Embed Size (px)
Citation preview
IBO New York City Independent Budget Office
Fiscal BriefAugust 2008
New York CityIndependent Budget OfficeRonnie Lowenstein, DirectorGeorge Sweeting, Deputy Director110 William St., 14th floorNew York, NY 10038Tel. (212) 442-0632Fax (212) 442-0350e-mail: [email protected] http://www.ibo.nyc.ny.us
Also available...
E-Commerce: Eroding City’s Sales Tax Revenue
... at www.ibo.nyc.ny.us
With Changes to Commercial Property Tax Program, Breaks Will Not be as Costly for the CitySUMMARY
THE INDUSTRIAL AND COMMERCIAL INCENTIVE PROGRAM, commonly referred to as ICIP, has been the largest source of commercial property tax exemptions in New York City, costing the city more than $500 million in forgone tax revenue last year. Critics, including the city’s Economic Development Corporation, said the program was expensive, the tax exemptions often lasted too long, and the exemptions were not well targeted.
Last June, at the urging of the Bloomberg Administration, the state Legislature enacted a bill giving the city the ability to replace ICIP with the Industrial and Commercial Abatement Program. While the new program replaces ICIP going forward, properties currently receiving ICIP benefits or slated to receive them when construction is complete will continue to garner benefits under the old exemption program. Both programs will operate simultaneously until all ICIP projects have received their full benefits, something that will not happen for another 25 years or more.
This report examines the distribution of ICIP benefits geographically and among different types of projects and describes the programmatic changes between ICIP and the new Industrial and Commercial Abatement Program. In describing some of the changes we also estimate their potential effect on city tax revenues. Among IBO’s findings on ICIP benefits:
The total cost of ICIP had tripled over the past decade. Adjusted for inflation, costs had increased from $170 million in 1999 to $512 million in 2008, an average annual growth rate of 13 percent. Because the foregone revenue, or “tax expenditure,” associated with an exemption depends on the property tax rate, some of this growth stems from the 18.5 percent increase in the property tax in the second half of 2003.ICIP tax expenditures have built up over time because new exemptions were added more rapidly than old exemptions—which can last up to 25 years—phased out. In 2008, around 33 percent of foregone revenue under ICIP was associated with exemptions initially granted before 2001, while around 16 percent was for exemptions in their first year.More than one in three ICIP exemptions went to stores in 2008 and accounted for 25 percent of ICIP’s foregone revenue. In contrast, utility projects accounted for less than 1 percent of exemptions, but 19 percent of ICIP tax expenditures in 2008.
The new Industrial and Commercial Abatement Program includes significant changes to eligibility and benefit schedules that should slow the growth in foregone tax revenue that would have occurred under ICIP. Because of the incremental nature of both the old and new programs, it will take many years for the city to fully realize those savings.
•
•
•

NEW YORK CITY INDEPENDENT BUDGET OFFICE�
INTRODUCTION
Last June the state Legislature passed legislation allowing New York City to establish the Industrial and Commercial Abatement Program (ICAP), replacing the Industrial and Commercial Incentive Program (ICIP). ICIP has been the largest commercial property tax exemption in New York City, costing the city more than $500 million in foregone tax revenue in fiscal year 2008.
While ICAP will replace ICIP going forward, properties currently receiving ICIP benefits or slated to receive benefits under ICIP upon completion of construction will continue to receive benefits under ICIP. Both programs will operate simultaneously until all projects have received their full ICIP benefits, something that may not happen for another 25 years or more.
ICIP provides benefits over several different time frames, with the longest benefit period extending 25 years. Since its creation in 1984 the program has changed considerably in terms of the size and the type of benefits granted. This report focuses on describing the ICAP and ICIP programs, rather than looking at how the existence of these programs might affect behavior with regards to development or renovation projects.
With long-lasting benefit periods, the current year cost of ICIP is largely determined by decisions made in prior years. For example, only 16 percent of the program’s cost in 2008 was the result of new exemptions granted that year while almost 20 percent stemmed from exemptions granted before 2000. This lagged effect means that even though ICAP will replace ICIP, the city will forgo significant tax revenues for ICIP—often called a tax expenditure—for many years to come.
The policy intent of a tax incentive program like ICIP or ICAP is to provide the additional financial incentive to make a construction or renovation project viable. While it may not be possible to design a broadly available program such as ICAP to target incentives only to projects that would not proceed without the additional benefit, one measure of a program’s effectiveness is how well targeted the benefits are.
In a 2007 study of ICIP, the New York City Economic Development Corporation (EDC) estimated that just under one-quarter of ICIP projects would not have gone forward without ICIP. This estimate has been criticized as too low because it applied current economic benchmarks on historical projects. For example, the assessment of whether a project would have been economically viable to proceed without ICIP was based on economic conditions in 2007. Such an assessment, however, does not reflect the economic situation at the time of project
initiation, such as the mid-1990s when the city faced a recession and commercial rents declined as available office space flooded the market. While IBO did not prepare its own estimate and recognizes the limitations of the EDC estimate, its study provides strong evidence that ICIP benefited a far broader group with more generous benefits than might have been necessary to meet the policy goal of promoting industrial and commercial development.
Recent Efforts to Amend ICIP and the ICAP Legislation. In 2007, when reauthorization of ICIP was on the legislative agenda, the Bloomberg Administration recommended significant revisions to the program, changes that were also backed by some traditional critics of ICIP. With insufficient support for the reform package, the state Legislature simply extended ICIP for one year without any programmatic changes.
With that one-year extension, ICIP was set to expire on June 30, 2008 and another round of reauthorization negotiations got underway this spring. The Bloomberg Administration supported a bill introduced in the state Legislature (S6366A), which established ICAP and was passed by both houses in late June and signed by Governor David Paterson. The changes enacted under ICAP are narrower in scope than those originally considered by the EDC study in 2007.
Overall, the new Industrial and Commercial Abatement Program keeps the benefit lengths similar while curtailing eligibility for certain property types and requiring greater investment from owners. One major change is going from an exemption of property taxes under ICIP to an abatement of taxes under ICAP. This change has implications for both the cost of ICAP to the city in foregone tax revenue over the long term as well as for the distribution of property tax burden across properties in the city. A second significant change in ICAP is to reduce eligibility of certain retail projects (based primarily on the share of space being devoted to retail activity) and of all utility projects. (The changes and their associated tax benefit for the city are discussed in more detail in the last section of this report.)
Among the recommendations in the 2007 Economic Development Corporation report on ICIP not incorporated into the new program were significant reductions in the benefit periods and removal of inflation (appreciation) protection.
Manhattan Borough President Scott Stringer’s May 2008 report on ICIP, Senseless Subsidies, included a list of proposals for reform as well. One major recommendation was curbing the flow of tax benefits to chain retail and fast food establishments. While ICAP does not specifically single out those types of businesses, the limitation on benefits to retail establishments will probably

NEW YORK CITY INDEPENDENT BUDGET OFFICE �
reduce or eliminate the ICAP incentive for some chain stores and fast food restaurants.
Transition from ICIP to ICAP. As of June 30, 2008, ICIP is no longer available to new projects, though many will continue to receive benefits under ICIP. One group that will continue to receive ICIP benefits consists of those already receiving ICIP exemptions. A second group is those who have filed applications already and have projects currently under construction (construction would need to be completed by December 31, 2013). A third group that will receive benefits under ICIP includes owners of properties who filed applications for ICIP before June 30, 2008 and received at least one building permit by July 31, 2008 (again, construction must be completed by December 31, 2013). Under these transition rules, the number of ICIP exemptions will increase in the next few years as these projects complete construction and will then phase out over the maximum 25-year benefit, meaning that New York City could still have active ICIP exemptions 30 years from now.
WHAT IS ICIP?
ICIP has been providing a tax exemption for increases in assessed value resulting from new construction or renovation of industrial, or commercial property. The exemption has been as-of-right, meaning that any project meeting eligibility criteria automatically received the exemption. Generally, ICIP benefits were stand-alone—in other words, the benefits were not part of a bigger package of incentives for development projects.
For example, if an owner of a warehouse assessed at $2 million completed renovations that raised the assessment by $200,000, under ICIP the owner was exempt from paying property taxes on the increase in assessed value resulting from the renovation for 25 years. (The full tax gradually phases in over the 17th to 25th years of the exemption. When discussing property taxes being exempted under ICIP, we are only referring to the increase in assessed value that is attributable to the renovation or new construction.)
ICIP History. The Industrial and Commercial Incentive Program was created by the New York City Council and New York State Legislature in 1984. It replaced an exemption program administered on a case-by-case basis by the Industrial and Commercial Incentive Board from 1977 to 1984.
Until January 1, 1993, parts of Manhattan below 96th street were designated a deferral area. Projects in the deferral area could defer the property tax increase resulting from renovation or new construction for 10 years, and then repay the deferred taxes in 10 installments. Our analysis excludes projects in the deferral
program. (For details on the data and methodology used in this report, click here.)
Originally, utility projects were thought to be ineligible under ICIP, but a court ruling in 1994 extended ICIP benefits to utility property.
Properties in Manhattan between 59th Street and 96th Street have not been eligible for ICIP benefits for commercial renovation since 1995. Further, in 1996, the eight-year benefit for “smart buildings” was limited to downtown Manhattan (smart buildings meet certain physical and technological requirements).
Parameters of ICIP. The ICIP benefit schedule for a given project depended on project type and location, detailed in the corresponding chart of ICIP parameters. For ease in exposition, we will refer to the different benefit levels based on the number of years that the exemption lasts—the 25-, 15-, 12-, and 8-year benefits. The project type and location distinctions in ICIP are also used in the newly enacted ICAP program.
The three project types were industrial, commercial new construction, and commercial renovation. A property was considered industrial if at least 75 percent of the floor space is used for manufacturing activities.
ICIP legislation defined benefit levels based on location in the city. Portions of the city—provided they were north of 96th Street in Manhattan or in the other four boroughs—were eligible for designation as “special areas” where projects received ICIP exemptions for a longer period of time. Special areas were defined in one of three ways: within the ICIP legislation itself; designated as a New York State Empire Zone; or designated by the Industrial and Commercial Incentive Board.
Eligibility was based on making a minimum required expenditure and filing applications and updates on a schedule required by the Department of Finance. For renovation, modernization, or expansion, the minimum required expenditure was either 10 percent or 20 percent of assessed value, depending on project type. For new construction, the minimum required expenditure was 10 percent or 20 percent (again, depending on project type) of the assessed value of the building being replaced.
25-Year ICIP Benefit. The longest ICIP benefit period was 25 years, reserved for industrial projects located anywhere in the city and commercial new construction in the special areas. The map on page 13 shows the current special areas in dark gray. Special areas could only be designated in Manhattan north of 96th Street,

NEW YORK CITY INDEPENDENT BUDGET OFFICE�
or in the other four boroughs.
The full increase in assessed value was exempted for 16 years, with inflation protection for the first 13 years. Inflation protection meant that when the assessed value that was being exempted under ICIP grew due to changes in the market (appreciation), the ICIP exemption was also increased proportionately. Beginning in the 14th year, there was no more inflation protection so that the exemption was flat in years 14 to 16 before gradually phasing out at a rate of 10 percent a year for nine years, with full taxes due in the 26th year.
Industrial projects receiving the 25-year benefit were also eligible for an eight-year abatement of 50 percent of existing real estate taxes (an abatement is a credit against tax liability, unlike an exemption that reduces taxable assessed value). To encourage industrial projects, since 2000 the industrial abatement of existing taxes had been extended to buildings with 25 percent of manufacturing given they are located in areas of the city designated as revitalization areas (areas zoned for major and secondary commercial districts, central commercial districts, and manufacturing districts).
15-Year ICIP Benefit. Commercial new construction north of 96th Street in Manhattan or in the other four boroughs, and not located in a special area, was eligible for an exemption for 15
years. The full increase in assessed value was exempted for 11 years without inflation protection and then phased out over four years, declining 20 percent each year.
12-Year ICIP Benefit. ICIP provided for a 12-year exemption for commercial renovation, with a higher minimum required expenditure for projects located in Manhattan below 59th Street. There were no ICIP exemptions for commercial renovation between 59th Street and 96th Streets in Manhattan.
Eight-Year ICIP Benefit. The shortest benefit period was for construction of “smart buildings” in downtown Manhattan, south of Murray, Frankfort, or Dover streets. The full exemption lasted for four years and phases out at 20 percent per year in years five to eight.
Value of ICIP Benefits. To illustrate how the different ICIP benefit schedules worked and the extent of the savings that could have been garnered by a developer, consider the following examples based on a project that increased a building’s assessment by $200,000. In each case we show the tax expenditure that resulted. Tax expenditure is the tax revenue not being collected by the city and is calculated as the exempt assessed value amount times the tax rate. We also provide the present value of the total tax expenditure. The assumptions in our simulation are a tax rate of 10.059 percent (the 2008
The Industrial and Commercial Incentive Program Parameters25-Year ICIP Benefit 15-Year ICIP 12-Year ICIP Benefit 8-Year ICIP
Project Type IndustrialCommercial
NewCommercial
New Commercial RenovationCommercial
New
Location CitywideICIP Designated
"Special Area"
Manhattan(North of 96th
Street) or Other Four Boroughs
Manhattan(North of 96th
Street) or Other Four Boroughs
Manhattan(South of
59th Street)
"Smart" Building, DowntownManhattan
Exemption YES YES YES YES YES YESMinimumRequiredExpenditure* 10% 10% 10% 10% 20% 20%Years at Full 16 16 11 8 8 4Years of InflationProtection 13 13 0 0 0 0YearsDeclining 9 9 4 4 4 4Rate of Decline 10% per year 10% per year 20% per year 20% per year 20% per year 20% per yearFull Taxes Due 26th year 26th year 16th year 13th year 13th year 9th yearAbatement YES NO NO NO NO NOSOURCES: IBO; Department of Finance; Economic Development Corporation.NOTES: *Minimum Required Expenditure is percent of assessed value; Abatement is percent of pre-existing property taxes; "Special Areas" are defined in ICIP legislation, by the Industrial and Commercial Incentive Board, or as New York State Empire Zones and are located either in Manhattan, north of 96th Street or in the outer boroughs.

NEW YORK CITY INDEPENDENT BUDGET OFFICE �
A Closer Look at Nine ICIP Exemptions
With a large and complex program like ICIP, considering some actual exemptions can be useful in getting a better sense of the program. These exemptions were chosen to highlight the variety of projects benefitting from ICIP, in terms of property type, benefit length, market value of the property, geographic location, ICIP tax exemption, and share of tax burden being exempted under ICIP. The examples are illustrative of the breadth of ICIP and not necessarily “typical” or “average.” The table below presents nine actual ICIP exemptions, all having begun to receive ICIP tax benefits since 2000 (the majority since 2006).
For example, the 25-year benefit for the industrial wholesale food manufacturing property had an ICIP exemption of just over
$100,000 in assessed value. That exemption reduced the tax bill for the property from $22,542 to $12,041, a 47 percent reduction.
The two office building examples show the diversity among properties of the same type. With the Manhattan office building renovation, the share of taxes exempted under ICIP was 26 percent, but because of high market values, it cost the city more than $1 million in foregone tax revenue. The office building in Staten Island, on the other hand, has 82 percent of its tax bill forgiven under ICIP at a cost to the city of $41,554.
The new construction 15-year ICIP exemption for a hotel in Queens also exempted over 80 percent of the assessed value from taxation, providing a tax savings of $132,583 for the property. The 25-year industrial/special area exemptions in the Bronx (storage facility) and northern Manhattan (supermarket)
also exempted over two-thirds of the assessed value from property taxes. The tax benefit for the property owner is $434,549 in northern Manhattan and $118,197 in the Bronx.
A smaller supermarket in Brooklyn (compared to the one in northern Manhattan) was also receiving a 25-year ICIP exemption. ICIP exempted $128,430 of the $508,500 in assessed value from taxation, reducing the property tax bill by 25 percent (tax savings of $12,919).
At the other end of the retail spectrum, the ICIP exemption for a retail center in Queens (15-year, new construction) equaled $38.3
million (of $91.7 million in total assessed value). This exemption reduced city tax revenue by $3.9 million.
The final example is a 25-year ICIP benefit for a utility property in Brooklyn. The market value was estimated at $16.1 million, with taxable assessed value of $7.3 million. The $450,000 ICIP exemption reduced the taxes due by $45,266 to $684,731 (or 6 percent of the full tax liability).
Property Retail Utility Retail
Examples of Properties with ICIP Exemptions in 2008 Benefit Length 15-Year 12-YearBenefit Type Commercial New Construction Renovation
Borough Queens Staten IslandMidtown
Manhattan
Property Type Hotel Mall/RetailOffice
Building/ BankOffice
BuildingFirst Year in ICIP 2006 2005 2006 2006Market Value $4,000,000 $225,000,000 $1,220,000 $94,000,000Assessed Value 1,622,155 91,657,394 506,790 42,300,000ICIP Exemption 1,318,050 38,308,500 413,100 10,800,000Billable Taxable Assessed Value 304,105 53,348,894 93,690 31,500,000Tax Bill Without ICIP $163,173 $9,219,817 $50,978 $4,254,957ICIP Tax Savings 132,583 3,853,452 41,554 1,086,372Taxes Due 30,590 5,366,365 9,424 3,168,585Share of Taxes Exempted 81% 42% 82% 26%Benefit Length 25-Year
Benefit Type Industrial/ Special Area
Borough Bronx BrooklynNorthern
Manhattan
Property Type TypeWholesale Food
ManufacturingManufacturingWarehouse/
StorageStorageSupermarket/
Retail UtilitySupermarket/
RetailFirst Year in ICIP 2006 2007 2004 2006 2000Market Value $498,000 $3,860,000 $1,130,000 $16,127,000 $12,600,000Assessed Value 224,100 1,737,000 508,500 7,257,150 5,670,000ICIP Exemption 104,400 1,175,040 128,430 450,000 4,320,000Billable Taxable Assessed Value 119,700 561,960 380,070 6,807,150 1,350,000Tax Bill Without ICIP $22,542 $174,725 $51,150 $729,997 $570,345ICIP Tax Savings 10,502 118,197 12,919 45,266 434,549Taxes Due 12,041 56,528 38,231 684,731 135,797Share of Taxes Exempted 47% 68% 25% 6% 76%SOURCES: IBO; Department of Finance.

NEW YORK CITY INDEPENDENT BUDGET OFFICE�
commercial property, or Class 4, tax rate), annual inflation adjustment of 3.5 percent, and a discount rate of 6 percent.
The 25-year ICIP benefit with inflation protection is the most costly to the city. For a $200,000 increase in assessed value that qualified for ICIP, IBO found that the total tax expenditure for a 25-year ICIP benefit has a present value of $296,606. The total tax expenditure for a $200,000 increase in assessed value that qualified for a 15-year ICIP benefit for commercial new construction outside the special areas has a present value of $177,564. The ICIP tax expenditure for a $200,000 increase in assessed value for the 12-year ICIP benefit for commercial renovation has a present value of $147,434. Comparable Smart Building commercial construction in downtown Manhattan had the lowest present value of total tax expenditure at $98,123. ICIP TAX EXPENDITURE AND GROWTH OVER TIME
IBO found that ICIP tax expenditures had been growing at a steady clip, while the number of exemptions had grown more slowly. One aspect contributing to growth in cost for ICIP was that the tax expenditures cumulated year after year, with older exemptions phasing out more slowly than new exemptions were added. Some of the more costly exemptions (those for 25-years with inflation protection, for renovation projects in Manhattan below
59th Street, and for utilities), had also fueled the growth of ICIP.
Further, because ICIP exempted assessed value from taxation, the tax expenditure depended not only on the assessed value, but also the tax rate. Changes to the property tax rate, notably the 18.5 percent increase in 2003 and the 7 percent cut in 2008 affected the ICIP tax expenditure. For example, if the assessed value exempted under ICIP was the same in 2007 and 2008, the estimate of the tax expenditure would be lower in 2008 because the commercial property tax rate was lower that year.
ICIP Had Strong Historical Growth. Between 1988 and 1998, the number of ICIP exemptions increased from 129 to 3,187, an average annual growth rate of 37.8 percent. In the last decade, the number of exemptions increased by 89 percent from 1998 to 6,017 in 2008, an average annual growth rate of 6.6 percent a year.
The tax expenditure associated with the ICIP program had grown more rapidly in recent years, topping $512 million in 2008. The cost had more than quadrupled in the last 10 years, increasing by $414 million from $98 million (1998 dollars). The compounded annual growth rate in the tax expenditure has been 17.9 percent annually between 1998 and 2008 (13.4 percent annually, after controlling for inflation1). The average annual growth in tax expenditure, after inflation, was more than twice the growth in the number of exemptions.
As noted above, the tax expenditure for ICIP depended in part on the city’s property tax rates, which were increased in the second half of 2003 and decreased in 2008. The average growth rate in inflation-adjusted tax expenditure for ICIP for
Value of ICIP Exemptions and Tax Expenditure for$200,000 Increase in Assessed Value, by Building Class and Location
ICIP Tax ExpenditureICIP Benefit Type Project Type/Location Total Total, PV
25-Year
Industrial/Special Area Commercial New Construction $552,160 $296,606
15-Year
Commercial New Construction, Manhattan (North of 96th St) or Other Four Boroughs, not Special Area $261,534 $177,564
12-Year
Areas (except Manhattan between 59th St and 96th St) $201,180 $147,434
8-YearSmart Building, Lower Manhattan $120,708 $98,123
SOURCE: IBO.NOTES: PV is Present Value, discount rate for PV is 6 percent, annual inflation is 3.5 percent for Industrial and Commercial New Construction in Special Areas. Tax rate is assumed as 10.059 percent (2008 tax rate for commercial, class 4 property).
0
100
200
300
400
500
$600
ICIP
Ta
x Ex
pe
nditu
re,
$
2008
, in
milli
on
s
ICIP Total Tax Expenditure, 1988 to 2008
SOURCES: IBO; Department of Finance.NOTE: Real dollars based on State and Local Government Deflator.

NEW YORK CITY INDEPENDENT BUDGET OFFICE �
the last decade (13 percent) includes both periods of fast and slow growth. For example, growth from 1999 to 2002, before the tax increase, averaged 13 percent. From 2002 to 2004, when the property tax rate increase was enacted, ICIP tax expenditure grew an average of 23 percent a year. Growth slowed in the next few years, averaging 5 percent a year from 2004 to 2007. From 2007 to 2008, ICIP tax expenditure grew 19 percent after inflation even though a tax rate cut was enacted, due to a jump in assessed value being exempted for both exemptions new in 2008 and increases in the market value of existing 25-year ICIP benefits with inflation protection.
In 1998, the median tax expenditure was $11,102 (in 2008 dollars) and by 2008 it increased to $15,766. The average expenditure is much higher than the median because of its sensitivity to a limited number of very large ICIP exemptions. In 2008, the average expenditure was $88,969, compared to $46,532 in 1998 (in 2008 dollars).
The average and median tax expenditure have grown more slowly from 1998 to 2008 than the total expenditure for ICIP. In inflation-adjusted dollars, the average tax expenditure grew by 6.7 percent a year, while the median tax expenditure averaged growth of 3.6 percent a year, suggesting an increase in the most costly ICIP exemptions over time. Moreover, the faster growth of total expenditures compared to the median expenditure reflects the cumulating nature of ICIP, with benefits being granted for a very long time period adding up year after year.
ICIP Exemptions by Type. Between 1988 and 1991, the majority of ICIP exemptions were regular commercial new construction or renovation (the 12- and 15-year benefits). From 1992 on, 25-year ICIP benefit exemptions have represented over half of all exemptions, with an average annual growth rate of 11.7 percent. By 2008, just about two out of every three exemptions were for 25-year benefits.
Twenty-five year ICIP exemptions have grown more rapidly than the shorter 15-, 12-, or 8- year ICIP exemptions, especially in Brooklyn, Queens, and the Bronx. Conversely, the majority of exemptions in Manhattan were in the latter group
of shorter benefit periods, partly because Manhattan below 96th Street was excluded from special area designation. In 2008, the median tax expenditure for a 15-, 12-, or 8-year ICIP benefit was $16,975, one-fourth larger than the median 25-year ICIP benefit tax expenditure of $13,580.
On the other hand, the share of the tax expenditure associated with 25-year ICIP benefits stayed below 50 percent most years, until 2006. While the 25-year benefit is longer and more generous, the far higher tax expenditure associated with the 12-
- -
2008 3 934 2 083 65 4% 300 6 211 4 58 7%
ICIP Exemptions and Tax Expenditure, By Benefit Length, 1988 to 2008
Number of Exemptions Tax Expenditure ($2008, millions)
Year25-YearBenefit
15-, 12-, and 8Year Benefits
Share25-Year
25-YearBenefit
15-, 12-, and 8Year Benefits
Share25-Year
1988 54 75 41.9% $1.8 $2.1 45.6%1989 150 169 47.0% 8.5 6.3 57.3%1990 314 365 46.2% 14.5 27.5 34.5%1991 513 536 48.9% 28.9 38.9 42.7%1992 668 665 50.1% 34.5 44.2 43.9%1993 810 727 52.7% 41.1 46.0 47.2%1994 924 812 53.2% 39.8 44.0 47.5%1995 1,085 949 53.3% 42.2 56.1 42.9%1996 1,301 1,069 54.9% 46.5 72.8 39.0%1997 1,481 1,214 55.0% 48.7 75.1 39.3%1998 1,673 1,514 52.5% 57.9 88.0 39.7%1999 1,836 1,665 52.4% 69.9 100.0 41.1%2000 2,097 1,633 56.2% 76.5 117.2 39.5%2001 2,266 1,661 57.7% 102.6 132.2 43.7%2002 2,328 1,530 60.3% 106.9 140.9 43.1%2003 2,654 1,674 61.3% 136.3 186.2 42.3%2004 2,904 1,703 63.0% 171.0 203.8 45.6%2005 2,962 1,726 63.2% 203.7 218.7 48.2%2006 3,509 2,014 63.5% 222.2 221.9 50.0%2007 3,720 2,032 64.7% 228.0 203.3 52.9%2008 3 934, 2 083, 65 4%. 300 6. 211 4. 58 7%.SOURCES: IBO; Department of Finance.
ICIPTables_0�1�0�.xls Chart�
010,00020,00030,00040,00050,00060,00070,00080,00090,000
$100,000
ICIP
Ta
x Ex
pe
nditu
re, 2
008
Do
llars
Median and Average ICIP Tax Expenditure, 1988-2008Average Tax Expenditure,2008 Dollars
Median Tax Expenditure,2008 Dollars
SOURCES: IBO; Department of Finance.NOTE: Real dollars based on State and Local Government Deflator.
IBO - DRAFT: Work in Progress - �/1�/�00�IBO - DRAFT: Work in Progress - �/1�/�00�
NEW YORK CITY INDEPENDENT BUDGET OFFICE�
year ICIP benefit projects in Manhattan below 96th Street (driven by higher property values which lead to higher exempt assessed values) resulted in greater total tax expenditure associated with the shorter benefit periods.
Outside Manhattan, IBO found that the average tax expenditure for a 15-, 12-, or 8-year ICIP benefit was lower than the average 25-year ICIP benefit tax expenditure. The difference was most striking for the average tax expenditure for a new 25-year ICIP benefit in the Bronx and Queens, and far less pronounced in Brooklyn and Staten Island. Manhattan told a different story, where the average tax expenditure was far higher for the commercial projects than the industrial or special area, due to the projects in core midtown and downtown Manhattan with higher valuation and assessments.
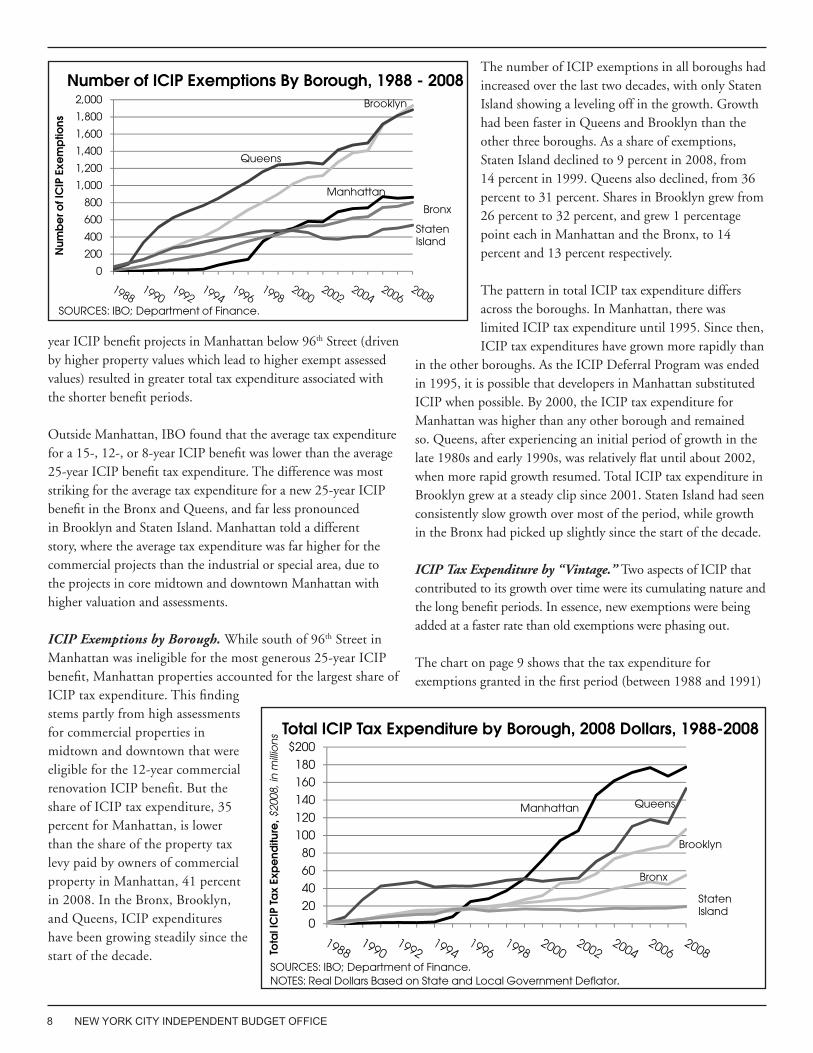
ICIP Exemptions by Borough. While south of 96th Street in Manhattan was ineligible for the most generous 25-year ICIP benefit, Manhattan properties accounted for the largest share of ICIP tax expenditure. This finding stems partly from high assessments for commercial properties in midtown and downtown that were eligible for the 12-year commercial renovation ICIP benefit. But the share of ICIP tax expenditure, 35 percent for Manhattan, is lower than the share of the property tax levy paid by owners of commercial property in Manhattan, 41 percent in 2008. In the Bronx, Brooklyn, and Queens, ICIP expenditures have been growing steadily since the start of the decade.
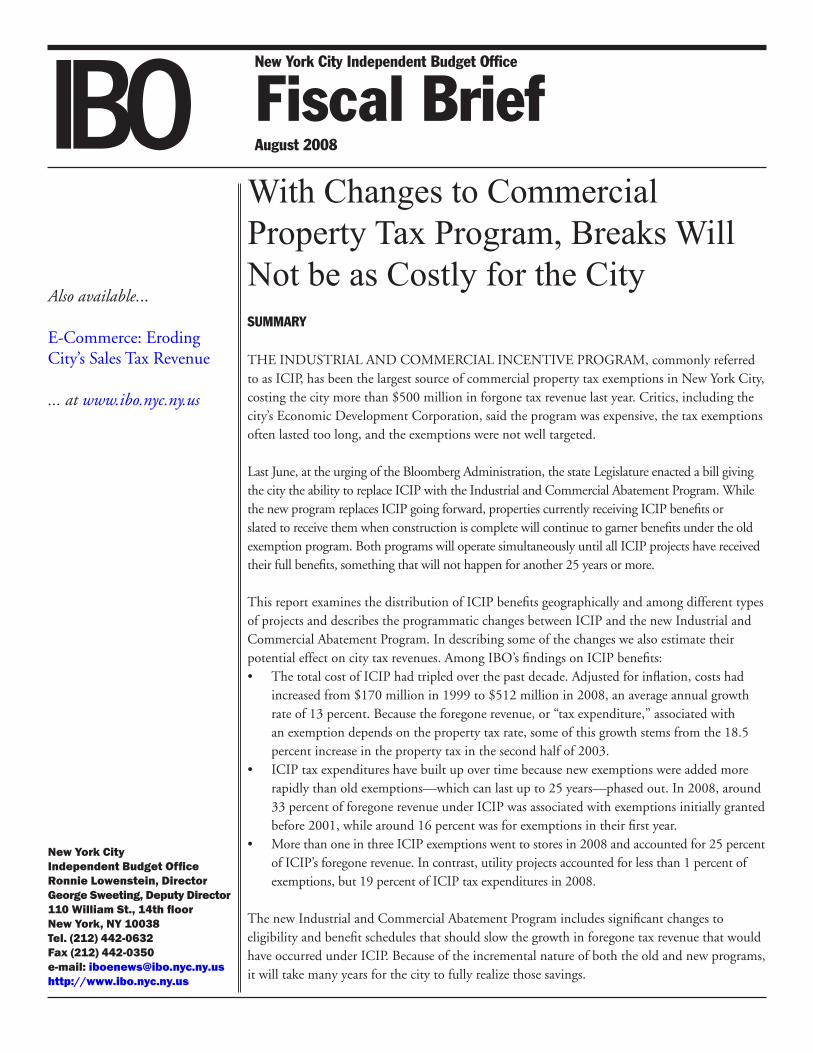
The number of ICIP exemptions in all boroughs had increased over the last two decades, with only Staten Island showing a leveling off in the growth. Growth had been faster in Queens and Brooklyn than the other three boroughs. As a share of exemptions, Staten Island declined to 9 percent in 2008, from 14 percent in 1999. Queens also declined, from 36 percent to 31 percent. Shares in Brooklyn grew from 26 percent to 32 percent, and grew 1 percentage point each in Manhattan and the Bronx, to 14 percent and 13 percent respectively.
The pattern in total ICIP tax expenditure differs across the boroughs. In Manhattan, there was limited ICIP tax expenditure until 1995. Since then, ICIP tax expenditures have grown more rapidly than
in the other boroughs. As the ICIP Deferral Program was ended in 1995, it is possible that developers in Manhattan substituted ICIP when possible. By 2000, the ICIP tax expenditure for Manhattan was higher than any other borough and remained so. Queens, after experiencing an initial period of growth in the late 1980s and early 1990s, was relatively flat until about 2002, when more rapid growth resumed. Total ICIP tax expenditure in Brooklyn grew at a steady clip since 2001. Staten Island had seen consistently slow growth over most of the period, while growth in the Bronx had picked up slightly since the start of the decade.
ICIP Tax Expenditure by “Vintage.” Two aspects of ICIP that contributed to its growth over time were its cumulating nature and the long benefit periods. In essence, new exemptions were being added at a faster rate than old exemptions were phasing out.
The chart on page 9 shows that the tax expenditure for exemptions granted in the first period (between 1988 and 1991)
ICIPTables_0�1�0�.xls Chart�
0
200
400
600
800
1,000
1,200
1,400
1,600
1,800
2,000
Num
be
r of I
CIP
Exe
mp
tions
Number of ICIP Exemptions By Borough, 1988 - 2008Brooklyn
Manhattan
Queens
Bronx
Staten Island
SOURCES: IBO; Department of Finance.
IBO - DRAFT: Work in Progress - �/1�/�00�IBO - DRAFT: Work in Progress - �/1�/�00�
020
4060
80
100120
140
160180
$200
Tota
l IC
IP T
ax
Exp
end
iture
, $20
08, i
nm
illio
ns Total ICIP Tax Expenditure by Borough, 2008 Dollars, 1988-2008
Manhattan Queens
Brooklyn
Bronx
Staten Island
SOURCES: IBO; Department of Finance.NOTES: Real Dollars Based on State and Local Government Deflator.

NEW YORK CITY INDEPENDENT BUDGET OFFICE �
was greater in 1999 than in 2003 and 2008 (as some exemptions decline in value during their phase out). The same pattern holds for the second period (exemptions granted between 1992 and 1995) on the bars where tax expenditure started to decline as exemptions began to phaseout.
The third period represents exemptions first granted from 1996 to 1999. The amount of tax expenditure associated with these exemptions grew slightly from 1999 to 2003 as the ICIP benefits with inflation protection saw an increase in assessed value due to market appreciation. The tax expenditure for these exemptions had already begun to decrease in 2008 as some exemptions entered the phase out portion of their benefit trajectory.
Exemptions granted between 2000 and 2003 are shown in the fourth section of the bar chart (and only appear on the 2003 and 2008 bars). We see that this group of exemptions represented roughly the same cost to the city in 2003 and 2008. Eventually, they will start to phase out, but most exemptions initiated in 2003 would not begin phasing out until 2011 at the earliest or 2019 at the latest.
On the bar for 2008, the exemptions granted between 2004 and 2007 were added on top of the tax expenditure already granted prior to 2004. The large increase in tax expenditure in 2008 (discussed above) is evidenced by the last segment of the bar in 2008, showing the cost to the city for exemptions granted last year. In 2009, another segment will be added, further increasing program costs. It is clear that the decline among older exemptions in the phaseout period is slower than the growth in new exemptions, leading to year-over-year increases in tax expenditures associated with ICIP.
ICIP Exemptions and Tax Expenditure by Property Type. The Department of Finance assigns each parcel a building class, from which we broadly grouped parcels receiving ICIP exemptions into property types. Much of the discussion on amending ICIP had centered on specific types of projects benefiting from ICIP, such as retail, gas stations, or utility properties.
The most common property type to receive ICIP exemptions was stores, with 2,096 exemptions citywide in 2008 (all other property types have less than 1,000 exemptions). Furthermore, this count underestimates the number of retail establishments with ICIP benefits because the Department of Finance data we have assigns one code to the entire
building and that code may not accurately reflect the usage of the part of the building for which the ICIP exemption was granted. For example, office buildings in Manhattan with ICIP often have ground floor retail. But the Department of Finance codes only identify as “stores” those buildings which are predominately used for retail purposes.
The next three most common property types in 2008 were warehouses (891), offices (814), and commercial condominiums (675). Some of the commercial condo properties are likely to be retail units in office buildings that have been organized as condominiums. There were also 532 factories and 435 garages with ICIP exemptions in 2008.
The relative costs of the exemptions differed across property types, so the share of exemptions was not representative of the share of tax expenditure. Some property types represented a
Property Type Number Percentage Amount PercentageOffice Buildings 814 14% $137.3 27%Stores 2,096 35% 128.7 25%Utility Property 31 1% 98.2 19%Commercial Condos 675 11% 36.7 7%Hotels 110 2% 31.8 6%Warehouses 891 15% 30.5 6%Other Properties 433 7% 22.1 4%Factories 532 9% 17.5 3%Garages 435 7% 9.3 2%SOURCES: IBO; Department of Finance.
ICIP Exemptions and Tax Expenditure, By Property Type, 2008
Exemptions Tax ExpenditureDollars in millions
NOTE: Numbers may not add due to rounding.
ICIPTables_0���0�.xls Chart�
ICIP Tax Expenditur
It's one or the other…I prefer the top, but Ronnie asked why not the standard format as below.
$0 $100 $200 $300 $400 $500 $600
1999
2003
2008
ICIP Tax Expenditure, $2008 dollars in millions
ICIP Tax Expenditures in 1999, 2003, and 2008
-1991
1992-1995
1996-1999
2000-2003
2004-2007
2008
SOURCES: IBO; Department of Finance.NOTE: Real Dollars Based on State and Local Government Deflator.
IBO - DRAFT: Work in Progress - �/1�/�00�
p p y
0
100
200
300
400
500
600
1999 2003 2008
ICIP
TaxExpe
nditure,
Millions,2
008Re
alDollars
ICIP Tax Expenditure by Year First Granted, 1999, 2003, and 2008
2008
2004 2007
2000 2003
1996 1999
1992 1995
1988 1991
Source: IBO; Department of Finance.Note: Real Dollars Based on State and Local Government Deflator.
IBO - DRAFT: Work in Progress - �/1�/�00�
1988
NOTE: Real dollars based on State and Local Deflator.

NEW YORK CITY INDEPENDENT BUDGET OFFICE10
larger share of exemptions than tax expenditures. For example, stores, as the largest class, accounted for 35 percent of ICIP exemptions and one-quarter of ICIP tax expenditure (an average $61,399 per exemption). While warehouses were about 15 percent of exemptions and factories another 9 percent, their combined share of the ICIP expenditure was just 9 percent. Commercial condos made up 11 percent of exemptions and 7 percent of tax expenditures. Garages represented 7 percent of exemptions but around 2 percent of tax expenditure with an average expenditure of $21,304.
On the other hand, some property types had a far larger share of tax expenditure than exemptions. Of total ICIP tax expenditure, office buildings represented 27 percent of the foregone revenue though they accounted for only 14 percent of exemptions, at an average of $168,670 per exemption. Strikingly, utility property, with just 31 ICIP exemptions in 2008 at an average tax expenditure of $3.2 million, cost the city $98 million in foregone tax revenue. In other words, 0.5 percent of the exemptions in 2008 were associated with 19 percent of the ICIP tax expenditure.
PROGRAMMATIC CHANGES AND POTENTIAL FISCAL IMPACT
Last June, the state Legislature passed a bill enabling the city to establish the Industrial and Commercial Abatement Program, which will replace ICIP for new projects applying after June 30, 2008. Below are some of major differences between ICIP and ICAP and IBO’s preliminary fiscal impact estimates, as compared to those from the 2007 EDC study.
Changing from an Exemption to an Abatement. One major change, leading to the new name of the program, is moving from an exemption under ICIP to an abatement under ICAP. An important difference between an exemption and an abatement is in the accounting within the broader property tax system—an exemption is a reduction of taxable assessed value (like the standard deduction on income taxes) applied before tax liability is calculated, while an abatement is an offset against a property tax bill (like a tax credit on income taxes).
There are two main effects from moving from an exemption to an abatement. First, under ICAP, the value of the abatement is determined by the initial tax rate (set in the year prior to the issuance of the first building permit) and does not get adjusted in future years to reflect changes in the tax rate (minimizing some of the fluctuation in tax expenditure we saw with ICIP). Therefore, the value of the abatement is more fixed under ICAP than ICIP (though both allow for increases due to appreciation for some lots, as discussed below).
Second, for the city, the move to an abatement has implications for property taxes not directly related to ICAP. By abating taxes rather than exempting assessed value, the increase in value resulting from the renovation or construction is included in property tax calculations such as the apportioning of tax levy among tax classes (class shares), the setting of tax rates for each class, and the determination of the city’s debt limit.2 By converting from an exemption to an abatement, the increased value of commercial property attributable to the incentive program will be included in the total assessed value of commercial property in the city. If all else remains the same, the increase in commercial assessed value could increase the class share and possibly reduce the overall tax rate for commercial property. But the change is not retroactive, so it would have minimal impact in the first few years.
Designating Special Areas for the 25-Year ICAP Benefit. A criticism of the ICIP program was that the special areas, which provide a 25-year ICIP benefit for commercial new construction compared to 15 years in other parts of the city, were not regularly reviewed and included neighborhoods that no longer needed special designation and more generous benefits to make projects financially viable. In fact, the Boundary Commission, which is charged with designating the special areas north of 96th Street in Manhattan and in the other four boroughs had last met in the early 1990s to review the boundaries.
Under ICAP, the Boundary Commission is required to meet in 2009, and every five years thereafter, to review the special area boundaries. Further, the ICAP legislation states that if the Boundary Commission does not meet for five years, applications for benefits in special areas will be granted only regular area benefits. It is not possible to estimate the fiscal impact of making the Boundary Commission meet in 2009 and on a regular schedule, because there is no evidence of how the commission might redraw those boundaries. Limiting Benefits for Projects with Significant Retail Space. Another change under ICAP limits eligibility of properties with retail activity. Retail activity is defined as the sale of tangible personal property and services such as stores or dry cleaners; the definition includes retail banking and food services, but excludes hotels.
Specifically, eligibility for the 25-year ICAP benefit for industrial properties or new commercial construction will be curtailed for buildings that use more than 10 percent of the space for retail activity. The non-retail construction and up to 10 percent of the retail construction would be eligible for the 25-year benefit schedule, while the retail space in excess of 10 percent would be eligible for a shortened 15-year benefit.
NEW YORK CITY INDEPENDENT BUDGET OFFICE 11
In other words, if an owner is constructing a commercial building in a special area that will be 50 percent manufacturing and 50 percent retail, the ICAP abatement would provide a 25-year benefit for 60 percent of the property (50 percent non-retail and 10 percent retail), while the remaining 40 percent would be abated for 15 years.
For commercial renovation between Murray Street and 59th Street, the maximum share of building space used for retail that could be abated is lower—5 percent. Unlike the shorter benefit schedule for retail in excess of 10 percent described above, ICAP does not provide any abatement for more than 5 percent of space for retail activity in a commercial renovation building between 59th Street and Murray Street.
Since ICAP reduces the benefit period for some special area retail and curtails the benefit for retail renovation in Manhattan between 59th Street and Murray Street, this change is expected to generate substantial savings to the city. The Economic Development Corporation estimated in 2007 that the total savings to the city from 2008 to 2013 of making all new retail projects ineligible would be $198 million (present value), with savings reaching a present value of $2,175 million by 2028. IBO does not have a precise estimate of the tax savings from limitations on retail in ICAP because we do not have data on the share of building space used for retail activity. But, IBO did estimate the impact of making all new stand-alone stores ineligible, to give some sense of the magnitude of the fiscal impact of restricting retail eligibility under ICAP. IBO’s estimate for savings from making all stand-alone stores ineligible has a present value of $106 million over five years and $1,643 million over 20 years.
Making Utilities Ineligible under ICAP. ICAP makes all new utility projects ineligible. Recall that ICIP exemptions for utilities are particularly costly to the city, making up 19 percent of ICIP expenditure in 2008 for just 31 exemptions. Because of the small number of utility projects and their widely variable assessments, it is difficult to estimate what the effect on tax revenues would be from this change. EDC’s estimate of additional tax revenue due to removing utilities from ICIP was $762 million (present value) from 2008 to 2028. Instead of a point estimate, IBO has estimated the tax savings as a range; the present value of excluding utilities from the program over the next 20 years would save the city from $344 million to $1.2 billion. Clearly, the city would realize substantial savings from making utility projects ineligible for ICAP. The prices of services provided by utility companies require government approval. To the extent allowed by regulations, utilities could include the increase in property taxes in their expenses when setting rates, essentially allowing them to pass the increase on to their customers.
Shorter and Reduced Benefits in Midtown Manhattan. Much discussion on ICIP had been critical of the high cost associated with commercial renovation in Manhattan between Murray Street and 59th Street, where a strong real estate market suggests that incentives may not be necessary to induce renovation, especially for retail establishments. ICAP reduced the commercial renovation benefit in this area by two years, from 12 to 10 years. IBO estimates that the change would have modest savings for the city, in the area of $3.6 million (present value of savings from 2009 to 2028).
Standardizing Calculation of the Abatement Base. ICAP standardized the method for determining the value of the abatement. Since construction or renovation generally lasts a few years, it is necessary to divide the increase in assessed value during construction into two parts: 1) market value growth that would have happened without the improvements and is not abated, and 2) growth due to physical improvements that is abated.
Under ICIP, assessors retained discretion in dividing the increase in value into the two parts. Under ICAP, a formula was instituted for making that determination. ICAP sets 15 percent as the increase in assessed value during construction or renovation that results from market appreciation and is therefore, not included in the calculation of the abatement base. It follows that the abatement base is defined as the difference between the post-construction or renovation tax liability (using the initial tax rate equal to the tax rate in the first year of the abatement) and 115 percent of the pre-construction tax liability. This change limits assessor discretion and is predictable, but may overestimate or underestimate the actual appreciation depending on market conditions. Inflation Protection. In 2007, EDC recommended removing the inflation protection for ICIP industrial projects and commercial new construction in designated special areas. ICAP does not alter the inflation protection for industrial projects, but does restrict the inflation protection for commercial projects in special areas to growth above 5 percent in a fiscal year. This change might affect a significant portion of these properties, as IBO expects more 25-year benefits to go to commercial construction in special areas rather than to industrial projects.
In Class 4, the tax class for commercial properties, market value increases phase in over five years in equal installments. Because of that, increases are spread out (a 5 percent increase in 2009 would be phased in at 1 percent a year from 2009 to 2013) and a property would need to see very strong market value growth over a few years or more steady growth over a longer period to see a one-year increase of more than 5 percent. From 2005 to 2008, around

NEW YORK CITY INDEPENDENT BUDGET OFFICE1�
half of the lots receiving a 25-year ICIP benefit saw increases of more than 5 percent, while from 2001 to 2005, the share of lots had been lower at around 30 percent. Many new projects qualifying for 25-year benefits would be subject to the 5 percent inflation protection minimum, and IBO expects a modest revenue increase for the city from this limit on inflation protection.
Many Years until Full Effect of Changes. ICIP was a major incentive for commercial and industrial development in New York City. Each year the city added new projects, and with older exemptions phasing out more slowly than new exemptions were added, the total cost to the city in foregone tax revenue had risen sharply. While ICAP is less ambitious than the 2007 EDC
You can receive IBO reports electronically—and for free. Just go to www.ibo.nyc.ny.us
reform proposal, the cost of the program will decline, assuming the boundaries for the special areas remain unchanged. Because of the incremental nature of the program, the reduced cost in foregone tax revenue will not be fully realized for many years.
This report prepared by Ana Champeny
ENDNOTES
1Throughout the brief, IBO has used the State and Local Government Deflator to adjust dollars. This deflator is the IBO standard when looking at local government fiscal impacts. 2For more detailed discussion of New York City’s Real Property Tax, including class shares and tax rates, see IBO’s publication, Twenty-Five Years after S7000A: How Property Tax Burdens Have Shifted in New York City.

NEW YORK CITY INDEPENDENT BUDGET OFFICE 1�
SOURCES: IBO; Economic Devevlopment Corporation; Department of Finance.