Embed Size (px)
Citation preview

Diane Roy Vice President, Regulatory Affairs Gas Regulatory Affairs Correspondence Email: [email protected] Electric Regulatory Affairs Correspondence Email: [email protected]
FortisBC 16705 Fraser Highway Surrey, B.C. V4N 0E8 Tel: (604) 576-7349 Cell: (604) 908-2790 Fax: (604) 576-7074 www.fortisbc.com
August 19, 2020 British Columbia Utilities Commission Suite 410, 900 Howe Street Vancouver, BC V6Z 2N3 Attention: Ms. Marija Tresoglavic, Acting Commission Secretary Dear Ms. Tresoglavic: Re: FortisBC Inc. (FBC)
Multi-Year Rate Plan for 2020 through 2024 approved by British Columbia Utilities Commission (BCUC) Order G-166-20 (MRP Plan)
Annual Review for 2020 and 2021 Rates
In accordance with the MRP Plan and BCUC Order G-211-20 setting out the Regulatory Timetable for FBC’s Annual Review, FBC hereby attaches its Annual Review for 2020 and 2021 Rates Application materials. If further information is required, please contact the undersigned. Sincerely, FORTISBC ENERGY INC. Original signed:
Diane Roy Attachments cc (email only): Registered Parties to the FortisBC Application for Multi-Year Rate Plan for 2020 through 2024

FORTISBC INC.
Multi-Year Rate Plan
for 2020 through 2024
Annual Review for 2020 and 2021 Rates
Volume 1 - Application
August 19, 2020

FORTISBC INC. ANNUAL REVIEW FOR 2020 AND 2021 RATES
PAGE I
Table of Contents
1. APPROVALS SOUGHT, OVERVIEW OF THE APPLICATION AND PROPOSED PROCESS ............................................................................................ 1
1.1 Introduction .................................................................................................................. 1
Permanent 2020 Rates ....................................................................................... 1
Permanent 2021 Rates ....................................................................................... 2
1.2 Approvals Sought ........................................................................................................ 2
1.3 Requirements for the Annual Review ......................................................................... 3
1.4 Revenue Requirement and Rate Changes for 2020 and 2021 .................................. 4
Load Forecast (Section 3) .................................................................................. 6
Power Supply (Section 4) ................................................................................... 6
Other Revenue (Section 5) ................................................................................. 6
Operations and Maintenance (O&M) Expense (Section 6) ................................ 6
Depreciation and Amortization (Section 7) ......................................................... 7
Financing and Return on Equity (Section 8) ....................................................... 7
Taxes (Section 9) ............................................................................................... 8
1.5 Service Quality Indicators (Section 13) ...................................................................... 8
2. FORMULA DRIVERS ................................................................................................ 9
2.1 Introduction and Overview .......................................................................................... 9
2.2 Inflation Factor Calculation Summary ........................................................................ 9
2.3 Growth Factor Calculation Summary ....................................................................... 10
2.4 Inflation and Growth Calculation Summary ............................................................. 11
3. LOAD FORECAST AND REVENUE AT EXISTING RATES .................................. 12
3.1 Introduction and Overview ........................................................................................ 12
3.2 Overview of Forecast Methods ................................................................................. 12
3.3 Demand Side Management Savings ......................................................................... 13
3.4 Load Forecast ............................................................................................................. 14
Residential ........................................................................................................ 16
Commercial ...................................................................................................... 18
Wholesale ......................................................................................................... 20
Industrial ........................................................................................................... 21
Lighting ............................................................................................................. 22
Irrigation ............................................................................................................ 23

FORTISBC INC. ANNUAL REVIEW FOR 2020 AND 2021 RATES
PAGE II
Losses and Company Use ............................................................................... 24
Peak Demand ................................................................................................... 25
3.5 Customer Forecast..................................................................................................... 26
3.6 Revenue Forecast ...................................................................................................... 27
3.7 Summary ..................................................................................................................... 27
4. POWER SUPPLY .................................................................................................... 29
4.1 Introduction and Overview ........................................................................................ 29
4.2 Summary of Power Supply Resources .................................................................... 29
4.3 Portfolio Optimization ................................................................................................ 30
4.4 FBC 2020/21 Annual Electric Contracting Plan ....................................................... 31
4.5 2020 Projected Power Purchase Expense ............................................................... 31
4.6 2021 Forecast Power Purchase Expense ................................................................. 32
4.7 Wheeling Expense...................................................................................................... 34
4.8 Transmission Service Loss Recoveries ................................................................... 34
4.9 Water Fees .................................................................................................................. 35
4.10 Summary ..................................................................................................................... 35
5. OTHER REVENUE .................................................................................................. 36
5.1 Introduction and Overview ........................................................................................ 36
5.2 Apparatus and Facilities Rental ................................................................................ 36
5.3 Contract Revenue....................................................................................................... 37
5.4 Transmission Access Revenue ................................................................................ 37
5.5 Interest Income ........................................................................................................... 37
5.6 Late Payment Charges............................................................................................... 37
5.7 Connection Charges .................................................................................................. 38
5.8 Other Recoveries........................................................................................................ 38
5.9 Summary ..................................................................................................................... 38
6. O&M EXPENSE ....................................................................................................... 39
6.1 Introduction and Overview ........................................................................................ 39
6.2 Formula O&M Expense .............................................................................................. 40
New/Incremental System Operations, Integrity and Security Funding ............. 40
6.3 O&M Expense Forecast Outside the Formula ......................................................... 42
Pension and OPEB Expense ............................................................................ 42
Insurance Premiums ......................................................................................... 44

FORTISBC INC. ANNUAL REVIEW FOR 2020 AND 2021 RATES
PAGE III
BCUC Levies .................................................................................................... 44
Annual Inspection Costs for Upper Bonnington Old Units ................................ 45
Clean Growth Initiative – Electric Vehicle (EV) Charging Stations ................... 46
6.4 Net O&M Expense ...................................................................................................... 46
6.5 Summary ..................................................................................................................... 46
7. RATE BASE ............................................................................................................ 47
7.1 Introduction and Overview ........................................................................................ 47
7.2 Regular Capital Expenditures ................................................................................... 48
Approved Capital Expenditures ........................................................................ 48
Flow-Through Capital Expenditures ................................................................. 48
7.3 Major Projects Capital Expenditures ........................................................................ 49
7.4 2020 and 2021 Plant Additions .................................................................................. 51
7.5 Contributions in Aid of Construction (CIAC) ........................................................... 51
7.6 Accumulated Depreciation ........................................................................................ 51
7.7 Rate Base Deferred Charges ..................................................................................... 52
New Deferral Accounts ..................................................................................... 53
Existing Deferral Accounts ............................................................................... 63
7.8 Working Capital .......................................................................................................... 66
7.9 Summary ..................................................................................................................... 66
8. FINANCING AND RETURN ON EQUITY ................................................................ 67
8.1 Introduction and Overview ........................................................................................ 67
8.2 Capital Structure and Return on Equity ................................................................... 67
8.3 Financing Costs ......................................................................................................... 67
Long-term Debt ................................................................................................. 67
Short-term Debt ................................................................................................ 68
Forecast of Interest Rates ................................................................................ 68
Interest Expense Forecast ................................................................................ 69
Allowance for Funds Used During Construction (AFUDC) ............................... 69
8.4 Summary ..................................................................................................................... 70
9. TAXES ..................................................................................................................... 71
9.1 Introduction and Overview ........................................................................................ 71
9.2 Property Taxes ........................................................................................................... 71
9.3 Income Tax ................................................................................................................. 72
9.4 Accelerated Investment Incentive ............................................................................ 73

FORTISBC INC. ANNUAL REVIEW FOR 2020 AND 2021 RATES
PAGE IV
9.5 Summary ..................................................................................................................... 73
10. EARNINGS SHARING ............................................................................................ 74
11. FINANCIAL SCHEDULES ...................................................................................... 75
12. ACCOUNTING MATTERS .................................................................................... 138
12.1 Introduction and Overview ...................................................................................... 138
12.2 Exogenous (Z) Factors ............................................................................................ 138
COVID-19 Pandemic ...................................................................................... 138
12.3 Accounting Matters .................................................................................................. 140
Emerging Accounting Guidance ..................................................................... 140
12.4 Non Rate Base Deferral Accounts .......................................................................... 141
Existing Deferral Accounts ............................................................................. 141
12.5 Summary ................................................................................................................... 145
13. SERVICE QUALITY INDICATORS ....................................................................... 146
13.1 Introduction and Overview ...................................................................................... 146
13.2 Review of the Performance of Service Quality Indicators .................................... 146
Safety Service Quality Indicators .................................................................... 148
Responsiveness to Customer Needs Service Quality Indicators ................... 149
Reliability Service Quality Indicators .............................................................. 154
13.3 Summary ................................................................................................................... 157
14. PBR ELEMENTS ................................................................................................... 158
14.1 Introduction and Overview ...................................................................................... 158
14.2 True-Up of PBR Plan Rate Base .............................................................................. 158
14.3 2019 Flow-Through Account ................................................................................... 158
14.4 Earnings sharing ...................................................................................................... 160
2019 Earnings Sharing ................................................................................... 160
Actual Customer Growth Adjustment ............................................................. 161
True-Up for 2018 Actual Earnings Sharing ..................................................... 163
Summary of 2019 Earnings Sharing ............................................................... 164
14.5 Service Quality Indicators ....................................................................................... 164

FORTISBC INC. ANNUAL REVIEW FOR 2020 AND 2021 RATES
PAGE V
List of Appendices
Appendix A – Load Forecast Supplementary Information
A1 - Statistics Canada and Conference Board of Canada Reports
A2 - Load Forecast Tables
A3 - Load Forecast Methods
Appendix B – Playmor Station Upgrade Business Case
Appendix C – Prior Year Directives
C1 - Prior Year Directives
C2 - AMI Project Net O&M Costs and Savings
C3 - Ruckles Substation Rebuild Project Status Report
C4 - Upper Bonnington Old Units Refurbishment Project Final Report
Appendix D – Draft Order

FORTISBC INC. ANNUAL REVIEW FOR 2020 AND 2021 RATES
PAGE VI
Index of Tables and Figures
Table 1-1: Annual Review Requirements .................................................................................... 3
Table 2-1: I-Factor Calculation ................................................................................................... 10
Table 2-2: Average Customer (AC) Growth Factor Calculation ................................................. 11
Table 2-3: Summary of Formula Drivers .................................................................................... 11
Table 3-1: Forecast Incremental 2020 and 2021 DSM Savings (GWh) ..................................... 14
Table 3-2: Normalized After-Savings Gross Load and System Peak ........................................ 15
Table 3-3: Year-End Direct Customer Count ............................................................................. 27
Table 3-4: Forecast Sales Revenue at Approved Rates ($ millions) ......................................... 27
Table 4-1: Power Supply Cost ($ millions) ................................................................................. 29
Table 4-2: 2019 and 2020 Power Purchase Expense ($ millions) ............................................. 32
Table 4-3: 2020 Projected and 2021 Forecast Power Purchase Expense ($ millions) .............. 32
Table 4-4: Wheeling Expense ($ millions) ................................................................................. 34
Table 4-5: Transmission Service Loss Recoveries (GWh) ........................................................ 35
Table 4-6: Water Fees ($ millions) ............................................................................................. 35
Table 5-1: Other Revenue ($ millions) ....................................................................................... 36
Table 6-1: O&M Expense ........................................................................................................... 39
Table 6-2: Calculation of 2020 and 2021 Formula O&M ($ thousands) .................................... 40
Table 6-3: System Operations, Integrity and Security New/Incremental Spending ................... 41
Table 6-4: Forecast O&M ($ millions) ........................................................................................ 42
Table 6-5: Pension and OPEB Expense ($ millions) ................................................................. 43
Table 6-6: Insurance Premiums ($ millions) .............................................................................. 44
Table 7-1: Regular Capital Expenditures ($millions) .................................................................. 48
Table 7-2: Approved Capital Expenditures ................................................................................ 48
Table 7-3: Flow-Through Regular Capital Expenditures ($ million) ........................................... 49
Table 7-4: Reconciliation of Capital Expenditures to Plant Additions ($millions) ....................... 51
Table 7-5: Deferral Account Filing Considerations .................................................................... 57
Table 7-6: Bill Payment Deferral Forecast ................................................................................. 63
Table 7-7: Bill Credit Forecast ................................................................................................... 64
Table 7-8: Unrecoverable Revenue Forecast ............................................................................ 64
Table 8-1: Short Term Interest Rate Forecast ........................................................................... 69
Table 8-2: Calculation of AFUDC Rates for 2020 and 2021 ...................................................... 70
Table 9-1: Property Taxes ($ millions) ....................................................................................... 71
Table 12-1: 2018-2019 Revenue Surplus Deferral Account Continuity ($ millions) ................. 142
Table 12-2: Variances Captured in the Flow-through Deferral Account .................................. 144
Table 13-1: Approved SQIs, Benchmarks and Actual Performance ........................................ 147
Table 13-2: Historical Emergency Response Time .................................................................. 148
Table 13-3: Historical All Injury Frequency Rate Results ......................................................... 149
Table 13-4: Historical First Contact Resolution Levels ............................................................ 150
Table 13-5: Calculation of 2020 Billing Index ........................................................................... 151
Table 13-6: Historical Billing Index Results .............................................................................. 151

FORTISBC INC. ANNUAL REVIEW FOR 2020 AND 2021 RATES
PAGE VII
Table 13-7: Historical Meter Reading Accuracy Results .......................................................... 152
Table 13-8: Historical TSF Results .......................................................................................... 152
Table 13-9: Historical Customer Satisfaction Results .............................................................. 153
Table 13-10: Average Speed of Answer .................................................................................. 154
Table 13-11: Historical SAIDI Results ...................................................................................... 155
Table 13-12: Historical SAIFI Results ...................................................................................... 156
Table 13-13: Historical Generator Forced Outages ................................................................. 156
Table 13-14: Interconnection Utilization ................................................................................... 157
Table 14-1: 2019 Flow-Through Deferral Account Additions ($ millions) ................................. 159
Table 14-2: Summary of Earnings Sharing to be Returned in 2020 ($ millions) ...................... 160
Table 14-3: Calculation of 2019 Earnings Sharing ($ millions) ................................................ 161
Table 14-4: Calculation of Earnings Sharing Adjustment for 2018 Actual Customer Growth ($ millions) ............................................................................................. 162
Table 14-5: Calculation of Earnings Sharing Adjustment for 2019 Actual Customer Growth ($ millions) .............................................................................................. 163
Table 14-6: Calculation of 2018 Actual Earnings Sharing True-up ($millions)......................... 164
Table 14-7: Approved SQIs, Benchmarks and Actual Performance ........................................ 164
Figure 1-1: 2020 Revenue Deficiency ($ millions) ....................................................................... 5
Figure 1-2: 2021 Revenue Deficiency ($ millions) ....................................................................... 5
Figure 3-1: Total Net Load (GWh) ............................................................................................. 15
Figure 3-2: Year-End Direct Residential Customer Count ......................................................... 16
Figure 3-3: Normalized After-Savings Residential UPC (MWh) ................................................. 17
Figure 3-4: Normalized After-Savings Residential Load (GWh) ................................................ 18
Figure 3-5: Year-End Direct Commercial Customer Count ........................................................ 19
Figure 3-6: After-Savings Commercial Load (GWh) .................................................................. 20
Figure 3-7: Normalized After-Savings Wholesale Load (GWh) ................................................. 21
Figure 3-8: After-Savings Industrial Load (GWh) ....................................................................... 22
Figure 3-9: After-Savings Lighting Load (GWh) ......................................................................... 23
Figure 3-10: After-Savings Irrigation Load (GWh) ..................................................................... 24
Figure 3-11: Normalized After-Savings Load Losses (GWh) ..................................................... 25
Figure 3-12: After-Savings Winter Peaks (MW) ......................................................................... 26
Figure 3-13: After-Savings Summer Peaks (MW) ...................................................................... 26
Figure 7-1: FBC Forecast Mid-Year Balances of Rate Base Deferral Accounts by Category ............................................................................................................... 53

FORTISBC INC. ANNUAL REVIEW FOR 2020 AND 2021 RATES
SECTION 1: APPROVALS SOUGHT, OVERVIEW OF THE APPLICATION AND PROPOSED PROCESS PAGE 1
1. APPROVALS SOUGHT, OVERVIEW OF THE APPLICATION AND 1 PROPOSED PROCESS 2
1.1 INTRODUCTION 3
FortisBC Inc. (FBC or the Company) files this Application in compliance with British Columbia 4 Utilities Commission (BCUC) Order G-166-20, which approved a Multi-Year Rate Plan (MRP or 5 the Plan) for FBC for the years 2020 to 2024. In accordance with the MRP, an annual review 6 process is required to set rates for each year of the MRP. 7
By Order G-303-19, the BCUC approved FBC’s 2020 rates on an interim basis, pending a 8 decision on the MRP. With the filing of this Application, FBC seeks to commence the annual 9 review process to set permanent rates for 2020 and 2021. 10
The MRP approved by the Decision attached to Order G-166-20 (MRP Decision) provides 11 stable levels of O&M funding while maintaining service quality. The approved Earnings Sharing 12 Mechanism (ESM), set out in Section 10, aligns the incentive properties of the Plan between 13 customers and the Company. 14
In the first year of the MRP, FBC anticipates relatively minor O&M savings in 2020 as compared 15 to that allowed under the O&M formula, and as a result has not forecast any savings or related 16 earnings sharing. The reason for FBC’s expectation of relatively minor formulaic O&M savings 17 is twofold. First, as described in its MRP application, FBC expects to face both continued and 18 new cost pressures. Second, with the inclusion of a 0.5 percent Productivity Improvement 19 Factor (PIF), which was directed by the BCUC as part of the MRP Decision, FBC will be 20 challenged to achieve savings beyond the embedded PIF. 21
FBC will continue to pursue productivity improvements as it seeks to manage its business 22 needs within the challenges described above. While such potential productivity improvements 23 may lead to cost reductions, FBC’s focus will be on efficient allocation of resources within the 24 business and “doing more with what we have”. FBC believes this approach to productivity 25 represents an appropriate balancing of the ongoing need to manage costs and mitigate 26 customer rate pressure, while providing resources to support growth and maintaining service 27 levels. 28
Permanent 2020 Rates 29
The rates for 2020 that would flow from the approved formulas and forecasts set out in the 30 Application result in a 1.93 percent rate increase from 2019 rates. This increase, before 31 utilization of a portion of FBC’s 2018-2019 Revenue Surplus deferral, which is further described 32 in Section 1.4, incorporates the actual 2019 results of the final year of the 2014-2019 33 Performance Based Ratemaking (PBR) Plan. Overall, FBC proposes to recover $0.250 million 34 (before tax) in earnings sharing from customers in 2020. This amount is a true-up from FBC’s 35 2019 projected earnings sharing and does not reflect savings in 2020 that may be achieved. 36

FORTISBC INC. ANNUAL REVIEW FOR 2020 AND 2021 RATES
SECTION 1: APPROVALS SOUGHT, OVERVIEW OF THE APPLICATION AND PROPOSED PROCESS PAGE 2
Order G-303-19 set FBC’s interim rates at 1.00 percent over 2019 approved rates. Due to the 1 expected timing of a decision on this Application, FBC is proposing to set permanent 2020 rates 2 at the existing interim levels and to capture the revenue deficiency greater than the 1.00 percent 3 approved as interim in the existing 2018-2019 Revenue Surplus deferral account as an offset to 4 prior years’ revenue surpluses. 5
Permanent 2021 Rates 6
The proposed rate change for 2021 after drawing down the 2018-2019 Revenue Surplus 7 deferral account to zero is a 6.37 percent rate increase from 2020 rates. The increase is 8 primarily due to an increase in depreciation and amortization expense and power supply costs 9 compared to 2020 Projected, as discussed in Section 1.4 below. 10
As noted above, FBC anticipates relatively minor formulaic O&M savings in 2020. FBC 11 continues to maintain a high level of service quality as indicated by meeting the Service Quality 12 Indicators (SQIs) approved in the MRP Decision. Once 2020 results are known, FBC will 13 determine the 2020 earnings sharing, if any, when setting rates for 2022. 14
In the sections below, FBC sets out the approvals it is seeking and provides an overview of the 15 requirements for the annual review process. This is followed by a summary of FBC’s proposed 16 revenue requirements and rate changes for 2020 and 2021 and an overview of the SQIs. 17 These matters are addressed in more detail in subsequent sections of the Application. 18
1.2 APPROVALS SOUGHT 19
With this Application, FBC requests BCUC approval for the following pursuant to sections 59 to 20 61 of the Utilities Commission Act (UCA): 21
1. Existing 2020 interim rates be made permanent, effective January 1, 2020; 22
2. A permanent rate increase of 6.37 percent, effective January 1, 2021; 23
3. The following deferral account approvals, as described in Sections 7.7 and 12.4: 24
Creation of rate base deferral accounts for the following regulatory proceedings: 25
o Annual Reviews for 2020 to 2024 Rates, with balances to be amortized in the 26 following year; 27
o 2021 Long-Term Electric Resource Plan (LTERP); 28
o 2020 Cost of Service Analysis (COSA) filing; and 29
o BCUC-Initiated Inquiries, with balances to be amortized in the following year; 30
Creation of a rate base deferral account to capture costs related to the Indigenous 31 Relations Agreement (Huth Substation); 32

FORTISBC INC. ANNUAL REVIEW FOR 2020 AND 2021 RATES
SECTION 1: APPROVALS SOUGHT, OVERVIEW OF THE APPLICATION AND PROPOSED PROCESS PAGE 3
1
Creation of a rate base deferral account to capture the costs of the 2021 triennial 2 Mandatory Reliability Standards (MRS) audit; 3
Draw down of the 2018-2019 Revenue Surplus deferral account in the amount of 4 $3.326 million in 2020 and $1.410 million in 2021, bringing the account balance to 5 zero; and 6
The previously approved 2020 Revenue Requirement Application deferral account to 7 be renamed to the 2020-2024 MRP Application deferral account, and amortized over 8 a five-year period beginning January 1, 2020. 9
4. To record COVID-19 incremental costs and related savings from 2020 and 2021 into the 10 previously approved COVID-19 Customer Recovery Fund Deferral Account, as 11 discussed in Section 12.2.1 of the Application. 12
13 FBC also requests, pursuant to section 44.2(3) of the UCA, acceptance of a capital expenditure 14 schedule consisting of the capital expenditures for the Playmor Substation Upgrade Project, as 15 described in Appendix B. 16
A draft order is included in Appendix D. 17
1.3 REQUIREMENTS FOR THE ANNUAL REVIEW 18
On page 167 of the MRP Decision, the BCUC set out its expectations for the Annual Review 19 component of the MRP. For reference, the table below sets out each requirement and FBC’s 20 response or where it is addressed in the Application. 21
Table 1-1: Annual Review Requirements 22
Item Description Response or Reference 1 Review of the current year projections and the upcoming year’s
forecast. For further clarity, these items are listed below: See items 1(a) to 1(f) below
1(a) Customer growth, volumes and revenues; Section 3 1(b) Year-end and average customers, and other cost driver
information including inflation; Section 2
1(c) Expenses, determined by the indexing formula plus items forecast annually;
Section 6
1(d) Capital expenditures (as provided for by the capital forecast), plus other items forecast annually;
Section 7
1(e) Plant balances, deferral account balances and other rate base information and depreciation and amortization to be included in rates; and
Sections 7 and 12

FORTISBC INC. ANNUAL REVIEW FOR 2020 AND 2021 RATES
SECTION 1: APPROVALS SOUGHT, OVERVIEW OF THE APPLICATION AND PROPOSED PROCESS PAGE 4
Item Description Response or Reference 1(f) Projected earnings sharing for the current year and true-up to
actual earnings sharing for the prior year. Section 10
2 Identification of any efficiency initiatives that the Utilities have undertaken, or intend to undertake, that require a payback period extending beyond the MRP period with recommendations to the BCUC with respect to the treatment of such initiatives.
FBC has not identified any efficiency initiatives with a payback beyond the end of the MRP period
3 Review of any exogenous events that the Company or stakeholders have identified that should be put forward to the BCUC for review.
Section 12.2
4 Review of the Utilities’ performance with respect to SQIs. Bring forward recommendations to the BCUC where there have been a “sustained serious degradation” of service.
Section 13
5 Assess and make recommendations with respect to any SQIs that should be reviewed in future Annual Reviews.
FBC does not have any recommendations at this time
6 Reporting on the Innovation Fund status. Not Applicable for FBC 7 Assess and make recommendations to the BCUC on potential
issues or topics for future Annual Reviews. FBC does not have any recommendations at this time
1
1.4 REVENUE REQUIREMENT AND RATE CHANGES FOR 2020 AND 2021 2
FBC has calculated the 2020 revenue requirement using a combination of the approved formula 3 for O&M and the approved forecasts for Regular Capital from the MRP Decision as well as 4 projected 2020 amounts for items that are forecast annually. The projected 2020 amounts for 5 these forecast items include six months of actual results up to June 30, 2020. 6
The rates for 2020 flowing from the revenue requirement components set out in the Application 7 result in a 1.93 percent increase from 2019 rates; however, FBC is proposing to make 8 permanent the existing interim rates for 2020, effective January 1, 2020, and to capture the 9 revenue deficiency greater than 1.00 percent in the existing 2018-2019 Revenue Surplus 10 deferral account. 11
The proposed rates for 2021, after drawing down the balance in the 2018-2019 Revenue 12 Surplus deferral account, result in a 6.37 percent increase from 2020 rates. 13
The following charts summarize the items that contribute to the 2020 and 2021 revenue 14 deficiencies, including the proposed draw-down of $3.326 million in 2020 and $1.410 million in 15 2021 from the 2018-2019 Revenue Surplus deferral account. The charts show each item that 16 increases the deficiency in yellow and each item that decreases the deficiency in green. The 17 2020 and 2021 deficiencies of $3.587 million and $23.543 million, respectively, are then the 18 sum of all of the previous bars and are shown at the end of the charts in blue. For 2020, the 19 blue bar represents the sum required to bring the total revenue deficiency to the deficiency 20

FORTISBC INC. ANNUAL REVIEW FOR 2020 AND 2021 RATES
SECTION 1: APPROVALS SOUGHT, OVERVIEW OF THE APPLICATION AND PROPOSED PROCESS PAGE 5
determined when setting interim rates for 2020 (1.00 percent). For 2021, the blue bar represents 1 the total revenue deficiency of $23.543 million (6.37 percent) after the final draw-down of the 2 2018 – 2019 Revenue Surplus deferral account to zero. 3
Figure 1-1: 2020 Revenue Deficiency ($ millions) 4
5
Figure 1-2: 2021 Revenue Deficiency ($ millions) 6
7

FORTISBC INC. ANNUAL REVIEW FOR 2020 AND 2021 RATES
SECTION 1: APPROVALS SOUGHT, OVERVIEW OF THE APPLICATION AND PROPOSED PROCESS PAGE 6
Each of the categories is discussed briefly below. 1
Load Forecast (Section 3) 2
For 2020, FBC has projected a sales load decrease of 40 GWh from 2019 Approved primarily 3 due to lower residential, commercial and wholesale usage on a per customer basis. These 4 decreases are partially offset by an increase in industrial load and use per customer. Lighting 5 and irrigation loads are projected to decease by 3 and 5 GWh, respectively, in 2020 when 6 compared to 2019 Approved. 7
For 2021, FBC has forecast a sales load increase of 84 GWh from 2020 Projected primarily due 8 to higher commercial, wholesale and industrial usage on a per customer basis. These 9 increases are partially offset by a decrease in residential load and use per customer when 10 compared to 2020 Projected. 11
FBC’s 2020 Projected revenue at 2019 existing rates and 2021 Forecast revenue at 2020 12 approved interim rates is $358.668 million and $369.643 million, respectively. 13
Power Supply (Section 4) 14
Power Supply expense is projected to decrease in 2020 by $5.418 million, which is attributed to 15 decreased purchases from the BC Hydro PPA due to a decrease in gross load and lower cost 16 wholesale market purchases. 17
FBC has forecast Power Supply to increase by $7.742 million in 2021 compared to 2020 18 Projected. This increase is mainly the result of an increase in gross load and, correspondingly, a 19 greater reliance on higher cost energy supplied by BC Hydro. 20
Other Revenue (Section 5) 21
Other Revenue is projected to increase in 2020 by $1.377 million. The main drivers of this 22 increase are Apparatus and Facility Rental and Contract Revenue, partially offset by lower Late 23 Payment Charges. For 2021, FBC has forecast Other Revenue to increase by $1.576 million 24 due to increases in Contract Revenue and Late Payment Charges. 25
Operations and Maintenance (O&M) Expense (Section 6) 26
FBC establishes the majority of its O&M expense by formula during the MRP term. For 2020, 27 the formula incorporates an inflation factor (I-Factor) of 2.309 percent, which is inclusive of a 28 productivity improvement factor (X-Factor) of 0.5 percent, and uses a forecast of the change in 29 average customers, for a total increase in formula O&M of 6.0 percent from 2019 Approved. 30 O&M forecast outside of the formula is decreasing by 21.5 percent from 2019 Approved, 31 primarily due to a number of items moving out of forecast O&M and into Base O&M, and a 32 decrease in Pension and OPEB costs. The 2020 increase in total O&M expense net of 33 capitalized overhead is $2.290 million. 34

FORTISBC INC. ANNUAL REVIEW FOR 2020 AND 2021 RATES
SECTION 1: APPROVALS SOUGHT, OVERVIEW OF THE APPLICATION AND PROPOSED PROCESS PAGE 7
For 2021, the O&M formula incorporates an inflation factor (I-Factor) of 3.793 percent, which is 1 inclusive of a productivity improvement factor (X-Factor) of 0.5 percent and uses a forecast of 2 the change in average customers for a total increase in formula O&M of 4.4 percent from 2020 3 formula O&M. O&M forecast outside of the formula is increasing by 24.2 percent over 2020 4 Projected, primarily due to Pension and OPEB and Insurance expense increases. The 2021 5 increase in total O&M expense net of capitalized overhead is $2.736 million. 6
Depreciation and Amortization (Section 7) 7
FBC’s depreciation expense is projected to increase by $0.401 million in 2020. Depreciation 8 increased by $2.373 million from adopting new depreciation rates as approved in the MRP 9 Decision, with an offsetting $1.972 million decrease in expense from resetting plant to actual, 10 which resulted in an increase in plant accounts with lower depreciation rates when compared to 11 2019 PBR plant balances. FBC’s amortization expense increased by $5.025 million in 2020 12 predominantly from a decrease in the credit from FBC’s Flow-through deferral account 13 amortization in 2020 when compared to 2019. 14
FBC’s 2021 depreciation and amortization expense increases by $3.123 million compared to 15 2020 Projected. Depreciation expense increases by approximately $1.000 million as a result of 16 CPCN additions to plant for the Corra Linn Dam Spillway Gate Replacement Project, the Grand 17 Forks Terminal Station (GFT) Reliability Project, and the Upper Bonnington (UBO) Old Units 18 Refurbishment Project, as discussed in Section 7. Amortization expense in 2021 increases by 19 $7.759 million primarily from the elimination of the credit flow-through variance embedded in 20 2020 rates from the final year of the 2014 – 2019 PBR Plan. 21
Financing and Return on Equity (Section 8) 22
The impact to FBC’s 2020 and 2021 deficiency is a sum of financing rate changes, the ratio of 23 long-term debt vs. short-term debt, and changes in rate base. 24
For 2020, FBC has issued $75 million of long-term debt in May 2020, and is projecting a short-25 term debt rate of 1.86 percent, a decrease from the 4.12 percent short-term debt rate embedded 26 in the 2019 Approved revenue requirement. Overall, FBC’s deficiency is reduced by $2.194 27 million from financing rate changes and further reduced by $0.141 million from the ratio change 28 between long-term and short-term debt. The increase in 2020 rate base has contributed $4.706 29 million to FBC’s deficiency when compared to 2019 Approved, due to a combination of the 30 Corra Linn Dam Spillway Gate Replacement Project, the UBO Old Units Refurbishment Project, 31 and the GFT Reliability Project entering rate base in 2020, as well as regular capital additions, 32 as discussed in Section 7. 33
For 2021, FBC has forecast a mid-year long-term debt issue of $75 million and is forecasting a 34 short-term debt rate of 2.22 percent, an increase from the 1.86 percent short-term debt rate 35 embedded in the 2020 Projected revenue requirement. Overall, FBC’s deficiency is reduced by 36 $0.049 million from financing rate changes and further decreased by $0.005 million from the 37 ratio change between long-term and short-term debt. The increase in 2021 rate base has 38

FORTISBC INC. ANNUAL REVIEW FOR 2020 AND 2021 RATES
SECTION 1: APPROVALS SOUGHT, OVERVIEW OF THE APPLICATION AND PROPOSED PROCESS PAGE 8
contributed $4.400 million to FBC’s deficiency when compared to 2020 Projected due to a 1 combination of CPCN additions and regular capital additions entering rate base, as discussed in 2 Section 7. 3
FBC has utilized the approved 2020 and 2021 capital structure and return on equity of 40 4 percent and 9.15 percent, respectively. 5
Taxes (Section 9) 6
FBC’s 2020 property taxes are projected to increase by 1.7 percent or $0.280 million from 2019 7 Approved, and 2021 property taxes are forecast to increase by 7.4 percent or $1.249 million 8 from 2020 Projected. The 2021 increases are driven by increases in rates for transmission and 9 distribution lines. 10
There has been no change in the income tax rate of 27 percent from 2019. Taxes are forecast 11 to decrease in 2020 by $2.892 million, primarily due to a decrease to adjustments to taxable 12 income from the Federal government’s Accelerated Investment Incentive regime, and increase 13 in 2021 by $3.636 million due to increases in rate base and amortization of deferred charges. 14
1.5 SERVICE QUALITY INDICATORS1 (SECTION 13) 15
FBC’s June 2020 year-to-date SQI results indicate that the Company’s overall performance to 16 date is representative of a high level of service quality. At the end of June 2020, for the eight 17 SQIs with benchmarks, all performed at or better than the thresholds. For the four SQIs that are 18 informational only, performance generally remains at a level consistent with prior years. Details 19 of the SQIs are included in Section 13. 20
1 FBC’s Final 2018 and 2019 SQIs, pertaining to the PBR Plan, are provided in Section 14.
FORTISBC INC. ANNUAL REVIEW FOR 2020 AND 2021 RATES
SECTION 2: FORMULA DRIVERS PAGE 9
2. FORMULA DRIVERS 1
2.1 INTRODUCTION AND OVERVIEW 2
This section provides the calculation of the Inflation Factor (or I-Factor) and Growth Factor used 3 for calculating the 2020 and 2021 O&M amounts according to the MRP formula. 4
In the MRP Decision and Order G-166-20, the BCUC approved an I-Factor using the actual 5 CPI-BC and BC-AWE indices from the previous year and a labour weighting based on the most 6 recent completed year of actuals.2 7
The MRP Decision approved the elimination of the lagging growth factor and approved the use 8 of a forecast of growth3 to determine Formula O&M. Further, the MRP Decision determined that 9 a growth factor multiplier of 75 percent for Formula O&M was appropriate. 10
The Inflation Factor and Growth Factor calculations utilize the above-described inputs and 11 determinations. For 2020 and 2021, FBC has used July 2017 through June 2019 inflation data 12 for the 2020 revenue requirement calculations and July 2018 through June 2020 inflation data 13 for the 2021 revenue requirement calculations, using the Statistics Canada tables included in 14 Appendix A1 of the Application. 15
2.2 INFLATION FACTOR CALCULATION SUMMARY 16
In the MRP Decision, the BCUC approved an Inflation Factor (I-Factor) using the actual CPI-BC 17 and BC-AWE indices from the previous year and the actual labour weighting based on the most 18 recent completed year of actuals. FBC uses inflation data from July through June and Statistics 19 Canada Table 18-10-0004-01 (formerly CANSIM 326-0020) for CPI-BC and Table 14-10-0223-20 01 (formerly CANSIM 281-0063) to determine AWE-BC. The supporting Statistics Canada 21 tables are provided in Appendix A1. The latest available month of May 2020 has been used as a 22 placeholder for June 2020 for AWE-BC, as results for this period have not been released by 23 Statistics Canada. Once results for this period are available, this placeholder will be replaced 24 with actuals and included in an Evidentiary Update or Compliance Filing. 25
As shown in Table 2-1 below, the I-Factor has been calculated utilizing actual CPI-BC and 26 AWE-BC data. Applying the actual 2019 labour weighting of 62 percent, the calculation of the 27 2020 I-Factor is (2.692 percent x 38 percent) + (2.881 percent x 62 percent) = 2.809 percent, 28 and the calculation of the 2021 I-Factor is (1.596 percent x 38 percent) + (5.946 percent x 62 29 percent) = 4.293 percent. 30
2 FBC’s most recent year of completed actuals is 2019 so that ratio has been used for both the 2020 and 2021 I-
Factor calculation. The 2022 I-Factor calculation will be based on 2020 actual non-labour / labour split. 3 Forecast of average customers for Formula O&M, including a true-up to actual customers in the following years.

FORTISBC INC. ANNUAL REVIEW FOR 2020 AND 2021 RATES
SECTION 2: FORMULA DRIVERS PAGE 10
Table 2-1: I-Factor Calculation 1
2
2.3 GROWTH FACTOR CALCULATION SUMMARY 3
As noted above, the BCUC approved the use of a forecast of average customers with a 75 4 percent modifier to determine Formula O&M. The calculation of average customers used to 5 determine Formula O&M is summarized in the table below. 6
Table: 18-
10-0004-01
Table: 14-10-
0223-01 12 Mth Average
Last
Completed
Line BC CPI BC AWE CPI AWE CPI AWE
Non
labour Labour I-Factor MRP Year
No. Date index $ index $ % % % % %
1 Jul-2017 125.6 939.88
2 Aug-2017 125.9 939.79
3 Sep-2017 125.7 951.51
4 Oct-2017 125.6 950.29
5 Nov-2017 125.9 952.12
6 Dec-2017 125.2 958.25
7 Jan-2018 126.1 957.22
8 Feb-2018 127.0 962.48
9 Mar-2018 127.4 963.99
10 Apr-2018 127.7 953.93
11 May-2018 128.4 956.99
12 Jun-2018 128.6 967.63 126.6 954.51
13 Jul-2018 129.7 974.29
14 Aug-2018 129.6 979.82
15 Sep-2018 128.9 975.65
16 Oct-2018 129.4 978.07
17 Nov-2018 128.9 979.83
18 Dec-2018 129.0 976.63
19 Jan-2019 129.1 973.10
20 Feb-2019 129.8 974.09
21 Mar-2019 130.7 986.67
22 Apr-2019 131.2 991.01
23 May-2019 131.8 1,001.50
24 Jun-2019 131.9 993.45 130.0 982.01 2.692% 2.881% 38% 62% 2.809% 2020
25 Jul-2019 132.4 996.11
26 Aug-2019 132.2 1,003.60
27 Sep-2019 132.0 1,008.09
28 Oct-2019 132.2 1,015.74
29 Nov-2019 131.8 1,012.40
30 Dec-2019 131.7 1,014.52
31 Jan-2020 132.1 1,025.61
32 Feb-2020 132.9 1,025.17
33 Mar-2020 132.3 1,029.38
34 Apr-2020 131.2 1,106.54
35 May-2020 131.5 1,123.79
36 Jun-2020 132.6 1,123.79 132.1 1,040.40 1.596% 5.946% 38% 62% 4.293% 2021

FORTISBC INC. ANNUAL REVIEW FOR 2020 AND 2021 RATES
SECTION 2: FORMULA DRIVERS PAGE 11
Table 2-2: Average Customer (AC) Growth Factor Calculation4 1
2
2.4 INFLATION AND GROWTH CALCULATION SUMMARY 3
A summary of the factors used to determine Formula O&M for 2020 and 2021 is provided in 4 Table 2-3, including the I-Factors calculated in Section 2.2, the approved X-Factor of 0.5 5 percent, and the forecast of customers incorporating the growth factor multiplier determined in 6 Section 2.3. 7
Table 2-3: Summary of Formula Drivers 8
9
In summary, the Net Inflation Factors for 2020 and 2021 are 2.309 percent and 3.793 percent, 10 respectively. Formula O&M for 2020 and 2021 is determined using average customers of 11 140,871 and 142,045, respectively. 12
4 Line 1 for 2020 (Average Customer Forecast – Prior Year) is 2019’s actual average customer count.
LineNo. Description 2020 2021 Reference
1 Average Customer Forecast - Prior Year 139,916 141,189 2 Average Customer Forecast - Test Year 141,189 142,754 Section 11, Schedule 18, Row 83 Average Customer Change 1,273 1,565 Line 2 - Line 14 Customer Growth Factor Multiplier 75% 75% Order G-166-205 Change in Customers - Rate Setting Purposes 955 1,174 Line 3 x Line 467 Average Customer Continuity for Rate Setting Purposes8 Average Customer Forecast - Prior Year 139,916 140,871 Prior Year Line 109 Change in Customers - Rate Setting Purposes 955 1,174 Line 510 Average Customer Forecast - Rate Setting Purposes 140,871 142,045 Line 8 + Line 9
LineNo. Description 2020 2021 Reference
1 CPI 2.692% 1.596% Table 2-1, Lines 24 and 362 AWE 2.881% 5.946% Table 2-1, Lines 24 and 3634 Non Labour 38% 38% Table 2-1, Lines 24 and 365 Labour 62% 62% Table 2-1, Lines 24 and 3667 CPI/AWE Inflation 2.809% 4.293% (Line 1 x Line 4) + (Line 2 x Line 5)89 Productivity Factor -0.500% -0.500% Order G-166-201011 Net Inflation Factor 2.309% 3.793% Line 7 + Line 91213 Average Customer Forecast for Formula O&M purposes 140,871 142,045 Table 2-2, Line 10

FORTISBC INC. ANNUAL REVIEW FOR 2020 AND 2021 RATES
SECTION 3: LOAD FORECAST AND REVENUE AT EXISTING RATES PAGE 12
3. LOAD FORECAST AND REVENUE AT EXISTING RATES 1
3.1 INTRODUCTION AND OVERVIEW 2
This section describes FBC’s forecast of gross system load. The gross system load is a 3 combination of residential, commercial, wholesale, industrial, street lighting and irrigation loads, 4 system losses and company use. The forecast of gross system load includes the impacts of 5 forecast load savings which include Demand Side Management (DSM) savings. These savings 6 are further explained in Section 3.3 – Demand Side Management Savings. 7
FBC is forecasting a decrease in consumption in the 2020 Projected (2020P) forecast (which 8 includes actuals to June 30, 2020) compared to the 2019 Approved. The 2020P gross load5 is 9 projected to be approximately 3,562 GWh, which is a 40 GWh decrease compared to the 2019 10 Approved gross load. The decrease in 2020 is due to decreased loads in the residential, 11 commercial, wholesale, lighting and irrigation classes, partially offset by an increase in industrial 12 load. Based on the 2019 Approved rates for each customer class, FBC’s 2020 Projected 13 revenue forecast is $358.668 million. 14
FBC is forecasting an increase in consumption in the 2021 Forecast (2021F) compared to the 15 2020 Projected forecast. The 2021F normalized gross load is forecast to be approximately 16 3,646 GWh, which is an increase of 84 GWh compared to the 2020 Projected gross load. The 17 increase in 2021F is primarily due to increased loads in the industrial, commercial and 18 wholesale classes, partially offset by lower residential load. Based on the 2020 Approved 19 Interim rates for each customer class, FBC’s 2021 revenue forecast is $369.643 million. 20
FBC has provided further information supporting its demand forecast in Appendix A of the 21 Application. 22
3.2 OVERVIEW OF FORECAST METHODS 23
Consistent with the forecasting method followed by FBC in previous years, the load forecast 24 relies on the following components: 25
the residential and commercial customer count forecast; 26
the residential use per customer (UPC) forecast; 27
the commercial, lighting and irrigation load forecast; and 28
the industrial and wholesale survey forecast. 29
30 The load forecast for residential customers is based on forecasts for the number of customers 31 and UPC rates. Specifically, the average UPC is estimated and is then multiplied by the 32 5 For the 2020P load, FBC replaced the first six months of projected normalized load with actual load.

FORTISBC INC. ANNUAL REVIEW FOR 2020 AND 2021 RATES
SECTION 3: LOAD FORECAST AND REVENUE AT EXISTING RATES PAGE 13
corresponding forecast of the number of customers to derive the residential load forecast. The 1 commercial load forecast is based on a regression against the Conference Board of Canada 2 (CBOC) Gross Domestic Product (GDP) forecast, while the lighting and irrigation forecasts use 3 the prior year’s actual loads. Wholesale and industrial forecasts are primarily based on 4 customer-specific survey results. 5
More detail on FBC’s forecasting methods can be found in Appendix A of this filing. 6
The following sections set out the results of the load forecast. In the figures provided in the load 7 forecast sections, the following three time periods are shown: 8
Actual Years: Actual years are those for which actual data exists for the full calendar 9 year. For this Annual Review the latest calendar year for which full actual data exists is 10 the 2019 calendar year. 11
Projected Year: The Projected Year (2020P) is the year prior to the first forecast year. 12 The Projected Year is forecast based on the latest years of actual data available 13 (through 2019). The January through June forecast values were then replaced with 14 Actual 2020 values. 15
Forecast Year: This is the year or years for which the forecast is being developed. This 16 can be one year (in the case of the Annual Review) or a range of two or more years 17 depending on the filing. In this Application, the forecast year is 2021 (2021F). 18
Also included in the figures in this section is the prior year’s forecasts, 2019F as 19 presented in the Annual Review for 2019 Rates. 20
21 FBC acquired the utility assets and customers of the City of Kelowna’s electric utility effective 22 March 31, 2013, resulting in an increase in direct customers and changes in the composition of 23 customers and sales load by class, which are reflected in the data and figures in this section. 24
3.3 DEMAND SIDE MANAGEMENT SAVINGS 25
FBC forecasts the DSM savings that are incremental to the DSM savings that are already 26 embedded in historical loads up to and including 2019. 27
The DSM savings forecast is deducted from the before-savings forecast for all customer 28 classes. All forecast values in the sections below are shown after being reduced by DSM 29 savings unless explicitly stated otherwise. 30
The forecast DSM savings for 2021F are summarized in Table 3-1 below. The incremental 31 forecasts for 2020 and 2021 shown in Table 3-1 are the forecast saving incremental to the 32 savings embedded in the historical loads. Historical DSM savings can be found in Appendix A2. 33

FORTISBC INC. ANNUAL REVIEW FOR 2020 AND 2021 RATES
SECTION 3: LOAD FORECAST AND REVENUE AT EXISTING RATES PAGE 14
Table 3-1: Forecast Incremental 2020 and 2021 DSM Savings (GWh)6 1
2
3.4 LOAD FORECAST 3
FBC’s total load consists of the weather normalized7 residential, commercial and wholesale load 4 and the industrial, lighting and irrigation load. As shown in Figure 3-1 below, the total load, net 5 of losses, is projected to be 3,273 GWh in 2020, a decrease of 46 GWh from 2019 Approved, 6 and is forecast to be 3,355 GWh in 2021F, an increase of 82 GWh from 2020P. 7
6 Both 2020 and 2021 columns are as compared to the embedded 2019 actual savings. 7 Note that per the definition of the Projected Year in Section 3.2 above, January through June 2020 use actual
(non-normalized) values.
LineNo. Description 2020 2021
1 Residential (2) (7) 2 Commercial (7) (20) 3 Wholesale (2) (7) 4 Industrial (5) (15) 5 Lighting (0) (1) 6 Irrigation (0) (0) 7 Net Load (17) (50) 8 Losses (2) (4) 9 Gross Load (19) (54)

FORTISBC INC. ANNUAL REVIEW FOR 2020 AND 2021 RATES
SECTION 3: LOAD FORECAST AND REVENUE AT EXISTING RATES PAGE 15
Figure 3-1: Total Net Load (GWh) 1
2
Table 3-2 below shows the normalized after-savings gross load by customer class as well as 3 the system peak. For 2021F, the residential customer class is forecast to account for 34 percent 4 of the normalized after-savings gross load. 5
Table 3-2: Normalized After-Savings Gross Load and System Peak 6
7
The residential, commercial, wholesale, industrial, lighting and irrigation load forecasts are 8 provided separately in the following subsections. 9
LineNo. Description 2010 2011 2012 2013 2014 2015 2016 2017 2018 2019 2020P 2021F
Energy (GWh)1 Residential 1,242 1,249 1,229 1,353 1,296 1,298 1,296 1,320 1,313 1,266 1,289 1,252 2 Commercial 660 657 681 788 863 853 905 915 926 932 899 937 3 Wholesale 895 910 899 675 567 580 574 574 585 566 573 584 4 Industrial 234 271 291 352 381 380 373 363 403 495 464 537 5 Lighting 14 13 13 13 16 16 16 16 13 11 10 10 6 Irrigation 40 40 38 40 40 46 42 42 39 36 37 36 7 Net Load 3,085 3,140 3,151 3,222 3,163 3,174 3,206 3,230 3,278 3,306 3,273 3,355 8 Losses & Company Use 284 307 271 278 270 272 274 282 285 287 289 292 9 Gross Load 3,369 3,447 3,422 3,500 3,433 3,446 3,480 3,512 3,564 3,592 3,562 3,646
1011 System Peak (MW)12 Winter Peak 726 702 723 698 693 685 755 714 682 732 737 748
13 Summer Peak 566 537 589 600 620 611 593 605 631 639 609 627

FORTISBC INC. ANNUAL REVIEW FOR 2020 AND 2021 RATES
SECTION 3: LOAD FORECAST AND REVENUE AT EXISTING RATES PAGE 16
Residential 1
3.4.1.1 Residential Customers 2
Forecast residential customer counts are determined by a regression of the year-end customer 3 accounts against population in the FBC direct service area. The population forecast for the FBC 4 service area is provided by a BC Statistics report produced for FBC. 5
Figure 3-2 shows the year-end residential customer count for FBC. 6
Figure 3-2: Year-End Direct Residential Customer Count 7
8
3.4.1.2 Residential UPC 9
Normalized historical UPCs are obtained by dividing the weather-normalized residential load by 10 the average customer count in each year. The before-savings UPC is forecast by applying a 11 ten-year trend to the normalized historical UPCs. For 2020P, the first six months of the forecast 12 were replaced by actual values. The before-savings UPC forecast is then multiplied by the 13 forecast average customer count to derive the before-savings load forecast. DSM savings, 14 which are incremental to the savings embedded in the historical data to 2019, are then 15 deducted from the before-savings load forecast to determine the after-savings load forecast. 16 The after-savings UPC forecast is then calculated by dividing the after-savings load forecast by 17 the average customer count. As shown in Figure 3-3 below, the residential after-savings UPC is 18 projected to remain close to 2019 Actual levels in 2020P and is forecast to decrease by 0.39 19 MWh during 2021F. 20

FORTISBC INC. ANNUAL REVIEW FOR 2020 AND 2021 RATES
SECTION 3: LOAD FORECAST AND REVENUE AT EXISTING RATES PAGE 17
Figure 3-3: Normalized After-Savings Residential UPC (MWh) 1
2
3.4.1.3 Residential Load 3
Consistent with past practice, the total before-savings load for the residential class is the 4 product of the average annual residential customer count multiplied by the residential UPC. The 5 after-savings load is produced by taking the before-savings load and then subtracting DSM 6 savings. As shown in Figure 3-4 below, residential after-DSM savings load is forecast to 7 increase by 23 GWh in 2020P from 2019 Actual levels and decrease by 37 GWh in 2021F from 8 2020P levels. 9

FORTISBC INC. ANNUAL REVIEW FOR 2020 AND 2021 RATES
SECTION 3: LOAD FORECAST AND REVENUE AT EXISTING RATES PAGE 18
Figure 3-4: Normalized After-Savings Residential Load (GWh) 1
2
Commercial 3
3.4.2.1 Commercial Customers 4
The forecast commercial customer count is determined by a regression of the year-end 5 customer accounts on the provincial GDP forecast from the CBOC, which is included in 6 Appendix A1. 7
Figure 3-5 shows the year-end commercial customer count for FBC. 8

FORTISBC INC. ANNUAL REVIEW FOR 2020 AND 2021 RATES
SECTION 3: LOAD FORECAST AND REVENUE AT EXISTING RATES PAGE 19
Figure 3-5: Year-End Direct Commercial Customer Count 1
2
3.4.2.2 Commercial Load 3
The commercial class is forecast based on a regression of load on the provincial GDP forecast 4 obtained from the CBOC. As shown in Figure 3-6 below, Commercial after-savings load is 5 forecast to decrease by 33 GWh in 2020P from 2019 Actuals and increase by 38 GWh in 2021F 6 from 2020P. The 2020P and 2021F fluctuations are due to a GDP projection from the CBOC 7 that includes COVID-19 impacts and the projected economic recovery (-3.2 percent in 2020P 8 and 6.3 percent in 2021F). 9

FORTISBC INC. ANNUAL REVIEW FOR 2020 AND 2021 RATES
SECTION 3: LOAD FORECAST AND REVENUE AT EXISTING RATES PAGE 20
Figure 3-6: After-Savings Commercial Load (GWh) 1
2
Wholesale 3
FBC sells wholesale power to municipalities for service to certain customers within its service 4 territory that own and operate their own electrical distribution systems, and to BC Hydro. The 5 wholesale customers’ load composition is a combination of residential, commercial, industrial 6 and street lighting. 7
Consistent with past practice, the wholesale class is forecast using survey information from 8 each of the individual wholesale customers. FBC believes that the individual wholesale 9 customers are best able to forecast their future load growth. All of the wholesale customers 10 responded with their load forecast projections. As shown in Figure 3-7 below, after-savings 11 wholesale load is forecast to increase by 7 GWh in 2020P and 11 GWh in 2021F. 12

FORTISBC INC. ANNUAL REVIEW FOR 2020 AND 2021 RATES
SECTION 3: LOAD FORECAST AND REVENUE AT EXISTING RATES PAGE 21
Figure 3-7: Normalized After-Savings Wholesale Load (GWh) 1
2
Industrial 3
Consistent with past practice, the industrial forecast is determined through a combination of 4 customer load surveys and, when not available, escalation of the most recent annual loads by 5 the corresponding provincial GDP growth rates for individual industries. 6
FBC sends all existing industrial customers a load survey that requests the customer’s 7 anticipated use for the next 5 years. A survey is used because individual industrial customers 8 have the best understanding of what their future load will be. This year FBC received a 9 response from 80 percent (41 of 51) of the surveys sent out. The responding customers 10 represent approximately 92 percent of the total industrial load. 11
FBC forecasts industrial loads from new customers in 2020P and 2021F based on information 12 from Key Account Managers. 13
As shown in Figure 3-8 below, after-savings industrial load is forecast to decrease by 31 GWh in 14 2020P when compared to 2019 Actual. Industrial load is forecast to increase by 73 GWh in 15 2021F compared to 2020P. This increase is mostly due to the addition of new customers and 16 the expansions of existing customer loads in the FBC system. 17

FORTISBC INC. ANNUAL REVIEW FOR 2020 AND 2021 RATES
SECTION 3: LOAD FORECAST AND REVENUE AT EXISTING RATES PAGE 22
Figure 3-8: After-Savings Industrial Load (GWh) 1
2
Lighting 3
Due to the implementation of LED street lights, the lighting load has seen declines for the past 4 two years. FBC used the 2019 Actuals as the forecast for this load and then reduced it by DSM 5 savings. As shown in Figure 3-9 below, after-savings lighting load is forecast to decrease by 1 6 GWh in 2020P and then remain flat in 2021F. The lighting customer count forecast uses a five-7 year regression analysis. 8

FORTISBC INC. ANNUAL REVIEW FOR 2020 AND 2021 RATES
SECTION 3: LOAD FORECAST AND REVENUE AT EXISTING RATES PAGE 23
Figure 3-9: After-Savings Lighting Load (GWh) 1
2
Irrigation 3
Due to the variability in the load in the recent historical data, FBC has used the 2019 Actuals as 4 the forecast for the Irrigation load. As shown in Figure 3-10 below, after-savings irrigation load is 5 forecast to increase by 1 GWh in 2020P when compared to 2019 Actual as a result of higher 6 use in the first half of 2020 and then return to 2019 levels in 2021F. The increase in 2020P 7 compared to 2019 is due to the inclusion of 2020 January through June actual loads in the 8 2020P projection. 9

FORTISBC INC. ANNUAL REVIEW FOR 2020 AND 2021 RATES
SECTION 3: LOAD FORECAST AND REVENUE AT EXISTING RATES PAGE 24
Figure 3-10: After-Savings Irrigation Load (GWh) 1
2
Losses and Company Use 3
FBC conducted a Losses Study in 20198 and, consistent with that study, has assumed a loss 4 rate of 7.6 percent of gross load excluding company use. System losses consist of: 5
Losses in the transmission and distribution system; 6
Losses due to wheeling through the BC Hydro system; and 7
Unaccounted-for load (meter inaccuracies and theft). 8
9 As shown in Figure 3-11 below, after-savings load losses are forecast to increase by 2 GWh in 10 2020P and increase by 3 GWh in 2021F. FBC has separated company use in the graph below, 11 which is forecast at 13 GWh per year in each of 2020P and 2021F. 12
8 MRP Application, Exhibit B-1-1, Appendix B3.

FORTISBC INC. ANNUAL REVIEW FOR 2020 AND 2021 RATES
SECTION 3: LOAD FORECAST AND REVENUE AT EXISTING RATES PAGE 25
Figure 3-11: Normalized After-Savings Load Losses (GWh) 1
2
Peak Demand 3
The peak demand forecast is produced using the ten-year average of historical peaks. The 4 historical peak data is escalated by the gross load growth rate before it is averaged to account 5 for the growth of demand on the FBC system. 6
Normalized after-savings historical winter and summer peaks are shown below along with 7 2020P and 2021F. The peaks shown below are seasonal, where the winter peak can fall in 8 either November or December of the current year or January and February of the following year, 9 while the summer peak falls in June, July or August of the current year. 10

FORTISBC INC. ANNUAL REVIEW FOR 2020 AND 2021 RATES
SECTION 3: LOAD FORECAST AND REVENUE AT EXISTING RATES PAGE 26
Figure 3-12: After-Savings Winter Peaks (MW) 1
2
Figure 3-13: After-Savings Summer Peaks (MW) 3
4
3.5 CUSTOMER FORECAST 5
Table 3-3 shows the actual and forecast year-end customer count by rate class. The residential, 6 commercial, and lighting customer counts are forecast using the methods described in Sections 7 3.4.1, 3.4.2 and 3.4.5, respectively. Industrial customers are forecast based on information on 8

FORTISBC INC. ANNUAL REVIEW FOR 2020 AND 2021 RATES
SECTION 3: LOAD FORECAST AND REVENUE AT EXISTING RATES PAGE 27
expected new loads provided by key account managers. Wholesale and Irrigation customer 1 counts are assumed to remain at 2019 levels. 2
Overall, FBC is forecasting customer growth of 0.4 percent in 2020P compared to 2019 actual 3 customers and 1.5 percent in 2021F compared to 2020P. 4
Table 3-3: Year-End Direct Customer Count 5
6
3.6 REVENUE FORECAST 7
The forecast of revenues has been developed by applying approved 2020 rates to the forecast 8 billing determinants for each customer class. 9
Table 3-4 below summarizes the 2019 Approved, 2019 Actual, 2020 Projected and 2021 10 Forecast sales revenue. 11
Table 3-4: Forecast Sales Revenue at Approved Rates ($ millions) 12
13
3.7 SUMMARY 14
The normalized after-savings gross load forecast for 2020P is 3,562 GWh. Based on net load of 15 3,273 GWh at the approved 2019 rates, FBC’s 2020P revenue forecast is $358.668 million. 16 The normalized after-savings gross load forecast for 2021F is 3,646 GWh. Based on net load of 17 3,355 GWh at the approved interim 2020 rates, FBC’s 2021F revenue forecast is $369.643 18 million. 19
at 2020 Interim RateLine Approved Actual Projected ForecastNo. Description 2019 2019 2020 2021
1 Residential 187.887 $ 179.509 $ 178.565 $ 176.095 $ 2 Commercial 94.508 94.065 89.191 95.850 3 Wholesale 49.519 48.962 47.938 49.466 4 Industrial 32.414 39.756 37.589 42.905 5 Lighting 2.661 2.316 2.219 2.167 6 Irrigation 3.554 3.042 3.166 3.160 7 Total 370.543 $ 367.649 $ 358.668 $ 369.643 $
at 2019 Approved Rates

FORTISBC INC. ANNUAL REVIEW FOR 2020 AND 2021 RATES
SECTION 3: LOAD FORECAST AND REVENUE AT EXISTING RATES PAGE 28
When comparing the 2019 Approved forecast to the 2020P, there is a decrease in gross load of 1 40 GWh. The decrease in 2020P is due to decreased loads in the residential, commercial, 2 wholesale, irrigation and lighting classes. 3
When comparing the 2021F to the 2020P there is an increase in gross load of 84 GWh. The 4 increase in 2021F is due to increased loads in the industrial, commercial and wholesale classes. 5

FORTISBC INC. ANNUAL REVIEW FOR 2020 AND 2021 RATES
SECTION 4: POWER SUPPLY PAGE 29
4. POWER SUPPLY 1
4.1 INTRODUCTION AND OVERVIEW 2
This section includes a review of the 2020 Projected compared to 2019 Approved and 2021 3 Forecast compared to 2020 Projected power purchase expense (PPE), wheeling expense and 4 water fees. Collectively, the PPE, wheeling expense and water fees are referred to as the 5 Power Supply cost. 6
As shown in Table 4-1 below, the 2020 Projected Power Supply cost of $155.347 million 7 represents a $5.418 million or 3.4 percent decrease compared to the 2019 Approved cost of 8 $160.765 million. The decrease in the 2020 Projected Power Supply cost is attributed to 9 increased market savings as well as a decrease in gross load, both of which result in decreased 10 purchases under the Company’s power purchase agreement with BC Hydro. This decrease is 11 slightly offset by increased rates for Waneta Expansion supply. The 2020 Projected wheeling 12 expense is forecast to increase due to increased wheeling rates as well as increased use of the 13 Open Access Transmission Tariff (OATT) and Teck 71 Line (71L) wheeling. 2020 Projected 14 water fees have increased due to increased entitlement generation in 2019. 15
Also shown in Table 4-1, the 2021 Forecast Power Supply cost of $163.089 million represents 16 an increase of $7.742 million or 5.0 percent compared to the 2020 Projected cost of $155.347 17 million. The increase in the 2021 Forecast Power Supply cost is mainly due to a gross load 18 increase from 2020 Projected gross load, and therefore increased purchases under the 19 Company’s power purchase agreement with BC Hydro, as well as increased rates for BC Hydro 20 and Waneta Expansion supply. The 2021 Forecast wheeling expense is forecast to increase 21 due to increased wheeling rates. The 2021 Forecast water fees have increased due to 22 increased rates. 23
Any variances between forecast and actual Power Supply costs are recorded in the Flow-24 through deferral account and returned to or recovered from customers in the subsequent year. 25
Table 4-1: Power Supply Cost ($ millions) 26
27
4.2 SUMMARY OF POWER SUPPLY RESOURCES 28
FBC uses a combination of Company-owned generation entitlements, firm contracted supply 29 and market purchases to meet its load requirements. The Company’s firm resources consist of: 30
Line Approved Actual Projected Forecast No. Description 2019 2019 2020 2021
1 Power Purchase Expense 145.065 $ 139.002 $ 138.612 $ 146.260 $ 2 Wheeling Expense 5.235 5.896 5.767 5.783 3 Water Fees 10.465 10.396 10.968 11.045 4 Total Power Supply Cost 160.765 $ 155.294 $ 155.347 $ 163.089 $ 56 Gross Load (GWh) 3,602 3,618 3,562 3,646

FORTISBC INC. ANNUAL REVIEW FOR 2020 AND 2021 RATES
SECTION 4: POWER SUPPLY PAGE 30
Canal Plant Agreement (CPA) Entitlements associated with the generation facilities owned by 1 FBC. The costs associated with FBC-owned generation are not included in the power purchase 2 estimates, except for the Balancing Pool adjustments, which account for year to year timing 3 differences in the entitlement energy storage under the CPA; 4
The Brilliant Power Purchase Agreement (BPPA), a 125 MW contract (Order E-7-96), and an 5 amendment to the BPPA which reflects the purchase of 20 MW of Brilliant Upgrade power 6 (Letter L-57-00), and the 5 MW Brilliant Tailrace Capacity agreement (Order E-17-01); 7
A power purchase agreement (PPA) with BC Hydro (a 200 MW contract) under BC Hydro Rate 8 Schedule 3808 (Order G-60-14); 9
The Waneta Expansion Capacity Purchase Agreement (WAX CAPA), which is a 40-year 10 purchase agreement with the Waneta Expansion Limited Partnership for capacity entitlements 11 under the CPA (Orders E-29-10 and E-15-12); 12
A number of small Independent Power Producer (IPP) contracts; and 13
A number of market purchase arrangements. 14
4.3 PORTFOLIO OPTIMIZATION 15
The primary objectives of FBC’s power supply portfolio planning are to ensure that the 16 Company has sufficient firm resources to meet expected load requirements, to ensure the 17 availability of cost-effective reliable power for FBC’s customers, to prudently manage exposure 18 to the cost and availability of market power supplies, and to optimize the value of any surplus 19 resources that are not needed to meet load requirements. 20
The Company currently has long-term, firm resources from which it can supply substantially all 21 of its 2020 Projected and 2021 Forecast annual energy and capacity requirements. The nature 22 of FBC’s contracted resources, in particular the BC Hydro PPA, provides the Company some 23 flexibility to participate in the market when conditions are favourable to mitigate the cost of 24 holding those firm resources. Furthermore, although FBC’s load requirements are forecast to 25 grow over time, the amount of capacity provided under the WAX CAPA is currently greater than 26 FBC’s capacity requirements in most months, and FBC sells the surplus capacity to mitigate 27 power purchase expense. FBC has contracted to release a 50 MW block of capacity purchased 28 under the WAX CAPA to BC Hydro under the Residual Capacity Agreement (RCA), which was 29 approved by the BCUC in Order G-161-14. The remaining surplus WAX CAPA will be sold to 30 Powerex Corp. (Powerex) on a day-ahead basis, if and when it is not required to meet FBC 31 load requirements. These sales are completed under the Capacity and Energy Purchase and 32 Sale Agreement (CEPSA) with Powerex, accepted pursuant to Order E-10-15, and amended in 33 the First Amending Agreement dated April 20, 2019, accepted pursuant to Order E-19-19 dated 34 October 24, 2019. 35
FORTISBC INC. ANNUAL REVIEW FOR 2020 AND 2021 RATES
SECTION 4: POWER SUPPLY PAGE 31
4.4 FBC 2020/21 ANNUAL ELECTRIC CONTRACTING PLAN 1
On March 31, 2020, FBC filed its 2020/21 Annual Electric Contracting Plan (AECP) with the 2 BCUC. The purpose of the AECP is to outline FBC’s plan to meet its peak demand 3 requirements and annual energy requirements for the operating year commencing October 1, 4 2020 and ending September 30, 2021, and to facilitate FBC’s annual energy nomination under 5 the PPA. FBC is required to take or pay for 75 percent of the PPA Nomination, regardless of 6 whether it schedules the energy. The difference between the PPA Nomination and the 75 7 percent minimum take provides flexibility to manage annual loads that are below forecast or to 8 displace PPA purchases with lower cost market purchases. Therefore, real-time opportunities 9 to displace PPA purchases are restricted to a maximum of 25 percent of the PPA nominated 10 energy but depending on system conditions, could be more or less.9 The AECP also outlines 11 FBC’s load and resource balance over the following four years, and FBC’s plan for optimizing its 12 portfolio over that period. FBC’s forecast of PPE for the remainder of 2020 and for 2021 are 13 based on the plan detailed in the 2020/21 AECP, which was accepted by the BCUC on May 19, 14 2020, by way of Letter L-28-20.10 15
The AECP identified FBC’s intention to make its annual energy nomination under the PPA for 16 the 2020/21 contract year equal to 779 GWh, less any firm market contracts that FBC could 17 enter into, as described in section 5 of the 2020/21 AECP. 18
Before June 30, 2020, FBC entered into energy supply contracts (ESCs) with Powerex under 19 the terms of the CEPSA, which provide FBC with 71 GWh of incremental market energy during 20 the winter of 2020/21, and 168 GWh during the winter of 2021/22, all at a lower cost than if 21 supplied under the PPA. The ESCs were submitted for BCUC approval on August 10, 2020 22 pursuant to Section 71 of the UCA. The ESCs and associated savings are included in the 2021 23 Forecast PPE. As a result of these contracts, and changes to the forecast gross load, the 24 Company submitted a PPA nomination for the 2020/21 contract year of 674 GWh, as confirmed 25 in a letter to the BCUC on June 25, 2020. 26
4.5 2020 PROJECTED POWER PURCHASE EXPENSE 27
As shown in Table 4-2 below, FBC’s 2020 Projected gross load (after taking into account DSM 28 and other customer savings) is projected to be 40 GWh below the 2019 Approved value, and 29 2020 PPE is projected to be $6.453 million less than 2019 Approved. The reduction in 2020 30 Projected power purchase expense is attributed to decreased purchases from the BC Hydro 31 PPA due to decreased gross load and lower cost wholesale market purchases. 32
9 For example, if loads were 50 GWh lower in a year than forecast, that must be adjusted for as part of the 25
percent PPA flexibility such that the amount of PPA energy that can be displaced by market purchases is also reduced by 50 GWh.
10 The AECP was filed confidentially. The non-confidential Executive Summary is attached to Letter L-28-20.

FORTISBC INC. ANNUAL REVIEW FOR 2020 AND 2021 RATES
SECTION 4: POWER SUPPLY PAGE 32
Table 4-2: 2019 and 2020 Power Purchase Expense ($ millions) 1
2
4.6 2021 FORECAST POWER PURCHASE EXPENSE 3
As shown in Table 4-3 below, the 2021 Forecast PPE is approximately $7.648 million greater 4 than the 2020 Projected. The forecast increase from $138.612 million in 2020 to $146.260 5 million in 2021 is mainly a result of an increase in gross load and correspondingly, a greater 6 reliance on higher cost energy supplied by BC Hydro. Also contributing to the increase are 7 reduced surplus sale expectations along with escalations to BC Hydro and Waneta Expansion 8 contract rates. 9
Table 4-3 shows a comparison of the 2020 Projected and 2021 Forecast PPE. Reasons for 10 significant variances from the 2020 Projected PPE are discussed below. 11
Table 4-3: 2020 Projected and 2021 Forecast Power Purchase Expense ($ millions) 12
13
Line Approved Actual ProjectedNo. Description 2019 2019 2020 Difference
1 Brilliant 41.865 $ 41.848 $ 41.505 $ (0.360) $ 2 BC Hydro PPA 52.174 40.740 42.088 (10.085) 3 Waneta Expansion 40.221 38.763 40.250 0.030 4 Market and Contracted Purchases 10.637 17.168 14.617 3.980 5 Sale of Surplus Power - (0.577) - - 6 Independent Power Producers 0.076 0.063 0.062 (0.014) 7 Self-Generators 0.093 0.059 0.110 0.017 8 CPA Balancing Pool - 0.784 0.018 0.018 9 Special and Accounting Adjustments - 0.154 (0.039) (0.039)
10 Total 145.065 $ 139.002 $ 138.612 $ (6.453) $ 1112 Gross Load (GWh) 3,602 3,618 3,562 (40)
Line Projected ForecastNo. Description 2020 2021 Difference
1 Brilliant 41.505 $ 41.027 $ (0.478) $ 2 BC Hydro PPA 42.088 48.882 6.794 3 Waneta Expansion 40.250 41.462 1.212 4 Market and Contracted Purchases 14.617 14.751 0.134 5 Independent Power Producers 0.062 0.076 0.014 6 Self-Generators 0.110 0.061 (0.049) 7 CPA Balancing Pool 0.018 (0.000) (0.018) 8 Special and Accounting Adjustments (0.039) - 0.039 9 Total 138.612 $ 146.260 $ 7.648 $ 1011 Gross Load (GWh) 3,562 3,646 85

FORTISBC INC. ANNUAL REVIEW FOR 2020 AND 2021 RATES
SECTION 4: POWER SUPPLY PAGE 33
Brilliant 1 Brilliant expense is forecast to decrease in 2021 by $0.478 million compared to 2020 Projected 2 due to decreased rates, which are based on a forecast of the operating and maintenance cost of 3 the plant, as well as a true up to the prior year’s actual costs compared to forecast. 4
BC Hydro PPA 5 BC Hydro PPA expense is forecast to increase in 2021 by $6.794 million compared to the 2020 6 Projected expense. The two drivers of the increase are a forecast BC Hydro rate increase of 7 2.7 percent on April 1, 2021,11 which accounts for $1.030 million, and a higher purchased 8 volume (97 GWh), which increases the expense by $7.764 million, for a total of $8.794 million. 9 FBC has reduced its forecast of PPA expense by an additional $2.000 million in savings to 10 account for potential real-time opportunities to displace PPA purchases with lower cost market 11 purchases, resulting in a variance between 2020 Projected and 2021 Forecast of $6.794 million, 12 as shown in Table 4-3. Actual market savings for the remainder of 2020 and 2021 may be 13 higher or lower and will depend on system and market conditions at the time. Any variance, 14 including these savings, is recorded in the Flow-through deferral account and returned to or 15 recovered from customers in a subsequent year. 16
Waneta Expansion 17 The $1.212 million increase in Waneta Expansion expense forecast for 2021 is due to the 2.1 18 percent annual fixed escalation of WAX CAPA rates, as well as a $0.111 million decrease in 19 forecast surplus sales revenue under the RCA and CEPSA. Revenue under the CEPSA is 20 linked to the amount of capacity FBC releases to Powerex and to the day-ahead market prices 21 at the Mid-Columbia River (Mid-C) trading hub. The Mid-C is the largest electricity trading hub 22 in the Pacific Northwest and is located on the US portion of the Columbia River. FBC’s forecast 23 of Mid-C forward market prices is based on contracts that have been traded and/or bids and 24 offers from future contracts on the Intercontinental Exchange Inc. (ICE), which is a global 25 exchange, clearing, financial data and technology company. The method used to forecast 26 market prices is the same as in the Annual Review for 2019 Rates, but the method to calculate 27 surplus sales has changed. As a result of the First Amending Agreement to the CEPSA, the 28 price FBC is paid for capacity sales was modified and the forecasting method was updated 29 accordingly. Overall, the forecast of market prices has a relatively small effect on the overall 30 PPE. The forecast of surplus capacity sales revenue in 2021, which is included in line 3 of 31 Table 4-3, is approximately $8.960 million. 32
Market and Contracted Purchases 33 The $0.134 million increase in Market and Contracted Purchases forecast for 2021 is due to 34 increased rates for the volume purchased compared to 2020 Projected. Market and Contracted 35 Purchases for 2020 Projected include both fixed price contracted purchases and real-time 36 market purchases made using the 25 percent flexibility of the PPA. All of the market purchases 37 included in the 2021 Forecast are based on fixed price contracts executed by the Company. As 38
11 BC Hydro F2020-F2021 Revenue Requirements Application proceeding, Exhibit B-45-20, February 25, 2019.

FORTISBC INC. ANNUAL REVIEW FOR 2020 AND 2021 RATES
SECTION 4: POWER SUPPLY PAGE 34
discussed above in the BC Hydro PPA variance explanation, there may be opportunities for 1 additional real-time market purchases using the flexibility of the PPA purchases. 2
4.7 WHEELING EXPENSE 3
Wheeling expense includes wheeling service provided by BC Hydro under the Amended and 4 Restated Wheeling Agreement (ARWA) and OATT as needed to supply the Company’s loads in 5 the Okanagan, Creston and Princeton. Also included are charges paid to Teck Metals Ltd. 6 (Teck) for the use of its 71 Line. Rates under the ARWA are specified in BC Hydro’s Rate 7 Schedule 3817. 8
Wheeling expense is forecast using the same method as in the Annual Review for 2019 Rates. 9 Table 4-4 below shows FBC’s Wheeling Expense for 2019 to 2021. ARWA costs account for 10 the majority of FBC’s wheeling expense for 2019 through 2021, with OATT and Teck 71L 11 wheeling costs falling into the Other category. 12
Table 4-4: Wheeling Expense ($ millions) 13
14
Total 2020 Projected wheeling expense is $0.532 million greater than 2019 Approved. The 2020 15 Projected ARWA costs are $5.184 million, a $0.093 million increase when compared to 2019 16 Approved, which is a result of higher rates. 2020 Projected Teck and OATT wheeling costs are 17 $0.583 million, which is $0.439 greater than 2019 Approved. This is mainly due to increased 18 use of both Teck and OATT wheeling. 19
2021 wheeling expense is forecast to increase by $0.016 million over 2020 Projected. This is a 20 result of increased ARWA rates on October 1 of both 2020 and 2021, which are based on 21 forecast BC-CPI, as well as increases to the Teck wheeling rate as a result of a letter 22 agreement made between Teck and FBC. 23
4.8 TRANSMISSION SERVICE LOSS RECOVERIES 24
Transmission service customers taking service under FBC’s Rate Schedules 100 and 101 25 currently physically deliver energy to FBC to compensate for the losses that are incurred on 26 FBC’s system as a result of wheeled energy. FBC includes transmission wheeling losses in its 27 load forecast and also includes loss recovery as a firm resource. Because the recoveries are 28
Line Approved Actual Projected ForecastNo. Description 2019 2019 2020 2021
1 Wheeling Nomination (MW Months)2 Okanagan Point of Interconnection 2,400 2,400 2,400 2,400 3 Creston 471 471 438 420 45 Wheeling Expense6 Okanagan Point of Interconnection 4.514 $ 4.524 $ 4.633 $ 4.694 $ 7 Creston 0.577 0.603 0.551 0.535 8 Other 0.144 0.769 0.583 0.555 9 Total Wheeling Expense 5.235 $ 5.896 $ 5.767 $ 5.783 $
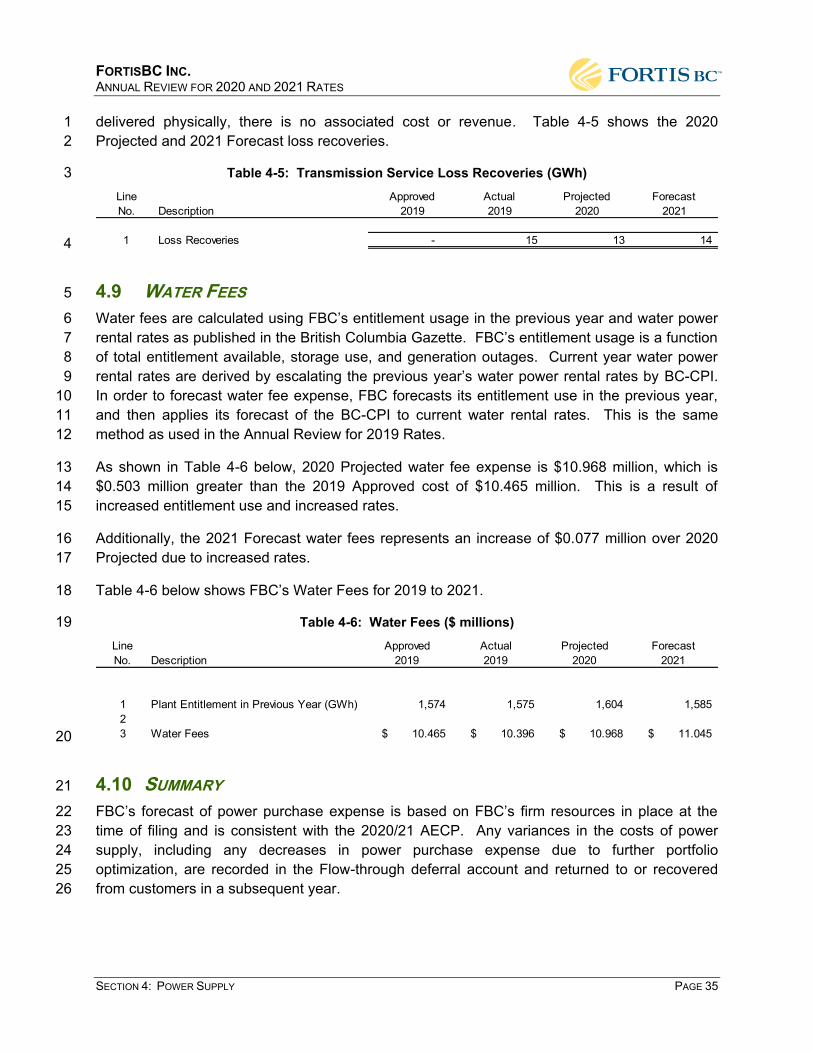
FORTISBC INC. ANNUAL REVIEW FOR 2020 AND 2021 RATES
SECTION 4: POWER SUPPLY PAGE 35
delivered physically, there is no associated cost or revenue. Table 4-5 shows the 2020 1 Projected and 2021 Forecast loss recoveries. 2
Table 4-5: Transmission Service Loss Recoveries (GWh) 3
4
4.9 WATER FEES 5
Water fees are calculated using FBC’s entitlement usage in the previous year and water power 6 rental rates as published in the British Columbia Gazette. FBC’s entitlement usage is a function 7 of total entitlement available, storage use, and generation outages. Current year water power 8 rental rates are derived by escalating the previous year’s water power rental rates by BC-CPI. 9 In order to forecast water fee expense, FBC forecasts its entitlement use in the previous year, 10 and then applies its forecast of the BC-CPI to current water rental rates. This is the same 11 method as used in the Annual Review for 2019 Rates. 12
As shown in Table 4-6 below, 2020 Projected water fee expense is $10.968 million, which is 13 $0.503 million greater than the 2019 Approved cost of $10.465 million. This is a result of 14 increased entitlement use and increased rates. 15
Additionally, the 2021 Forecast water fees represents an increase of $0.077 million over 2020 16 Projected due to increased rates. 17
Table 4-6 below shows FBC’s Water Fees for 2019 to 2021. 18
Table 4-6: Water Fees ($ millions) 19
20
4.10 SUMMARY 21
FBC’s forecast of power purchase expense is based on FBC’s firm resources in place at the 22 time of filing and is consistent with the 2020/21 AECP. Any variances in the costs of power 23 supply, including any decreases in power purchase expense due to further portfolio 24 optimization, are recorded in the Flow-through deferral account and returned to or recovered 25 from customers in a subsequent year. 26
Line Approved Actual Projected ForecastNo. Description 2019 2019 2020 2021
1 Loss Recoveries - 15 13 14
Line Approved Actual Projected ForecastNo. Description 2019 2019 2020 2021
1 Plant Entitlement in Previous Year (GWh) 1,574 1,575 1,604 1,585 23 Water Fees 10.465 $ 10.396 $ 10.968 $ 11.045 $

FORTISBC INC. ANNUAL REVIEW FOR 2020 AND 2021 RATES
SECTION 5: OTHER REVENUE PAGE 36
5. OTHER REVENUE 1
5.1 INTRODUCTION AND OVERVIEW 2
This section discusses FBC’s forecasts of Other Revenue. In the MRP Decision (page 74), FBC 3 was approved for variances between forecast and actual Other Revenue to be subject to 4 earnings sharing. 5
FBC is projecting Other Revenue for 2020 to be $1.377 million higher than the amount 6 approved for 2019. The main drivers of this increase are higher Apparatus and Facilities Rental 7 due to a new pole attachment contract, and higher Contract Revenue due to a three-year asset 8 refurbishment project for a third party. These increases are partially offset by lower Late 9 Payment Charges as a result of customer relief measures implemented by FBC during the 10 COVID-19 pandemic. 11
Other Revenue for 2021 is forecast to be $1.576 million higher than 2020 Projected due to 12 higher Contract Revenue resulting from the timing of work expected to be performed on the 13 asset refurbishment project for a third party, as well as a return to normal forecast of Late 14 Payment Charges. 15
Table 5-1: Other Revenue ($ millions) 16
17
18 In the following sections, FBC summarizes its projections and forecasts for each of the line 19 items included in the table above. 20
5.2 APPARATUS AND FACILITIES RENTAL 21
Apparatus and Facilities Rental is comprised primarily of pole contact revenue from other 22 utilities and businesses that attach their facilities to FBC infrastructure in order to deliver 23 services to their customers, such as telephone and cable television providers. Rent is charged 24 at a unit rate per pole contact multiplied by the number of poles that are contacted. The 2020 25 Projected is higher than 2019 Approved due to a new pole attachment contract as well as 26
Line Approved Actual Projected ForecastNo. Description 2019 2019 2020 2021
1 Apparatus and Facilities Rental 4.878$ 5.915$ 5.843$ 5.930$ 2 Contract Revenue 1.766 2.076 2.305 3.088 3 Transmission Access Revenue 1.230 1.054 1.496 1.501 4 Interest Income 0.016 0.005 0.020 0.020 5 Late Payment Charges 0.861 0.929 0.205 0.829 6 Connection Charges 0.376 0.524 0.394 0.476 7 Other Recoveries 0.142 0.124 0.382 0.377 8 Total 9.268$ 10.627$ 10.645$ 12.221$

FORTISBC INC. ANNUAL REVIEW FOR 2020 AND 2021 RATES
SECTION 5: OTHER REVENUE PAGE 37
escalations in unit rental rates for continuing contracts. The 2021 Forecast is higher than 2020 1 Projected due to escalations in unit rental rates. 2
5.3 CONTRACT REVENUE 3
FBC performs work under contract to third parties at the Waneta and Brilliant hydroelectric 4 generating facilities. This third party work, and the associated management fees earned, 5 fluctuate from year to year based on customer requirements, which include routine and non-6 routine work planned at the start of the customer’s fiscal year. 7
The Company also operates and maintains a number of other facilities for third party entities 8 through its non-regulated affiliate FortisBC Pacific Holdings Inc. (FPHI). Transactions between 9 FBC and FPHI are conducted in accordance with FBC’s Code of Conduct and Transfer Pricing 10 Policy12 and earn a transfer price profit revenue. Revenues may fluctuate from year to year 11 depending on customer requirements. 12
The 2020 Projected and 2021 Forecast are expected to be higher than 2019 Approved due to 13 revenues received from a three-year asset refurbishment project for a third party that is 14 beginning in 2020, based on customer requirements. 15
5.4 TRANSMISSION ACCESS REVENUE 16
Transmission Access Revenue represents charges to customers for transmitting power over the 17 FBC system. 2020 Projected and 2021 Forecast revenues are higher than 2019 Approved due 18 to the phased increase in rates beginning January 1, 2020, as approved by Order G-40-19. 19
5.5 INTEREST INCOME 20
Interest Income is primarily comprised of DSM loan interest income, as well as other banking 21 interest income. The Company is not forecasting significant changes in the amount of DSM 22 loans. As a result, no significant changes in Interest Income are expected in 2020 Projected or 23 in the 2021 Forecast. 24
5.6 LATE PAYMENT CHARGES 25
FBC implemented a number of customer relief measures in 2020 due to the COVID-19 26 pandemic, including the suspension of Late Payment Charges. As a result, 2020 Projected Late 27 Payment Charges are expected to be lower than 2019 Approved. In 2021, FBC expects the 28 amount of Late Payment Charges to return to a more normal level. 29
12 As approved by Order G-5-10A.

FORTISBC INC. ANNUAL REVIEW FOR 2020 AND 2021 RATES
SECTION 5: OTHER REVENUE PAGE 38
The 2021 Forecast for Late Payment Charges as part of Other Revenue is based on the 2017 to 1 2019 average of Late Payment Charges earned, while the calculation for 2020 Projected 2 includes six months of actual results. 3
5.7 CONNECTION CHARGES 4
Connection Charges are calculated based on the fees specified in FBC’s rate schedules 5 applicable to new customer connections or current customer reconnections. The 2020 6 Projected and 2021 Forecast are expected to be higher than 2019 Approved due to customer 7 growth and forecast customer reconnections. 8
5.8 OTHER RECOVERIES 9
Other Recoveries are primarily comprised of fees earned on the recovery of costs for 10 miscellaneous services, such as street light maintenance charged to municipalities and, 11 beginning in 2020, AMI radio-off meter read fees.13 The 2020 Projected and 2021 Forecast are 12 expected to be higher than 2019 Approved due to the inclusion of AMI radio-off meter read fees. 13
5.9 SUMMARY 14
FBC has forecast the Other Revenue components for 2020 and 2021 reflecting all applicable 15 contracts and fixed revenues, and based on the Company’s best knowledge of the factors that 16 drive the variable components. Variances in Other Revenue affect ROE and are shared with 17 customers through the earnings sharing mechanism. 18
13 As approved by Order G-40-19.

FORTISBC INC. ANNUAL REVIEW FOR 2020 AND 2021 RATES
SECTION 6: O&M EXPENSE PAGE 39
6. O&M EXPENSE 1
6.1 INTRODUCTION AND OVERVIEW 2
Under the MRP, FBC’s O&M expense is primarily determined by formula, with the addition of a 3 number of items that are forecast outside the formula on an annual basis. 4
In the MRP Decision and Order G-166-20, the BCUC approved a Base 2019 O&M for FBC 5 based on the adjusted actual 2018 O&M plus incremental O&M funding in certain areas.14 As 6 provided in the compliance filing to the MRP Decision, the resulting 2019 Base O&M for FBC is 7 $57.630 million, which, divided by the 2019 Actual Average Customer count, results in a 2019 8 Base O&M per customer of $412.15 9
In 2020, the Formula O&M is $59.447 million, representing a 6.0 percent increase from the 2019 10 Formula O&M approved under the 2014-2019 PBR Plan and a 3.2 percent increase from the 11 2019 Base O&M. The increase of 6.0 percent is primarily the result of re-setting the Base O&M 12 as part of the approved MRP as well as an increase resulting from the formula drivers. The 13 increase of 3.2 percent from the 2019 Base O&M is entirely due to the formula drivers. For 14 2021, the Formula O&M is $62.073 million, representing a 4.4 percent increase from the 2020 15 Formula O&M, entirely due to the formula drivers. 16
O&M expenses forecast outside the formula for 2020 and 2021 are $2.448 million and $3.041 17 million, respectively. 18
Overall, there is an increase in Gross O&M Expense from 2019 Approved to 2020 Projected of 19 4.6 percent and an increase in Gross O&M Expense from 2020 Projected to 2021 Forecast of 20 5.2 percent. 21
The components of 2020 and 2021 O&M expense are shown in Table 6-1 below. 22
Table 6-1: O&M Expense 23
24
In the sections below, FBC provides further details on its formula and forecast O&M expenses 25 for 2020 and 2021. Additionally, in compliance with the BCUC’s directive in the MRP 26 Decision,16 FBC provides information related to its System Operations, Integrity and Security 27 expenditures in Subsection 6.2.1. 28
14 MRP Decision, pp. 107-118. 15 MRP Decision Compliance Filing, p. 6. 16 MRP Decision, p. 118.
Line Approved Actual Projected ForecastNo. Description 2019 2019 2020 2021 Reference
1 Formula O&M 56.081 $ 55.516 $ 59.447 $ 62.073 $ Section 11, Schedule 20, Line 8/Line 102 Forecast O&M 3.120 3.003 2.448 3.041 Section 11, Schedule 20, Line 15/Line 163 Total Gross O&M 59.201 58.519 61.895 65.114 Line 1 + Line 24 Capitalized Overhead (15%) (8.880) (8.880) (9.284) (9.767) Section 11, Schedule 20, Line 19/Line 205 Net O&M 50.321 $ 49.638 $ 52.611 $ 55.347 $ Line 3 + Line 4

FORTISBC INC. ANNUAL REVIEW FOR 2020 AND 2021 RATES
SECTION 6: O&M EXPENSE PAGE 40
6.2 FORMULA O&M EXPENSE 1
Base O&M starts from the prior year’s Approved Base O&M per Customer (UCOM), escalated 2 by the prior year’s inflation less a productivity improvement factor of 0.5 percent, and 75 percent 3 of the forecast growth in average customers. As calculated in Section 2, the 2020 and 2021 4 inflation based on prior year’s BC-CPI and BC-AWE, less the productivity improvement factor, is 5 2.309 percent in 2020 and 3.793 percent in 2021. 6
For 2020, the annual operating and maintenance expense under the formula is calculated as: 7
2019 Approved Base UCOM x [1 + (I Factor – X Factor)] x [Prior Year Average 8 Customers + (0.75 x growth in average customers)] 9
For 2021, the annual operating and maintenance expense under the formula is calculated as: 10
2020 Approved formula UCOM x [1 + (I Factor – X Factor)] x [Prior Year Average 11 Customers + (0.75 x growth in average customers)] 12
FBC considers the impacts of capital expenditures on O&M expense and estimates O&M 13 impacts explicitly for Major Projects.17 In its application for a CPCN for the Grand Forks 14 Terminal Station (GFT) Reliability Project, FBC identified net O&M savings of $0.085 million 15 ($2018) arising from the retirement of approximately 44.6 kilometres of transmission line 16 beginning in 2021. Accordingly, FBC has reduced its Base O&M in 2021 by the equivalent per 17 customer amount.18 18
Table 6-2 below shows the calculation of the 2020 and 2021 Formula O&M. 19
Table 6-2: Calculation of 2020 and 2021 Formula O&M ($ thousands) 20
21
New/Incremental System Operations, Integrity and Security Funding 22
In the MRP Decision (page 118), the BCUC directed FBC to provide in each Annual Review a 23 breakdown and explanation of both annual and cumulative variances between forecast/actual 24 17 MRP Application, Exhibit B-9, response to MoveUP IR1 10.1. 18 FBC calculated the 2021 per customer savings in the same manner as the Base O&M per customer cost. The
$2018 value was escalated in accordance with the PBR escalation factor for 2019 and dividing by the average 2019 customer count ($85 thousand × 102.382% ÷ 139,916 = $0.62). The 2019 per customer cost was escalated using the net inflation factors for 2020 ($0.62 × 102.309% = $0.64). This value is subtracted from the 2020 Base O&M per customer prior to applying the customer growth factor for 2021.
Line Projected ForecastNo. Description 2020 2021 Reference
1 Prior Year Base Unit Cost O&M ($/ customer) 412$ 422$ G-166-20FBC MRP Decision2 GFT Reliability Project O&M Reduction - (0.64) 3 Adjusted Base Unit Cost O&M 412$ 421$ Line 1 + Line 24 I-Factor 2.309% 3.793% Section 2, Table 2-3, Line 115 Current Year Unit Cost O&M ($/customer) 422$ 437$ Line 3 x (1 + Line 4)6 Average Customer Forecast 140,871 142,045 Section 2, Table 2-3, Line 137 Inflation-Indexed O&M 59,447$ 62,073$ Line 5 x Line 6 ÷ 1000

FORTISBC INC. ANNUAL REVIEW FOR 2020 AND 2021 RATES
SECTION 6: O&M EXPENSE PAGE 41
and formula O&M related to the approved new/incremental System Operations, Integrity and 1 Security funding, and quantify the variances attributable to the following areas: tree 2 management; generation dam safety; network operations apprentice program; cyber security; 3 data analytics; and any other significant factors or miscellaneous items. 4
The table below shows the requested information, including the new/incremental funding in 5 each category in 2019 dollars, escalated by the annual formula factors to arrive at the Formula 6 O&M amounts, and the forecast amounts for 2020. 7
Table 6-3: System Operations, Integrity and Security New/Incremental Spending 8
9
At the time of preparing this Application, FBC has critical initiatives underway and is in the 10 process of finalizing its plans to implement further activities. As shown in the table above, FBC 11 is forecasting to spend all of the incremental funding approved. For 2020, given that the MRP 12 Decision was issued part way through the year, there will likely be a variance between the 13 actual expenditures in 2020 and the amounts calculated using the formula escalators. Over the 14 term of the MRP, FBC anticipates that the total new/incremental spending in the combined 15 categories of System Operations, Integrity and Security required will be relatively close to the 16 cumulative approved formula amounts, although there will continue to be variations from year to 17 year. 18
In the MRP Decision, the BCUC also directed FBC to describe how it is prioritizing its 19 new/incremental funding approved for System Operations, Integrity and Security. 20
The categories of the new/incremental System Operations, Integrity and Security funding, as 21 shown in Table 6-3 above, were developed based on the anticipated requirements over the term 22 of the MRP, recognizing that priorities may change and that the expenditures may vary from 23 year to year depending upon factors such as the availability of resources (i.e., labour vacancies) 24 and the timing of activities. The common theme underlying the need for the new/incremental 25 funding is to support the safe and reliable delivery of energy to customers. In prioritizing the 26 new/incremental funding, FBC will consider factors such as regulation changes, code 27
System Operations, Integrity and Security2020 Formula
O&M1
Forecast 2020
O&M
2020
Forecast/Actual
Variance
Cumulative
Forecast/Actual
Variance2
Tree Management 0.075$ 0.077$ 0.077$ -$ -$
Generation Dam Safety 0.232$ 0.237$ 0.237$ -$ -$
Network Operations Apprentice Program 0.197$ 0.202$ 0.202$ -$ -$
Cyber Security 0.080$ 0.082$ 0.082$ -$ -$
Data Analytics 0.099$ 0.101$ 0.101$ -$ -$
Other -$ -$ -$ -$ -$
Total 0.683$ 0.699$ 0.699$ -$ -$
Notes:
(1) 2020 Formula O&M is the incremental funding with Net Inflatiion factor applied (2.309%)
(2) Cumulative Forecast/Actual variance is the same as the 2020 (first year of MRP) Forecast/Actual variance.
$ millions

FORTISBC INC. ANNUAL REVIEW FOR 2020 AND 2021 RATES
SECTION 6: O&M EXPENSE PAGE 42
requirements, safety and security requirements, and customer requirements which may create a 1 higher priority and urgency for certain expenditures compared to other expenditures. Similar to 2 what other organizations may do, funds are reprioritized as required depending on the business 3 environment, conditions, and requirements the Company is facing. In prioritizing 4 new/incremental spending, the safety and reliability of the system will be paramount. 5
6.3 O&M EXPENSE FORECAST OUTSIDE THE FORMULA 6
In addition to FBC’s Formula O&M, FBC forecasts a number of O&M items outside of the 7 formula annually, including pension and OPEB expense, insurance premiums, BCUC levies, 8 and the cost of service associated with Clean Growth Initiatives, such as Electric Vehicle (EV) 9 charging stations, as well as the O&M impacts of any exogenous factor items. FBC has also 10 included in 2020 a reduction to O&M due to the foregone annual inspection of the fourth Upper 11 Bonnington generating unit undergoing refurbishment. The 2020 and 2021 amounts are shown 12 in Table 6-4 below along with a comparison to 2019. 13
Table 6-4: Forecast O&M ($ millions) 14
15
Each of the items that is forecast outside of the formula is discussed below. Variances in 16 pension and OPEB expenses are captured in the Pension and OPEB Variance deferral account 17 and variances in BCUC levies are captured in the BCUC Levies Variance deferral account. 18 Variances in insurance premiums, the cost of service associated with EV charging stations, and 19 the O&M portion of exogenous factors are captured in the Flow-through deferral account. 20
Pension and OPEB Expense 21
Pension and OPEB expense for 2020 is based upon actuarial estimates using a range of 22 assumptions as at December 31, 2019 provided by the Company’s external third party actuary, 23 Willis Towers Watson. The pension and OPEB expense for 2021 is similarly based on actuarial 24 assumptions determined at December 31, 2019 but has been further updated to reflect the 25 volatility in the assumptions around expected return on assets and discount rates that has 26 occurred during the first half of 2020, in part due to the COVID-19 pandemic. Pension and 27 OPEB expense is segregated into O&M and capital categories, as shown in Table 6-5. 28
Line Approved Actual Projected ForecastNo. Description 2019 2019 2020 2021
1 Pension/OPEB (O&M Portion) 1.692 $ 1.692 $ 0.470 $ 0.775 $ 2 Insurance Premiums 1.283 1.381 1.691 1.916 3 BCUC Levies - - 0.330 0.350 4 Upper Bonnington Old Unit Inspections (0.042) (0.042) (0.043) - 5 Clean Growth Initiative - EV Charging Stations - - - - 6 Included in 2020 Formula O&M1 0.187 (0.028) - - 7 Forecast O&M 3.120 $ 3.003 $ 2.448 $ 3.041 $ 89 1AMI net savings, MRS incremental O&M, Employer Health Tax, MSP Premium Elimination

FORTISBC INC. ANNUAL REVIEW FOR 2020 AND 2021 RATES
SECTION 6: O&M EXPENSE PAGE 43
Table 6-5: Pension and OPEB Expense ($ millions) 1
2
Notes: 3
1 This line item represents the pension and OPEB expense difference between the estimates embedded in the 4 Capital forecasts on Line 2 in this table, which were based on the pension and OPEB actuarial estimates 5 provided in 2019, and the actuarial estimates updated for 2020 and 2021 rate setting purposes. 6
2019 Actual pension and OPEB expense equals the 2019 Approved expense as any variances 7 from the approved amount for setting 2019 rates are flowed through to the Pension and OPEB 8 Variance deferral account and amortized into rates over a three-year period, as approved by 9 Order G-139-14.19 10
Projected 2020 pension and OPEB expense has decreased by $0.780 million compared to the 11 2019 Approved expense primarily due to the following factors: 12
A $1.2 million reduction due to the full elimination of the Medical Services Premium 13 (MSP) in 2020 as compared to 50 percent MSP in place for 2019; 14
A $1.6 million reduction in net benefit cost in 2020 and beyond as a result of a pension 15 plan amendment that occurred in 2019; and 16
A $0.5 million reduction in the annual amortization associated with the 2005 CICA OPEB 17 regulatory asset, as established pursuant to Order G-110-12, which was fully amortized 18 as at the end of 2019; 19
offset in part by: 20
An approximately $2.5 million increase in amortization of actuarial losses and increases 21 in current service costs and interest costs due to a decline in discount rates. The 22 discount rates, which are determined with reference to the market rate of interest on high 23 quality debt instruments at a point in time, decreased from 3.5 percent, which was used 24 to determine 2019 Approved expense, to 3.0 percent, which is used to determine the 25 2020 Projected expense. 26
27 The 2021 total pension and OPEB expense is forecast to be $1.280 million higher than the 2020 28 Projected expense primarily due to two factors. First, there is a forecast further decline in 29
19 Total pension and OPEB expense for 2019 was $4.292 million; therefore, a credit of $1.012 million was recorded
in the deferral account in 2019.
Line Approved Actual Projected ForecastNo. Description 2019 2019 2020 2021
1 O&M 1.692 $ 1.692 $ 0.470 $ 0.775 $ 2 Capital (Approved) 3.612 3.612 3.807 3.575 3 Capital (to Pension & OPEB Variance Deferral)1 - - 0.247 1.454 4 Total 5.304 $ 5.304 $ 4.524 $ 5.804 $

FORTISBC INC. ANNUAL REVIEW FOR 2020 AND 2021 RATES
SECTION 6: O&M EXPENSE PAGE 44
discount rates in mid-2020 due to the volatility in capital debt markets. Second, while there has 1 been a recovery in the value of pension plan assets since the beginning of the pandemic in 2 2020, it is still expected that the estimated annual asset return for 2020 will remain lower than 3 expected and this expectation has been incorporated into the determination of the 2021 pension 4 and OPEB expense. 5
With respect to the discount rates used in determining pension expense, due to the timing of 6 filing this Application, the rates have been impacted by the financial market impacts of COVID-7 19. FBC will monitor the rates for the remainder of the year, and file an Evidentiary Update to 8 reflect any significant changes. 9
Insurance Premiums 10
The component of insurance expense tracked outside of Formula O&M relates to the insurance 11 premium expense allocated to FBC by Fortis Inc. as set out in Table 6-6 below. 12
Table 6-6: Insurance Premiums ($ millions) 13
14
The projected insurance premium expense for 2020 of $1.691 million, which incorporates FBC’s 15 July 2020 insurance renewals, is an increase of $0.408 million from what was approved for 16 2019. The higher premiums experienced in 2020 are expected to continue into 2021. The 17 forecast insurance premium expense for 2021 is $1.916 million, an increase of $0.225 million 18 from 2020. The forecast for 2021 is calculated as the amount of the first six months of the 19 known annual insurance premium for July 2020 to June 2021 of $1.734 million and applying a 5 20 percent increase for the remaining six months, as well as including the annual cost of fire 21 fighting premium of $138,500.20 FBC has experienced significant increases in insurance 22 expense in the last two renewals as a result of various insurers reducing their capacity and 23 increasing restrictions and retentions. 24
BCUC Levies 25
FBC’s forecast for BCUC levies for 2020 and 2021 is based on two components: (i) the BCUC 26 levy; and (ii) FBC’s portion of funding for the BCUC hearing room facilities.21 27
The 2020 Projected BCUC levies for FBC is $0.330 million and includes the following: 28
20 $1.734 million/2 = $0.867 million. $0.867 million x 1.05 = $0.910 million. $0.867 million + $0.910 million + $0.139
million annual firefighting premium = $1.916 million. 21 Located at 12th floor, 1125 Howe Street, Vancouver, BC and managed/operated by Allwest Reporting Ltd.
Line Approved Actual Projected ForecastNo. Description 2019 2019 2020 2021
1 Insurance Premiums 1.283 $ 1.381 $ 1.691 $ 1.916 $ 2 Total 1.283 $ 1.381 $ 1.691 $ 1.916 $

FORTISBC INC. ANNUAL REVIEW FOR 2020 AND 2021 RATES
SECTION 6: O&M EXPENSE PAGE 45
The projected BCUC levy of $0.293 million. This amount is comprised of the levy amount 1 from Order G-138-19A1 for the BCUC’s Fiscal 2019/20 year which is applied to FBC’s 2 first fiscal quarter of 2020 (January to March),22 and the levy amount from Order G-134-3 20 for the BCUC’s Fiscal 2020/21 year which is applied to FBC’s remaining three 4 quarters of 2020 (April to December); and 5
An estimate of $0.037 million for FBC’s portion of the funding for the BCUC hearing 6 room facilities. 7
The 2021 Forecast BCUC levies for FBC is $0.350 million and includes the following: 8
The forecast BCUC levy of $0.313 million based on Order G-134-20 for the BCUC’s 9 Fiscal 2020/21 year because this is the best information available at this time. FBC 10 notes that the BCUC levy calculation for Fiscal 2021/22 will not be available until early in 11 2021; and 12
An estimate of $0.037 million for FBC’s portion of the funding for the BCUC hearing 13 room facilities. 14
15 The MRP Decision approved flow-through treatment for BCUC levies with annual variances 16 between forecast and actual amounts in O&M expense being recorded in the BCUC Levies 17 Forecast Variance deferral account and amortized over one year. 18
Annual Inspection Costs for Upper Bonnington Old Units 19
The Upper Bonnington Old (UBO) Units Refurbishment project commenced in 2017. 20 Refurbishment of UBO Units 3, 4, and 1 have been completed in previous years, and Unit 2 is 21 being completed in 2020. The Company has not carried out annual inspections on the units 22 while out of service for refurbishment, and FBC has reduced its O&M expenditures accordingly. 23
The O&M reduction related to the annual unit inspections is a one-time reduction to O&M 24 expense in the year that a unit is refurbished. Each unit will once again undergo annual 25 inspections following refurbishment. Therefore, the level of Base O&M expenditures is not 26 impacted on an ongoing basis. For this reason, the O&M reduction is outside of Formula O&M. 27 Because these are avoided costs, there will not be a future true-up of this value. 28
The cost reductions are based on the estimated cost in 2017 of $0.040 million, escalated in 29 accordance with the PBR and MRP formula drivers. As the final unit will be completed in 2020, 30 annual inspections of all units will take place in 2021, with no further reductions to O&M 31 expense. 32
22 Which is the BCUC’s Fiscal 2019/20 fourth quarter.
FORTISBC INC. ANNUAL REVIEW FOR 2020 AND 2021 RATES
SECTION 6: O&M EXPENSE PAGE 46
Clean Growth Initiative – Electric Vehicle (EV) Charging Stations 1
The cost of service associated with EV charging stations is subject to flow-through treatment, 2 contingent upon approval by the BCUC for inclusion of EV charging stations in rate base.23 3 FBC’s application for rates for EV charging stations was adjourned in 2018; however, on July 4 10, 2020 the BCUC issued Order G-183-20 re-starting the review process. Following BCUC 5 approval, FBC will forecast the associated cost of service annually. At this time, FBC has not 6 forecast any amounts for O&M or other cost of service items related to EVs, but will capture any 7 amounts that are approved in the Flow-through deferral account and recover them from or 8 return them to customers in future rates. 9
6.4 NET O&M EXPENSE 10
Net O&M expense is Gross O&M less capitalized overhead. As approved by the BCUC in 11 Order G-166-20, the capitalized overhead rate is set at 15 percent for FBC, unchanged from 12 2019. After capitalized overhead, the net O&M expense is $52.611 million and $55.347 million 13 in 2020 and 2021, respectively. 14
6.5 SUMMARY 15
Overall, the increase in Gross O&M Expense from 2019 Approved to 2020 Projected is 4.6 16 percent. The formula-driven O&M is increasing at a rate of 6.0 percent, and O&M forecast 17 outside the formula is 21.5 percent lower than 2019 Approved. 18
For 2021, Gross O&M Expense is forecast to increase by 5.2 percent from 2020 Projected. 19 Formula-driven O&M is increasing at a rate of 4.4 percent, and O&M forecast outside the 20 formula is 24.2 percent higher than 2020 Projected. 21
The capitalized overhead rate for 2020 and 2021 remains unchanged from 2019. 22
23 Costs related to EV charging stations are held outside of rate base pending BCUC approval, pursuant to Order G-
9-18.

FORTISBC INC. ANNUAL REVIEW FOR 2020 AND 2021 RATES
SECTION 7: RATE BASE PAGE 47
7. RATE BASE 1
7.1 INTRODUCTION AND OVERVIEW 2
Rate Base for FBC is forecast to be $1.412 billion for 2020 and $1.479 billion for 2021. Rate 3 Base is comprised of mid-year net plant in service, work in progress not attracting AFUDC, 4 unamortized deferred charges, working capital, and the generation plant acquisition 5 adjustment.24 6
FBC’s 2020 Rate Base includes the full-year impacts of the 2019 closing plant balances as well 7 as the impact of the following amounts: 8
Mid-year impact of capital additions, net of Contributions in Aid of Construction (CIAC) 9 additions, resulting from regular capital expenditures of $85.874 million; 10
Mid-year impact of plant depreciation, net of CIAC amortization, of $63.910 million; 11
Full-year impact of $20.427 million for the Corra Linn Dam Spillway Gate Replacement 12 Project and the Upper Bonnington (UBO) Old Units Refurbishment Project as discussed 13 in Section 7.3 below; 14
Full-year impact of the 2019 capital formula dead band adjustment of $8.827 million as 15 shown in Row 30, Column 7 in Table 14-3 in Section 14.4.1; and 16
Full-year impact of the 2014-2019 cumulative capital expenditures within the dead band 17 of $17.088 million as shown in Row 33, Column 2 in Table 14-3 in Section 14.4.1. 18
19 FBC’s 2021 Rate Base includes the full-year impacts of the 2020 closing projected plant 20 balances as well as the impact of the following amounts: 21
Mid-year impact of capital additions, net of CIAC additions, resulting from regular capital 22 expenditures of $92.133 million; 23
Mid-year impact of plant depreciation, net of CIAC amortization, of $71.554 million; and 24
Full-year impact of $40.407 million for the Corra Linn Dam Spillway Gate Replacement 25 Project, the UBO Old Units Refurbishment Project, and the Grand Forks Terminal 26 Station Reliability Project, as discussed in Section 7.3 below. 27
28 In addition, various changes in deferred charges, working capital and other items increase rate 29 base by a net amount of $41.544 million in 2020 and $47.974 million in 2021. 30
24 The utility plant acquisition adjustment relates to the 1982 purchase of Plants 2, 3, and 4 and is being amortized
over a period of 64 years.

FORTISBC INC. ANNUAL REVIEW FOR 2020 AND 2021 RATES
SECTION 7: RATE BASE PAGE 48
Details of the 2020 and 2021 Forecast plant balances can be found in Section 11, Schedules 5 1 through 9. 2
7.2 REGULAR CAPITAL EXPENDITURES 3
As part of the MRP Decision and Order G-166-20, FBC received the following approvals for 4 capital expenditures: 5
Approval of FBC’s forecasts submitted for regular capital expenditures for the years 6 2020 through 2023; and 7
Approval of a number of items to be forecast on an annual basis. 8
9 The components of 2020 and 2021 regular capital expenditures are shown in Table 7-1 below. 10
Table 7-1: Regular Capital Expenditures ($millions) 11
12
In the subsections below, FBC provides further details on its regular capital expenditures for 13 2020 and 2021. 14
Approved Capital Expenditures 15
The level of forecast capital expenditures approved for 2020 and 2021 by the MRP Decision is 16 shown in Table 7-2 below. 17
Table 7-2: Approved Capital Expenditures 18
19
Flow-Through Capital Expenditures 20
FBC is afforded flow-through treatment for certain capital items due to a variety of factors, 21 including their uncontrollable nature, because they drive incremental revenues, because they 22
Line Approved Actual Approved ForecastNo. Description 2019 2019 2020 2021 Reference
1 Approved Capex 48.474 $ 61.485 $ 93.244 $ 87.572 $ Table 7.2 Line 42 Flow-Through Capex 4.159 3.010 - - Table 7.3 Line 3 Total Gross Regular Capex 52.633 $ 64.495 $ 93.244 $ 87.572 $ Sum of Lines 1 & 24 Less CIAC (8.876) (9.315) (11.107) (11.465) Section 11, Schedule 9, Line 135 Net Regular Capex 43.757 $ 55.180 $ 82.137 $ 76.107 $ Sum of Lines 3 & 4
Line Approved Actual Approved ApprovedNo. Description 2019 2019 2020 2021 Reference
1 Growth Capital n/a 20.202 $ 27.029 $ 23.042 $ Section 11, Schedule 4, Line 22 Sustainment Capital n/a 29.481 50.463 49.818 Section 11, Schedule 4, Line 33 Other Capital n/a 11.802 15.752 14.712 Section 11, Schedule 4, Line 44 Total 48.474 $ 61.485 $ 93.244 $ 87.572 $ Section 11, Schedule 4, Line 5
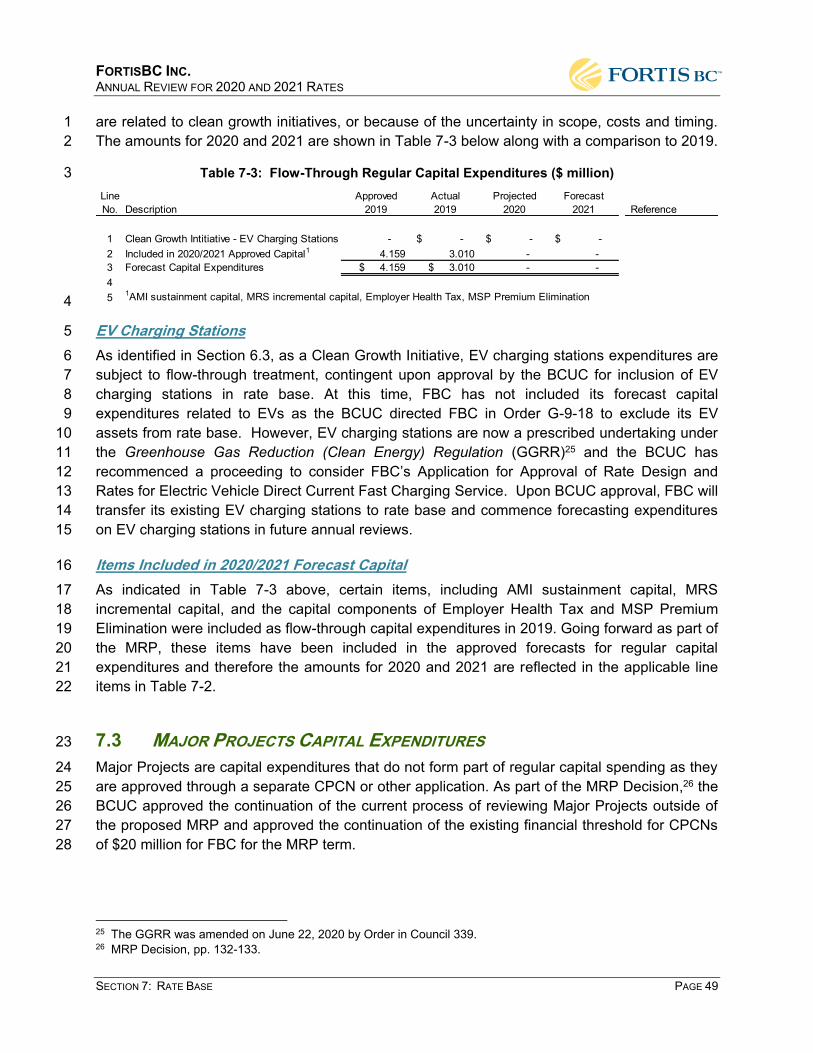
FORTISBC INC. ANNUAL REVIEW FOR 2020 AND 2021 RATES
SECTION 7: RATE BASE PAGE 49
are related to clean growth initiatives, or because of the uncertainty in scope, costs and timing. 1 The amounts for 2020 and 2021 are shown in Table 7-3 below along with a comparison to 2019. 2
Table 7-3: Flow-Through Regular Capital Expenditures ($ million) 3
4
EV Charging Stations 5 As identified in Section 6.3, as a Clean Growth Initiative, EV charging stations expenditures are 6 subject to flow-through treatment, contingent upon approval by the BCUC for inclusion of EV 7 charging stations in rate base. At this time, FBC has not included its forecast capital 8 expenditures related to EVs as the BCUC directed FBC in Order G-9-18 to exclude its EV 9 assets from rate base. However, EV charging stations are now a prescribed undertaking under 10 the Greenhouse Gas Reduction (Clean Energy) Regulation (GGRR)25 and the BCUC has 11 recommenced a proceeding to consider FBC’s Application for Approval of Rate Design and 12 Rates for Electric Vehicle Direct Current Fast Charging Service. Upon BCUC approval, FBC will 13 transfer its existing EV charging stations to rate base and commence forecasting expenditures 14 on EV charging stations in future annual reviews. 15
Items Included in 2020/2021 Forecast Capital 16 As indicated in Table 7-3 above, certain items, including AMI sustainment capital, MRS 17 incremental capital, and the capital components of Employer Health Tax and MSP Premium 18 Elimination were included as flow-through capital expenditures in 2019. Going forward as part of 19 the MRP, these items have been included in the approved forecasts for regular capital 20 expenditures and therefore the amounts for 2020 and 2021 are reflected in the applicable line 21 items in Table 7-2. 22
7.3 MAJOR PROJECTS CAPITAL EXPENDITURES 23
Major Projects are capital expenditures that do not form part of regular capital spending as they 24 are approved through a separate CPCN or other application. As part of the MRP Decision,26 the 25 BCUC approved the continuation of the current process of reviewing Major Projects outside of 26 the proposed MRP and approved the continuation of the existing financial threshold for CPCNs 27 of $20 million for FBC for the MRP term. 28
25 The GGRR was amended on June 22, 2020 by Order in Council 339. 26 MRP Decision, pp. 132-133.
Line Approved Actual Projected ForecastNo. Description 2019 2019 2020 2021 Reference
1 Clean Growth Intitiative - EV Charging Stations - $ - $ - $ -2 Included in 2020/2021 Approved Capital1 4.159 3.010 - - 3 Forecast Capital Expenditures 4.159 $ 3.010 $ - - 45 1AMI sustainment capital, MRS incremental capital, Employer Health Tax, MSP Premium Elimination

FORTISBC INC. ANNUAL REVIEW FOR 2020 AND 2021 RATES
SECTION 7: RATE BASE PAGE 50
For 2020 and 2021, FBC is forecasting capital expenditures related to the following approved 1 projects: Corra Linn Dam Spillway Gate Replacement Project, the Grand Forks Terminal Station 2 (GFT) Reliability Project, and the UBO Refurbishment Project. 3
Each of these approved projects is described further below.27 4
5 6 7 8 9
10
The Corra Linn Dam Spillway Gate Replacement Project was approved by Order C-1-17 and involves the replacement of 14 spillway gates and upgrades to the associated infrastructure. The project is expected to be completed in 2022 at a cost of $74.405 million, inclusive of AFUDC and cost of removal, with $20.456 million of this amount incurred in 2020 and $12.072 million incurred in 2021. Expenditures are added to plant in service as the gate replacements are completed. Additions to plant are $11.840 million and $23.629 million in 2020 and 2021, respectively.11
The GFT Station Reliability Project was approved by Order C-2-19. It involves the12 installation of a second transformer at GFT and the removal of 44.6 km of transmission13 line between Christina Lake and Rossland. The project is estimated at $13.171 million,14 inclusive of AFUDC and cost of removal, of which $4.411 million will be incurred in 202015 and $7.648 million incurred in 2021. $8.686 million will be added to plant in service in16 2021. 17
The UBO Project was approved by Order G-8-17 and involves the refurbishment of the18 more than 100-year-old generating Units 1 – 4 (the Old Units). The refurbishments will19 be completed in 2021 at an estimated cost of $32.493 million, inclusive of AFUDC and20 cost of removal, of which $6.495 million will be incurred in 2020 and $1.808 million will21 be incurred in 2021. Additions to Plant are $8.587 million and $8.092 million in 2020 and22 2021, respectively. As directed by the BCUC in the Annual Review for 2017 Rates, the23 UBO Project Status Report is included as Appendix C4.24
25 In addition to the three projects described above that have already been approved, FBC is 26 requesting approval under Section 44.2 of the UCA for one new capital project, the Playmor 27 Substation Upgrade Project, which is driven by new customer requests received after the 28 preparation of the MRP capital plan. 29
The Playmor Substation Upgrade Project proposes to rebuild the Playmor substation in South 30 Slocan, BC on an expanded station footprint in order to increase station capacity. The project is 31 necessary to meet load growth from existing customers and new customer requests, and to 32 continue reliably supplying electricity to the surrounding area, including several large 33 commercial and industrial customers. The forecast cost of the Playmor Substation Upgrade 34 Project is $10.922 million, inclusive of AFUDC and cost of removal, with expenditures of $0.490 35 million, $9.024 million, and $1.408 million in 2020, 2021, and 2022, respectively. Project 36
27 Costs inclusive of AFUDC.

FORTISBC INC. ANNUAL REVIEW FOR 2020 AND 2021 RATES
SECTION 7: RATE BASE PAGE 51
expenditures will enter rate base on January 1, 2023 upon completion. The business case for 1 the project is provided in Appendix B. 2
7.4 2020 AND 2021 PLANT ADDITIONS 3
The 2020 and 2021 Plant Additions are comprised of: (i) FBC’s 2020 and 2021 regular capital 4 expenditures from Section 7.2; (ii) the Major Projects from Section 7.3 to the extent that portions 5 of those projects are placed into service; (iii) the change in work in progress which adjusts for 6 capital expenditures for projects that are in progress at year-end; (iv) AFUDC; and (v) overhead 7 capitalized for the year. A reconciliation of capital expenditures to plant additions is shown 8 below and is also provided in Section 11 – 2020 and Section 11 – 2021, Schedule 5. 9
Table 7-4: Reconciliation of Capital Expenditures to Plant Additions ($millions) 10
11
7.5 CONTRIBUTIONS IN AID OF CONSTRUCTION (CIAC) 12
Rate base is reduced by CIAC. Gross CIAC is composed of opening contributions plus 13 additions during the year. 2020 and 2021 CIAC additions are forecast at $11.107 million and 14 $11.465 million, respectively. The year-end CIAC balances net of accumulated amortization are 15 $140.959 million (projected) in 2020 and $148.008 million (forecast) in 2021. 16
7.6 ACCUMULATED DEPRECIATION 17
The rate base of FBC includes both the accumulated depreciation on plant in service and 18 accumulated amortization of CIAC. Both are increased through depreciation expense, and 19 decreased through retirements. 20
Line Projected ForecastNo. Description 2020 2021 Reference
1 Forecast Capital Expenditures 93.244 $ 87.573 $ Table 7-1, Line 12 Flow-Through Capital Expenditures - - Table 7-1, Line 23 Total Regular Capital Expenditures 93.244 87.5734 5 Capitalized Overhead 9.284 9.767 Table 6-16 AFUDC 0.288 0.542 Section 11, Schedule 5, Line 217 Change in Work in Progress (5.836) 5.717 Section 11, Schedule 5, Line 238 Total Regular Additions to Plant 96.981 103.5999
10 Major Projects Capital Expenditures 27.341 21.938 Section 11, Schedule 5, Line 2711 Major Projects AFUDC 1.960 1.857 Section 11, Schedule 5, Line 2812 Change in Work in Progress (8.873) 16.612 Section 11, Schedule 5, Line 3113 Major Projects Additions to Plant 20.428 40.407 14 15 Plant Additions 117.409 $ 144.006 $

FORTISBC INC. ANNUAL REVIEW FOR 2020 AND 2021 RATES
SECTION 7: RATE BASE PAGE 52
The depreciation rates used for 2020 and 2021, which were approved by Order G-166-20 and 1 are based on FBC’s most recent depreciation study, include the recovery of the estimated future 2 costs of removal over the average service life of the assets (net salvage) in accumulated 3 depreciation. Depreciation is calculated beginning January 1 of the year after the assets are 4 placed in service, which is the treatment approved in Order G-139-14. 5
Based on calculating depreciation expense at these approved depreciation rates on the opening 6 plant-in-service balance, the 2020 depreciation expense is calculated as $56.472 million,28 and 7 2021 depreciation expense is calculated as $59.372 million.29 8
7.7 RATE BASE DEFERRED CHARGES 9
On May 3, 2017, the BCUC issued its Regulatory Account Filing Checklist.30 The stated 10 purpose of the checklist is to assist regulated entities when filing regulatory account requests 11 and to facilitate an efficient review by the BCUC. 12
The checklist classifies deferral accounts as one of: (a) forecast variance account; (b) rate 13 smoothing account; (c) benefit matching (capital-like) account; (d) retroactive expense account; 14 or (e) other. In Section 11, Schedule 11, FBC has classified its rate base deferral accounts in 15 accordance with this classification. 16
The forecast mid-year balance of unamortized deferred charges in rate base for FBC is 17 approximately $20.420 million in 2020 and approximately $25.728 million in 2021. This balance 18 is driven largely by the balances in deferral accounts for DSM, Pension and OPEB funding 19 liability and deferred debt issue expense. 20
Figure 7-1 provides the mid-year deferral account balances summarized by deferral account 21 category. 22
28 $60.666 million depreciation expense as shown in Section 11 - 2020, Schedule 21, Line 2 less $4.194 million
amortization of CIAC as shown in Section 11 - 2020, Schedule 21, Line 8. 29 $63.789 million depreciation expense as shown in Section 11 - 2021, Schedule 21, Line 2 less $4.417 million
amortization of CIAC as shown in Section 11 - 2021, Schedule 21, Line 8. 30 BCUC Letter, Log No. 53608, Appendix B.

FORTISBC INC. ANNUAL REVIEW FOR 2020 AND 2021 RATES
SECTION 7: RATE BASE PAGE 53
Figure 7-1: FBC Forecast Mid-Year Balances of Rate Base Deferral Accounts by Category 1
2
Based on amortizing the opening deferral account balances using the approved and proposed 3 amortization periods, the 2020 amortization expense for rate base deferral accounts is 4 calculated as $4.691 million31 and the 2021 amortization expense is calculated as $5.536 5 million.32 The subsections below include a discussion on new rate base deferral accounts and 6 changes or updates to existing rate base deferral accounts. For a discussion on non-rate base 7 deferral accounts, please refer to Section 12. 8
New Deferral Accounts 9
FBC seeks approval of six new deferral accounts, four of which are related to regulatory 10 proceedings. One new deferral account relates to periodic costs not included in FBC’s Formula 11 O&M Expense and one new deferral account relates to the strengthening of the relationship 12 between FBC and its Indigenous stakeholders. The proposed new deferral accounts are: 13
Annual Reviews for 2020 – 2024 Rates; 14
2021 Long-Term Electric Resource Plan; 15
2020 Cost of Service Analysis; 16
BCUC-Initiated Inquiry Costs; 17
MRS 2021 Audit; and 18
Indigenous Relations Agreement (Huth Substation). 19
31 Section 11 - 2020, Schedule 11, Line 24, Column 6. 32 Section 11 - 2021, Schedule 11, Line 24, Column 6.

FORTISBC INC. ANNUAL REVIEW FOR 2020 AND 2021 RATES
SECTION 7: RATE BASE PAGE 54
1 Each of these proposed deferral accounts is described in more detail below. 2
7.7.1.1 Annual Reviews for 2020 – 2024 Rates 3
FBC is requesting approval to establish a deferral account to capture costs related to the Annual 4 Reviews for 2020 – 2024 Rates. Consistent with other deferral accounts related to regulatory 5 applications, the Annual Review deferral account will capture costs such as BCUC costs, 6 intervener and participant funding costs, consulting costs, external legal fees, and 7 miscellaneous facilities, stationary and supplies costs. FBC forecasts additions of $0.140 million 8 ($0.102 million after tax) in each of 2020 and 2021. 9
7.7.1.2 2021 Long-Term Electric Resource Plan 10
FBC will file its 2021 Long-Term Electric Resource Plan (LTERP) on or before December 1, 11 2021 as directed by Order G-117-18. Consistent with historical and approved practice, FBC is 12 seeking a deferral account to capture the costs of external resources required for the 2021 13 LTERP that are incremental to the costs in FBC’s Base O&M, including expert and consulting 14 fees, external legal fees, public consultation, BCUC costs and intervener funding. FBC 15 estimates that total costs of the LTERP application proceeding, which will conclude in 2022, will 16 be $0.725 million ($0.529 million after tax). Annual expenditures are estimated to be $0.260 17 million, $0.145 million, and $0.320 million before tax ($0.190 million, $0.106 million and $0.234 18 million after tax) in 2020, 2021, and 2022, respectively. 19
FBC typically amortizes the costs of its resource plans over the time period between filings, and 20 will apply for disposition of the account in a future annual review, following completion of the 21 regulatory process for the 2021 LTERP. 22
7.7.1.3 2020 Cost of Service Analysis 23
FBC will file a Cost of Service Analysis (2020 COSA) on or before December 31, 2020 as 24 directed in Order G-40-19. As provided for in the accompanying Decision to Order G-40-19, the 25 2020 COSA will provide an update to the Revenue to Cost ratios derived as part of the 2017 26 COSA and Rate Design Application such that there will be an opportunity for rebalancing before 27 customer classes move too far outside the range of reasonableness. FBC anticipates it will 28 incur $0.080 million ($0.058 million after tax) of costs in 2020 and an additional $0.020 million 29 ($0.015 million after tax) in 2021 to manage any regulatory process. FBC will apply for 30 disposition of the account in a future annual review. 31
7.7.1.4 BCUC-Initiated Inquiry Costs 32
FBC is seeking a deferral account to capture, in aggregate, costs associated with its 33 participation in BCUC-initiated inquiries and proceedings for the purpose of determining 34 provincial regulatory policy or ensuring consistency of treatment among utilities. These costs 35

FORTISBC INC. ANNUAL REVIEW FOR 2020 AND 2021 RATES
SECTION 7: RATE BASE PAGE 55
represent BCUC costs, participant funding, consulting costs and external legal fees. The 1 following proceedings are currently included or will be included in this deferral account: 2
BCUC Inquiry into the Regulation of Electric Vehicle Charging Service: FBC incurred 3 $0.066 million ($0.048 after tax) for the Phase 1 and Phase 2 Inquiries. 4
BCUC Indigenous Utilities Regulation Inquiry, which concluded in April 2020. To date, 5 FBC has incurred $0.093 million ($0.068 million after tax) and anticipates additional 6 costs of $0.125 million before tax in 2020 related to the issuance of the final report and 7 participant funding costs. 8
BCUC Municipal Energy Utilities Inquiry, which is currently adjourned. FBC has incurred 9 $0.006 million ($0.004 million after tax) to date. FBC forecasts further costs, before tax, 10 of $0.005 million in 2020 and $0.005 million in 2021. 11
12 FBC proposes to include the costs of these and future tariff-related applications in a single 13 deferral account, in order to reduce the number of individual deferral account requests. FBC 14 further proposes to amortize costs in the year following when the expenses are forecast. 15
7.7.1.5 Mandatory Reliability Standards (MRS) 2021 Audit 16
FBC’s triennial MRS compliance audit is scheduled to occur in 2021. This audit will be 17 performed by the administrator of the BC MRS Program, the Western Electricity Coordinating 18 Council (WECC), and will include a review, at a minimum, of all applicable reliability standards 19 identified in the Actively Monitored List, to be issued in November 2020. This will include Critical 20 Infrastructure Protection (CIP) and Operations and Planning (O&P) standards. Eligible costs are 21 incremental labour and expenses directly caused by the periodic audit and therefore not 22 included in Formula O&M Expense. Based on previous audits, FBC forecasts costs of $0.350 23 million before tax ($0.256 after tax) in 2021. 24
FBC will propose the disposition of this account in a future annual review. 25
7.7.1.6 Indigenous Relations Agreement (Huth Substation) 26
In November 2019, the BC government passed Bill 41 (Declaration on the Rights of Indigenous 27 Peoples Act). The BC Government passed this legislation to implement the United Nations 28 Declaration on the Rights of Indigenous Peoples. Since this legislation has come into force, 29 many First Nations are asking FortisBC to act in the spirit of the legislation and make efforts 30 towards reconciliation. FBC is seeking a deferral account to capture costs to address the 31 Penticton Indian Band’s (PIB) concerns regarding the Huth Substation in Penticton and the 32 impacts the substation has had on Syilx33 history and culture, such as the discovery of ancestral 33 remains found at the Huth substation while performing construction works. 34
33 The PIB is a community of the Syilx people.

FORTISBC INC. ANNUAL REVIEW FOR 2020 AND 2021 RATES
SECTION 7: RATE BASE PAGE 56
Huth Substation is a vital component of the South Okanagan area power system, providing 1 direct service to both FBC customers and the municipal utility of the City of Penticton. This hub 2 is connected to five major transmission lines (42L, 49L, 47L, 52L and 53L) and to two City of 3 Penticton distribution substations. Given this importance to the supply of power in the South 4 Okanagan and the historical value of the land to the PIB and the Syilx people, FBC has 5 engaged in reconciliation efforts with the PIB, consistent with the recent legislation passed by 6 the Provincial government. 7
FBC is unable to publicly disclose the nature of potential costs associated with these 8 reconciliation efforts or estimate an amount of costs to be incurred while the negotiation process 9 is underway. FBC will update its progress with respect to this matter in its next Annual Review 10 filing and will request approval for recovery of costs captured in this deferral account in a future 11 revenue requirements proceeding once an agreement with the PIB has been reached and the 12 impacts can be communicated. 13
Table 7-5 below addresses the considerations identified in the Regulatory Account Filing 14 Checklist as they pertain to the deferral accounts requested in Sections 7.7.1.1 to 7.7.1.6 15 above. 16

FORTISBC INC. ANNUAL REVIEW FOR 2020 AND 2021 RATES
SECTION 7: RATE BASE PAGE 57
Table 7-5: Deferral Account Filing Considerations 1
Item Consideration Regulatory Proceeding Costs MRS Compliance Audit Indigenous Relations
Agreement (Huth Substation)
I. Indicate if the request is: (a) for a modification or a change in scope to an existing Commission approved regulatory account; or (b) to establish a new regulatory account.
The four regulatory proceeding cost accounts are new deferral accounts, consistent with previously approved regulatory proceeding deferral accounts.
The 2021 MRS Compliance Audit account is a new deferral account.
The Indigenous Relations Agreement (Huth Substation) account is a new deferral account.
a) If the request is for a modification or change in scope to an existing regulatory account, explain why the existing regulatory account is an appropriate account to use (specifically addressing the existing account’s intended and approved purpose, mechanism for recovery, timeline for recovery and carrying costs).
N/A N/A N/A
b) If the request is for approval of a new regulatory account, state the purpose of the regulatory account and explain its intended use.
The requested accounts are regulatory proceeding cost accounts, which are routinely sought by utilities to capture external costs related to the preparation, filing, and regulatory review of applications.
The requested account will capture periodic incremental costs of the MRS compliance audit.
The requested account will capture costs related to reconciliation efforts.
II. Propose a term (i.e., length of time) that the regulatory account should be approved for and explain why that term is appropriate.
The term of each account encompasses the preparation and filing of the relevant regulatory application and its review by the BCUC.
The term of the account encompasses the conduct of the audit and subsequent amortization period, equivalent to the term of the benefit.
The term of the account encompasses the period of negotiation with the PIB and the subsequent amortization period.

FORTISBC INC. ANNUAL REVIEW FOR 2020 AND 2021 RATES
SECTION 7: RATE BASE PAGE 58
Item Consideration Regulatory Proceeding Costs MRS Compliance Audit Indigenous Relations
Agreement (Huth Substation)
III. Identify any alternate treatments that were considered, including an overview of what the accounting treatment would be in the absence of approval of the request to establish a regulatory account, and explain why these alternate treatments may not be appropriate.
In the absence of deferral accounts for regulatory proceedings, the costs of regulatory proceedings would have to be forecast as an O&M expense (outside of the MRP formula O&M since regulatory proceeding costs are not included in Base O&M Expense) and trued up annually by way of the Flow-Through deferral account. FBC considers this to be a more cumbersome and less efficient means of accounting for regulatory proceeding costs. It is accepted regulatory practice to defer the costs of regulatory applications for review and recovery following the regulatory review of the application itself. Review and recovery after the completion of the regulatory process allows for more transparency as the history of the costs is simpler to track and report on.
In the absence of a deferral account, the audit costs would have to be forecast as an O&M expense (outside of the MRP formula O&M, as the costs are not included in Base O&M Expense) and trued up by way of the Flow-Through deferral account. FBC considers this to be a more cumbersome and less efficient means of managing the audit costs. In addition, the use of a deferral account permits multi-year cost recovery, which is consistent with the three-year period between audits, as opposed to recovery in a single year.
In the absence of a deferral account, the costs would have to be forecast as an O&M expense (outside of the MRP formula O&M, as the costs are not included in Base O&M Expense) and trued up by way of the Flow-Through deferral account. Since the terms of the agreement have not yet been negotiated, FBC is unable to forecast expenditures with confidence at this time, or to determine an appropriate period for recovery.
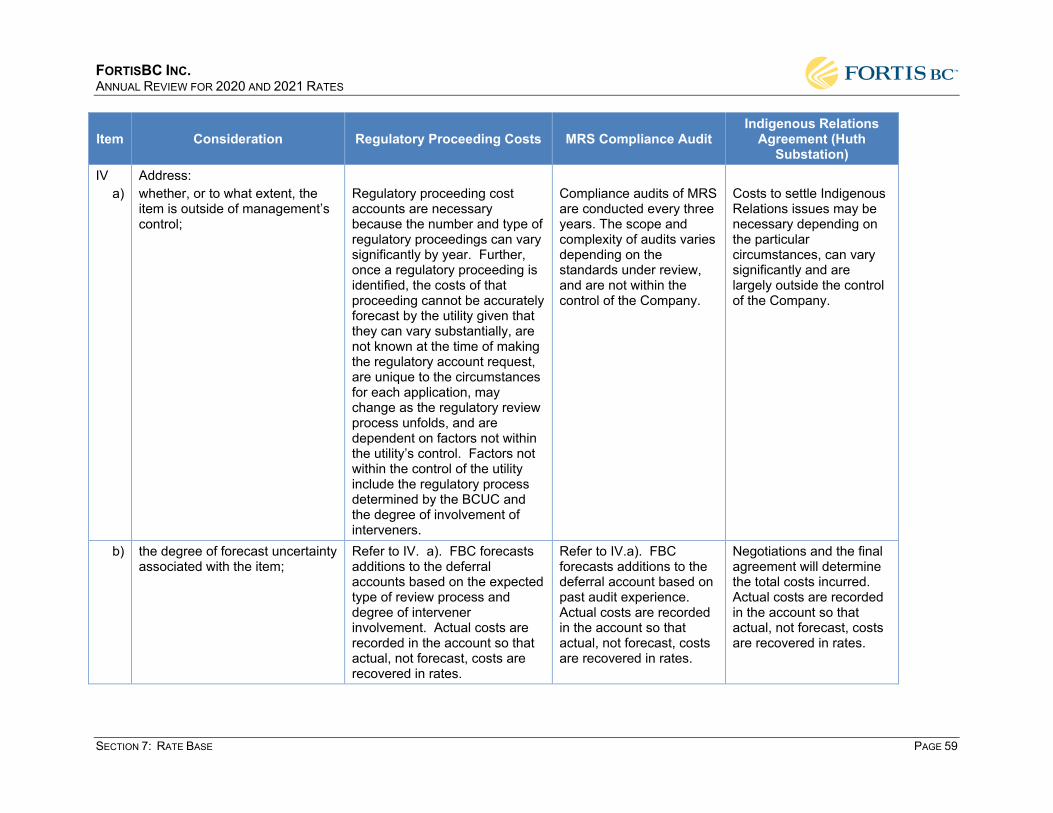
FORTISBC INC. ANNUAL REVIEW FOR 2020 AND 2021 RATES
SECTION 7: RATE BASE PAGE 59
Item Consideration Regulatory Proceeding Costs MRS Compliance Audit Indigenous Relations
Agreement (Huth Substation)
IV a)
Address: whether, or to what extent, the item is outside of management’s control;
Regulatory proceeding cost accounts are necessary because the number and type of regulatory proceedings can vary significantly by year. Further, once a regulatory proceeding is identified, the costs of that proceeding cannot be accurately forecast by the utility given that they can vary substantially, are not known at the time of making the regulatory account request, are unique to the circumstances for each application, may change as the regulatory review process unfolds, and are dependent on factors not within the utility’s control. Factors not within the control of the utility include the regulatory process determined by the BCUC and the degree of involvement of interveners.
Compliance audits of MRS are conducted every three years. The scope and complexity of audits varies depending on the standards under review, and are not within the control of the Company.
Costs to settle Indigenous Relations issues may be necessary depending on the particular circumstances, can vary significantly and are largely outside the control of the Company.
b) the degree of forecast uncertainty associated with the item;
Refer to IV. a). FBC forecasts additions to the deferral accounts based on the expected type of review process and degree of intervener involvement. Actual costs are recorded in the account so that actual, not forecast, costs are recovered in rates.
Refer to IV.a). FBC forecasts additions to the deferral account based on past audit experience. Actual costs are recorded in the account so that actual, not forecast, costs are recovered in rates.
Negotiations and the final agreement will determine the total costs incurred. Actual costs are recorded in the account so that actual, not forecast, costs are recovered in rates.

FORTISBC INC. ANNUAL REVIEW FOR 2020 AND 2021 RATES
SECTION 7: RATE BASE PAGE 60
Item Consideration Regulatory Proceeding Costs MRS Compliance Audit Indigenous Relations
Agreement (Huth Substation)
c) the materiality of the costs The number and size of regulatory proceedings vary from year to year, and represent costs not included in Base O&M for the purpose of determining formula O&M Expense under the MRP. See sections 7.7.1.1 to 7.7.1.4.
Audit preparation and participation impacts many individuals and business units and is not manageable within FBC’s formula O&M Expense.
Negotiations and the final agreement will determine the total costs incurred and represent costs not included in FBC’s formula O&M expense.
d) any impact on intergenerational equity
Generally, FBC recovers the costs of regulatory proceedings over the period of time related to the application, which serves to match the costs and benefits. See sections 7.7.1.1 to 7.7.1.4. There are no intergenerational inequities inherent in this practice.
FBC expects to recover the audit costs over the period of time between audits, which serves to match the costs and benefits. There are no intergenerational inequities inherent in this practice.
FBC expects to recover the costs over the period of time which serves to match the costs and benefits. There are no intergenerational inequities inherent in this practice.
V. Classify the regulatory account as either: (a) forecast variance account; (b) rate smoothing account; (c) benefit matching account; (d) retroactive expense account; or (e) other.
FBC generally classifies regulatory proceeding accounts as benefit matching accounts since the costs are recovered over the period of time related to the applications, which serves to match the costs and benefits of the application.
The account is classified as a benefit matching account since the costs will be recovered over the period of time between audits, which serves to match the costs and benefits of the audit.
The account is classified as “other”.
VI. Identify if the regulatory account is a cash or non-cash account.
Regulatory proceeding cost accounts are cash accounts.
The compliance audit deferral account is a cash account.
The Indigenous Relations Agreement account is a cash account.

FORTISBC INC. ANNUAL REVIEW FOR 2020 AND 2021 RATES
SECTION 7: RATE BASE PAGE 61
Item Consideration Regulatory Proceeding Costs MRS Compliance Audit Indigenous Relations
Agreement (Huth Substation)
VII. Specify what additions to the regulatory account are being requested (i.e. type and amount of additions), including whether the account is intended to capture additions for a specific period of time or on an ongoing basis.
Eligible costs include the BCUC’s direct costs, notice publication costs, fees for consultants or experts, external legal counsel fees, courier and miscellaneous administrative costs, and participant assistance cost awards incurred in the preparation, filing and regulatory review of the applications. Regular labour and staff expenses related to regulatory applications are included in formula O&M Expense.
Eligible costs are incremental to ongoing MRS expenses and include labour, consulting and miscellaneous expenses not included in Formula O&M Expense.
FBC is unable to publicly disclose the nature or potential costs associated with these reconciliation efforts during the negotiation process.
VIII. Propose a mechanism for recovery (e.g. how the balance in the regulatory account will be recovered or refunded to ratepayers) and explain why it is appropriate.
Costs are recovered in revenue requirements by way of amortization expense.
Costs will be recovered in revenue requirements by way of amortization expense.
Costs will be recovered in revenue requirements by way of amortization expense.
IX. Propose a timeline for recovery (e.g. the period over which the regulatory account balance is either collected or refunded; also referred to as the amortization period) and explain why it is appropriate.
Generally, FBC amortizes the costs of regulatory proceedings over the period of time related to the application, which serves to match the timing of costs and benefits. See sections 7.7.1.1 to 7.7.1.4.
FBC will propose the recovery of costs in a subsequent Annual Review. Recovery of the costs over the period of time between audits serves to match the costs and benefits of the audit.
FBC will propose the recovery of costs in a subsequent Annual Review.

FORTISBC INC. ANNUAL REVIEW FOR 2020 AND 2021 RATES
SECTION 7: RATE BASE PAGE 62
Item Consideration Regulatory Proceeding Costs MRS Compliance Audit Indigenous Relations
Agreement (Huth Substation)
X. Propose a carrying cost for the balance in the regulatory account and explain why it is appropriate.
Rate base deferral accounts are included in rate base and are therefore implicitly financed using the weighted average cost of capital (WACC).
Rate base deferral accounts are included in rate base and are therefore implicitly financed using the weighted average cost of capital (WACC).
Rate base deferral accounts are included in rate base and are therefore implicitly financed using the weighted average cost of capital (WACC).
XI. Outline a recommended regulatory process for the Commission’s review of the application.
The proposed deferral accounts can be reviewed as part of the present proceeding. Deferral account approvals and disposition are generally determined in revenue requirements proceedings.
1

FORTISBC INC. ANNUAL REVIEW FOR 2020 AND 2021 RATES
SECTION 7: RATE BASE PAGE 63
Existing Deferral Accounts 1
7.7.2.1 COVID-19 Customer Recovery Fund Deferral Account 2
In June 2020, FBC received approval through Order G-133-20 to establish the COVID-19 3 Customer Recovery Fund Deferral Account in rate base to record three items: 4
(a) any bill payment deferrals provided to customers due the COVID-19 pandemic and 5 subsequent payments of those deferred amounts; 6
(b) any bill credits provided to customers due to the COVID-19 pandemic; and 7
(c) any unrecovered revenue resulting from customers being unable to pay their bills 8 due to the COVID-19 pandemic, which will be tracked separately by rate schedule. 9
10 The following section provides 2020 and 2021 financial estimates and descriptions for each of 11 the three items for inclusion in the COVID-19 Customer Recovery Fund Deferral Account. 12
(a) Bill payment deferrals provided to residential and small commercial customers 13 The 3-month bill payment deferral program has been offered to residential and small 14 commercial customers affected by COVID-19 from April to June 2020. The bill payment 15 deferrals are to be repaid by customers over a 12-month period with such repayments 16 beginning in July 2020. 17
Table 7-6: Bill Payment Deferral Forecast 18
19
The deferral account gross additions of $0.424 million related to this customer relief offering 20 have been estimated as the outstanding customer accounts receivable balances of $0.848 21 million as of July 2020, less the estimated customer repayments from July 2020 through to the 22 end of 2020. As customers are expected to repay the balances over a 12-month term, beginning 23 in July 2020, there is not expected to be an ending balance of bill payment deferral balances as 24 at the end of 2021. 25
Any of the customers enrolled in the bill payment deferral program that are unable to repay their 26 outstanding balances will be designated as unrecoverable revenue. This change in classification 27 will entail a reduction in the bill payment deferral portion of the deferral account in this section 28 (a) and will be reallocated as an addition to the unrecovered revenue (section c) component. 29 There could be customers that default on their repayment of the bill deferral arrangements and 30 these would also be allocated to the unrecovered revenue (section c). No such defaults have 31
COVID-19 Deferral Account Year Opening Bal.
Gross
Additions Less Taxes
Amortization
Expense Ending Bal.
COVID-19 Customer Recovery Fund -
Bill Payment Deferrals 2020 - 424 - - 424
COVID-19 Customer Recovery Fund -
Bill Payment Deferrals 2021 424 (424) - - -

FORTISBC INC. ANNUAL REVIEW FOR 2020 AND 2021 RATES
SECTION 7: RATE BASE PAGE 64
been forecast in section (a) as they are assumed to be incorporated in the estimates provided in 1 section (c) associated with unrecovered revenue. 2
(b) Bill credits provided to small commercial customers 3 The 3-month bill credit program offered to small commercial customers for April through June 4 2020 has been estimated using the customer balances of $0.161 million as of July 2020. 5
Table 7-7: Bill Credit Forecast 6
7
While the bill credits are available for the three-month period from April through June 2020, the 8 forecast balance of bill credits are still subject to change after June 2020. This is primarily due to 9 the expectation that there could still be small commercial customers that have yet to apply for 10 bill credit relief for the qualifying three-month period, as well as certain billing cycles yet to be 11 completed. 12
(c) Unrecovered revenue resulting from customers being unable to pay their bills due to 13 the COVID-19 pandemic. 14
Unrecovered revenues are representative of accounts receivable balances that are determined 15 to be uncollectible due to COVID-19 and therefore include the write-offs of bad debts. These 16 forecast balances are meant to represent the unrecovered revenues specific to COVID-19 that 17 are recognized in the deferral account and therefore are in excess of the normal course forecast 18 bad debt expense that is recognized in indexed-based O&M. While FBC has currently forecast 19 the bad debt expense to be recognized in indexed-based O&M for 2020 and 2021 as 20 representative of the normalized bad debt expense that was embedded in the Base O&M, the 21 actual bad debt expense recognized in O&M could differ. This is in part due to the timing of 22 recognizing the bad debt expense in O&M versus the write-offs of bad debts in the deferral 23 account, as well as the uncertainty around the duration and significance of the pandemic on 24 customers’ ability to pay their bills. 25
Table 7-8: Unrecoverable Revenue Forecast 26
27
COVID-19 Deferral Account Year Opening Bal.
Gross
Additions Less Taxes
Amortization
Expense Ending Bal.
COVID-19 Customer Recovery Fund -
Bill Credits 2020 - 161 (43) - 118
COVID-19 Customer Recovery Fund -
Bill Credits 2021 118 - - - 118
COVID-19 Deferral Account Year Opening Bal.
Gross
Additions Less Taxes
Amortization
Expense Ending Bal.
COVID-19 Customer Recovery Fund -
Unrecoverable Revenue 2020 - 801 (216) 585
COVID-19 Customer Recovery Fund -
Unrecoverable Revenue 2021 585 1,747 (472) - 1,860

FORTISBC INC. ANNUAL REVIEW FOR 2020 AND 2021 RATES
SECTION 7: RATE BASE PAGE 65
The unrecovered revenue recorded in the deferral account will include: 1
any remaining balances associated with the bill payment deferral program, described in 2 section (a), that resulted from customers’ inability to pay; and 3
any unrecovered revenue from all customer classes due to COVID-19, including 4 industrial and large commercial customers and those residential and small commercial 5 customers that did not participate in the bill payment deferral or bill credit relief offerings. 6
7 There has been a minimal amount of confirmed customer bad debt write-offs relating to COVID-8 19 in the first four to five months since the relief options have been offered to customers. While 9 there still exists uncertainty around the effects of COVID-19 on customers’ ability to make 10 payments for current and future billed revenues, it is probable and reasonable to expect that 11 unrecovered revenue will materialize in the last half of 2020 and through 2021. Accordingly, 12 FBC has developed a methodology to estimate additions to the deferral account by applying an 13 estimated loss rate on forecast 2020 revenues to determine the potential unrecovered revenue 14 from customers resulting from the COVID-19 pandemic. To clarify, the ending balance of $1.860 15 million is based on the estimated bad debt write offs calculated on revenues billed in 2020 and 16 does not take into account bad debt write offs associated with revenue billed in 2021 or beyond. 17 Due to the significant uncertainty around the extent and duration of the pandemic on FBC’s 18 customers’ ability to pay in the future, there could also be unrecovered revenues that are 19 recognized in the deferral account beyond the forecast periods of 2020 and 2021. 20
For residential and small commercial customers, the loss rate took into account the relative 21 increase in the forecast 2020 unemployment rate for BC from 5.0 percent prior to the pandemic 22 to 8.2 percent. Similarly, there was a loss rate applied for industrial and large commercial 23 customers which incorporated the forecast 2020 GDP decrease in BC of 4.5 percent. The loss 24 rate was then applied to forecast revenues from March 2020 through to December 2020. The 25 unemployment and GDP indicators are macroeconomic factors based on forecasts from five 26 financial institutions and corroborated through the Conference Board of Canada. 27
Applying macroeconomic factors to estimating unrecoverable revenues is consistent with the 28 principles for external financial reporting. US GAAP ASU 2016-13 Financial Instruments – Credit 29 Losses: Measurement of Credit Losses on Financial Instruments discussed in Section 12.3.1.1 30 of this Application requires entities to consider historical experience, current conditions and 31 reasonable forecasts to determine the expected amount of credit losses that will occur. 32 Accordingly, FBC has estimated $0.8 million and $1.7 million of unrecoverable revenue 33 additions for 2020 and 2021, respectively, to the COVID-19 Customer Recovery Fund Deferral 34 Account. 35
While the forecasts of the unrecovered revenue additions rely on estimates and broader 36 macroeconomic factors, the actual amounts that accumulate in the deferral account are 37 expected to be representative of balances that are attributable to specific customers that cannot 38 make payment due to COVID-19. 39

FORTISBC INC. ANNUAL REVIEW FOR 2020 AND 2021 RATES
SECTION 7: RATE BASE PAGE 66
FUTURE DISPOSITION OF DEFERRAL ACCOUNT BALANCES 1
At the time of the original COVID-19 Customer Recovery Fund Deferral Account application in 2 early April 2020, there was significant uncertainty around the effect of the pandemic and the 3 overall economic effect on FortisBC’s customers. The combination of the programs offered to 4 customers and the deferral account have been successful and are working as intended to the 5 date of this filing. However, there continues to be uncertainty around future unrecovered 6 revenues and the possibility as to whether further extensions or additional relief offerings will be 7 required for the balance of 2020 and into 2021. 8
Rather than suggesting partial disposition for the three items in the deferral account, FBC 9 recommends a more comprehensive approach to the disposition of the deferral account, 10 particularly given that the effects of COVID-19 on these measures could occur over multiple 11 years. Therefore, FBC is not yet proposing an amortization period for the deferral account in 12 2020 or 2021. FBC has forecast additions to the deferral account for 2020 and 2021 and will 13 propose a disposition of the deferral account in the Annual Review for 2022 Rates filing, to take 14 place in 2021. 15
7.8 WORKING CAPITAL 16
The working capital component of rate base is comprised of cash working capital and other 17 working capital. 18
Cash working capital is defined as the average amount of capital provided by investors in the 19 Company to bridge the gap between the time expenditures are required to provide service 20 (expense lag) and the time collections are received for that service (revenue lag). The cash 21 working capital requirements that have been included reflect the most recent Lead Lag Study 22 results, as approved through Order G-166-20. 23
Other working capital includes customer (DSM) loans, employee loans and withholdings and 24 inventory of materials and supplies. 25
2020 amounts are projected based on 2019 levels, while also including six months of actual 26 results for 2020. 2021 amounts are based on similar inputs and include inflation where 27 applicable. 28
7.9 SUMMARY 29
FBC’s rate base includes the impact of Regular and Major Projects capital expenditures, 30 adjusted for work-in-progress, AFUDC and overheads capitalized. FBC has provided forecasts 31 for all of its rate base deferral accounts in its financial schedules in Section 11. Finally, the rate 32 base includes cash and other working capital. 33

FORTISBC INC. ANNUAL REVIEW FOR 2020 AND 2021 RATES
SECTION 8: FINANCING AND RETURN ON EQUITY PAGE 67
8. FINANCING AND RETURN ON EQUITY 1
8.1 INTRODUCTION AND OVERVIEW 2
FBC has prepared this Application using a capital structure of 60 percent debt and 40 percent 3 equity and a Return on Equity (ROE) of 9.15 percent as approved by Orders G-129-16 and G-4 47-14. FBC’s ROE is set at a premium of 40 basis points over the benchmark ROE, which is 5 the ROE approved for FortisBC Energy Inc. (FEI). The 2020 Projection for financing costs, 6 including the interest expense on issued long- and short-term debt and on new issuances that 7 are forecast, has been updated as described in Section 8.3 below. Based on the updated 8 financing costs, FBC’s AFUDC rates for 2020 and 2021 (which are equal to its after-tax 9 weighted average cost of capital) are 5.77 percent and 5.76 percent, respectively. Any 10 variances from interest rates used to set rates, and any variances in interest resulting from 11 items subject to flow-through in the Flow-through deferral account, will be flowed through to 12 customers. All other differences in interest expense will affect the achieved ROE and be subject 13 to earnings sharing. 14
8.2 CAPITAL STRUCTURE AND RETURN ON EQUITY 15
The Company finances its investment in rate base assets with a mix of debt and equity, as 16 approved by the BCUC from time to time. Order G-47-14 approved a capital structure for FBC of 17 60.0 percent debt and 40.0 percent equity with an equity risk premium of 40 basis points over 18 the benchmark ROE, which was set at 8.75 percent by Order G-129-16. 19
FBC has therefore prepared this Application using an ROE of 9.15 percent and a common 20 equity percentage of 40.0 percent. 21
8.3 FINANCING COSTS 22
Debt financing costs include the borrowing costs on issued debt as well as on new issuances 23 that are forecast. Debt consists of both long- and short-term (unfunded) debt. 24
Long-term Debt 25
FBC is both a private and public issuer of long-term debt. In May 2020, FBC completed a 26 private placement of $75 million long-term debt at a rate of 3.12 percent34 for a term of 30 years. 27 The net proceeds were used to repay existing indebtedness and finance the Company’s capital 28 expenditure program. FBC plans to issue additional long-term debt of approximately $75 million 29 in 2021, the proceeds of which will be used for the same purposes. The 2021 debt issuance is 30 reflected in the financial schedules in July 2021 at a rate of 3.90 percent.35 The exact timing, 31 amount and rate of the 2021 issuance will depend on future market conditions and capital 32 34 Section 11 – 2020 and 2021, Schedule 27, Line 9. 35 Section 11 – 2021, Schedule 27, Line 10.

FORTISBC INC. ANNUAL REVIEW FOR 2020 AND 2021 RATES
SECTION 8: FINANCING AND RETURN ON EQUITY PAGE 68
expenditure requirements. Variances in interest expense related to the timing and amount of the 1 issuances of the debt or the rates at which they are issued will be captured in the Flow-through 2 deferral account. 3
Short-term Debt 4
Since mid-2019, FBC has been obtaining short-term funding primarily through the issuance of 5 commercial paper to Canadian institutional investors. Until 2019, the Company was only able to 6 issue Bankers’ Acceptances. FBC backstops the commercial paper issuances by maintaining a 7 $150 million committed credit facility that matures in April 2024. The credit facility, along with a 8 $10 million overdraft facility, provides FBC with short-term liquidity to fund FBC’s capital 9 program and working capital requirements. The Company also issues letters of credit as part of 10 this facility. The short-term debt rate reflects FBC’s commercial paper and letter of credit 11 issuances. 12
Forecast of Interest Rates 13
FBC uses interest rate forecasts to estimate future interest expense. Forecasts of Treasury Bills 14 and benchmark Government of Canada Bond interest rates are used in determining the overall 15 interest rates for short-term debt and for rates on new issues of long-term debt, respectively. 16 The forecasts are based on available projections made by Canadian Chartered banks. 17
Credit spreads on new long-term debt are based on current indicative rates, on the assumption 18 that the current credit ratings of FBC are maintained. 19
FBC’s short-term borrowing rate is based on the rate at which it issues commercial paper and 20 letters of credit. Since commercial paper issuance rates are not forecast by economists, a 21 forecast needs to be derived by FBC. The forecast is based on the historical differential 22 between the Canadian Deposit Overnight Rate (CDOR) and the rate obtained by FBC under its 23 commercial paper program. CDOR is used because FBC’s short-term borrowings under its 24 credit facility are priced based on CDOR and therefore CDOR is tracked relative to FBC’s 25 commercial paper borrowings. As CDOR is not forecast by economists, FBC must first obtain 26 the 3-Month T-Bill rate forecast and then convert it to a CDOR forecast. FBC does this by taking 27 the 3-year historical spread between CDOR and the 3-month T-Bill rate. Then, to derive the 28 short-term borrowing rate forecast, FBC adjusts the CDOR forecast with the historical spread 29 between CDOR and rates of issuances under its commercial paper program. 30
The 3-Month T-Bill forecast for 2020 and 2021 has been significantly impacted by the COVID-19 31 pandemic and is projected to decrease from 2.05 percent in 2019 to approximately 0.51 percent 32 in 2020 and 0.45 percent in 2021. As noted above, the 2019 short-term interest rate forecast 33 reflects Bankers’ Acceptance issuances by FBC whereas the 2020 and 2021 short-term rates 34 assume FBC exclusively issues commercial paper. For 2020 and 2021, FBC has also forecast 35 other financing fees similarly to 2019, which includes the fees that it incurs for its letters of credit 36 under the $150 million credit facility, as well as interest paid on customer deposits. The short-37 term borrowing rate forecast is shown in Table 8-1 below. 38

FORTISBC INC. ANNUAL REVIEW FOR 2020 AND 2021 RATES
SECTION 8: FINANCING AND RETURN ON EQUITY PAGE 69
Table 8-1: Short Term Interest Rate Forecast 1
2
Notes: 3
1 3-Month T-Bill Rate for 2020 based on a composite of actual historical rates up to June 30, 2020 and forecast 4 rates for the remainder of the year. 5
2 Fixed financing fees represent the costs of maintaining $150 million credit facility and letter of credit facility, which 6 are fixed fees regardless if FBC draws from the credit facility. The fees have been converted into a short-term rate 7 for forecast purposes. 8
3 A standby fee of 20 bps is charged on undrawn credit facility amounts, which would change if credit facility 9 amounts are drawn through banker acceptances or prime loans. However, the forecast assumes FBC will borrow 10 through commercial paper and will not change the undrawn credit facility fee percentage. 11
Interest Expense Forecast 12
The interest expense forecast reflects FBC’s existing and forecast borrowing costs on long- and 13 short-term debt. 14
Short-term interest expense is determined by applying the forecast short-term debt rate to the 15 estimated short-term debt balance. Long-term debt interest expense is determined using the 16 straight-line method by multiplying the average balance of the specific debenture by the debt 17 coupon rate, or forecast coupon rate, if it is a new issue. The 2020 and 2021 long-term debt 18 schedules for FBC can be found in Section 11 – 2020 and Section 11 - 2021, Schedule 27. 19
Allowance for Funds Used During Construction (AFUDC) 20
FBC applies AFUDC to projects that are greater than 3 months in duration and greater than 21 $100 thousand. Based on the above information, FBC’s AFUDC rates for 2020 and 2021 22 (which are equal to its after-tax weighted average cost of capital) are 5.77 percent and 5.76 23 percent, respectively. The calculation of the rates are shown in the following table. 24
Approved Actual Projected Forecasted2019 2019 2020 2021
3-Month T-Bill Rate 1 2.05% 1.79% 0.51% 0.45%Spread to CDOR 0.42% 0.42% 0.44% 0.44%Acceptance Fee Rate 1.00% - - - CDOR Rate 3.47% 2.21% 0.95% 0.89%Spread to CP - -0.17% -0.22% -0.22%CP Dealer Commission - 0.10% 0.10% 0.10%ST Interest Rate on Credit Facilities 3.47% 2.14% 0.83% 0.77%
Fixed Financing Fees 2
Standby fee on Undrawn Credit 3 0.24% 0.34% 0.51% 0.77%Renewal Fee on Undrawn Credit 0.07% 0.14% 0.19% 0.29%Other Financing Fees 0.34% 0.45% 0.33% 0.40%
ST Interest Rate on Fixed Financing Fee 0.65% 0.93% 1.03% 1.45%
FBC Short Term Rate 4.12% 3.07% 1.86% 2.22%
FBC Short Term Interest Rate

FORTISBC INC. ANNUAL REVIEW FOR 2020 AND 2021 RATES
SECTION 8: FINANCING AND RETURN ON EQUITY PAGE 70
Table 8-2: Calculation of AFUDC Rates for 2020 and 2021 1
2
8.4 SUMMARY 3
FBC’s equity financing and ROE have been forecast for 2020 and 2021 at the same 4 percentages as approved for 2019. FBC’s debt financing costs on rate base are primarily 5 determined by embedded rates on long-term debt, and to a lesser degree by short-term debt 6 rates; both of these rates are forecast to decrease in 2020 and 2021 as compared to 2019 7 Approved. 8
Line Pre-Tax After-Tax Earned Pre-Tax After-Tax Earned No. Description Weight Rate Rate Return Weight Rate Rate Return
1 Short Term Debt 4.55% 1.86% 1.36% 1.86% 2.84% 2.22% 1.62% 2.22%2 Long Term Debt 55.45% 5.05% 3.69% 5.05% 57.16% 4.93% 3.60% 4.93%3 Common Equity 40.00% 12.53% 9.15% 9.15% 40.00% 12.53% 9.15% 9.15%4 5 Weighted Average 100.00% 7.90% 5.77% 6.55% 100.00% 7.90% 5.76% 6.54%
2020 2021

FORTISBC INC. ANNUAL REVIEW FOR 2020 AND 2021 RATES
SECTION 9: TAXES PAGE 71
9. TAXES 1
9.1 INTRODUCTION AND OVERVIEW 2
This section discusses FBC’s forecasts of property taxes and income tax which have been 3 forecast on a basis consistent with prior years. In 2020, property taxes are projected to 4 increase by 1.7 percent from 2019 Approved, with a further increase of 7.4 percent in 2021 5 compared to the 2020 Projected amount. Income tax is projected to decrease by 36.9 percent in 6 2020 compared to 2019 Approved, and then increase by 73.7 percent in 2021 compared to the 7 2020 Projected amount. 8
9.2 PROPERTY TAXES 9
Property taxes for 2020 and 2021 of $16.993 million and $18.242 million, respectively, 10 incorporate Company forecasts of assessed values of taxable assets, mill rates and taxes from 11 revenues earned from electricity consumed within municipalities. A breakdown of property 12 taxes by asset type is provided in Table 9-1 below. 13
Table 9-1: Property Taxes ($ millions) 14
15
Projected 2020 property taxes in the table above include actual payments of $16.954 million 16 and projected payments of $0.039 million for the remainder of the year. Property taxes in 2020 17 are projected to increase by 1.7 percent compared to 2019 Approved, with a further forecast 18 increase in 2021 of 7.4 percent compared to 2020 Projected. In general, the 2021 increase 19 from 2020 Projected is primarily due to the increases in rates for transmission and distribution 20 lines. The most significant forecast drivers of the changes are as follows: 21
1. Changes in Tax Rates. Tax Rates are expected to change for 2021 as follows: 22
a) Municipal rates are expected to increase by 0.50 percent; 23
b) School rates are expected to decrease by 2.5 percent to offset assessment 24 increases resulting from the BC Assessment Utility Class model updates; 25
Line Approved Actual Projected ForecastNo. Description 2019 2019 2020 2021
1 Generating Plant 3.082 $ 3.036 $ 3.092 $ 3.087 $ 2 Transmission and Distribution 6.705 6.532 6.756 8.075 3 Substation Equipment 3.741 3.838 3.825 3.843 4 Land and Buildings 1.019 1.092 1.057 1.112 5 In-Lieu 2.166 2.166 2.263 2.125 6 Total Property Taxes 16.713 $ 16.664 $ 16.993 $ 18.242 $ 78 2019 Actual to Approved -0.3%9 2020 Projected Change from 2019 Approved 1.7%
10 2021 Forecast Change from 2020 Projected 7.4%

FORTISBC INC. ANNUAL REVIEW FOR 2020 AND 2021 RATES
SECTION 9: TAXES PAGE 72
c) Rural rates are expected to increase by 1.0 percent; 1
d) Tax rates on First Nations are expected to increase 0.25 percent; and 2
e) Other rates are expected to increase by 1.0 percent. 3
2. Changes in Revenues to Calculate Grants In Lieu of Taxes. Revenues reported to 4 municipalities are expected to decrease by 2.0 percent based on actual revenues to be 5 reported. Grants in-lieu of taxes are based on a fixed percentage of revenues; the 6 overall decrease in revenues reported to municipalities decreases the grants in-lieu of 7 taxes due. 8
3. Changes in Assessed Values. Forecast changes in the assessed values of FBC’s 9 property are based on the increases that BC Assessment was proposing at the time the 10 forecast was developed. These include: 11
a) Distribution lines are expect to increase by 20 percent and transmission lines are 12 expected to increase by 30 percent because of a major review of linear properties by 13 BC Assessment that is expected to be implemented starting in 2021; 14
b) A 2.0 percent increase in assessed values for generating facilities calculated using 15 legislated cost manuals for valuing generating facilities; 16
c) A 2.0 percent increase in assessed values for substations calculated using legislated 17 cost manuals for valuing substations; and 18
d) Land values are expected to increase on average 3.0 percent for both right of ways 19 and properties owned in fee simple. 20
21 Any variances from the forecast of property taxes included in rates will be recorded in the Flow-22 through deferral account and returned to or collected from customers in the following year. 23
9.3 INCOME TAX 24
FBC is subject to corporate income taxes imposed by the Federal and BC governments. 25 Current income taxes have been calculated using the flow-through (taxes payable) method, 26 consistent with BCUC-approved past practice, at the corporate tax rate of 27 percent for 2020 27 and 2021, which is unchanged from 2019. The corporate tax rates used in this Application are 28 based on the Canada Income Tax Act and the BC Income Tax Act enacted legislation and are 29 updated each year as part of the annual rate setting process. 30
Income tax for 2020 is projected to decrease by $2.892 million or 36.9 percent compared to 31 2019 Approved and then increase by $3.636 million or 73.7 percent in 2021 compared to the 32 2020 Projected amount. The 2020 decrease is primarily due to a decrease to adjustments to 33 taxable income from the Federal government’s Accelerated Investment Incentive regime as 34 discussed below, partially offset by increases in rate base and amortization of deferred charges. 35

FORTISBC INC. ANNUAL REVIEW FOR 2020 AND 2021 RATES
SECTION 9: TAXES PAGE 73
In 2021, the income tax increase is primarily due to increases in rate base and amortization of 1 deferred charges. 2
Any tax rate variances and variances in income taxes on items that are flowed through in rates 3 will also be subject to flow-through treatment. 4
All other differences in income tax expense will affect the achieved ROE and be subject to 5 earnings sharing. 6
9.4 ACCELERATED INVESTMENT INCENTIVE 7
On November 21, 2018, the Federal government introduced the Accelerated Investment 8 Incentive regime, which enabled FBC to claim additional Capital Cost Allowance (CCA) 9 deductions in the year of addition for all qualifying expenditures made after November 20, 2018 10 and before January 1, 2028. The impact of the additional CCA deductions has been 11 incorporated in tax forecasts for 2020 and 2021. The benefits of the additional CCA deductions 12 for 2018 and 2019 were included in the Flow-through deferral account and will be returned to 13 customers through amortization of the deferral account balance. 14
9.5 SUMMARY 15
FBC has forecast its property and income taxes on a basis consistent with prior years, utilizing 16 enacted legislation for income taxes and forecast changes for property tax rates and 17 assessments. 18

FORTISBC INC. ANNUAL REVIEW FOR 2020 AND 2021 RATES
SECTION 10: EARNINGS SHARING PAGE 74
10. EARNINGS SHARING 1
In the MRP Decision (at page 82), the BCUC approved an earnings sharing mechanism from 2 2020 to 2024 whereby 50 percent of the achieved ROE above or below the allowed ROE will be 3 shared with customers. 4
As discussed in Section 1.1, FBC is proposing to set 2020 permanent rates at existing interim 5 levels by capturing the revenue requirement difference in the 2018-2019 Revenue Surplus 6 deferral account. The revenue requirement for 2020 includes an amount for earnings sharing 7 related to the Actual 2019 results from the final year of the 2014-2019 PBR Plan, the details of 8 which are discussed in Section 14. 9
As also discussed in Section 1.1, FBC is not projecting any earnings sharing from 2020 to be 10 included in 2021 rates, as FBC anticipates relatively minor formulaic O&M savings in 2020 for a 11 variety of reasons, such as the inclusion of a 0.5 percent X-Factor in the calculation of Formula 12 O&M, as directed by the BCUC in the MRP Decision. Further, FBC has included actual amounts 13 up until June 30, 2020 within its Projected 2020 revenue requirement throughout this 14 Application, and is not projecting any further variances for the remainder of the year from the 15 amounts included in this Application. While many of these items are treated as flow-through and 16 therefore the variances do not impact earnings sharing, certain forecast items, such as Other 17 Revenue and depreciation on regular capital, are subject to earnings sharing. For the foregoing 18 reasons, FBC is not projecting any earnings sharing (i.e., 50 percent of the variance between 19 achieved ROE and allowed ROE) from 2020 to be included in the 2021 rates. An adjustment to 20 include the difference between the projected amount of zero and final actual amounts of 21 earnings sharing from 2020 will be trued-up in 2021 and amortized in 2022 rates. 22

FORTISBC INC. ANNUAL REVIEW FOR 2020 AND 2021 RATES
SECTION 11: FINANCIAL SCHEDULES PAGE 75
11. FINANCIAL SCHEDULES 1
2
3
Description Schedule Reference
Summary Of Rate Change 1 Rate Base
Utility Rate Base 2 Formula Inflation Factors 3 Capital Expenditures 4 Capital Expenditures To Plant Reconciliation 5 Plant In Service Continuity Schedule 6 Accumulated Depreciation Continuity Schedule 7 Schedule Not Applicable 8 Contributions In Aid Of Construction Continuity Schedule 9 Schedule Not Applicable 10 Unamortized Deferred Charges And Amortization - Rate Base 11 Unamortized Deferred Charges And Amortization - Non-Rate Base 12 Working Capital Allowance 13 Cash Working Capital 14 Schedule Not Applicable 15
Revenue RequirementUtility Income And Earned Return 16 Volume And Revenue 17 Revenue At Existing And Revised Rates 18 Cost Of Energy 19 Operating And Maintenance Expense 20 Depreciation And Amortization Expense 21 Property And Sundry Taxes 22 Other Revenue 23 Income Taxes 24 Capital Cost Allowance 25 Return On Capital 26 Embedded Cost Of Long Term Debt 27

FORTISBC INC. FBC Annual Review for 2020 and 2021 Rates Section 11 - 2020
SUMMARY OF RATE CHANGE Schedule 1FOR THE YEAR ENDING DECEMBER 31, 2020($000,000s)
Line 2020No. Particulars Forecast Cross Reference
(1) (2) (3) (4)
1 VOLUME/REVENUE RELATED
2 Customer Growth and Volume 11.866
3 Change in Other Revenue (1.377) 10.489
45 POWER SUPPLY6 Power Purchases (net of customer growth and volume) (6.453) 7 Wheeling 0.532 8 Water Fees 0.503 (5.418) 910 O&M CHANGES11 Gross O&M Change 2.694 12 Capitalized Overhead Change (0.404) 2.290 1314 DEPRECIATION EXPENSE15 Depreciation Rate Change (Depreciation Study) 2.373 16 Depreciation from Net Additions (1.972) 0.401 1718 AMORTIZATION EXPENSE19 CIAC Amortization Rate Change (Depreciation Study) (0.189) 20 CIAC from Net Additions 0.167 21 Deferral Accounts 5.047 5.025
22
23 FINANCING AND RETURN ON EQUITY
24 Financing Rate Changes (2.194)
25 Financing Ratio Changes (0.141)
26 Rate Base Growth 4.706 2.371
2728 TAX EXPENSE29 Property and Other Taxes Changes 0.280 30 Other Income Taxes Changes (2.892) (2.612) 3132 2019 Revenue Surplus (5.633) 33 Deferred 2020 Revenue Deficiency (3.326) 3435 Revenue Deficiency (Surplus) 3.587$ Schedule 16, Line 6, Column 43637 Revenue at Existing Rates 358.668 Schedule 16, Line 5, Column 338 Rate Change 1.00%
Page 76

FORTISBC INC. FBC Annual Review for 2020 and 2021 Rates Section 11 - 2020
UTILITY RATE BASE Schedule 2FOR THE YEAR ENDING DECEMBER 31, 2020($000s)
Line 2019 2020No. Particulars Approved at Revised Rates Change Cross Reference
(1) (2) (3) (4) (5)
1 Plant in Service, Beginning 1 2,040,679$ 2,112,240$ 71,561$ Schedule 6.1, Line 19, Column 3
2 Opening Balance Adjustment 12,007 (47,893) (59,900) Schedule 6.1, Line 19, Columns 4+5
3 Net Additions 66,540 98,457 31,917 Schedule 6.1, Line 19, Columns 6+7+8
4 Plant in Service, Ending 2,119,226 2,162,803 43,577
5
6 Accumulated Depreciation Beginning (631,022)$ (664,986)$ (33,964)$ Schedule 7.1, Line 19, Column 5
7 Opening Balance Adjustment - 72,871 72,871 Schedule 7.1, Line 19, Columns 6+7
8 Net Additions (42,176) (49,153) (6,977) Schedule 7.1, Line 19, Columns 8+9+10+11
9 Accumulated Depreciation Ending (673,198) (641,268) 31,930
10
11 CIAC, Beginning (199,444)$ (209,719)$ (10,275)$ Schedule 9, Line 1, Column 2
12 Opening Balance Adjustment - - -
13 Net Additions (8,876) (11,107) (2,231) Schedule 9, Line 1, Column 4
14 CIAC, Ending (208,320) (220,826) (12,506)
15
16 Accumulated Amortization Beginning - CIAC 71,910$ 75,672$ 3,762$ Schedule 9, Line 3, Column 2
17 Opening Balance Adjustment - - -
18 Net Additions 4,172 4,194 22 Schedule 9, Line 3, Column 4
19 Accumulated Amortization Ending - CIAC 76,082 79,867 3,784
20
21 Net Plant in Service, Mid-Year 1,303,960$ 1,359,381$ 55,420$
22
23 Adjustment for timing of Capital additions 7,170$ 10,214$ 3,044$
24 Capital Work in Progress, No AFUDC 8,921 11,228 2,307
25 Unamortized Deferred Charges 14,480 20,420 5,940 Schedule 11, Line 24, Column 8
26 Working Capital 2,107 5,713 3,606 Schedule 13, Line 16, Column 3
27 Utility Plant Acquistion Adjustment 5,307 5,121 (186)
2829 Mid-Year Utility Rate Base 1,341,945$ 1,412,075$ 70,130$
30
31 Note 1: Pursuant to Order G-9-18, the costs of FBC's Electric Vehicle DCFC stations are excluded from rate base until the Commission directs otherwise.
Page 77

FORTISBC INC. FBC Annual Review for 2020 and 2021 Rates Section 11 - 2020
FORMULA INFLATION FACTORS Schedule 3FOR THE YEAR ENDING DECEMBER 31, 2020($000s)
Line
No. Particulars Reference 2020 Cross Reference(1) (2) (3) (4)
1 Cost Drivers for O&M2 CPI 2.692%3 AWE 2.881%4 Labour Split5 Non Labour 38.000%6 Labour 62.000%7 Inflation Factor for Costs (Line 2 x Line 5) + (Line 3 x Line 6) 2.809%8 Productivity Factor G-166-20 -0.500%9 Net Inflation Factor for Costs Line 7 + Line 8 2.309%
101112 Growth in Average Customer Calculation13 Average Customer - Prior Year 139,916 14 Average Customer Forecast - Test Year Schedule 18, Line 8, Column 6 141,189 15 Average Customer Change Line 14 - Line 13 1,273 16 Customer Growth Factor Multiplier G-166-20 75%17 Change in Customers - Rate Setting Purposes Line 15 x Line 17 955 1819 Average Customer Continuity for Rate Setting Purposes20 Average Customer Forecast - Prior Year Prior Year Line 22 139,916 21 Change in Customers - Rate Setting Purposes Line 17 955 22 Average Customer Forecast - Rate Setting Purposes Line 20 + Line 21 140,871
Page 78

FORTISBC INC. FBC Annual Review for 2020 and 2021 Rates Section 11 - 2020
CAPITAL EXPENDITURES Schedule 4FOR THE YEAR ENDING DECEMBER 31, 2020($000s)
LineNo. 2020 Cross Reference
(2) (3)
1 Forecast Capital Expenditures2 Growth Capital 27,029$ 3 Sustainment Capital 50,463 4 Other Capital 15,752 5 Total Forecast Capital 93,244$ 67 Flow-Through Capital Expenditures -$ 89 Total Regular Capital Expenditures 93,244$
1011 CPCN and Special Projects12 Corra Linn Spillway Gate Replacement 16,768 13 Upper Bonnington Old Units Refurbishment 5,886 14 Grand Forks Terminal Station 4,204 15 Playmor Substation Rebuild Project 483 16 Total CPCN and Special Projects 27,341$ 1718 Total Capital Expenditures Before CIAC 120,585$
Particulars(1)
Page 79

FORTISBC INC. FBC Annual Review for 2020 and 2021 Rates Section 11 - 2020
CAPITAL EXPENDITURES TO PLANT RECONCILIATION Schedule 5FOR THE YEAR ENDING DECEMBER 31, 2020($000s)
Line
No. Particulars 2020 Cross Reference(1) (2) (3)
1 CAPITAL EXPENDITURES23 Forecast Capital Expenditures 93,244 4 Flow-Through Capital Expenditures - 5 Total Regular Capital Expenditures 93,244$ Schedule 4, Column 2, Line 967 CPCN and Special Projects8 Corra Linn Spillway Gate Replacement 16,768 9 Upper Bonnington Old Units Refurbishment 5,886
10 Grand Forks Terminal Station 4,204 11 Playmor Substation Rebuild 483 12 Total CPCN and Special Projects 27,341$ Schedule 4, Column 2, Line 161314 Total Capital Expenditures 120,585$ Schedule 4, Column 2, Line 18151617 RECONCILIATION OF CAPITAL EXPENDITURES TO PLANT1819 Regular Capital Expenditures 93,244$ Line 5, Column 220 Add - Capitalized Overheads 9,284 Schedule 20,- Line 19, Column 421 Add - AFUDC 288
22 Gross Capital Expenditures 102,816$
23 Change in Work in Progress (5,836)
24 Total Additions to Plant 96,981$
25
2627 CPCN and Special Projects 27,341$ Line 12, Column 228 Add - AFUDC 1,960 29 Gross Capital Expenditures 29,301 30 Change in Work in Progress (8,873) 31 Total Additions to Plant 20,428$ 3233 Grand Total Additions to Plant 117,409$ Schedule 6.1, Line 19, Columns 6 + 7
Page 80

FORTISBC INC. FBC Annual Review for 2020 and 2021 Rates Section 11 - 2020
PLANT IN SERVICE CONTINUITY SCHEDULE Schedule 6FOR THE YEAR ENDING DECEMBER 31, 2020($000s)
Opening AmortizationLine Balance AccountingNo. Account Particulars 12/31/19 Adjustment Transition1 CPCNs Additions Retirements 12/31/20 Cross Reference
(1) (2) (3) (4) (5) (6) (7) (8) (9) (10)
1 Hydraulic Production Plant2 330 Land Rights 950$ 12$ -$ -$ -$ -$ 962$ 3 331 Structures and Improvements 19,152 235 - - 615 (88) 19,914 4 332 Reservoirs, Dams & Waterways 37,328 458 - 1,021 2,094 (159) 40,742 5 333 Water Wheels, Turbines and Gen. 107,552 1,320 - 14,299 1,167 (100) 124,237 6 334 Accessory Equipment 46,607 572 - 3,064 1,031 (72) 51,203 7 335 Other Power Plant Equipment 45,095 553 - - 945 (97) 46,497 8 336 Roads, Railroads and Bridges 1,272 16 - - - - 1,287 9 257,956$ 3,165$ -$ 18,384$ 5,852$ (516)$ 284,841$
10 Transmission Plant11 350 Land Rights-R/W 8,899$ 109$ -$ -$ 604$ -$ 9,613$ 12 350.1 Land Rights-Clearing 8,134 100 - - 604 - 8,838 13 353 Station Equipment 237,427 2,913 - 2,043 2,078 (305) 244,155 14 355 Poles Towers & Fixtures 114,556 1,405 - - 3,988 (82) 119,868 15 356 Conductors and Devices 111,692 1,370 - - 3,988 (87) 116,964 16 359 Roads and Trails 1,108 14 - - - - 1,121 17 481,815$ 5,911$ -$ 2,043$ 11,262$ (473)$ 500,559$ 18 Distribution Plant - 19 360 Land Rights-R/W 7,098$ 87$ -$ -$ -$ -$ 7,185$ 20 360.1 Land Rights-Clearing 11,489 141 - - - - 11,630 21 362 Station Equipment 251,685 3,088 - - 14,460 (334) 268,899 22 364 Poles Towers & Fixtures 222,863 2,734 - - 11,961 (564) 236,995 23 365 Conductors and Devices 359,689 4,413 - - 25,790 (641) 389,251 24 368 Line Transformers 172,847 2,121 - - 7,331 (1,484) 180,815 25 369 Services 9,406 115 - - - - 9,521 26 370 Meters 50 1 - - - (1) 50 27 370.1 AMI Meters 40,501 497 - - 140 - 41,137 28 371 Installation on Customers' Premises 927 11 - - - - 938 29 373 Street Lighting and Signal System 13,300 163 - - 865 (144) 14,184 30 1,089,855$ 13,371$ -$ -$ 60,547$ (3,167)$ 1,160,606$
Page 81

FORTISBC INC. FBC Annual Review for 2020 and 2021 Rates Section 11 - 2020
PLANT IN SERVICE CONTINUITY SCHEDULE Schedule 6.1FOR THE YEAR ENDING DECEMBER 31, 2020($000s)
Opening AmortizationLine Balance AccountingNo. Account Particulars 12/31/19 Adjustment Transition1 CPCNs Additions Retirements 12/31/20 Cross Reference
(1) (2) (3) (4) (5) (6) (7) (8) (9) (10)
1 General Plant2 389 Land 10,970$ 135$ -$ -$ -$ -$ 11,105$ 3 390 Structures - Frame & Iron - - - - - - - 4 390.1 Structures - Masonry 44,310 544 - - 1,682 - 46,536 5 390.2 Operation Building 15,364 188 - - 1,682 - 17,235 6 390.1 Leasehold Improvements 2,837 35 - - - - 2,872 7 391 Office Furniture & Equipment 8,101 99 (2,841) - 224 (315) 5,269 8 391.1 Computer Equipment 33,803 415 (20,932) - 3,519 (2,385) 14,419 9 391.2 Computer Software 78,274 960 (39,126) - 5,103 (4,750) 40,461
10 391.2 AMI Software 9,473 116 - - 1,364 - 10,954 11 392.1 Light Duty Vehicles 4,384 54 - - 891 (184) 5,144 12 392.1 Heavy Duty Vehicles 24,773 304 - - 2,078 (1,042) 26,114 13 394 Tools and Work Equipment 14,082 173 (5,187) - 777 (759) 9,086 14 397 Communication Structures & Equipment 17,207 211 (3,188) - 1,999 (3,913) 12,316 15 397.1 Fibre 14,127 173 (2,535) - - (1,448) 10,318 16 397.2 AMI Communications Structure & Equipment 4,909 60 - - - - 4,970 17 282,614$ 3,467$ (73,808)$ -$ 19,319$ (14,795)$ 216,798$ 1819 Total Plant in Service 2,112,240$ 25,915$ (73,808)$ 20,427$ 96,981$ (18,951)$ 2,162,803$ 20 21
222324 Cross Reference Schedule 5 Schedule 5
Line 31 Line 24Column 2 Column 2
Note 1: The amortization method of accounting includes the retirement of assets at the end of the amortization period. A change to amortization accounting was recommended in FBC's 2017 Depreciation Study, which was approved by Order G-166-20.
Page 82

FORTISBC INC. FBC Annual Review for 2020 and 2021 Rates Section 11 - 2020
ACCUMULATED DEPRECIATION CONTINUITY SCHEDULE Schedule 7
FOR THE YEAR ENDING DECEMBER 31, 2020
($000s)
Opening Amortization
Line Gross Plant for Depreciation Balance Accounting Depreciation Cost ofNo. Account Particulars Depreciation Rate 12/31/19 Adjustment Transition1 Expense Retirements Removal Adjustments 12/31/20 Cross Reference
(1) (2) (3) (4) (5) (6) (7) (7) (8) (9) (10) (11) (12)
1 Hydraulic Production Plant
2 330 Land Rights 962$ 1.07% (413)$ (1)$ -$ 10$ -$ -$ -$ (403)$
3 331 Structures and Improvements 19,387 1.68% 4,959 7 - 326 (88) 18 - 5,222
4 332 Reservoirs, Dams & Waterways 38,807 1.90% 4,224 6 - 737 (159) 282 - 5,091
5 333 Water Wheels, Turbines and Gen. 123,171 1.79% 19,819 28 - 2,205 (100) 1,757 - 23,709
6 334 Accessory Equipment 50,243 3.13% 12,309 17 - 1,573 (72) 453 - 14,281
7 335 Other Power Plant Equipment 45,649 2.12% 17,621 25 - 968 (97) - - 18,517
8 336 Roads, Railroads and Bridges 1,287 1.44% 419 1 - 19 - - - 438
9 279,505$ 58,940$ 83$ -$ 5,837$ (516)$ 2,510$ -$ 66,854$
10 Transmission Plant
11 350 Land Rights-R/W 9,008$ 0.00% (0)$ (0)$ -$ -$ -$ -$ -$ (0)$
12 350.1 Land Rights-Clearing 8,234 1.27% 2,148 3 - 105 - - - 2,256
13 353 Station Equipment 242,382 2.33% 87,143 123 - 5,648 (305) 302 - 92,911
14 355 Poles Towers & Fixtures 115,961 2.52% 31,584 45 - 2,922 (82) 419 - 34,888
15 356 Conductors and Devices 113,062 2.52% 25,343 36 - 2,849 (87) 465 - 28,606
16 359 Roads and Trails 1,121 1.96% 369 1 - 22 - - - 391
17 489,769$ 146,587$ 207$ -$ 11,545$ (473)$ 1,186$ -$ 159,052$
18 Distribution Plant
19 360 Land Rights-R/W 7,185$ 0.00% -$ -$ -$ -$ -$ -$ -$ -$
20 360.1 Land Rights-Clearing 11,630 1.25% 2,499 4 - 145 - - - 2,648
21 362 Station Equipment 254,773 2.61% 75,088 106 - 6,650 (334) 155 - 81,665
22 364 Poles Towers & Fixtures 225,597 2.73% 64,709 91 - 6,159 (564) 790 - 71,185
23 365 Conductors and Devices 364,102 2.38% 107,926 152 - 8,666 (641) 1,274 - 117,377
24 368 Line Transformers 174,968 3.13% 36,822 52 - 5,476 (1,484) 1,312 - 42,178
25 369 Services 9,521 0.51% 6,660 9 - 49 - - - 6,718
26 370 Meters 50 6.68% 1,229 2 - 3 (1) - - 1,234
27 370.1 AMI Meters 40,998 6.25% 3,945 6 - 2,562 - - - 6,513
28 371 Installation on Customers' Premises 938 0.00% 937 1 - - - - - 938
29 373 Street Lighting and Signal System 13,463 4.95% 4,499 6 - 666 (144) - - 5,028
30 1,103,226$ 304,315$ 429$ -$ 30,377$ (3,167)$ 3,530$ -$ 335,484$
Page 83

FORTISBC INC. FBC Annual Review for 2020 and 2021 Rates Section 11 - 2020
ACCUMULATED DEPRECIATION CONTINUITY SCHEDULE Schedule 7.1
FOR THE YEAR ENDING DECEMBER 31, 2020
($000s)
Opening Amortization
Line Gross Plant for Depreciation Balance Accounting Depreciation Cost ofNo. Account Particulars Depreciation Rate 12/31/19 Adjustment Transition1 Expense Retirements Removal Adjustments 12/31/20 Cross Reference
(1) (2) (3) (4) (5) (6) (7) (8) (9) (10) (11) (12) (13)
1 General Plant
2 389 Land 11,105$ 0.00% 34$ 0$ -$ -$ -$ -$ -$ 34$
3 390 Structures - Frame & Iron - 0.56% - - - - - - - -
4 390.1 Structures - Masonry 44,853 2.53% 9,610 14 - 1,135 - - - 10,758
5 390.2 Operation Building 15,552 1.63% 6,285 9 - 254 - - - 6,548
6 390.1 Leasehold Improvements 2,872 1.63% 2,559 4 - 47 - - - 2,610
7 391 Office Furniture & Equipment 5,360 4.42% 4,441 6 (2,841) 237 (315) - - 1,528
8 391.1 Computer Equipment 13,285 21.60% 26,861 38 (20,932) 2,870 (2,385) - - 6,450
9 391.2 Computer Software 40,108 8.96% 58,084 82 (39,126) 3,594 (4,750) - - 17,884
10 391.2 AMI Software 9,590 10.00% 4,346 6 - 959 - - - 5,311
11 392.1 Light Duty Vehicles 4,437 3.81% 3,170 4 - 169 (184) 45 - 3,204
12 392.1 Heavy Duty Vehicles 25,077 6.50% 5,811 8 - 1,630 (1,042) 105 - 6,513
13 394 Tools and Work Equipment 9,067 4.11% 10,131 14 (5,187) 373 (759) - - 4,572
14 397 Communication Structures & Equipment 14,230 3.44% 13,616 19 (3,188) 490 (3,913) 62 - 7,086
15 397.1 Fibre 11,766 6.97% 8,799 12 (2,535) 820 (1,448) - - 5,650
16 397.2 AMI Communications Structure & Equipment 4,970 6.67% 1,397 2 - 331 - - - 1,730
17 212,273$ 155,143$ 219$ (73,808)$ 12,907$ (14,795)$ 212$ -$ 79,878$
18
19 108 Total Accumulated Depreciation 2,084,774$ 664,986$ 937$ (73,808)$ 60,666$ (18,951)$ 7,438$ -$ 641,268$
202122 1Explanation2324 Cross Reference Schedule 6.1
Line 19Columns 3+4+5+6
Page 84

FORTISBC INC. FBC Annual Review for 2020 and 2021 Rates Section 11 - 2020
Schedule 8
SCHEDULE NOT APPLICABLE
Page 85

FORTISBC INC. FBC Annual Review for 2020 and 2021 Rates Section 11 - 2020
CONTRIBUTIONS IN AID OF CONSTRUCTION CONTINUITY SCHEDULE Schedule 9FOR THE YEAR ENDING DECEMBER 31, 2020($000s)
LineNo. Particulars 12/31/19 Adjustment Additions Retirements 12/31/20 Cross Reference
(1) (2) (3) (4) (5) (6) (7)
1 CIAC 209,719$ -$ 11,107$ -$ 220,826$
2
3 Amortization (75,672) - (4,194) - (79,867)
45 Net CIAC 134,047$ -$ 6,913$ -$ 140,959$
Page 86

FORTISBC INC. FBC Annual Review for 2020 and 2021 Rates Section 11 - 2020
Schedule 10
SCHEDULE NOT APPLICABLE
Page 87

FORTISBC INC. FBC Annual Review for 2020 and 2021 Rates Section 11 - 2020
UNAMORTIZED DEFERRED CHARGES AND AMORTIZATION - RATE BASE Schedule 11FOR THE YEAR ENDING DECEMBER 31, 2020($000s)
Line Opening Bal./ Gross Less Amortization Mid-YearNo. Particulars 12/31/19 Transfer/Adj. Additions Taxes Expense 12/31/20 Average Cross Reference
(1) (2) (3) (4) (5) (6) (7) (8) (9)
1 1. Forecasting Variance Accounts -$ -$ -$ -$ -$ -$ -$ 23 2. Rate Smoothing Accounts -$ -$ -$ -$ -$ -$ -$ 45 3. Benefits Matching Accounts6 Demand Side Management 27,369$ -$ 10,600$ (2,862)$ (4,532)$ 30,576$ 28,972$ 7 Deferred Debt Issue Costs 3,352 - 625 (63) (160) 3,754 3,553 8 Preliminary and Investigative Charges 825 - 650 - - 1,476 1,150 Note 19 Annual Reviews for 2020 -2024 Rates - - 140 (38) - 102 51 10 2020 Cost of Service Analysis - - 80 (22) - 58 29 11 2021 Long-Term Electric Resource Plan - 19 235 (63) - 190 104 12 BCUC-Initiated Inquiry Costs - 87 176 (48) - 215 151 13 MRS 2021 Audit - - - - - - - 14 31,546$ 105$ 12,507$ (3,096)$ (4,691)$ 36,372$ 34,012$ 1516 4. Retroactive Expense Accounts - - - - - - - 1718 5. Other Accounts19 Pension and OPEB Liability (14,253)$ -$ 196$ -$ -$ (14,057)$ (14,155)$ 20 Indigenous Relations Agreement (Huth Substation) - - - - - - - 21 COVID-19 Customer Recovery Fund - - 1,386 (260) - 1,126 563 22 (14,253)$ -$ 1,582$ (260)$ -$ (12,931)$ (13,592)$ 2324 Total Rate Base Deferral Accounts 17,293$ 105$ 14,089$ (3,355)$ (4,691)$ 23,441$ 20,420$ 25
26Note 1: Gross additions for Preliminary and Investigative Charges are after transfers to Construction Work in Progress. Additions of $1.339 million - transfers of $0.689 million = $0.650 million.
Page 88

FORTISBC INC. FBC Annual Review for 2020 and 2021 Rates Section 11 - 2020
UNAMORTIZED DEFERRED CHARGES AND AMORTIZATION - NON-RATE BASE Schedule 12FOR THE YEAR ENDING DECEMBER 31, 2020($000s)
Line Opening Bal./ Gross Less Amortization Mid-YearNo. Particulars 12/31/19 Transfer/Adj. Additions Taxes Expense 12/31/20 Average Cross Reference
(1) (2) (3) (4) (5) (6) (7) (8) (9)
1 Deferral Accounts Financed at Short Term Interest Rate23 1. Forecasting Variance Accounts4 2014-2019 Flow-Through Accounts (7,429)$ -$ (46)$ -$ 7,475$ -$ (3,715)$ 5 Pension & Other Post Retirement Benefits (OPEB) Variance (1,927) - - - 779 (1,148) (1,538) 6 (9,356)$ -$ (46)$ -$ 8,254$ (1,148)$ (5,252)$ 78 2. Rate Smoothing Accounts -$ -$ -$ -$ -$ -$ -$ 9
10 3. Benefits Matching Accounts11 Annual Reviews for 2015-2019 Rates (14)$ -$ -$ -$ 14$ -$ (7)$ 12 Self-Generation Policy Application, Stage II 108 - - - (108) - 54 13 Net Metering Program Tariff Update 2 - - - (2) - 1 14 2018 Demand Side Management Expenditure Schedule Application 2 - - - (2) - 1 15 98$ -$ -$ -$ (98)$ -$ 49$ 1617 4. Retroactive Expense Accounts -$ -$ -$ -$ -$ -$ -$ 1819 5. Other Accounts20 2014-2019 Earnings Sharing Account 145$ -$ 52$ (14)$ (183)$ -$ 72$ 21 BC Hydro Waneta 2017 Transactions 19 - - - (19) - 9 22 164$ -$ 52$ (14)$ (202)$ -$ 82$ 2324 Total Deferral Accounts at Short Term Interest (9,094)$ -$ 6$ (14)$ 7,954$ (1,148)$ (5,121)$ 2526 Financing Costs at STI (90)$ -$ (96)$ -$ 90$ (96)$ (93)$
Page 89

FORTISBC INC. FBC Annual Review for 2020 and 2021 Rates Section 11 - 2020
UNAMORTIZED DEFERRED CHARGES AND AMORTIZATION - NON-RATE BASE cont'd Schedule 12.1 FOR THE YEAR ENDING DECEMBER 31, 2020($000s)
Line Opening Bal./ Gross Less Amortization Mid-YearNo. Particulars 12/31/19 Transfer/Adj. Additions Taxes Expense 12/31/20 Average Cross Reference
(1) (2) (3) (4) (5) (6) (7) (8) (9)
1 Deferral Accounts Financed at Weighted Average Cost of Debt23 1. Forecasting Variance Accounts -$ -$ -$ -$ -$ -$ -$ 45 2. Rate Smoothing Accounts6 2018 - 2019 Revenue Surplus (3,458)$ -$ 3,326$ (898)$ -$ (1,030)$ (2,244)$ 78 3. Benefits Matching Accounts9 CPCN Projects Preliminary Engineering1 166$ -$ 264$ -$ -$ 430$ 298$ 10 2016 Long Term Electric Resource Plan 310 - - - (103) 207 258 11 2017 Rate Design Application 590 - - - (118) 472 531 12 2020 - 2024 Multi-Year Rate Plan Application 589 - 115 (31) (135) 539 564 13 2019 - 2022 Multi-Year DSM Expenditure Schedule 108 - - - (36) 72 90 14 2018 Joint Pole Use Audit 79 - - - (26) 53 66 15 EV Charging Stations Rate Design and Tariff Application 13 - 80 (34) - 59 36 16 1,855$ -$ 459$ (65)$ (418)$ 1,831$ 1,842$ 1718 4. Retroactive Expense Accounts -$ -$ -$ -$ -$ -$ -$ 1920 5. Other Accounts21 US GAAP Pension and OPEB Transitional Obligation 1,389$ -$ (347)$ -$ -$ 1,042$ 1,215$ 22 Advanced Metering Infrastructure Radio-Off Shortfall 97 - - - (24) 72 85 23 1,486$ -$ (347)$ -$ (24)$ 1,114$ 1,300$ 242526 Total Deferral Accounts at Weighted Average Cost of Debt (117)$ -$ 3,438$ (963)$ (442)$ 1,915$ 899$ 2728 Financing Costs at WACD 151$ -$ 47$ -$ (151)$ 47$ 99$ 29
30 Note 1: Gross additions for CPCN Projects Preliminary Engineering after transfers to Construction Work in Progress.
Page 90

FORTISBC INC. FBC Annual Review for 2020 and 2021 Rates Section 11 - 2020
UNAMORTIZED DEFERRED CHARGES AND AMORTIZATION - NON-RATE BASE cont'd Schedule 12.2 FOR THE YEAR ENDING DECEMBER 31, 2020($000s)
Line Opening Bal./ Gross Less Amortization Mid-YearNo. Particulars 12/31/19 Transfer/Adj. Additions Taxes Expense 12/31/20 Average Cross Reference
(1) (2) (3) (4) (5) (6) (7) (8) (9)
1 Deferral Accounts Financed at Weighted Average Cost of Capital23 1. Forecasting Variance Accounts4 2020 - 2024 Flow-Through Deferral Account -$ -$ -$ -$ -$ -$ -$ 56 2. Rate Smoothing Accounts78 3. Benefit Matching Accounts9 On Bill Financing (OBF) Participant Loans 5$ -$ (1)$ -$ -$ 4$ 4$
1011 4. Other12 MRP Earnings Sharing Account -$ -$ -$ -$ -$ -$ -$ 1314 Total Deferral Accounts at Weighted Average Cost of Capital 5$ -$ (1)$ -$ -$ 4$ 4$ 1516 Financing Costs at AFUDC 1$ -$ 0$ (0)$ (1)$ 0$ 1$ 1718 Deferral Accounts Non-Interest Bearing 50$ -$ -$ -$ -$ 50$ 50$ 1920 Total Non Rate Base Deferral Accounts (including financing) (9,094)$ -$ 3,395$ (977)$ 7,450$ 772$ (4,162)$
Page 91

FORTISBC INC. FBC Annual Review for 2020 and 2021 Rates Section 11 - 2020
WORKING CAPITAL ALLOWANCE Schedule 13FOR THE YEAR ENDING DECEMBER 31, 2020($000s)
Line 2019 2020No. Particulars Approved Forecast Change Cross Reference
(1) (2) (3) (4) (5)
1 Cash Working Capital2 Cash Working Capital 5,077$ 6,393$ 1,316$ Schedule 14, Line 35, Column 534 Add: Funds Unavailable5 Customer Loans 470 470 - 6 Employee Loans 350 340 (10) 7 Uncollectible Accounts 2,000 - (2,000) 8 Inventory (average monthly investment) 650 630 (20) 910 Less: Funds Available11 Average Customer Deposits (5,470) 5,470 12 Average Employee Withholdings (2,120) (2,120) 13 Average Provincial Sales Tax (600) - 600 14 Average Goods and Services Tax (370) - 370 1516 Total 2,107$ 5,713$ 3,606$ 1718 Note: Uncollectible Accounts and Goods and Services Tax included in Cash Working Capital calculation (Schedule 14) beginning in 2020.
Page 92

FORTISBC INC. FBC Annual Review for 2020 and 2021 Rates Section 11 - 2020
CASH WORKING CAPITAL Schedule 14FOR THE YEAR ENDING DECEMBER 31, 2020($000s)
WeightedLine 2020 Lag (Lead) AverageNo. Particulars at Revised Rates Days Extended Lag (Lead) Days Cross Reference
(1) (2) (3) (4) (5) (6)
1 REVENUE2 Sales Revenue3 Residential Tariff Revenue 180,351$ 56.0 10,100$ 4 Commercial Tariff Revenue 90,083 45.1 4,063 5 Wholesale Tariff Revenue 48,417 37.5 1,816 6 Industrial Tariff Revenue 37,965 38.0 1,443 7 Lighting Tariff Revenue 2,241 34.6 78 8 Irrigation Tariff Revenue 3,198 47.0 150 910 Other Revenue11 Apparatus and Facilities Rental 5,843 90.0 526 12 Contract Revenue 2,305 62.2 143 13 Transmission Revenue 1,496 65.2 98 14 Late Payment Charges 205 54.0 11 15 Connection Charge 394 30.5 12 16 Other Recoveries 402 63.4 25 1718 Total 372,900$ 18,464$ 49.5 1920 EXPENSES21 Power Purchases 138,612$ 51.5 7,139 22 Wheeling 5,767 46.9 270 23 Water Fees 10,968 1.4 15 24 Operating & Maintenance 52,611 28.6 1,505 25 Property Taxes 16,993 4.9 83
26 GST 8,212 45.4 373
27 Income Tax 4,935 15.2 75
28
29 Total 238,098$ 9,460$ (39.7)
30
31 Net Lag (Lead) Days 9.8
32
33 Total Expenses 238,098$
34
35 Cash Working Capital 6,393$
Page 93

FORTISBC INC. FBC Annual Review for 2020 and 2021 Rates Section 11 - 2020
Schedule 15
SCHEDULE NOT APPLICABLE
Page 94

FORTISBC INC. FBC Annual Review for 2020 and 2021 Rates Section 11 - 2020
UTILITY INCOME AND EARNED RETURN Schedule 16FOR THE YEAR ENDING DECEMBER 31, 2020($000s)
Line 2019 2020 ForecastNo. Particulars Approved at Existing Rates Revised Revenue at Revised Rates Change Cross Reference
(1) (2) (3) (4) (5) (6) (7)
1 ENERGY VOLUMES2 Sales Volume (GWh) 3,319 3,272 3,272 (47) Schedule 17, Line 9, Column 334 REVENUE5 Sales 370,534$ 358,668$ -$ 358,668$ (11,866)$ Schedule 17, Line 19, Column 36 Deficiency (Surplus) - - 3,587 3,587 3,587 7 Total 370,534 358,668 3,587 362,255 (8,279) Schedule 18, Line 8, Column 589 EXPENSES
10 Cost of Energy 160,765 155,347 - 155,347 (5,418) Schedule 19, Line 33, Column 311 O&M Expense (net) 50,321 52,611 - 52,611 2,290 Schedule 20, Line 20, Column 412 Depreciation & Amortization 48,473 53,899 - 53,899 5,426 Schedule 21, Line 11, Column 313 Property Taxes 16,713 16,993 - 16,993 280 Schedule 22, Line 7, Column 314 Other Revenue (9,268) (10,645) - (10,645) (1,377) Schedule 23, Line 9, Column 315 Deferred 2019 Revenue Surplus / 2020 Revenue Deficiency 5,633 (3,326) - (3,326) (8,959) 16 Utility Income Before Income Taxes 97,897 93,788 3,587 97,377 (520) 1718 Income Taxes 7,827 3,966 969 4,935 (2,892) Schedule 24, Line 13, Column 31920 EARNED RETURN 90,071$ 89,822$ 2,619$ 92,442$ 2,371$ Schedule 26, Line 5, Column 7
2122 UTILITY RATE BASE 1,341,649$ 1,412,075$ 1,412,075$ 70,426$ Schedule 2, Line 29, Column 323 RATE OF RETURN ON UTILITY RATE BASE 6.71% 6.36% 6.55% -0.16% Schedule 26, Line 5, Column 6
Page 95

FORTISBC INC. FBC Annual Review for 2020 and 2021 Rates Section 11 - 2020
VOLUME AND REVENUE Schedule 17FOR THE YEAR ENDING DECEMBER 31, 2020($000s)
Line 2019 2020No. Particulars Approved Projected Change Cross Reference
(1) (2) (3) (4) (5)
1 ENERGY VOLUME SOLD (GWh)2 Residential 1,349 1,289 (60) 3 Commercial 935 899 (36) 4 Wholesale 594 573 (21) 5 Industrial 385 464 79 6 Lighting 13 10 (3) 7 Irrigation 42 37 (5) 89 Total 3,319 3,272 (47)
1011 REVENUE AT EXISTING RATES12 Residential 187,887$ 178,565$ (9,322)$ 13 Commercial 94,508 89,191 (5,317) 14 Wholesale 49,519 47,938 (1,581) 15 Industrial 32,414 37,589 5,175 16 Lighting 2,661 2,219 (442) 17 Irrigation 3,544 3,166 (378) 1819 Total 370,534$ 358,668$ (11,865)$
Page 96

FORTISBC INC. FBC Annual Review for 2020 and 2021 Rates Section 11 - 2020
REVENUE AT EXISTING AND REVISED RATES Schedule 18FOR THE YEAR ENDING DECEMBER 31, 2020($000s)
2019 2020 Forecast AverageLine Approved Revenue at Effective Revenue at Number ofNo. Particulars Revenue Existing Rates Increase Revised Rates Customers GWh Cross Reference
(1) (2) (3) (4) (5) (6) (7) (8)
1 Residential 187,887$ 178,565$ 1,786$ 180,351$ 122,412 1,289 2 Commercial 94,508 89,191 892 90,083 16,187 899 3 Wholesale 49,519 47,938 479 48,417 6 573 4 Industrial 32,414 37,589 376 37,965 54 464 5 Lighting 2,661 2,219 22 2,241 1,446 10 6 Irrigation 3,544 3,166 32 3,198 1,084 37 78 Total 370,534$ 358,668$ 3,587$ 362,255$ 141,189 3,272 910 Effective Increase 1.00%
Page 97

FORTISBC INC. FBC Annual Review for 2020 and 2021 Rates Section 11 - 2020
COST OF ENERGY Schedule 19FOR THE YEAR ENDING DECEMBER 31, 2020($000s)
Line 2019 2020No. Particulars Approved Projected Change Cross Reference
(1) (2) (3) (4) (5)
1 POWER PURCHASES2 Gross Load (GWh) 3,602 3,562 (40) 34 Power Purchase Expense5 Brilliant 41,865$ 41,505$ (360)$ 6 BC Hydro PPA 52,174 42,088 (10,085) 7 Waneta Expansion 40,221 40,250 30 8 Market and Contracted Producers 10,637 14,617 3,980 9 Independent Power Producers 76 62 (14) 10 Self-Generators 93 110 17 11 CPA Balancing Pool - 18 18 12 Special and Accounting Adjustments - (39) (39) 13 Total 145,065$ 138,612$ (6,453)$ 1415 Note 1: No cost is associated with loss recoveries, which are physically delivered to FBC.1617 WHEELING18 Wheeling Nomination (MW months)19 Okanagan Point of Interconnection 2,400 2,400 - 20 Creston 471 438 (33) 2122 Wheeling Expense23 Okanagan Point of Interconnect 4,514$ 4,633$ 119$ 24 Creston 577 551 (26) 25 Other 144 583 439 26 Total 5,235$ 5,767$ 532$ 2728 WATER FEES29 Plant Entitlement Use in previous year (GWh) 1,574 1,604 30 3031 Water Fees 10,465$ 10,968$ 503$ 3233 Total 160,765$ 155,347$ (5,418)$
Page 98

FORTISBC INC. FBC Annual Review for 2020 and 2021 Rates Section 11 - 2020
OPERATING AND MAINTENANCE EXPENSE Schedule 20FOR THE YEAR ENDING DECEMBER 31, 2020($000s)
Line Formula Forecast TotalNo. Particulars O&M O&M O&M Cross Reference
(1) (2) (3) (4) (5)
1 Inflation Indexed O&M2 2019 Base Unit Cost 412$ 3 Net Inflation Factor 2.309% Schedule 3, Line 9, Column 34 Unit Cost O&M 422$ Line 2 x (1 + Line 3)56 2020 Average Customer Forecast - Rate Setting Purposes 140,871 Schedule 3, Line 22, Column 378 2020 Inflation Indexed O&M 59,447$ 59,447$ Line 4 x Line 6 / 10009
10 O&M Tracked Outside of Formula11 Pension & OPEB (O&M Portion) 470$ 12 Insurance Premiums 1,691 13 Upper Bonnington Old Unit Inspections (43) 14 BCUC levies 330 15 Total 2,448$ 2,448 1617 Total Gross O&M 61,895$ 1819 Capitalized Overhead - 15% of Total Gross O&M (9,284) 20 Net O&M Expense 52,611$
Page 99

FORTISBC INC. FBC Annual Review for 2020 and 2021 Rates Section 11 - 2020
DEPRECIATION AND AMORTIZATION EXPENSE Schedule 21FOR THE YEAR ENDING DECEMBER 31, 2020($000s)
Line 2019 2020No. Particulars Approved Forecast Change Cross Reference
(1) (2) (3) (4) (5)
1 Depreciation2 Depreciation Expense 60,265$ 60,666$ 401$ Schedule 7.1, Line 19, Column 834 Amortization5 Rate Base deferrals 5,313$ 4,691$ (622)$ Schedule 11, Line 24, Column 66 Non-Rate Base deferrals (13,119) (7,450) 5,669 Schedule 12.2 , Line 20, Column 67 Utility Plant Acquisition Adjustment 186 186 - 8 CIAC (4,172) (4,194) (22) Schedule 9, Line 3, Column 49 (11,792) (6,767) 5,025 1011 Total 48,473$ 53,899$ 5,426$
Page 100

FORTISBC INC. FBC Annual Review for 2020 and 2021 Rates Section 11 - 2020
PROPERTY AND SUNDRY TAXES Schedule 22FOR THE YEAR ENDING DECEMBER 31, 2020($000s)
Line 2019 2020No. Particulars Approved Forecast Change Cross Reference
(1) (2) (3) (4) (5)
1 Generating Plant 3,082$ 3,092$ 10$ 2 Transmission and Distribution 6,705 6,756 51 3 Substation Equipment 3,741 3,825 84 4 Land and Buildings 1,019 1,057 38 5 1% In-Lieu of Municipal Taxes 2,166 2,263 97 67 Total 16,713$ 16,993$ 280$
Page 101

FORTISBC INC. FBC Annual Review for 2020 and 2021 Rates Section 11 - 2020
OTHER REVENUE Schedule 23FOR THE YEAR ENDING DECEMBER 31, 2020($000s)
Line 2019 2020No. Particulars Approved Forecast Change Cross Reference
(1) (2) (3) (4) (5)
1 Apparatus and Facilities Rental 4,878$ 5,843$ 965$ 2 Contract Revenue 1,766 2,305 539 3 Transmission Access Revenue 1,230 1,496 266 4 Interest Income 16 20 4 5 Late Payment Charges 861 205 (656) 6 Connection Charge 376 394 18 7 Other Recoveries 142 382 240 89 Total 9,268$ 10,645$ 1,377$
Page 102

FORTISBC INC. FBC Annual Review for 2020 and 2021 Rates Section 11 - 2020
INCOME TAXES Schedule 24FOR THE YEAR ENDING DECEMBER 31, 2020($000s)
Line 2019 2020No. Particulars Approved Forecast Change Cross Reference
(1) (2) (3) (4) (5)
1 EARNED RETURN 90,071$ 92,442$ 2,371$ Schedule 16, Line 20, Column 52 Deduct: Interest on Debt (40,956) (40,760) 196 Schedule 26, Lines 1+2, Column 7
3 Adjustments to Taxable Income (27,954) (38,340) (10,386) Schedule 24, Line 30, Column 3
4 Accounting Income After Tax 21,161$ 13,342$ (7,819)$
5
6 1 - Current Income Tax Rate 73.00% 73.00% 0.00%
7 Taxable Income 28,988$ 18,276$ (10,712)$
8
9 Current Income Tax Rate 27.00% 27.00% 0.00%
10 Income Tax - Current 7,827$ 4,935$ (2,892)$
11
12 Previous Year Adjustment - - -
13 Total Income Tax 7,827$ 4,935$ (2,892)$
14
15
16 ADJUSTMENTS TO TAXABLE INCOME
17 Addbacks:
18 Depreciation 60,265$ 60,666$ 401$ Schedule 21, Line 2, Column 3
19 Amortization of Deferred Charges (7,806) (2,759) 5,047 Schedule 21, Lines 5+6, Column 3
20 Amortization of Utility Plant Acquisition Adjustment 186 186 - Schedule 21, Line 7, Column 3
21 Pension & OPEB Expense 5,304 4,524 (780)
22
23 Deductions:
24 Capital Cost Allowance (67,203) (80,952) (13,749) Schedule 25, Line 20, Column 6
25 CIAC Amortization (4,172) (4,194) (22) Schedule 21, Line 8, Column 3
26 Pension & OPEB Contributions (5,537) (5,216) 321
27 Overheads Capitalized Expensed for Tax Purposes (8,880) (9,284) (404) Schedule 20, Line 19, Column 4
28 Removal Costs - (1,200) (1,200)
29 All Other (111) (111) -
30 Total (27,954)$ (38,340)$ (10,386)$
Page 103

FORTISBC INC. FBC Annual Review for 2020 and 2021 Rates Section 11 - 2020
CAPITAL COST ALLOWANCE Schedule 25FOR THE YEAR ENDING DECEMBER 31, 2020($000s)
Line CCA 12/31/2019 2020 2020 12/31/2020No. Class Rate UCC Balance Adjustments Additions CCA UCC Balance
(1) (2) (3) (4) (5) (6) (7)
1 1(a) 4% 174,159 $ - $ - $ (6,966) $ 167,193 $
2 1(b) 6% 32,636 - 3,060 (2,234) 33,463
3 2 6% 13,729 - - (824) 12,905
4 3 5% 756 - - (38) 718
5 6 10% 4 - - (0) 3
6 8 20% 4,412 - 911 (1,156) 4,167
7 9 25% - - - - -
8 10 30% 4,642 - 2,700 (2,608) 4,735
9 12 100% - - - - -
10 13 0% 11 - - - 11
11 14.1 5% 8,430 - - (421) 8,008
12 14.1 7% 1,433 - 1,099 (216) 2,317
13 17 8% 115,437 - 21,711 (11,840) 125,308
14 42 12% 6,381 - 1,818 (1,093) 7,106
15 45 45% 3 - - (1) 2
16 46 30% 7,896 - - (2,369) 5,527
17 47 8% 446,849 - 54,397 (42,276) 458,971
18 50 55% 2,579 - 9,081 (8,910) 2,750
19
20 Total 819,358 $ - $ 94,776 $ (80,952) $ 833,183 $
Page 104

FORTISBC INC. FBC Annual Review for 2020 and 2021 Rates Section 11 - 2020
RETURN ON CAPITAL Schedule 26FOR THE YEAR ENDING DECEMBER 31, 2020($000s)
2019 Average EarnedLine Approved Embedded Cost Earned ReturnNo. Particulars Earned Return Amount Ratio Cost Component Return Change Cross Reference
(1) (2) (3) (4) (5) (6) (7) (8) (9)
1 Long Term Debt 38,068$ 783,000$ 55.45% 5.05% 2.80% 39,565$ 1,498$ Schedule 27, Line 10, Column 62 Short Term Debt 2,888 64,245 4.55% 1.86% 0.08% 1,195 (1,693) 3 Common Equity 49,115 564,830 40.00% 9.15% 3.66% 51,682 2,567 45 Total 90,071$ 1,412,075$ 100.00% 6.55% 92,442$ 2,372$ 67 Cross Reference Schedule 2
Line 29Column 3
2020
Page 105

FORTISBC INC. FBC Annual Review for 2020 and 2021 Rates Section 11 - 2020
EMBEDDED COST OF LONG TERM DEBT Schedule 27FOR THE YEAR ENDING DECEMBER 31, 2020($000s)
AverageLine Issue Maturity Principal Interest InterestNo. Particulars Date Date Outstanding Rate Expense Cross Reference
(1) (2) (3) (4) (5) (6) (7)
1 Series G August 28, 1993 August 28, 2023 25,000$ 8.800% 2,200$ 2 Series I December 1, 1997 December 1, 2021 25,000 7.810% 1,953 3 Series 1 - 05 November 9, 2005 November 9, 2035 100,000 5.600% 5,600 4 Series 1 - 07 July 4, 2007 July 4, 2047 105,000 5.900% 6,195 5 MTN - 09 June 2, 2009 June 2, 2039 105,000 6.100% 6,405 6 MTN - 10 November 24, 2010 November 24, 2050 100,000 5.000% 5,000 7 MTN - 14 October 28, 2014 October 28, 2044 200,000 4.000% 8,000 8 MTN - 17 December 4, 2017 December 6, 2049 75,000 3.620% 2,715 9 MTN - 20 May 11, 2020 May 11, 2050 48,000 3.120% 1,498
10 Total 783,000$ 39,565$ 1112 Average Embedded Cost 5.05%
Page 106

FORTISBC INC. FBC Annual Review for 2020 and 2021 Rates Section 11 - 2021
SUMMARY OF RATE CHANGE Schedule 1FOR THE YEAR ENDING DECEMBER 31, 2021($000,000s)
Line 2021No. Particulars Forecast Cross Reference
(1) (2) (3) (4)
1 VOLUME/REVENUE RELATED
2 Customer Growth and Volume (7.388)
3 Change in Other Revenue (1.576) (8.964)
45 POWER SUPPLY6 Power Purchases (net of customer growth and volume) 7.648 7 Wheeling 0.016 8 Water Fees 0.077 7.742 9
10 O&M CHANGES11 Gross O&M Change 3.219 12 Capitalized Overhead Change (0.483) 2.736 1314 DEPRECIATION EXPENSE15 Depreciation from Net Additions 3.123 3.123 1617 AMORTIZATION EXPENSE18 CIAC from Net Additions (0.223) 19 Deferral Accounts 7.982 7.759
20
21 FINANCING AND RETURN ON EQUITY
22 Financing Rate Changes (0.049)
23 Financing Ratio Changes (0.005)
24 Rate Base Growth 4.400 4.346
2526 TAX EXPENSE27 Property and Other Taxes Changes 1.249 28 Other Income Taxes Changes 3.636 4.885 2930 2020 Revenue Deficiency 3.326 31 2021 Revenue Deficiency (1.410) 3233 Revenue Deficiency (Surplus) 23.543$ Schedule 16, Line 6, Column 43435 Revenue at Existing Rates 369.643 Schedule 16, Line 5, Column 336 Rate Change 6.37%
Page 107

FORTISBC INC. FBC Annual Review for 2020 and 2021 Rates Section 11 - 2021
UTILITY RATE BASE Schedule 2FOR THE YEAR ENDING DECEMBER 31, 2021($000s)
Line 2020 2021No. Particulars Projected at Revised Rates Change Cross Reference
(1) (2) (3) (4) (5)
1 Plant in Service, Beginning 1 2,112,240$ 2,162,803$ 50,564$ Schedule 6.1, Line 19, Column 3
2 Opening Balance Adjustment (47,893) - 47,893 Schedule 6.1, Line 19, Column 4
3 Net Additions 98,457 126,798 28,341 Schedule 6.1, Line 19, Columns 5+6+7
4 Plant in Service, Ending 2,162,803 2,289,601 126,798
5
6 Accumulated Depreciation Beginning (664,986)$ (641,268)$ 23,718$ Schedule 7.1, Line 19, Column 5
7 Opening Balance Adjustment 72,871 - (72,871) Schedule 7.1, Line 19, Column 6
8 Net Additions (49,153) (58,763) (9,610) Schedule 7.1, Line 19, Columns 7+8+9+10
9 Accumulated Depreciation Ending (641,268) (700,031) (58,763)
10
11 CIAC, Beginning (209,719)$ (220,826)$ (11,107)$ Schedule 9, Line 1, Column 2
12 Opening Balance Adjustment - - -
13 Net Additions (11,107) (11,465) (358) Schedule 9, Line 1, Column 4
14 CIAC, Ending (220,826) (232,291) (11,465)
15
16 Accumulated Amortization Beginning - CIAC 75,672$ 79,867$ 4,194$ Schedule 9, Line 3, Column 2
17 Opening Balance Adjustment - - -
18 Net Additions 4,194 4,417 222 Schedule 9, Line 3, Column 4
19 Accumulated Amortization Ending - CIAC 79,867 84,283 4,417
20
21 Net Plant in Service, Mid-Year 1,359,381$ 1,411,069$ 51,689$
22
23 Adjustment for timing of Capital additions 10,214$ 20,204$ 9,990$
24 Capital Work in Progress, No AFUDC 11,228 11,228 -
25 Unamortized Deferred Charges 20,420 25,728 5,309 Schedule 11, Line 24, Column 8
26 Working Capital 5,713 6,083 370 Schedule 13, Line 12, Column 3
27 Utility Plant Acquistion Adjustment 5,121 4,935 (186)
2829 Mid-Year Utility Rate Base 1,412,075$ 1,479,247$ 67,172$
30
31Note 1: Pursuant to Order G-9-18, the costs of FBC's Electric Vehicle DCFC stations are excluded from rate base until the Commission directs otherwise.
Page 108

FORTISBC INC. FBC Annual Review for 2020 and 2021 Rates Section 11 - 2021
FORMULA INFLATION FACTORS Schedule 3FOR THE YEAR ENDING DECEMBER 31, 2021($000s)
Line
No. Particulars Reference 2020 2021 Cross Reference(1) (2) (3) (4) (5)
1 Cost Drivers for O&M2 CPI 2.692% 1.596%3 AWE 2.881% 5.946%4 Labour Split5 Non Labour 38.000% 38.000%6 Labour 62.000% 62.000%7 Inflation Factor for Costs (Line 2 x Line 5) + (Line 3 x Line 6) 2.809% 4.293%8 Productivity Factor G-166-20 -0.500% -0.500%9 Net Inflation Factor for Costs Line 7 + Line 8 2.309% 3.793%101112 Growth in Average Customer Calculation13 Average Customer - Prior Year Prior Year Line 14 139,916 141,189 14 Average Customer Forecast - Test Year Schedule 18, Line 8, Column 6 141,189 142,754 15 Average Customer Change Line 14 - Line 13 1,273 1,565 16 Customer Growth Factor Multiplier G-166-20 75% 75%17 Change in Customers - Rate Setting Purposes Line 15 x Line 17 955 1,174 1819 Average Customer Continuity for Rate Setting Purposes20 Average Customer Forecast - Prior Year Prior Year Line 22 139,916 140,871 21 Change in Customers - Rate Setting Purposes Line 17 955 1,174 22 Average Customer Forecast - Rate Setting Purposes Line 20 + Line 21 140,871 142,045
Page 109

FORTISBC INC. FBC Annual Review for 2020 and 2021 Rates Section 11 - 2021
CAPITAL EXPENDITURES Schedule 4FOR THE YEAR ENDING DECEMBER 31, 2021($000s)
LineNo. 2021 Cross Reference
(2) (3)
1 Forecast Capital Expenditures2 Growth Capital 23,042$ 3 Sustainment Capital 49,818 4 Other Capital 14,712 5 Total Forecast Capital 87,573$ 67 Flow-Through Capital Expenditures -$ 89 Total Regular Capital Expenditures 87,573$ 1011 CPCN and Special Projects12 Corra Linn Spillway Gate Replacement 8,640 13 Upper Bonnington Old Units Refurbishment 1,782 14 Grand Forks Terminal Station 2,806 15 Playmor Substation Rebuild Project 8,710 16 Total CPCN and Special Projects 21,938$ 1718 Total Capital Expenditures Before CIAC 109,511$
Particulars(1)
Page 110

FORTISBC INC. FBC Annual Review for 2020 and 2021 Rates Section 11 - 2021
CAPITAL EXPENDITURES TO PLANT RECONCILIATION Schedule 5FOR THE YEAR ENDING DECEMBER 31, 2021($000s)
Line
No. Particulars 2021 Cross Reference(1) (2) (3)
1 CAPITAL EXPENDITURES23 Forecast Capital Expenditures 87,573 4 Flow-Through Capital Expenditures - 5 Total Regular Capital Expenditures 87,573$ Schedule 4, Column 2, Line 967 CPCN and Special Projects8 Corra Linn Spillway Gate Replacement 8,640 9 Upper Bonnington Old Units Refurbishment 1,782
10 Grand Forks Terminal Station 2,806 11 Playmor Substation Rebuild Project 8,710 12 Total CPCN and Special Projects 21,938$ Schedule 4, Column 2, Line 161314 Total Capital Expenditures 109,511$ Schedule 4, Column 2, Line 18151617 RECONCILIATION OF CAPITAL EXPENDITURES TO PLANT1819 Regular Capital Expenditures 87,573$ Schedule 5, Column 2, Line 520 Add - Capitalized Overheads 9,767 Schedule 20, Line 20, Column 421 Add - AFUDC 542
22 Gross Capital Expenditures 97,882$
23 Change in Work in Progress 5,717
24 Total Additions to Plant 103,599$
25
2627 CPCN and Special Projects 21,938$ Schedule 5, Column 2, Line 1228 Add - AFUDC 1,857 29 Gross Capital Expenditures 23,795 30 Change in Work in Progress 16,612 31 Total Additions to Plant 40,407$ 3233 Grand Total Additions to Plant 144,006$ Schedule 6.1, Line 19, Columns 5 + 6
Page 111

FORTISBC INC. FBC Annual Review for 2020 and 2021 Rates Section 11 - 2021
PLANT IN SERVICE CONTINUITY SCHEDULE Schedule 6FOR THE YEAR ENDING DECEMBER 31, 2021($000s)
Line Opening Bal.No. Account Particulars 12/31/20 Adjustment CPCNs Additions Retirements 12/31/21 Cross Reference
(1) (2) (3) (4) (5) (6) (7) (8) (9)
1 Hydraulic Production Plant2 330 Land Rights 962$ -$ -$ -$ -$ 962$ 3 331 Structures and Improvements 19,914 - - 782 (88) 20,607 4 332 Reservoirs, Dams & Waterways 40,742 - 1,616 3,987 (159) 46,186 5 333 Water Wheels, Turbines and Gen. 124,237 - 22,621 1,286 (100) 148,044 6 334 Accessory Equipment 51,203 - 4,847 1,755 (72) 57,733 7 335 Other Power Plant Equipment 46,497 - - 1,264 (97) 47,664 8 336 Roads, Railroads and Bridges 1,287 - - - - 1,287 9 284,841$ -$ 29,084$ 9,074$ (516)$ 322,483$
10 Transmission Plant11 350 Land Rights-R/W 9,613$ -$ -$ 610$ -$ 10,222$ 12 350.1 Land Rights-Clearing 8,838 - - 610 - 9,448 13 353 Station Equipment 244,155 - 9,705 2,786 (305) 256,342 14 355 Poles Towers & Fixtures 119,868 - - 3,021 (82) 122,807 15 356 Conductors and Devices 116,964 - - 3,021 (87) 119,898 16 359 Roads and Trails 1,121 - 162 - - 1,283 17 500,559$ -$ 9,867$ 10,047$ (473)$ 520,000$ 18 Distribution Plant - 19 360 Land Rights-R/W 7,185$ -$ -$ -$ -$ 7,185$ 20 360.1 Land Rights-Clearing 11,630 - - - - 11,630 21 362 Station Equipment 268,899 - - 19,498 (334) 288,063 22 364 Poles Towers & Fixtures 236,995 - - 11,599 (564) 248,030 23 365 Conductors and Devices 389,251 - 1,457 25,932 (641) 415,999 24 368 Line Transformers 180,815 - - 7,671 (1,484) 187,002 25 369 Services 9,521 - - - - 9,521 26 370 Meters 50 - - - (1) 49 27 370.1 AMI Meters 41,137 - - 144 - 41,281 28 371 Installation on Customers' Premises 938 - - - - 938 29 373 Street Lighting and Signal System 14,184 - - 82 (144) 14,123 30 1,160,606$ -$ 1,457$ 64,926$ (3,167)$ 1,223,821$
Page 112

FORTISBC INC. FBC Annual Review for 2020 and 2021 Rates Section 11 - 2021
PLANT IN SERVICE CONTINUITY SCHEDULE Schedule 6.1FOR THE YEAR ENDING DECEMBER 31, 2021($000s)
Line Opening Bal.No. Account Particulars 12/31/20 Adjustment CPCNs Additions Retirements 12/31/21 Cross Reference
(1) (2) (3) (4) (5) (6) (7) (8) (9)
1 General Plant2 389 Land 11,105$ -$ -$ -$ -$ 11,105$ 3 390 Structures - Frame & Iron - - - - - - 4 390.1 Structures - Masonry 46,536 - - 1,180 - 47,716 5 390.2 Operation Building 17,235 - - 1,180 - 18,415 6 390.1 Leasehold Improvements 2,872 - - - - 2,872 7 391 Office Furniture & Equipment 5,269 - - 327 (243) 5,354 8 391.1 Computer Equipment 14,419 - - 3,599 (4,825) 13,193 9 391.2 Computer Software 40,461 - - 5,068 (4,188) 41,342
10 391.2 AMI Software 10,954 - - 1,312 - 12,265 11 392.1 Light Duty Vehicles 5,144 - - 916 (184) 5,875 12 392.1 Heavy Duty Vehicles 26,114 - - 2,137 (1,042) 27,209 13 394 Tools and Work Equipment 9,086 - - 642 (860) 8,869 14 397 Communication Structures & Equipment 12,316 - - 3,189 (1,708) 13,798 15 397.1 Fibre 10,318 - - - (3) 10,316 16 397.2 AMI Communications Structure & Equipment 4,970 - - - - 4,970 17 216,798$ -$ -$ 19,551$ (13,051)$ 223,298$ 1819 Total Plant in Service 2,162,803$ -$ 40,407$ 103,598$ (17,208)$ 2,289,601$ 20 21 Cross Reference Schedule 5 Schedule 5
Line 31 Line 24Column 2 Column 2
Page 113

FORTISBC INC. FBC Annual Review for 2020 and 2021 Rates Section 11 - 2021
ACCUMULATED DEPRECIATION CONTINUITY SCHEDULE Schedule 7
FOR THE YEAR ENDING DECEMBER 31, 2021
($000s)
Line Gross Plant for Depreciation Opening Bal. Depreciation Cost ofNo. Account Particulars Depreciation Rate 12/31/20 Adjustment Expense Retirements Removal Adjustments 12/31/21 Cross Reference
(1) (2) (3) (4) (5) (6) (7) (8) (9) (10) (11) (12)
1 Hydraulic Production Plant
2 330 Land Rights 962$ 1.07% (403)$ -$ 10$ -$ -$ -$ (393)$
3 331 Structures and Improvements 19,914 1.68% 5,222 - 335 (88) 8 - 5,476
4 332 Reservoirs, Dams & Waterways 42,358 1.90% 5,091 - 805 (159) 259 - 5,996
5 333 Water Wheels, Turbines and Gen. 146,858 1.79% 23,709 - 2,629 (100) 1,574 - 27,811
6 334 Accessory Equipment 56,050 3.13% 14,281 - 1,754 (72) 409 - 16,373
7 335 Other Power Plant Equipment 46,497 2.12% 18,517 - 986 (97) - - 19,406
8 336 Roads, Railroads and Bridges 1,287 1.44% 438 - 19 - - - 457
9 313,925$ 66,854$ -$ 6,537$ (516)$ 2,250$ -$ 75,125$
10 Transmission Plant
11 350 Land Rights-R/W 9,613$ 0.00% (0)$ -$ -$ -$ -$ -$ (0)$
12 350.1 Land Rights-Clearing 8,838 1.27% 2,256 - 112 - - - 2,368
13 353 Station Equipment 253,861 2.33% 92,911 - 5,915 (305) 493 - 99,014
14 355 Poles Towers & Fixtures 119,868 2.52% 34,888 - 3,021 (82) 421 - 38,247
15 356 Conductors and Devices 116,964 2.52% 28,606 - 2,947 (87) 4,789 - 36,256
16 359 Roads and Trails 1,283 1.96% 391 - 25 - - - 416
17 510,426$ 159,052$ -$ 12,020$ (473)$ 5,703$ -$ 176,302$
18 Distribution Plant
19 360 Land Rights-R/W 7,185$ 0.00% -$ -$ -$ -$ -$ -$ -$
20 360.1 Land Rights-Clearing 11,630 1.25% 2,648 - 145 - - - 2,793
21 362 Station Equipment 268,899 2.61% 81,665 - 7,018 (334) 469 - 88,817
22 364 Poles Towers & Fixtures 236,995 2.73% 71,185 - 6,470 (564) 841 - 77,932
23 365 Conductors and Devices 390,708 2.38% 117,377 - 9,299 (641) 1,357 - 127,392
24 368 Line Transformers 180,815 3.13% 42,178 - 5,660 (1,484) 1,351 - 47,704
25 369 Services 9,521 0.51% 6,718 - 49 - - - 6,767
26 370 Meters 50 6.68% 1,234 - 3 (1) - - 1,236
27 370.1 AMI Meters 41,137 6.25% 6,513 - 2,571 - - - 9,084
28 371 Installation on Customers' Premises 938 0.00% 938 - - - - - 938
29 373 Street Lighting and Signal System 14,184 4.95% 5,028 - 702 (144) - - 5,586
30 1,162,063$ 335,484$ -$ 31,917$ (3,167)$ 4,018$ -$ 368,251$
Page 114

FORTISBC INC. FBC Annual Review for 2020 and 2021 Rates Section 11 - 2021
ACCUMULATED DEPRECIATION CONTINUITY SCHEDULE Schedule 7.1
FOR THE YEAR ENDING DECEMBER 31, 2021
($000s)
Line Gross Plant for Depreciation Opening Bal. Depreciation Cost ofNo. Account Particulars Depreciation Rate 12/31/20 Adjustment Expense Retirements Removal Adjustments 12/31/21 Cross Reference
(1) (2) (3) (4) (5) (6) (7) (8) (9) (10) (11) (12)
1 General Plant
2 389 Land 11,105$ 0.00% 34$ -$ -$ -$ -$ -$ 34$
3 390 Structures - Frame & Iron - 0.56% - - - - - - -
4 390.1 Structures - Masonry 46,536 2.53% 10,758 - 1,177 - - - 11,935
5 390.2 Operation Building 17,235 1.63% 6,548 - 281 - - - 6,829
6 390.1 Leasehold Improvements 2,872 1.63% 2,610 - 47 - - - 2,656
7 391 Office Furniture & Equipment 5,269 4.42% 1,528 - 233 (243) - - 1,518
8 391.1 Computer Equipment 14,419 21.60% 6,450 - 3,114 (4,825) - - 4,740
9 391.2 Computer Software 40,461 8.96% 17,884 - 3,625 (4,188) - - 17,322
10 391.2 AMI Software 10,954 10.00% 5,311 - 1,095 - - - 6,406
11 392.1 Light Duty Vehicles 5,144 3.81% 3,204 - 196 (184) 45 - 3,261
12 392.1 Heavy Duty Vehicles 26,114 6.50% 6,513 - 1,697 (1,042) 105 - 7,274
13 394 Tools and Work Equipment 9,086 4.11% 4,572 - 373 (860) - - 4,086
14 397 Communication Structures & Equipment 12,316 3.44% 7,086 - 424 (1,708) 62 - 5,864
15 397.1 Fibre 10,318 6.97% 5,650 - 719 (3) - - 6,366
16 397.2 AMI Communications Structure & Equipment 4,970 6.67% 1,730 - 331 - - - 2,061
17 216,798$ 79,878$ -$ 13,314$ (13,051)$ 212$ -$ 80,353$
18
19 108 Total Accumulated Depreciation 2,203,211$ 641,268$ -$ 63,789$ (17,208)$ 12,182$ -$ 700,031$ 2021 Cross Reference Schedule 6.122 Line 1923 Columns 3+4+5
Page 115

FORTISBC INC. FBC Annual Review for 2020 and 2021 Rates Section 11 - 2021
Schedule 8
SCHEDULE NOT APPLICABLE
Page 116

FORTISBC INC. FBC Annual Review for 2020 and 2021 Rates Section 11 - 2021
CONTRIBUTIONS IN AID OF CONSTRUCTION CONTINUITY SCHEDULE Schedule 9FOR THE YEAR ENDING DECEMBER 31, 2021($000s)
LineNo. Particulars 12/31/20 Adjustment Additions Retirements 12/31/21 Cross Reference
(1) (2) (3) (4) (5) (6) (7)
1 CIAC 220,826$ -$ 11,465$ -$ 232,291$
2
3 Amortization (79,867) - (4,417) - (84,283)
45 Net CIAC 140,959$ -$ 7,048$ -$ 148,008$
Page 117

FORTISBC INC. FBC Annual Review for 2020 and 2021 Rates Section 11 - 2021
Schedule 10
SCHEDULE NOT APPLICABLE
Page 118

FORTISBC INC. FBC Annual Review for 2020 and 2021 Rates Section 11 - 2021
UNAMORTIZED DEFERRED CHARGES AND AMORTIZATION - RATE BASE Schedule 11FOR THE YEAR ENDING DECEMBER 31, 2021($000s)
Line Opening Bal./ Gross Less Amortization Mid-YearNo. Particulars 12/31/20 Transfer/Adj. Additions Taxes Expense 12/31/21 Average Cross Reference
(1) (2) (3) (4) (5) (6) (7) (8) (9)
1 1. Forecasting Variance Accounts -$ -$ -$ -$ -$ -$ -$ 23 2. Rate Smoothing Accounts -$ -$ -$ -$ -$ -$ -$ 45 3. Benefits Matching Accounts6 Demand Side Management 30,576$ -$ 11,100$ (2,997)$ (5,040)$ 33,639$ 32,107$ 7 Deferred Debt Issue Costs 3,754 - 625 (97) (178) 4,104 3,929 8 Preliminary and Investigative Charges 1,476 - 365 - - 1,840 1,658 Note 19 Annual Reviews for 2020 -2024 Rates 102 - 140 (38) (102) 102 102
10 2020 Cost of Service Analysis 58 - 20 (5) - 73 66 11 2021 Long-Term Electric Resource Plan 190 - 145 (39) - 296 243 12 BCUC-Initiated Inquiry Costs 215 - 5 (1) (215) 4 110 13 MRS 2021 Audit - - 350 (95) - 256 128 14 36,372$ -$ 12,750$ (3,272)$ (5,536)$ 40,313$ 38,342$ 1516 4. Retroactive Expense Accounts -$ -$ -$ -$ -$ -$ -$ 1718 5. Other Accounts19 Pension and OPEB Liability (14,057)$ -$ (218)$ -$ -$ (14,275)$ (14,166)$ 20 Indigenous Relations Agreement (Huth Substation) - - - - - - - 21 COVID-19 Customer Recovery Fund 1,126 - 1,323 (472) - 1,978 1,552 22 (12,931)$ -$ 1,105$ (472)$ -$ (12,298)$ (12,614)$ 2324 Total Rate Base Deferral Accounts 23,441$ -$ 13,854$ (3,744)$ (5,536)$ 28,016$ 25,728$ 25
26 Note 1: Gross additions for Preliminary and Investigative Charges are after transfers to Construction Work in Progress. Additions of $1.045 million - transfers of $0.680 million = $0.365 million.
Page 119

FORTISBC INC. FBC Annual Review for 2020 and 2021 Rates Section 11 - 2021
UNAMORTIZED DEFERRED CHARGES AND AMORTIZATION - NON-RATE BASE Schedule 12FOR THE YEAR ENDING DECEMBER 31, 2021($000s)
Line Opening Bal./ Gross Less Amortization Mid-YearNo. Particulars 12/31/20 Transfer/Adj. Additions Taxes Expense 12/31/21 Average Cross Reference
(1) (2) (3) (4) (5) (6) (7) (8) (9)
1 Deferral Accounts Financed at Short Term Interest Rate23 1. Forecasting Variance Accounts4 Pension & Other Post Retirement Benefits (OPEB) Variance (1,148)$ -$ -$ -$ 706$ (442)$ (795)$ 56 2. Rate Smoothing Accounts -$ -$ -$ -$ -$ -$ -$ 78 3. Benefits Matching Accounts -$ -$ -$ -$ -$ -$ -$ 910 4. Retroactive Expense Accounts -$ -$ -$ -$ -$ -$ -$ 1112 5. Other Accounts -$ -$ -$ -$ -$ -$ -$ 1314 Total Deferral Accounts at Short Term Interest (1,148)$ -$ -$ -$ 706$ (442)$ (795)$ 1516 Financing Costs at STI (96)$ -$ (19)$ -$ 96$ (19)$ (57)$
Page 120

FORTISBC INC. FBC Annual Review for 2020 and 2021 Rates Section 11 - 2021
UNAMORTIZED DEFERRED CHARGES AND AMORTIZATION - NON-RATE BASE cont'd Schedule 12.1FOR THE YEAR ENDING DECEMBER 31, 2021($000s)
Line Opening Bal./ Gross Less Amortization Mid-YearNo. Particulars 12/31/20 Transfer/Adj. Additions Taxes Expense 12/31/21 Average Cross Reference
(1) (2) (3) (4) (5) (6) (7) (8) (9)
1 Deferral Accounts Financed at Weighted Average Cost of Debt23 1. Forecasting Variance Accounts45 2. Rate Smoothing Accounts6 2018 - 2019 Revenue Surplus (1,030)$ -$ 1,410$ (381)$ -$ -$ (515)$ 78 3. Benefits Matching Accounts9 CPCN Projects Preliminary Engineering1 430$ -$ (430)$ -$ -$ -$ 215$ 10 2016 Long Term Electric Resource Plan 207 - - - (103) 103 155 11 2017 Rate Design Application 472 - - - (118) 354 413 12 2020 - 2024 Multi-Year Rate Plan Application 539 - - - (135) 404 471 13 2019 - 2022 Multi-Year DSM Expenditure Schedule 72 - - - (36) 36 54 14 2018 Joint Pole Use Audit 53 - - - (26) 26 40 15 EV Charging Stations Rate Design and Tariff Application 59 - 170 (34) - 196 127 16 1,831$ -$ (260)$ (34)$ (418)$ 1,119$ 1,475$ 1718 4. Retroactive Expense Accounts -$ -$ -$ -$ -$ -$ -$ 1920 5. Other Accounts21 US GAAP Pension and OPEB Transitional Obligation 1,042 -$ (347)$ -$ -$ 695$ 868$ 22 Advanced Metering Infrastructure Radio-Off Shortfall 72 - - - (24) 48 60 23 1,114$ -$ (347)$ -$ (24)$ 743$ 929$ 242526 Total Deferral Accounts at Weighted Average Cost of Debt 1,915$ -$ 804$ (415)$ (442)$ 1,862$ 1,889$ 2728 Financing Costs at WACD 47 -$ 92$ -$ (47)$ 92$ 69$
29 Note 1: Gross additions for CPCN Projects Preliminary Engineering after transfers to Construction Work in Progress.
Page 121

FORTISBC INC. FBC Annual Review for 2020 and 2021 Rates Section 11 - 2021
UNAMORTIZED DEFERRED CHARGES AND AMORTIZATION - NON-RATE BASE cont'd Schedule 12.2FOR THE YEAR ENDING DECEMBER 31, 2021($000s)
Line Opening Bal./ Gross Less Amortization Mid-YearNo. Particulars 12/31/20 Transfer/Adj. Additions Taxes Expense 12/31/21 Average Cross Reference
(1) (2) (3) (4) (5) (6) (7) (8) (9)
1 Deferral Accounts Financed at Weighted Average Cost of Capital23 1. Forecasting Variance Accounts4 2020 - 2024 Flow-Through Deferral Account -$ -$ -$ -$ -$ -$ -$ 56 2. Rate Smoothing Accounts -$ -$ -$ -$ -$ -$ -$ 78 3. Benefit Matching Accounts9 On Bill Financing (OBF) Participant Loans 4$ -$ -$ -$ -$ 4$ 4$ 1011 4. Other12 MRP Earnings Sharing Account -$ -$ -$ -$ -$ -$ -$ 1314 Total Deferral Accounts at Weighted Average Cost of Capital 4$ -$ -$ -$ -$ 4$ 4$ 1516 Financing Costs at AFUDC 0$ -$ -$ -$ (0)$ -$ 0$ 1718 Deferral Accounts Non-Interest Bearing 50$ -$ -$ -$ -$ 50$ 50$ 1920 Total Non Rate Base Deferral Accounts (including financing) 772$ -$ 877$ (415)$ 313$ 1,547$ 1,160$
Page 122

FORTISBC INC. FBC Annual Review for 2020 and 2021 Rates Section 11 - 2021
WORKING CAPITAL ALLOWANCE Schedule 13FOR THE YEAR ENDING DECEMBER 31, 2021($000s)
Line 2020 2021No. Particulars Projected Forecast Change Cross Reference
(1) (2) (3) (4) (5)
1 Cash Working Capital2 Cash Working Capital 6,393$ 6,805$ 412$ Schedule 14, Line 35, Column 534 Add: Funds Unavailable5 Customer Loans 470 470 - 6 Employee Loans 340 340 - 7 Inventory (average monthly investment) 630 630 - 89 Less: Funds Available10 Average Employee Withholdings (2,120) (2,163) (42) 1112 Total 5,713$ 6,083$ 370$ 1314 Note: Uncollectible Accounts and Goods and Services Tax included in Cash Working Capital calculation (Schedule 14) beginning in 2020.
Page 123

FORTISBC INC. FBC Annual Review for 2020 and 2021 Rates Section 11 - 2021
CASH WORKING CAPITAL Schedule 14FOR THE YEAR ENDING DECEMBER 31, 2021($000s)
WeightedLine 2021 Lag (Lead) AverageNo. Particulars at Revised Rates Days Extended Lag (Lead) Days Cross Reference
(1) (2) (3) (4) (5) (6)
1 REVENUE2 Sales Revenue3 Residential Tariff Revenue 187,311$ 56.0 10,489$ 4 Commercial Tariff Revenue 101,955 45.1 4,598 5 Wholesale Tariff Revenue 52,617 37.5 1,973 6 Industrial Tariff Revenue 45,638 38.0 1,734 7 Lighting Tariff Revenue 2,305 34.6 80 8 Irrigation Tariff Revenue 3,361 47.0 158 910 Other Revenue11 Apparatus and Facilities Rental 5,930 90.0 534 12 Contract Revenue 3,088 62.2 192 13 Transmission Revenue 1,501 65.2 98 14 Late Payment Charges 829 54.0 45 15 Connection Charge 476 30.5 15 16 Other Recoveries 397 63.4 25 1718 Total 405,408$ 19,941$ 49.2 1920 EXPENSES21 Power Purchases 146,260$ 51.5 7,532 22 Wheeling 5,783 46.9 271 23 Water Fees 11,045 1.4 15 24 Operating & Maintenance 55,347 28.6 1,583 25 Property Taxes 18,242 4.9 89
26 GST 8,212 45.4 373
27 Income Tax 8,571 15.2 130
28
29 Total 253,461$ 9,995$ (39.4)
30
31 Net Lag (Lead) Days 9.8
32
33 Total Expenses 253,461$
34
35 Cash Working Capital 6,805$
Page 124

FORTISBC INC. FBC Annual Review for 2020 and 2021 Rates Section 11 - 2021
Schedule 15
SCHEDULE NOT APPLICABLE
Page 125

FORTISBC INC. FBC Annual Review for 2020 and 2021 Rates Section 11 - 2021
UTILITY INCOME AND EARNED RETURN Schedule 16FOR THE YEAR ENDING DECEMBER 31, 2021($000s)
Line 2020 2021 Forecast
No. Particulars ProjectedAt 2020 Approved
Interim Rates Revised Revenue at Revised Rates Change Cross Reference(1) (2) (3) (4) (5) (6) (7)
1 ENERGY VOLUMES2 Sales Volume (GWh) 3,272 3,356 3,356 84 Schedule 17, Line 9, Column 334 REVENUE5 Sales 362,255$ 369,643$ -$ 369,643$ 7,388$ Schedule 17, Line 19, Column 36 Deficiency (Surplus) - 23,544 23,544 23,544 7 Total 362,255 369,643 23,544 393,187 30,932 Schedule 18, Line 8, Column 589 EXPENSES
10 Cost of Energy 155,347 163,089 - 163,089 7,742 Schedule 19, Line 31, Column 311 O&M Expense (net) 52,611 55,347 - 55,347 2,736 Schedule 20, Line 21, Column 412 Depreciation & Amortization 53,899 64,781 - 64,781 10,882 Schedule 21, Line 11, Column 313 Property Taxes 16,993 18,242 - 18,242 1,249 Schedule 22, Line 7, Column 314 Other Revenue (10,645) (12,221) - (12,221) (1,576) Schedule 23, Line 9, Column 315 Deferred 2020/2021 Revenue Deficiency (3,326) (1,410) - (1,410) 1,916 16 Utility Income Before Income Taxes 97,377 81,815 23,544 105,359 7,982 1718 Income Taxes 4,935 2,214 6,357 8,571 3,636 Schedule 24, Line 13, Column 31920 EARNED RETURN 92,442$ 79,601$ 17,187$ 96,788$ 4,346$ Schedule 26, Line 5, Column 7
2122 UTILITY RATE BASE 1,412,075$ 1,479,247$ 1,479,247$ 67,172$ Schedule 2, Line 29, Column 323 RATE OF RETURN ON UTILITY RATE BASE 6.55% 5.38% 6.54% 0.00% Schedule 26, Line 5, Column 6
Page 126

FORTISBC INC. FBC Annual Review for 2020 and 2021 Rates Section 11 - 2021
VOLUME AND REVENUE Schedule 17FOR THE YEAR ENDING DECEMBER 31, 2021($000s)
Line 2020 2021No. Particulars Projected Forecast Change Cross Reference
(1) (2) (3) (4) (5)
1 ENERGY VOLUME SOLD (GWh)2 Residential 1,289 1,252 (37) 3 Commercial 899 937 38 4 Wholesale 573 584 11 5 Industrial 464 537 73 6 Lighting 10 10 - 7 Irrigation 37 36 (1) 89 Total 3,272 3,356 84
1011 REVENUE AT APPROVED RATES12 Residential 178,565$ 176,095$ (2,470)$ 13 Commercial 89,191 95,850 6,659 14 Wholesale 47,938 49,466 1,528 15 Industrial 37,589 42,905 5,316 16 Lighting 2,219 2,167 (52) 17 Irrigation 3,166 3,160 (6) 1819 Total 358,668$ 369,643$ 10,975$
Page 127

FORTISBC INC. FBC Annual Review for 2020 and 2021 Rates Section 11 - 2021
REVENUE AT EXISTING AND REVISED RATES Schedule 18FOR THE YEAR ENDING DECEMBER 31, 2021($000s)
2020 2021 Forecast AverageLine Projected At 2020 Approved Effective Revenue at Number ofNo. Particulars Revenue Interim Rates Increase Revised Rates Customers GWh Cross Reference
(1) (2) (3) (4) (5) (6) (7) (8)
1 Residential 180,351$ 176,095$ 11,216$ 187,311$ 124,055 1,252 2 Commercial 90,083 95,850 6,105 101,955 16,148 937 3 Wholesale 48,417 49,466 3,151 52,617 6 584 4 Industrial 37,965 42,905 2,733 45,638 59 537 5 Lighting 2,241 2,167 138 2,305 1,405 10 6 Irrigation 3,198 3,160 201 3,361 1,082 36 78 Total 362,255$ 369,643$ 23,544$ 393,187$ 142,754 3,356 9
10 Effective Increase 6.37%
Page 128

FORTISBC INC. FBC Annual Review for 2020 and 2021 Rates Section 11 - 2021
COST OF ENERGY Schedule 19FOR THE YEAR ENDING DECEMBER 31, 2021($000s)
Line 2020 2021No. Particulars Projected Forecast Change Cross Reference
(1) (2) (3) (4) (5)
1 POWER PURCHASES2 Gross Load (GWh) 3,562 3,646 84 34 Power Purchase Expense5 Brilliant 41,505$ 41,027$ (478)$ 6 BC Hydro PPA 42,088 48,882 6,794 7 Waneta Expansion 40,250 41,462 1,212 8 Market and Contracted Producers 14,617 14,751 134 9 Independent Power Producers 62 76 14
10 Self-Generators 110 61 (49) 11 CPA Balancing Pool 18 (0) (18) 12 Special and Accounting Adjustments (39) - 39 13 Total 138,612$ 146,260$ 7,648$ 1415 WHEELING16 Wheeling Nomination (MW months)17 Okanagan Point of Interconnection 2,400 2,400 - 18 Creston 438 420 (18) 1920 Wheeling Expense21 Okanagan Point of Interconnect 4,633$ 4,694$ 60$ 22 Creston 551 535 (16) 23 Other 583 555 (28) 24 Total 5,767$ 5,783$ 16$ 2526 WATER FEES27 Plant Entitlement Use in previous year (GWh) 1,604 1,585 (19) 2829 Water Fees 10,968$ 11,045$ 77$ 3031 Total 155,347$ 163,089$ 7,742$
Page 129

FORTISBC INC. FBC Annual Review for 2020 and 2021 Rates Section 11 - 2021
OPERATING AND MAINTENANCE EXPENSE Schedule 20FOR THE YEAR ENDING DECEMBER 31, 2021($000s)
Line Formula Forecast TotalNo. Particulars O&M O&M O&M Cross Reference
(1) (2) (3) (4) (5)
1 Inflation Indexed O&M2 2020 Base Unit Cost 422$ 3 GFT Reliability Project O&M Reduction (0.6) 4 Adjusted Base Unit Cost 421$ 5 Net Inflation Factor 3.793% Schedule 3, Line 9, Column 46 2021 Base Unit Cost 437$ Line 4 x (1 + Line 5)78 2021 Average Customer Forecast - Rate Setting Purposes 142,045 Schedule 3, Line 22, Column 49
10 2021 Inflation Indexed O&M 62,073$ 62,073$ Line 6 x Line 8 / 10001112 O&M Tracked Outside of Formula13 Pension & OPEB (O&M Portion) 775$ 14 Insurance Premiums 1,916 15 BCUC levies 350 16 Total 3,041$ 3,041 1718 Total Gross O&M 65,114$ 1920 Capitalized Overhead - 15% of Total Gross O&M (9,767) 21 Net O&M Expense 55,347$
Page 130

FORTISBC INC. FBC Annual Review for 2020 and 2021 Rates Section 11 - 2021
DEPRECIATION AND AMORTIZATION EXPENSE Schedule 21FOR THE YEAR ENDING DECEMBER 31, 2021($000s)
Line 2020 2021No. Particulars Projected Forecast Change Cross Reference
(1) (2) (3) (4) (5)
1 Depreciation2 Depreciation Expense 60,666$ 63,789$ 3,123$ Schedule 7.1, Line 19, Column 734 Amortization5 Rate Base deferrals 4,691$ 5,536$ 845$ Schedule 11, Line 24, Column 66 Non-Rate Base deferrals (7,450) (313) 7,137 Schedule 12.2, Line 20, Column 67 Utility Plant Acquisition Adjustment 186 186 - 8 CIAC (4,194) (4,417) (223) Schedule 9, Line 3, Column 49 (6,767) 992 7,759 1011 Total 53,899$ 64,781$ 10,882$
Page 131

FORTISBC INC. FBC Annual Review for 2020 and 2021 Rates Section 11 - 2021
PROPERTY AND SUNDRY TAXES Schedule 22FOR THE YEAR ENDING DECEMBER 31, 2021($000s)
Line 2020 2021No. Particulars Projected Forecast Change Cross Reference
(1) (2) (3) (4) (5)
1 Generating Plant 3,092$ 3,087$ (5)$ 2 Transmission and Distribution 6,756 8,075 1,319 3 Substation Equipment 3,825 3,843 18 4 Land and Buildings 1,057 1,112 55 5 1% In-Lieu of Municipal Taxes 2,263 2,125 (138) 67 Total 16,993$ 18,242$ 1,249$
Page 132

FORTISBC INC. FBC Annual Review for 2020 and 2021 Rates Section 11 - 2021
OTHER REVENUE Schedule 23FOR THE YEAR ENDING DECEMBER 31, 2021($000s)
Line 2020 2021No. Particulars Projected Forecast Change Cross Reference
(1) (2) (3) (4) (5)
1 Apparatus and Facilities Rental 5,843$ 5,930$ 87$ 2 Contract Revenue 2,305 3,088 783 3 Transmission Access Revenue 1,496 1,501 5 4 Interest Income 20 20 - 5 Late Payment Charges 205 829 624 6 Connection Charge 394 476 82 7 Other Recoveries 382 377 (5) 89 Total 10,645$ 12,221$ 1,576$
Page 133

FORTISBC INC. FBC Annual Review for 2020 and 2021 Rates Section 11 - 2021
INCOME TAXES Schedule 24FOR THE YEAR ENDING DECEMBER 31, 2021($000s)
Line 2020 2021No. Particulars Projected Forecast Change Cross Reference
(1) (2) (3) (4) (5)
1 EARNED RETURN 92,442$ 96,788$ 4,346$ Schedule 16, Line 20, Column 52 Deduct: Interest on Debt (40,760) (42,647) (1,887) Schedule 26, Lines 1+2, Column 73 Adjustments to Taxable Income (38,340) (30,968) 7,373 Schedule 24, Line 30, Column 34 Accounting Income After Tax 13,342$ 23,173$ 9,831$ 56 1 - Current Income Tax Rate 73.00% 73.00% 0.00%7 Taxable Income 18,276$ 31,744$ 13,468$ 89 Current Income Tax Rate 27.00% 27.00% 0.00%10 Income Tax - Current 4,935$ 8,571$ 3,636$ 1112 Previous Year Adjustment - - - 13 Total Income Tax 4,935$ 8,571$ 3,636$
141516 ADJUSTMENTS TO TAXABLE INCOME17 Addbacks:18 Depreciation 60,666$ 63,789$ 3,123$ Schedule 21, Line 2, Column 319 Amortization of Deferred Charges (2,759) 5,223 7,982 Schedule 21, Lines 5+6, Column 320 Amortization of Utility Plant Acquisition Adjustment 186 186 - Schedule 21, Line 7, Column 321 Pension & OPEB Expense 4,524 5,804 1,280 22 - 23 Deductions: - 24 Capital Cost Allowance (80,952) (85,236) (4,284) Schedule 25, Line 20, Column 625 CIAC Amortization (4,194) (4,417) (223) Schedule 21, Line 8, Column 326 Pension & OPEB Contributions (5,216) (5,239) (23) 27 Overheads Capitalized Expensed for Tax Purposes (9,284) (9,767) (483) Schedule 20, Line 20, Column 428 Removal Costs (1,200) (1,200) - 29 All Other (111) (111) - 30 Total (38,340)$ (30,968)$ 7,373$
Page 134

FORTISBC INC. FBC Annual Review for 2020 and 2021 Rates Section 11 - 2021
CAPITAL COST ALLOWANCE Schedule 25FOR THE YEAR ENDING DECEMBER 31, 2021($000s)
Line CCA 12/31/2020 2021 2021 12/31/2021No. Class Rate UCC Balance Adjustments Additions CCA UCC Balance
(1) (2) (3) (4) (5) (6) (7)
1 1(a) 4% 167,193 $ - $ - $ (6,688) $ 160,505 $
2 1(b) 6% 33,463 - 2,040 (2,191) 33,311
3 2 6% 12,905 - - (774) 12,131
4 3 5% 718 - - (36) 682
5 6 10% 3 - - (0) 3
6 8 20% 4,167 - 874 (1,096) 3,946
7 9 25% - - - - -
8 10 30% 4,735 - 2,770 (2,667) 4,838
9 12 100% - - - - -
10 13 0% 11 - - - 11
11 14.1 5% 8,008 - - (400) 7,608
12 14.1 7% 2,317 - 552 (220) 2,649
13 17 8% 125,308 - 37,311 (14,502) 148,117
14 42 12% 7,106 - 2,983 (1,390) 8,700
15 45 45% 2 - - (1) 1
16 46 30% 5,527 - - (1,658) 3,869
17 47 8% 458,971 - 66,122 (44,652) 480,440
18 50 55% 2,750 - 9,028 (8,960) 2,817
19
20 Total 833,183 $ - $ 121,680 $ (85,236) $ 869,627 $
Page 135

FORTISBC INC. FBC Annual Review for 2020 and 2021 Rates Section 11 - 2021
RETURN ON CAPITAL Schedule 26FOR THE YEAR ENDING DECEMBER 31, 2021($000s)
2020 Average EarnedLine Projected Embedded Cost Earned ReturnNo. Particulars Earned Return Amount Ratio Cost Component Return Change Cross Reference
(1) (2) (3) (4) (5) (6) (7) (8) (9)
1 Long Term Debt 39,565$ 845,500$ 57.16% 4.93% 2.82% 41,714$ 2,149$ Schedule 27, Line 11, Column 62 Short Term Debt 1,195 42,048 2.84% 2.22% 0.06% 933 (261) 3 Common Equity 51,682 591,699 40.00% 9.15% 3.66% 54,140 2,458 45 Total 92,442$ 1,479,247$ 100.00% 6.54% 96,788$ 4,346$ 67 Cross Reference Schedule 2
Line 29Column 3
2021
Page 136

FORTISBC INC. FBC Annual Review for 2020 and 2021 Rates Section 11 - 2021
EMBEDDED COST OF LONG TERM DEBT Schedule 27FOR THE YEAR ENDING DECEMBER 31, 2021($000s)
AverageLine Issue Maturity Principal Interest InterestNo. Particulars Date Date Outstanding Rate Expense Cross Reference
(1) (2) (3) (4) (5) (6) (7)
1 Series G August 28, 1993 August 28, 2023 25,000$ 8.800% 2,200$ 2 Series I December 1, 1997 December 1, 2021 23,000 7.810% 1,796 3 Series 1 - 05 November 9, 2005 November 9, 2035 100,000 5.600% 5,600 4 Series 1 - 07 July 4, 2007 July 4, 2047 105,000 5.900% 6,195 5 MTN - 09 June 2, 2009 June 2, 2039 105,000 6.100% 6,405 6 MTN - 10 November 24, 2010 November 24, 2050 100,000 5.000% 5,000 7 MTN - 14 October 28, 2014 October 28, 2044 200,000 4.000% 8,000 8 MTN - 17 December 4, 2017 December 6, 2049 75,000 3.620% 2,715 9 MTN - 20 May 11, 2020 May 11, 2050 75,000 3.120% 2,340
10 MTN - 21 July 1, 2021 July 1, 2051 37,500 3.900% 1,463 11 Total 845,500$ 41,714$ 1213 Average Embedded Cost 4.93%
Page 137

FORTISBC INC. ANNUAL REVIEW FOR 2020 AND 2021 RATES
SECTION 12: ACCOUNTING MATTERS PAGE 138
12. ACCOUNTING MATTERS 1
12.1 INTRODUCTION AND OVERVIEW 2
In this section, FBC discusses “Exogenous Factors” under its MRP (identifying one potential 3 exogenous factor that affects 2020), emerging accounting guidance, and the status of its non-4 rate base deferral accounts. With respect to its non-rate base deferral accounts, FBC requests 5 approval for the disposition of two existing deferral accounts. FBC also provides information on 6 the Flow-through deferral account. 7
12.2 EXOGENOUS (Z) FACTORS 8
FBC is permitted to adjust the cost of service for “Exogenous Factors” under the MRP. The 9 BCUC established the following criteria for evaluating whether the impact of an event qualifies 10 for exogenous factor treatment: 11
1. The costs/savings must be attributable entirely to events outside the control of a 12 prudently operated utility; 13
2. The costs/savings must be directly related to the exogenous event and clearly outside 14 the base upon which the rates were originally derived; 15
3. The impact of the event was unforeseen; 16
4. The costs must be prudently incurred; and 17
5. The costs/savings related to each exogenous event must exceed the BCUC-defined 18 materiality threshold. 19
20 The materiality threshold (item 5) for FBC has been established at $0.150 million, as approved 21 in the MRP Decision. 22
The COVID-19 pandemic is a potential exogenous factor affecting 2020 and future years, as 23 described below. 24
COVID-19 Pandemic 25
During the COVID-19 public health emergency, FBC has taken the necessary steps as a critical 26 infrastructure service provider to ensure the health, safety and well-being of its customers, 27 employees and their communities, and to continue to operate its system safely and reliably. 28
Any incremental O&M and capital impacts related to COVID-19 would meet the first three 29 Exogenous Factor requirements based on the following: 30
The COVID-19 pandemic is an event outside the control of a prudently operated utility. 31

FORTISBC INC. ANNUAL REVIEW FOR 2020 AND 2021 RATES
SECTION 12: ACCOUNTING MATTERS PAGE 139
Costs to address COVID-19 were not included in the 2019 Base O&M expense or the 1 forecast regular capital expenditures approved as part of the MRP. Therefore, these 2 costs would satisfy the criterion that they be “outside the base upon which rates were 3 originally derived”. 4
The COVID-19 pandemic started to have measurable impacts in mid-March 2020 in BC, 5 and was unforeseen at the time of the close of evidence related to the MRP Application. 6 The BCUC commented on the pandemic in the MRP Decision,36 stating that the 7 pandemic has raised questions about the validity of some fundamental assumptions 8 underlying various elements of the MRPs. The BCUC concluded that the situation is fluid 9 with many uncertainties and outcomes that are difficult to predict and manage in the 10 circumstances and that the BCUC must adjudicate the merits of the MRP Application 11 based on the evidence submitted. The BCUC also pointed to the Annual Review process 12 and other safeguards such as exogenous factors as avenues that could provide relief to 13 FBC and ratepayers should such relief become necessary. 14
15 For the remaining criteria - the determination of whether the amounts are directly related to 16 COVID-19 and the prudency and materiality of costs - these determinations cannot be made 17 until after the impacts of the exogenous factor are known. 18
To date in 2020, FBC has incurred incremental O&M expenditures for COVID-19 related items, 19 including the following: 20
cleaning and disinfecting of facilities to promote a safe work environment; 21
sequestering of system control centre employees from having to return to their homes to 22 ensure a safe and healthy work environment (i.e., 10 employees were sequestered from 23 April 3 to May 14, both for days on and off shift); and 24
Public Affairs Emergency communications activities to keep our customers informed of 25 the assistance available during this challenging time. 26
27 FBC expects to continue to incur additional expenditures for the remainder of the year. 28 Additionally, FBC is monitoring for any significant savings related to COVID-19 such as a 29 temporary reduction in employee-related expenses that may help to offset the incremental 30 expenditures. However, with the uncertainty regarding COVID-19’s duration and impact (i.e., 31 timing of transition to and from Phases 2, 3, and 4 of the Province’s BC Restart Plan), FBC at 32 this time is unable to provide a forecast of incremental impacts related to COVID-19 for 2020 or 33 for future years. 34
Due to the uncertainty, FBC is not seeking approval of exogenous factor treatment for 35 incremental impacts related to COVID-19 at this time. Instead, over the coming months, FBC 36
36 MRP Decision, p. 170.

FORTISBC INC. ANNUAL REVIEW FOR 2020 AND 2021 RATES
SECTION 12: ACCOUNTING MATTERS PAGE 140
will evaluate the COVID-19 incremental costs and related savings. If the incremental costs and 1 related savings are determined to be significant, FBC proposes to include the amounts in the 2 previously approved COVID-19 Customer Recovery Fund Deferral Account. The amounts will 3 then be reviewed in 2021 when actual 2020 amounts and forecasts for future years can be 4 ascertained, and an appropriate recovery method can be determined. 5
12.3 ACCOUNTING MATTERS 6
In the following section, FBC provides information on emerging accounting guidance. 7
Emerging Accounting Guidance 8
In the PBR Plan decision, the BCUC directed FBC to “communicate any accounting policy 9 changes and updates to the Commission and other stakeholders as part of the Annual Review 10 process during the PBR period.” While this directive was not included as part of the MRP 11 Decision, FBC will continue to provide accounting policy changes and updates as part of the 12 Annual Review materials. FBC discusses one accounting matter below: 13
Credit Losses - for Accounting Standards Update (ASU) 2016-13, Measurement of 14 Credit Losses on Financial Instruments: The accounting assessment of this new 15 standard is not expected to directly affect how FBC sets its revenue requirements or 16 rates, but some principles within the new guidance have been applied in the 17 determination of forecast unrecovered revenue for 2020 and 2021 to be captured in the 18 COVID-19 Customer Recovery Fund Deferral Account. 19
12.3.1.1 Credit Losses 20
Effective January 1, 2020, FBC adopted ASU No. 2016-13, Measurement of Credit Losses on 21 Financial Instruments, which requires the use of reasonable and supportable forecasts in the 22 estimate of credit losses (also referred to as allowance for doubtful accounts) and the 23 recognition of expected losses (also referred to as bad debt expense) upon initial recognition of 24 a financial instrument, in addition to using past events and current conditions. 25
Consistent with prior accounting under US GAAP, FBC records an allowance for credit losses to 26 reduce accounts receivable for amounts estimated to be uncollectible. As a result of this ASU, 27 the credit loss allowance is estimated by taking into account historical experience, current 28 conditions, reasonable and supportable economic forecasts and accounts receivable aging. In 29 addition to historical collection patterns, FBC considers customer class, customer size, 30 economic indicators and certain other risk characteristics when evaluating the credit loss 31 allowance. 32
ASU 2016-13 is not expected to change how FBC determines its revenue requirements for 2020 33 and 2021. However, since ASU 2016-13 provides entities with additional guidance on how to 34 estimate future credit losses, some principles within the new guidance have been applied in the 35 determination of forecast unrecovered revenue for 2020 and 2021 to be captured in the COVID-36

FORTISBC INC. ANNUAL REVIEW FOR 2020 AND 2021 RATES
SECTION 12: ACCOUNTING MATTERS PAGE 141
19 Customer Recovery Fund Deferral Account. Details of this deferral account are provided in 1 Section 7.7.2.1. 2
The focus of ASU 2016-13 is to develop a forward-looking provision for credit losses, or bad 3 debt expense, at the beginning of the revenue cycle relying on broader principles and 4 macroeconomic factors. The unrecovered revenue captured in the COVID-19 Customer 5 Recovery Fund Deferral Account is intended to represent specific customer bad debt write-offs 6 that occur potentially many months after initially being billed the revenue for consumption. 7 Therefore, under US GAAP, FBC will recognize the initial credit loss expense against the 8 deferral account explained in Section 7.7.2.1 with the offset against accounts receivable. This 9 entry will only be applied for external financial reporting purposes and will not affect the deferral 10 account or O&M for regulatory accounting purposes or setting rates. Over the entire revenue, 11 billing and collection cycle, the credit losses recognized under ASU 2016-13 will approximate 12 the actual customer account write-offs. 13
12.4 NON RATE BASE DEFERRAL ACCOUNTS 14
FBC maintains both rate base and non-rate base deferral accounts. Rate base deferral 15 accounts are included in rate base and earn a rate base return. In contrast, non-rate base 16 deferral accounts are outside of rate base and may have varying rates of return, depending on 17 the nature of the account and the return approved by the BCUC. 18
The forecast mid-year balance of unamortized non-rate base deferred charges is a credit 19 balance of approximately $4.162 million in 2020 and a debit balance of approximately $1.160 20 million in 2021. 21
In the following sections, FBC requests disposition of two previously approved deferral 22 accounts, and provides information on its Flow-through deferral account. Information on FBC’s 23 non-rate base earnings sharing deferral account is included in Section 10. 24
Existing Deferral Accounts 25
12.4.1.1 2018-2019 Revenue Surplus Deferral Account 26
As part of the Annual Review for 2018 Rates, FBC received approval through Order G-131-18 27 to establish the 2018 Revenue Deficiency deferral account to capture the 2018 revenue 28 deficiency of $0.896 million ($0.654 million after tax) resulting from maintaining 2018 rates at 29 existing 2017 levels. 30
As part of the Annual Review for 2019 Rates, FBC received approval through Order G-246-18 31 to capture the 2019 revenue surplus of $5.633 million ($4.112 million after tax) in the same 32 deferral account and to rename the account to the 2018-2019 Revenue Surplus deferral 33

FORTISBC INC. ANNUAL REVIEW FOR 2020 AND 2021 RATES
SECTION 12: ACCOUNTING MATTERS PAGE 142
account. As a result of the 2019 addition, the net credit balance in the deferral account was 1 $4.737 million ($3.458 million after tax).37 2
In this Application, FBC is requesting approval to draw down $3.326 million38 pre-tax of the 3 deferral account balance in 2020 rates, which will result in a total forecast revenue deficiency of 4 $3.587 million and a 1.00 percent rate increase, maintaining 2020 permanent rates at interim 5 levels. 6
FBC is also requesting approval to draw down the remaining balance of the deferral account in 7 2021 rates, which equals $1.410 million pre-tax,39 which will result in a 6.37 percent 2021 rate 8 increase compared to 2020 rates. Without returning a portion of the existing surplus in 2021, 9 the 2021 rate increase would be 6.75 percent compared to 2020 levels. 10
As shown in Table 12-1 below, the ending 2021 after-tax balance in the deferral account is 11 forecast to be zero.40 12
Table 12-1: 2018-2019 Revenue Surplus Deferral Account Continuity ($ millions) 13
14
12.4.1.2 2020 – 2024 Multi-Year Rate Plan Application 15
As part of the Annual Review for 2018 Rates Application, FBC received approval through Order 16 G-38-18 to establish the 2020 Revenue Requirements deferral account to capture the costs 17 related to filing that application and the related regulatory proceeding. Further, FBC noted that it 18 would request an amortization period for this account in a future application. 19
Consistent with past practice, FBC is proposing to amortize this deferral account over five years 20 commencing January 1, 2020, which represents the period covered by the MRP Application. 21
FBC notes that it has renamed the deferral account from 2020 Revenue Requirements to 2020–22 2024 Multi-Year Rate Plan Application to better reflect the nature of the deferral account. 23
12.4.1.3 Flow-Through Deferral Account (2020-2024) 24
As approved by Order G-166-20, the Flow-through deferral account is used to capture the 25 annual variances between the approved and actual amounts for all costs and revenues which 26 37 Section 11 – 2020, Schedule 12.1, Line 6, Column 2. 38 Section 11 – 2020, Schedule 12.1, Line 6, Column 4. 39 Section 11 – 2021, Schedule 12.1, Line 6, Column 4. 40 Section 11 – 2021, Schedule 12.1, Line 6, Column 7.
Line Opening (Additions)/ EndingNo. Description Balance Drawdowns Taxes Balance
1 2018 Actuals -$ 0.896$ (0.242)$ 0.654$ 2 2019 Actuals 0.654 (5.633) 1.521 (3.458) 3 2020 Projected (3.458) 3.326 (0.898) (1.030) 4 2021 Forecast (1.030) 1.410 (0.381) -

FORTISBC INC. ANNUAL REVIEW FOR 2020 AND 2021 RATES
SECTION 12: ACCOUNTING MATTERS PAGE 143
are forecast annually, are not subject to earnings sharing, and which do not have a previously 1 approved deferral account. The specific items included in the Flow-through deferral account 2 were set out in Table C4-1 of the MRP Application, reproduced below. 3

FORTISBC INC. ANNUAL REVIEW FOR 2020 AND 2021 RATES
SECTION 12: ACCOUNTING MATTERS PAGE 144
Table 12-2: Variances Captured in the Flow-through Deferral Account 1
2

FORTISBC INC. ANNUAL REVIEW FOR 2020 AND 2021 RATES
SECTION 12: ACCOUNTING MATTERS PAGE 145
FBC has included a discussion on the final amounts accumulated in the Flow-through deferral 1 account during the 2014-2019 PBR Plan term in Section 14 of this Application. 2
Similar to the discussion in Section 10 on FBC’s 2020 Projected earnings sharing amount, FBC 3 is not projecting a Flow-through balance for 2020. This is because FBC has included actual 4 amounts up until June 30, 2020 within its Projected 2020 revenue requirement throughout this 5 Application and is not projecting any further variances for the remainder of the year from the 6 amounts included in this Application. Therefore, there are no amounts to include within the 2020 7 Flow-through projection. 8
An adjustment to include the difference between the projected amount of zero41 and final actual 9 amounts for 2020 subject to flow-through will be recorded in the deferral account in 2021 and 10 amortized in 2022 rates. 11
12.5 SUMMARY 12
FBC has discussed one new exogenous factor that may affect rates in 2021, has provided an 13 update on certain accounting related matters, requested approval for the disposition of two 14 existing deferral accounts, and included information on the Flow-through deferral account. 15
41 Section 11 - 2020, Schedule 12.2, Line 4, Column 4.

FORTISBC INC. ANNUAL REVIEW FOR 2020 AND 2021 RATES
SECTION 13: SERVICE QUALITY INDICATORS PAGE 146
13. SERVICE QUALITY INDICATORS 1
13.1 INTRODUCTION AND OVERVIEW 2
Under the MRP, SQIs are used to monitor the Utility’s performance to ensure that any 3 efficiencies and cost reductions do not result in a degradation of the quality of service to 4 customers. 5
In the MRP Decision and Order G-166-20, the BCUC approved a balanced set of SQIs for FBC, 6 covering safety, responsiveness to customer needs, and reliability. Eight of the SQIs have 7 benchmarks and performance ranges set by a threshold level. Four of the SQIs are for 8 information only and as such do not have benchmarks or performance ranges. 9
The BCUC has determined that the process used during the 2014-2019 PBR Plan to interpret 10 metric performance will remain in effect for the MRP.42 Consistent with the BCUC’s direction 11 issued in its Reasons for Decision accompanying Order G-44-16 in FBC’s All Injury Frequency 12 Rate Compliance Filing, FBC will review service quality for a year in the following year’s annual 13 review. As 2019 SQI results pertain to the 2014-2019 PBR Plan, they are discussed separately 14 in Section 14. 15
In the subsections below, FBC reports on its June 2020 year-to-date performance as measured 16 against the SQI benchmarks and thresholds. The June 2020 year-to-date SQI results indicate 17 that the Company’s overall performance to date meets service quality requirements. For the 18 eight SQIs with benchmarks, all performed at or better than the thresholds. For the four SQIs 19 that are informational only, performance generally remains at a level consistent with prior years. 20
Consistent with how SQIs were reviewed during the 2014-2019 PBR Plan term, FBC has 21 provided year-to-date 2020 SQI results in this annual review. In accordance with Order G-44-16, 22 the BCUC will evaluate FBC’s actual 2020 SQI performance in the Annual Review for 2022 23 Rates when actual SQI results are known. FBC also notes that it will provide information on the 24 2021 year-to-date SQI results in the Annual Review for 2022 Rates. 25
13.2 REVIEW OF THE PERFORMANCE OF SERVICE QUALITY INDICATORS 26
For each SQI, Table 13-1 provides a comparison of FBC’s June year-to-date performance for 27 2020 to the proposed benchmarks and thresholds as part of the MRP. Actual June year-to-date 28 results for 2020 are also provided for the four informational SQIs. 29
42 MRP Decision page 99 “the Panel determines that the existing approved process for interpreting metric
performance is to remain in effect over the term of the MRPs”.

FORTISBC INC. ANNUAL REVIEW FOR 2020 AND 2021 RATES
SECTION 13: SERVICE QUALITY INDICATORS PAGE 147
Table 13-1: Approved SQIs, Benchmarks and Actual Performance 1
Performance Measure Description
Benchmark
Threshold
June 2020 YTD
Safety SQIs Emergency Response Time
Percent of calls responded to within two hours >=93% 90.6% 91%
All Injury Frequency Rate (AIFR)
3 year average of lost time injuries plus medical treatment injuries per 200,000 hours worked
<=1.64 2.39 0.85
Responsiveness to Customer Needs SQIs First Contact Resolution
Percent of customers who achieved call resolution in one call >=78% 74% 82%43
Billing Index Measure of customer bills produced meeting performance criteria <=3.0 5.0 0.20
Meter Reading Accuracy
Number of scheduled meters that were read
>=98% 96% 99%
Telephone Service Factor (Non- Emergency)
Percent of non-emergency calls answered within 30 seconds or less
>=70% 68% 73%
Customer Satisfaction Index
Informational indicator - measures overall customer satisfaction - - 8.4
Average Speed of Answer
Informational indicator – the amount of time it takes to answer a call (seconds)
- - 47
Reliability SQIs System Average Interruption Duration Index (SAIDI) – Normalized
Annual SAIDI (average of cumulative customer outage time) 3.2244 4.52 3.36
System Average Interruption Frequency Index (SAIFI) - Normalized
Annual SAIFI (average customer outage)
1.57 2.19 1.74
Generator Forced Outage Rate
Informational indicator – Percent of time a generating unit is removed from service due to component failure or other events.
- - 1.0%
43 First Contact Resolution surveying was suspended from Mar 23 - May 3 2020 as a result of the COVID-19
pandemic, thus the YTD figure does not contain data for the period that surveys were suspended. 44 Benchmarks and thresholds for SAIDI and SAIFI as calculated in the MRP Compliance Filing.

FORTISBC INC. ANNUAL REVIEW FOR 2020 AND 2021 RATES
SECTION 13: SERVICE QUALITY INDICATORS PAGE 148
Performance Measure Description
Benchmark
Threshold
June 2020 YTD
Interconnection Utilization
Informational indicator – percent of time that an interconnection point was available and providing electrical service to wholesale customers.
- - 99.90%
1
In the following sections, FBC reviews each SQI’s year-to-date individual performance in 2020. 2 Discussion is also provided for the informational SQIs. 3
Safety Service Quality Indicators 4
Emergency Response Time 5 Emergency Response Time is the time elapsed from the initial identification of a loss of 6 electrical power (via a customer call or internal notification) to the arrival of FBC personnel on 7 site at the trouble location. This metric provides ongoing information to assess FBC crew sizes 8 and crew locations in response to system trouble. The target measures the percentage of 9 emergency calls responded to within two hours. The measure is calculated as follows: 10
Number of emergency calls responded to within two hours 11 Total number of emergency calls in the year 12
There are many variables affecting the response time, including time of day (i.e., during 13 business hours or after business hours), number and type of events (i.e., widespread outages), 14 available resources, location (i.e., travel times and traffic congestion) and weather conditions. 15
The June 2020 year-to-date performance is 91 percent, which is above the threshold. 16
For comparison, the Company’s annual results under the 2014-2019 PBR Plan and 2020 year-17 to-date emergency response time results are provided below. While the results have been 18 relatively consistent, variables such as the location and severity of outage and the number of 19 trouble calls contribute to the observed volatility in the annual performance for this metric. 20
Table 13-2: Historical Emergency Response Time 21
Description 2014 2015 2016 2017 2018 2019 June 2020 YTD
Results 91% 92% 97% 93% 94% 92% 91% Benchmark 93% 93% 93% 93% 93% 93% 93% Threshold 90.6% 90.6% 90.6% 90.6% 90.6% 90.6% 90.6%

FORTISBC INC. ANNUAL REVIEW FOR 2020 AND 2021 RATES
SECTION 13: SERVICE QUALITY INDICATORS PAGE 149
All Injury Frequency Rate 1 The All Injury Frequency Rate (AIFR) is an employee safety performance indicator based on 2 injuries per 200,000 hours worked, with injuries defined as lost time injuries (i.e., one or more 3 days missed from work) and medical treatments (i.e., medical treatment was given or 4 prescribed). The annual performance for this metric is calculated as: 5
Number of Employee Injuries x 200,000 hours 6 Total Exposure Hours Worked 7
For the purpose of this SQI, the measurement of performance is based on the three-year rolling 8 average of the annual results. 9
The June 2020 year-to-date performance (three-year rolling average) result is 0.85, which is 10 better than the benchmark. The 2020 year-to-date performance reflects zero Medical 11 Treatments and zero Lost Time Injuries. 12
Safety continues to be a core value for FBC and prevention of injury remains a key focus. FBC 13 continues to focus on and reinforce the fundamentals of safety through effective safe work 14 planning, identifying hazards and mitigating risks, detailed work observations, and thorough 15 event analysis, capturing learnings and identifying opportunities for continued improvement. 16
For comparison, the Company’s 2014 to 2019 annual and 2020 year-to-date AIFR results are 17 provided below. 18
Table 13-3: Historical All Injury Frequency Rate Results 19
Description 2014 2015 2016 2017 2018 2019 June 2020 YTD
Annual Results 3.21 1.54 1.15 1.13 1.56 0.46 0.00
Three year rolling average 2.58 2.52 1.97 1.27 1.28 1.06 0.85
Benchmark 1.64 1.64 1.64 1.64 1.64 1.64 1.64 Threshold 2.39 2.39 2.39 2.39 2.39 2.39 2.39
20
Responsiveness to Customer Needs Service Quality Indicators 21
First Contact Resolution 22 First Contact Resolution (FCR) measures the percentage of customers who receive resolution 23 to their issue in one contact with FBC. The Company determines the FCR results using a 24 customer survey, tracking the number of customers who responded that their issue was 25 resolved in the first contact with the Company. The FCR rate is impacted by factors such as the 26 quality and effectiveness of the Company’s coaching and training programs and the composition 27 of the different call drivers. 28
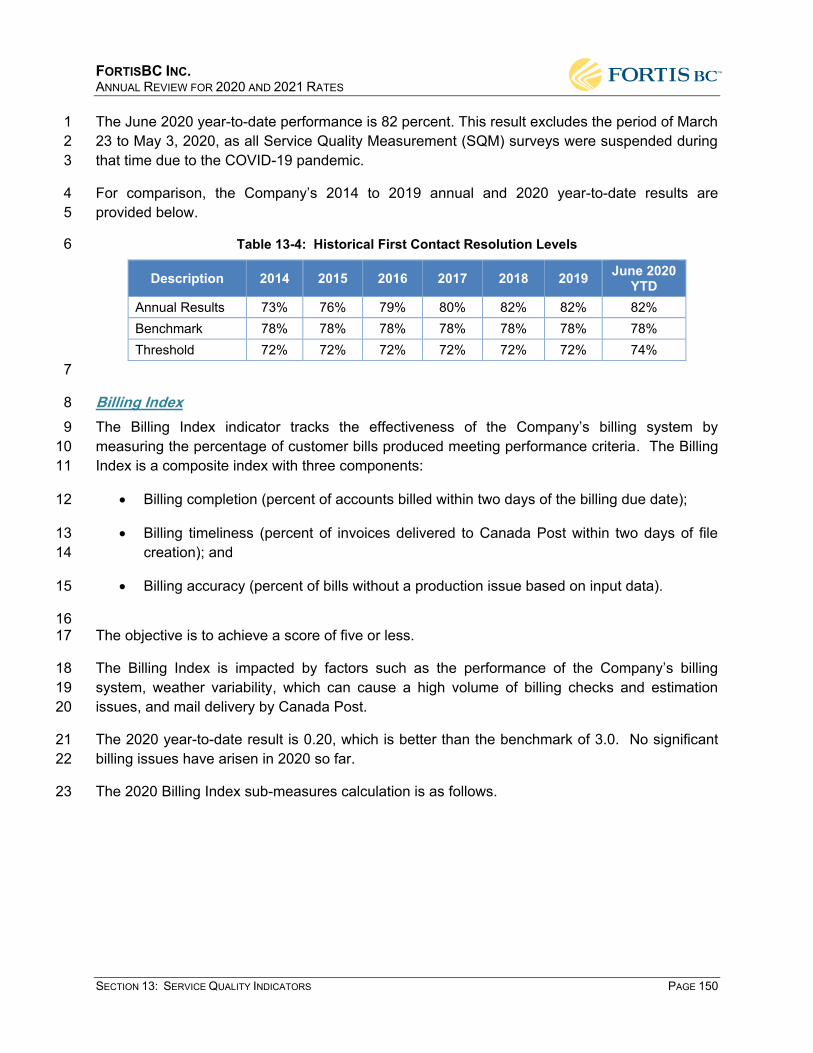
FORTISBC INC. ANNUAL REVIEW FOR 2020 AND 2021 RATES
SECTION 13: SERVICE QUALITY INDICATORS PAGE 150
The June 2020 year-to-date performance is 82 percent. This result excludes the period of March 1 23 to May 3, 2020, as all Service Quality Measurement (SQM) surveys were suspended during 2 that time due to the COVID-19 pandemic. 3
For comparison, the Company’s 2014 to 2019 annual and 2020 year-to-date results are 4 provided below. 5
Table 13-4: Historical First Contact Resolution Levels 6
Description 2014 2015 2016 2017 2018 2019 June 2020 YTD
Annual Results 73% 76% 79% 80% 82% 82% 82% Benchmark 78% 78% 78% 78% 78% 78% 78% Threshold 72% 72% 72% 72% 72% 72% 74%
7
Billing Index 8 The Billing Index indicator tracks the effectiveness of the Company’s billing system by 9 measuring the percentage of customer bills produced meeting performance criteria. The Billing 10 Index is a composite index with three components: 11
Billing completion (percent of accounts billed within two days of the billing due date); 12
Billing timeliness (percent of invoices delivered to Canada Post within two days of file 13 creation); and 14
Billing accuracy (percent of bills without a production issue based on input data). 15
16 The objective is to achieve a score of five or less. 17
The Billing Index is impacted by factors such as the performance of the Company’s billing 18 system, weather variability, which can cause a high volume of billing checks and estimation 19 issues, and mail delivery by Canada Post. 20
The 2020 year-to-date result is 0.20, which is better than the benchmark of 3.0. No significant 21 billing issues have arisen in 2020 so far. 22
The 2020 Billing Index sub-measures calculation is as follows. 23

FORTISBC INC. ANNUAL REVIEW FOR 2020 AND 2021 RATES
SECTION 13: SERVICE QUALITY INDICATORS PAGE 151
Table 13-5: Calculation of 2020 Billing Index 1
2 For comparison, the Company’s 2014 to 2019 annual and 2020 year-to-date results are 3 provided below. 4
Table 13-6: Historical Billing Index Results 5
Description 2014 2015 2016 2017 2018 2019 June 2020 YTD
Annual Results 2.34 0.39 0.57 0.15 0.29 1.96 0.20 Benchmark 5.0 5.0 5.0 5.0 5.0 5.0 3.0 Threshold 5.0 5.0 5.0 5.0 5.0 5.0 5.0
6
Meter Reading Accuracy 7 This SQI compares the number of meters that are read to those scheduled to be read. 8 Providing accurate and timely meter reads for customers is a key driver for the Company and its 9 customers. The results are calculated as: 10
Number of scheduled meters read 11 Number of scheduled meters for reading 12
The 2020 year-to-date result is 99 percent, which is better than the benchmark. 13
For comparison, the Company’s 2014 to 2019 annual and 2020 year-to-date results are 14 provided below. 15
Billing sub-measure Percent Achieved (PA) Formula Result
Billing Accuracy (Percent of bills without a Production Issue, based on input data); Target: 99.9%
100.00% If
(PA≥99.9%,5000*(1 - PA),1.05-PA))
=5000*(1-1) 0.00
Billing Timeliness (Percent of invoices delivered to Canada Post within 2 days of file creation); Target: 95%
100.00% (100%-PA)*100 =(100%-100%)*100 0
Billing Completion (Percent of accounts billed within 2 days of the billing due date); Target: 95%
99.39% (100%-PA)*100 =(100%-99.39%)*100 0.61
Billing Service Quality Indicator; Target < 3.0
(Accuracy PA+Timeliness PA+Completion
PA)/3
=(0+0+.61) /3 0.20
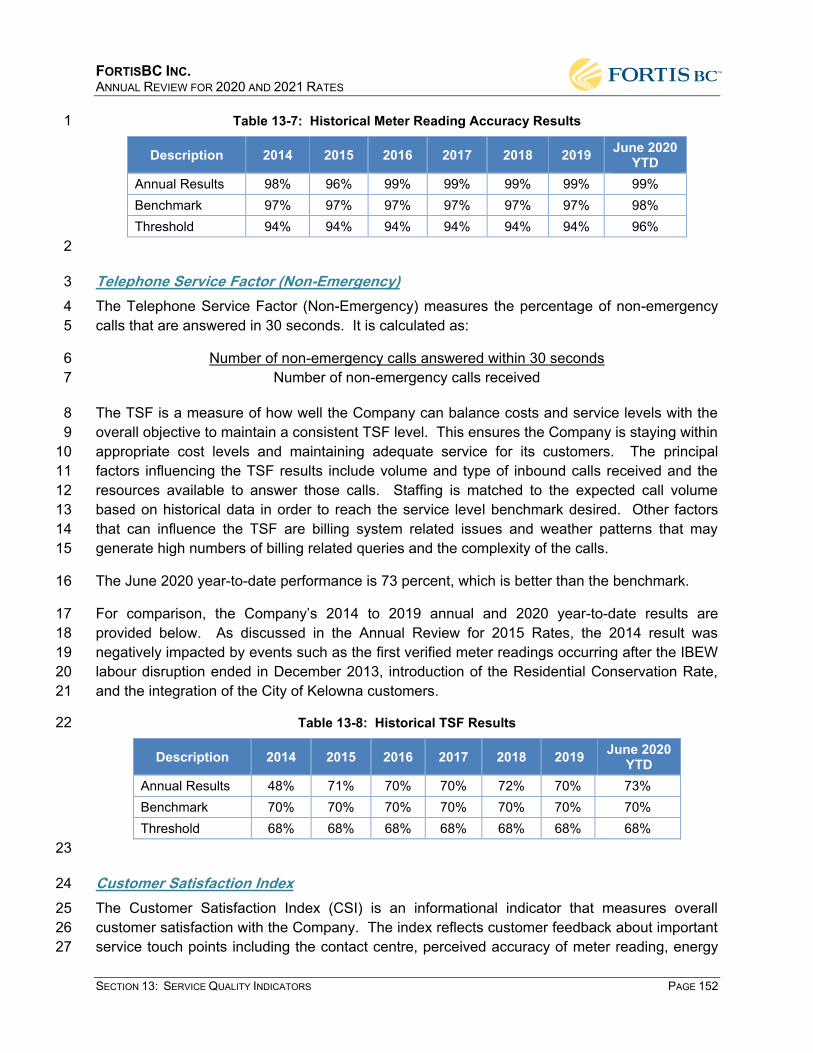
FORTISBC INC. ANNUAL REVIEW FOR 2020 AND 2021 RATES
SECTION 13: SERVICE QUALITY INDICATORS PAGE 152
Table 13-7: Historical Meter Reading Accuracy Results 1
Description 2014 2015 2016 2017 2018 2019 June 2020 YTD
Annual Results 98% 96% 99% 99% 99% 99% 99% Benchmark 97% 97% 97% 97% 97% 97% 98% Threshold 94% 94% 94% 94% 94% 94% 96%
2
Telephone Service Factor (Non-Emergency) 3 The Telephone Service Factor (Non-Emergency) measures the percentage of non-emergency 4 calls that are answered in 30 seconds. It is calculated as: 5
Number of non-emergency calls answered within 30 seconds 6 Number of non-emergency calls received 7
The TSF is a measure of how well the Company can balance costs and service levels with the 8 overall objective to maintain a consistent TSF level. This ensures the Company is staying within 9 appropriate cost levels and maintaining adequate service for its customers. The principal 10 factors influencing the TSF results include volume and type of inbound calls received and the 11 resources available to answer those calls. Staffing is matched to the expected call volume 12 based on historical data in order to reach the service level benchmark desired. Other factors 13 that can influence the TSF are billing system related issues and weather patterns that may 14 generate high numbers of billing related queries and the complexity of the calls. 15
The June 2020 year-to-date performance is 73 percent, which is better than the benchmark. 16
For comparison, the Company’s 2014 to 2019 annual and 2020 year-to-date results are 17 provided below. As discussed in the Annual Review for 2015 Rates, the 2014 result was 18 negatively impacted by events such as the first verified meter readings occurring after the IBEW 19 labour disruption ended in December 2013, introduction of the Residential Conservation Rate, 20 and the integration of the City of Kelowna customers. 21
Table 13-8: Historical TSF Results 22
Description 2014 2015 2016 2017 2018 2019 June 2020 YTD
Annual Results 48% 71% 70% 70% 72% 70% 73% Benchmark 70% 70% 70% 70% 70% 70% 70% Threshold 68% 68% 68% 68% 68% 68% 68%
23
Customer Satisfaction Index 24 The Customer Satisfaction Index (CSI) is an informational indicator that measures overall 25 customer satisfaction with the Company. The index reflects customer feedback about important 26 service touch points including the contact centre, perceived accuracy of meter reading, energy 27

FORTISBC INC. ANNUAL REVIEW FOR 2020 AND 2021 RATES
SECTION 13: SERVICE QUALITY INDICATORS PAGE 153
conservation information and field services. The index includes feedback from both residential 1 and commercial customers. The survey is conducted quarterly and results are presented as a 2 score out of ten. 3
The CSI survey investigates service quality as well as customer attitudes that are often 4 influenced by factors outside the Company’s control. Important examples include storm-related 5 unplanned outages and media coverage. 6
The average index score for June 2020 year-to-date is 8.4, slightly lower than the 8.5 score for 7 the same period last year. Of the five measures that make up the overall customer satisfaction 8 score, the results for June 2020 year-to-date were lower in three, higher in one, and static in 9 another category compared to June 2019 year-to-date performance. Customer attitudes about 10 the Company’s contact centre decreased by two points from 8.5 to 8.3. There are small 11 decreases in scores for both accuracy of meter reading and energy conservation information 12 metrics, with the former decreasing from 8.3 to 8.2, and the latter from 7.7 to 7.6. Satisfaction 13 with field services increased from 8.9 to 9.0, while overall satisfaction remained static at 8.4. 14
For comparison, the Company’s 2014 to 2019 annual and 2020 year-to-date results are 15 provided below. 16
Table 13-9: Historical Customer Satisfaction Results 17
Description 2014 2015 2016 2017 2018 2019 June 2020 YTD
Annual Results 8.1 8.1 8.2 8.2 8.3 8.7 8.4 Benchmark n/a n/a n/a n/a n/a n/a n/a Threshold n/a n/a n/a n/a n/a n/a n/a
Average Speed of Answer 18 The Average Speed of Answer (ASA) is an informational indicator that measures the amount of 19 time it takes for a customer service representative to answer a customer’s call (seconds). 20
The June 2020 year-to-date result of 47 seconds is consistent with prior years’ results. 21
For comparison, the Company’s 2014 to 2019 annual and 2020 year-to-date results are 22 provided below.45 23
45 ASA in 2014 is higher than other years due to the impact of the six months of job action that took place in Q3 and
Q4 of 2013. This job action resulted in a higher number of bill estimates, which led to a higher volume of customer inquiries in 2014 as bill adjustments were made reflecting actual meter reads.

FORTISBC INC. ANNUAL REVIEW FOR 2020 AND 2021 RATES
SECTION 13: SERVICE QUALITY INDICATORS PAGE 154
Table 13-10: Average Speed of Answer 1
Description 2014 2015 2016 2017 2018 2019 June 2020 YTD
Annual Results 226 49 48 49 49 49 47 Benchmark n/a n/a n/a n/a n/a n/a n/a Threshold n/a n/a n/a n/a n/a n/a n/a
Reliability Service Quality Indicators 2
FBC measures transmission and distribution system reliability according to the Institute of 3 Electrical and Electronics Engineers (IEEE) method of normalizing reliability statistics by 4 excluding “major events”. Major events are identified as those that cause outages exceeding a 5 threshold number of customer-hours. Threshold values are calculated by applying a statistical 6 method called the “2.5 Beta” adjustment to historical reliability data. Any single outage event 7 that exceeds the threshold value is excluded from the reliability data. Excluding major events 8 allows them to be studied separately and reveals trends in daily operations that would be hidden 9 or skewed if they were included in the data set. Major event days in the FBC service territory 10 have been caused by mudslides, wind or snow storms, and wildfires. 11
Reported outages included in these measures are of one minute or longer in duration, which is 12 consistent with the Canadian Electricity Association (CEA) standard for reporting. 13
System Average Interruption Duration Index (SAIDI) – Normalized 14 SAIDI is the amount of time the average customer’s power is off during the year (i.e., the total 15 amount of time the average customer’s clock would lose during a year), after adjusting for the 16 impact of major events as described above, and is calculated as follows: 17
Total Customer Hours of Interruption 18 Total Number of Customers Served 19
Customer Hours of Interruption related to a power outage are calculated by multiplying the 20 number of customers affected by the outage by the duration of the outage. 21
For the purpose of this SQI, the measurement of performance is based on the annual results. 22
The June 2020 year-to-date result of 3.36 is consistent with the proposed benchmark and 23 threshold set out in the MRP Compliance Filing. To adjust the benchmark for the influence of 24 the Outage Management System (OMS), FBC proposed to update the existing SAIDI three-year 25 rolling average benchmark using the most recent three full years of results (i.e., 2017, 2018 and 26 2019), which incorporate the impact of the OMS. Similar to the approach used to determine the 27 thresholds for the 2014-2019 PBR Plan term, the proposed threshold is based on statistical 28 analysis (i.e., standard deviation) of the SAIDI historical results from 2010 to 2019. 29
In 2020, there have been two days that qualified as a “major event” day. The first major event 30 day was a heavy snowstorm that started in the afternoon of December 31, 2019 and continued 31

FORTISBC INC. ANNUAL REVIEW FOR 2020 AND 2021 RATES
SECTION 13: SERVICE QUALITY INDICATORS PAGE 155
to January 1, 2020. It resulted in approximately 20,000 customer hours interrupted and 1 impacted 1,100 customers on December 31st. The January 1st totals were approximately 37,000 2 customer hours interrupted and impacted 5,000 customers. The second major event day was 3 on March 4, 2020 due to a major windstorm. It impacted approximately 13,750 customers and 4 63,800 customer hours. 5
For comparison, the Company’s 2014 to 2019 annual and 2020 year-to-date results are 6 provided below. From 2014 to 2019, the benchmark and the threshold reflect the values 7 established under the PBR Plan using three-year rolling average results. For 2020, the 8 benchmark is based on an average of the most recent three-year results (i.e., 2017, 2018 and 9 2019) with the threshold based on historical volatility as described above. 10
Table 13-11: Historical SAIDI Results 11
Description 2014 2015 2016 2017 2018 2019 June 2020 YTD
Annual normalized results 2.32 2.13 2.10 4.05 3.15 2.45 3.36
Benchmark 2.22 2.22 2.22 2.22 2.22 2.22 3.22 Threshold 2.62 2.62 2.62 2.62 2.62 2.62 4.52
12
System Average Interruption Frequency Index (SAIFI) – Normalized 13 SAIFI is the average number of interruptions per customer served per year (i.e., the number of 14 times the average customer would have to reset their clock during the year), after adjusting for 15 the impact of major events as described above, and is calculated as follows: 16
Total Number of Customer Interruptions 17 Total Number of Customers Served 18
The Number of Customer Interruptions related to a power outage is the number of customers 19 affected by the outage. 20
For the purpose of this SQI, the measurement of performance is based on the annual results. 21
The June 2020 year-to-date result of 1.74 is consistent with the proposed benchmark and 22 threshold set out in the MRP Compliance Filing. To adjust the benchmark for the influence of 23 the OMS on the reported results, FBC proposed to update the existing SAIFI three-year rolling 24 average benchmark using the most recent three full years of results (i.e., 2017, 2018 and 2019), 25 which incorporate the impact of the OMS. Similar to the approach used to determine the 26 thresholds for the 2014-2019 PBR Plan term, the proposed threshold is based on statistical 27 analysis (i.e., standard deviation) of the SAIFI historical results from 2010 to 2019. 28
For comparison, the Company’s 2014 to 2019 annual and 2020 year-to-date results are 29 provided below. From 2014 to 2019, the benchmark and the threshold reflect the values 30 established under the PBR Plan using three-year rolling average results. For 2020, the 31

FORTISBC INC. ANNUAL REVIEW FOR 2020 AND 2021 RATES
SECTION 13: SERVICE QUALITY INDICATORS PAGE 156
benchmark is based on an average of the most recent three-year results (i.e., 2017, 2018 and 1 2019) with the threshold based on historical volatility. 2
Table 13-12: Historical SAIFI Results 3
Description 2014 2015 2016 2017 2018 2019 June 2020 YTD
Annual normalized results 1.64 1.56 1.34 1.78 1.73 1.21 1.74
Benchmark 1.64 1.64 1.64 1.64 1.64 1.64 1.57 Threshold 2.50 2.50 2.50 2.50 2.50 2.50 2.19
Generator Forced Outage Rate 4 Generator Forced Outage Rate (GFOR), an informational indicator, is a measure of the 5 percentage of time in one year that the generating units experienced forced outages compared 6 to the amount of time they could have operated without a forced outage. A forced outage 7 means the removal of a generating unit from service due to the occurrence of a component 8 failure or other event, making it unavailable to produce power due to the unexpected 9 breakdown. The GFOR is defined by the CEA as follows: 10
Total Forced Outage Time e 11 Total Forced Outage Time + Total Operating Time 12
The June 2020 year-to-date result of 1.0 percent is generally consistent with prior years’ results. 13 The year-to-date result was impacted by an outage in June 2020 at the UBO Unit 1 related 14 mainly to the generator, lasting approximately 14 days. 15
For comparison, the Company’s 2014 to 2019 annual and 2020 year-to-date results are 16 provided below. 17
Table 13-13: Historical Generator Forced Outages 18
2014 2015 2016 2017 2018 2019 June 2020 YTD
FBC 1.7% 0.1% 0.8% 0.6% 0.4% 0.1% 1.0% CEA 6.3% 6.2% 6.2% 6.2% 6.7% TBD TBD 19
Interconnection Utilization 20 Interconnection Utilization, an informational indicator, is a measurement of the time that an 21 interconnection point was available and providing electrical service to the municipal wholesale 22 customers (City of Penticton, City of Summerland, City of Grand Forks and City of Nelson). 23 There are twelve points of interconnection combined between the four customers. 24
The Interconnection Utilization metric for the interconnection points listed is calculated as 25 follows: 26
X 100

FORTISBC INC. ANNUAL REVIEW FOR 2020 AND 2021 RATES
SECTION 13: SERVICE QUALITY INDICATORS PAGE 157
Total Operating Hours 1 Total Operating Hours + Total Outage Time 2
The June 2020 year-to-date result of 99.90 percent is consistent with prior years’ results. 3
For comparison, the Company’s 2014 to 2019 annual and 2020 year-to-date results are 4 provided below. 5
Table 13-14: Interconnection Utilization 6
Description 2014 2015 2016 2017 2018 2019 June 2020 YTD
Interconnection Utilization 99.99% 99.94% 99.99% 99.95% 99.96% 99.98% 99.90%
Benchmark n/a n/a n/a n/a n/a n/a n/a Threshold n/a n/a n/a n/a n/a n/a n/a
13.3 SUMMARY 7
In summary, FBC’s June 2020 year-to-date SQI results indicate that the Company’s overall 8 performance meets service quality requirements. At the end of June 2020, for the eight SQIs 9 with benchmarks, all performed at or better than the thresholds. For the four SQIs that are 10 informational only, performance generally remains at a level consistent with prior years. 11

FORTISBC INC. ANNUAL REVIEW FOR 2020 AND 2021 RATES
SECTION 14: PBR ELEMENTS PAGE 158
14. PBR ELEMENTS 1
14.1 INTRODUCTION AND OVERVIEW 2
The setting of rates for 2020 includes elements related to the conclusion of the 2014-2019 PBR 3 Plan, which are discussed in this section. Calculations for the true-up of rate base, 2019 Flow-4 through account, Earnings Sharing Mechanism, and Service Quality Indicator results are 5 included in this section. 6
14.2 TRUE-UP OF PBR PLAN RATE BASE 7
During the term of the 2014-2019 PBR Plan, capital expenditures in excess of formula but within 8 the defined dead band (10 percent on an annual basis, or 15 percent on a two-year basis) were 9 excluded from rate base. For FBC, the cumulative amount of capital excluded from rate base 10 was $17.088 million (Table 14-3, Line 33, Column 2). As provided in the 2014-2019 PBR Plan, 11 this amount is added to plant in service effective January 1, 2020. 12
Also included in the January 1, 2020 adjustment to plant in service is the $8.827 million in 2019 13 expenditures that exceeded the dead band (Table 14-3, Line 30, Column 7). Under the 2014-14 2019 PBR Plan, expenditures outside of the dead band enter rate base on January 1 of the 15 following year. The total adjustment to plant in service at January 2020 is therefore $25.915 16 million ($17.088 million plus $8.827 million) as shown in Section 11 – 2020, Schedule 6.1, Line 17 19, Column 4. 18
Correspondingly, depreciation expense reflects the aforementioned adjustments to 2020 19 opening plant. 20
14.3 2019 FLOW-THROUGH ACCOUNT 21
As approved by Order G-163-14, the Flow-through deferral account is used to capture the 22 annual variances during the 2014-2019 PBR Plan term between the approved and actual 23 amounts for all costs and revenues which are included in rates on a forecast basis and which do 24 not have a previously approved deferral account. 25
The final amount to be distributed to customers in 2020 is a credit of $7.475 million (after tax) 26 and is comprised of the following: 27
A net variance between approved and actual of $6.352 million (credit) in flow-through 28 items for 2019. The variance is primarily the result of lower power purchase expense, 29 lower income taxes and higher apparatus rental revenue, partially offset by lower sales 30 revenue; and 31
A true-up to actual of $1.122 million (credit) to the projected ending 2018 Flow-through 32 account balance, also resulting from lower power purchase expense, lower income taxes 33

FORTISBC INC. ANNUAL REVIEW FOR 2020 AND 2021 RATES
SECTION 14: PBR ELEMENTS PAGE 159
and higher apparatus rental revenue, partially offset by lower sales revenue. The $1.122 1 million credit is the difference between the projected ending 2018 Flow-through deferral 2 account balance embedded in 2019 rates of $12.788 million46 (credit) and the actual 3 ending 2018 deferral account balance of $13.910 million (credit). 4
5 The total of the amounts above results in a return to customers of $7.475 million (after tax) in 6 2020, as shown in the non-rate base deferral section of the financial schedules in Section 11 - 7 2020, Schedule 12 and in Table 14-1 below. 8
Table 14-1: 2019 Flow-Through Deferral Account Additions ($ millions) 9
10
46 Annual Review for 2019 Rates Compliance Filing financial schedules, Schedule 12, Line 5, Column 2.
LineNo. Particulars
(1)
1 Revenue $ (370.534) $ (367.649) $ 2.88523 Power Purchase Expense 145.065 139.002 (6.063) 45 Water Fees 10.465 10.396 (0.069) 67 Wheeling 5.235 5.896 0.660 89 O&M Tracked Outside of Formula10 Insurance Premiums 1.283 1.381 0.098 11 Advanced Metering Infrastructure Project (1.161) (1.296) (0.134) 12 Mandatory Reliability Standards 0.940 0.891 (0.049) 13 Upper Bonnington Unit 3 Annual Inspection (0.042) (0.042) - 14 MSP Premium Reduction (0.168) (0.180) (0.012) 15 Employer Health Tax 0.576 0.556 (0.020) 1617 Property Tax 16.713 16.664 (0.049) 1819 Depreciation and Amortization 48.473 49.291 0.818 2021 Other Revenue (9.268) (10.627) (1.359) 2223 Interest Expense 40.956 40.465 (0.491) 2425 Income Tax 7.827 5.391 (2.436) 2627 2018 Working Capital Adjustment for AMI (0.046) 28 2019 Working Capital Adjustment for AMI (0.085) 2930 2019 After-Tax Flow-Through Addition to Deferral Account $ (6.352)3132 2018 Ending Deferral Account Balance True-Up $ (1.122)33 2020 After-Tax Amortization $ (7.475)
(2) (3) (4)
Approved Actual2019 2019 Variance

FORTISBC INC. ANNUAL REVIEW FOR 2020 AND 2021 RATES
SECTION 14: PBR ELEMENTS PAGE 160
14.4 EARNINGS SHARING 1
For 2020, FBC is proposing to recover through rates a $0.250 million pre-tax debit ($0.183 2 million after tax) as shown in Table 14-2 below. This amount is comprised of: 3
2019 actual sharing on formula O&M and capital expenditures; 4
An adjustment for actual customer growth in 2018 and 2019; and 5
The true-up of the 2018 projected earnings sharing to actual. 6
7 Table 14-2: Summary of Earnings Sharing to be Returned in 202047 ($ millions) 8
9
Each of these items is discussed in the sections below. 10
2019 Earnings Sharing 11
As set out in FBC’s letter dated November 7, 2014 in response to Order G-163-14 and as 12 approved by Order G-107-15 for FBC’s Annual Review for 2015 Rates, the earnings sharing is 13 calculated each year as one-half of the pre-tax earnings impact of the variances in the formula-14 driven gross O&M and cumulative capital expenditures, as follows: 15
Formula-driven O&M less actual base O&M48 x 50% + 16
((Cumulative formula-driven capital expenditures less cumulative actual base capital 17 expenditures49) x equity percentage x approved return on equity x 50%) divided by (1 – 18 the tax rate) 19
In 2019, FBC achieved formula-driven O&M savings of $0.565 million, and 2019 capital 20 expenditures exceeded the formula by $13.011 million. The $13.011 million excess 2019 21 capital expenditures exceeded the dead band by $8.827 million; therefore, FBC has removed 22 the $8.827 million amount above the dead band in the calculation of 2019 earnings sharing, as 23 shown in Line 30 of Table 14-3 below. 24
47 Financing on the deferral account balance is included in the deferred charges schedule in Section 11 - 2020,
Schedule 12, Line 26. 48 Excluding items that are reforecast outside of the formula. 49 Ibid.
Line After-taxNo. Description Amount Reference
1 2019 Actual Sharing 0.106 $ Table 14-3, Line 522 2018 Actual Customer Growth Adjustment 0.011 Table 14-4, Line 183 2019 Actual Customer Growth Adjustment 0.012 Table 14-5, Line 184 2019 Actual Customer Growth Adjustment O&M 0.026 Table 14-5, Line 275 2018 Projected vs. Actual Ending Balance True-Up 0.026 Table 14-6, Line 36 7 2020 After-Tax Amount Collected from Customers 0.183 8 2020 Pre-Tax Amount Collected from Customers 0.250

FORTISBC INC. ANNUAL REVIEW FOR 2020 AND 2021 RATES
SECTION 14: PBR ELEMENTS PAGE 161
Table 14-3: Calculation of 2019 Earnings Sharing ($ millions) 1
2
Actual Customer Growth Adjustment 3
As set out in Order G-15-15 in relation to formula capital expenditures: 4
FEI and FBC are approved to recover the variance in earned return driven by the 5 use of prior year customer additions for the growth term when compared to the 6 actual customer additions. This positive or negative variance in earned return 7 resulting from the Growth Term shall be recovered from or returned to customers 8 in the subsequent year through the earnings sharing mechanism. 9
Also as set out in Order G-15-15 in relation to formula O&M expenditures: 10
At the end of the PBR term, or any subsequent extension to the PBR term, FEI 11 and FBC are approved to adjust the earnings sharing calculation for the last year 12 of the PBR term to account for the actual growth in the last year of the PBR term. 13
LineNo. Particulars Cross Reference
(1) (2) (3) (4) (5) (6) (7) (8)
1 Approved Formula O&M 56,081 $ G-246-182 3 Actual Gross O&M 58,519 4 5 Less: O&M Tracked Outside of Formula6 Pension/OPEB (O&M Portion) 1,692 7 Insurance Premiums 1,381 8 Advanced Metering/Infrastructure Costs/Savings (1,296) 9 Mandatory Reliability Standards 891
10 Upper Bonnington Unit 3 Annual Inspection (42) 11 Employer Health Tax 556 12 MSP Reduction (180) 13 Total 3,003 Sum of Lines 6 - 1214 15 Actual Base O&M 55,516 Line 3 - Line 1316 17 O&M Subject to Sharing (565) $ Line 15 - Line 118 19 20 2014 2015 2016 2017 2018 2019 Note 121 22 Cumulative Formula Capital Expenditures 259,385 $ 42,193$ 42,384$ 42,874$ 43,254$ 43,818$ 44,862$ 23 24 Cumulative Total Regular Capital Expenditures 336,600 49,061 49,043 49,512 62,908 64,592 61,485 25 26 Less: Cumulative Pension and OPEB27 Tracked Outside of Formula 25,104 6,396 4,253 3,674 3,539 3,630 3,612 28 29 Actual Base Capital Expenditures 311,497 42,665 44,791 45,838 59,369 60,962 57,873 Line 24 - Line 2730 Dead Band Adjustment (35,024) (12,075) (14,122) (8,827) Adjustment to stay within deadband31 Actual Base Capital Expenditure for ESM Calculation 276,473 42,665 44,791 45,838 47,293 46,840 49,046 Line 29 - Line 3032 33 Actual Base Capital Expenditure Variance 17,088 472 2,407 2,964 4,039 3,022 4,184 Line 31 - Line 2234 35 Single Year Deadband % Variance (after adjustment) 0.97% 5.16% 6.37% 8.63% 6.37% 8.63% Line 33 ÷ (Line 22 + Line 27)36 Two year Cumlative Deadband % Variance (after adjustment) 6.13% 11.53% 15.00% 15.00% 15.00%37 38 39 40 Equity Component of Rate Base 40.00%41 Approved Return on Equity 9.15%42 After Tax Capital Expenditures Subject to Sharing 625 $ Product of Lines 33, 40 & 4143 44 Tax Rate 27.00%45 46 Before Tax Capital Expenditures Subject to Sharing 857 $ Line 42 ÷ (1 - Line 44)47 48 Total Before Tax Sharing Account 292 Line 17 + Line 4649 Sharing Percentage 50.00% G-139-1450 51 2019 Actual Earnings Sharing (Pre-Tax) 146 $ Line 48 x Line 4952 2019 Actual Earnings Sharing (After-Tax) 106 $ Line 51 x 0.73
Notes1 Actual results from BCUC Annual Report
Annual Capital Expenditures

FORTISBC INC. ANNUAL REVIEW FOR 2020 AND 2021 RATES
SECTION 14: PBR ELEMENTS PAGE 162
Based on its actual customer additions, FBC has calculated the resulting adjustments of $0.015 1 million debit ($0.011 million debit after tax) for 2018 capital expenditures, $0.017 million debit 2 ($0.012 million debit after tax) for 2019 capital expenditures, and $0.036 million debit ($0.026 3 million debit after tax) for 2019 O&M expenditures, as shown in Tables 14-4 and 14-5 below. 4
Table 14-4: Calculation of Earnings Sharing Adjustment for 2018 Actual Customer Growth 5 ($ millions) 6
7
LineNo. Description Reference
1 Average Customers 2018 137,299 2 Average Customers 2017 134,246 3 Growth in Average Customers 3,054 Line 1 - Line 24 Average Customer Growth 2.275% Line 3 ÷ Line 25 50% G-139-146 Average Customer Growth to be recast in Formula 1.137%
7 2018 Net Inflation Factor 0.671% G-38-18 Compliance Filing, Section 11, Schedule 3, Line 9, Column 7
8 2017 Reforecast Formulaic Capital 43.491 $ Annual Review for 2019 Rates, Table 10-3, Line 9
9 2018 Reforecast Formulaic Capital 44.281 $ Line 8 x (1 + Line 7) x (1 + Line 6)
10 2018 Year Formulaic Capital 43.818 $ G-38-18 Compliance Filing, Section 11, Schedule 4, Line 17, Column 4
11 12 Increase in Capital Requirements from Actual Growth 0.463 $ Line 9 - Line 1013 Mid-Year 0.231 $ Line 12 x 0.514
15 Equity Cost Component 3.66% G-38-18 Compliance Filing, Section 11, Schedule 26, Line 3, Column 6
16 Debt Cost Component 3.03% G-38-18 Compliance Filing, Section 11, Schedule 26, Lines 1+2, Column 6
17 Earned Return on Incremental Capital Requirements (Pre-Tax) 0.015 $ Line 13 x (line 15 + Line 16)18 Earned Return on Incremental Capital Requirements (After-Tax) 0.011 $ Line 17 x 0.73

FORTISBC INC. ANNUAL REVIEW FOR 2020 AND 2021 RATES
SECTION 14: PBR ELEMENTS PAGE 163
Table 14-5: Calculation of Earnings Sharing Adjustment for 2019 Actual Customer Growth 1 ($ millions) 2
3
True-Up for 2018 Actual Earnings Sharing 4
In FBC’s 2018 Annual Report to the BCUC, FBC calculated the final 2018 earnings sharing 5 based on the final 2018 results. The final amount of earnings sharing for 2018 was $0.226 6 million, which was $0.026 million lower than the $0.252 million projected for 2018, as shown in 7 Table 14-6 below. As a result, FBC is recovering the 2018 earnings sharing variance between 8 the projected and actual amounts of $0.026 million (after-tax) in 2020 rates. 9
LineNo. Description Reference
1 Average Customers 2019 139,916 2 Average Customers 2018 137,299 3 Growth in Average Customers 2,616 Line 1 - Line 24 Average Customer Growth 1.906% Line 3 ÷ Line 25 50% G-139-146 Average Customer Growth to be recast in Formula 0.953%
7 2019 Net Inflation Factor 1.481% G-246-18 Compliance Filing, Section 11, Schedule 3, Line 9, Column 8
8 2018 Reforecast Formulaic Capital 44.281 $ Note 1 9 2019 Reforecast Formulaic Capital 45.365 $ Line 8 x (1 + Line 7) x (1 + Line 6)
10 2019 Year Formulaic Capital 44.862 $ G-246-18 Compliance Filing, Section 11, Schedule 4, Line 20, Column 4
11 12 Increase in Capital Requirements from Actual Growth 0.503 $ Line 9 - Line 1013 Mid-Year 0.251 $ Line 12 x 0.514
15 Equity Cost Component 3.66% G-246-18 Compliance Filing, Section 11, Schedule 26, Line 3, Column 6
16 Debt Cost Component 3.06% G-246-18 Compliance Filing, Section 11, Schedule 26, Lines 1+2, Column 6
17 Earned Return on Incremental Capital Requirements (Pre-Tax) 0.017 $ Line 13 x (line 15 + Line 16)18 Earned Return on Incremental Capital Requirements (After-Tax) 0.012 $ Line 17 x 0.7319 20 21 Average Customer Growth to be recast in Formula 0.953% Line 622 2019 Net Inflation Factor 1.481% Line 7
23 2018 Formula O&M 54.776 $
G-246-18 Compliance Filing, Section 11, Schedule 20, Line 19, Column 2
24 2019 Reforecast O&M 56.117 $ Line 23 x (1 + Line 22) x (1 + Line 21)
25 2019 Formulaic O&M 56.081 $
G-246-18 Compliance Filing, Section 11, Schedule 20, Line 22, Column 2
26 2019 O&M difference from Actual Customer Growth (pre-tax) 0.036 $ Line 24 - Line 25 27 2019 O&M difference from Actual Customer Growth (after-tax) 0.026 $ Line 26 x 0.73
Notes1 Table 14-4 (2018), Line 9

FORTISBC INC. ANNUAL REVIEW FOR 2020 AND 2021 RATES
SECTION 14: PBR ELEMENTS PAGE 164
Table 14-6: Calculation of 2018 Actual Earnings Sharing True-up ($millions) 1
2
Summary of 2019 Earnings Sharing 3
After calculating the 2019 actual earnings sharing and including the adjustments described 4 above, FBC proposes to recover $0.250 million pre-tax ($0.183 million after tax) from customers 5 in 2020 revenue requirements. 6
14.5 SERVICE QUALITY INDICATORS 7
For the 2014-2019 PBR Plan, the BCUC approved a balanced set of SQIs covering safety, 8 responsiveness to customer needs, and reliability. Eight of the SQIs have benchmarks and 9 performance ranges set by a threshold level, as outlined in the Consensus Recommendation 10 approved by the BCUC in Order G-14-15. Three of the SQIs are for information only, and as 11 such do not have benchmarks or performance ranges. 12
For each SQI, Table 14-7 below provides a comparison of FBC’s 2019 SQI results under the 13 2014-2019 PBR Plan to the BCUC-approved benchmarks and includes the performance range 14 thresholds that have been agreed to in the Consensus Recommendation that was approved by 15 the BCUC. Actual 2019 results are also provided for the three informational SQIs. 16
Table 14-7: Approved SQIs, Benchmarks and Actual Performance 17
Performance Measure Description Benchmark Threshold 2019
Results
Safety SQIs Emergency Response Time
Percent of calls responded to within two hours >=93% 90.6% 92%
All Injury frequency rate (AIFR)
3 year average of lost time injuries plus medical treatment injuries per 200,000 hours worked
<=1.64 2.39 1.05
Responsiveness to Customer Needs SQIs First Contact Resolution
Percent of customers who achieved call resolution in one call >=78% 72% 82%
Billing Index Measure of customer bills produced meeting performance criteria <=5.0 <=5.0 1.96
Meter Reading Accuracy
Number of scheduled meters that were read >=97% 94% 99%
Line After-taxNo. Description Amount Reference
1 2018 Actual Earnings Sharing Account Ending Balance (0.226) $ 2018 Annual Report to BCUC
2 2018 Projected Earnings Sharing Account Ending Balance (0.252) G-246-18 Compliance Filing, Section 11, Schedule 12, Line 26, Column 2
3 2018 Earnings Sharing Account True-Up 0.026 $

FORTISBC INC. ANNUAL REVIEW FOR 2020 AND 2021 RATES
SECTION 14: PBR ELEMENTS PAGE 165
Performance Measure Description Benchmark Threshold 2019
Results
Telephone Service Factor (Non- Emergency)
Percent of non-emergency calls answered within 30 seconds or less >=70% 68% 70%
Customer Satisfaction Index
Informational indicator - measures overall customer satisfaction - - 8.7
Telephone Abandon Rate
Informational indicator – percent of calls abandoned by the customer before speaking to a customer service representative
- - 5.7%
Reliability SQIs System Average Interruption Duration Index (SAIDI) – Normalized
3 year average of SAIDI (average of cumulative customer outage time) <=2.22 2.62 3.22
System Average Interruption Frequency Index (SAIFI) - Normalized
3 year average of SAIFI (average customer outage) <=1.64 2.50 1.57
Generator Forced Outage Rate
Informational indicator – Percent of time a generating unit is removed from service due to component failure or other events.
- - 0.1%
1
For all the SQIs with BCUC-approved benchmarks and agreed upon thresholds, except for 2 SAIDI, 2019 annual performance was better than the thresholds. Further, with the exception of 3 Emergency Response Time, 2019 annual performance met or was better than the approved 4 benchmarks. For the SAIDI and SAIFI SQIs, in 2019, there were no qualifying Major Events. 5
As discussed in the FBC Annual Review for 2019 Rates, SAIDI results in recent years have 6 been influenced by the implementation of the Outage Management System (OMS), a system 7 used to record distribution outages based on the Outage Start Time. With the change to the 8 OMS and a different definition to the Outage Start Time, the reported outage times have 9 increased, causing the SAIDI values reported to increase, even though there has been no 10 change in the Company’s operating practices. 11
In the BCUC’s Decision and Order G-246-18 regarding 2018 performance, the BCUC accepted 12 FBC’s explanation for the higher SAIDI results (at page 17): 13
While the Panel acknowledges ICG’s concerns regarding FBC’s SAIDI 14 performance, we accept FBC’s explanation that the decline in SAIDI results are 15 related to a combination of the introduction of the OMS, adverse weather, foreign 16 interference (e.g. vehicle incidents) and forest fires. The Panel finds no evidence 17

FORTISBC INC. ANNUAL REVIEW FOR 2020 AND 2021 RATES
SECTION 14: PBR ELEMENTS PAGE 166
to suggest a serious degradation of service has occurred and, accordingly, does 1 not consider that a financial penalty is warranted. Notwithstanding, the Panel 2 takes note of the potential decline in SAIDI performance created by the 3 implementation of the OMS, and encourages FBC to incorporate the impact of 4 the OMS in setting a future benchmark for SAIDI. 5
Similarly, the higher SAIDI and SAIFI results in 2019 were due to the impact of the OMS. 6 Therefore, FBC submits that the SAIDI results for 2019 are acceptable. 7
For 2020 and future years, FBC will use updated benchmarks and thresholds that incorporate 8 the impact of the OMS, as set out in the Company’s July 20, 2020 MRP Compliance Filing in 9 response to Directive 35 of the MRP Decision: Updated Benchmarks and Thresholds for FBC’s 10 SQIs SAIDI and SAIFI. 11
In summary, FBC’s 2019 SQI results indicate that the Company’s overall performance meets 12 service quality standards. 13

Appendix A LOAD FORECAST SUPPLEMENTARY INFORMATION
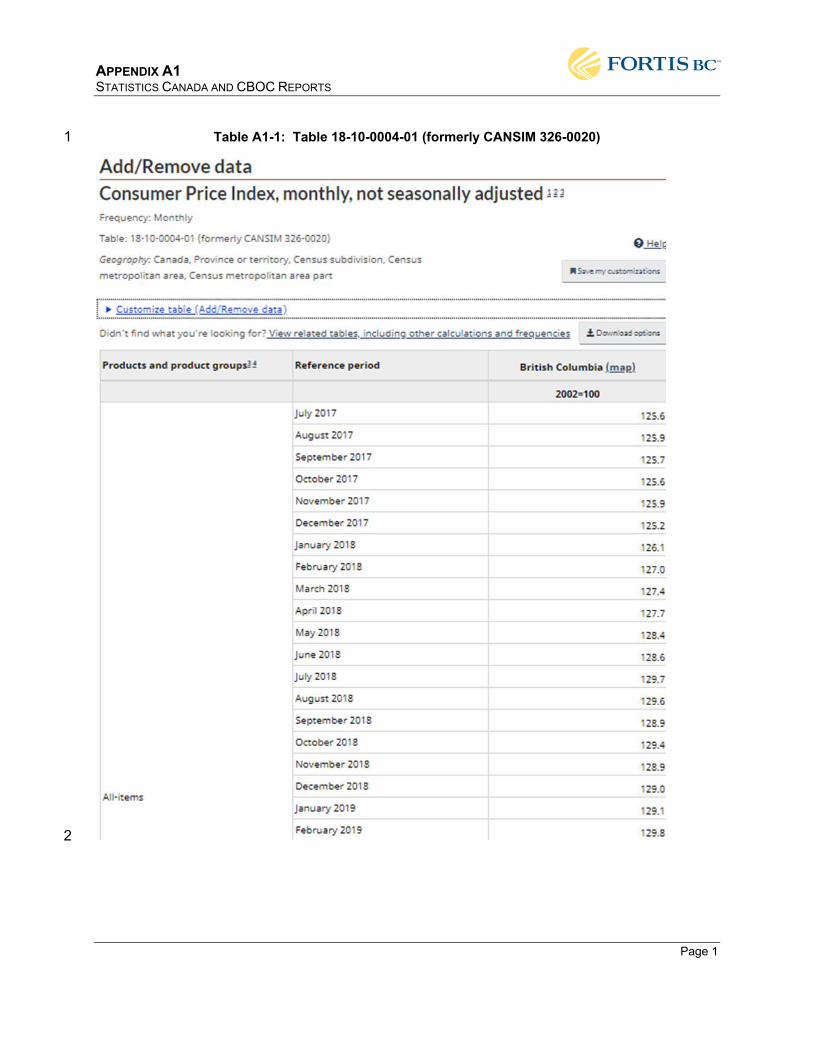
APPENDIX A1 STATISTICS CANADA AND CBOC REPORTS
Page 1
Table A1-1: Table 18-10-0004-01 (formerly CANSIM 326-0020) 1
2

APPENDIX A1 STATISTICS CANADA AND CBOC REPORTS
Page 2
1
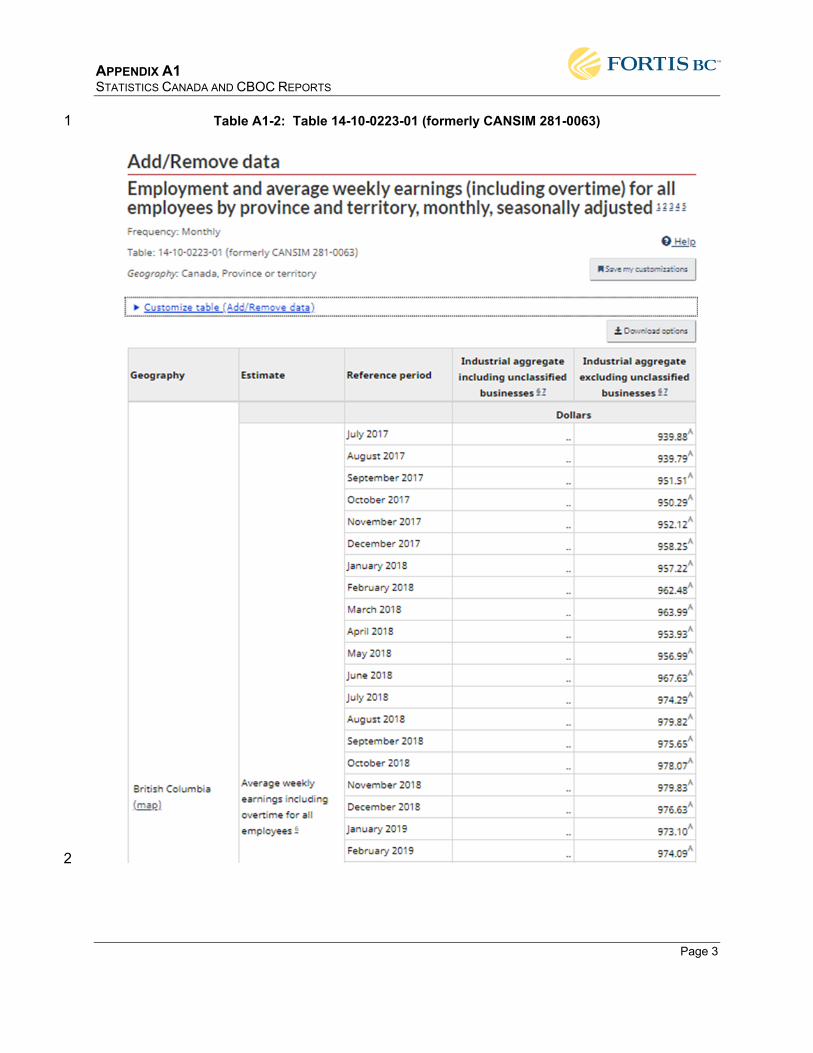
APPENDIX A1 STATISTICS CANADA AND CBOC REPORTS
Page 3
Table A1-2: Table 14-10-0223-01 (formerly CANSIM 281-0063) 1
2

APPENDIX A1 STATISTICS CANADA AND CBOC REPORTS
Page 4
1

APPENDIX A1 STATISTICS CANADA AND CBOC REPORTS
Page 5
Table A1-3: British Columbia Preliminary Economic Forecast, 1 Conference Board of Canada, Provincial Outlook Economic Forecast, Spring 2020 2
3
4

Appendix A-2
Load Forecast Tables

APPENDIX A2 LOAD FORECAST TABLES
PAGE i
Table of Contents
1. Introduction ......................................................................................................... 1
2. Monthly Load Forecast ...................................................................................... 2
2.1 Gross Load (MWh) ................................................................................................... 2
2.2 Net Load (MWh) ....................................................................................................... 2
2.3 Residential (MWh) .................................................................................................... 3
2.4 Commercial (MWh) .................................................................................................. 3
2.5 Wholesale (MWh) ..................................................................................................... 3
2.6 Industrial (MWh) ....................................................................................................... 4
2.7 Lighting (MWh) ......................................................................................................... 4
2.8 Irrigation (MWh)........................................................................................................ 4
2.9 System Peak (MW) .................................................................................................. 5
3. Customer Forecast ............................................................................................. 6
3.1 Customers ................................................................................................................ 6
3.2 Customer Additions .................................................................................................. 6
4. Normalized after-Savings Use Per Customer (UPC) ........................................ 7
5. Load ..................................................................................................................... 8
5.1 Normalized After-Savings Load ................................................................................ 8
5.2 Normalized After-Savings Wholesale Load .............................................................. 8
5.3 DSM (GWh) without Losses ..................................................................................... 8
6. Variances to Forecast ........................................................................................ 9
6.1 Customer Count Variance ........................................................................................ 9
6.2 Load Variance, Normalized Actual to Forecast ...................................................... 10
6.3 Normalized After-Savings Annual Percent Growth ................................................ 11
6.4 Residential UPC, Normalized Actual to Forecast ................................................... 12
6.5 Winter Peak , Actual to Forecast ............................................................................ 12
6.6 System Load Factor ............................................................................................... 12

APPENDIX A2 LOAD FORECAST TABLES
PAGE 1
1. INTRODUCTION 1
This appendix provides the historical and forecast load data used in Section 3 of the Application. 2 Tables 2.1 to 5.2 show ten years of historical data and the before-savings and after-savings 3 forecast for 2020 and 2021. The 2020 forecast includes actual loads until June of 2020. Table 5.3 4 shows the DSM that was deducted from the before-savings forecast to provide the after-savings 5 forecast for 2021. Tables 6.1 and 6.2 show the variance of the customer accounts and forecasts 6 from 2015 to 2019 when compared to the actuals. Table 6.3 shows the annual growth of customer 7 and load that FBC has experienced since 2015. Table 6.4 and 6.5 show the Residential UPC and 8 Winter peak variances from forecast from 2015 to 2019. Finally Table 6.6 shows the system load 9 factor from the years 2015 to 2019 and the forecast load factor for 2020 and 2021. 10
The tables in this appendix reflect the acquisition by FBC of the assets and customers of the City 11 of Kelowna electric utility effective March 31, 2013. The acquisition resulted in an increase in 12 direct customers to FBC and a re-distribution of load from wholesale to other rate classes in 2013 13 and 2014. 14

APPENDIX A2 LOAD FORECAST TABLES
PAGE 2
2. MONTHLY LOAD FORECAST 1
Forecast loads are shown: 2
before-savings – the load before DSM and includes Normalized loads to December 2019 3 and Actual loads from January 2020 to June 2020. 4
after-savings – the load after DSM and include Normalized loads to December 2019 and 5 actual loads to June 2020. 6
2.1 GROSS LOAD (MWH) 7
8
2.2 NET LOAD (MWH) 9
10
Year Jan Feb Mar Apr May Jun Jul Aug Sep Oct Nov Dec TotalHistorical Normalized Actuals
2010 358,574 304,251 288,022 253,247 237,451 232,285 274,190 265,937 227,770 258,133 303,172 365,668 3,368,701 2011 374,096 313,764 312,059 254,039 235,722 242,276 268,421 273,732 242,593 260,877 307,093 362,607 3,447,280 2012 354,376 315,497 304,411 253,594 237,899 233,308 272,143 275,122 236,457 262,538 313,757 362,555 3,421,657 2013 372,939 327,919 300,296 255,888 249,987 235,093 291,183 274,786 241,239 266,317 303,923 380,406 3,499,975 2014 363,947 304,540 303,886 253,159 241,999 242,933 284,643 269,971 229,496 256,060 300,844 381,603 3,433,082 2015 365,681 319,636 299,774 250,449 249,965 245,501 286,189 276,449 233,713 256,762 300,047 361,987 3,446,152 2016 363,248 311,848 292,351 268,698 248,319 242,786 289,259 280,588 234,770 266,284 332,085 350,062 3,480,297 2017 361,265 295,737 307,586 263,795 249,642 251,284 299,544 288,941 246,701 265,695 326,103 355,527 3,511,820 2018 375,664 309,496 306,028 264,140 273,621 256,591 308,227 297,251 231,377 262,531 302,555 376,342 3,563,824 2019 372,224 288,274 315,330 261,324 268,354 257,653 298,081 293,227 260,757 291,917 313,593 371,724 3,592,459
Before-Savings
2020P 369,327 321,446 312,382 255,630 244,802 245,197 300,412 297,184 250,693 284,422 322,171 371,703 3,575,370 2021F 379,971 308,249 319,777 274,167 275,653 264,579 311,599 306,562 257,766 291,168 330,083 381,060 3,700,634
After-Savings
2020P 369,327 321,446 312,382 255,630 244,802 245,197 298,826 295,348 248,578 281,976 319,393 368,613 3,561,518 2021F 376,570 304,617 315,983 270,255 271,648 260,442 307,276 301,953 252,810 285,768 324,255 374,865 3,646,444
Year Jan Feb Mar Apr May Jun Jul Aug Sep Oct Nov Dec TotalHistorical Normalized Actuals
2010 322,764 275,389 264,054 233,827 220,707 215,751 252,308 245,260 211,831 238,568 276,095 328,561 3,085,116 2011 333,975 282,076 283,208 233,733 218,542 223,679 246,555 251,059 223,951 240,135 278,304 324,686 3,139,902 2012 321,730 286,779 279,732 235,517 222,312 217,842 252,099 254,667 220,598 243,793 286,926 328,517 3,150,511 2013 337,728 297,641 276,667 237,842 233,199 219,696 268,867 254,751 225,078 247,419 279,078 343,897 3,221,865 2014 330,080 277,952 279,588 235,366 226,108 226,460 263,122 250,470 214,691 238,394 276,319 344,675 3,163,224 2015 331,359 290,442 275,968 232,925 232,996 228,619 264,346 255,968 218,317 238,919 275,526 328,297 3,173,683 2016 329,697 284,239 269,871 248,933 231,743 226,433 267,219 259,761 219,415 247,393 302,834 318,710 3,206,245 2017 327,600 270,353 282,545 244,429 232,661 233,596 275,700 266,639 229,612 246,617 297,428 322,834 3,230,015 2018 340,082 282,343 281,627 245,049 253,803 238,507 283,500 274,131 216,479 244,187 277,988 340,643 3,278,339 2019 337,457 264,607 289,706 242,736 249,368 239,550 274,993 270,833 242,244 269,708 287,514 337,042 3,305,758
Before-Savings
2020P 334,772 293,291 287,337 237,129 228,146 225,140 276,956 274,193 233,469 263,232 294,723 336,977 3,285,366 2021F 344,683 282,083 294,089 254,316 256,163 246,005 287,115 282,806 240,077 269,582 302,076 345,587 3,404,583
After-Savings
2020P 334,772 293,291 287,337 237,129 228,146 225,140 275,496 272,504 231,523 260,983 292,167 334,135 3,272,623 2021F 341,555 278,742 290,598 250,718 252,479 242,199 283,137 278,566 235,517 264,614 296,715 339,888 3,354,728
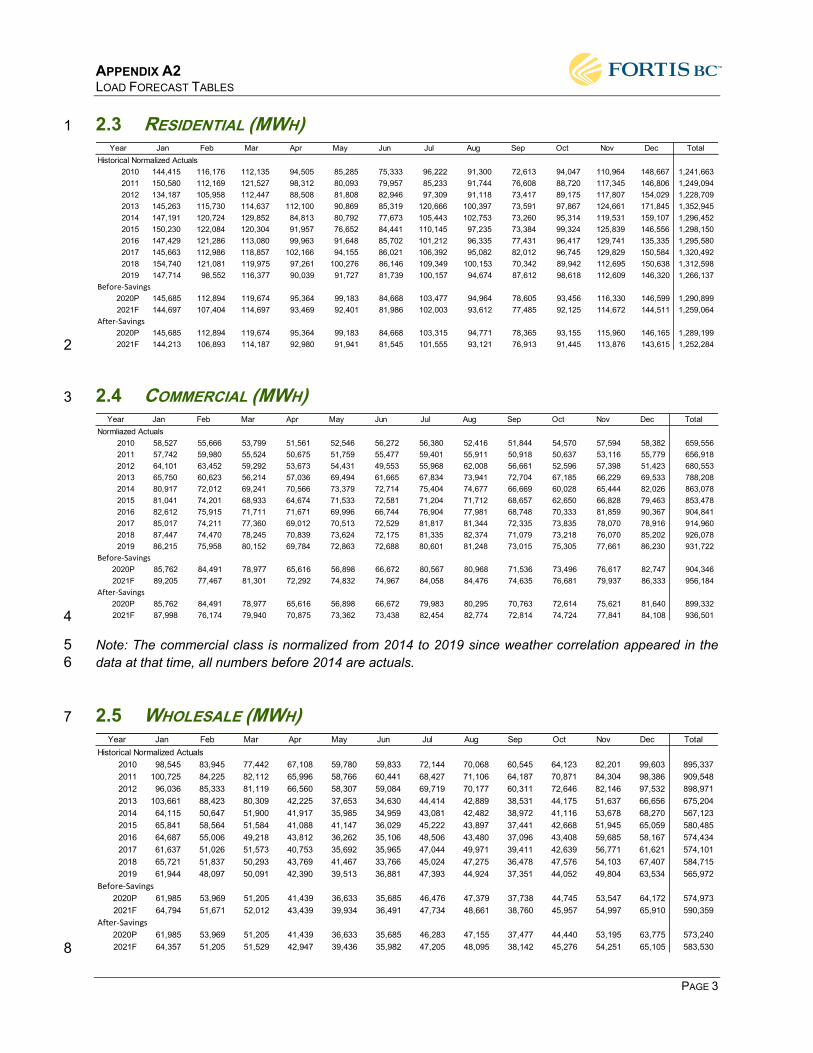
APPENDIX A2 LOAD FORECAST TABLES
PAGE 3
2.3 RESIDENTIAL (MWH) 1
2
2.4 COMMERCIAL (MWH) 3
4
Note: The commercial class is normalized from 2014 to 2019 since weather correlation appeared in the 5 data at that time, all numbers before 2014 are actuals. 6
2.5 WHOLESALE (MWH) 7
8
Year Jan Feb Mar Apr May Jun Jul Aug Sep Oct Nov Dec TotalHistorical Normalized Actuals
2010 144,415 116,176 112,135 94,505 85,285 75,333 96,222 91,300 72,613 94,047 110,964 148,667 1,241,663 2011 150,580 112,169 121,527 98,312 80,093 79,957 85,233 91,744 76,608 88,720 117,345 146,806 1,249,094 2012 134,187 105,958 112,447 88,508 81,808 82,946 97,309 91,118 73,417 89,175 117,807 154,029 1,228,709 2013 145,263 115,730 114,637 112,100 90,869 85,319 120,666 100,397 73,591 97,867 124,661 171,845 1,352,945 2014 147,191 120,724 129,852 84,813 80,792 77,673 105,443 102,753 73,260 95,314 119,531 159,107 1,296,452 2015 150,230 122,084 120,304 91,957 76,652 84,441 110,145 97,235 73,384 99,324 125,839 146,556 1,298,150 2016 147,429 121,286 113,080 99,963 91,648 85,702 101,212 96,335 77,431 96,417 129,741 135,335 1,295,580 2017 145,663 112,986 118,857 102,166 94,155 86,021 106,392 95,082 82,012 96,745 129,829 150,584 1,320,492 2018 154,740 121,081 119,975 97,261 100,276 86,146 109,349 100,153 70,342 89,942 112,695 150,638 1,312,598 2019 147,714 98,552 116,377 90,039 91,727 81,739 100,157 94,674 87,612 98,618 112,609 146,320 1,266,137
Before-Savings
2020P 145,685 112,894 119,674 95,364 99,183 84,668 103,477 94,964 78,605 93,456 116,330 146,599 1,290,899 2021F 144,697 107,404 114,697 93,469 92,401 81,986 102,003 93,612 77,485 92,125 114,672 144,511 1,259,064
After-Savings
2020P 145,685 112,894 119,674 95,364 99,183 84,668 103,315 94,771 78,365 93,155 115,960 146,165 1,289,199 2021F 144,213 106,893 114,187 92,980 91,941 81,545 101,555 93,121 76,913 91,445 113,876 143,615 1,252,284
Year Jan Feb Mar Apr May Jun Jul Aug Sep Oct Nov Dec TotalNormliazed Actuals
2010 58,527 55,666 53,799 51,561 52,546 56,272 56,380 52,416 51,844 54,570 57,594 58,382 659,556 2011 57,742 59,980 55,524 50,675 51,759 55,477 59,401 55,911 50,918 50,637 53,116 55,779 656,918 2012 64,101 63,452 59,292 53,673 54,431 49,553 55,968 62,008 56,661 52,596 57,398 51,423 680,553 2013 65,750 60,623 56,214 57,036 69,494 61,665 67,834 73,941 72,704 67,185 66,229 69,533 788,208 2014 80,917 72,012 69,241 70,566 73,379 72,714 75,404 74,677 66,669 60,028 65,444 82,026 863,078 2015 81,041 74,201 68,933 64,674 71,533 72,581 71,204 71,712 68,657 62,650 66,828 79,463 853,478 2016 82,612 75,915 71,711 71,671 69,996 66,744 76,904 77,981 68,748 70,333 81,859 90,367 904,841 2017 85,017 74,211 77,360 69,012 70,513 72,529 81,817 81,344 72,335 73,835 78,070 78,916 914,960 2018 87,447 74,470 78,245 70,839 73,624 72,175 81,335 82,374 71,079 73,218 76,070 85,202 926,078 2019 86,215 75,958 80,152 69,784 72,863 72,688 80,601 81,248 73,015 75,305 77,661 86,230 931,722
Before-Savings
2020P 85,762 84,491 78,977 65,616 56,898 66,672 80,567 80,968 71,536 73,496 76,617 82,747 904,346 2021F 89,205 77,467 81,301 72,292 74,832 74,967 84,058 84,476 74,635 76,681 79,937 86,333 956,184
After-Savings
2020P 85,762 84,491 78,977 65,616 56,898 66,672 79,983 80,295 70,763 72,614 75,621 81,640 899,332 2021F 87,998 76,174 79,940 70,875 73,362 73,438 82,454 82,774 72,814 74,724 77,841 84,108 936,501
Year Jan Feb Mar Apr May Jun Jul Aug Sep Oct Nov Dec TotalHistorical Normalized Actuals
2010 98,545 83,945 77,442 67,108 59,780 59,833 72,144 70,068 60,545 64,123 82,201 99,603 895,337 2011 100,725 84,225 82,112 65,996 58,766 60,441 68,427 71,106 64,187 70,871 84,304 98,386 909,548 2012 96,036 85,333 81,119 66,560 58,307 59,084 69,719 70,177 60,311 72,646 82,146 97,532 898,971 2013 103,661 88,423 80,309 42,225 37,653 34,630 44,414 42,889 38,531 44,175 51,637 66,656 675,204 2014 64,115 50,647 51,900 41,917 35,985 34,959 43,081 42,482 38,972 41,116 53,678 68,270 567,123 2015 65,841 58,564 51,584 41,088 41,147 36,029 45,222 43,897 37,441 42,668 51,945 65,059 580,485 2016 64,687 55,006 49,218 43,812 36,262 35,106 48,506 43,480 37,096 43,408 59,685 58,167 574,434 2017 61,637 51,026 51,573 40,753 35,692 35,965 47,044 49,971 39,411 42,639 56,771 61,621 574,101 2018 65,721 51,837 50,293 43,769 41,467 33,766 45,024 47,275 36,478 47,576 54,103 67,407 584,715 2019 61,944 48,097 50,091 42,390 39,513 36,881 47,393 44,924 37,351 44,052 49,804 63,534 565,972
Before-Savings
2020P 61,985 53,969 51,205 41,439 36,633 35,685 46,476 47,379 37,738 44,745 53,547 64,172 574,973 2021F 64,794 51,671 52,012 43,439 39,934 36,491 47,734 48,661 38,760 45,957 54,997 65,910 590,359
After-Savings
2020P 61,985 53,969 51,205 41,439 36,633 35,685 46,283 47,155 37,477 44,440 53,195 63,775 573,240 2021F 64,357 51,205 51,529 42,947 39,436 35,982 47,205 48,095 38,142 45,276 54,251 65,105 583,530

APPENDIX A2 LOAD FORECAST TABLES
PAGE 4
2.6 INDUSTRIAL (MWH) 1
2
2.7 LIGHTING (MWH) 3
4
2.8 IRRIGATION (MWH) 5
6
Year Jan Feb Mar Apr May Jun Jul Aug Sep Oct Nov Dec TotalHistorical Actuals
2010 19,449 17,896 18,991 18,389 18,616 18,603 18,551 20,146 19,259 21,495 22,097 20,207 233,699 2011 23,160 24,129 21,555 17,261 24,902 22,812 25,671 21,690 22,374 24,978 20,262 21,971 270,764 2012 24,973 30,356 25,036 25,285 23,707 21,432 22,094 22,115 22,666 22,863 26,328 23,917 290,771 2013 19,966 30,774 23,744 24,489 31,517 33,006 29,815 29,726 31,598 32,105 32,500 33,084 352,325 2014 35,943 32,746 26,411 34,532 30,112 32,770 29,719 22,362 30,032 38,104 35,138 33,043 380,912 2015 32,138 33,574 32,797 31,186 36,574 26,261 27,971 34,078 32,395 29,853 27,852 34,997 379,676 2016 32,901 29,835 33,180 28,953 27,588 31,785 31,632 32,805 30,120 33,350 28,559 32,687 373,396 2017 33,109 30,227 32,593 30,117 27,928 31,621 29,477 29,518 28,665 28,831 30,770 29,734 362,590 2018 30,089 33,113 31,062 30,455 32,718 39,030 38,264 35,307 33,245 30,034 33,591 35,836 402,744 2019 40,014 40,563 41,563 37,886 39,198 40,876 38,967 41,784 39,929 49,045 45,695 39,390 494,911
Before-Savings
2020P 39,704 40,302 35,771 32,283 31,263 30,747 37,814 42,390 40,509 48,359 46,711 41,992 467,844 2021F 44,315 44,054 44,431 42,850 44,138 45,835 44,698 47,564 44,115 51,643 50,951 47,366 551,959
After-Savings
2020P 39,704 40,302 35,771 32,283 31,263 30,747 37,342 41,849 39,901 47,667 45,948 41,171 463,947 2021F 43,403 43,071 43,384 41,737 42,971 44,604 43,413 46,206 42,691 50,113 49,348 45,715 536,656
Year Jan Feb Mar Apr May Jun Jul Aug Sep Oct Nov Dec TotalHistorical Actuals
2010 1,132 1,100 1,172 1,047 1,184 1,513 1,767 1,246 1,123 1,111 1,045 1,041 14,480 2011 1,114 1,027 1,674 582 1,092 1,098 1,086 1,113 1,615 560 1,121 1,153 13,233 2012 1,618 1,031 1,232 601 1,666 601 1,661 1,137 611 1,127 1,137 1,064 13,487 2013 1,532 863 1,003 1,112 1,186 1,101 1,151 1,069 1,135 1,132 1,080 1,114 13,479 2014 1,282 1,273 1,251 1,310 1,327 1,331 1,329 1,374 1,257 1,255 1,260 1,382 15,633 2015 1,319 1,339 1,261 1,321 1,372 1,382 1,299 1,347 1,248 1,349 1,295 1,359 15,891 2016 1,245 1,363 1,341 1,362 1,361 1,347 1,404 1,381 1,294 1,191 1,251 1,388 15,930 2017 1,394 1,233 1,390 1,286 1,339 1,301 1,383 1,382 1,289 1,335 1,270 1,330 15,932 2018 1,385 1,178 1,291 1,307 1,198 1,118 1,068 998 988 952 848 894 13,225 2019 907 808 873 943 965 937 917 949 955 947 909 928 11,039
Before-Savings
2020P 936 958 883 702 779 1,066 925 914 887 888 831 866 10,636 2021F 1,012 884 976 971 962 922 925 914 887 888 831 866 11,039
After-Savings
2020P 936 958 883 702 779 1,066 888 872 837 827 760 784 10,292 2021F 926 796 889 887 881 843 846 831 797 787 720 746 9,949
Year Jan Feb Mar Apr May Jun Jul Aug Sep Oct Nov Dec TotalHistorical Normalized Actuals
2010 698 605 514 1,217 3,296 4,198 7,243 10,085 6,448 3,223 2,194 660 40,381 2011 654 545 816 908 1,931 3,894 6,737 9,495 8,249 4,369 2,156 590 40,345 2012 816 650 606 890 2,393 4,226 5,348 8,113 6,933 5,385 2,109 552 38,019 2013 1,557 1,228 759 880 2,480 3,974 4,986 6,729 7,519 4,955 2,970 1,666 39,704 2014 633 549 932 2,227 4,512 7,013 8,146 6,822 4,501 2,578 1,267 847 40,025 2015 790 680 1,089 2,698 5,718 7,925 8,506 7,700 5,192 3,074 1,768 863 46,003 2016 822 834 1,341 3,172 4,888 5,748 7,561 7,778 4,724 2,694 1,739 765 42,065 2017 780 670 772 1,096 3,035 6,160 9,587 9,343 5,898 3,231 719 649 41,939 2018 700 662 761 1,419 4,521 6,271 8,461 8,024 4,348 2,465 681 666 38,979 2019 663 630 650 1,694 5,103 6,429 6,958 7,254 3,381 1,741 835 640 35,978
Before-Savings
2020P 701 678 827 1,725 3,390 6,302 7,696 7,578 4,194 2,289 688 602 36,670 2021F 659 604 672 1,295 3,896 5,805 7,696 7,578 4,194 2,289 688 602 35,978
After-Savings
2020P 701 678 827 1,725 3,390 6,302 7,685 7,562 4,180 2,280 683 600 36,613 2021F 658 603 670 1,292 3,888 5,786 7,665 7,539 4,162 2,269 679 598 35,808

APPENDIX A2 LOAD FORECAST TABLES
PAGE 5
2.9 SYSTEM PEAK (MW) 1
2
Note: The peaks show in the table above are seasonal peaks. The seasonal winter peak is 3 based on November and December of the current year and January and February of the following 4 year. The seasonal summer peak is based on June, July and August of the current year. 5
System Peak (MW)
Year Jan Feb Mar Apr May Jun Jul Aug Sep Oct Nov Dec Winter SummerHistorical Normalized Actuals
2010 683 629 536 499 486 420 566 554 448 487 652 726 726 566 2011 722 666 593 516 472 448 529 537 509 508 632 691 702 537 2012 702 675 560 523 493 418 589 540 453 501 624 723 723 589 2013 720 631 549 493 515 442 600 565 523 502 598 698 698 600 2014 651 580 562 469 403 482 620 605 412 467 572 645 693 620 2015 693 679 568 488 501 523 611 587 437 514 669 631 685 611 2016 685 683 569 540 490 582 587 593 443 480 613 724 755 593 2017 755 673 595 510 597 505 600 605 561 515 594 648 714 605 2018 714 648 583 516 602 533 630 631 429 459 609 659 682 631 2019 678 682 651 514 568 502 626 639 538 562 622 701 732 639
Before-Savings2020P 732 621 572 479 432 503 596 602 463 501 625 672 738 610 2021F 701 656 591 495 469 531 614 620 477 516 644 692 750 628
After-Savings2020P 732 621 572 479 432 503 596 601 462 500 624 671 737 609 2021F 700 655 590 494 467 530 613 618 475 514 642 690 748 627

APPENDIX A2 LOAD FORECAST TABLES
PAGE 6
3. CUSTOMER FORECAST 1
3.1 CUSTOMERS 2
3
3.2 CUSTOMER ADDITIONS 4
5
6
Customer Count 2010 2011 2012 2013 2014 2015 2016 2017 2018 2019 2020P 2021FResidential 97,883 98,795 99,228 111,862 113,431 114,166 115,772 117,748 120,291 122,465 123,407 124,603 Commercial 11,419 11,525 11,811 13,662 14,363 14,976 15,073 15,398 15,678 15,956 15,639 16,579 Wholesale 7 7 7 6 6 6 6 6 6 6 6 6 Industrial 35 36 39 47 49 50 50 50 52 51 57 59 Lighting 1,830 1,803 1,739 1,644 1,620 1,590 1,559 1,511 1,482 1,467 1,425 1,393 Irrigation 1,075 1,092 1,091 1,097 1,103 1,095 1,090 1,080 1,078 1,082 1,082 1,082 Total Direct 112,249 113,258 113,915 128,318 130,572 131,883 133,550 135,793 138,587 141,027 141,616 143,722
Customer Additions 2010 2011 2012 2013 2014 2015 2016 2017 2018 2019 2020P 2021FResidential 1,318 912 433 12,634 1,569 735 1,606 1,976 2,543 2,174 942 1,196 Commercial 111 106 286 1,851 701 613 97 325 280 278 (317) 939 Wholesale - - - (1) - - - - - - - - Industrial 2 1 3 8 2 1 - - (6) (9) 6 2 Lighting (44) (27) (64) (95) (24) (30) (31) (48) (29) (15) (42) (32) Irrigation 9 17 (1) 6 6 (8) (5) (10) (2) 4 - - Total Direct 1,396 1,009 657 14,403 2,254 1,311 1,667 2,243 2,786 2,432 589 2,105

APPENDIX A2 LOAD FORECAST TABLES
PAGE 7
4. NORMALIZED AFTER-SAVINGS USE PER CUSTOMER (UPC) 1
2 MWh/Customer 2010 2011 2012 2013 2014 2015 2016 2017 2018 2019 2020P 2021FResidential 12.77 12.70 12.41 12.48 11.51 11.41 11.27 11.31 11.03 10.43 10.49 10.10

APPENDIX A2 LOAD FORECAST TABLES
PAGE 8
5. LOAD 1
5.1 NORMALIZED AFTER-SAVINGS LOAD 2
3
5.2 NORMALIZED AFTER-SAVINGS WHOLESALE LOAD 4
5
5.3 DSM (GWH) WITHOUT LOSSES 6
7
8
Load (GWh) 2010 2011 2012 2013 2014 2015 2016 2017 2018 2019 2020P 2021FResidential 1,242 1,249 1,229 1,353 1,296 1,298 1,296 1,320 1,313 1,266 1,289 1,252Commercial 660 657 681 788 863 853 905 915 926 932 899 937Wholesale 895 910 899 675 567 580 574 574 585 566 573 584Industrial 234 271 291 352 381 380 373 363 403 495 464 537Lighting 14 13 13 13 16 16 16 16 13 11 10 10Irrigation 40 40 38 40 40 46 42 42 39 36 37 36Net 3,085 3,140 3,151 3,222 3,163 3,174 3,206 3,230 3,278 3,306 3,273 3,355 Losses & Company Use 284 307 271 278 270 272 274 282 285 287 289 292Gross 3,369 3,447 3,422 3,500 3,433 3,446 3,480 3,512 3,564 3,592 3,562 3,646System Peak (MW)Winter Peak 726 702 723 698 693 685 755 714 682 732 737 748 Summer Peak 566 537 589 600 620 611 593 605 631 639 609 627
Wholesale (GWh) 2010 2011 2012 2013 2014 2015 2016 2017 2018 2019 2020P 2021FBCH Lardeau 10 8 6 6 6 6 6 8 8 7 7 8BCH Kingsgate 3 3 5 5 5 5 5 5 5 5 5 5City of Grand Forks 41 41 41 41 39 41 41 39 46 37 38 38City of Nelson 90 88 80 83 81 83 80 86 88 84 86 81City of Penticton 341 344 341 348 342 348 345 338 340 338 340 343District of Summerland 97 96 95 98 94 97 98 98 99 95 97 108City of Kelowna 314 329 332 94Total 895 910 899 675 567 580 574 574 585 566 573 584
Load (GWh) 2015 2016 2017 2018 2019 2020P 2021FDemand Side Management (12) (23) (28) (31) (26) (19) (54)

APPENDIX A2 LOAD FORECAST TABLES
PAGE 9
6. VARIANCES TO FORECAST 1
6.1 CUSTOMER COUNT VARIANCE 2
3
Customer Count 2014 2015 2016 2017 2018 2019Actual
Residential 113,431 114,166 115,772 117,748 120,291 122,465Commercial 14,363 14,976 15,073 15,398 15,678 15,956Wholesale 6 6 6 6 6 6Industrial 49 50 50 50 52 51Lighting 1,620 1,590 1,559 1,511 1,482 1,467Irrigation 1,103 1,095 1,090 1,080 1,078 1,082Total 130,572 131,883 133,550 135,793 138,587 141,027
ForecastResidential 113,229 114,855 115,758 116,031 117,774 120,405Commercial 13,739 14,531 15,042 15,813 16,122 16,405Wholesale 6 6 6 6 6 6Industrial 48 49 49 50 50 51Lighting 1,742 1,620 1,620 1,590 1,559 1,511Irrigation 1,091 1,103 1,103 1,095 1,090 1,080Total 129,855 132,164 133,578 134,585 136,602 139,459
Variance (customers)Residential 202 (689) 14 1,717 2,517 2,060 Commercial 624 445 31 (415) (444) (449) Wholesale - - - - - - Industrial 1 1 1 - 2 - Lighting (122) (30) (61) (79) (77) (44) Irrigation 12 (8) (13) (15) (12) 2 Total 717 (281) (28) 1,208 1,986 1,569
Variance (%)Residential 0.2% -0.6% 0.0% 1.5% 2.1% 1.7%Commercial 4.3% 3.0% 0.2% -2.7% -2.8% -2.8%Wholesale 0.0% 0.0% 0.0% 0.0% 0.0% 0.0%Industrial 2.0% 2.0% 2.0% 0.0% 3.8% 0.0%Lighting -7.5% -1.9% -3.9% -5.2% -5.2% -3.0%Irrigation 1.1% -0.7% -1.2% -1.4% -1.1% 0.2%Total 0.5% -0.2% 0.0% 0.9% 1.4% 1.1%

APPENDIX A2 LOAD FORECAST TABLES
PAGE 10
6.2 LOAD VARIANCE, NORMALIZED ACTUAL TO FORECAST 1
2
Load (GWh) 2014 2015 2016 2017 2018 2019Normalized
Residential 1,296 1,298 1,296 1,320 1,313 1,266 Commercial 863 853 905 915 926 932 Wholesale 567 580 574 574 585 566 Industrial 381 380 373 363 403 495 Lighting 16 16 16 16 13 11 Irrigation 40 46 42 42 39 36 Net 3,163 3,174 3,206 3,230 3,278 3,306 Gross 3,433 3,446 3,480 3,512 3,564 3,592
ForecastResidential 1,402 1,397 1,367 1,353 1,280 1,349 Commercial 813 808 871 879 912 935 Wholesale 581 593 579 587 586 594 Industrial 389 371 393 407 379 385 Lighting 13 14 13 14 15 13 Irrigation 42 40 39 40 41 42 Net 3,240 3,224 3,262 3,282 3,213 3,319 Gross 3,519 3,499 3,540 3,559 3,485 3,602
Variance (GWh)Residential (106) (99) (71) (33) 33 (83) Commercial 50 45 34 36 14 (3) Wholesale (14) (13) (5) (13) (1) (28) Industrial (9) 9 (20) (44) 24 110 Lighting 3 2 3 1 (2) (2) Irrigation (2) 6 3 2 (2) (6) Net (77) (50) (56) (52) 65 (13) Gross (86) (53) (59) (47) 79 (10)
Variance (%)Residential -8.2% -7.6% -5.5% -2.5% 2.5% -6.6%Commercial 5.9% 5.3% 3.8% 3.9% 1.5% -0.4%Wholesale -2.5% -2.2% -0.8% -2.3% -0.2% -5.0%Industrial -2.2% 2.3% -5.3% -12.3% 5.9% 22.2%Lighting 18.2% 12.7% 16.3% 9.4% -13.4% -17.8%Irrigation -4.9% 12.1% 7.7% 3.9% -5.2% -16.7%Net -2.4% -1.6% -1.7% -1.6% 2.0% -0.4%Gross -2.5% -1.5% -1.7% -1.3% 2.2% -0.3%

APPENDIX A2 LOAD FORECAST TABLES
PAGE 11
6.3 NORMALIZED AFTER-SAVINGS ANNUAL PERCENT GROWTH 1
2
Load (GWh) 2014 2015 2016 2017 2018 2019 2020P 2021FResidential 1,296 1,298 1,296 1,320 1,313 1,266 1,289 1,252Commercial 863 853 905 915 926 932 899 937Wholesale 567 580 574 574 585 566 573 584Industrial 381 380 373 363 403 495 464 537Lighting 16 16 16 16 13 11 10 10Irrigation 40 46 42 42 39 36 37 36Net 3,163 3,174 3,206 3,230 3,278 3,306 3,273 3,355Losses & Company Use 270 272 274 282 285 287 289 292Gross 3,433 3,446 3,480 3,512 3,564 3,592 3,562 3,646System PeakWinter Peak (MW) 693 685 755 714 682 732 737 748Summer Peak (MW) 620 611 593 605 631 639 609 627
Growth Year over Year 2014 2015 2016 2017 2018 2019 2020P 2021FResidential 0% 0% 2% -1% -4% 2% -3%Commercial -1% 6% 1% 1% 1% -3% 4%Wholesale 2% -1% 0% 2% -3% 1% 2%Industrial 0% -2% -3% 11% 23% -6% 16%Lighting 2% 0% 0% -17% -17% -7% -3%Irrigation 15% -9% 0% -7% -8% 2% -2%Net 0% 1% 1% 1% 1% -1% 3%Losses & Company Use 1% 1% 3% 1% 0% 1% 1%Gross 0% 1% 1% 1% 1% -1% 2%System PeakWinter Peak (MW) -1% 10% -5% -4% 7% 1% 1%Summer Peak (MW) -1% -3% 2% 4% 1% -5% 3%
Customer Count 2014 2015 2016 2017 2018 2019 2020P 2021FResidential 113,431 114,166 115,772 117,748 120,291 122,465 123,407 124,603 Commercial 14,363 14,976 15,073 15,398 15,678 15,956 15,639 16,579 Wholesale 6 6 6 6 6 6 6 6 Industrial 49 50 50 50 52 51 57 59 Lighting 1,620 1,590 1,559 1,511 1,482 1,467 1,425 1,393 Irrigation 1,103 1,095 1,090 1,080 1,078 1,082 1,082 1,082 Total Direct 130,572 131,883 133,550 135,793 138,587 141,027 141,616 143,722
Growth Year over Year 2014 2015 2016 2017 2018 2019 2020P 2021FResidential 1% 1% 2% 2% 2% 1% 1%Commercial 4% 1% 2% 2% 2% -2% 6%Wholesale 0% 0% 0% 0% 0% 0% 0%Industrial 2% 0% 0% 4% -2% 12% 4%Lighting -2% -2% -3% -2% -1% -3% -2%Irrigation -1% 0% -1% 0% 0% 0% 0%Total Direct 1% 1% 2% 2% 2% 0% 1%

APPENDIX A2 LOAD FORECAST TABLES
PAGE 12
6.4 RESIDENTIAL UPC, NORMALIZED ACTUAL TO FORECAST 1
2
6.5 WINTER PEAK , ACTUAL TO FORECAST 3
4
Note: The peaks reflected in this table are the actual seasonal peaks are not normalized. 5
6.6 SYSTEM LOAD FACTOR 6
The following table shows annual after-savings gross load, peak load and load factor. The annual 7 load factor is calculated as annual load ÷ peak hourly load x number of hours in a year (8,760). 8
9
Note: The peaks in this table represent annual peaks meaning they happened in the calendar 10 year and are not the seasonal peaks. 11
Residential UPC (MWh) 2017 2018 2019After- Savings Normalized Actual UPC 11.31 11.03 10.43Forecast 11.71 10.92 11.27Variance (0.40) 0.11 (0.84) Variance (%) -3.5% 1.0% -8.0%
Winter Peak (MW) 2017 2018 2019After- Savings Actual Peak 663 691 732 Forecast 734 712 764 Variance (71) (21) (32) Variance (%) -10% -3% -4%
Year Load (MWh) Peak (MW) Load Factor2014 3,433,619 651 0.60 2015 3,446,152 693 0.57 2016 3,480,006 724 0.55 2017 3,512,293 755 0.53 2018 3,563,824 714 0.57 2019 3,592,459 701 0.58
2020P 3,561,518 737 0.55 2021F 3,646,444 748 0.56

Appendix A-3
Load Forecast Methods

APPENDIX A3 LOAD FORECAST METHODS
PAGE I
Table of Contents
1. Load Forecast Methods ..................................................................................... 1
1.1 Weather Normalization ............................................................................................. 1
1.2 Load Forecast .......................................................................................................... 3
Residential ............................................................................................................... 3
Commercial .............................................................................................................. 4
Wholesale ................................................................................................................ 5
Industrial .................................................................................................................. 5
Irrigation ................................................................................................................... 5
Lighting .................................................................................................................... 5
Demand Side Mangment (DSM) Savings ............................................................... 6
1.3 Peak Demand Forecast............................................................................................ 6

APPENDIX A3 LOAD FORECAST METHODS
PAGE 1
1. LOAD FORECAST METHODS 1
This appendix describes FBC’s load forecast methods on which the forecast in section 3 of the 2 Application is based. 3
In the figures provided in this appendix, the following three time frames are shown: 4
Actual Years: Actual years are those for which actual data exists for the full calendar year. 5 For the 2021 Annual Review the latest calendar year for which full actual data exists is the 6 2019 calendar year. 7
Forecast Year(s): This is the year or years for which the forecast is being developed. This 8 can be one year (in the case of the Annual Review) or a range of two or more years 9 depending on the filing. In this Application, 2021 is the Forecast Year (2021F). 10
Projected Year: The Projected Year is the year prior to the first forecast year. The 11 Projected Year is combination of a forecast based on the latest years of actual data 12 available and actuals loads for that year. For this Application the Projected Year is 2020 13 (2020P) and includes actuals to June of 2020, 14
1.1 WEATHER NORMALIZATION 15
Electricity consumption is impacted by weather, particularly by temperature. For example, load 16 requirements in an extremely cold winter month can be significantly higher than requirements in 17 normal weather conditions in the same month, due to additional heating loads. As the load 18 forecast is made under an assumption of normal weather, it is necessary to remove those extreme 19 weather effects from the historical data. This is the first step in forecasting. 20
Statistical tests were made to check whether the residential, wholesale, commercial and irrigation 21 loads were sensitive to temperature due to heating and cooling demands and whether the 22 irrigation load was sensitive to the amount of precipitation1. The results from the regression for 23 these four rate classes are shown below. The results show significant results with high R2 values 24 greater than 0.60 for all seasons for the residential, wholesale and commercial2 load classes; 25 therefore these classes are normalized. The irrigation class shows a R2 value of less than 0.60 26 for the Winter, Summer and Fall seasons; therefore this class was not normalized. 27
1 Industrial and street lighting loads are typically insensitive to the weather. 2 The commercial class data is normalized from 2014 to 2019 since a strong correlation was present in those years.
All commercial data prior to 2014 is actual because it did not show a correlation to weather at that time.

APPENDIX A3 LOAD FORECAST METHODS
PAGE 2
Table A3-1: Residential Regression Table 1
2
Table A3-2: Wholesale Regression Table 3
4
Table A3-2: Commercial Regression Table 5
6
Table A3-2: Irrigation Regression Table 7
8
Steps for weather (temperature) normalization are as follows: 9
1. Calculate monthly Heating Degree Days (HDD)3 and Cooling Degree Days (CDD)4 for the 10 Penticton weather station. 11
2. Calculate 10-year HDD and CDD averages for each month of the year. These are used 12 as the parameters of normal weather. 13
3. For each of the residential, wholesale and commercial classes, regress load on HDD or 14 CDD on a seasonal basis. Four seasons were defined: winter (November to February), 15 spring (March to May), summer (June to August) and fall (September to October). Thus 16 all monthly load and degree day data for each season is used and four separate 17
3 Heating degree-days for a given day are the number of Celsius degrees that the mean temperature is below 18
Celsius degrees. 4 Cooling degree-days for a given day are the number of Celsius degrees that the mean temperature is above 18
Celsius degrees.
Residential Winter Spring Summer FallIntercept 39,515 73,227 71,387 62,477 Slope HDD 175 101 - 115 Slope CDD - - 220 - Adjusted R2 0.73 0.61 0.84 0.73
Wholesale Winter Spring Summer FallIntercept 55,586 47,677 57,858 59,812 Slope HDD 70 57 - 31 Slope CDD - - 112 - Adjusted R2 0.95 0.73 0.96 0.94
Commercial Winter Spring Summer FallIntercept 42,373 52,329 52,801 52,855 Slope HDD 32 15 - 0 Slope CDD - - 45 - Adjusted R2 0.78 0.70 0.80 0.75
Irrigation Winter Spring Summer FallIntercept 2,010 4,889 5,068 6,671 Slope HDD (2) (11) - (12) Slope CDD - - 24 - Adjusted R2 0.06 0.74 0.36 0.44

APPENDIX A3 LOAD FORECAST METHODS
PAGE 3
regressions are calculated for each class. The City of Kelowna (CoK) Event variables were 1 included in the regressions to recognize the integration of the CoK in 2013 into the FBC 2 direct customer base. 3
4. To normalize a month, e.g. February 2019: 4
(a) obtain the month’s HDD (or CDD) information from Environment Canada; 5
(b) calculate the deviation from the 10-year average (2010-2019) HDD (CDD) as found in 6 Step 2; 7
(c) apply the regression slope obtained in Step 3 to this deviation to come up with a 8 normalization adder; and 9
(d) add the normalization adder to the month’s load (residential or wholesale). 10
The general equation to normalize load requirements in month t is shown below. 11
𝑁𝑜𝑟𝑚𝑎𝑙𝑖𝑧𝑒𝑑 𝐿𝑜𝑎𝑑𝑡 = 𝐿𝑜𝑎𝑑𝑡 − 𝐻𝐷𝐷 𝑆𝑙𝑜𝑝𝑒𝑡 × (𝐻𝐷𝐷𝑡 − 𝑁𝑜𝑟𝑚𝑎𝑙 𝐻𝐷𝐷𝑡) 12
𝑤ℎ𝑒𝑟𝑒 𝐻𝐷𝐷 𝑖𝑠 𝐻𝑒𝑎𝑡𝑖𝑛𝑔 𝐷𝑒𝑔𝑟𝑒𝑒 𝐷𝑎𝑦𝑠 𝑎𝑛𝑑 𝑡 = 𝑆𝑝𝑟𝑖𝑛𝑔, 𝐹𝑎𝑙𝑙 𝑎𝑛𝑑 𝑊𝑖𝑛𝑡𝑒𝑟 13
And 14
𝑁𝑜𝑟𝑚𝑎𝑙𝑖𝑧𝑒𝑑 𝐿𝑜𝑎𝑑𝑡 = 𝐿𝑜𝑎𝑑𝑡 − 𝐶𝐷𝐷 𝑆𝑙𝑜𝑝𝑒𝑡 × (𝐶𝐷𝐷𝑡 − 𝑁𝑜𝑟𝑚𝑎𝑙 𝐶𝐷𝐷𝑡) 15
𝑤ℎ𝑒𝑟𝑒 𝐶𝐷𝐷 𝑖𝑠 𝐶𝑜𝑜𝑙𝑖𝑛𝑔 𝐷𝑒𝑔𝑟𝑒𝑒 𝐷𝑎𝑦𝑠 𝑎𝑛𝑑 𝑡 = 𝑆𝑢𝑚𝑚𝑒𝑟 16
1.2 LOAD FORECAST 17
FBC forecasts energy requirements by customer class based on historical loads as set out in the 18 previous section. These are referred to as the “before-savings” loads. DSM savings that are 19 incremental to those embedded in historical loads (up to and including 2019) are also forecast for 20 each customer class and subtracted from the before-savings loads to arrive at the “after-savings” 21 loads. This section discusses the before-savings forecast load requirements for each of FBC’s 22 load classes. 23
Residential 24
The formula to forecast the expected before-savings residential load in year t is: 25
𝐵𝑒𝑓𝑜𝑟𝑒 𝑆𝑎𝑣𝑖𝑛𝑔𝑠 𝐿𝑜𝑎𝑑𝑡 = 𝑈𝑃𝐶𝑡 × 𝐴𝑣𝑒𝑟𝑎𝑔𝑒 𝐶𝑢𝑠𝑡𝑜𝑚𝑒𝑟 𝐺𝑟𝑜𝑤𝑡ℎ𝑡 26
where UPC (use per customer in MWh per customer per year) is before-savings. 27
The before-savings UPC was based on a ten-year historic trend of annual UPC values from 2010 28 to 2019. FBC reviews the forecast methods on an annual basis. As FBC found that there was a 29 strong statistically significant correlation, it herefore applied a ten year trend. 30

APPENDIX A3 LOAD FORECAST METHODS
PAGE 4
Table A3-3: Results of UPC Trend Analysis 1
2
Next, average customer count in year t is calculated as: 3
𝐴𝑣𝑒𝑟𝑎𝑔𝑒 𝐶𝑢𝑠𝑡𝑜𝑚𝑒𝑟 𝐶𝑜𝑢𝑛𝑡𝑡 =(𝑌𝑒𝑎𝑟 𝐸𝑛𝑑 𝐶𝑜𝑢𝑛𝑡𝑡 − 𝑌𝑒𝑎𝑟 𝐸𝑛𝑑 𝐶𝑜𝑢𝑛𝑡𝑡−1)
2 4
The year-end customer count was based on the least squares regression model below. 5
𝐴𝑣𝑒𝑟𝑎𝑔𝑒 𝐶𝑢𝑠𝑡𝑜𝑚𝑒𝑟 𝐶𝑜𝑢𝑛𝑡𝑡 = 𝑏0 + 𝑏1 × 𝑃𝑜𝑝𝑢𝑙𝑎𝑡𝑖𝑜𝑛𝑡 6
Populationt is the population data supplied by BC Stats for the Company’s direct service area. 7
Table A3-4: Results of Residential Regression 8
9
Commercial 10
The expected before-savings commercial load in year t is forecast based on the provincial GDP 11 supplied by the CBOC. The relationship was estimated from the following equation. 12
𝐵𝑒𝑓𝑜𝑟𝑒 𝑆𝑎𝑣𝑖𝑛𝑔𝑠 𝐿𝑜𝑎𝑑𝑡 = 𝑏0 + 𝑏1 × 𝐺𝐷𝑃𝑡 + 𝑏2 × 𝑃𝑟𝑖𝑛𝑐𝑒𝑡𝑜𝑛 𝐸𝑣𝑒𝑛𝑡𝑡 + 𝑏3 × 𝐶𝑜𝐾 𝐸𝑣𝑒𝑛𝑡𝑡 13
Princeton Eventt is a binary variable for the Princeton Light and Power (PLP) integration event in 14 2007, CoKt is a binary variable for the City of Kelowna integration event in 2013. Coefficients b0, 15 b1, b2, and b3 are obtained from an ordinary least squares (OLS) regression analysis on the 2005 16 to 2019 data. 17
Regression UPCStart Year 2010End Year 2019R2 0.95Adjusted R2 0.90df 9Intercept 488Slope UPC -0.24
Regression ResidentialStart Year 1995End Year 2019R2 0.98Adjusted R2 0.98df 24Intercept (23,964) Slope Population 0.48

APPENDIX A3 LOAD FORECAST METHODS
PAGE 5
Table A3-5: Results of Commercial Regression 1
2
Wholesale 3
The Company forecasts the wholesale load based on load surveys from all wholesale customers. 4 For this forecast, the response rate was 100 percent. FBC then summed the wholesale 5 customers’ forecasts to calculate the before-savings wholesale load forecast. This approach 6 recognizes that in the near to medium term, the wholesale customers themselves are best able 7 to forecast their load growth based on their knowledge of their customer mix, load behaviors, 8 development projects with associated load requirements, etc. 9
Industrial 10
The before-savings industrial load is the sum of forecasts supplied by those individual customers 11 who responded to the load survey and, for customers who did not respond, escalation of the 12 customer’s load in the preceding year by the CBOC forecast GDP growth rates for the industrial 13 sector the customer is in. Eighty percent of FBC’s industrial customers responded to the surveys, 14 accounting for 92 percent of 2019 load. 15
FBC assumes no new industrial customers in the current forecast unless there is a confirmed 16 commitment from an industrial customer. FBC works with key account managers to identify new 17 customers and existing customers with expansion plans that have commited contracts that are 18 being added to the system. The key account managers work with the new customers directly and 19 relay the load requirements to the forecasting group. 20
Irrigation 21
The before-savings irrigation load forcast uses the 2019 actuals as the forecast due to the 22 variability in the load in recent years. 23
Lighting 24
The before-savings lighting load uses the 2019 actuals due to the variability in the load primarily 25 due to streetlight LED replacement programs which reduced the load for 2018 and 2019. 26
Regression CommercialStart Year 2005End Year 2019R2 0.99Adjusted R2 0.98df 14Intercept 110,014 Slope GDP 2.61Slope PLP Event 36,536Slope CoK Event 134,808

APPENDIX A3 LOAD FORECAST METHODS
PAGE 6
Demand Side Mangment (DSM) Savings 1
FBC forecasts load reductions resulting from its DSM programs. 2
The forecast of DSM savings is consistent with the Company’s approved 2019 DSM Plan. DSM 3 measures are grouped into applicable programs that are then added to produce the three primary 4 sector (residential, commercial & industrial) annual plan savings targets. Finally, the annual 5 sector targets beginning with the Projected Year are converted into a cumulative time series, and 6 disaggregated into the customer rate classes and commensurate system loss reductions. 7
1.3 PEAK DEMAND FORECAST 8
The peak demand forecast is produced by taking the ten year average (2010-2019) of historical 9 peak data. The historical peak data is escalated by the gross load growth rate before it is averaged 10 to account for the growth of demand on the FBC system. Self-generating customers are removed 11 from the historical load data since the underlying trends that impact other loads do not apply. 12 Seasonal peaks were used for both the winter and the summer. The twelve monthly peaks, as 13 well as the seasonal peaks, were then escalated by the annual load growth rates in the forecast 14 period to produce forecast monthly peaks. The winter peak and the summer peak are assumed 15 to replace monthly peaks in December and July, respectively. 16
The after DSM peak forecast was calculated by subtracting DSM capacity savings forecast from 17 the before DSM peak forecast for each month in each year. 18
Appendix B PLAYMOR STATION UPGRADE BUSINESS CASE

FORTISBC INC.
Playmor Station Upgrade
Business Case

FORTISBC INC. PLAYMOR STATION UPGRADE BUSINESS CASE
PAGE I
Table of Contents 1
1. PROJECT SUMMARY .............................................................................................. 1 2
1.1 Background .................................................................................................................. 1 3
2. PROJECT NEED ....................................................................................................... 4 4
2.1 Growth Capacity ........................................................................................................... 4 5 2.2 Reliability ...................................................................................................................... 6 6 2.3 Aging Infrastructure and Equipment Condition ........................................................ 7 7 2.4 Summary of Project Objectives .................................................................................. 8 8
3. PROJECT ALTERNATIVES ..................................................................................... 9 9
3.1 Alternative A: Install Two Transformers .................................................................... 9 10 Advantages ......................................................................................................... 9 11 Disadvantages .................................................................................................. 10 12
3.2 Alternative B: Install Single Transformer ................................................................. 10 13 Advantages ....................................................................................................... 10 14 Disadvantages .................................................................................................. 10 15
3.3 Alternative C: Do Nothing .......................................................................................... 11 16 Advantages ....................................................................................................... 12 17 Disadvantages .................................................................................................. 12 18
3.4 Option Summary and Recommendation .................................................................. 12 19
4. PROJECT DESCRIPTION ...................................................................................... 14 20
4.1 Project Scope ............................................................................................................. 14 21 4.1 Project Risks .............................................................................................................. 16 22 4.2 Project Cost Estimate ................................................................................................ 17 23 4.3 Project Schedule ........................................................................................................ 18 24
5. PUBLIC AND FIRST NATIONS CONSULATION ................................................... 19 25
6. CONCLUSION ......................................................................................................... 20 26
27

FORTISBC INC. PLAYMOR STATION UPGRADE BUSINESS CASE
PAGE II
List of Appendices 1
Appendix 1 Alternative A Single Line Diagram 2
Appendix 2 Alternative A Revenue Requirements Analysis 3
Appendix 3 Alternative B Revenue Requirements Analysis 4
5

FORTISBC INC. PLAYMOR STATION UPGRADE BUSINESS CASE
PAGE III
Index of Tables and Figures 1
Table 1: PLA Station Upgrade Project Alternatives Comparison ............................................... 12 2 Table 2: Total estimate project cost summary ($ millions) ......................................................... 17 3 4
Figure 1: Playmor Substation, Distribution Supply, Transmission Supply, and Surrounding 5 Area .............................................................................................................................................. 2 6 Figure 2: PLA Substation Existing Location ................................................................................. 3 7 Figure 3: PLA Area Winter Peak Load and Limits Under Alternative A (2x20 MVA) ................... 5 8 Figure 4: PLA Area Winter Peak Load and Limits Under Alternative B (1x40 MVA) ................... 6 9 Figure 5: Additional land acquired adjacent to existing station .................................................. 16 10 Figure 6: Preliminary high-level project schedule ...................................................................... 18 11 12

FORTISBC INC. PLAYMOR STATION UPGRADE BUSINESS CASE
SECTION 1: PROJECT SUMMARY PAGE 1
1. PROJECT SUMMARY 1
The Playmor Station Upgrade project proposes to rebuild the Playmor (PLA) substation on an 2 expanded station footprint and increase station capacity by installing two 63kV/13/25 kV 3 transformers (the Project). The Project is necessary to meet load growth, and to continue to 4 reliably supply electricity to the surrounding area, including several large commercial and 5 industrial customers. The Project will also address aging infrastructure and equipment condition 6 issues. 7
The estimated total cost of the Project is $10.922 million in as-spent dollars, including AFUDC 8 and cost of removal. FBC plans to initiate the detailed design, procurement and construction for 9 the Project early in the first quarter of 2021. The substation is scheduled to be in service by 10 December 2021, with Project completion and close-out by February 2022. 11
1.1 BACKGROUND 12
The PLA substation is located on Sentinel Rd in South Slocan, BC between Castlegar and Nelson. 13 The existing station consists of a single 63/13 kV 16 MVA transformer (PLA T1) and is supplied 14 by FBC’s 63 kV transmission line 25 Line (25L). The station also provides a 13 kV distribution 15 supply source to the area through three distribution feeders (PLA1, PLA2 and PLA3). The PLA 16 station presently serves 2,484 residential customers, 270 commercial customers, and 1 industrial 17 customer. The following figures show the area served by PLA and the PLA substation property 18 location. 19

FORTISBC INC. PLAYMOR STATION UPGRADE BUSINESS CASE
SECTION 1: PROJECT SUMMARY PAGE 2
Figure 1: Playmor Substation, Distribution Supply, Transmission Supply, and Surrounding Area 1
2

FORTISBC INC. PLAYMOR STATION UPGRADE BUSINESS CASE
SECTION 1: PROJECT SUMMARY PAGE 3
Figure 2: PLA Substation Existing Location 1
2

FORTISBC INC. PLAYMOR STATION UPGRADE BUSINESS CASE
SECTION 2: PROJECT NEED PAGE 4
2. PROJECT NEED 1
There are three primary drivers for the PLA Station Upgrade Project. 2
1. Station capacity constraints are preventing growth in the PLA area for new and existing 3 customers; 4
2. FBC customers in the PLA area are potentially exposed to lengthy outages, due to the 5 limited ability of the neighbouring substations to support the PLA load in the event of an 6 outage to PLA T1; and 7
3. Station equipment is aging, poor health, and/or obsolete, presenting safety and reliability 8 risks in the event of a failure. 9
10 An upgrade to the PLA substation, encompassing the replacement of the existing 16 MVA 11 transformer with either two new 20 MVA 63/25/13 kV transformers (Alternative A) or a single 40 12 MVA 63/25/13 kV transformer (Alternative B), is required to address these issues, as discussed 13 below. 14
2.1 GROWTH CAPACITY 15
PLA area load experiences its peak load in the winter season. The existing winter limit for PLA 16 T1 in normal operation is 16.6 MVA as a result of equipment condition issues with the load tap 17 changer (LTC) as noted in section 2.3. 18
Due to capacity constraints at the station, two potential new large load requests could not be 19 connected at the requested load levels. To accommodate native load growth, load increases for 20 existing commercial/industrial customers and the recent large capacity requests, it is necessary 21 to increase the station capacity. 22
For each of the Alternatives, Figures 3 and 4 below show the actual/forecast winter peak PLA 23 area load and the actual/forecast winter peak PLA area load including the potential new loads 24 that could not be recently connected at the requested load levels. 25
The actual/forecast winter peak load will exceed the existing winter limit in normal operation in 26 year 2028 assuming native load growth. However, if the potential new loads are also considered, 27 the limit would be exceeded immediately. The winter rating in normal operation for the upgraded 28 station would be 47.5 MVA (each 20 MVA transformer has a normal winter rating of 23.75 MVA 29 as confirmed by the manufacturer), providing incremental capacity of 30.9 MVA compared to the 30 current winter limit of 16.6 MVA. 31

FORTISBC INC. PLAYMOR STATION UPGRADE BUSINESS CASE
SECTION 2: PROJECT NEED PAGE 5
Figure 3: PLA Area Winter Peak Load and Limits Under Alternative A (2x20 MVA) 1
2
0.00
5.00
10.00
15.00
20.00
25.00
30.00
35.00
40.00
45.00
50.00
20
15
20
16
20
17
20
18
20
19
20
20
20
21
20
22
20
23
20
24
20
25
20
26
20
27
20
28
20
29
20
30
20
31
20
32
20
33
20
34
20
35
20
36
20
37
20
38
20
39
20
40
MV
A
Year
Actual/Forecast Winter Peak Load (MVA)
Actual/Forecast Winter Peak Load + Potential New Loads (MVA)
Existing Winter Limit (MVA) - Normal Operation
Post-Upgrade Winter Limit (MVA) - Normal Operation
Existing Winter Limit (MVA) - PLA Transformer Outage
Post-Upgrade Winter Limit (MVA) - PLA Transformer Outage

FORTISBC INC. PLAYMOR STATION UPGRADE BUSINESS CASE
SECTION 2: PROJECT NEED PAGE 6
Figure 4: PLA Area Winter Peak Load and Limits Under Alternative B (1x40 MVA) 1
2
2.2 RELIABILITY 3
As shown in Figure 1 above, there are two neighbouring stations near PLA: Passmore (PAS) 4 substation and Tarrys (TAR) substation. PAS and TAR both have limited station capacity, limiting 5 FBC’s ability to offload residential and commercial customers from PLA to these substations. 6 Consequently, only 13 percent of the total PLA customers could be supplied during a PLA T1 7 transformer outage under peak load conditions. During a PLA T1 outage, all customers supplied 8 by distribution feeders PLA1 and PLA3, and 866 customers supplied by PLA2 would be without 9 service. 10
Figures 3 and 4 above show the existing and post-upgrade PLA station winter limits in the event 11 of a single PLA transformer outage under Alternatives A and B. 12
0.00
5.00
10.00
15.00
20.00
25.00
30.00
35.00
40.00
45.00
50.00
20
15
20
16
20
17
20
18
20
19
20
20
20
21
20
22
20
23
20
24
20
25
20
26
20
27
20
28
20
29
20
30
20
31
20
32
20
33
20
34
20
35
20
36
20
37
20
38
20
39
20
40
MV
A
Year
Actual/Forecast Winter Peak Load (MVA)
Actual/Forecast Winter Peak Load + Potential New Loads (MVA)
Existing Winter Limit (MVA) - Normal Operation
Post-Upgrade Winter Limit (MVA) - Normal Operation
Existing Winter Limit (MVA) - PLA Transformer Outage
Post-Upgrade Winter Limit (MVA) - PLA Transformer Outage

FORTISBC INC. PLAYMOR STATION UPGRADE BUSINESS CASE
SECTION 2: PROJECT NEED PAGE 7
Under Alternative A, the remaining unit can carry the entire station load during a single PLA 1 transformer outage for the next twenty years, at winter peak loads below 23.75 MVA. No customer 2 outages would be required, improving reliability for PLA area customers. 3
Under Alterative B, there would continue to be no ability at PLA station to supply load during a 4 transformer outage without support from a mobile transformer or the installation of a second 5 transformer. 6
The largest mobile transformer (M18) that may be available for substations in the Kootenay region 7 is rated 18 MVA. A larger 32 MVA mobile transformer (M32) is located in the Okanagan region 8 but transporting this unit can be challenging given its size, winter road conditions, and potential 9 BC road restrictions (depending on the timing of an outage). The use of the M32 would also be 10 subject to its availability at the time of a transformer outage event. The 20-year load forecast 11 indicates that in 2036, PLA station winter peak load will exceed 18 MVA. Relying on the larger 32 12 MVA unit could result in extended outages to customers (minimum 24 hours) and would leave the 13 Okanagan region at risk while the mobile transformer was relocated to the Kootenays. 14
Figures 3 and 4 illustrate that while there is a significant amount of capacity available in normal 15 operation under both alternatives, by installing two 20 MVA transformers at PLA, a single 16 transformer could carry the entire station load during a PLA transformer outage for the next 20 17 years. 18
2.3 AGING INFRASTRUCTURE AND EQUIPMENT CONDITION 19
PLA T1 was manufactured in 1966 and is now 54 years old. Recent Dissolved Gas Analysis 20 (DGA) results indicate a fast paper insulation aging process. Additionally, the LTC for PLA T1 is 21 experiencing abnormal arcing. The LTC is obsolete and repair is not possible because of the 22 unavailability of parts. Replacing the LTC would not be cost-effective, compared to replacement 23 of the transformer itself. 24
Other substation components are also in need of replacement. The PLA metal-clad switchgear 25 is obsolete and there are no spare breakers. The arc shoots are also suspected to contain 26 asbestos. The arc flash hazard at PLA is on the higher side (Category 3 with 13 cal/cm2 incident 27 energy at the switchgear). Failure of the switchgear would result in a substation outage with no 28 ability to restore service until replacement parts or switchgear could be sourced. The switchgear 29 needs to be replaced by 2027, even without the substation upgrade. 30
Furthermore, there is a deficiency in the station DC system that continues to trigger ground fault 31 alarms. Properly addressing this issue requires replacing the station circuitry and the obsolete DC 32 panel. 33
As a result of these equipment deficiencies, it is not feasible to replace these individual 34 components, and it is therefore necessary to rebuild the substation. 35

FORTISBC INC. PLAYMOR STATION UPGRADE BUSINESS CASE
SECTION 2: PROJECT NEED PAGE 8
2.4 SUMMARY OF PROJECT OBJECTIVES 1
To summarize, the objectives of the PLA Station Upgrade project are as follows: 2
Increase station capacity to support growth in the area; 3
Address reliability concerns during a PLA transformer outage to minimize potential 4 customer outages; and 5
Replace aging infrastructure and obsolete equipment consistent with FBC equipment 6 standards to address reliability and safety concerns. 7

FORTISBC INC. PLAYMOR STATION UPGRADE BUSINESS CASE
SECTION 3: PROJECT ALTERNATIVES PAGE 9
3. PROJECT ALTERNATIVES 1
FBC considered two alternatives to increase the capacity of PLA, which are a two-transformer 2 solution and a one-transformer solution. These alternatives are described and evaluated below. 3
3.1 ALTERNATIVE A: INSTALL TWO TRANSFORMERS 4
Alternative A includes replacing PLA T1 with two new dual voltage 63/25/13 kV 20 MVA 5 transformers. The station will be entirely rebuilt with all new equipment that is consistent with FBC 6 equipment standards and will resolve other equipment age and condition issues. To 7 accommodate the upgrade, the station footprint will be expanded. 8
The upgraded station will continue to have three feeders (PLA1, PLA2, and PLA3). A spare 9 breaker will be installed for a future fourth feeder (PLA4). The conduit for PLA4 will be installed 10 and capped off outside the station fence. Any new conductor required for the reconfiguration of 11 the overhead feeders will use 477 ACSR. To provide offload capability, bypass switches will be 12 required between PLA1 and PLA2, and PLA3 and PLA4. Finally, the transmission switches PLA 13 25-1 and 25-2 will be salvaged and held as spares. 14
Additional property has been acquired to the north and adjacent to the existing site. The expanded 15 site allows for construction of the upgrade while maintaining service to customers with the existing 16 substation in-service. Some reconfiguration of the transmission line (25L) and distribution feeders 17 (PLA1, PLA2, and PLA3) in the immediate vicinity of the substation is also be required to allow 18 for construction of the new station. 19
The Class 3 capital cost estimate for this alternative is $10.719 million ($2020), including AFUDC 20 and removal costs. A single-line diagram is included as Appendix 1. 21
Advantages 22
The advantages of Alternative A are: 23
Installed capacity summer limit 40 MVA and winter limit 47.5 MVA; 24
Ability to supply large load requests in the area and native load growth; 25
Reliability concerns addressed with redundant transformer. The remaining transformer 26 can carry peak station load during a PLA transformer outage with no customers outages 27 required; 28
Mobile transformer no longer required for PLA transformer outage given redundant 29 transformer; and 30
Aging infrastructure and obsolete equipment replaced. Non arc-flash rated switchgear and 31 asbestos exposure risks removed. 32

FORTISBC INC. PLAYMOR STATION UPGRADE BUSINESS CASE
SECTION 3: PROJECT ALTERNATIVES PAGE 10
Disadvantages 1
The disadvantages of Alternative A are: 2
Station needs to be expanded to accommodate the second transformer and allow for 3 construction of the upgrade while maintaining service to customers with the existing 4 station in-service; and 5
Incremental O&M costs of approximately $15,000 per year. The increase in O&M costs 6 are primarily associated with the installation of a second transformer and three high 7 voltage circuit breakers. 8
3.2 ALTERNATIVE B: INSTALL SINGLE TRANSFORMER 9
Alternative B includes replacing PLA T1 with a single new dual voltage 63/25/13 kV 40 MVA 10 transformer. The station will be entirely rebuilt with all new equipment that is consistent with FBC 11 equipment standards and will resolve other equipment age and condition issues. A mobile 12 transformer connection is required. Space has been provisioned for the installation of second 13 transformer in the future if required. To accommodate the upgrade, the station footprint will be 14 expanded. All other aspects of the project will be similar to Alternative A. 15
The Class 4 capital cost estimate for this alternative is $9.499 million (2020$), including AFUDC 16 and removal costs. 17
Advantages 18
The advantages of Alternative B are: 19
Installed capacity summer limit 40 MVA and winter limit 47.5 MVA; 20
Ability to supply large load requests in the area and native load growth; 21
Incremental O&M costs of approximately $7 thousand per year, which is slightly lower 22 than for Alternative A. The increase in O&M costs are associated with the installation of 23 two high voltage circuit breakers; and 24
Aging infrastructure and obsolete equipment replaced. Non arc-flash rated switchgear 25 and asbestos exposure risks removed. 26
Disadvantages 27
The disadvantages of Alternative B are: 28
No transformer redundancy at PLA. Reliability concerns persist in the event of a PLA 29 transformer outage; 30

FORTISBC INC. PLAYMOR STATION UPGRADE BUSINESS CASE
SECTION 3: PROJECT ALTERNATIVES PAGE 11
During a PLA transformer outage, restoring customers will require the use of the mobile 1 transformer. Availability of the mobile transformer will be dependent on BC road 2 conditions, BC road restrictions (March to June), and if it is already designated to another 3 station; 4
The largest mobile transformer (M18) that is available in the Kootenays is 18 MVA. As per 5 the 20-year load forecast, the M18 can only carry the winter peak station load until 2036; 6
Beyond 2036, one of the following solutions will be required, as the M18 can no longer 7 carry the winter peak station load. The customer restoration times associated with each 8 option for a transformer outage are also provided below; 9
a) Purchase a new mobile transformer rated 32 MVA for the Kootenay region 10 (approximately >$2 million). Customer restoration times may be upwards of 8 11 hours. B.C road restrictions prevent the transportation of a larger unit (>32 MVA) 12 as a mobile transformer; 13
b) Procure and install a second 63/25/13 kV 40 MVA transformer at PLA. Project will 14 require costs for installing a second transformer and station equipment 15 (approximately $1.2 million); 16
c) FBC would need to rely on the larger mobile transformer unit (M32, 32 MVA), which 17 resides in the Okanagan region. Customer restoration times may be extended to 18 a minimum of 24 hours due to transport and availability of the mobile transformer 19 from the Okanagan region. Restoration using the M32 may not be an option due 20 to BC road restrictions (March to June) and BC road conditions. Okanagan region 21 will be at a higher risk while M32 resides in the Kootenay region. Maintenance and 22 transportation costs for M32 will increase due to additional wear and tear on the 23 unit; 24
Station needs be expanded to allow for construction of the upgrade while maintaining 25 service to customers with the existing station in-service and to provide space for a potential 26 future second transformer (land has already been acquired); and 27
Excluded from the $9.499 million capital cost is the cost of purchasing a new mobile 28 transformer in year 2036 (assumed Option A selected). FBC assumes the cost of that 29 addition to be $2 million subject to inflation. These 2036 costs have been included in the 30 40-year financial analysis of this project for comparability to Alternatives A. 31
3.3 ALTERNATIVE C: DO NOTHING 32
The Do Nothing Option would involve no modifications to the substation equipment. 33

FORTISBC INC. PLAYMOR STATION UPGRADE BUSINESS CASE
SECTION 3: PROJECT ALTERNATIVES PAGE 12
Advantages 1
The advantages of Alternative C are: 2
No immediate costs. 3
Disadvantages 4
The disadvantages of Alternative C are: 5
Would not address station capacity issues. Inability to sustain native load growth or new 6 load requests in the near future; 7
Would not address reliability issues; 8
Would not address aging infrastructure or equipment condition issues. Safety concerns 9 associated with the switchgear (arc-flash) and asbestos would persist; 10
Urgent repair expenditures at this site can be expected to rise. Major component failures 11 would require long lead times; 12
Potential to negatively affect community relations and local economy with minimal ability 13 to connect to new load requests; 14
Failure of the switchgear would result in the inability to restore customers until replacement 15 parts or switchgear can be sourced; and 16
Failure of PLA T1 would require restoration through M18, if available. Additional costs for 17 M18 monitoring and maintenance to incur due to extended period in service. 18
3.4 OPTION SUMMARY AND RECOMMENDATION 19
Table 1 below summarizes the analysis of the three options. 20
Revenue requirements analyses for Alternatives A and B are included as Appendices 2 and 3, 21 respectively. 22
Table 1: PLA Station Upgrade Project Alternatives Comparison 23
Criteria Alternative A – Two Transformers
Alternative B – Single transformer
Alternative C – Do Nothing
Capital Cost ($2020) $10.719 million $ 9.499 million $ - Incremental O&M ($2020) $ 0.015 million $ 0.007 million $ - Present Value Incremental Revenue Requirement
$ 11.683 million $ 11.522 N/A
Levelized Rate Impact 0.19% 0.18% N/A

FORTISBC INC. PLAYMOR STATION UPGRADE BUSINESS CASE
SECTION 3: PROJECT ALTERNATIVES PAGE 13
Criteria Alternative A – Two Transformers
Alternative B – Single transformer
Alternative C – Do Nothing
Addresses station capacity constraints
Yes Yes No
Addresses reliability issues Yes No No Addresses aging infrastructure and equipment condition issues
Yes Yes No
Resolution Window > 20 Years 14 years 1-2 years Alternative Evaluation Ranking 1 2 3
1
Alternative A, installing two 20 MVA transformers, is the preferred option as it achieves all of the 2 Project criteria, and provides the longest term solution for the area (>20 years). By installing two 3 transformers at PLA, a single transformer could carry the entire forecast station load during a PLA 4 transformer outage for the next 20 years. With the ability to offload the entire station load to either 5 transformer, no customer outages would be required during a transformer outage under 6 Alternative A. Furthermore, although Alternative B has a lower capital cost initially, it would require 7 future capital expenditures after 2036 (not included in the table above) to ensure the winter peak 8 station load could be supplied during a PLA transformer outage. Finally, the rate impact to 9 customers is 0.01 percent higher for Alterative A as compared to Alternative B.10

FORTISBC INC. PLAYMOR STATION UPGRADE BUSINESS CASE
SECTION 4: PROJECT DESCRIPTION PAGE 14
4. PROJECT DESCRIPTION 1
4.1 PROJECT SCOPE 2
The scope of the preferred Alternative A for the Playmor Station Upgrade project includes, but is 3 not limited to, the following: 4
Station Work: 5
Extend site for new station adjacent to existing site, built to current FBC standards; 6
Install new station fence; 7
Install two (2) new 20MVA, 63kV/13/25 kV transformers with OLTC; 8
Install transformer containment, FQ stone and access steps; 9
Install two new 69kV A-frames for line connection; 10
Install transformer drainage, external sump, dry pump, soak pit; 11
Install two 69kV, 1200A transformer disconnects with MODs; 12
Install two 69kV, 1200A line breakers and disconnects; 13
Install 69kV, 1200A tie breaker and disconnects; 14
Install three aluminium breaker platforms; 15
Install new 69kV bus per SLD; 16
Install two, 2 bay distribution structures; 17
Install two, 25kV, 2000A Main breakers and load side disconnects; 18
Install four, 25kV, 1200A feeder breakers and disconnects; 19
Install two feeder bypass breakers 25kV, 1200A, vertical break bypass switches; 20
Install 25kV, 2000A bus breaker and disconnects; 21
Install four new feeder egress structures; 22
Install 7.2kV/14.4k 3 phase VTs and fuses for each distribution structure; 23
Install 7.2kV/14.4k, 25kV station service transformer and fuse for each distribution 24 structure; 25
Install new station AC/DC station service; 26

FORTISBC INC. PLAYMOR STATION UPGRADE BUSINESS CASE
SECTION 4: PROJECT DESCRIPTION PAGE 15
Install temporary distribution feeds during construction (under Transmission and 1 Distribution work); 2
Install new Control building and cable pull pit; 3
Install new station duct & cable trench system; 4
Install new standard Class II metering and protection; 5
Install new SCADA infrastructure; 6
Install new station ground grid & interconnect with existing; 7
Install 4-40m ground wells; 8
Install new station lighting; 9
Complete station ground grid study; 10
Complete station geotechnical study; 11
Realign 69kV lines to new station A-frames (under Transmission and Distribution work); 12
Demolish all remaining existing structures & equipment; 13
Salvage existing major station equipment; 14
Demolish existing buildings on site (switchgear), remove hazardous materials as required; 15
Demolish existing transformer containment (Sorbweb); 16
Salvage transformer; and 17
Animal protection cover-up of substation equipment to reduce the number of animal-18 caused outages. 19
Transmission and Distribution Work: 20
Re-route 25L to accommodate new PLA substation site build; 21
Re-route existing distribution feeders (PLA1, PLA2 and PLA3) to accommodate the new 22 PLA substation site build; 23
Cutover/tie-in line(s) to the new PLA substation; and 24
New conductor is assumed for all new spans 477 ASCR for transmission and distribution 25 underbuild with 3/0 ACSR Neutral, and 750 MCM for distribution underground cables with 26 4/0 Copper poly Neutral underground cable. 27

FORTISBC INC. PLAYMOR STATION UPGRADE BUSINESS CASE
SECTION 4: PROJECT DESCRIPTION PAGE 16
Land Acquisition: 1
In 2020, additional property was acquired north and adjacent to the existing site to increase the 2 station footprint. The expanded site will allow for construction of the upgrade while maintaining 3 service to customers with the existing station remaining in service (a single brief outage for two 4 to three hours is anticipated for PLA3 feeder as part of the distribution re-route work). Figure 5 5 below shows the existing PLA land and the additional land that was acquired. 6
Figure 5: Additional land acquired adjacent to existing station 7
8
4.1 PROJECT RISKS 9
The potential risks to the PLA Station Upgrade project identified to date include the following. 10

FORTISBC INC. PLAYMOR STATION UPGRADE BUSINESS CASE
SECTION 4: PROJECT DESCRIPTION PAGE 17
Unforeseen environmental or archaeological discoveries during the construction phase. 1 The risk of such occurrences is considered low, based on FBC’s previous construction 2 experience at PLA substation. In 2019, a preliminary site investigation revealed no 3 indicators of previous contamination or other obvious environmental concerns and 4 therefore concluded that further intrusive investigation is not warranted. All capital projects 5 include an environmental management plan, which provides guidance on management of 6 environmental risks during the construction phase; 7
Availability of labour and materials may be at risk due to Covid-19 and the current state of 8 the economy. FBC has partially mitigated the risk of any financial or schedule pressures 9 by developing preliminary equipment specifications and obtaining quotes from vendors. 10 Any residual risk will be managed through project planning and contractual performance 11 guarantees; and 12
Outages to be coordinated with system and operational planning to have minimal system 13 impact. 14
4.2 PROJECT COST ESTIMATE 15
The PLA Station Upgrade project has a capital cost of $10.719 million in 2020$ (including $0.289 16 million of removal costs). The cost estimate for the Project has been developed to a Class 3 17 degree of accuracy as defined in the AACE International Recommended Practice No. 10S-90. 18
Table 2 below summarizes the total estimate project cost summary. 19
Table 2: Total estimate project cost summary ($ millions) 20
21
Project Component Total Project Cost As Spent $
Station Work (incl. 15% contingency) 8.672$ 8.848$ T&D Line Work (incl. 10% contingency) 0.799 0.815 Land 0.076 0.076 AFUDC 0.866 0.866 Construction Cost 10.413$ 10.605$ Station Work COR 0.251 0.260 T&D Line Work COR 0.038 0.039 AFUDC 0.018 0.018 Net Removal Cost 0.307$ 0.318$ Total Project Cost 10.719$ 10.922$

FORTISBC INC. PLAYMOR STATION UPGRADE BUSINESS CASE
SECTION 4: PROJECT DESCRIPTION PAGE 18
4.3 PROJECT SCHEDULE 1
The project is expected to be complete by February 2022, assuming approval is provided for the 2 preferred Alternative A by December 2020, engineering and design for the IFC package begins 3 in September 2020, and construction begins in March 2021. 4
The preliminary high-level project schedule is provided in Figure 6. Under the proposed schedule, 5 final commissioning and construction of the new station would be complete by December 2021, 6 and the station, transmission and distribution salvage would take place in January and February 7 2022. 8
Figure 6: Preliminary high-level project schedule 9
10

FORTISBC INC. PLAYMOR STATION UPGRADE BUSINESS CASE
SECTION 5: PUBLIC AND FIRST NATIONS CONSULTATION PAGE 19
5. PUBLIC AND FIRST NATIONS CONSULATION 1
Three residential customers are located within 150 meters from the substation, with the closest 2 residential customer approximately 75 meters from the existing station. As shown in Figure 2, 3 residential customers have limited visibility of the station due to tree coverage. There is also 4 limited visibility of the station from Highway 3A since it is located on a hill and behind a tree line. 5 The new station will be built adjacent to the existing station and visibility of the rebuilt substation 6 will be similar. 7
Letters were sent out to residents within 150 meters of the project in August of 2020 notifying 8 them of the project and footprint expansion. 9
Finally, the transmission and distribution work will be completed in a staged approach to relocate 10 existing facilities to accommodate the new substation and minimize outages to customers as best 11 as possible, in particular to the distribution services where there are limited backup capabilities. 12
The PLA station upgrade does not trigger a requirement for First Nations consultation, as FBC 13 believes that Aboriginal Rights and Title will not be affected by this Project. The proposed 14 substation site is not near any known archaeological site and is not in a zone of high archeological 15 potential. 16

FORTISBC INC. PLAYMOR STATION UPGRADE BUSINESS CASE
SECTION 6: CONCLUSION PAGE 20
6. CONCLUSION 1
The Company respectfully submits that the PLA Station Upgrade project is necessary to support 2 growth and improve reliability of service for new and existing customers in the PLA area. Based 3 on the evaluation of all feasible alternatives, Alternative A provides the best solution that would 4 allow the Company to meet all Project objectives and requirements. The substation is scheduled 5 to be in service by December 2021, with Project completion and close-out by February 2022. 6

Appendix 1 ALTERNATIVE A SINGLE LINE DIAGRAM


Appendix 2 ALTERNATIVE A REVENUE REQUIREMENTS ANALYSIS

FortisBC Inc.Playmor Station Upgrade ‐ Alternative AAugust 2020($000s), unless otherwise stated
Line Particulars Reference 2020 2021 2022 2023 2024 2025 2026 2027 2028 2029 2030 2031 2032 2033 2034 2035 2036 2037 2038 2039 2040 2045 2050 2055 2060 20641 Cost of Service2 Operation & Maintenance ‐ Net of Capitalized Overhead Line 23 ‐ ‐ ‐ 13 13 13 14 14 14 14 15 15 15 16 16 16 16 17 17 17 18 20 22 24 26 29 3 Property Taxes Line 28 ‐ ‐ ‐ 70 70 70 70 70 71 71 71 71 71 71 72 72 72 72 72 72 73 74 75 77 85 92 4 Depreciation Expense Line 54 ‐ ‐ ‐ 277 277 277 277 277 277 277 277 277 277 277 277 278 278 278 278 278 278 278 279 217 128 129 5 Income Taxes Line 96 ‐ ‐ (546) (6) 13 28 41 53 64 73 82 89 96 102 107 111 115 118 120 122 124 126 121 90 50 46 6 Earned Return Line 79 ‐ ‐ ‐ 698 691 673 655 637 619 601 583 565 547 529 511 493 475 457 439 421 403 313 223 138 77 43 7 Incremental Annual Revenue Requirement Sum of Line 1 to Line 6 ‐ ‐ (546) 1,052 1,063 1,060 1,056 1,051 1,044 1,036 1,027 1,017 1,006 995 982 969 955 941 926 911 895 810 719 546 367 339 8 PV of Revenue Requirement (After‐tax WACC of 5.77%) Line 7 / (1 + Line 81)^Yr ‐ ‐ (461) 840 803 757 713 671 630 591 554 519 485 453 423 395 368 343 319 297 276 188 126 72 37 27 9 Total PV of Annual Revenue Requirement Sum of Line 8 11,683 1011 2021 Approved Revenue Requirement (2021 Advanced Materials) 393,512 393,512 393,512 393,512 393,512 393,512 393,512 393,512 393,512 393,512 393,512 393,512 393,512 393,512 393,512 393,512 393,512 393,512 393,512 393,512 393,512 393,512 393,512 393,512 393,512 393,512 12 % change in Rates Line 7 / Line 11 0.00% 0.00% ‐0.14% 0.27% 0.27% 0.27% 0.27% 0.27% 0.27% 0.26% 0.26% 0.26% 0.26% 0.25% 0.25% 0.25% 0.24% 0.24% 0.24% 0.23% 0.23% 0.21% 0.18% 0.14% 0.09% 0.09%1314 PV of Annual 2021 Approved Revenue Requirement Line 11 / (1 + Line 81)^Yr 372,040 351,740 332,548 314,403 297,248 281,029 265,695 251,197 237,491 224,532 212,281 200,698 189,747 179,394 169,605 160,351 151,601 143,329 135,509 128,115 121,124 91,494 69,112 52,205 39,434 31,507 15 Total PV of 2021 Approved Revenue Requirement Sum of Line 14 6,272,492 16 Levelized % Increase (45 yrs) on 2021 Rate Line 9 / Line 15 0.19%1718 Operation & Maintenance19 Labour Costs ‐ ‐ ‐ 15 15 16 16 16 17 17 17 18 18 18 19 19 19 20 20 21 21 23 26 28 31 34 20 Non‐Labour Costs ‐ ‐ ‐ ‐ ‐ ‐ ‐ ‐ ‐ ‐ ‐ ‐ ‐ ‐ ‐ ‐ ‐ ‐ ‐ ‐ ‐ ‐ ‐ ‐ ‐ ‐ 21 Total Gross O&M Expenses Line 19 + Line 20 ‐ ‐ ‐ 15 15 16 16 16 17 17 17 18 18 18 19 19 19 20 20 21 21 23 26 28 31 34 22 Less: Capitalized Overhead Overhead Rate of 15% ‐ ‐ ‐ (2) (2) (2) (2) (2) (2) (3) (3) (3) (3) (3) (3) (3) (3) (3) (3) (3) (3) (3) (4) (4) (5) (5) 23 Net O&M Expenses Line 21 + Line 22 ‐ ‐ ‐ 13 13 13 14 14 14 14 15 15 15 16 16 16 16 17 17 17 18 20 22 24 26 29 2425 Property Taxes26 General, School and Other ‐ ‐ ‐ 70 70 70 70 70 71 71 71 71 71 71 72 72 72 72 72 72 73 74 75 77 85 92 27 1% in Lieu of General Municipal Tax1 1% of Line 7 ‐ ‐ ‐ ‐ ‐ ‐ ‐ ‐ ‐ ‐ ‐ ‐ ‐ ‐ ‐ ‐ ‐ ‐ ‐ ‐ ‐ ‐ ‐ ‐ ‐ ‐ 28 Total Property Taxes Line 26 + Line 27 ‐ ‐ ‐ 70 70 70 70 70 71 71 71 71 71 71 72 72 72 72 72 72 73 74 75 77 85 92 29 1 ‐ Calculation is based on the second preceding year, e.g. 2019 is based on 2017 revenue3031 Capital Spending32 Project Capital Spending2 483 8,710 546 ‐ ‐ ‐ ‐ ‐ ‐ ‐ ‐ ‐ ‐ ‐ ‐ ‐ ‐ ‐ ‐ ‐ ‐ ‐ ‐ ‐ ‐ ‐ 33 AFUDC 8 283 575 ‐ ‐ ‐ ‐ ‐ ‐ ‐ ‐ ‐ ‐ ‐ ‐ ‐ ‐ ‐ ‐ ‐ ‐ ‐ ‐ ‐ ‐ ‐
34 Total Annual Capital Spending & AFUDC Sum of Line 32 to 35 490 8,993 1,122 ‐ ‐ ‐ ‐ ‐ ‐ ‐ ‐ ‐ ‐ ‐ ‐ ‐ ‐ ‐ ‐ ‐ ‐ ‐ ‐ ‐ ‐ ‐ 35 Cost of Removal ‐ 31 286 ‐ ‐ ‐ ‐ ‐ ‐ ‐ ‐ ‐ ‐ ‐ ‐ ‐ ‐ ‐ ‐ ‐ ‐ ‐ ‐ ‐ ‐ ‐ 36 Contributions in Aid of Construction (CIAC) ‐ ‐ ‐ ‐ ‐ ‐ ‐ ‐ ‐ ‐ ‐ ‐ ‐ ‐ ‐ ‐ ‐ ‐ ‐ ‐ ‐ ‐ ‐ ‐ ‐ ‐
37 Total Annual Project Cost ‐ Capital Line 34 + Line 35 490 9,024 1,408 ‐ ‐ ‐ ‐ ‐ ‐ ‐ ‐ ‐ ‐ ‐ ‐ ‐ ‐ ‐ ‐ ‐ ‐ ‐ ‐ ‐ ‐ ‐ 3839 Total Project Cost (incl. AFUDC) Sum of Line 34 10,605 40 Net Project Cost (incl. Removal and/or CIAC) Sum of Line 37 10,922 41 2 ‐ Excluding capitalized overhead; First year of analysis includes all prior year spending4243 Gross Plant in Service (GPIS)44 GPIS ‐ Beginning3 Preceding Year, Line 48 ‐ ‐ ‐ 10,605 10,607 10,610 10,612 10,614 10,617 10,619 10,622 10,624 10,627 10,630 10,632 10,635 10,638 10,641 10,644 10,647 10,650 10,666 10,684 8,706 5,467 5,482 45 Additions to Plant4 ‐ ‐ ‐ 2 2 2 2 2 2 3 3 3 3 3 3 3 3 3 3 3 3 3 4 4 5 5 46 Retirements ‐ ‐ ‐ ‐ ‐ ‐ ‐ ‐ ‐ ‐ ‐ ‐ ‐ ‐ ‐ ‐ ‐ ‐ ‐ ‐ ‐ ‐ ‐ ‐ ‐ (5,261) 47 Net Addition to Plant Sum of Line 45 to 46 ‐ ‐ ‐ 2 2 2 2 2 2 3 3 3 3 3 3 3 3 3 3 3 3 3 4 4 5 (5,256) 48 GPIS ‐ Ending Line 44 + Line 47 ‐ ‐ ‐ 10,607 10,610 10,612 10,614 10,617 10,619 10,622 10,624 10,627 10,630 10,632 10,635 10,638 10,641 10,644 10,647 10,650 10,653 10,670 10,688 8,710 5,472 226 49 3 ‐ Consistent with treatment of CPCN, additions (when work complete and placed in‐service) is shown in the opening balance of plant on Jan 1 of following year)50 4 ‐ Includes capitalized overhead5152 Accumulated Depreciation53 Accumulated Depreciation ‐ Beginning Preceding Year, Line 57 ‐ ‐ ‐ ‐ 40 (237) (513) (790) (1,067) (1,344) (1,622) (1,899) (2,176) (2,453) (2,731) (3,008) (3,286) (3,563) (3,841) (4,119) (4,397) (5,787) (7,180) (6,514) (4,249) (4,759) 54 Depreciation Expense5 Line 44 @ 2.63% ‐ ‐ ‐ (277) (277) (277) (277) (277) (277) (277) (277) (277) (277) (277) (277) (278) (278) (278) (278) (278) (278) (278) (279) (217) (128) (129) 55 Retirements ‐ ‐ ‐ ‐ ‐ ‐ ‐ ‐ ‐ ‐ ‐ ‐ ‐ ‐ ‐ ‐ ‐ ‐ ‐ ‐ ‐ ‐ ‐ ‐ ‐ 5,261 56 Cost of Removal ‐ ‐ ‐ 317 ‐ ‐ ‐ ‐ ‐ ‐ ‐ ‐ ‐ ‐ ‐ ‐ ‐ ‐ ‐ ‐ ‐ ‐ ‐ ‐ ‐ ‐ 57 Accumulated Depreciation ‐ Ending Sum of Line 53 to 55 ‐ ‐ ‐ 40 (237) (513) (790) (1,067) (1,344) (1,622) (1,899) (2,176) (2,453) (2,731) (3,008) (3,286) (3,563) (3,841) (4,119) (4,397) (4,674) (6,065) (7,458) (6,731) (4,378) 374 58 5 ‐ Depreciation & Amortization Expense calculation is based on opening balance x composite depreciation rate; The composite rate of all assets addition to plant is 2.63%59
Page 1 of 3

FortisBC Inc.Playmor Station Upgrade ‐ Alternative AAugust 2020($000s), unless otherwise stated
Line Particulars Reference 2020 2021 2022 2023 2024 2025 2026 2027 2028 2029 2030 2031 2032 2033 2034 2035 2036 2037 2038 2039 2040 2045 2050 2055 2060 206460 Rate Base and Earned Return61 Gross Plant in Service ‐ Beginning Line 44 ‐ ‐ ‐ 10,605 10,607 10,610 10,612 10,614 10,617 10,619 10,622 10,624 10,627 10,630 10,632 10,635 10,638 10,641 10,644 10,647 10,650 10,666 10,684 8,706 5,467 5,482 62 Gross Plant in Service ‐ Ending Line 48 ‐ ‐ ‐ 10,607 10,610 10,612 10,614 10,617 10,619 10,622 10,624 10,627 10,630 10,632 10,635 10,638 10,641 10,644 10,647 10,650 10,653 10,670 10,688 8,710 5,472 226 6364 Accumulated Depreciation ‐ Beginning Line 53 ‐ ‐ ‐ ‐ 40 (237) (513) (790) (1,067) (1,344) (1,622) (1,899) (2,176) (2,453) (2,731) (3,008) (3,286) (3,563) (3,841) (4,119) (4,397) (5,787) (7,180) (6,514) (4,249) (4,759) 65 Accumulated Depreciation ‐ Ending Line 57 ‐ ‐ ‐ 40 (237) (513) (790) (1,067) (1,344) (1,622) (1,899) (2,176) (2,453) (2,731) (3,008) (3,286) (3,563) (3,841) (4,119) (4,397) (4,674) (6,065) (7,458) (6,731) (4,378) 374 6667 CIAC ‐ Beginning Line 59 ‐ ‐ ‐ ‐ ‐ ‐ ‐ ‐ ‐ ‐ ‐ ‐ ‐ ‐ ‐ ‐ ‐ ‐ ‐ ‐ ‐ ‐ ‐ ‐ ‐ ‐ 68 CIAC ‐ Ending Line 59 ‐ ‐ ‐ ‐ ‐ ‐ ‐ ‐ ‐ ‐ ‐ ‐ ‐ ‐ ‐ ‐ ‐ ‐ ‐ ‐ ‐ ‐ ‐ ‐ ‐ ‐ 6970 Accumulated Amortization of CIAC ‐ Beginning Line 59 ‐ ‐ ‐ ‐ ‐ ‐ ‐ ‐ ‐ ‐ ‐ ‐ ‐ ‐ ‐ ‐ ‐ ‐ ‐ ‐ ‐ ‐ ‐ ‐ ‐ ‐ 71 Accumulated Amortization of CIAC ‐ Ending Line 59 ‐ ‐ ‐ ‐ ‐ ‐ ‐ ‐ ‐ ‐ ‐ ‐ ‐ ‐ ‐ ‐ ‐ ‐ ‐ ‐ ‐ ‐ ‐ ‐ ‐ ‐ 7273 Net Plant in Service, Mid‐Year (Sum of Lines 61 to Line 71 ) / 2 ‐ ‐ ‐ 10,626 10,510 10,236 9,961 9,687 9,412 9,137 8,863 8,588 8,314 8,039 7,764 7,490 7,215 6,940 6,666 6,391 6,116 4,742 3,367 2,086 1,156 661 74 Cash Working Capital Line 48 x FBC CWC/Closing GPIS % ‐ ‐ ‐ 31 31 31 31 31 31 31 31 31 31 31 31 31 31 31 31 31 31 31 31 26 16 1 75 Total Rate Base Sum of Line 73 to 74 ‐ ‐ ‐ 10,657 10,541 10,267 9,992 9,718 9,443 9,169 8,894 8,620 8,345 8,070 7,796 7,521 7,246 6,972 6,697 6,422 6,147 4,773 3,399 2,112 1,172 662 7677 Equity Return Line 75 x ROE x Equity % ‐ ‐ ‐ 390 386 376 366 356 346 336 326 315 305 295 285 275 265 255 245 235 225 175 124 77 43 24 78 Debt Component 7 ‐ ‐ ‐ 308 305 297 289 281 273 265 257 249 241 233 225 218 210 202 194 186 178 138 98 61 34 19 79 Total Earned Return Line 77 + Line 78 ‐ ‐ ‐ 698 691 673 655 637 619 601 583 565 547 529 511 493 475 457 439 421 403 313 223 138 77 43 80 Return on Rate Base % Line 79 / Line 75 0.00% 0.00% 0.00% 6.55% 6.55% 6.55% 6.55% 6.55% 6.55% 6.55% 6.55% 6.55% 6.55% 6.55% 6.55% 6.55% 6.55% 6.55% 6.55% 6.55% 6.55% 6.55% 6.55% 6.55% 6.55% 6.55%81 After‐ Tax Weighted Average Cost of Capital (WACC) 8 5.77% 5.77% 5.77% 5.77% 5.77% 5.77% 5.77% 5.77% 5.77% 5.77% 5.77% 5.77% 5.77% 5.77% 5.77% 5.77% 5.77% 5.77% 5.77% 5.77% 5.77% 5.77% 5.77% 5.77% 5.77% 5.77%82 6 ‐ (Line 47 + Line 54 + Line 59) x [(Days In‐service/365)‐1/2]83 7 ‐ Line 75 x (LTD Rate x LTD% + STD Rate x STD %)84 8 ‐ ROE Rate x Equity Component + [(STD Rate x STD Portion) + (LTD Rate x LTD Portion)] x (1‐ Income Tax Rate)]8586 Income Tax Expense87 Earned Return Line 79 ‐ ‐ ‐ 698 691 673 655 637 619 601 583 565 547 529 511 493 475 457 439 421 403 313 223 138 77 43 88 Deduct: Interest on debt Line 78 ‐ ‐ ‐ (308) (305) (297) (289) (281) (273) (265) (257) (249) (241) (233) (225) (218) (210) (202) (194) (186) (178) (138) (98) (61) (34) (19) 89 Add: Depreciation Expense Line 54 ‐ ‐ ‐ 277 277 277 277 277 277 277 277 277 277 277 277 278 278 278 278 278 278 278 279 217 128 129 90 Deduct: Overhead Capitalized Expenses for Tax Purposes ‐ ‐ ‐ (2) (2) (2) (2) (2) (2) (3) (3) (3) (3) (3) (3) (3) (3) (3) (3) (3) (3) (3) (4) (4) (5) (5) 91 Deduct: Removal Costs Line 35 ‐ ‐ (317) ‐ ‐ ‐ ‐ ‐ ‐ ‐ ‐ ‐ ‐ ‐ ‐ ‐ ‐ ‐ ‐ ‐ ‐ ‐ ‐ ‐ ‐ ‐ 92 Deduct: Capital Cost Allowance Line 104 ‐ ‐ (1,160) (680) (626) (576) (530) (487) (448) (412) (379) (349) (321) (296) (272) (250) (230) (212) (195) (179) (165) (109) (72) (47) (31) (22) 93 Taxable Income After Tax Sum of Line 87 to 92 ‐ ‐ (1,476) (16) 34 74 111 143 172 198 221 241 259 275 288 300 310 318 325 331 335 341 328 243 135 126 94 Income Tax Rate 27% 27% 27% 27% 27% 27% 27% 27% 27% 27% 27% 27% 27% 27% 27% 27% 27% 27% 27% 27% 27% 27% 27% 27% 27% 27%9596 Total Income Tax Expense Line 93 / (1 ‐ Line 94) x Line 94 ‐ ‐ (546) (6) 13 28 41 53 64 73 82 89 96 102 107 111 115 118 120 122 124 126 121 90 50 46 9798 Capital Cost Allowance99 Opening Balance Proceeding Year, Line 105 ‐ ‐ ‐ 8,579 7,899 7,273 6,697 6,168 5,680 5,232 4,819 4,440 4,091 3,770 3,474 3,202 2,952 2,722 2,510 2,316 2,136 1,434 971 666 465 354 100 Additions to Plant Line 34 ‐ ‐ 10,605 ‐ ‐ ‐ ‐ ‐ ‐ ‐ ‐ ‐ ‐ ‐ ‐ ‐ ‐ ‐ ‐ ‐ ‐ ‐ ‐ ‐ ‐ ‐ 101 Less: AFUDC Line 33 ‐ ‐ (866) ‐ ‐ ‐ ‐ ‐ ‐ ‐ ‐ ‐ ‐ ‐ ‐ ‐ ‐ ‐ ‐ ‐ ‐ ‐ ‐ ‐ ‐ ‐ 102 Less: CIAC Line 36 ‐ ‐ ‐ ‐ ‐ ‐ ‐ ‐ ‐ ‐ ‐ ‐ ‐ ‐ ‐ ‐ ‐ ‐ ‐ ‐ ‐ ‐ ‐ ‐ ‐ ‐ 103 Net Addition for CCA Sum of Line 100 through 102 ‐ ‐ 9,739 ‐ ‐ ‐ ‐ ‐ ‐ ‐ ‐ ‐ ‐ ‐ ‐ ‐ ‐ ‐ ‐ ‐ ‐ ‐ ‐ ‐ ‐ ‐ 104 CCA [Line 99 + (Line 103/2)] x CCA Rate ‐ ‐ (1,160) (680) (626) (576) (530) (487) (448) (412) (379) (349) (321) (296) (272) (250) (230) (212) (195) (179) (165) (109) (72) (47) (31) (22) 105 Closing Balance Line 99 + Line 103 + Line 104 ‐ ‐ 8,579 7,899 7,273 6,697 6,168 5,680 5,232 4,819 4,440 4,091 3,770 3,474 3,202 2,952 2,722 2,510 2,316 2,136 1,971 1,325 899 618 433 332
Page 2 of 3
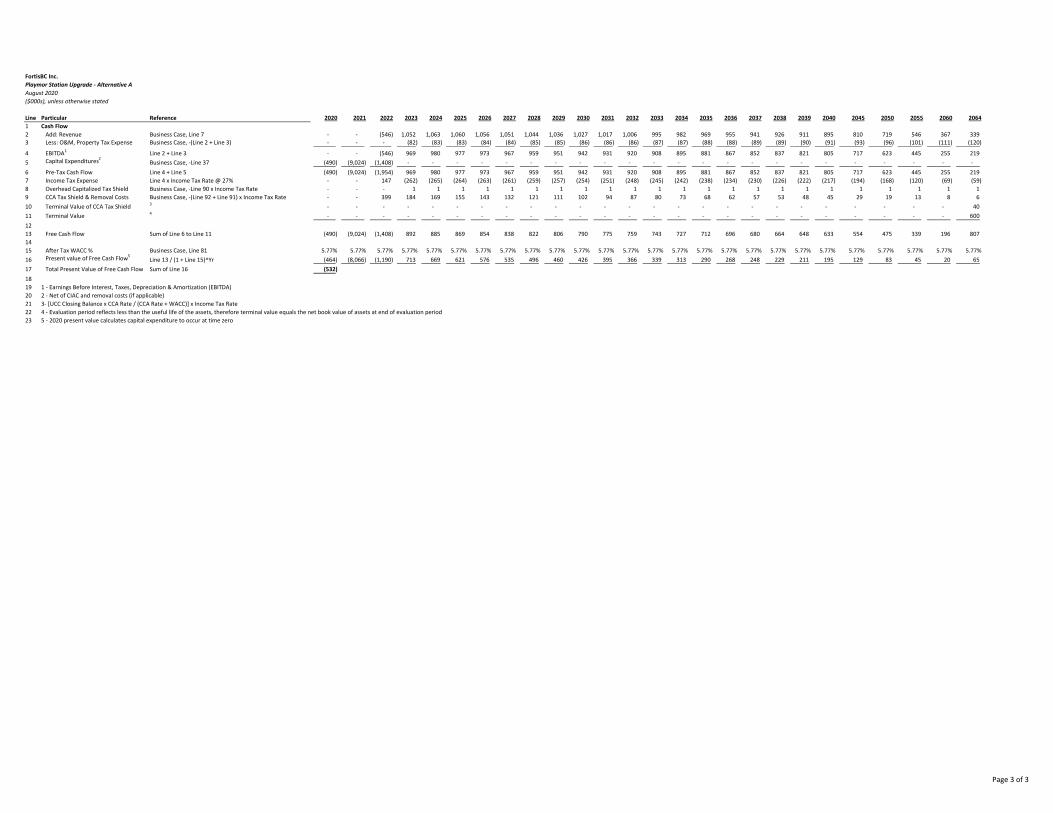
FortisBC Inc.Playmor Station Upgrade ‐ Alternative AAugust 2020($000s), unless otherwise stated
Line Particular Reference 2020 2021 2022 2023 2024 2025 2026 2027 2028 2029 2030 2031 2032 2033 2034 2035 2036 2037 2038 2039 2040 2045 2050 2055 2060 20641 Cash Flow2 Add: Revenue Business Case, Line 7 ‐ ‐ (546) 1,052 1,063 1,060 1,056 1,051 1,044 1,036 1,027 1,017 1,006 995 982 969 955 941 926 911 895 810 719 546 367 339 3 Less: O&M, Property Tax Expense Business Case, ‐(Line 2 + Line 3) ‐ ‐ ‐ (82) (83) (83) (84) (84) (85) (85) (86) (86) (86) (87) (87) (88) (88) (89) (89) (90) (91) (93) (96) (101) (111) (120)
4 EBITDA1 Line 2 + Line 3 ‐ ‐ (546) 969 980 977 973 967 959 951 942 931 920 908 895 881 867 852 837 821 805 717 623 445 255 219 5 Capital Expenditures2 Business Case, ‐Line 37 (490) (9,024) (1,408) ‐ ‐ ‐ ‐ ‐ ‐ ‐ ‐ ‐ ‐ ‐ ‐ ‐ ‐ ‐ ‐ ‐ ‐ ‐ ‐ ‐ ‐ ‐ 6 Pre‐Tax Cash Flow Line 4 + Line 5 (490) (9,024) (1,954) 969 980 977 973 967 959 951 942 931 920 908 895 881 867 852 837 821 805 717 623 445 255 219 7 Income Tax Expense Line 4 x Income Tax Rate @ 27% ‐ ‐ 147 (262) (265) (264) (263) (261) (259) (257) (254) (251) (248) (245) (242) (238) (234) (230) (226) (222) (217) (194) (168) (120) (69) (59) 8 Overhead Capitalized Tax Shield Business Case, ‐Line 90 x Income Tax Rate ‐ ‐ ‐ 1 1 1 1 1 1 1 1 1 1 1 1 1 1 1 1 1 1 1 1 1 1 1 9 CCA Tax Shield & Removal Costs Business Case, ‐(Line 92 + Line 91) x Income Tax Rate ‐ ‐ 399 184 169 155 143 132 121 111 102 94 87 80 73 68 62 57 53 48 45 29 19 13 8 6 10 Terminal Value of CCA Tax Shield 3 ‐ ‐ ‐ ‐ ‐ ‐ ‐ ‐ ‐ ‐ ‐ ‐ ‐ ‐ ‐ ‐ ‐ ‐ ‐ ‐ ‐ ‐ ‐ ‐ ‐ 40 11 Terminal Value 4 ‐ ‐ ‐ ‐ ‐ ‐ ‐ ‐ ‐ ‐ ‐ ‐ ‐ ‐ ‐ ‐ ‐ ‐ ‐ ‐ ‐ ‐ ‐ ‐ ‐ 600 1213 Free Cash Flow Sum of Line 6 to Line 11 (490) (9,024) (1,408) 892 885 869 854 838 822 806 790 775 759 743 727 712 696 680 664 648 633 554 475 339 196 807 1415 After Tax WACC % Business Case, Line 81 5.77% 5.77% 5.77% 5.77% 5.77% 5.77% 5.77% 5.77% 5.77% 5.77% 5.77% 5.77% 5.77% 5.77% 5.77% 5.77% 5.77% 5.77% 5.77% 5.77% 5.77% 5.77% 5.77% 5.77% 5.77% 5.77%16 Present value of Free Cash Flow5
Line 13 / (1 + Line 15)^Yr (464) (8,066) (1,190) 713 669 621 576 535 496 460 426 395 366 339 313 290 268 248 229 211 195 129 83 45 20 65 17 Total Present Value of Free Cash Flow Sum of Line 16 (532) 1819 1 ‐ Earnings Before Interest, Taxes, Depreciation & Amortization (EBITDA)20 2 ‐ Net of CIAC and removal costs (if applicable)21 3‐ [UCC Closing Balance x CCA Rate / (CCA Rate + WACC)] x Income Tax Rate22 4 ‐ Evaluation period reflects less than the useful life of the assets, therefore terminal value equals the net book value of assets at end of evaluation period23 5 ‐ 2020 present value calculates capital expenditure to occur at time zero
Page 3 of 3

Appendix 3 ALTERNATIVE B REVENUE REQUIREMENTS ANALYSIS
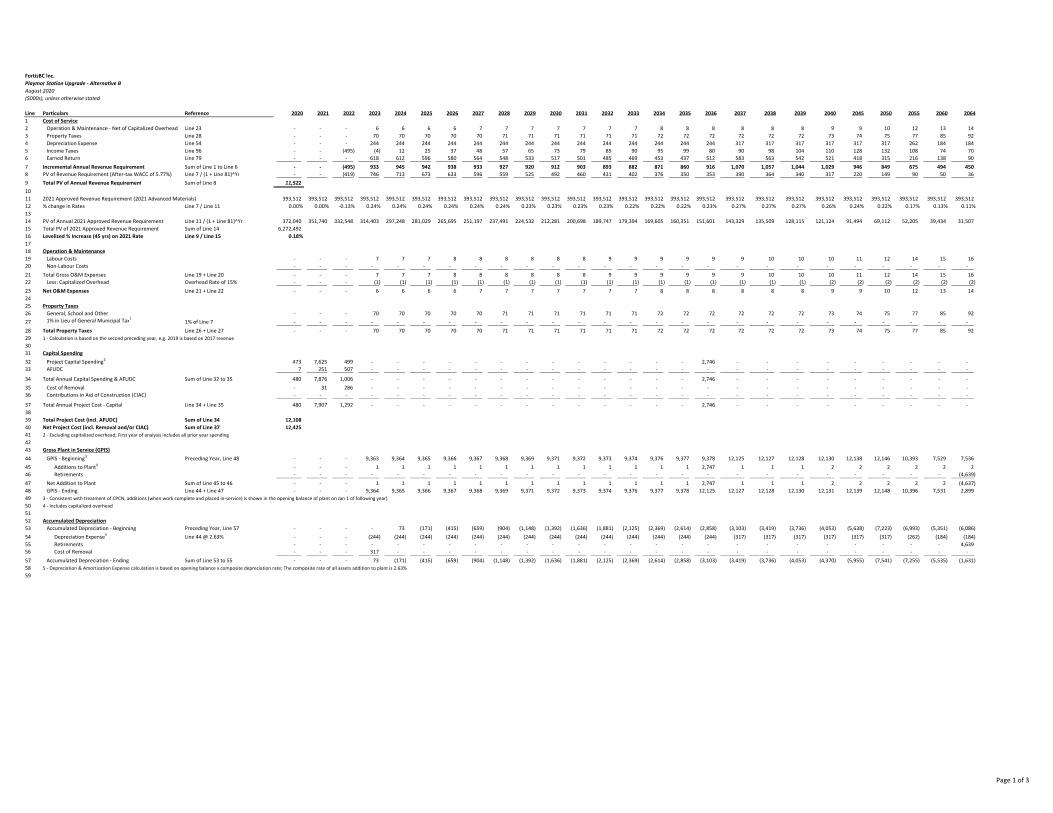
FortisBC Inc.Playmor Station Upgrade ‐ Alternative BAugust 2020($000s), unless otherwise stated
Line Particulars Reference 2020 2021 2022 2023 2024 2025 2026 2027 2028 2029 2030 2031 2032 2033 2034 2035 2036 2037 2038 2039 2040 2045 2050 2055 2060 20641 Cost of Service2 Operation & Maintenance ‐ Net of Capitalized Overhead Line 23 ‐ ‐ ‐ 6 6 6 6 7 7 7 7 7 7 7 8 8 8 8 8 8 9 9 10 12 13 14 3 Property Taxes Line 28 ‐ ‐ ‐ 70 70 70 70 70 71 71 71 71 71 71 72 72 72 72 72 72 73 74 75 77 85 92 4 Depreciation Expense Line 54 ‐ ‐ ‐ 244 244 244 244 244 244 244 244 244 244 244 244 244 244 317 317 317 317 317 317 262 184 184 5 Income Taxes Line 96 ‐ ‐ (495) (4) 12 25 37 48 57 65 73 79 85 90 95 99 80 90 98 104 110 128 132 108 74 70 6 Earned Return Line 79 ‐ ‐ ‐ 618 612 596 580 564 548 533 517 501 485 469 453 437 512 583 563 542 521 418 315 216 138 90 7 Incremental Annual Revenue Requirement Sum of Line 1 to Line 6 ‐ ‐ (495) 933 945 942 938 933 927 920 912 903 893 882 871 860 916 1,070 1,057 1,044 1,029 946 849 675 494 450 8 PV of Revenue Requirement (After‐tax WACC of 5.77%) Line 7 / (1 + Line 81)^Yr ‐ ‐ (419) 746 713 673 633 596 559 525 492 460 431 402 376 350 353 390 364 340 317 220 149 90 50 36 9 Total PV of Annual Revenue Requirement Sum of Line 8 11,522 1011 2021 Approved Revenue Requirement (2021 Advanced Materials) 393,512 393,512 393,512 393,512 393,512 393,512 393,512 393,512 393,512 393,512 393,512 393,512 393,512 393,512 393,512 393,512 393,512 393,512 393,512 393,512 393,512 393,512 393,512 393,512 393,512 393,512 12 % change in Rates Line 7 / Line 11 0.00% 0.00% ‐0.13% 0.24% 0.24% 0.24% 0.24% 0.24% 0.24% 0.23% 0.23% 0.23% 0.23% 0.22% 0.22% 0.22% 0.23% 0.27% 0.27% 0.27% 0.26% 0.24% 0.22% 0.17% 0.13% 0.11%1314 PV of Annual 2021 Approved Revenue Requirement Line 11 / (1 + Line 81)^Yr 372,040 351,740 332,548 314,403 297,248 281,029 265,695 251,197 237,491 224,532 212,281 200,698 189,747 179,394 169,605 160,351 151,601 143,329 135,509 128,115 121,124 91,494 69,112 52,205 39,434 31,507 15 Total PV of 2021 Approved Revenue Requirement Sum of Line 14 6,272,492 16 Levelized % Increase (45 yrs) on 2021 Rate Line 9 / Line 15 0.18%1718 Operation & Maintenance19 Labour Costs ‐ ‐ ‐ 7 7 7 8 8 8 8 8 8 9 9 9 9 9 9 10 10 10 11 12 14 15 16 20 Non‐Labour Costs ‐ ‐ ‐ ‐ ‐ ‐ ‐ ‐ ‐ ‐ ‐ ‐ ‐ ‐ ‐ ‐ ‐ ‐ ‐ ‐ ‐ ‐ ‐ ‐ ‐ ‐ 21 Total Gross O&M Expenses Line 19 + Line 20 ‐ ‐ ‐ 7 7 7 8 8 8 8 8 8 9 9 9 9 9 9 10 10 10 11 12 14 15 16 22 Less: Capitalized Overhead Overhead Rate of 15% ‐ ‐ ‐ (1) (1) (1) (1) (1) (1) (1) (1) (1) (1) (1) (1) (1) (1) (1) (1) (1) (2) (2) (2) (2) (2) (2) 23 Net O&M Expenses Line 21 + Line 22 ‐ ‐ ‐ 6 6 6 6 7 7 7 7 7 7 7 8 8 8 8 8 8 9 9 10 12 13 14 2425 Property Taxes26 General, School and Other ‐ ‐ ‐ 70 70 70 70 70 71 71 71 71 71 71 72 72 72 72 72 72 73 74 75 77 85 92 27 1% in Lieu of General Municipal Tax1 1% of Line 7 ‐ ‐ ‐ ‐ ‐ ‐ ‐ ‐ ‐ ‐ ‐ ‐ ‐ ‐ ‐ ‐ ‐ ‐ ‐ ‐ ‐ ‐ ‐ ‐ ‐ ‐ 28 Total Property Taxes Line 26 + Line 27 ‐ ‐ ‐ 70 70 70 70 70 71 71 71 71 71 71 72 72 72 72 72 72 73 74 75 77 85 92 29 1 ‐ Calculation is based on the second preceding year, e.g. 2019 is based on 2017 revenue3031 Capital Spending32 Project Capital Spending2 473 7,625 499 ‐ ‐ ‐ ‐ ‐ ‐ ‐ ‐ ‐ ‐ ‐ ‐ ‐ 2,746 ‐ ‐ ‐ ‐ ‐ ‐ ‐ ‐ ‐ 33 AFUDC 7 251 507 ‐ ‐ ‐ ‐ ‐ ‐ ‐ ‐ ‐ ‐ ‐ ‐ ‐ ‐ ‐ ‐ ‐ ‐ ‐ ‐ ‐ ‐ ‐
34 Total Annual Capital Spending & AFUDC Sum of Line 32 to 35 480 7,876 1,006 ‐ ‐ ‐ ‐ ‐ ‐ ‐ ‐ ‐ ‐ ‐ ‐ ‐ 2,746 ‐ ‐ ‐ ‐ ‐ ‐ ‐ ‐ ‐ 35 Cost of Removal ‐ 31 286 ‐ ‐ ‐ ‐ ‐ ‐ ‐ ‐ ‐ ‐ ‐ ‐ ‐ ‐ ‐ ‐ ‐ ‐ ‐ ‐ ‐ ‐ ‐ 36 Contributions in Aid of Construction (CIAC) ‐ ‐ ‐ ‐ ‐ ‐ ‐ ‐ ‐ ‐ ‐ ‐ ‐ ‐ ‐ ‐ ‐ ‐ ‐ ‐ ‐ ‐ ‐ ‐ ‐ ‐
37 Total Annual Project Cost ‐ Capital Line 34 + Line 35 480 7,907 1,292 ‐ ‐ ‐ ‐ ‐ ‐ ‐ ‐ ‐ ‐ ‐ ‐ ‐ 2,746 ‐ ‐ ‐ ‐ ‐ ‐ ‐ ‐ ‐ 3839 Total Project Cost (incl. AFUDC) Sum of Line 34 12,108 40 Net Project Cost (incl. Removal and/or CIAC) Sum of Line 37 12,425 41 2 ‐ Excluding capitalized overhead; First year of analysis includes all prior year spending4243 Gross Plant in Service (GPIS)44 GPIS ‐ Beginning3 Preceding Year, Line 48 ‐ ‐ ‐ 9,363 9,364 9,365 9,366 9,367 9,368 9,369 9,371 9,372 9,373 9,374 9,376 9,377 9,378 12,125 12,127 12,128 12,130 12,138 12,146 10,393 7,529 7,536 45 Additions to Plant4 ‐ ‐ ‐ 1 1 1 1 1 1 1 1 1 1 1 1 1 2,747 1 1 1 2 2 2 2 2 2 46 Retirements ‐ ‐ ‐ ‐ ‐ ‐ ‐ ‐ ‐ ‐ ‐ ‐ ‐ ‐ ‐ ‐ ‐ ‐ ‐ ‐ ‐ ‐ ‐ ‐ ‐ (4,639) 47 Net Addition to Plant Sum of Line 45 to 46 ‐ ‐ ‐ 1 1 1 1 1 1 1 1 1 1 1 1 1 2,747 1 1 1 2 2 2 2 2 (4,637) 48 GPIS ‐ Ending Line 44 + Line 47 ‐ ‐ ‐ 9,364 9,365 9,366 9,367 9,368 9,369 9,371 9,372 9,373 9,374 9,376 9,377 9,378 12,125 12,127 12,128 12,130 12,131 12,139 12,148 10,396 7,531 2,899 49 3 ‐ Consistent with treatment of CPCN, additions (when work complete and placed in‐service) is shown in the opening balance of plant on Jan 1 of following year)50 4 ‐ Includes capitalized overhead5152 Accumulated Depreciation53 Accumulated Depreciation ‐ Beginning Preceding Year, Line 57 ‐ ‐ ‐ ‐ 73 (171) (415) (659) (904) (1,148) (1,392) (1,636) (1,881) (2,125) (2,369) (2,614) (2,858) (3,103) (3,419) (3,736) (4,053) (5,638) (7,223) (6,993) (5,351) (6,086) 54 Depreciation Expense5 Line 44 @ 2.63% ‐ ‐ ‐ (244) (244) (244) (244) (244) (244) (244) (244) (244) (244) (244) (244) (244) (244) (317) (317) (317) (317) (317) (317) (262) (184) (184) 55 Retirements ‐ ‐ ‐ ‐ ‐ ‐ ‐ ‐ ‐ ‐ ‐ ‐ ‐ ‐ ‐ ‐ ‐ ‐ ‐ ‐ ‐ ‐ ‐ ‐ ‐ 4,639 56 Cost of Removal ‐ ‐ ‐ 317 ‐ ‐ ‐ ‐ ‐ ‐ ‐ ‐ ‐ ‐ ‐ ‐ ‐ ‐ ‐ ‐ ‐ ‐ ‐ ‐ ‐ ‐ 57 Accumulated Depreciation ‐ Ending Sum of Line 53 to 55 ‐ ‐ ‐ 73 (171) (415) (659) (904) (1,148) (1,392) (1,636) (1,881) (2,125) (2,369) (2,614) (2,858) (3,103) (3,419) (3,736) (4,053) (4,370) (5,955) (7,541) (7,255) (5,535) (1,631) 58 5 ‐ Depreciation & Amortization Expense calculation is based on opening balance x composite depreciation rate; The composite rate of all assets addition to plant is 2.63%59
Page 1 of 3

FortisBC Inc.Playmor Station Upgrade ‐ Alternative BAugust 2020($000s), unless otherwise stated
Line Particulars Reference 2020 2021 2022 2023 2024 2025 2026 2027 2028 2029 2030 2031 2032 2033 2034 2035 2036 2037 2038 2039 2040 2045 2050 2055 2060 206460 Rate Base and Earned Return61 Gross Plant in Service ‐ Beginning Line 44 ‐ ‐ ‐ 9,363 9,364 9,365 9,366 9,367 9,368 9,369 9,371 9,372 9,373 9,374 9,376 9,377 9,378 12,125 12,127 12,128 12,130 12,138 12,146 10,393 7,529 7,536 62 Gross Plant in Service ‐ Ending Line 48 ‐ ‐ ‐ 9,364 9,365 9,366 9,367 9,368 9,369 9,371 9,372 9,373 9,374 9,376 9,377 9,378 12,125 12,127 12,128 12,130 12,131 12,139 12,148 10,396 7,531 2,899 6364 Accumulated Depreciation ‐ Beginning Line 53 ‐ ‐ ‐ ‐ 73 (171) (415) (659) (904) (1,148) (1,392) (1,636) (1,881) (2,125) (2,369) (2,614) (2,858) (3,103) (3,419) (3,736) (4,053) (5,638) (7,223) (6,993) (5,351) (6,086) 65 Accumulated Depreciation ‐ Ending Line 57 ‐ ‐ ‐ 73 (171) (415) (659) (904) (1,148) (1,392) (1,636) (1,881) (2,125) (2,369) (2,614) (2,858) (3,103) (3,419) (3,736) (4,053) (4,370) (5,955) (7,541) (7,255) (5,535) (1,631) 6667 CIAC ‐ Beginning Line 59 ‐ ‐ ‐ ‐ ‐ ‐ ‐ ‐ ‐ ‐ ‐ ‐ ‐ ‐ ‐ ‐ ‐ ‐ ‐ ‐ ‐ ‐ ‐ ‐ ‐ ‐ 68 CIAC ‐ Ending Line 59 ‐ ‐ ‐ ‐ ‐ ‐ ‐ ‐ ‐ ‐ ‐ ‐ ‐ ‐ ‐ ‐ ‐ ‐ ‐ ‐ ‐ ‐ ‐ ‐ ‐ ‐ 6970 Accumulated Amortization of CIAC ‐ Beginning Line 59 ‐ ‐ ‐ ‐ ‐ ‐ ‐ ‐ ‐ ‐ ‐ ‐ ‐ ‐ ‐ ‐ ‐ ‐ ‐ ‐ ‐ ‐ ‐ ‐ ‐ ‐ 71 Accumulated Amortization of CIAC ‐ Ending Line 59 ‐ ‐ ‐ ‐ ‐ ‐ ‐ ‐ ‐ ‐ ‐ ‐ ‐ ‐ ‐ ‐ ‐ ‐ ‐ ‐ ‐ ‐ ‐ ‐ ‐ ‐ 7273 Net Plant in Service, Mid‐Year (Sum of Lines 61 to Line 71 ) / 2 ‐ ‐ ‐ 9,400 9,315 9,072 8,829 8,586 8,343 8,100 7,857 7,614 7,371 7,128 6,885 6,642 7,772 8,865 8,550 8,235 7,919 6,342 4,765 3,271 2,087 1,359 74 Cash Working Capital Line 48 x FBC CWC/Closing GPIS % ‐ ‐ ‐ 28 28 28 28 28 28 28 28 28 28 28 28 28 36 36 36 36 36 36 36 31 22 9 75 Total Rate Base Sum of Line 73 to 74 ‐ ‐ ‐ 9,427 9,343 9,100 8,857 8,614 8,371 8,128 7,885 7,642 7,399 7,156 6,912 6,669 7,807 8,901 8,586 8,270 7,955 6,378 4,801 3,301 2,109 1,367 7677 Equity Return Line 75 x ROE x Equity % ‐ ‐ ‐ 345 342 333 324 315 306 297 289 280 271 262 253 244 286 326 314 303 291 233 176 121 77 50 78 Debt Component 7 ‐ ‐ ‐ 273 270 263 256 249 242 235 228 221 214 207 200 193 226 257 248 239 230 184 139 95 61 40 79 Total Earned Return Line 77 + Line 78 ‐ ‐ ‐ 618 612 596 580 564 548 533 517 501 485 469 453 437 512 583 563 542 521 418 315 216 138 90 80 Return on Rate Base % Line 79 / Line 75 0.00% 0.00% 0.00% 6.55% 6.55% 6.55% 6.55% 6.55% 6.55% 6.55% 6.55% 6.55% 6.55% 6.55% 6.55% 6.55% 6.55% 6.55% 6.55% 6.55% 6.55% 6.55% 6.55% 6.55% 6.55% 6.55%81 After‐ Tax Weighted Average Cost of Capital (WACC) 8 5.77% 5.77% 5.77% 5.77% 5.77% 5.77% 5.77% 5.77% 5.77% 5.77% 5.77% 5.77% 5.77% 5.77% 5.77% 5.77% 5.77% 5.77% 5.77% 5.77% 5.77% 5.77% 5.77% 5.77% 5.77% 5.77%82 6 ‐ (Line 47 + Line 54 + Line 59) x [(Days In‐service/365)‐1/2]83 7 ‐ Line 75 x (LTD Rate x LTD% + STD Rate x STD %)84 8 ‐ ROE Rate x Equity Component + [(STD Rate x STD Portion) + (LTD Rate x LTD Portion)] x (1‐ Income Tax Rate)]8586 Income Tax Expense87 Earned Return Line 79 ‐ ‐ ‐ 618 612 596 580 564 548 533 517 501 485 469 453 437 512 583 563 542 521 418 315 216 138 90 88 Deduct: Interest on debt Line 78 ‐ ‐ ‐ (273) (270) (263) (256) (249) (242) (235) (228) (221) (214) (207) (200) (193) (226) (257) (248) (239) (230) (184) (139) (95) (61) (40) 89 Add: Depreciation Expense Line 54 ‐ ‐ ‐ 244 244 244 244 244 244 244 244 244 244 244 244 244 244 317 317 317 317 317 317 262 184 184 90 Deduct: Overhead Capitalized Expenses for Tax Purposes ‐ ‐ ‐ (1) (1) (1) (1) (1) (1) (1) (1) (1) (1) (1) (1) (1) (1) (1) (1) (1) (2) (2) (2) (2) (2) (2) 91 Deduct: Removal Costs Line 35 ‐ ‐ (317) ‐ ‐ ‐ ‐ ‐ ‐ ‐ ‐ ‐ ‐ ‐ ‐ ‐ ‐ ‐ ‐ ‐ ‐ ‐ ‐ ‐ ‐ ‐ 92 Deduct: Capital Cost Allowance Line 104 ‐ ‐ (1,023) (600) (552) (508) (467) (430) (395) (364) (335) (308) (283) (261) (240) (221) (313) (398) (366) (336) (310) (204) (134) (89) (58) (42) 93 Taxable Income After Tax Sum of Line 87 to 92 ‐ ‐ (1,339) (12) 33 68 100 129 154 177 197 215 231 244 256 267 216 244 264 282 297 345 357 293 201 190 94 Income Tax Rate 27% 27% 27% 27% 27% 27% 27% 27% 27% 27% 27% 27% 27% 27% 27% 27% 27% 27% 27% 27% 27% 27% 27% 27% 27% 27%9596 Total Income Tax Expense Line 93 / (1 ‐ Line 94) x Line 94 ‐ ‐ (495) (4) 12 25 37 48 57 65 73 79 85 90 95 99 80 90 98 104 110 128 132 108 74 70 9798 Capital Cost Allowance99 Opening Balance Proceeding Year, Line 105 ‐ ‐ ‐ 7,574 6,974 6,422 5,915 5,448 5,018 4,622 4,259 3,924 3,616 3,333 3,072 2,833 2,612 5,045 4,647 4,282 3,945 2,626 1,757 1,184 806 599 100 Additions to Plant Line 34 ‐ ‐ 9,363 ‐ ‐ ‐ ‐ ‐ ‐ ‐ ‐ ‐ ‐ ‐ ‐ ‐ 2,746 ‐ ‐ ‐ ‐ ‐ ‐ ‐ ‐ ‐ 101 Less: AFUDC Line 33 ‐ ‐ (766) ‐ ‐ ‐ ‐ ‐ ‐ ‐ ‐ ‐ ‐ ‐ ‐ ‐ ‐ ‐ ‐ ‐ ‐ ‐ ‐ ‐ ‐ ‐ 102 Less: CIAC Line 36 ‐ ‐ ‐ ‐ ‐ ‐ ‐ ‐ ‐ ‐ ‐ ‐ ‐ ‐ ‐ ‐ ‐ ‐ ‐ ‐ ‐ ‐ ‐ ‐ ‐ ‐ 103 Net Addition for CCA Sum of Line 100 through 102 ‐ ‐ 8,597 ‐ ‐ ‐ ‐ ‐ ‐ ‐ ‐ ‐ ‐ ‐ ‐ ‐ 2,746 ‐ ‐ ‐ ‐ ‐ ‐ ‐ ‐ ‐ 104 CCA [Line 99 + (Line 103/2)] x CCA Rate ‐ ‐ (1,023) (600) (552) (508) (467) (430) (395) (364) (335) (308) (283) (261) (240) (221) (313) (398) (366) (336) (310) (204) (134) (89) (58) (42) 105 Closing Balance Line 99 + Line 103 + Line 104 ‐ ‐ 7,574 6,974 6,422 5,915 5,448 5,018 4,622 4,259 3,924 3,616 3,333 3,072 2,833 2,612 5,045 4,647 4,282 3,945 3,636 2,422 1,622 1,095 747 557
Page 2 of 3

FortisBC Inc.Playmor Station Upgrade ‐ Alternative BAugust 2020($000s), unless otherwise stated
Line Particular Reference 2020 2021 2022 2023 2024 2025 2026 2027 2028 2029 2030 2031 2032 2033 2034 2035 2036 2037 2038 2039 2040 2045 2050 2055 2060 20641 Cash Flow2 Add: Revenue Business Case, Line 7 ‐ ‐ (495) 933 945 942 938 933 927 920 912 903 893 882 871 860 916 1,070 1,057 1,044 1,029 946 849 675 494 450 3 Operation & Maintenance ‐ Net of CapitBusiness Case, ‐(Line 2 + Line 3) ‐ ‐ ‐ (76) (76) (76) (77) (77) (77) (78) (78) (78) (79) (79) (79) (80) (80) (80) (81) (81) (81) (83) (85) (88) (97) (106)
4 EBITDA1 Line 2 + Line 3 ‐ ‐ (495) 857 868 866 861 856 850 842 834 824 814 804 792 780 836 990 977 963 948 862 764 587 397 344 5 Capital Expenditures2 Business Case, ‐Line 37 (480) (7,907) (1,292) ‐ ‐ ‐ ‐ ‐ ‐ ‐ ‐ ‐ ‐ ‐ ‐ ‐ (2,746) ‐ ‐ ‐ ‐ ‐ ‐ ‐ ‐ ‐ 6 Pre‐Tax Cash Flow Line 4 + Line 5 (480) (7,907) (1,788) 857 868 866 861 856 850 842 834 824 814 804 792 780 (1,910) 990 977 963 948 862 764 587 397 344 7 Income Tax Expense Line 4 x Income Tax Rate @ 27% ‐ ‐ 134 (231) (234) (234) (233) (231) (229) (227) (225) (223) (220) (217) (214) (211) (226) (267) (264) (260) (256) (233) (206) (158) (107) (93) 8 Overhead Capitalized Tax Shield Business Case, ‐Line 90 x Income Tax Rate ‐ ‐ ‐ 0 0 0 0 0 0 0 0 0 0 0 0 0 0 0 0 0 0 0 0 1 1 1 9 CCA Tax Shield & Removal Costs Business Case, ‐(Line 92 + Line 91) x Income Tax Rate ‐ ‐ 362 162 149 137 126 116 107 98 90 83 76 70 65 60 84 107 99 91 84 55 36 24 16 11 10 Terminal Value of CCA Tax Shield 3 ‐ ‐ ‐ ‐ ‐ ‐ ‐ ‐ ‐ ‐ ‐ ‐ ‐ ‐ ‐ ‐ ‐ ‐ ‐ ‐ ‐ ‐ ‐ ‐ ‐ 75 11 Terminal Value 4 ‐ ‐ ‐ ‐ ‐ ‐ ‐ ‐ ‐ ‐ ‐ ‐ ‐ ‐ ‐ ‐ ‐ ‐ ‐ ‐ ‐ ‐ ‐ ‐ ‐ 1,268 1213 Free Cash Flow Sum of Line 6 to Line 11 (480) (7,907) (1,292) 788 783 769 755 741 727 713 699 685 671 657 643 629 (2,051) 830 812 794 776 685 594 453 306 1,607 1415 After Tax WACC % Business Case, Line 81 5.77% 5.77% 5.77% 5.77% 5.77% 5.77% 5.77% 5.77% 5.77% 5.77% 5.77% 5.77% 5.77% 5.77% 5.77% 5.77% 5.77% 5.77% 5.77% 5.77% 5.77% 5.77% 5.77% 5.77% 5.77% 5.77%16 Present value of Free Cash Flow5
Line 13 / (1 + Line 15)^Yr (454) (7,068) (1,092) 630 592 549 510 473 439 407 377 350 324 300 277 256 (790) 302 280 259 239 159 104 60 31 129 17 Total Present Value of Free Cash Flow Sum of Line 16 (464) 1819 1 ‐ Earnings Before Interest, Taxes, Depreciation & Amortization (EBITDA)20 2 ‐ Net of CIAC and removal costs (if applicable)21 3‐ [UCC Closing Balance x CCA Rate / (CCA Rate + WACC)] x Income Tax Rate22 4 ‐ Evaluation period reflects less than the useful life of the assets, therefore terminal value equals the net book value of assets at end of evaluation period23 5 ‐ 2020 present value calculates capital expenditure to occur at time zero
Page 3 of 3

Appendix C PRIOR YEAR DIRECTIVES

APPENDIX C1 PRIOR YEAR DIRECTIVES
PAGE 1
No. Decision Page No.
Directive No. Reference Description / Details Status
Section in this Application
G-169-14 – FBC ADVANCED METERING INFRASTRUCTURE (AMI) ENABLED BILLING OPTIONS FOR CUSTOMERS 1. 6 4 Incremental
Working Capital Benefits
FBC must flow through any incremental working capital benefits to customers as part of the new [PBR] flow through deferral account, approved in Order G-163-14, or another appropriate flow through account.
Completed. Section 14 and Appendix C2
2. n/a 5 Incremental Costs and Savings
FBC must report these incremental costs and savings in each of the annual reviews during the Performance Based Ratemaking term.
Completed Appendix C2
G-107-15 – FBC ANNUAL REVIEW FOR 2015 RATES 3. 15 n/a Advanced
Metering Infrastructure (AMI) Theft Reduction
The Commission Panel directs FBC to include, in its next and subsequent annual PBR reports, the impact of AMI on losses through theft deterrence. This directive will improve regulatory efficiency in the review of FBC’s proposed actions (and FBC’s incentives to undertake these actions while under PBR) related to the reduction of theft related costs. The information to be submitted should include: (i) a comparison of the projected GWh reduction for the test year and proceeding years to the estimated GWh theft reduction assumed in the AMI decision for those years; and (ii) a description of FBC’s operational activities and costs incurred in reducing electricity theft (for example, related to FBC’s Revenue Protection Program) and the regulatory treatment of these costs.
Completed Appendix C2
G-8-17 – FBC ANNUAL REVIEW FOR 2017 RATES 4. 15 5 Ruckles
Substation Rebuild Project
The Panel directs FBC to report in each of its annual review applications during the remainder of the PBR term the following information on the Ruckles Substation Rebuild project:
The status of the Ruckles project, including a comparison of the project timeline provided in the current Application to the updated project timeline, as at the time of filing each annual review application.
Updated cost estimates and scope descriptions compared to the cost estimates and scope descriptions provided in the current Application, including explanations for any variances/changes to the cost estimates or project scope.
Actual costs incurred to date on the Ruckles project as at the time of filing each annual review application.
The final actual project cost, including a description of the scope of work completed relative to the cost estimate and scope description provided in the Application, with explanations for any variances.
Completed Appendix C3
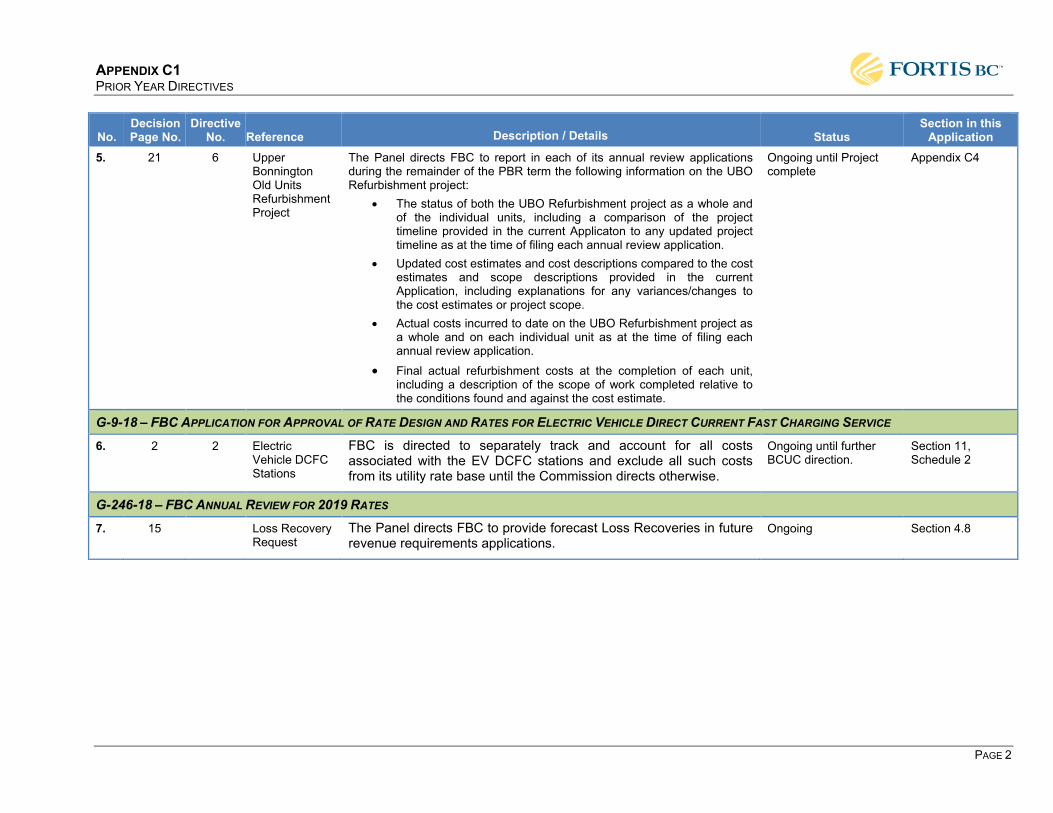
APPENDIX C1 PRIOR YEAR DIRECTIVES
PAGE 2
No. Decision Page No.
Directive No. Reference Description / Details Status
Section in this Application
5. 21 6 Upper Bonnington Old Units Refurbishment Project
The Panel directs FBC to report in each of its annual review applications during the remainder of the PBR term the following information on the UBO Refurbishment project:
The status of both the UBO Refurbishment project as a whole and of the individual units, including a comparison of the project timeline provided in the current Applicaton to any updated project timeline as at the time of filing each annual review application.
Updated cost estimates and cost descriptions compared to the cost estimates and scope descriptions provided in the current Application, including explanations for any variances/changes to the cost estimates or project scope.
Actual costs incurred to date on the UBO Refurbishment project as a whole and on each individual unit as at the time of filing each annual review application.
Final actual refurbishment costs at the completion of each unit, including a description of the scope of work completed relative to the conditions found and against the cost estimate.
Ongoing until Project complete
Appendix C4
G-9-18 – FBC APPLICATION FOR APPROVAL OF RATE DESIGN AND RATES FOR ELECTRIC VEHICLE DIRECT CURRENT FAST CHARGING SERVICE 6. 2 2 Electric
Vehicle DCFC Stations
FBC is directed to separately track and account for all costs associated with the EV DCFC stations and exclude all such costs from its utility rate base until the Commission directs otherwise.
Ongoing until further BCUC direction.
Section 11, Schedule 2
G-246-18 – FBC ANNUAL REVIEW FOR 2019 RATES 7. 15 Loss Recovery
Request The Panel directs FBC to provide forecast Loss Recoveries in future revenue requirements applications.
Ongoing Section 4.8

APPENDIX C1 PRIOR YEAR DIRECTIVES
PAGE 3
No. Decision Page No.
Directive No. Reference Description / Details Status
Section in this Application
G-165-20 – FEI MULTI-YEAR RATE PLAN FOR 2020 THROUGH 2024 8. 48 11 Setting the I-
Factor Based on these findings the Panel determines that the I‐factor formula will be as follows:
I = X 𝑥 𝐴𝑊𝐸:𝐵𝐶𝑡−1 + Y 𝑥 𝐶𝑃𝐼:𝐵𝐶𝑡−1 Where:
I = Inflation Factor AWE:BC = labour index CPI:BC = non ‐ labour index t ‐ 1 = most recent July to June value X = the previous year’s labour ratio; and Y = the previous year’s non‐labour ratio.
FortisBC is directed to provide the results of the completed formula based on 2019 results for FEI and FBC to set the base for 2020 as part of its compliance filing. Thereafter, the formula will be informed by the previous year’s results and reviewed as part of the Annual Review Process.
Completed Section 2.2
9. 75 24 General Flow-through Deferral Account
The Panel directs [FBC] to provide a detailed analysis of the individual forecast variances recorded in the Flow-through deferral account in each Annual Review.
Ongoing during the MRP term
n/a for 2020 and 2021 as no amounts are forecast
10. 87 32 Efficiency Carry-Over Mechanism
Therefore, the Panel determines the following process for the handling of an ECM application:
1. An ECM can be applied for at any time in the last three years of the MRPs, either in advance or following the action or initiative being undertaken.
2. For proposed activities where identifiable savings are expected to extend beyond the term of the MRP, FortisBC is to file an ECM proposal describing the initiative, its timing, costs and benefits and savings.
3. Parties will have the opportunity to review and comment on the proposal and the BCUC will determine whether to approve the ECM proposal (an Approved ECM Initiative).
FortisBC must submit details of continued savings annually under an Approved ECM Initiative as part of the Annual Review process. The net savings will be shared equally between ratepayers and the Utilities will carry forward past the end of the MRP for a maximum period of three years.
No approved ECM initiatives to report on
n/a

APPENDIX C1 PRIOR YEAR DIRECTIVES
PAGE 4
No. Decision Page No.
Directive No. Reference Description / Details Status
Section in this Application
11. 99 35 SAIDI and SAIFI major events
The Panel also directs FBC to include a discussion of major events relevant to the SAIDI and SAIFI results in future Annual Review materials.
Ongoing during the MRP term
Section 13
12. 99-100 SQI Informational Indicators
In addition to the SQIs, the Panel approves the following informational indicators for the Utilities:
Customer Satisfaction Index (measures overall customer satisfaction) – FEI and FBC.
Average Speed of Answer (average number of seconds to answer emergency and non-emergency calls) – FEI and FBC.
Generator Forced Outage Rate (percent of time a generating unit is removed from service due to component failure or other events) – FBC only.
Interconnection Utilization (percent of time that an interconnection point was available and providing electrical service to wholesale customers) – FBC only.
The Utilities are directed to report on these informational indicators along with the SQIs as part of the Annual Review process.
Ongoing during the MRP term
Section 13
13. 118 42 System Operations, Integrity and Security Expenditures
The Panel directs FBC to provide the following information related to System Operations, Integrity and Security expenditures in its future revenue requirements applications over the term of the Proposed MRPs:
1. A breakdown and explanation of both annual and cumulative variances between forecast/actual and formula O&M related to System Operations, Integrity and Security expenditures, which quantify the variances attributable to the following areas:
Tree management; Generation dam safety; Network operations apprentice program; Cyber security; Data analytics; and Any other significant factors or miscellaneous items.
2. A description of how FBC is prioritizing its System Operations, Integrity and Security expenditures.
Ongoing during the MRP term
Section 6.2.1
14. 131 49 Forecast Capital Expenditures
The Panel directs FortisBC to file an updated forecast of the 2023 to 2024 capital expenditures in the 2023 Annual Review.
Will be filed in FBC’s Annual Review for 2023 Rates
n/a

APPENDIX C2 AMI PROJECT NET O&M COSTS AND SAVINGS
PAGE 1
1. INTRODUCTION 1
In this appendix FBC provides the final 2018 and 2019 results for Advanced Metering 2 Infrastructure (AMI) related impacts on system losses, net O&M costs and savings, and cash 3 working capital. 4
2. AMI IMPACT ON DETERRING THEFT OF POWER 5
FBC’s implementation of AMI (approved by Order C-7-13) was expected to positively impact 6 losses (unaccounted-for energy) by deterring theft of power, mainly from indoor marijuana grow 7 sites. In Order G-107-15 in FBC’s Annual Review for 2015 Rates, FBC was directed to include 8 in its next and subsequent Annual Review materials the impact of AMI on theft deterrence, 9 including: 10
(i) a comparison of the projected GWh reduction for the test year and proceeding 11 years to the estimated GWh theft reduction assumed in the AMI decision for those 12 years; and 13
(ii) a description of FBC’s operational activities and costs incurred in reducing 14 electricity theft (for example, related to FBC’s Revenue Protection Program) and 15 the regulatory treatment of these costs.1 16
17 FBC estimates that the implementation of AMI had a positive impact on losses (unaccounted-for 18 energy) by deterring theft of power, mainly from indoor marijuana grow sites. Beginning with the 19 2016 year, FBC included in its forecast of system losses an adjustment based on estimates 20 developed in the AMI Project CPCN application and subsequently adjusted pursuant to the 21 BCUC’s decision on the AMI Project, Order C-7-13. 22
Operationally, FBC has implemented its energy balancing program, facilitated by AMI, and is also 23 leveraging the tamper detection functionality of the AMI system for theft identification. In 2019 24 FBC carried out a study of system losses, employing newly-available AMI data. The results of 25 that study2 incorporate the impact of those operational improvements. Therefore, for 2020 and 26 future estimates of system losses (described in Section 3.4.7 of the Application), FBC will no 27 longer make adjustments to reflect AMI impacts. 28
The O&M expenditures incurred in reducing electricity theft that were incremental to those 29 included in the PBR Base O&M related primarily to the addition of a Revenue Protection Analyst 30 for managing the development and operation of the AMI-enabled energy balancing program, as 31 well as the necessary field resources for the periodic deployment and relocation of the feeder 32
1 Order G-107-15, page 15. 2 The 2019 Losses Study was filed as Appendix B3 of the FEI-FBC MRP Application.

APPENDIX C2 AMI PROJECT NET O&M COSTS AND SAVINGS
PAGE 2
metering devices as required. The incremental costs to manage the AMI-enabled energy 1 balancing program included 2019 O&M expenditures of $0.206 million. 2
During the PBR term, the AMI costs and savings, including those associated with FBC’s Revenue 3 Protection Program, that were incremental to the Revenue Protection program costs included in 4 formula O&M were forecast and tracked outside of the PBR formula, as set out in the following 5 section. 6
3. AMI IMPACT ON O&M EXPENSE 7
Incremental O&M costs related to the implementation of the AMI project are being offset by post-8 implementation savings, resulting in a net decrease to O&M expense during the PBR period. 9 Because of the high variability of AMI costs and savings during the implementation period, net 10 AMI costs, including the costs of AMI-enabled billing options, were forecast and tracked outside 11 of the PBR formula. 12
Table C2-1 below compares 2014 through 2019 net AMI savings to the net savings forecast in 13 the AMI CPCN application. 14
Table C2-1: AMI Costs and Savings ($ millions) 15
16
As reported previously, AMI-related costs and savings from 2014 to 2017 lag those estimated in 17 the AMI CPCN primarily due to delayed project timing following an extensive CPCN review 18 process and the BCUC’s directive to file for approval of an opt-out program prior to meter 19 installation. The AMI project was substantially completed during 2016, such that 2017 was the 20 first year of fully realized costs and savings for the AMI project. 21
Following implementation, costs were approximately as forecast in the CPCN application, while 22 annual savings were lower than the CPCN forecast of $4.424 million. As shown in Table C2-1 23 above, the 2019 actual savings of $3.153 million are approximately $1.0 million lower. This 24 variance is driven by meter reading, Measurement Canada compliance savings, and other smaller 25 factors as explained below. 26
3.1.1.1 Meter Reading 27
The CPCN forecast was a comparison of the savings that would be achieved with the AMI project 28 to the costs that would otherwise be incurred to support the continuation of a manual meter 29 reading program. As such, the AMI CPCN forecast savings required a cost forecast of continuing 30 with manual meter reading. The manual meter reading cost forecasts used in the CPCN for 2013 31 and 2014 (the last full years of manual meter reading) were higher than the costs actually 32
Line
No. Actual Approved CPCN(1) Actual Approved CPCN(1) Actual Approved CPCN(1)
1 AMI Costs 7.153 $ 7.829 $ 8.752 $ 1.920 $ 2.055 $ 1.951 $ 9.073 $ 9.884 $ 10.703 $ 2 AMI Savings (10.290) (10.841) (14.863) (3.216) (3.216) (4.244) (13.506) (14.057) (19.107) 3 Net AMI Costs/(Savings) (3.137) $ (3.012) $ (6.111) $ (1.296) $ (1.161) $ (2.293) $ (4.433) $ (4.173) $ (8.404) $ 4
5 (1)CPCN estimates adjusted to include reclassification of software from capital pursuant to Order G-13-14.
2014-2018 2019 Total

APPENDIX C2 AMI PROJECT NET O&M COSTS AND SAVINGS
PAGE 3
experienced in those years. These savings resulted largely from efficiencies found in absorbing 1 the City of Kelowna manual meter reading work. As a result, the savings potential was diminished 2 in 2015 and beyond. 3
CPCN forecast costs for meter reading were also based in part on the forecast number of 4 customers. This customer count forecast in the CPCN application was an average of 1.9 percent 5 growth per year between 2014 and 2016 (the last year of comparative meter reading costs), which 6 was higher than the 1.3 percent actually experienced. 7
In total, the meter reading savings contribute approximately $0.400 million of the total AMI savings 8 variance in 2019. 9
3.1.1.2 Measurement Canada Compliance 10
One of the benefits of replacing the majority of the meter fleet with AMI meters was a reduction in 11 Measurement Canada compliance costs. As with meter reading, forecasting these savings 12 required a forecast of the cost of meter exchanges that would have been required in the absence 13 of AMI. In the CPCN application, FBC forecast that 2018 would be the peak year in terms of the 14 number of electromechanical and non-AMI digital meter replacements due to the Measurement 15 Canada SS-06 regulation (in the absence of AMI). These non-AMI compliance costs were 16 estimated to be $0.400 million higher than the forecast of Measurement Canada cost for 2019. 17 This $0.400 million avoided cost does not result in a reduction to 2019 O&M costs, but will still 18 result in lower rates for customers than in the absence of AMI. 19
3.1.1.3 Other Factors 20
Other factors contributing to the $1.0 million AMI Savings variance in 2019 include: 21
1. Approximately $0.100 million lower savings due to higher post-AMI manual disconnect and 22 reconnect costs than forecast. The higher post-AMI costs are due to not forecasting an 23 increase in the unit cost of manual disconnects and reconnects at substantially lower post-24 AMI volumes. 25
2. Approximately $0.100 million lower savings due to lower pre-AMI Measurement Canada 26 compliance exchange costs than forecast. As with the lower pre-AMI meter reading costs 27 discussed above, this reduced the post-AMI savings potential. 28
4. AMI WORKING CAPITAL ADJUSTMENT 29
Order G-16-14 approved the introduction of a monthly billing option for customers previously billed 30 on a bi-monthly basis, and ordered that any incremental working capital benefits resulting from 31 an increase in monthly billings be returned to customers during the PBR term. FBC calculated 32 the impact on working capital due to the AMI Project, which resulted from changes in the 33 proportion of monthly-billed to bi-monthly-billed customers facilitated by AMI. In this Appendix, 34 FBC calculates the impact to cash working capital for 2018 and 2019, the final two years of the 35 PBR term, based on changes in billing determinants from the approved. 36

APPENDIX C2 AMI PROJECT NET O&M COSTS AND SAVINGS
PAGE 4
In 2018 and 2019, the impact of AMI on cash working capital resulted in decreases of $0.035 1 million and $0.085 million respectively to revenue requirements, which is being returned to 2 customers in 2020. The calculations of the revenue requirements impacts are provided below. 3
4.1 2018 AMI WORKING CAPITAL IMPACT 4
As can be seen by comparing columns c and f in Table C2-2 below, for the two largest customer 5 classes, residential and commercial, the proportion of customers receiving monthly rather than 6 bi-monthly bills was greater in 2018 than forecast (approved). The periods between taking service 7 and meter reading, and between billing and collection are shorter for customers on a monthly 8 billing cycle. Hence, the total revenue lag days is lower than calculated in the approved cash 9 working capital calculation. 10
Table C2-2: Calculation of 2018 Revenue Lag 11
12
Table C2-3 below recalculates 2018 cash working capital assuming the revenue lags for 2018. 13 Cash working capital is reduced by $0.583 million, therefore reducing rate base by the same 14 amount. 15
Line Consumption ConsumptionNo. Customer Class Monthly Bimonthly Monthly Bimonthly Lag Monthly Bimonthly Lag
a b c d e=a*c+b*d f g h=a*f+b*g i
1 Residential 15.2 30.4 14.6% 85.4% 28.2 19.7% 80.3% 27.4 1.02 Commercial 15.2 30.4 19.6% 80.4% 27.4 25.2% 74.8% 26.6 1.03 Wholesale 15.2 30.4 100.0% 0.0% 15.2 100.0% 0.0% 15.2 1.04 Industrial 15.2 30.4 100.0% 0.0% 15.2 100.0% 0.0% 15.2 1.05 Lighting 15.2 30.4 40.3% 59.7% 24.3 43.9% 56.1% 23.7 1.06 Irrigation 15.2 30.4 16.2% 83.8% 27.9 18.9% 81.1% 27.5 1.0789 Approved Actual
10 Clearing Clearing11 Monthly Bimonthly Monthly Bimonthly Lag Monthly Bimonthly Lag12 j k l=c m=d n=j*l+k*m o=f p=g q=j*o+k*p r=e+i+n s=h+i+q
13 Residential 17 22 14.6% 85.4% 21.3 19.7% 80.3% 21.0 50.5 49.414 Commercial 17 22 19.6% 80.4% 21.0 25.2% 74.8% 20.7 49.4 48.315 Wholesale 17 22 100.0% 0.0% 17.0 100.0% 0.0% 17.0 33.2 33.216 Industrial 17 22 100.0% 0.0% 17.0 100.0% 0.0% 17.0 33.2 33.217 Lighting 17 22 40.3% 59.7% 20.0 43.9% 56.1% 19.8 45.3 44.518 Irrigation 17 22 16.2% 83.8% 21.2 18.9% 81.1% 21.1 50.1 49.6
Meter Read Proportion Billed Proportion Billed BillingService Period to Approved Actual Meter Read to
Collection Proportion Billed Proportion BilledTotal Lag Days
Processing Lag
Billing to Approved Actual

APPENDIX C2 AMI PROJECT NET O&M COSTS AND SAVINGS
PAGE 5
Table C2-3: AMI Adjustment to 2018 Cash Working Capital ($ millions) 1
2
Finally, Table C2-4 calculates the revenue requirements impact of the $0.580 million reduction 3 in rate base by applying the pre-tax weighted average cost of capital. The adjustment of $0.046 4 million (credit) is included in the additions to the Flow-through deferral account, as shown in the 5 Application, Section 14, Table 14-1 at line 27. 6
Table C2-4: 2018 Revenue Requirements Impact of AMI Adjustment to Cash Working Capital 7 ($ millions) 8
9
4.2 2019 AMI WORKING CAPITAL IMPACT 10
Similarly, in 2019 the proportion of residential and commercial customers receiving monthly rather 11 than bi-monthly bills was greater than forecast (approved), as seen in columns c and f of Table 12 C2-5. The total revenue lag days for these categories are lower than calculated in the approved 13 cash working capital calculation. 14
Line CWC Pre-Tax Adjustment forNo. Description Weight Component Rate Cash Working Capital Reference (2018 Rates Compliance Filing)
1 Long Term Debt 55.63% (0.323)$ 5.18% (0.017)$ Section 11, Schedule 26, Line 12 Short Term Debt 4.37% (0.025) 3.45% (0.001) Section 11, Schedule 26, Line 23 Common Equity 40.00% (0.232) 12.36% (0.029) Note 1456 Weighted Average 100.00% (0.580)$ 7.98% (0.046)$ 78 Note 1: Pre-tax value = approved ROE of 9.15%/(1-26%)= 12.36%

APPENDIX C2 AMI PROJECT NET O&M COSTS AND SAVINGS
PAGE 6
Table C2-5: Calculation of 2019 Revenue Lag 1
2
Cash working capital is reduced by $1.061 million, shown in Table C2-6, reducing rate base by 3 the same amount. 4
Table C2-6: AMI Adjustment to 2019 Cash Working Capital ($ millions) 5
6
Table C2-7 calculates the revenue requirements impact of the $0.293 million reduction in rate 7 base by applying the pre-tax weighted average cost of capital. The adjustment of $0.085 million 8 (credit) is included in the additions to the Flow-through deferral account, as shown in the 9 Application, Section 14, Table 14-1 at line 28. 10
Line Consumption ConsumptionNo. Customer Class Monthly Bimonthly Monthly Bimonthly Lag Monthly Bimonthly Lag
a b c d e=a*c+b*d f g h=a*f+b*g i
1 Residential 15.2 30.4 14.6% 85.4% 28.2 23.2% 76.8% 26.9 1.02 Commercial 15.2 30.4 19.6% 80.4% 27.4 28.9% 71.1% 26.0 1.03 Wholesale 15.2 30.4 100.0% 0.0% 15.2 100.0% 0.0% 15.2 1.04 Industrial 15.2 30.4 100.0% 0.0% 15.2 100.0% 0.0% 15.2 1.05 Lighting 15.2 30.4 40.3% 59.7% 24.3 47.0% 53.0% 23.3 1.06 Irrigation 15.2 30.4 16.2% 83.8% 27.9 57.3% 42.7% 21.7 1.0789 Approved Actual
10 Clearing Clearing11 Monthly Bimonthly Monthly Bimonthly Lag Monthly Bimonthly Lag12 j k l=c m=d n=j*l+k*m o=f p=g q=j*o+k*p r=e+i+n s=h+i+q
13 Residential 17 22 14.6% 85.4% 21.3 23.2% 76.8% 20.8 50.5 48.714 Commercial 17 22 19.6% 80.4% 21.0 28.9% 71.1% 20.6 49.4 47.615 Wholesale 17 22 100.0% 0.0% 17.0 100.0% 0.0% 17.0 33.2 33.216 Industrial 17 22 100.0% 0.0% 17.0 100.0% 0.0% 17.0 33.2 33.217 Lighting 17 22 40.3% 59.7% 20.0 47.0% 53.0% 19.7 45.3 43.918 Irrigation 17 22 16.2% 83.8% 21.2 57.3% 42.7% 19.1 50.1 41.8
Service Period to Approved Actual Meter Read to
Processing Lag
Billing to Approved Actual
Meter Read Proportion Billed Proportion Billed Billing
Proportion Billed Proportion BilledTotal Lag Days
Collection
Revised WeightedLine 2019 Lag (Lead) AverageNo. Description Forecast Days Extended Lag (Lead) Days Reference (2019 Compliance Filing)
1 REVENUE2 Sales Revenue3 Residential Tariff Revenue 187.887 48.7 9.153$ 4 Commercial Tariff Revenue 94.508 47.6 4.495 5 Wholesale Tariff Revenue 49.519 33.2 1.644 6 Industrial Tariff Revenue 32.414 33.2 1.076 7 Lighting Tariff Revenue 2.661 43.9 0.117 8 Irrigation Tariff Revenue 3.544 41.8 0.148 910 Other Revenue 9.268 0.330 Section 11, Schedule 14, Lines 11 - 161112 Total 379.802$ 16.963$ 44.7 1314 EXPENSES 276.581$ 10.904$ (39.4) Section 11, Schedule 14, Line 361516 Net Lag (Lead) Days 5.3 1718 Total Expenses 276.581$ 1920 Cash Working Capital, Revised Lag Days 4.016$ 2122 Cash Working Capital in 2019 Rates 5.077$ Section 11, Schedule 14, Line 422324 Reduction in Cash Working Capital (1.061)$

APPENDIX C2 AMI PROJECT NET O&M COSTS AND SAVINGS
PAGE 7
Table C2-7: 2019 Revenue Requirements Impact of AMI Adjustment to Cash Working Capital 1 ($ millions) 2
3
4.3 SUMMARY 4
Overall, the proportion of FBC customers billed on a monthly basis increased from less than 15 5 percent prior to the implementation of AMI to approximately 26.5 percent at year-end 2019. By 6 including the working capital impact in the Flow-through deferral account, FBC has returned the 7 working capital benefits of its AMI project to customers. 8
Line CWC Pre-Tax Adjustment forNo. Description Weight Component Rate Cash Working Capital Reference (2019 Compliance Filing)
1 Long Term Debt 54.77% (0.581)$ 5.18% (0.030)$ Section 11, Schedule 26, Line 12 Short Term Debt 5.23% (0.055) 4.12% (0.002) Section 11, Schedule 26, Line 23 Common Equity 40.00% (0.424) 12.36% (0.052) Note 1456 Weighted Average 100.00% (1.061)$ 8.00% (0.085)$ 78 Note 1: Pre-tax value = approved ROE of 9.15%/(1-26%)= 12.36%

Appendix C3
FortisBC Inc.
Ruckles Substation Rebuild Project
Final Report

APPENDIX C3 FBC RUCKLES SUBSTATION REBUILD PROJECT STATUS REPORT
PAGE I
Table of Contents
1. Project Status ..................................................................................................... 1
Project Background .................................................................................................. 1
General Project Status ............................................................................................. 1
Major Accomplishments, Work Completed and Key Decisions Made ...................... 2
1.3.1 Project Engineering ................................................................................................. 2
1.3.2 Procurement ............................................................................................................ 3
1.3.3 Environmental Planning ........................................................................................... 3
1.3.4 Permits and Approvals ............................................................................................ 3
Project Challenges and Issues ................................................................................. 3
1.4.1 Detailed Engineering ............................................................................................... 3
1.4.2 Communications and Stakeholder Engagement ..................................................... 3
1.4.3 Construction and Commissioning ............................................................................ 3
1.4.4 Project Photos ......................................................................................................... 5
2. Project Schedule ................................................................................................ 9
Schedule Performance ............................................................................................. 9
Schedule Projection Going Forward ......................................................................... 9
Schedule Difficulties and Variances ....................................................................... 10
Project Scope Change Summary ........................................................................... 10
3. Project Costs .................................................................................................... 11
4. Project Risks ..................................................................................................... 12
5. Conclusion ........................................................................................................ 12

APPENDIX C3 FBC RUCKLES SUBSTATION REBUILD PROJECT STATUS REPORT
PAGE 1
1. PROJECT STATUS 1
PROJECT BACKGROUND 2
On January 20, 2017, the British Columbia Utilities Commission (BCUC) approved capital 3 expenditures related to the Ruckles Substation Rebuild project (Ruckles project) by Order G-8-4 17. The BCUC directed FBC to provide the following information about the progress of the 5 Ruckles project as part of its annual review applications. 6
The status of the Ruckles project, including a comparison of the project timeline provided 7 in the [Annual Review for 2017 Rates] Application to the updated project timeline, as at 8 the time of filing each annual review application. 9
Updated cost estimates and scope descriptions compared to the cost estimates and scope 10 descriptions provided in the [Annual Review for 2017 Rates] Application, including 11 explanations for any variances/changes to the cost estimates or project scope. 12
Actual costs incurred to date on the Ruckles project as at the time of filing each annual 13 review application. 14
The final actual project cost, including a description of the scope of work completed relative 15 to the cost estimate and scope description provided in the [Annual Review for 2017 Rates] 16 Application, with explanations for any variances.1 17
18 The Ruckles project involved rebuilding the Ruckles Substation, together with the necessary 19 transmission and distribution modifications, primarily to address issues of age and the 20 substation’s location in the identified flood zone of the Kettle River, in order to continue the safe 21 supply of electricity to the City of Grand Forks (CoGF) municipal electric utility and surrounding 22 area. FBC submits this final report in compliance with the above directive of BCUC Order G-8-23 17. 24
GENERAL PROJECT STATUS 25
In the Annual Review for 2017 Rates in which approval was requested, the Ruckles project had 26 an AACE Class 3 capital cost estimate of $8.288 million in as-spent dollars (including $0.428 27 million of AFUDC and $0.301 million of removal costs). Final project costs are $6.403 million, or 28 $1.885 million or 22.8 percent lower than estimated, due to savings associated with the 29 elimination of 13 kV to 4 kV step-down equipment that was no longer necessary (discussed further 30 below), favourable actual costs for major equipment compared to budget allowances, and the 31 release of project contingency. 32
1 G-8-17, Appendix A, page 15.

APPENDIX C3 FBC RUCKLES SUBSTATION REBUILD PROJECT STATUS REPORT
PAGE 2
FBC maintained the project schedule as presented in the business case. FBC completed all 1 construction, including project deficiencies mitigation and closeout, by December 31, 2018. 2
Significant areas of Grand Forks, including the old Ruckles Substation, experienced extensive 3 flooding in May 2018. The floodwaters reached levels consistent with those expected for a 1 in 4 200-year event. The possibility of such an event was one of the main drivers for the Ruckles 5 project. Emergency flood response, including the installation of a mobile transformer, placement 6 of concrete blocks and sandbags for flood control, and contractor support to operate dewatering 7 pumps and provide site clean up resulted in a small amount of additional costs to the project. The 8 newly constructed, elevated Ruckles Substation did not sustain flood damage. By successfully 9 maintaining scheduled milestones, FBC installed, commissioned, and energized the new 10 equipment before the floodwaters damaged the old substation, thereby avoiding extended and 11 extensive outages to FBC and CoGF customers. 12
MAJOR ACCOMPLISHMENTS, WORK COMPLETED AND KEY DECISIONS MADE 13
1.3.1 Project Engineering 14
As described in the previous Status Reports, Ruckles Substation is supplied by two FBC 15 transmission lines and provides a distribution supply source to direct residential, irrigation and 16 commercial customers of FBC (at 13 kV), the electrical utility of the CoGF (at both 13 kV and 4 17 kV), and an industrial sawmill customer (at 4 kV). 18
Following BCUC approval of the Ruckles project, and to seek out project cost savings, FBC 19 initiated discussions with the CoGF municipal electric utility to explore whether the CoGF would 20 be willing to advance its ongoing 4 kV to 13 kV system voltage conversion project so that it would 21 be completed by June 1, 2018. The CoGF was originally anticipating completion of the conversion 22 project in 2018/2019. An earlier conversion allowed FBC to eliminate the 4 kV infrastructure 23 requirements associated with the CoGF supply from this project and to achieve project cost 24 savings. In June 2017, the CoGF accepted FBC’s offer to contribute a portion of the project 25 savings in order to advance the voltage conversion. 26
FBC also held discussions with its industrial customer, Interfor Corporation (Interfor) to explore 27 whether Interfor would also be willing to convert its equipment from 4 kV to 13 kV by June 1, 2018. 28 Following initial discussions, Interfor engaged a third party to develop a scope and estimate for 29 the conversion. FBC and Interfor then reached an agreement whereby FBC contributed a portion 30 of Interfor’s costs of conversion. 31
By removing the 4 kV supply infrastructure from the Ruckles project, gross cost savings were 32 approximately $0.500 million, less contributions to the CoGF and Interfor. Including the 33 contributions, the net cost savings were approximately $0.250 million. 34

APPENDIX C3 FBC RUCKLES SUBSTATION REBUILD PROJECT STATUS REPORT
PAGE 3
FBC completed all civil and structural design and issued the electrical tender package to four 1 vendors on June 6, 2017 as part of the Request for Quotation (RFQ). The detailed electrical 2 construction package was issued in September 2017. 3
1.3.2 Procurement 4
FBC received all major equipment, which was installed on site. The Electrical construction 5 contract is 100 percent complete. The contract scope of work included the civil and site, structures 6 and bus work, station equipment and apparatus, protection, control, and metering, and removal 7 of existing equipment. 8
1.3.3 Environmental Planning 9
FBC developed a site specific Environmental Management Plan for the project. Both internal 10 FBC crews and contractors met or exceeded the environmental requirements. 11
1.3.4 Permits and Approvals 12
There are no outstanding permits or approvals required. 13
PROJECT CHALLENGES AND ISSUES 14
1.4.1 Detailed Engineering 15
FBC completed geotechnical and soil characterization studies to verify site conditions. FBC also 16 used surveys and historical information to determine site elevations. This allowed engineering to 17 design the project above the flood plain by reconstructing the station two metres above the 18 existing grade. 19
1.4.2 Communications and Stakeholder Engagement 20
Communications with the CoGF and Interfor are complete. Both parties agreed to convert from a 21 4 kV to 13 kV supply. As explained in section 1.3.1, this reduced the project capital cost, improved 22 system reliability by reducing the amount of installed equipment, and allowed FBC to achieve 23 efficiencies by not having to maintain non-standard 4 kV equipment. 24
1.4.3 Construction and Commissioning 25
The Ruckles Substation and surrounding areas in the Grand Forks area experienced extensive 26 flooding in May 2018, with water levels consistent with those expected for a 1 in 200-year event. 27
On the morning of May 11, rising floodwaters breached a temporary sandbag dike erected by 28 FBC around the old Ruckles Substation. Water levels in the station yard and control buildings 29 quickly reached the levels foreseen in the project application (refer to Project photos in section 30 1.4.4 below). This forced the de-energization of the station to manage the extreme safety hazards 31

APPENDIX C3 FBC RUCKLES SUBSTATION REBUILD PROJECT STATUS REPORT
PAGE 4
associated with flooded high voltage equipment. Although not all aspects of the project were 1 complete, construction of the new station was sufficiently advanced that the electrical 2 infrastructure was available to provide safe and reliable service. FBC was able to expedite the 3 remaining commissioning and only a short unplanned outage occurred before load was 4 transferred from the unserviceable equipment in the old Ruckles Substation to the new substation 5 equipment. Additional emergency flood response, including the installation of a mobile 6 transformer to provide a temporary 4 kV supply, concrete block and sandbag installations, and 7 contractor support to operate dewatering pumps and site clean-up, resulted in approximately $70 8 thousand of additional costs to the project, but no significant schedule delays occurred. 9
Field equipment commissioning was completed by a third party contractor. All protection and 10 control commissioning was completed by internal FBC employees. Both Interfor and the CoGF 11 have fully converted to the new 13 kV voltage and are being supplied from the new Ruckles 12 Substation. 13

APPENDIX C3 FBC RUCKLES SUBSTATION REBUILD PROJECT STATUS REPORT
PAGE 5
1.4.4 Project Photos 1
Figure C3-1: Old Ruckles Substation T1 transformer and FDR4 / FDR5 circuit breakers three days 2 after peak flooding (note high water marks on equipment) 3
4

APPENDIX C3 FBC RUCKLES SUBSTATION REBUILD PROJECT STATUS REPORT
PAGE 6
Figure C3-2: Old Ruckles Substation control building interior 1 (note high water marks on switchgear panels) 2
3
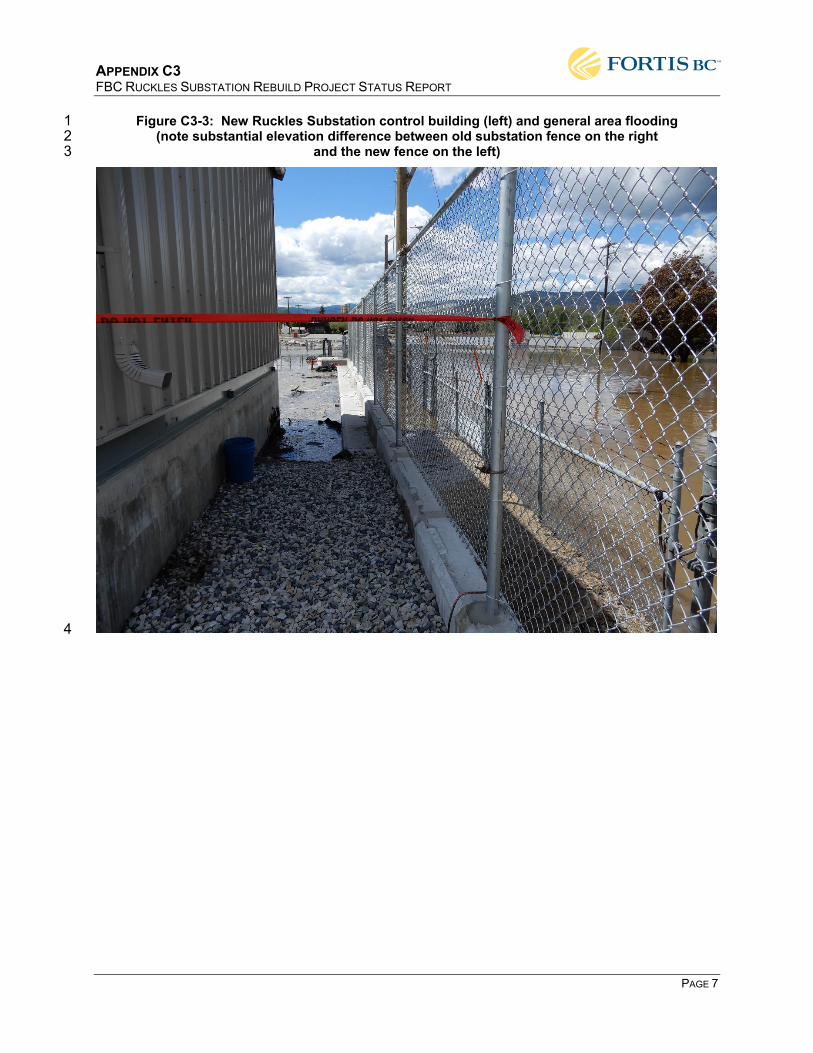
APPENDIX C3 FBC RUCKLES SUBSTATION REBUILD PROJECT STATUS REPORT
PAGE 7
Figure C3-3: New Ruckles Substation control building (left) and general area flooding 1 (note substantial elevation difference between old substation fence on the right 2
and the new fence on the left) 3
4

APPENDIX C3 FBC RUCKLES SUBSTATION REBUILD PROJECT STATUS REPORT
PAGE 8
Figure C3-4: New Ruckles Substation 1 (photo taken shortly after the flood peak) 2
3

APPENDIX C3 FBC RUCKLES SUBSTATION REBUILD PROJECT STATUS REPORT
PAGE 9
2. PROJECT SCHEDULE 1
Major milestones are as shown in the schedule below. 2
Table C3-1: Milestone Summary 3
Milestone Planned
Completion Date
Actual Completion
Date Status
Engineering/Procurement: Q4-2018 December 2018 Complete 9L 63 kV reconfiguration(IFC) Q1-2017 March 31, 2017 Complete
Control room (IFC) Q2-2017 May 11, 2017 Complete Site/Civil (IFC) Q2-2017 April 14, 2017 Complete Electrical/Physical (IFC) Q2-2017 June 5, 2017 Complete Issue RFQ Q2-2017 June 6, 2017 Complete Steel (IFC) Q2-2017 June 15, 2017 Complete Issue Contract Q3-2017 July 14, 2017 Complete Major equipment delivery Q4-2017 December 2018 Complete Construction: Civil/site Phase 1 (pre-construction) Q4-2017 November 2017 Complete
Civil/Site Phase 2 (completion) Q4-2018 September 2018 Complete
Buildings Q2-2018 May 2018 Complete Structures/Buswork Q4-2018 May 2018 Complete Station Equipment/Apparatus Q3-2018 June 2018 Complete
Communication/SCADA Q2-2018 June 2018 Complete Protection/Control/Metering Q2-2018 May 2018 Complete Commissioning Q3-2018 June 2018 Complete Distribution Line work Q3-2018 September 2018 Complete Equipment removal Q4-2018 September 2018 Complete Project Completion Q4-2018 December 2018 Complete
SCHEDULE PERFORMANCE 4
FBC completed construction, engineering, and project closeouts on schedule. 5
SCHEDULE PROJECTION GOING FORWARD 6
The Ruckles project is 100 percent complete with no outstanding deficiencies. 7

APPENDIX C3 FBC RUCKLES SUBSTATION REBUILD PROJECT STATUS REPORT
PAGE 10
SCHEDULE DIFFICULTIES AND VARIANCES 1
Floodwaters in 2018 slightly delayed construction, but FBC maintained the schedule and 2 completed major construction in September 2018. 3
PROJECT SCOPE CHANGE SUMMARY 4
Successful negotiations with the CoGF and Interfor allowed FBC to remove the 4 kV portion of 5 the project. This created some Civil and Electrical design changes for the project. Specifically, 6 two padmount transformers and the associated containment systems and foundations were 7 removed from the scope of work. 8
FBC change management procedures were used to manage design and scope change.9

APPENDIX C3 FBC RUCKLES SUBSTATION REBUILD PROJECT STATUS REPORT
PAGE 11
3. PROJECT COSTS 1
The following table outlines the total project expenditures. 2
Table C3-2: Cost Summary 3
Description Application/
Control Budget Total
Expenditures Percent Variance Variance Explanation
(1) (2) (3)=((2)-(1))/(1)
($000s) (%)
Line Work 241 259 7
High water table when transmission poles installed. Vacuum truck required
Civil & Site 1,688 1,663 -1 Buildings 191 205 7
Structures & Buswork 427 505 18
Scope addition for animal guarding and capacitor bank breaker replacement
Station Equipment & Apparatus2 2,602 1,777 -32
4 kV to 13 kV voltage conversion savings and favourable equipment pricing
Communications & SCADA 32 34 6
Protection, Control & Metering 270 246 -9
Design 627 714 14
Additional engineering required for 4 kV-13 kV conversion
Commissioning 132 122 -7
Project Management 544 300 -45
Internal FBC dual role construction / project manager. Did not have to contract out on site
Subtotal - Construction 6,754 5,824 -14
Cost of Removal 301 175 -42
Savings on non-PCB oil disposal and salvage credits
Project Contingency 805 0 -100 Identified potential risks did not materialize
Subtotal- Construction & Removal 7,860 6,000 -24 AFUDC 428 403 -6
Total Project Cost 8,288 6,403 -23

APPENDIX C3 FBC RUCKLES SUBSTATION REBUILD PROJECT STATUS REPORT
PAGE 12
The project cost is $1.885 million lower than the business case forecast as a result of eliminating 1 the 4 kV equipment from the substation, favourable actual costs for major equipment compared 2 to budget allowances, and the release of project risk and contingency. Additional details are 3 included in Table C3-2 above. 4
4. PROJECT RISKS 5
The Ruckles project is now 100 percent complete so no project risks remain. 6
5. CONCLUSION 7
FBC successfully energized the new Ruckles Substation in May 2018 to address imminent 8 damage to equipment in the old Ruckles Substation resulting from flooding in the Grand Forks 9 area. Had FBC not proceeded with the project, extensive and extended outages to FBC direct 10 customers, CoGF customers, and the Interfor sawmill would have been inevitable. There would 11 also have been substantial unforeseen costs associated with addressing damaged equipment 12 and potential environmental mitigation. 13
Project cost savings resulted from successful negotiations with Interfor and the CoGF allowing 14 FBC to remove the 4 kV voltage system requirements from the project scope. Favourable 15 equipment pricing and the release of risk and contingency also contributed to the project cost 16 savings. 17

Appendix C4
FortisBC Inc. Upper Bonnington Unit Refurbishment
Project
Status Report
August 2020

APPENDIX C4 FBC UBO REFURBISHMENT PROJECT STATUS REPORT
PAGE I
Table of Contents
1. Project Status ..................................................................................................... 1
Project Background .................................................................................................. 1
General Project Status ............................................................................................. 1
Major Accomplishments, Work Completed and Key Decisions Made ...................... 2
1.3.1 Detailed Engineering ............................................................................................... 2
1.3.2 Procurement (2017-2020) ....................................................................................... 2
1.3.3 Construction (2017-2020) ........................................................................................ 3
1.3.4 Construction Pictures .............................................................................................. 4
1.3.5 Environmental .......................................................................................................... 6
Project Challenges and Issues ................................................................................. 6
1.4.1 Unit 3 Deficiency ...................................................................................................... 6
1.4.2 Unit 4 ....................................................................................................................... 7
1.4.3 Unit 1 ....................................................................................................................... 7
1.4.4 Unit 2 Stator ............................................................................................................. 7
1.4.5 Common Challenges and Issues (All Units) ............................................................ 7
2. Project Schedule ................................................................................................ 8
3. Project Costs ...................................................................................................... 9
3.1.1 Project Cost Summary ........................................................................................... 10
Project Scope Change Summary ........................................................................... 11
4. Project Risks ..................................................................................................... 12
Balance of plant ..................................................................................................... 12
Oil leak repair Units 2 and 3 ................................................................................... 12
COVID-19 Pandemic .............................................................................................. 12
5. Conclusion ........................................................................................................ 13

APPENDIX C4 FBC UBO REFURBISHMENT PROJECT STATUS REPORT
PAGE 1
1. PROJECT STATUS 1
PROJECT BACKGROUND 2
On January 20, 2017, the British Columbia Utilities Commission (BCUC) approved capital 3 expenditures related to the Upper Bonnington Old Units Refurbishment (UBO Refurbishment 4 Project) in Order G-8-17. Directive 6 of Order G-8-17 required FBC to file specific information on 5 the project’s updated scope, progress and costs as part of FBC’s future annual review 6 applications. Specifically, the BCUC directed FBC to provide the following information about the 7 progress of the project: 8
The status of both the UBO Refurbishment Project as a whole and of the individual units, 9 including a comparison of the project timeline provided in the [Annual Review for 2017 10 Rates] Application to any updated project timeline as at the time of filing each annual 11 review application. 12
Updated cost estimates and cost descriptions compared to the cost estimates and scope 13 descriptions provided in the [Annual Review for 2017 Rates] Application, including 14 explanations for any variances/changes to the cost estimates or project scope. 15
Actual costs incurred to date on the UBO Refurbishment Project as a whole and on each 16 individual unit as at the time of filing each annual review application. 17
Final actual refurbishment costs at the completion of each unit, including a description of 18 the scope of work completed relative to the conditions found and against the cost 19 estimate.1 20
21 The UBO Refurbishment Project involves the refurbishment of generating Units 1-4 (the Old 22 Units), which are over 100 years old, in order to extend their lives for an additional twenty years 23 or more. The project will also reduce the safety and environmental risks associated with failures 24 of the aged equipment. 25
FBC submits the following report regarding the UBO Refurbishment Project in compliance with 26 Directive 6 of Commission Order G-8-17, including costs to June 30, 2020. 27
GENERAL PROJECT STATUS 28
The Project has progressed well since the last submitted progress report. FBC encountered 29 challenges refurbishing Units 3, 4, and 1, but ultimately overcame those challenges while 30 maintaining scope and schedule. The as-found condition of the turbine components was and 31
1 G-8-17, Appendix A, page 21.

APPENDIX C4 FBC UBO REFURBISHMENT PROJECT STATUS REPORT
PAGE 2
continues to be the main challenge encountered due to higher than anticipated levels of corrosion 1 and wear. 2
Unit 2 is currently under construction and is scheduled to return to service in Q4 2020. The 3 balance of the plant work will begin immediately after Unit 2 is in service, and is expected to be 4 complete by Q2 2021. The following table shows the status of each of the generating units being 5 worked on as part of the Project. 6
Table C4-1: Project Status 7
Upper Bonnington
Refurbishment Project
Start Project
Duration Inservice
Date Remaining Work
Unit 3 Q1 2017 10 Months Q4 2017 Painting and Rotor Leak Deficiency1
Unit 4 Q1 2018 10 Months Q4 2018 Painting Unit 1 Q1 2019 10 Months Q4 2019 Painting
Unit 2 Q1 2020 9 Months Reassembly Alignment, Commissioning, Painting
Balance of Plant Q2 2020 7 Months Demobilization Q2 2020 1 Month
8 Notes: 9
1 Unit 3 Rotor Leak Deficiency is explained in more detail in Section 1.4.1. 10
The UBO Refurbishment Project was approved with a Class 4 capital cost estimate of $31.783 11 million in as-spent dollars (including $0.867 million of AFUDC and $1.880 million of removal 12 costs). Project expenditures to May 30, 2020 are approximately $28.534 million. Final project 13 costs (including $1.096 million of AFUDC and $1.679 million of removal costs) are currently 14 forecast to be $34.180 million. 15
The construction schedule remains unchanged from the previous update provided in the Annual 16 Review for 2019 Rates. 17
MAJOR ACCOMPLISHMENTS, WORK COMPLETED AND KEY DECISIONS MADE 18
1.3.1 Detailed Engineering 19
FBC has predominantly completed detailed engineering for all units. Minor engineering work to 20 complete Unit 2 commissioning will be completed after the balance of plant work. 21
1.3.2 Procurement (2017-2020) 22
The majority of the procurement for the project is complete. When possible, FBC procured 23 components as a single tender for all units, to standardize equipment and realize savings by 24
APPENDIX C4 FBC UBO REFURBISHMENT PROJECT STATUS REPORT
PAGE 3
purchasing bulk material. The remaining procurement activities on the Project include finalizing 1 the machining and fabrication contract services for Unit 2 and balance of plant work. 2
1.3.3 Construction (2017-2020) 3
Units 3, 1, and 4 are complete and have been put back into commercial operation. These units 4 are performing well. 5
Refurbishment of Unit 2 is progressing well compared to plan. FBC dismantled Unit 2 in Q1 2020 6 with all of the mechanical components shipped throughout British Columbia and Alberta to be 7 refurbished. This procurement strategy, similar to Units 1, 3, and 4, was used to ensure quality, 8 schedule, and cost of the components. Quality assurance measures were completed by 9 engineering at the various machine shops to ensure each product was being refurbished against 10 the requirements outlined within the technical specifications. Most of the Unit 2 components are 11 completed and returned to site. 12
The following is a brief update on Unit 2 work: 13
Modifications to generator are 100 percent complete; 14
Unit 2 trash racks and support beams are 90 percent complete; 15
The installation of the new Unit 2 excitation system is 54 percent complete; 16
The installation of the new Unit 2 protection and control systems are 20 percent complete; 17
The installation of the new bearing lubrication system is 20 percent complete; 18
The installation of the new brake system is 38 percent complete; 19
The installation of the new governor system is 72 percent complete; 20
The installation of the new cooling water system is 21 percent complete; and 21
Removal of the old water wheel excitation system is 30 percent complete. 22
23 Reassembly and alignment of Unit 2 will begin in Q3 2020. The project remains on schedule and 24 FBC anticipates returning Unit 2 to service in Q4 2020. 25
The COVID-19 pandemic has introduced challenges to Unit 2 work which were not present for 26 the other units. Restrictions placed on the site to protect the workforce has caused delays. 27 Suppliers have also changed their procedures as a result of the COVID-19 pandemic, which has 28 created interferences primarily with the delivery of components. However, to date the Project has 29 been able to progress through the COVID-19 pandemic with only minor impacts to schedule and 30 cost. 31

APPENDIX C4 FBC UBO REFURBISHMENT PROJECT STATUS REPORT
PAGE 4
1.3.4 Construction Pictures 1
The following pictures show some comparisons of typical components before and after 2 refurbishment. 3
Figure C4-1: Unit 2 Replacement Operating Rings Figure C4-2: Unit 2 Operating Ring 4
5
Figure C4-3: New Trash Racks Figure C4-4: Old Trash Racks 6
7
Broken while in service

APPENDIX C4 FBC UBO REFURBISHMENT PROJECT STATUS REPORT
PAGE 5
Figure C4-5: New Governor Interface Figure C4-6: Old Governor Interface 1
2
Figure C4-7: Rotor Spider Figure C4-8: Rotor Refurbishment Complete 3
4
Leaks Developed in This Area on Unit 3

APPENDIX C4 FBC UBO REFURBISHMENT PROJECT STATUS REPORT
PAGE 6
Figure C4-9: New Transformer (Unit 1) Figure C4-10: Old Transformer (Unit 1) 1
2
1.3.5 Environmental 3
FBC continues to follow the Environmental Management Plan (EMP) developed in 2017 and to 4 date there have been no reportable environmental incidents. 5
PROJECT CHALLENGES AND ISSUES 6
1.4.1 Unit 3 Deficiency 7
The rotor spider on Unit 3 is an original 1908 cast steel component that as designed allows 8 lubricating oil to return from the upper guide bearing back through the center of the spider to the 9 reservoir. As the oil is flowing back to the reservoir, it is able to flow over and into the voids of the 10 steel that were formed as part of the original casting process. As the rotor spins, centrifugical 11 forces push the oil away from the center of the spider towards the outer edge and oil is exposed 12 to atmosphere at various locations along the spider. As the oil seeps out of the voids, the wind 13 generated from the operating unit blows the oil onto the rotor and various other components 14 creating the need for maintainance to clean off the oil. As Unit 2 and Unit 3 rotor spiders are 15 identical, the same issue exists on Unit 2. FBC is currently developing a repair procedure for Unit 16 2 and is planning to re-use the existing spider. The source of the problem is suspected to be voids 17 within the casting at the microscopic level and therefore it is not possible to predict the success 18 of the planned repair. Once Unit 2 is returned to service, FBC will be able to determine if the 19 repair was successful. If successful, Unit 3 will be removed from service in Q1 2021 to have the 20
APPENDIX C4 FBC UBO REFURBISHMENT PROJECT STATUS REPORT
PAGE 7
same repair applied. The current cost forecast includes this repair on Unit 3 at an estimated cost 1 of $0.166 million and a schedule delay of four weeks. If the repair is not successful for Unit 2, 2 both rotor spiders will need to be replaced. FBC is currently exploring options and costing to 3 replace the rotors if required. 4
1.4.2 Unit 4 5
Due to the refurbished mechanical components and tighter tolerances obtained through the 6 refurbishment, Unit 4 produced more power than was anticipated. The generating unit was not 7 designed to accommodate the higher output, and therefore the unit output was reduced and 8 limited to the design rating (FBC’s energy entitlements are limited to the ratings set out in the 9 Canal Plant Agreement). Operating the unit at a reduced output should also increase the life 10 expectancy of the Unit. 11
1.4.3 Unit 1 12
While commissioning Unit 1, the new trash racks developed a vibration when the unit was 13 operating under full load conditions. The vibration was resolved by changing the fastening 14 configuration on the racks. Although Units 3 and 4 did not have the vibration, the fastening 15 methods were changed to match Unit 1 as a precautionary measure and for consistency. 16
1.4.4 Unit 2 Stator 17
The Unit 2 stator and rotor were rewound in 1995 following failure. The installation of the new 18 brake system interfered with the main lead cabling and equipment that was installed as part of 19 the rewind in the mid 1990s. This interference created additional scope on Unit 2 as it required 20 the generator cables and equipment to be relocated. 21
1.4.5 Common Challenges and Issues (All Units) 22
The Governor Systems – The as-found condition of the existing equipment planned to 23 be reused was worse than anticipated resulting in a complete replacement and redesign 24 of the high pressure governor system. FBC worked collaboratively with the governor 25 manufacturer to determine an appropriate solution. 26
Trash Racks – The scope of the trashrack work was based on the original design. Upon 27 inspection of each unit, the as-found condition of each unit’s supporting beam (deck 28 beam), although not originally anticipated to require replacement, was found to be in poor 29 condition and was replaced. 30
Components Machining and Refurbishment Scope – The condition of the concealed 31 components varied throughout Units 1-4. FBC developed custom scopes of work for each 32 component based on the condition of each component. The additional effort to customize 33 each scope was offset by the savings related to not replacing the components. 34

APPENDIX C4 FBC UBO REFURBISHMENT PROJECT STATUS REPORT
PAGE 8
2. PROJECT SCHEDULE 1
Major milestones complete and remaining for the project have been identified in the milestone 2 summary below. 3
Table C4-2: Milestone Summary 4
Milestone Planned
Completion Date
Actual Completion Date Status
Engineering Mechanical Components – Machining and Fabrication Specifications Q4, 2017 Q4, 2017 Complete
All Units Detailed Engineering Q1, 2018 Q1, 2018 Complete Balance of Plant Engineering Q3, 2020 Procurement All Major Unit Mechanical Q2, 2020 Q2,2020 Complete. All Major Unit Electrical Q2, 2020 Q2, 2020 Complete Construction Refurbishment of Unit 3 Q4, 2017 Q4, 2017 Complete Refurbishment of Unit 4 Q4, 2018 Q4, 2018 Complete Refurbishment of Unit 1 Q4, 2019 Q4, 2019 Complete Refurbishment of Unit 2 Q4, 2020 Ongoing Installation of U2 High Pressure Governor System Q3, 2020 Ongoing
Installation of U2 Excitation System Q3, 2020 Ongoing, cubicles installed.
Installation of U2 Unit Protection and Control Q3, 2020 Ongoing, cabinets
installed. Generator U2 Modifications Q2, 2020 Q2, 2020 Complete U2 Re-Assembly Q3,2020 U2 Returned to Commercial Service Q4, 2020 U3 Oil Leak Deficiency Repair Q1, 2021 Balance of Plant Q2, 2021
5

APPENDIX C4 FBC UBO REFURBISHMENT PROJECT STATUS REPORT
PAGE 9
3. PROJECT COSTS 1
The following table outlines the project expenditures to June 30, 2020 and the forecast project expenditures to completion. 2
Table C4-3: Cost Summary 3
Description
Application/ Control Budget
Spent to Date Estimate to Complete Forecast Total to Complete Variance
(1) (2) (3) (4)=(2)+(3) (5)=((4)-(1))/(1) ($000s) (%)
Unit 4 6,634 8,043 11 8,055 21% Unit 3 4,079 6,235 182 6,417 57% Unit 2 5,641 3,918 2,529 6,447 14% Unit 1 8,050 8,268 (15) 8,253 3% Balance of Plant 860 429 1,589 2,018 135% Subtotal - Construction 25,264 26,893 4,296 31,190 23% Cost of Removal 1,880 1,456 233 1,689 -10% Project Contingency 3,771 - 229 229 -94% Subtotal- Construction & Removal 30,916 28,350 4,758 33,108 7% AFUDC 867 974 98 1,072 24% Total Project Cost 31,783 29,324 4,856 34,180 8%
4

APPENDIX C4 FBC UBO REFURBISHMENT PROJECT STATUS REPORT
PAGE 10
3.1.1 Project Cost Summary 1
Unit 4 – The forecast total for Unit 4 is currently $8.055 million, which represents a variance of 2 $1.421 million. This variance is mainly due to the higher than estimated costs to rewind the stator 3 and rotor, the as-found condition of the concealed components and the challenges associated 4 with installing a modern system in an antiquated operating plant. 5
Unit 3 - The forecast total for Unit 3 is currently $6.417 million, which represents a variance of 6 $2.388 million. This variance is mainly due to the additional upfront engineering costs as this 7 was the first unit to be refurbished, and the higher than estimated costs to rewind the stator and 8 rotor. Additionally, after the commissioning of Unit 3, a leak developed due to the rotor casting 9 flaws of the generator. 10
Unit 2 - The forecast total for Unit 2 is currently $6.447 million, which represents a variance of 11 $0.806 million. This variance is mainly due to the additional work required to modify the existing 12 stator equipment to facilitate the new braking system, the as-found condition of the concealed 13 components and the challenges associated with installing a modern system in an antiquated 14 operating plant. 15
Unit 1 - The forecast total for Unit 1 is currently $8.253 million, which represents a variance of 16 $0.203 million. The total variance on Unit 1 was offset by a positive variance of $0.813 million 17 savings on the GSU transformer replacement. 18
The common variances associated with Units 1-4 are the higher than estimated costs to rewind 19 the stator and rotor, the as-found condition of the concealed components and the challenges 20 associated with installing a modern system in an antiquated operating plant. The estimate to 21 rewind the generators was developed using a combination of actual costs from other rewound 22 units and vendor input. When the generator rewind work was tendered to three contractors, the 23 costs received were higher than budgeted. The costs to rewind all generators was approximately 24 $1.442 million higher than estimated. 25
Balance of Plant - The forecast total for the balance of plant work is currently $2.018 million, which 26 represents a variance of $1.158 million. The scope of this work has evolved as the project 27 progressed. The installation of new equipment and removal of old equipment within an operating 28 facility presents unanticipated challenges that could not be defined during the planning stage. 29 This variance is mainly due to the extra effort required to remove equipment and cabling which 30 was not initially expected to contain asbestos, and the additional scope created by the relocation 31 of plant equipment. 32
Cost of Removal – The forecast total for cost of removal is $1.683 million, which represents a 33 positive variance of $0.191 million. This variance is mainly due to lower than anticipated removals 34 for stator and rotor and the lower engineering and construction management costs during these 35 removals. 36
AFUDC – The forecast total for AFUDC is $1.072 million, which represents a variance of $0.205 37 million. The variance is mainly due to the advancing of engineering and equipment procurement 38

APPENDIX C4 FBC UBO REFURBISHMENT PROJECT STATUS REPORT
PAGE 11
early on in the project. This variance was offset by efficiencies in engineering and economies of 1 scale in procurement within the individual system costs. 2
Contingency – Project contingency has been utilized to offset the variences that were 3 encountered amoung the different Units. The remaining project contingency of $229 thousand is 4 for risks that may still be realized. 5
The project estimate was approved as Class 4 in the Annual Review for 2017 Rates because it 6 was difficult to achieve further definition without dismantling the units. The solutions developed 7 to address the uncertainties by FBC engineering and construction crews resulted in learnings 8 which were applied as the work progressed. FBC has realized efficiencies as the Project 9 progressed, but could not overcome the budget pressures caused by higher than planned rewind 10 costs, the condition of the turbine components, and the scope changes required during the 11 project. 12
PROJECT SCOPE CHANGE SUMMARY 13
Throughout detailed engineering, FBC made adjustments in order to address unforeseen 14 challenges and issues not considered during the planning stage. These adjustments and other 15 construction changes orders total approximately $1.763 million. 16
The following table is a summary of changes on the project over $50 thousand. 17
Table C4-4: Change Summary 18
Title Cost ($thousands) Status Comment
1 Revised Protection & Control Costs $102 Complete Detailed design required changes to
equipment 2 Rotor and Stator Quality
Control $70 Complete Third party oversight while Voith performed rewinds
3 Specialized Tool Purchase $223 Complete The dismantle of the generators
required pedestals and specialty tools 4 Turbine Condition
Assessments $125 Complete To reduce procurement risk the turbines were inspected prior to refurbishment
5 Additional Tailrace Gate $50 Complete
The additional tailrace gate was required to maintain outage water levels through freshet.
6 Washcar Trailer $112 Complete
The wash car initially planned for the project was condemned due to structural and infestation issues.
7 Trash Rack Upper Beam Repair $198 Complete Main deck supporting beam was
deteriorated an all four units 8 Governor Interface,
Actuators and Gate Locks
$551 Complete The governor actuator and its interfacing required redesign and replacement for all governor systems

APPENDIX C4 FBC UBO REFURBISHMENT PROJECT STATUS REPORT
PAGE 12
Title Cost ($thousands) Status Comment
9 Runner Plate Replacement Unit 4 Thrust Assembly
$93 Complete The as found condition of the runner plate did not meet specification and required replacement .
10 Unit 2 Generator Modifications $239 Complete
Equipment relocation and reconfiguration to facilitate new brakes and controls.
1
4. PROJECT RISKS 2
The project risk has significantly diminished from the last submitted report as the components are 3 completed. The remaining risks to the project are the balance of plant scope of work, the repair 4 of the oil leak on Units 2 and 3 rotor spiders, and the Covid-19 pandemic. 5
BALANCE OF PLANT 6
FBC engineering is currently finalizing the scope of work for the balance of plant work. As the 7 plant remains operational during the balance of plant activities, there is a risk that outages will 8 occur resulting in impacts to cost and schedule. 9
OIL LEAK REPAIR UNITS 2 AND 3 10
As outlined in section 1.4.1, Unit 3 which has already been refurbished, has an oil leak which 11 needs to be addressed. While refurbishing Unit 2, an identical unit, a solution will be implemented 12 and monitored throughout commissioning and early online operation. If the solution is successful, 13 Unit 3 will be taken offline in 2021 to be repaired. If not successful, Unit 2 and Unit 3 will have to 14 be re-assessed and likely have a new rotor spider built. The project is holding sufficient 15 contingency to repair Unit 3 based on the solution being implemented for Unit 2. 16
COVID-19 PANDEMIC 17
The COVID-19 pandemic has introduced challenges to construction as explained in Section 1.3.3; 18 however, many operational responses have been developed to continue construction activities. 19 The project team will continue the Covid operational responses, following the provincial 20 guidelines. It is unknown what effects the pandemic may have on the schedule or budget of the 21 project. 22

APPENDIX C4 FBC UBO REFURBISHMENT PROJECT STATUS REPORT
PAGE 13
5. CONCLUSION 1
The UBO Refurbishment Project continues to track well against scope and schedule. While the 2 forecast total project cost has increased to $34.108, the increase was required to maintain scope 3 to extend the units’ lives for an additional twenty years or more. The project has been successful 4 in reducing the safety and environmental risks associated with failures of the aged equipment. 5 FBC continues to focus on the safe and efficient execution of construction work, and on reducing 6 the risk profile of the project. 7

Appendix D DRAFT ORDER

File XXXXX | file subject 1 of 2
ORDER NUMBER
G-xx-xx
IN THE MATTER OF the Utilities Commission Act, RSBC 1996, Chapter 473
and
FortisBC Inc.
Annual Review for 2020 and 2021 Rates
BEFORE: [Panel Chair]
Commissioner Commissioner
on Date
ORDER
WHEREAS: A. On June 22, 2020, the British Columbia Utilities Commission (BCUC) issued its Decision and Order G-166-20
approving for FortisBC Inc. (FBC) a Multi-Year Rate Plan (MRP) for 2020 through 2024 (the MRP Decision). In accordance with the MRP Decision, FBC is to conduct an Annual Review process to set rates for each year;
B. By Order G-303-19, dated November 28, 2019, the BCUC approved a 1.0 percent general rate increase from 2019 rates on an interim and refundable/recoverable basis, effective January 1, 2020, pending a decision on the MRP;
C. By letter dated July 20, 2020, FBC proposed a regulatory timetable for its annual review for permanent 2020 and 2021 rates;
D. By Order G-211-20 dated August 11, 2020, the BCUC established the regulatory timetable and on August 19, 2020, FBC submitted its Annual Review for 2020 and 2021 Rates Application (Application);
E. In the Application, FBC’s revenue requirements for 2020 result in a general rate increase of 1.93 percent from 2019 rates. FBC requests approval to make the existing interim rates permanent, effective January 1, 2020, and to capture the revenue deficiency greater than the 1.0 percent general rate increase already incorporated into the interim rates in the existing 2018 & 2019 Revenue Surplus deferral account as an offset to prior years’ revenue surpluses;
F. The Application also requests approval of a general rate increase of 6.37 percent from 2020 rates, effective January 1, 2021, after drawing down the 2018-2019 Revenue Surplus deferral account; and
G. The BCUC has reviewed the Application and evidence filed in the proceeding and considers that approval is warranted.

Order G-xx-xx
File XXXXX | file subject 2 of 2
NOW THEREFORE pursuant to sections 44.2(3) and 59 to 61 of the Utilities Commission Act, for the reasons attached as Appendix A to this order, the BCUC orders as follows: 1. FortisBC Inc. (FBC) is approved to make permanent the existing 2020 interim rates, effective January 1, 2020.
2. FBC’s permanent rate increase of 6.37 percent, effective January 1, 2021 is approved.
3. The following deferral account requests are approved:
a. Creation of rate base deferral accounts for the following regulatory proceedings:
i. The Annual Reviews during the MRP term, with balances to be amortized in the following year;
ii. FBC’s 2021 Long-Term Electric Resource Plan;
iii. FBC’s 2020 Cost of Service Analysis filing; and
iv. Participation in BCUC-Initiated Inquiries, with balances to be amortized in the following year;
b. Creation of a rate base deferral account to capture costs related to the Indigenous Relations Agreement (Huth Substation);
c. Creation of a rate base deferral account to capture the costs of the 2021 triennial Mandatory Reliability Standards audit;
d. Draw down of the existing 2018-2019 Revenue Surplus deferral account in the amount of $3.326 million in 2020 and $1.410 million in 2021, bringing the account balance to zero; and
e. The previously approved 2020 Revenue Requirement Application deferral account is renamed to the 2020-2024 MRP Application deferral account, and amortized over a five-year period beginning January 1, 2020.
4. FBC is approved to record COVID-19 incremental costs and related savings from 2020 and 2021 into the previously approved COVID-19 Customer Recovery Fund Deferral Account as discussed in Section 12.2.1 of the Application.
5. The BCUC accepts the capital expenditures for the Playmor Substation Upgrade Project, as described in Appendix B to the Application.
DATED at the City of Vancouver, in the Province of British Columbia, this (XX) day of (Month Year). BY ORDER (X. X. last name) Commissioner