Embed Size (px)
Citation preview

Q2 2021 Earnings
Presentation
August 12, 2021

Jacksonville, FL
1
DisclaimerGeneral
Forward-Looking Statements
This presentation may contain forward-looking statements and information relating to
expected future events and the Company’s financial and operating results and projections,
including statements regarding the Company’s growth and performance goals and
expectations, including, in particular, targeted returns, expected future performance, and
growth projections, that involve risks and uncertainties. Such forward-looking information is
typically indicated by the use of words such as “will”, “may”, “expects” or “intends”. The
forward-looking statements and information contained in this presentation include
statements regarding the Company’s strategic priorities; expected or targeted financial and
operating performance including project timing, projected cash flow; projected NOI and
other projected performance metrics; the ability of the Company to extend debt maturities
and refinance debt; FFO growth and the potential drivers of that growth; expectations for
the growth in the business; the availability and quantum of debt reduction opportunities
and the Company’s ability to avail itself of them;; the Company's future balance sheet
composition; the anticipated quantum and availability of leverage to facility home
acquisitions; the anticipated value of the Company's assets and managed portfolios; the
potential up-size of the Homebuilder Direct and SFR JV-2 JVs; the Company's acquisition
program and the anticipated pace, number and timing of home acquisitions; Tricon’s
growth strategies and projections for its single-family rental business; and the Company’s
capital raising targets and anticipated future investment vehicles. These statements reflect
the Company’s current intentions and strategic plans however, the items noted may not
occur in line with the Company’ expectations or at all. These statements are based on
management’s current expectations, intentions and assumptions which management
believes to be reasonable having regard to its understanding of prevailing market
conditions and the current terms on which investment opportunities may be available
In regards to the strategic goals, targets and potential value creation opportunities
presented herein, these are based on the assumed impact of the growth drivers, proposed
transactions or events, and sources of cash flow described, on the assumption that other
drivers of performance will not deteriorate over the relevant period, and on the specific
assumptions concerning performance and market conditions noted specifically herein.
There can be no assurance that such growth drivers, transactions, events or cash flow will
occur, be realized, or have their anticipated impact, and the assumptions underlying such
statements are subject to known and unknown risks, including market risks, which may not
be in the Company’s control, and therefore there can be no assurance that actual
performance will align with the Company’s targets or that the value creation opportunities
presented herein will be realized.
Projected returns and financial performance are based in part on projected cash flows for
incomplete projects as well as future company plans. Numerous factors, many of which
are not in the Company’s control, and including known and unknown risks, general and
local market conditions and general economic conditions (such as prevailing interest rates
and rates of inflation) may cause actual performance and income to differ from current
projections. Accordingly, although we believe that our anticipated future results,
performance or achievements expressed or implied by the forward-looking statements and
information are based upon reasonable assumptions and expectations, the reader should
not place undue reliance on forward-looking statements and information. If known or
unknown risks materialize, or if any of the assumptions underlying the forward-looking
statements prove incorrect, actual results may differ materially from management
expectations as projected in such forward-looking statements. Examples of such risks are
described in the Company’s continuous disclosure materials from time-to-time, as
available on SEDAR at www.sedar.com. The Company disclaims any intention or
obligation to update or revise any forward-looking statements, whether as a result of new
information, future events or otherwise, unless required by applicable law.
You are advised to read this disclaimer carefully before reading, accessing or making any
other use of the information included herewith. These materials are not an offer or the
solicitation of an offer to purchase any securities or make any investment. This
presentation includes information about Tricon Residential Inc. and its subsidiaries and
investees (together, the “Company”) as of June 30, 2021, unless otherwise stated. These
materials should be reviewed in conjunction with the Company’s Financial Statements and
Management Discussion and Analysis for the periods ending June 30, 2021 and are
subject to the detailed information and disclaimers contained therein. All dollar amounts
are expressed in U.S. Dollars unless otherwise stated.
The Company measures the success of its business in part by employing several key
performance indicators that are not recognized under IFRS including net operating income
(“NOI”), funds from operations (“FFO”), core funds from operations (“core FFO”), adjusted
funds from operations (“AFFO”), and assets under management (“AUM”). These indicators
should not be considered an alternative to IFRS financial measures, such as net income.
As non-IFRS financial measures do not have standardized definitions prescribed by IFRS,
they are less likely to be comparable with other issuers or peer companies. A description
of the non-IFRS measures used by the Company in measuring its performance is included
in its Management Discussion and Analysis available on the Company’s website at
www.triconresidential.com and on SEDAR at www.sedar.com.
This presentation may contain information and statistics regarding the markets in which
the Company and its investees operate. Some of this information has been obtained from
market research, publicly available information, and industry publications. This information
has been obtained from sources believed to be reliable, but the accuracy or completeness
of such information has not been independently verified by the Company and cannot be
guaranteed. Disclosure of past performance is not indicative of future result.

Q2/21 Key Takeaways
• Long-term tailwinds support our Sun Belt
middle-market strategy
• Single-family rental delivered another
quarter of strong operating performance
• Acquired a record 1,504 single-family
rental homes primarily through organic
resale channels
• Growth initiatives supported by $2 billion
of third-party equity commitments
announced year-to-date; path to 50,000
SFR homes in place
• Surpassed de-leveraging target
significantly ahead of schedule
2
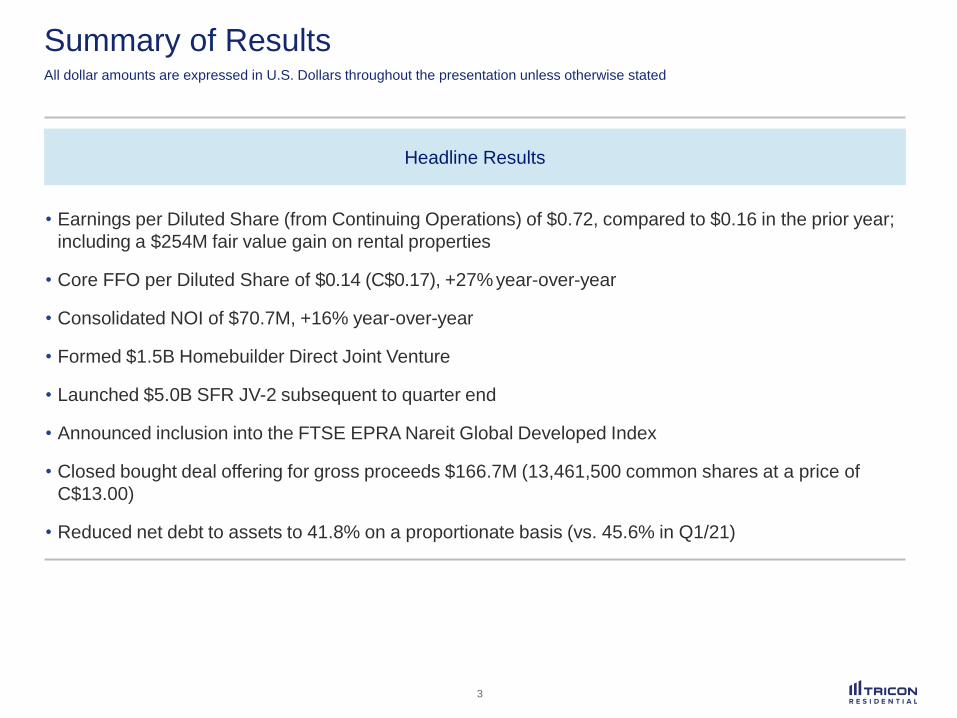
Summary of ResultsAll dollar amounts are expressed in U.S. Dollars throughout the presentation unless otherwise stated
• Earnings per Diluted Share (from Continuing Operations) of $0.72, compared to $0.16 in the prior year;
including a $254M fair value gain on rental properties
• Core FFO per Diluted Share of $0.14 (C$0.17), +27% year-over-year
• Consolidated NOI of $70.7M, +16% year-over-year
• Formed $1.5B Homebuilder Direct Joint Venture
• Launched $5.0B SFR JV-2 subsequent to quarter end
• Announced inclusion into the FTSE EPRA Nareit Global Developed Index
• Closed bought deal offering for gross proceeds $166.7M (13,461,500 common shares at a price of
C$13.00)
• Reduced net debt to assets to 41.8% on a proportionate basis (vs. 45.6% in Q1/21)
Headline Results
3

Summary of ResultsAll dollar amounts are expressed in U.S. Dollars throughout the presentation unless otherwise stated
• Continued to grow single-family rental portfolio, with a record 1,504 homes acquired in Q2/21
• Increased Tricon’s proportionate NOI by 10%, to $54.1M
• Same home metrics include 5.5% NOI growth (6.1% excluding Texas storm impact), 66.6% NOI
margin, 97.6% occupancy, 22.6% annualized turnover and 8.0% blended rent growth
• U.S. multi-family rental: operating metrics exceeded pre-pandemic levels including 5.9% same
property NOI growth, 59.1% NOI Margin, 95.6% occupancy, 49.6% annualized turnover and 10.2%
blended rent growth
• For-sale housing: distributed $19.7M of cash to Tricon in the quarter (including performance fees)
• Canadian multi-family build-to-core: 4,600-unit development pipeline with The Taylor, West Don Lands
(Blocks 3, 4, 7, 8 & 10), The Ivy and The James under construction
Single-Family Rental
Other Business Segments
4

5
Tricon’s Sun Belt Markets are OutperformingTricon’s key markets have outperformed the national average population growth over the long term, and exceeded
the national average employment growth in the recent year.
15%
15%
14%
12%
10%
10%
9%
8%
7%
6%
Texas
Nevada
Florida
Arizona
South Carolina
Georgia
North Carolina
Tennessee
National Average
California
Population Growth from 2010 to
2020 in Tricon’s Key Markets1
1. U.S. Census Data, April 2021.
2. U.S. Bureau of Labor Statistics, July 2021.
Employment Growth from 2020 to
2021 in Tricon’s Key Markets2
3%
4%
5%
5%
5%
5%
6%
6%
6%
12%
National Average
Florida
Georgia
California
Arizona
South Carolina
North Carolina
Texas
Tennessee
Nevada

Rent Growth is Keeping Pace with Home Price AppreciationTricon’s new move-in rent growth has kept pace with or exceeded home price appreciation for the past four years,
showing a high level of correlation and supporting a very strong long-term buying opportunity, even in instances of
robust HPA.
6.1%
3.0%
4.2%
15.4%
7.6%
8.5%
9.9%
14.8%
0%
2%
4%
6%
8%
10%
12%
14%
16%
18%
2018 2019 2020 2021 YTD
Tricon's Annualized Home Price Appreciation Tricon's Average New Move-in Rent Growth
Tricon’s SFR Portfolio Home Price Appreciation & Average New Move-in Rent Growth
6
1
1. Includes capital expenditures.

7
Note: Refer to “General” and “Forward-Looking Statements” on Page 1.
1. Total assets based on reported fair market value of consolidated assets as of Q2/21.
$6.5Bof Real Estate
Assets1
Residential Development (5%)
Canadian multi-family build-to-core
and U.S. single-family rental build-to-
rent growth strategies, expected to
remain near 5% of assets
Multi-family Rental (2%)
Expected to remain below
5% of assets
Single-family Rental (93%)
Core balance sheet growth
strategy expected to account
for over 90% of our assets 93%5%
2%
Canada3%
U.S.97%
Balance Sheet Asset Composition
Single-family rental is Tricon’s core business and represents more than 90% of our assets

MLS
Traditional resale
home channel
Off Market
Includes emerging
“iBuyer” direct
sales channel
which allows
sellers to bypass
MLS
Scattered New
Homes
Acquisition of
newly-built
homes
Existing New
Home
Communities
Acquisition of
dedicated single-
family rental home
communities
Development of
New Home
Communities
Development of
dedicated single-
family rental home
communities
Portfolios
Leverage Tricon’s
industrywide
relationships and
strong operating
platform to buy
stabilized homes in
bulk
SFR Acquisition Channels
Tricon has expanded its single-family rental acquisition program across multiple channels and
formed complementary joint ventures with third-party investors to scale faster
8
Investment Vehicle
THPAS JV-1
Homebuilder Direct JV
SFR JV-2
~25,000
Units
~50,000
Units
18,000
4,250
100% growth
projected over
the next 3
years
~25,000
2,500
~25,000
Refer to the Forward-Looking Statements on Page 1
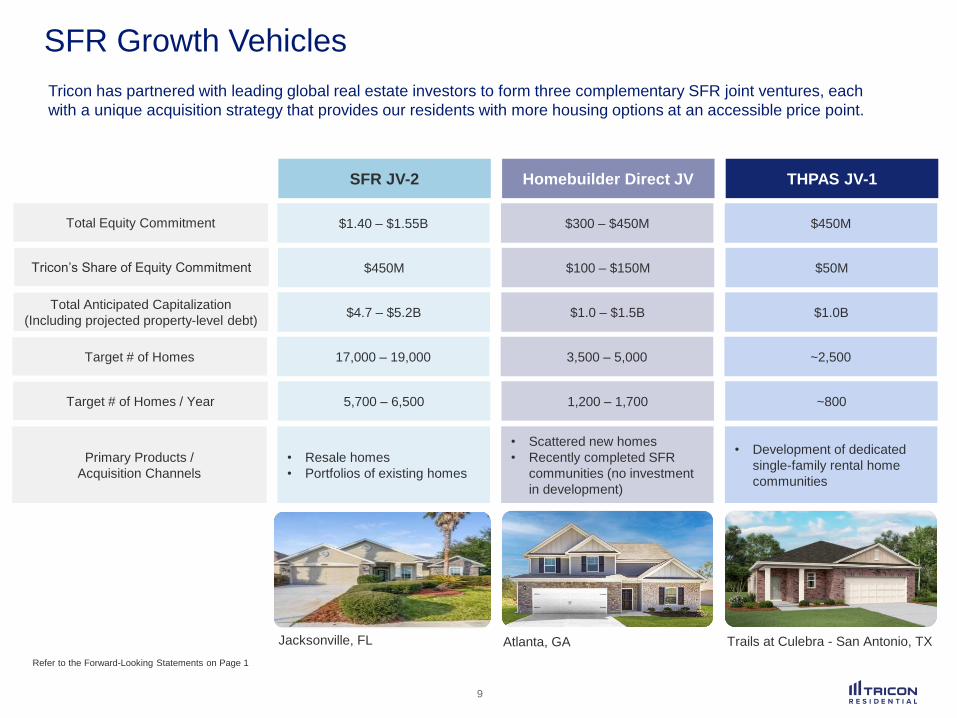
SFR Growth Vehicles
Tricon has partnered with leading global real estate investors to form three complementary SFR joint ventures, each
with a unique acquisition strategy that provides our residents with more housing options at an accessible price point.
9
SFR JV-2 Homebuilder Direct JV THPAS JV-1
$1.40 – $1.55B $300 – $450M $450M
$450M $100 – $150M $50M
$4.7 – $5.2B $1.0 – $1.5B $1.0B
17,000 – 19,000 3,500 – 5,000 ~2,500
5,700 – 6,500 1,200 – 1,700 ~800
Total Equity Commitment
Tricon’s Share of Equity Commitment
Total Anticipated Capitalization
(Including projected property-level debt)
Target # of Homes
Target # of Homes / Year
• Resale homes
• Portfolios of existing homes
• Scattered new homes
• Recently completed SFR
communities (no investment
in development)
• Development of dedicated
single-family rental home
communities
Primary Products /
Acquisition Channels
Trails at Culebra - San Antonio, TXJacksonville, FL Atlanta, GA
Refer to the Forward-Looking Statements on Page 1

Expanded Acquisition OpportunityTricon’s three active SFR joint ventures allow the company to have a broader acquisition “buy-box” in terms of target
markets and price point, which should enable Tricon to more than double its organic acquisition volume to over 7,000
homes per year.
10
SFR JV-2Homebuilder
Direct JVTHPAS JV-1SFR JV-1
12 active markets
$215K average acquisition cost1 and $1,535 average rent
~5.5-6.0% blended acquisition cap rates
~3,500 target organic acquisitions per year
21 active markets
$315K average acquisition cost1 and $1,900 average rent
~5.0-5.5% blended acquisition cap rates
7,000+ target organic acquisitions per year
LAS VEGASSOUTHERN CALIFORNIA
PHOENIX
RENO
DALLAS-FORT WORTH
HOUSTON
ATLANTA
SAN ANTONIO
AUSTIN
DENVER
NASHVILLE
ORLANDOTAMPA
CHARLOTTE
HOUSTON
RALEIGH
INDIANAPOLIS
SOUTHEAST
FLORIDA
JACKSONVILLE
COLUMBIA
SOUTHERNCALIFORNIA
NORTHERNCALIFORNIA
LAS VEGAS
PHOENIX
SAN ANTONIO
DALLAS-FORT WORTH
ATLANTA
NASHVILLE
LAS VEGASSOUTHERN CALIFORNIA
PHOENIX
RENO
DALLAS-FORT WORTH
HOUSTON
ATLANTA
SAN ANTONIO
AUSTIN
DENVER
NASHVILLE
ORLANDOTAMPA
CHARLOTTE
HOUSTON
RALEIGH
INDIANAPOLIS
JACKSONVILLE
COLUMBIA
SAN ANTONIO
DALLAS-FORT WORTH
ATLANTA
NASHVILLE
2018 – 2021 Acquisition Program 2022 – 2025 Acquisition Program
AUSTIN
GREENSBORO
GREENVILLE
RENO
1. Includes cost of renovations.

ESG Update
Following the release of our inaugural ESG annual report in May 2021, Tricon engaged in several initiatives this quarter
in support of our commitment to sustainability.
Indigenous Hub Ground Breaking
• In June 2021, construction began on
Ontario's first purpose-built Indigenous
Hub, a part of Tricon’s West Don
Lands project.
• The Hub will help meet critical health
care, spiritual, employment, training
and family support needs for the
Indigenous community.
First GRESB Submission
• In June 2021, Tricon completed its
inaugural GRESB submission.
• Private results anticipated by Q4/21
will underpin the development and
execution of our ESG strategy, with
public results expected by Q4/22.
11
Environmental
30% Club & BlackNorth Initiative
• Tricon has met or exceeded
commitments to both the 30% Club
Canada campaign and BlackNorth
Initiative's CEO pledge to increase
gender diversity and black, indigenous
and people of colour (BIPOC)
representation at board and senior
management levels.
Social GovernanceEnvironmental Social Governance

C$3.01
C$11.87
2012 2013 2014 2015 2016 2017 2018 2019 2020 Q2/21
Jacksonville, FL
Performance Dashboard1
1. Refer to “General” and “Forward-Looking Statements” on Page 1, USD/CAD exchange rate used are 1.2470 at June 30, 2021.
2. All debt figures are presented net of cash and exclude Tricon’s outstanding 5.75% convertible debentures.
3. The comparative period results have been recast to present the consolidated results in conformity with the current period presentation. Please refer to MD&A for further details.
Adopt consolidated accounting
Adopt more conventional company-
wide real estate performance metrics,
such as FFO / AFFO per share
Enhance financial disclosure practices
Adopt comprehensive ESG plan
$0.29
$0.503
$0.27
$0.52 -$0.57
2019 2020 2021 YTD 2022 Target
Grow FFO per Share Grow Book Value per ShareIncrease Third-Party AUM
Reduce Leverage2 Improve Reporting
DebtEquity
Tricon has exceeded
its leverage target of
50-55% net debt to
assets on a
consolidated basis,
ahead of schedule
$1.0B
2021 YTD 2022 Target
$2.0B
17% annualized growth since entering
SFR in 2012
Book Value per Share does not fully capture the value
from embedded growth in underlying investments or the
Private Funds & Advisory business segment
Target 10%+ compounded
annual growth
✓
✓
✓
✓
2019 Consolidated
Leverage
72% increase year-
over-year
Tricon has exceeded its target of
raising $1B of fee-bearing equity
capital ahead of schedule, with $2B
raised year-to-date
Q2/21 Consolidated
Leverage
46%54%
$1.3B SFR
$0.4B U.S. MF
$0.3B CA MF
42% proportionate
leverage
12
61%
39%

Jacksonville, FL
Select Financial Metrics
1. The comparative period results have been recast to present the consolidated results in conformity with the current period presentation. Please refer to MD&A for further details.
For the three months ended June 30, 2021
(in thousands of U.S. dollars) 2021 20201 %Y/Y
Financial highlights on a consolidated basis
Net income (loss), from continuing operations $ 146,322 $ 30,165 385%
Diluted earnings (loss) per share from continuing
operations$ 0.72 $ 0.16 350%
2021 20201 %Y/Y
Non-IFRS measures on a proportionate basis
Core funds from operations (Core FFO) $ 35,726 $ 24,199 48%
Adjusted funds from operations (AFFO) $ 28,226 $ 18,316 54%
Core FFO per share $ 0.14 $ 0.11 27%
AFFO per share $ 0.11 $ 0.09 22%
Core FFO payout ratio 33% 41% (19%)
AFFO payout ratio 42% 52% (19%)
Weighted average shares outstanding – diluted 252,512 211,678 19%
13
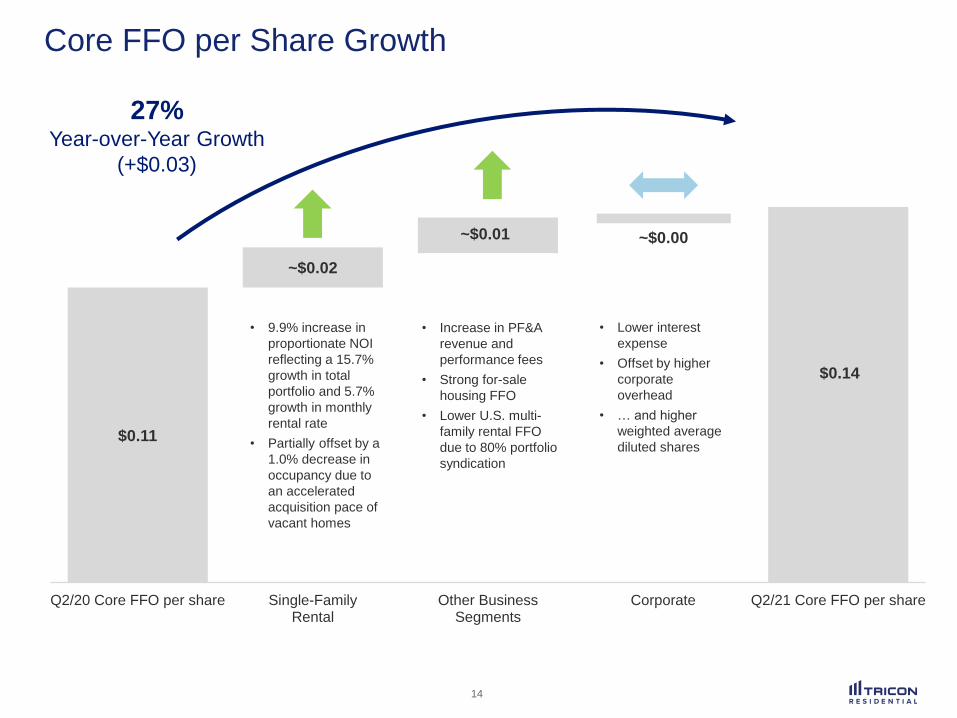
$0.11
~$0.02
~$0.01
$0.14
Q2/20 Core FFO per share Single-FamilyRental
Other BusinessSegments
Corporate Q2/21 Core FFO per share
• 9.9% increase in
proportionate NOI
reflecting a 15.7%
growth in total
portfolio and 5.7%
growth in monthly
rental rate
• Partially offset by a
1.0% decrease in
occupancy due to
an accelerated
acquisition pace of
vacant homes
• Increase in PF&A
revenue and
performance fees
• Strong for-sale
housing FFO
• Lower U.S. multi-
family rental FFO
due to 80% portfolio
syndication
• Lower interest
expense
• Offset by higher
corporate
overhead
• … and higher
weighted average
diluted shares
Core FFO per Share Growth
27%Year-over-Year Growth
(+$0.03)
~$0.00
14

• $25M SFR JV-1 Credit Facility – to
be repaid with cash on hand
$25
$1,218
$417
$312
$886
$440
$0
$200
$400
$600
$800
$1,000
$1,200
$1,400
2021 2022 2023 2024 2025 2026 2027 andthereafter
CorporateSFRDevelopment
$0
Consolidated Debt Profile
Debt Maturity Schedule1
(in millions of USD)
Tricon has minimal debt maturing this year and continues to extend its debt maturity profile.
• $221M SFR Term Loan
• $458M 2017-1 SFR Securitization
• $504M SFR JV-1 Warehouse Facilities
15
Blended rate of 3.09% with potential
to be refinanced at lower prevailing
interest rates beginning in Q3 2021
1. This assumes the exercise of all available extension options.

Strong Liquidity Position
Tricon’s current liquidity position, recurring cash flows and projected cash sources provide ample funding for
near-term growth initiatives.
16
Refer to the Forward-Looking Statements on Page 1. This page reflects significant cash sources and commitments but may not reflect all sources and uses of cash.
1. Includes SFR JV-2 and Homebuilder Direct JV where Tricon has a 33% share.
2. Includes THPAS JV-1 where Tricon has an 11% share.
3. Includes existing Canadian multi-family build-to-core commitments where Tricon has an average 45% share.
4. Common share cash dividend represents total dividend of $11.8M less dividend reinvestment plan of $1.6M.
Recurring Cash Flows
Q2/21 AFFO annualized run rate $ 113M
Annualized common + preferred
dividend4 (58M)
Annualized AFFO
less dividends$ 55M
Net cash projected from residential
developments (1-5 years)$ 185M
Undrawn credit facility +
unrestricted cash571M
Total cash sources $ 756M
Multi-year Cash Sources
Single-family rental acquisitions1 $ 600M
Build-to-rent development2 40M
Canadian multi-family build-to-core3 80M
Total cash commitments $ 720M
Over
~3 years
Multi-year Cash Commitments
Path to $100M+ annually
with in place growth plans
~
~
~
~

$44.9M $47.3M
+5.4% ($3.6M)Revenue Growth +5.0% ($1.1M)
Expense Growth
Q2/21 NOI
5.5%Year-over-Year Same
Home NOI Growth
(6.1% excluding the Texas
storm impact)
• 10 bps occupancy
increase (to 97.6%)
• 5.4% higher average
monthly rent ($1,431 to
$1,509)
• Stable bad debt expense
(1.7% of total revenue in
Q2/21 vs. 1.6% in Q2/20)
• $0.7M increase in
ancillary fees and other
revenue
• $0.5M increase in
property taxes due to
higher assessed property
values
• $0.6M increase in repairs
and maintenance largely
driven by winter storm
repairs
• Partially offset by $0.5M
reduction in turnover
costs due to lower
annualized turnover and
more capital
improvements
• Includes $0.3M of Texas
storm repair expense
Revenues Expenses
Single-Family Rental – Q2/21 Same Home NOI Drivers
Q2/20 NOI
5.0%
increase
in rental
revenue
17

97.5%
97.6% 97.6%
97.5%
Apr-21 May-21 Jun-21 Jul-21
Jacksonville, FL
Single-Family Rental – Post Q2/21 Operational Update
1. Metrics reflect Tricon’s proportionate share of the managed portfolio and exclude limited partners’ interests in the SFR JV-1 portfolio.
Same Home Average Occupancy1 Same Home Average Rent Growth1
4.4% 4.7% 4.9% 4.9%
16.3% 16.7%17.8%
20.7%
8.0% 7.9%8.6%
Apr-21 May-21 Jun-21 Jul-21
9.3%
Sustaining consistent near-record occupancy
throughout the pandemic
Average
occupancy
for past 8
quarters:
97.0%
Re-leasing spreads driven by strong market demand,
limited supply of homes and loss-to-lease while continuing
to self-govern on renewals
18
New Move-In
Blended
Renewal
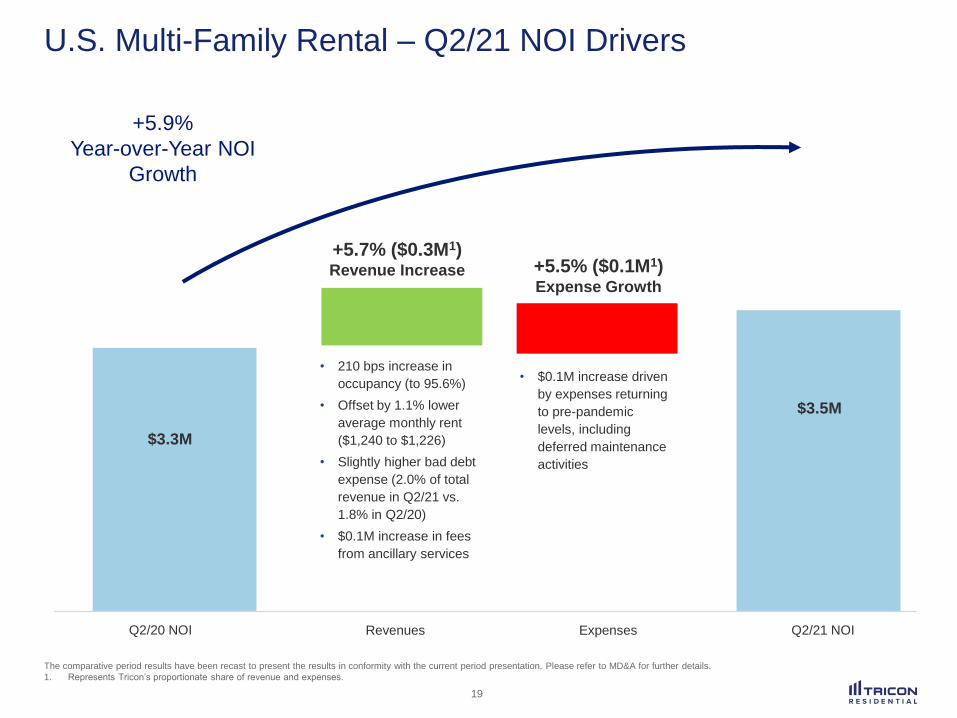
$3.3M
$3.5M
Q2/20 NOI Q2/21 NOI
+5.7% ($0.3M1)Revenue Increase +5.5% ($0.1M1)
Expense Growth
• 210 bps increase in
occupancy (to 95.6%)
• Offset by 1.1% lower
average monthly rent
($1,240 to $1,226)
• Slightly higher bad debt
expense (2.0% of total
revenue in Q2/21 vs.
1.8% in Q2/20)
• $0.1M increase in fees
from ancillary services
• $0.1M increase driven
by expenses returning
to pre-pandemic
levels, including
deferred maintenance
activities
Revenues Expenses
U.S. Multi-Family Rental – Q2/21 NOI Drivers
+5.9%
Year-over-Year NOI
Growth
19
The comparative period results have been recast to present the results in conformity with the current period presentation. Please refer to MD&A for further details.
1. Represents Tricon’s proportionate share of revenue and expenses.

Jacksonville, FL
Value Creation Opportunity
20
Refer to “General” and “Forward-Looking Statements” on Page 1, USD/CAD exchange rate used are 1.2470 at June 30, 2021.
1. Reflects book value per basic share outstanding as of Q2/21.
2. Current IFRS NAV includes development properties and The Selby.
3. Valuation based on Tricon’s proportionate share of in-place NOI as of Q2/21; cap rate represents current market stabilized cap rate
for the portfolio’s Sun Belt markets as per Green Street Real Estate Analytics, July 2021.
4. Assumes development yield of 4.75% on cost and market stabilized cap rate for downtown Class A multi-family assets. NAV per
share is based on 209M basic shares outstanding. The CPP JV currently only includes the Queen & Ontario project.
Strategy
Investment
Vehicles
IFRS Book
Value1
Value Creation
Opportunity
Stabilized
U.S.
Multi-family
• Explore operating
synergies with SFR
• Enhance scale of
operations
• Provide complementary
Sun Belt residential offering
to third-party investors
$1.3B JV (incl. debt)
with two institutional
investors
(20% Tricon)
$121M
(C$0.72 / share)
~$185M value
assuming 4.00%
cap rate3
(C$1.10 / share)
Canadian
Multi-family
Development
• Provide exposure and
scale to high-growth
Toronto residential market
to third-party investors
C$500M JV with
CPP Investments5
(30% Tricon) +
separate accounts
$202M2
(C$1.20 / share)
~$560M value upon
stabilization
(C$3.30 / share)4
U.S.
Residential
Development
• Harvest legacy for-sale
housing investments
Commingled funds +
separate accounts
$154M
(C$0.91 / share)
$295M net distributions
expected
(C$1.75 / share)
Total
$478M
current value
(C$2.83 / share)
$1.0B
potential value
(C$6.15 / share)
2X+ value
creation
opportunity
Tricon’s U.S. multi-family portfolio and residential developments represent a meaningful source of potential value
creation for shareholders.

Positioned for Sustainable Growth
21
1,500+ acquisitions in Q2, on
track for 2,000+ acquisitions
in Q3 and clear path to
growing SFR to 50,000 units
over three years.
Vast Growth
Opportunity
Strong balance sheet liquidity
position combined with strategic
third-party capital will allow
Tricon to enhance scale and
operational efficiency, reduce
balance sheet exposure to
development activities, and
drive return on equity for its
shareholders.
Well Capitalized
Business Plan
Tech-Enabled
Operating Platform
Committed to improving the
resident experience through a
centralized, technology-enabled
operating platform and
innovative approach to rental
housing.

Gary Berman
Managing Director,
Capital Markets
Wissam Francis
Executive Vice President
and Chief Financial Officer
Wojtek Nowak
President and
Chief Executive Officer
triconresidential.com