Embed Size (px)
Citation preview

Q2 2021 Earnings
July 28, 2021
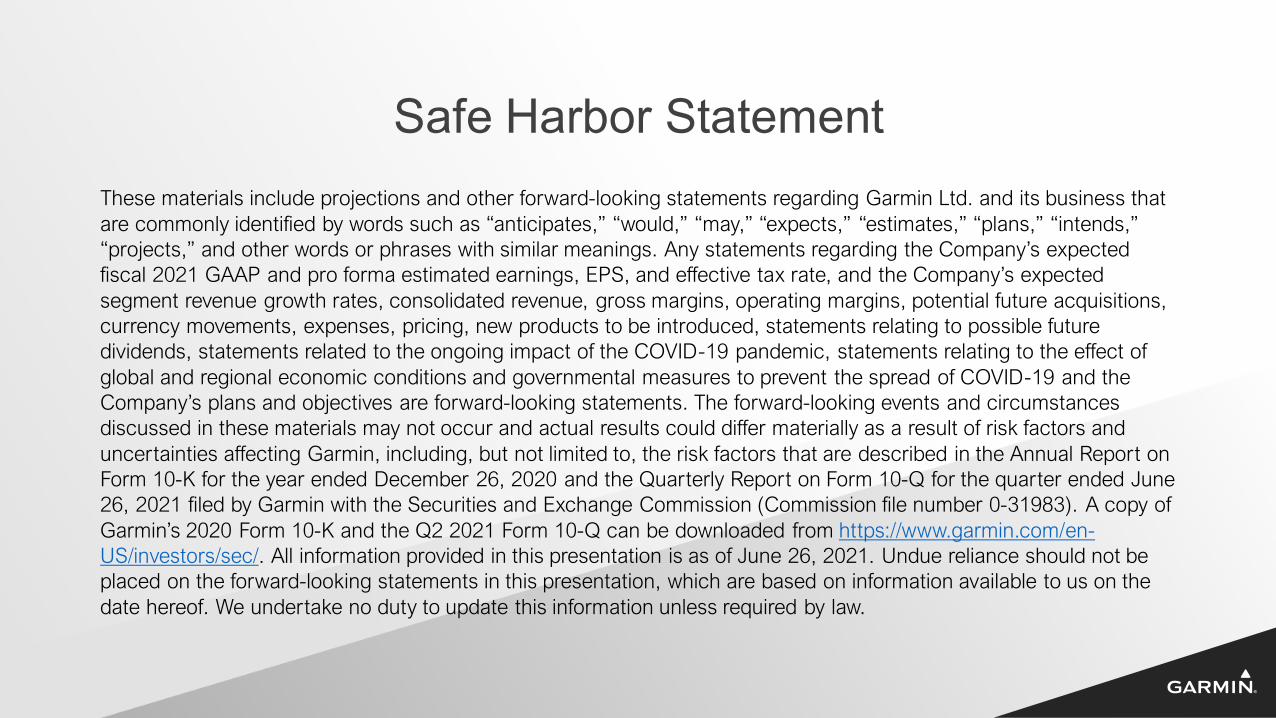
These materials include projections and other forward-looking statements regarding Garmin Ltd. and its business that are commonly identified by words such as “anticipates,” “would,” “may,” “expects,” “estimates,” “plans,” “intends,” “projects,” and other words or phrases with similar meanings. Any statements regarding the Company’s expected fiscal 2021 GAAP and pro forma estimated earnings, EPS, and effective tax rate, and the Company’s expected segment revenue growth rates, consolidated revenue, gross margins, operating margins, potential future acquisitions, currency movements, expenses, pricing, new products to be introduced, statements relating to possible future dividends, statements related to the ongoing impact of the COVID-19 pandemic, statements relating to the effect of global and regional economic conditions and governmental measures to prevent the spread of COVID-19 and the Company’s plans and objectives are forward-looking statements. The forward-looking events and circumstances discussed in these materials may not occur and actual results could differ materially as a result of risk factors and uncertainties affecting Garmin, including, but not limited to, the risk factors that are described in the Annual Report on Form 10-K for the year ended December 26, 2020 and the Quarterly Report on Form 10-Q for the quarter ended June 26, 2021 filed by Garmin with the Securities and Exchange Commission (Commission file number 0-31983). A copy of Garmin’s 2020 Form 10-K and the Q2 2021 Form 10-Q can be downloaded from https://www.garmin.com/en-US/investors/sec/. All information provided in this presentation is as of June 26, 2021. Undue reliance should not be placed on the forward-looking statements in this presentation, which are based on information available to us on the date hereof. We undertake no duty to update this information unless required by law.
Safe Harbor Statement

Business Update
Cliff PemblePresident and CEO

BUSINESS INSIGHTS
• Strong demand for our products
• Investing in people, facilities, and equipment to support growth
• Updated revenue guidance: $4.9B
Q2 2021Consolidated Revenue
$1.33B53% y/y growth
Operating income
$371M97% y/y growth
Operating margin
28.0%

Fitness
SEGMENT INSIGHTS
28%Operating margin
62% y/y growth$117MOperating income
40% y/y growth$413MRevenue
• Growth across all product categories led by cycling and advanced wearables
• Launched new wearables
• Updated growth guidance: +17%
Q2 2021

• Growth across all product categories led by adventure watches
• Launched our smallest dive watch
• Updated growth guidance: +17%
SEGMENT INSIGHTS
Revenue
$323M57% y/y growth
Operating income
$122M81% y/y growth
Operating margin
38%OutdoorQ2 2021

• Growth in both OEM and aftermarket product categories
• Awarded the 2020 Robert J. Collier Trophy
• Announced acquisition of AeroData
• Updated growth guidance: +10%
SEGMENT INSIGHTS
Revenue
$181M43% y/y growth
Operating income
$51M226% y/y growth
Operating margin
28%AviationQ2 2021

• Strong demand across multiple categories led by chartplotters
• Integration with Mercury marine engines
• Launched the MSC 10 marine satellite compass
• Updated growth guidance: +27%
SEGMENT INSIGHTS
Revenue
$262M66% y/y growth
Operating income
$90M106% y/y growth
Operating margin
34%MarineQ2 2021

• Growth in both OEM and consumer auto products
• Launched first connected dash cam
• Updated growth guidance: +15%
SEGMENT INSIGHTS
Revenue
$148M74% y/y growth
Operating loss
($8M)Operating margin
(6%)AutoQ2 2021

Financial Update
Doug BoessenCFO and Treasurer
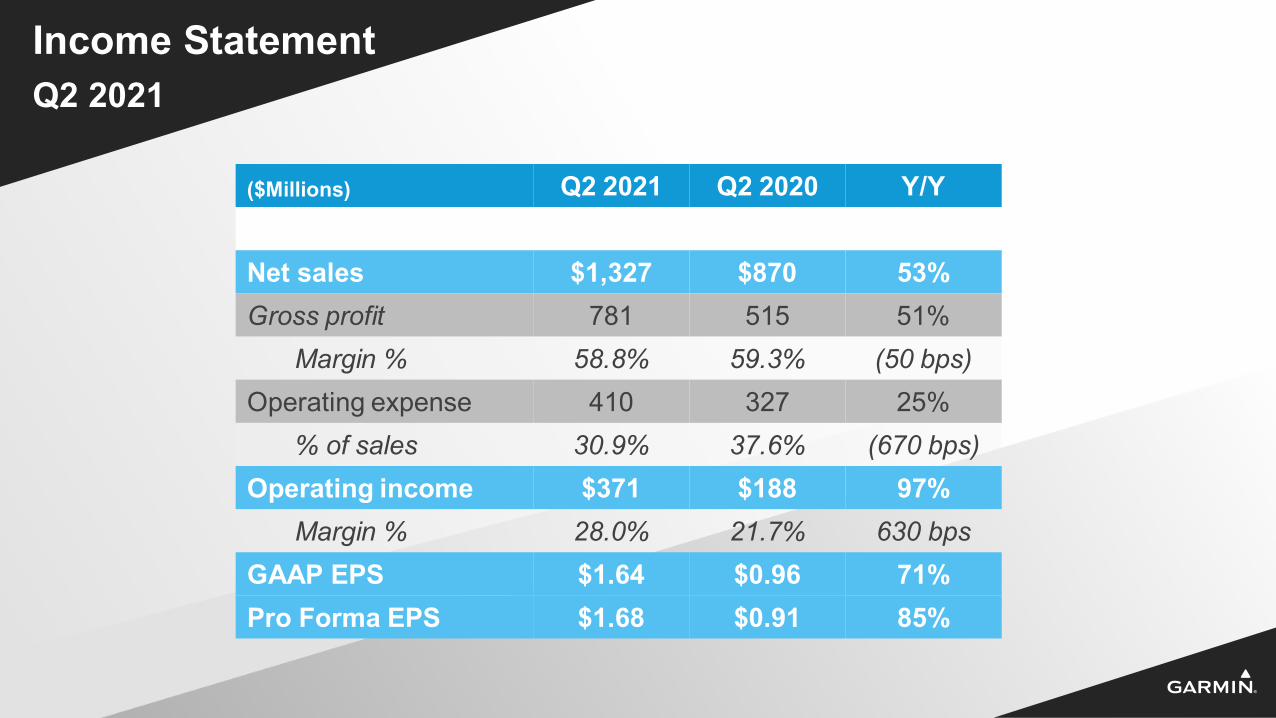
Income Statement
($Millions) Q2 2021 Q2 2020 Y/Y
Net sales $1,327 $870 53%Gross profit 781 515 51%
Margin % 58.8% 59.3% (50 bps)Operating expense 410 327 25%
% of sales 30.9% 37.6% (670 bps)Operating income $371 $188 97%
Margin % 28.0% 21.7% 630 bpsGAAP EPS $1.64 $0.96 71%Pro Forma EPS $1.68 $0.91 85%
Q2 2021
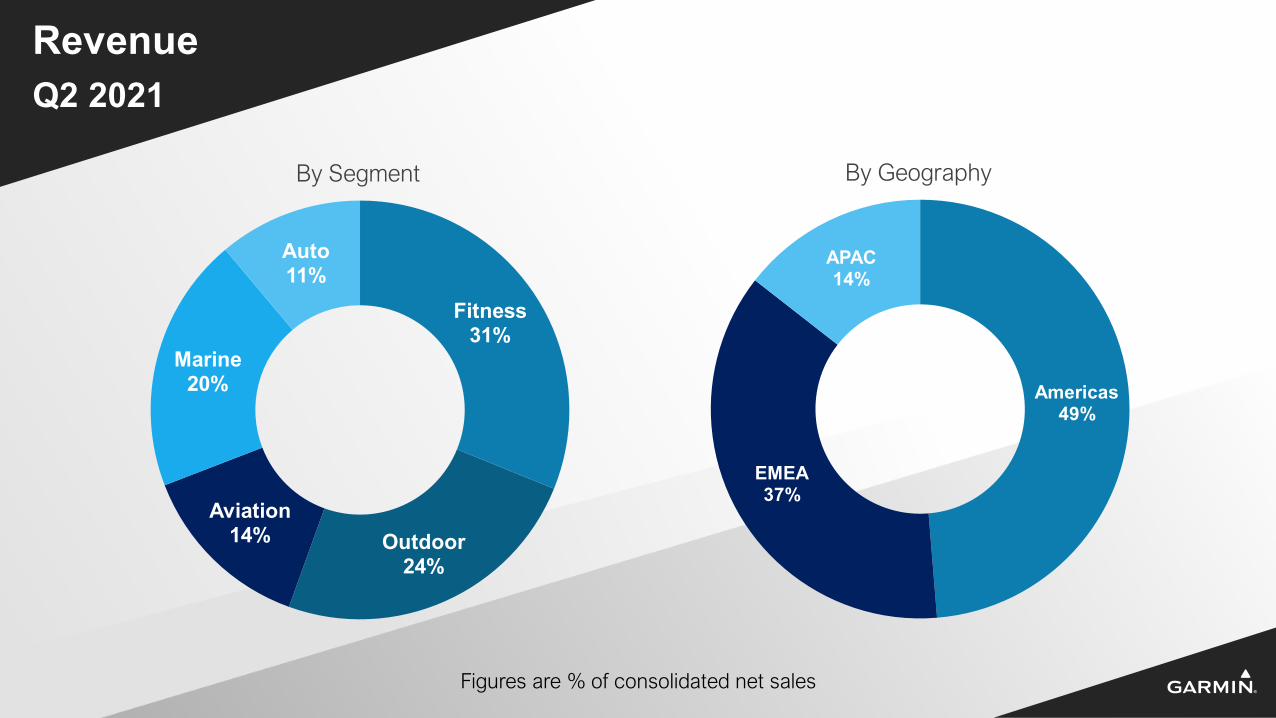
Revenue
Figures are % of consolidated net sales
Fitness31%
Outdoor24%
Aviation14%
Marine20%
Auto11%
By Segment
Americas49%
EMEA37%
APAC14%
By Geography
Q2 2021
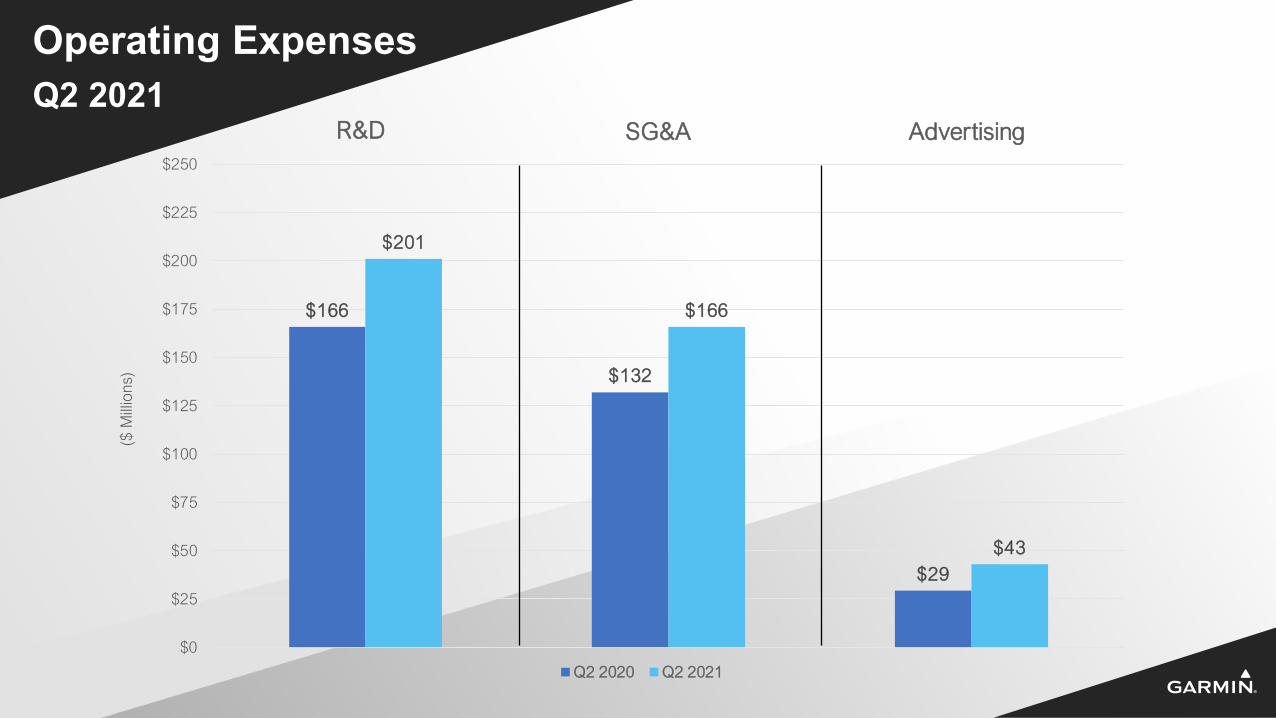
Operating Expenses
$166
$201
$0
$25
$50
$75
$100
$125
$150
$175
$200
$225
$250
R&D
$132
$166
SG&A
Q2 2020 Q2 2021
$29$43
AdvertisingQ2 2021
($ M
illio
ns)
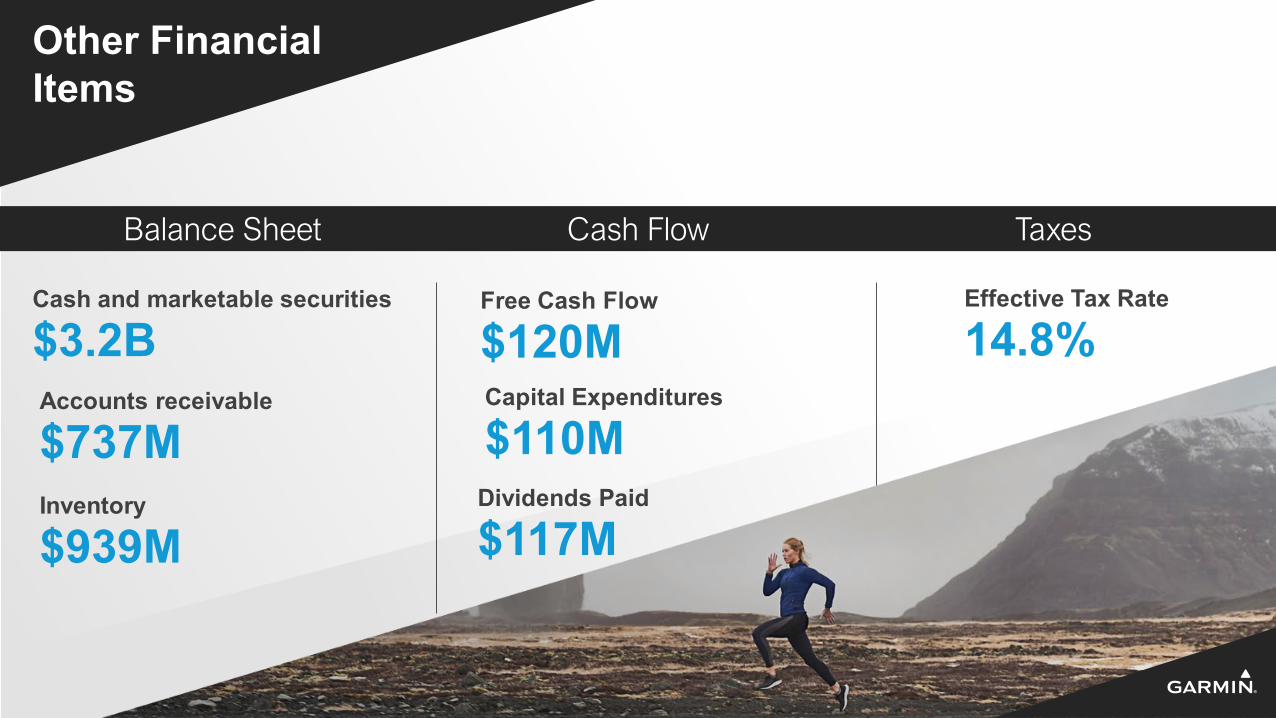
Balance Sheet Cash Flow Taxes
Other FinancialItems
14.8%Effective Tax Rate
$3.2BCash and marketable securities
$737MAccounts receivable
$939MInventory
$120MFree Cash Flow
$117MDividends Paid
$110MCapital Expenditures
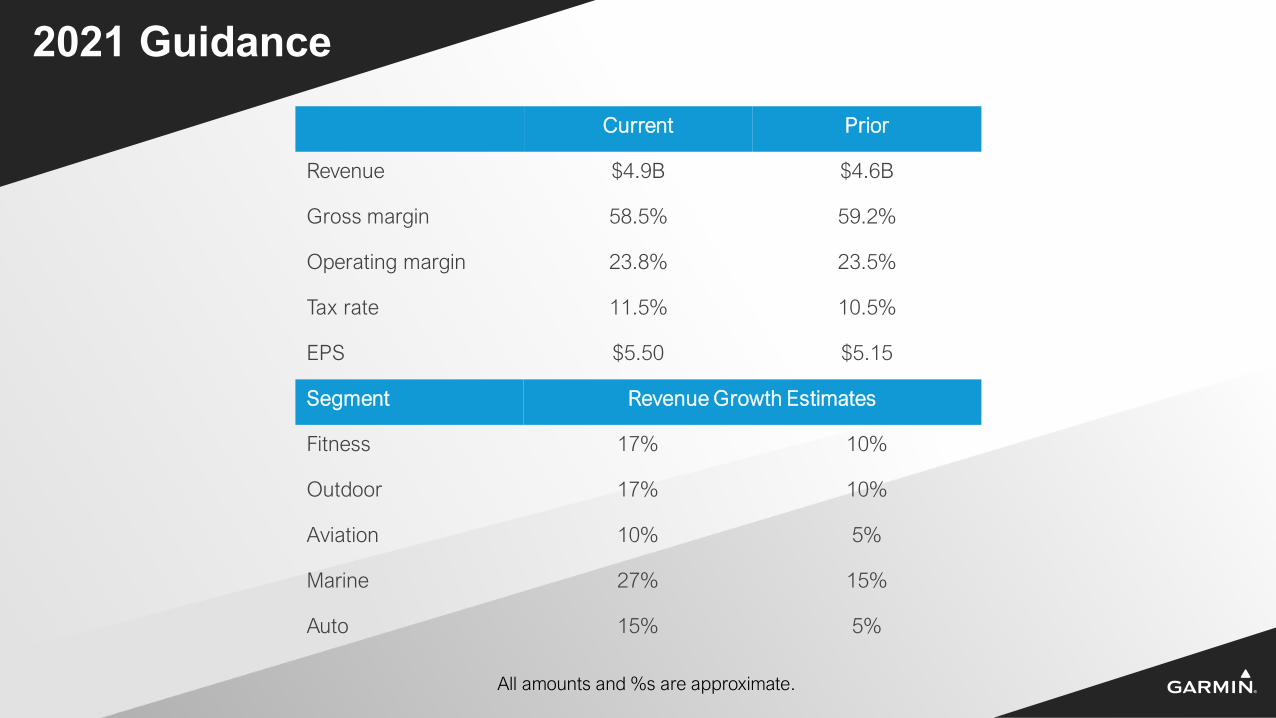
2021 GuidanceCurrent Prior
Revenue $4.9B $4.6B
Gross margin 58.5% 59.2%
Operating margin 23.8% 23.5%
Tax rate 11.5% 10.5%
EPS $5.50 $5.15
Segment Revenue Growth Estimates
Fitness 17% 10%
Outdoor 17% 10%
Aviation 10% 5%
Marine 27% 15%
Auto 15% 5%
All amounts and %s are approximate.


Cash Flow
AppendixJuly 28, 2021
Non-GAAP Financial Information
To supplement our financial results presented in accordance with GAAP, this release includes the following measures defined by the Securities and Exchange Commission as non-GAAP financial measures: pro forma effective tax rate, pro forma net income (earnings) per share and free cash flow. These non-GAAP measures are not based on any comprehensive set of accounting rules or principles and should not be considered a substitute for, or superior to, financial measures calculated in accordance with GAAP, and may be different from non-GAAP measures used by other companies, limiting the usefulness of the measures for comparison with other companies. Management believes providing investors with an operating view consistent with how it manages the Company provides enhanced transparency into the operating results of the Company, as described in more detail by category below.
The tables in the subsequent slides provide reconciliations between the GAAP and non-GAAP measures.
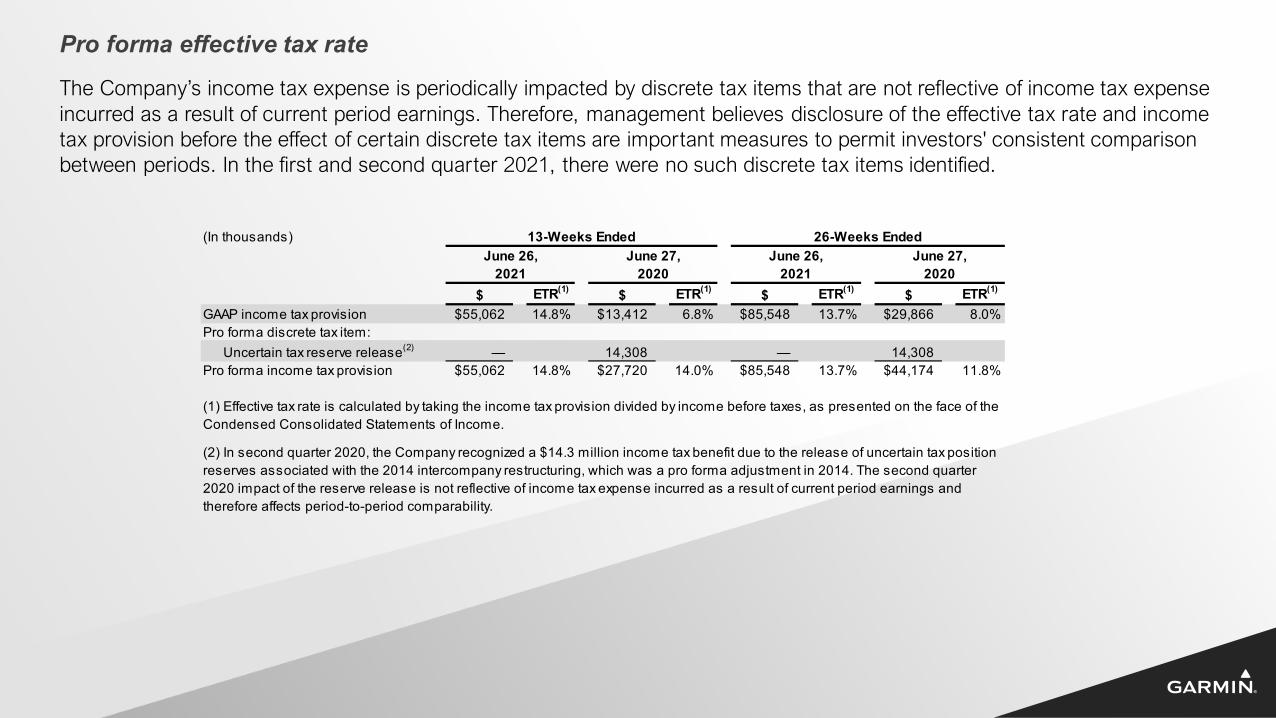
The Company’s income tax expense is periodically impacted by discrete tax items that are not reflective of income tax expenseincurred as a result of current period earnings. Therefore, management believes disclosure of the effective tax rate and income tax provision before the effect of certain discrete tax items are important measures to permit investors' consistent comparison between periods. In the first and second quarter 2021, there were no such discrete tax items identified.
Pro forma effective tax rate
(In thousands)
$ ETR(1) $ ETR(1) $ ETR(1) $ ETR(1)
GAAP income tax provision 55,062$ 14.8% 13,412$ 6.8% 85,548$ 13.7% 29,866$ 8.0%Pro forma discrete tax item:
Uncertain tax reserve release(2) — 14,308 — 14,308 Pro forma income tax provision 55,062$ 14.8% 27,720$ 14.0% 85,548$ 13.7% 44,174$ 11.8%
26-Weeks Ended13-Weeks Ended
(1) Effective tax rate is calculated by taking the income tax provision divided by income before taxes, as presented on the face of the Condensed Consolidated Statements of Income.
(2) In second quarter 2020, the Company recognized a $14.3 million income tax benefit due to the release of uncertain tax position reserves associated with the 2014 intercompany restructuring, which was a pro forma adjustment in 2014. The second quarter 2020 impact of the reserve release is not reflective of income tax expense incurred as a result of current period earnings and therefore affects period-to-period comparability.
June 27, June 27,2020 2020
June 26,2021
June 26,2021
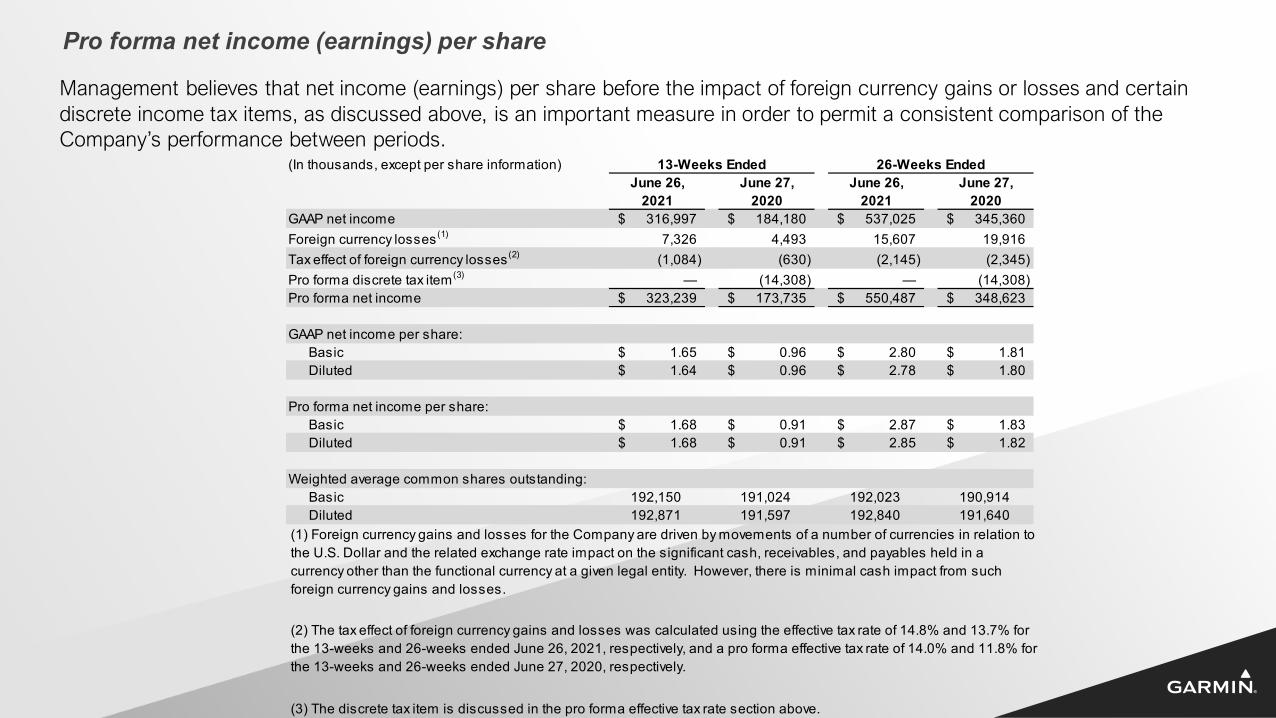
Management believes that net income (earnings) per share before the impact of foreign currency gains or losses and certain discrete income tax items, as discussed above, is an important measure in order to permit a consistent comparison of the Company’s performance between periods.
Pro forma net income (earnings) per share
(In thousands, except per share information)June 26, June 27, June 26, June 27,
2021 2020 2021 2020GAAP net income 316,997$ 184,180$ 537,025$ 345,360$ Foreign currency losses(1) 7,326 4,493 15,607 19,916 Tax effect of foreign currency losses(2) (1,084) (630) (2,145) (2,345) Pro forma discrete tax item(3) — (14,308) — (14,308) Pro forma net income 323,239$ 173,735$ 550,487$ 348,623$ GAAP net income per share:
Basic 1.65$ 0.96$ 2.80$ 1.81$ Diluted 1.64$ 0.96$ 2.78$ 1.80$
Pro forma net income per share:
Basic 1.68$ 0.91$ 2.87$ 1.83$ Diluted 1.68$ 0.91$ 2.85$ 1.82$
Weighted average common shares outstanding:
Basic 192,150 191,024 192,023 190,914Diluted 192,871 191,597 192,840 191,640
13-Weeks Ended 26-Weeks Ended
(1) Foreign currency gains and losses for the Company are driven by movements of a number of currencies in relation to the U.S. Dollar and the related exchange rate impact on the significant cash, receivables, and payables held in a currency other than the functional currency at a given legal entity. However, there is minimal cash impact from such foreign currency gains and losses.
(2) The tax effect of foreign currency gains and losses was calculated using the effective tax rate of 14.8% and 13.7% for the 13-weeks and 26-weeks ended June 26, 2021, respectively, and a pro forma effective tax rate of 14.0% and 11.8% for the 13-weeks and 26-weeks ended June 27, 2020, respectively.
(3) The discrete tax item is discussed in the pro forma effective tax rate section above.
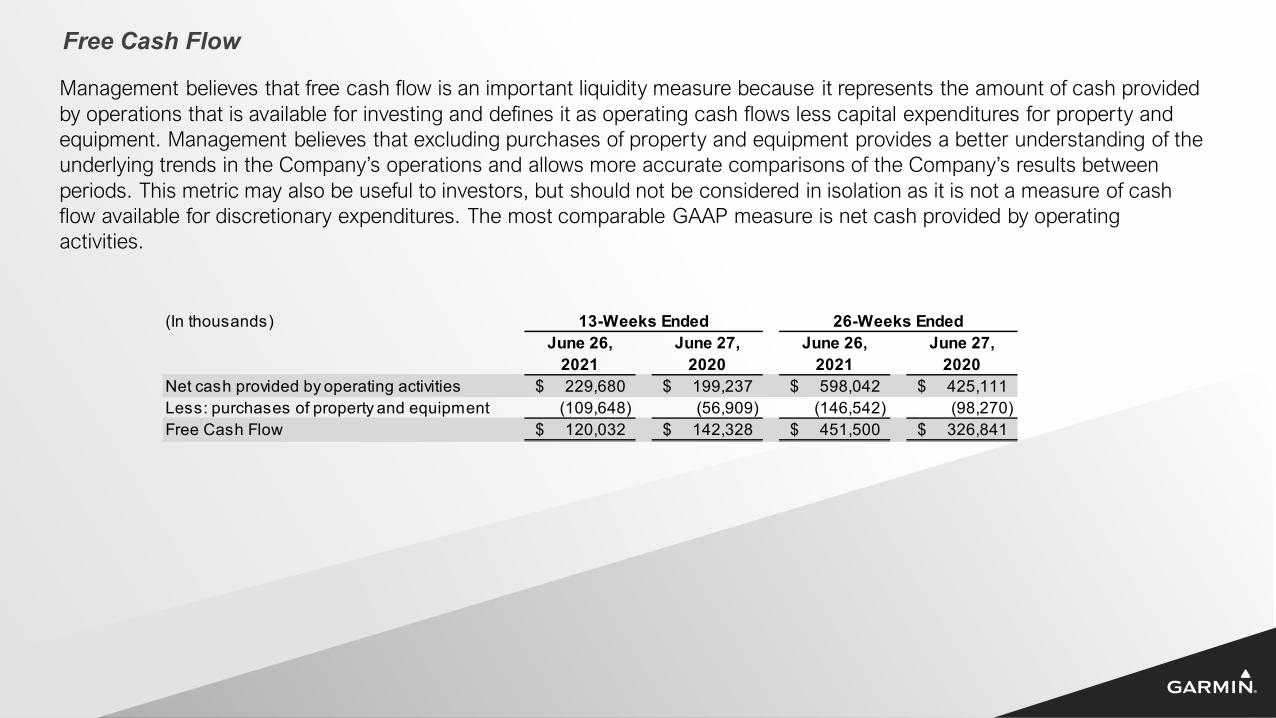
Management believes that free cash flow is an important liquidity measure because it represents the amount of cash provided by operations that is available for investing and defines it as operating cash flows less capital expenditures for property and equipment. Management believes that excluding purchases of property and equipment provides a better understanding of the underlying trends in the Company’s operations and allows more accurate comparisons of the Company’s results between periods. This metric may also be useful to investors, but should not be considered in isolation as it is not a measure of cash flow available for discretionary expenditures. The most comparable GAAP measure is net cash provided by operating activities.
Free Cash Flow
(In thousands)June 26, June 27, June 26, June 27,
2021 2020 2021 2020Net cash provided by operating activities 229,680$ 199,237$ 598,042$ 425,111$ Less: purchases of property and equipment (109,648) (56,909) (146,542) (98,270) Free Cash Flow 120,032$ 142,328$ 451,500$ 326,841$
13-Weeks Ended 26-Weeks Ended
The forward-looking financial measures in our 2021 guidance provided above do not consider the potential future net effect of foreign currency exchange gains and losses, certain discrete tax items and any other impacts that may be identified as pro forma adjustments in calculating the non-GAAP measures described above.
The estimated impact of foreign currency gains and losses cannot be reasonably estimated on a forward-looking basis due to the high variability and low visibility with respect to non-operating foreign currency exchange gains and losses and the relatedtax effects of such gains and losses. The impact on diluted net income per share of foreign currency gains and losses, net oftax effects, was $0.07 per share for the 26-weeks ended June 26, 2021.
At this time, management is unable to determine whether or not significant discrete tax items will occur in fiscal 2021 or anticipate the impact of any other events that may be considered in the calculation of non-GAAP financial measures.
Forward-looking Financial Measures