Embed Size (px)
Citation preview
Augmented Reality Visualizationof Archeological Data
Daniel Eggert, Dennis Hücker and Volker Paelke
Abstract One intention of archeology is the documentation and reconstruction ofhistorical development of mankind. The extracted data of an archeological exca-vation is usually spatial referenced and visualized with the help of maps or geo-graphical information system. Both, paper maps and digital representations havepartly complementary strengths and shortcomings in their application. WithAugmented Reality, both Systems can be combined and complement each other.This Work presents a concept for augmenting archeological paper maps with 3Dmodels and additional interaction options. Besides the presentation of contents in3D space for museum visitors, the identified examples of usage include the gen-eration of new contents to support the archeological work on an excavation site.The mobile application ARAC Maps (Augmented Reality for ArcheologicalContent) realizes this concept based on commercially available devices with theAndroid operation system.
Keywords Augmented reality � Archaeological mapping � 3D geovisualization �Google android
1 Introduction
Augmented Reality (AR) is a technology that extends the real environment withcomputer-generated content. The history of AR can be traced back to the devel-opment of the ultimate display, an AR system with a head-mounted display
D. Eggert (&) � D. Hücker � V. PaelkeInstitut für Kartographie und Geoinformatik, Leibniz Universität Hannover, Hanover,Germanye-mail: [email protected]
M. Buchroithner et al. (eds.), Cartography from Pole to Pole,Lecture Notes in Geoinformation and Cartography, DOI: 10.1007/978-3-642-32618-9_15,� Springer-Verlag Berlin Heidelberg 2014
203
developed by Sutherland (1968). Progress in computer technology development inthe early 1990s led to an expansion of research and development in AR tech-nology, but AR applications remained limited to laboratories or special installa-tions for a long time, mostly due to the high performance hardware required.Mobile augmented reality was finally enabled on a large scale by the developmentof devices like smartphones and tablets that combine potent processing andgraphics hardware with the necessary sensors.
With the help of AR visualizations information can be interactively commu-nicated from a totally new perspective. Archaeology is one of the most promisingapplications that can be improved by AR presentations. It is the nature ofarchaeology, that the structures and objects (artifact’s) uncovered by excavationsare often incomplete or damaged. Reconstruction of past structures and artifacts istherefore an important task, especially when the results are to be communicated toa general audience. Typical presentation formats in museums range from postersand maps to actual physical reconstructions. However, physical models are costlyand are therefore not always viable. More common are reconstructions presentedas smaller scale models or the use of rendered 3D models in video presentations.While such models and videos can present relevant information more effectivelythan 2D depictions, they limit the transfer of knowledge because they are static andnot interactive. Interactive 3D visualizations, and especially AR applications, canimprove the communication process because they enable interaction and can alsodirectly tie the presented information to the existing site or artifacts. AR systemshave many potential benefits: due to the proliferation of high performancesmartphones and tablets the required hardware is relatively cheap and many vis-itors can in fact use their own device. An additional aspect is the simplifiednavigation compared to purely virtual environments. Because the AR content isspatially linked to physical artifacts the users can employ their everyday naviga-tion skills to explore the content and do not need to learn a new set of controls.Often interesting 3D content such as reconstructions are already available as aresult of the archaeological work but only a small portion can be presented usingconventional presentation formats. AR thus has high potential to make a largerselection of contents available, to dynamically adapt the presented content to userpreferences and to enable user interaction with the presented information. Thechallenge is to make the implementation of such AR systems practical and inex-pensive for the potential content creators, e.g. archaeologists or museum curators.
2 Related Work
Our work presented in this paper relates both to the augmentation of maps and theuse of augmented reality in the presentation of archaeological content. While mostAR systems aim to augment a physical environment, the augmentation of indi-vidual objects in general and paper maps in particular has been studied by severalresearchers in the past. An even larger application area has been the use of AR
204 D. Eggert et al.
techniques within an archaeological context. We can therefore only provide anoverview of several projects that are of particular relevance to our system.
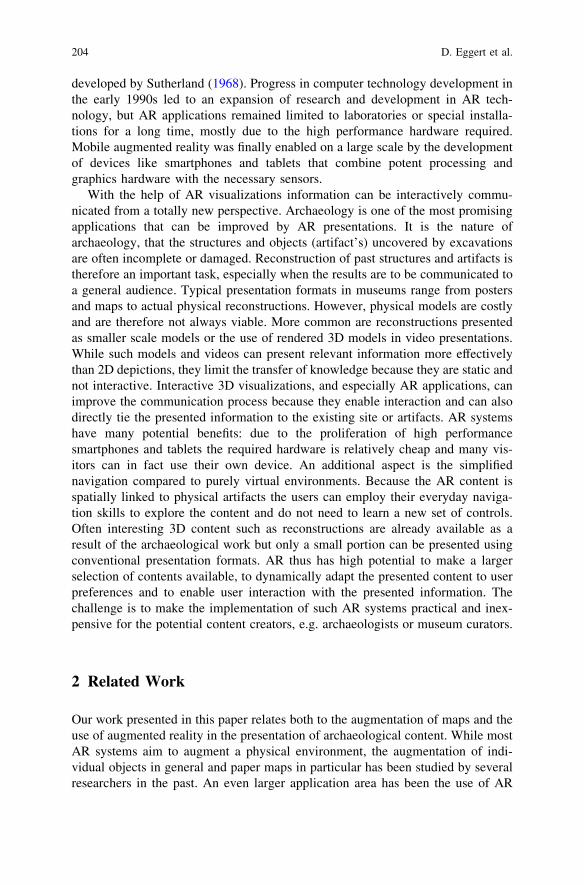
ARCHEOGUIDE (Augmented Reality based Cultural Heritage On-siteGUIDE) was an EU-funded project to develop an AR system for visitors to anarchaeological site (Vlahakis et al. 2002). The project was centered around theidea of providing visitor to an archaeological site with a mobile AR system,consisting of a portable computer, a HMD (head-mounted-display) equipped witha camera and a GPS sensor for positioning. Based on the interests and require-ments of the user the system would then propose a route through the excavationsite. During the site visit the system superimposes 3D models of reconstructedmonuments into the users view, using the HMD, shown in Fig. 1. Users caninteract with the presented content through pointing gestures, e.g. to obtainadditional audio information on an object of interest. While ARCHEOGUIDEused custom hardware like head-mounted-displays, later projects have alsoinvestigated the use of off-the-shelve hardware in similar application settings. Thework on AR in archaeology has focused on the presentation of information tomuseum visitors. The use of AR as a tool to support archaeologists in the field hasremained largely unexplored.
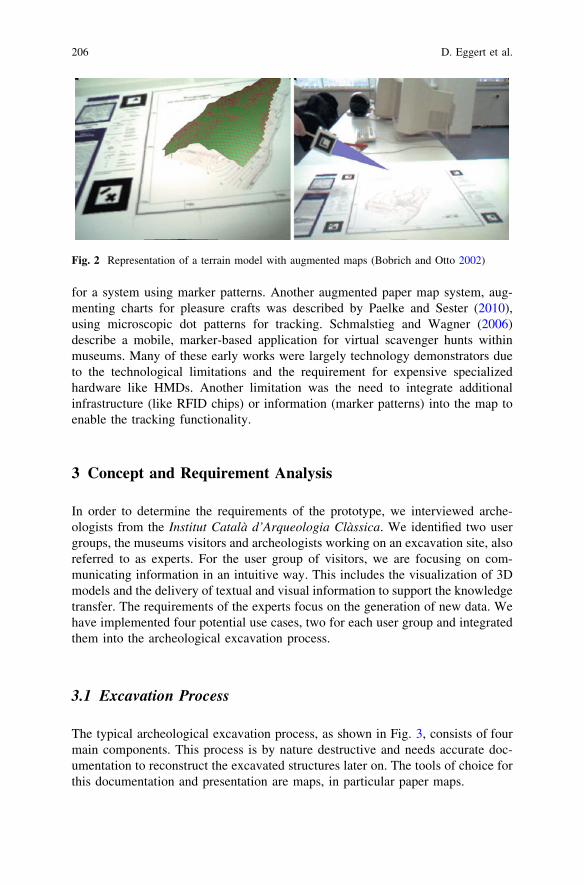
While systems like ARCHEOGUIDE are designed to work in the specific siteof interest applications that augment artifacts like maps have the advantage thatthey can be used in many sites (e.g. museums, classrooms) simultaneously. One ofthe first systems for augmenting paper maps with the AR technologies wasdeveloped by Bobrich and Otto (2002). Their system used an optical trackingsystem with specific marker patterns that were attached to the paper map todetermine the position of the user with respect to the map. The display of the 3Daugmentation information was realized with a HMD. For interaction the user hadthe opportunity to use additional markers within the field of view of the camera inorder to trigger predefined actions, as shown in Fig. 2. As the application dependedon a desktop PC for the tracking and rendering the mobility of the user waslimited.
Mobile systems for augmenting paper maps were presented by Reilly et al.(2006) for a system that used RFID chips for tracking and Schöning et al. (2006)
Fig. 1 Example of on site augmentation technique, generated by ARCHEOGUIDE
Augmented Reality Visualization of Archeological Data 205
for a system using marker patterns. Another augmented paper map system, aug-menting charts for pleasure crafts was described by Paelke and Sester (2010),using microscopic dot patterns for tracking. Schmalstieg and Wagner (2006)describe a mobile, marker-based application for virtual scavenger hunts withinmuseums. Many of these early works were largely technology demonstrators dueto the technological limitations and the requirement for expensive specializedhardware like HMDs. Another limitation was the need to integrate additionalinfrastructure (like RFID chips) or information (marker patterns) into the map toenable the tracking functionality.
3 Concept and Requirement Analysis
In order to determine the requirements of the prototype, we interviewed arche-ologists from the Institut Català d’Arqueologia Clàssica. We identified two usergroups, the museums visitors and archeologists working on an excavation site, alsoreferred to as experts. For the user group of visitors, we are focusing on com-municating information in an intuitive way. This includes the visualization of 3Dmodels and the delivery of textual and visual information to support the knowledgetransfer. The requirements of the experts focus on the generation of new data. Wehave implemented four potential use cases, two for each user group and integratedthem into the archeological excavation process.
3.1 Excavation Process
The typical archeological excavation process, as shown in Fig. 3, consists of fourmain components. This process is by nature destructive and needs accurate doc-umentation to reconstruct the excavated structures later on. The tools of choice forthis documentation and presentation are maps, in particular paper maps.
Fig. 2 Representation of a terrain model with augmented maps (Bobrich and Otto 2002)
206 D. Eggert et al.
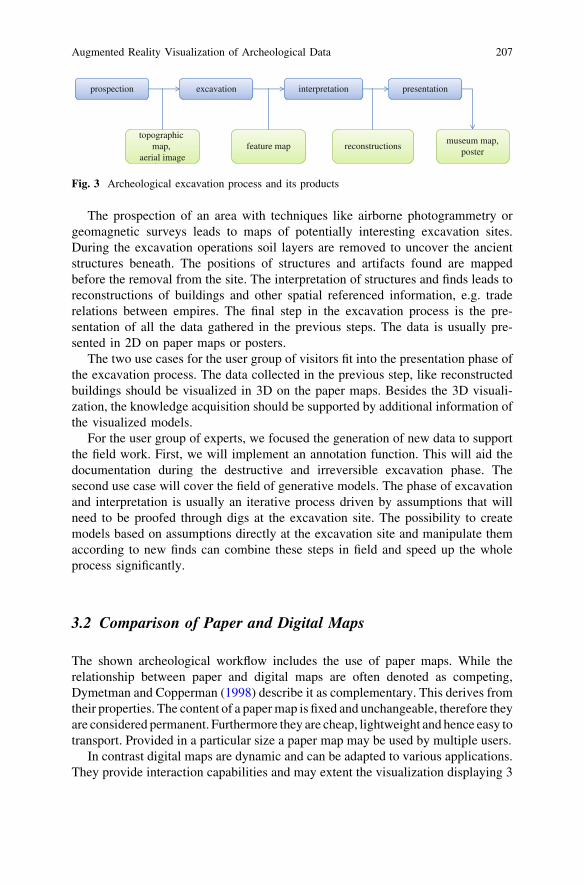
The prospection of an area with techniques like airborne photogrammetry orgeomagnetic surveys leads to maps of potentially interesting excavation sites.During the excavation operations soil layers are removed to uncover the ancientstructures beneath. The positions of structures and artifacts found are mappedbefore the removal from the site. The interpretation of structures and finds leads toreconstructions of buildings and other spatial referenced information, e.g. traderelations between empires. The final step in the excavation process is the pre-sentation of all the data gathered in the previous steps. The data is usually pre-sented in 2D on paper maps or posters.
The two use cases for the user group of visitors fit into the presentation phase ofthe excavation process. The data collected in the previous step, like reconstructedbuildings should be visualized in 3D on the paper maps. Besides the 3D visuali-zation, the knowledge acquisition should be supported by additional information ofthe visualized models.
For the user group of experts, we focused the generation of new data to supportthe field work. First, we will implement an annotation function. This will aid thedocumentation during the destructive and irreversible excavation phase. Thesecond use case will cover the field of generative models. The phase of excavationand interpretation is usually an iterative process driven by assumptions that willneed to be proofed through digs at the excavation site. The possibility to createmodels based on assumptions directly at the excavation site and manipulate themaccording to new finds can combine these steps in field and speed up the wholeprocess significantly.
3.2 Comparison of Paper and Digital Maps
The shown archeological workflow includes the use of paper maps. While therelationship between paper and digital maps are often denoted as competing,Dymetman and Copperman (1998) describe it as complementary. This derives fromtheir properties. The content of a paper map is fixed and unchangeable, therefore theyare considered permanent. Furthermore they are cheap, lightweight and hence easy totransport. Provided in a particular size a paper map may be used by multiple users.
In contrast digital maps are dynamic and can be adapted to various applications.They provide interaction capabilities and may extent the visualization displaying 3
prospection excavation interpretation presentation
topographic map,
aerial imagefeature map reconstructions
museum map,poster
Fig. 3 Archeological excavation process and its products
Augmented Reality Visualization of Archeological Data 207
dimensional models. The major problem of digital maps is need for a ratherexpensive infrastructure. This results in restricted mobility and is susceptible totechnical errors.
Still, the discussed archeological use cases will benefit from the advantagesprovided by digital maps. Considering the museum use case, a map has to provide(additional) information and must be fairly cheap. Paper maps are cheap but theprovided information is predefined and fixed. In terms of communication theorythis is called a push medium. A proper information provider, however, alsoincludes pull capabilities. Unlike paper maps, digital maps may provide such afeature, where users can interact with the map and acquire additional informationof interesting areas. The distribution of information is thus much more personal-ized, efficient and attractive.
Moreover, digital maps are already widely used in the archeology domain.Computer-aided design (CAD) and GIS are important components of the arche-ological workflow. Because of their easy handling, paper maps are nonetheless themain map-tool at an excavation site.
4 Implementation
The goal was to develop a practical and cost effective platform for AR applicationsthat work on common smartphones and tablets, thereby making them accessible tolarge audiences. Due to the advances of mobile hardware in processing power andthe integration of custom hardware for 3D rendering we were able to use naturalfeatures tracking, avoiding the need to integrate special marker patterns fortracking.
Our prototype is implemented on Android OS and thus runs on a wide range ofmobile devices like smartphones and tablets. The image matching to recognize thepaper maps as targets for the AR content is based on the Vuforia SDK. This free-to-use toolkit features a fast and reliable image tracking and is compatible with mostAndroid devices. It supports the generation of new image markers with an onlineweb-tool. In case a predefined marker is recognized in the video frame, the pose of thecamera relative to the marker is estimated from the distortion of features found. Thispose is used to render the 3D scene and display it on the marker.
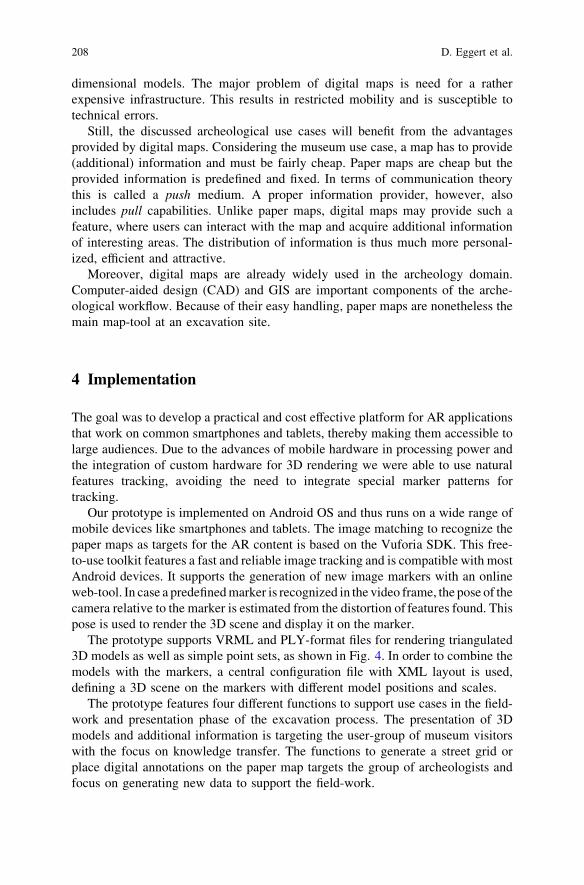
The prototype supports VRML and PLY-format files for rendering triangulated3D models as well as simple point sets, as shown in Fig. 4. In order to combine themodels with the markers, a central configuration file with XML layout is used,defining a 3D scene on the markers with different model positions and scales.
The prototype features four different functions to support use cases in the field-work and presentation phase of the excavation process. The presentation of 3Dmodels and additional information is targeting the user-group of museum visitorswith the focus on knowledge transfer. The functions to generate a street grid orplace digital annotations on the paper map targets the group of archeologists andfocus on generating new data to support the field-work.
208 D. Eggert et al.
4.1 Layers
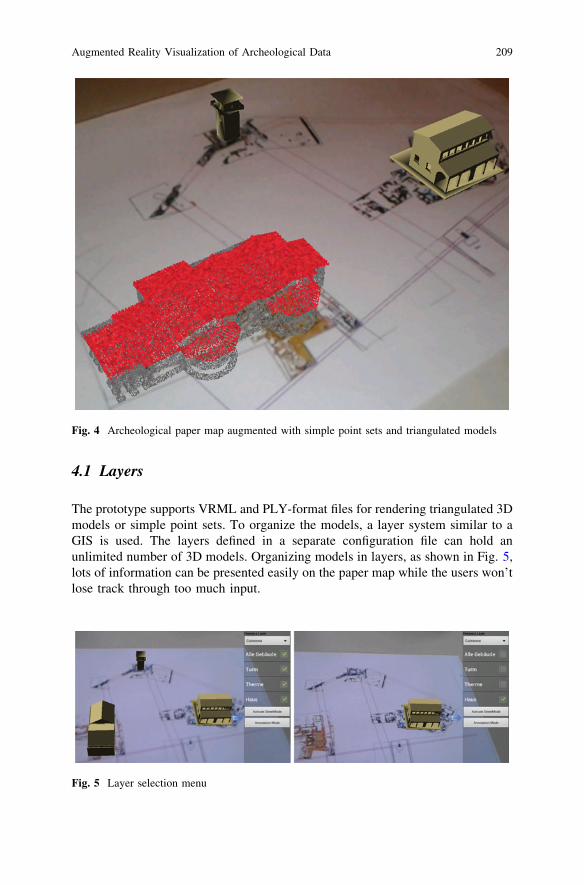
The prototype supports VRML and PLY-format files for rendering triangulated 3Dmodels or simple point sets. To organize the models, a layer system similar to aGIS is used. The layers defined in a separate configuration file can hold anunlimited number of 3D models. Organizing models in layers, as shown in Fig. 5,lots of information can be presented easily on the paper map while the users won’tlose track through too much input.
Fig. 4 Archeological paper map augmented with simple point sets and triangulated models
Fig. 5 Layer selection menu
Augmented Reality Visualization of Archeological Data 209
4.2 Model Information
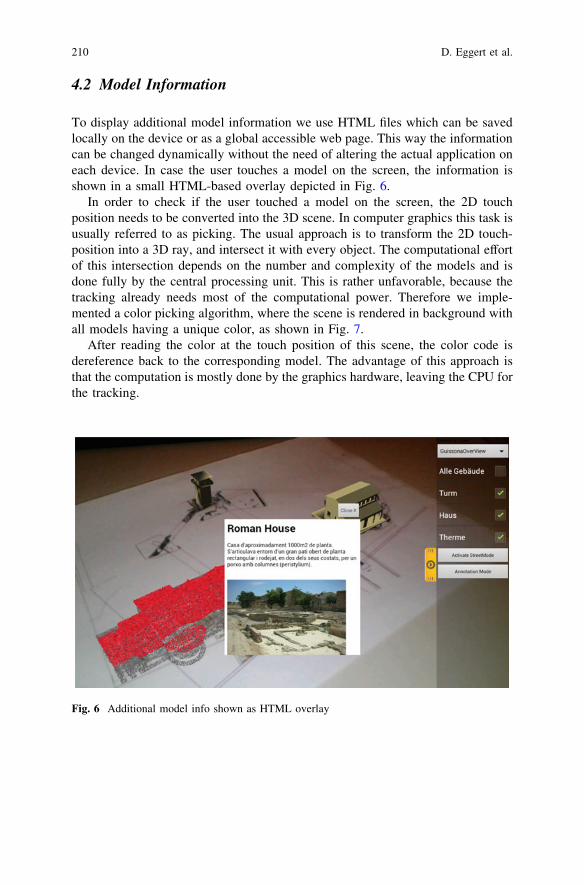
To display additional model information we use HTML files which can be savedlocally on the device or as a global accessible web page. This way the informationcan be changed dynamically without the need of altering the actual application oneach device. In case the user touches a model on the screen, the information isshown in a small HTML-based overlay depicted in Fig. 6.
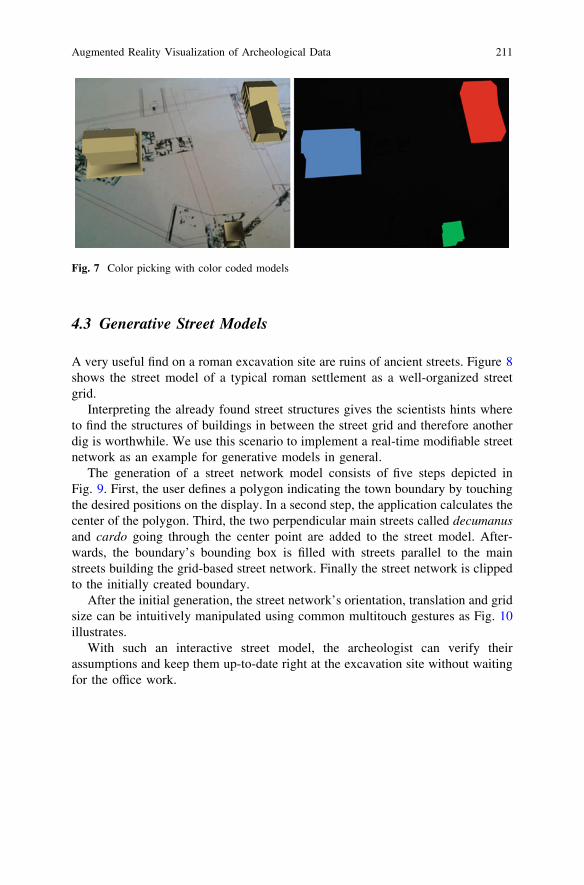
In order to check if the user touched a model on the screen, the 2D touchposition needs to be converted into the 3D scene. In computer graphics this task isusually referred to as picking. The usual approach is to transform the 2D touch-position into a 3D ray, and intersect it with every object. The computational effortof this intersection depends on the number and complexity of the models and isdone fully by the central processing unit. This is rather unfavorable, because thetracking already needs most of the computational power. Therefore we imple-mented a color picking algorithm, where the scene is rendered in background withall models having a unique color, as shown in Fig. 7.
After reading the color at the touch position of this scene, the color code isdereference back to the corresponding model. The advantage of this approach isthat the computation is mostly done by the graphics hardware, leaving the CPU forthe tracking.
Fig. 6 Additional model info shown as HTML overlay
210 D. Eggert et al.
4.3 Generative Street Models
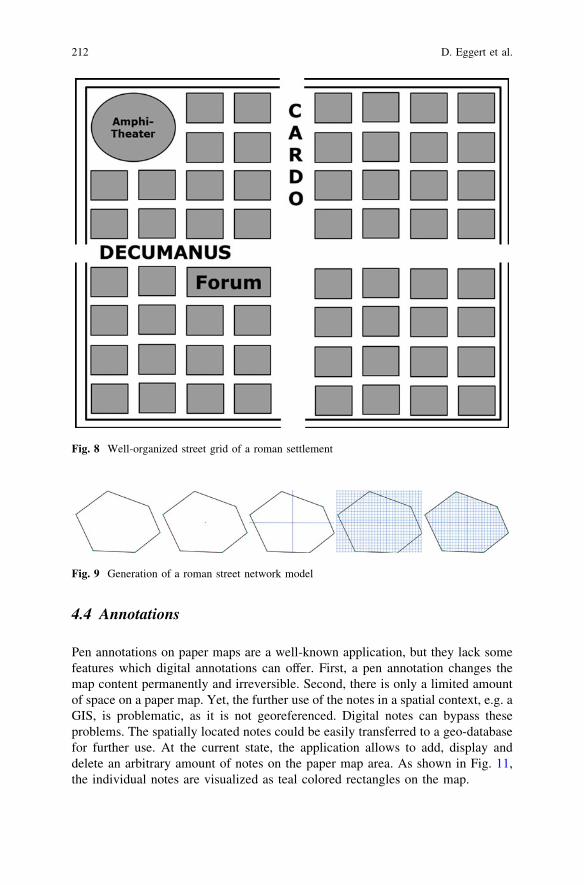
A very useful find on a roman excavation site are ruins of ancient streets. Figure 8shows the street model of a typical roman settlement as a well-organized streetgrid.
Interpreting the already found street structures gives the scientists hints whereto find the structures of buildings in between the street grid and therefore anotherdig is worthwhile. We use this scenario to implement a real-time modifiable streetnetwork as an example for generative models in general.
The generation of a street network model consists of five steps depicted inFig. 9. First, the user defines a polygon indicating the town boundary by touchingthe desired positions on the display. In a second step, the application calculates thecenter of the polygon. Third, the two perpendicular main streets called decumanusand cardo going through the center point are added to the street model. After-wards, the boundary’s bounding box is filled with streets parallel to the mainstreets building the grid-based street network. Finally the street network is clippedto the initially created boundary.
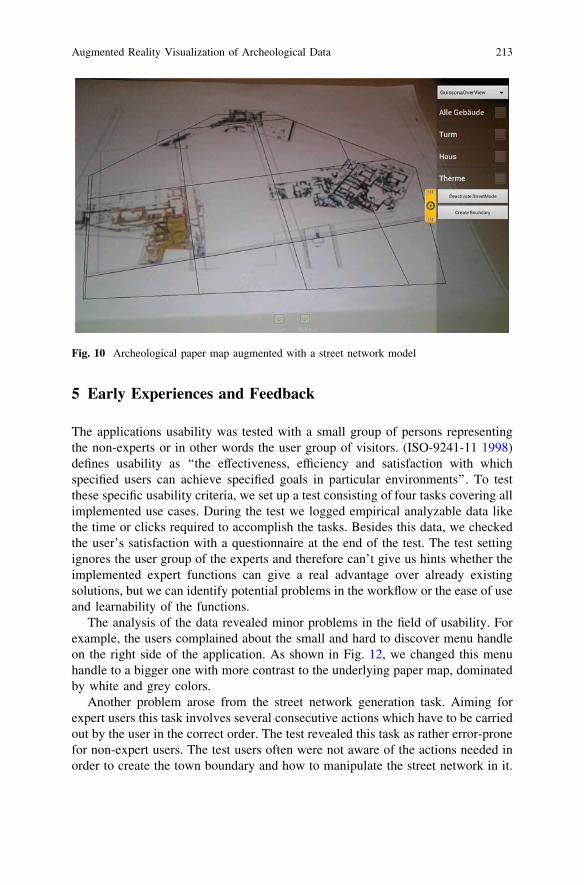
After the initial generation, the street network’s orientation, translation and gridsize can be intuitively manipulated using common multitouch gestures as Fig. 10illustrates.
With such an interactive street model, the archeologist can verify theirassumptions and keep them up-to-date right at the excavation site without waitingfor the office work.
Fig. 7 Color picking with color coded models
Augmented Reality Visualization of Archeological Data 211
4.4 Annotations
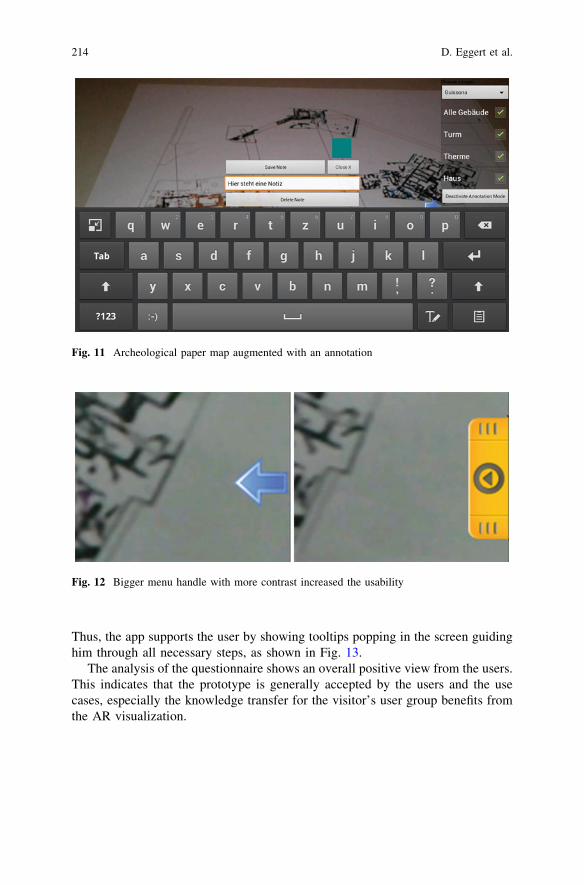
Pen annotations on paper maps are a well-known application, but they lack somefeatures which digital annotations can offer. First, a pen annotation changes themap content permanently and irreversible. Second, there is only a limited amountof space on a paper map. Yet, the further use of the notes in a spatial context, e.g. aGIS, is problematic, as it is not georeferenced. Digital notes can bypass theseproblems. The spatially located notes could be easily transferred to a geo-databasefor further use. At the current state, the application allows to add, display anddelete an arbitrary amount of notes on the paper map area. As shown in Fig. 11,the individual notes are visualized as teal colored rectangles on the map.
Fig. 8 Well-organized street grid of a roman settlement
Fig. 9 Generation of a roman street network model
212 D. Eggert et al.
5 Early Experiences and Feedback
The applications usability was tested with a small group of persons representingthe non-experts or in other words the user group of visitors. (ISO-9241-11 1998)defines usability as ‘‘the effectiveness, efficiency and satisfaction with whichspecified users can achieve specified goals in particular environments’’. To testthese specific usability criteria, we set up a test consisting of four tasks covering allimplemented use cases. During the test we logged empirical analyzable data likethe time or clicks required to accomplish the tasks. Besides this data, we checkedthe user’s satisfaction with a questionnaire at the end of the test. The test settingignores the user group of the experts and therefore can’t give us hints whether theimplemented expert functions can give a real advantage over already existingsolutions, but we can identify potential problems in the workflow or the ease of useand learnability of the functions.
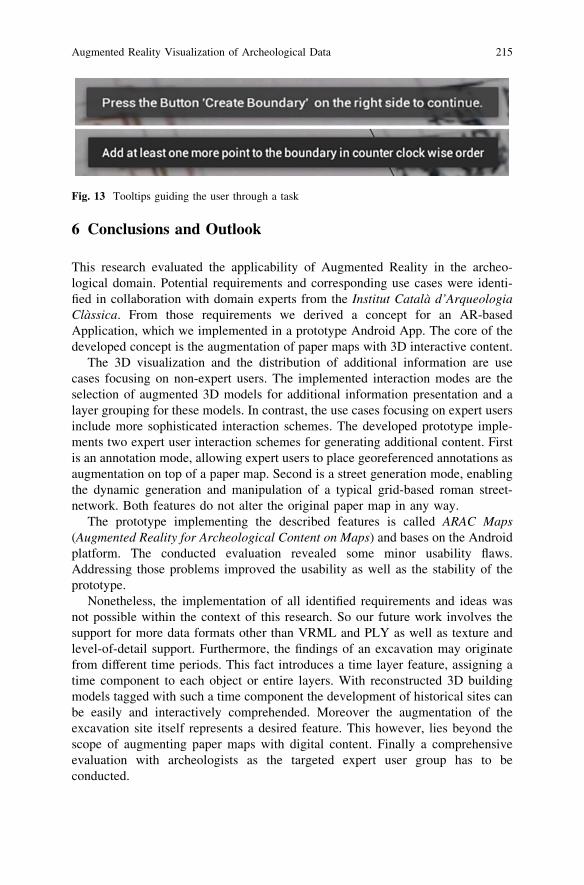
The analysis of the data revealed minor problems in the field of usability. Forexample, the users complained about the small and hard to discover menu handleon the right side of the application. As shown in Fig. 12, we changed this menuhandle to a bigger one with more contrast to the underlying paper map, dominatedby white and grey colors.
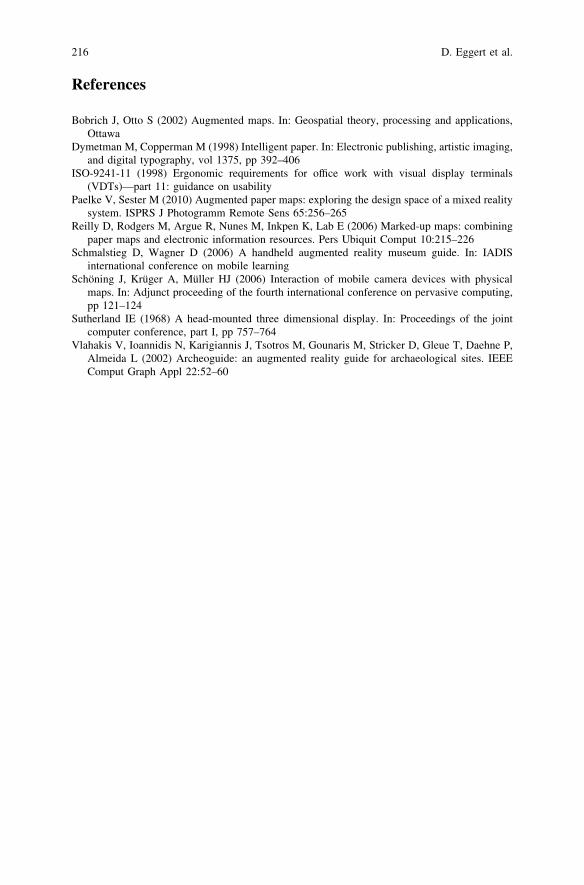
Another problem arose from the street network generation task. Aiming forexpert users this task involves several consecutive actions which have to be carriedout by the user in the correct order. The test revealed this task as rather error-pronefor non-expert users. The test users often were not aware of the actions needed inorder to create the town boundary and how to manipulate the street network in it.
Fig. 10 Archeological paper map augmented with a street network model
Augmented Reality Visualization of Archeological Data 213
Thus, the app supports the user by showing tooltips popping in the screen guidinghim through all necessary steps, as shown in Fig. 13.
The analysis of the questionnaire shows an overall positive view from the users.This indicates that the prototype is generally accepted by the users and the usecases, especially the knowledge transfer for the visitor’s user group benefits fromthe AR visualization.
Fig. 11 Archeological paper map augmented with an annotation
Fig. 12 Bigger menu handle with more contrast increased the usability
214 D. Eggert et al.
6 Conclusions and Outlook
This research evaluated the applicability of Augmented Reality in the archeo-logical domain. Potential requirements and corresponding use cases were identi-fied in collaboration with domain experts from the Institut Català d’ArqueologiaClàssica. From those requirements we derived a concept for an AR-basedApplication, which we implemented in a prototype Android App. The core of thedeveloped concept is the augmentation of paper maps with 3D interactive content.
The 3D visualization and the distribution of additional information are usecases focusing on non-expert users. The implemented interaction modes are theselection of augmented 3D models for additional information presentation and alayer grouping for these models. In contrast, the use cases focusing on expert usersinclude more sophisticated interaction schemes. The developed prototype imple-ments two expert user interaction schemes for generating additional content. Firstis an annotation mode, allowing expert users to place georeferenced annotations asaugmentation on top of a paper map. Second is a street generation mode, enablingthe dynamic generation and manipulation of a typical grid-based roman street-network. Both features do not alter the original paper map in any way.
The prototype implementing the described features is called ARAC Maps(Augmented Reality for Archeological Content on Maps) and bases on the Androidplatform. The conducted evaluation revealed some minor usability flaws.Addressing those problems improved the usability as well as the stability of theprototype.
Nonetheless, the implementation of all identified requirements and ideas wasnot possible within the context of this research. So our future work involves thesupport for more data formats other than VRML and PLY as well as texture andlevel-of-detail support. Furthermore, the findings of an excavation may originatefrom different time periods. This fact introduces a time layer feature, assigning atime component to each object or entire layers. With reconstructed 3D buildingmodels tagged with such a time component the development of historical sites canbe easily and interactively comprehended. Moreover the augmentation of theexcavation site itself represents a desired feature. This however, lies beyond thescope of augmenting paper maps with digital content. Finally a comprehensiveevaluation with archeologists as the targeted expert user group has to beconducted.
Fig. 13 Tooltips guiding the user through a task
Augmented Reality Visualization of Archeological Data 215
References
Bobrich J, Otto S (2002) Augmented maps. In: Geospatial theory, processing and applications,Ottawa
Dymetman M, Copperman M (1998) Intelligent paper. In: Electronic publishing, artistic imaging,and digital typography, vol 1375, pp 392–406
ISO-9241-11 (1998) Ergonomic requirements for office work with visual display terminals(VDTs)—part 11: guidance on usability
Paelke V, Sester M (2010) Augmented paper maps: exploring the design space of a mixed realitysystem. ISPRS J Photogramm Remote Sens 65:256–265
Reilly D, Rodgers M, Argue R, Nunes M, Inkpen K, Lab E (2006) Marked-up maps: combiningpaper maps and electronic information resources. Pers Ubiquit Comput 10:215–226
Schmalstieg D, Wagner D (2006) A handheld augmented reality museum guide. In: IADISinternational conference on mobile learning
Schöning J, Krüger A, Müller HJ (2006) Interaction of mobile camera devices with physicalmaps. In: Adjunct proceeding of the fourth international conference on pervasive computing,pp 121–124
Sutherland IE (1968) A head-mounted three dimensional display. In: Proceedings of the jointcomputer conference, part I, pp 757–764
Vlahakis V, Ioannidis N, Karigiannis J, Tsotros M, Gounaris M, Stricker D, Gleue T, Daehne P,Almeida L (2002) Archeoguide: an augmented reality guide for archaeological sites. IEEEComput Graph Appl 22:52–60
216 D. Eggert et al.


![Augmented Reality...Virtual Environment Augmented Reality Real Environment Support Archeological Field Work [Benkoet al, 2005, Columbia] [[]video] Overlay Assembly Instructions [Feiner](https://img.pdfslide.us/doc/110x75/5fa67eafd645cf3fe37fc4eb/augmented-reality-virtual-environment-augmented-reality-real-environment-support.jpg)


![[DEMO] On-Site Augmented Collaborative Architecture Visualization](https://img.pdfslide.us/doc/110x75/587f47041a28aba8108b862a/demo-on-site-augmented-collaborative-architecture-visualization.jpg)