Embed Size (px)
Citation preview
1
Augmented and Virtual Reality in Construction: drivers 1
and limitations for industry adoption 2
1. Juan Manuel Davila Delgado, Big Data Enterprise and Artificial Intelligence 3 Laboratory, University of West of England Bristol, Coldharbour Lane, Bristol, BS16 4 1WD, UK, [email protected] 5
2. Lukumon Oyedele1, Big Data Enterprise and Artificial Intelligence Laboratory, 6 University of West of England Bristol, Coldharbour Lane, Bristol, BS16 1WD, UK, 7 [email protected] 8
3. Thomas Beach, School of Engineering, Cardiff University, The Parade, Cardiff, CF24 9 3AA, UK, [email protected] 10
4. Peter Demian, School of Architecture, Building and Civil Engineering, 11 Loughborough University, Loughborough LE11 3TU, UK, [email protected] 12
13 1. Corresponding author. 14
15
ABSTRACT 16 Augmented and virtual reality have the potential to provide a step-change in productivity in 17 the construction sector; however, the level of adoption is very low. This paper presents a 18 systematic study of the factors that limit and drive adoption in the construction sector-19 specific context. A mixed research method was employed, combining qualitative and 20 quantitative data collection and analysis. Eight focus groups with 54 experts and an online 21 questionnaire were conducted. Forty-two limiting and driving factors were identified and 22 ranked. Principal Component Analysis was conducted to group the identified factors into a 23 smaller number of factors based on correlations. Four types of limiting factors and four 24 types of driving factors were identified. The main limitation of adoption is that AR and VR 25 technologies are regarded as expensive and immature technologies that are not suitable for 26 engineering and construction. The main drivers are that AR and VR enable improvements 27 in project delivery and provision of new and better services. This study provides valuable 28 insights to stakeholders to devise actions that mitigate the limiting factors, and that boosts 29 the driving factors. This is one of the first systematic studies that presents a detailed analysis 30 of the factors that limit and drive adoption of AR and VR in the construction industry. The 31 main contribution to knowledge of this study is that it grouped and characterized a myriad 32 of limiting and driving factors into easily understandable categories; so that, the limiting 33 factors can be effectively mitigated, and the driving factors potentiated. Also, a roadmap 34 with specific short term and medium-term actions for improving adoption has been outlined. 35
Keywords: Augmented Reality, Virtual Reality, Construction, Architecture, Engineering, Limitations, 36 Drivers, Adoption Roadmap. 37
38
Manuscript Click here toaccess/download;Manuscript;ARVRLim_Review2.docx
2
1 Introduction 39
Augmented Reality (AR) and Virtual Reality (VR) are visualization technologies that are dramatically 40
changing the way humans interact with visual information. AR and VR technologies are becoming 41
widespread, and every industry will be affected by the rapid adoption of these technologies. AR and 42
VR technologies have been identified as one of the top 10 Gartner strategic technology trends for 2019 43
(Panneta, 2018). So far, the main applications are in the gaming and entertainment sectors, but tourism, 44
marketing, sports, education, and training have experimented substantial growth as well (Research and 45
Markets, 2018). A study by Goldman Sachs (Heather Bellini, 2016) estimates that the size of the AR 46
and VR markets will grow to $80 billion by 2025, similar to the size of the personal computer market 47
in 2016. More recent reports estimate the size of the AR and VR market to grow to $94 billion by 2023 48
(Research and Markets, 2018). Fifty-two out of the Fortune 500 companies are testing and deploying 49
AR or VR solutions, and venture capital investment increased 230% from 2016 to 2017 (Kaiser and 50
Scatsky, 2017). Many companies from various sectors (e.g. aerospace, logistics, retail) are using AR 51
and VR for education, training and productivity improvements. For example, Boeing (2018) reported 52
up to 40% productivity improvements in electrical wiring installation tasks when using AR head-53
mounted displays (HDMs) to support workers. 54
Despite the huge potential of AR and VR technologies, as with other digital technologies, their adoption 55
in the Architecture, Engineering, and Construction (AEC) sectors is still very low. For example, the 56
McKinsey Global Institute (Manyika et al., 2015) reported that the level of digitalization index for the 57
construction industry was the lowest out of 22 industries. Results from a survey conducted by the 58
authors for this study estimate a VR adoption factor in the UK construction sector of 2.5 out of 5; and 59
of 1.5 out of 5 for AR (Davila Delgado et al., 2019a). In the factor scale, 5 represents full adoption, and 60
1 represents not used at all. These low levels of adoption are caused by a myriad of complex and 61
interrelated factors that are very difficult to understand, and consequently, appropriate mitigating 62
actions cannot be devised. This paper presents a systematic study of the factors that limit and drive the 63
adoption of AR and VR technologies in the construction industry. The objectives of this study are: 64
(1) To identify, categorize, and rank the most relevant factors that limit and drive the adoption of 65
AR and VR in the construction industry. 66
(2) To provide a clear and understandable explanation of the main factors that limit and drive 67
adoption, which could be used as the basis to develop mitigating actions. 68
A mixed method approach, consisting of qualitative and quantitative data collection and analyses (see 69
Figure 3), was employed to achieve the objectives above. Exploratory workshops —with experts from 70
industry and academia— and quantitative data collection tools were used to identify and rank the 71
factors. Statistical analyses were used to organize a large number of possibly correlated factors into a 72
3
smaller number of uncorrelated factors. The uncorrelated factors are then explained in the context and 73
the dynamics of the construction sector. The next section provides an overview of AR and VR 74
technologies in the AEC context; next, the methodology used in this study is explained. Sections 4 and 75
5 present the qualitative and quantitative analyses, respectively. Sections 6 and 7 explain the limitations 76
and drivers that have been identified. Section 8 discusses the findings presented, provides and 77
comparison with other similar studies, and presents a roadmap to improve adoption. Lastly, conclusions 78
are provided. 79
2 Background 80
2.1 Virtual Reality, Augmented Reality, and Mixed Reality 81
VR is the technology that enables the creation of entirely computer-generated environments that give 82
the user the sensation of being completely immersed within a virtual environment. It provides a way to 83
replace the perception of the surrounding world with a computer-generated artificial 3D environment. 84
The virtual experience is provided usually through a head-mounted display (HMD), a device that 85
provides a virtual experience to a single individual, but they are other room-sized systems that enable 86
VR experiences for many individuals (e.g. DeFanti et al., 2009). VR can be used, for example, to train 87
and test healthcare professionals by immersing them in virtual surgery rooms (Yiannakopoulou et al., 88
2015), in which they need to perform specific tasks without the need for expensive real-life facilities 89
and human subjects. On the other hand, AR is the technology that enables to overlay digital information 90
onto the real environment –in real-time and in the correct spatial position– to augment or enhance the 91
real environment. In other words, AR enables digital objects and information to be overlaid either 92
through an HMD or via a handheld device with a camera such as a smartphone or a tablet. For example, 93
AR systems, reported in literature, enable users to view three dimensional virtual furniture on real 94
environments (Young and Smith, 2016). These capabilities have migrated to commercial solutions such 95
as AR mobile shopping apps, which allow to visualize 3D models of furniture and see how they would 96
look and fit in various places around a house. 97
The term “Mixed Reality” was originally coined by Milgram (1994). It refers to the spectrum or “virtual 98
continuum” in which different technologies exist based on how much of the real environment is 99
displayed (see Figure 1). At one end of the spectrum is the real environment that everybody experiences 100
daily. On the other end, resides the virtual environment, in which the real environment is completely 101
replaced by virtual objects. Various technologies can be mapped within the Mixed Reality Spectrum. 102
For example, VR is closer to the virtual environment end of the spectrum, in which the real environment 103
is not displayed at all. While AR is closer to the other end, in which a combination of real environment 104
objects and virtual environment objects are displayed. Other technologies can be mapped within this 105
spectrum, for instance Augmented Virtuality (AV) refers to a virtual environment augmented with 106
4
object from the real environment (e.g. Albert et al., 2014); or Tangible User Interfaces (TUI), which are 107
physical objects from the real environment that enable a new way to interact with virtual objects (e.g. 108
Skulmowski et al., 2016). Benford et al. (1998) presented a similar taxonomy to Milgram’s one to 109
explain the differences between AR and VR. In this case, the technologies are mapped in a four-110
quadrant space, in which two spectrums range from the physical world to the virtual world and from 111
computer-generated data to physical data. 112
Milgram’s definition of Mixed Reality is the most widely accepted in academia. However, recently the 113
term Mixed Reality has been used by technology development companies to refer to a new distinct 114
technology instead of a spectrum in which many technologies lie. This new definition has not been 115
universally agreed upon, and many different definitions abound. In summary, it refers to a technology 116
that, like AR, places virtual objects on a real environment, but that it also anchors them on the real 117
world, and it enables interaction among physical and virtual objects. This new definition is very vague, 118
lacks scientific rigor, and there are no reliable sources to support it. The new definition was primarily 119
used as a marketing strategy to differentiate similar products. However, it seems that this new definition 120
is losing traction, as now even the same technology development companies that introduced the new 121
definition are using Milgram’s definition as well (Bray and Zeller, 2018). 122
Table 1 and Figure 2 presents the main types of AR and VR technologies. Both technologies have a 123
mobile variant with fewer capabilities. AR and VR require HMDs and specialized controllers. The 124
mobile version of AR does not require an HMD. Both mobile versions are less expensive and do not 125
have high-processing requirements. Note that there are other types of AR and VR devices such as AR 126
glasses, but they were not included here because they are not as developed, and there have not been 127
applications related to the construction industry reported in literature. 128
2.2 AR and VR in Architecture, Engineering and Construction 129
AR and VR technologies are of utmost importance for the AEC industry as a whole as the built 130
environment is intrinsically linked to 3D space, and AEC professionals rely heavily on imagery for 131
communication. In the UK, the Data for the Public Good report (National Infrastructure Commission, 132
2017) considered AR and VR as key new technologies to increase the productivity on infrastructure 133
delivery, maintenance, and support decision-making. Similarly, in the USA, the government’s 134
information technology initiatives include an AR and VR initiative. In 2017, the emerging Citizen 135
Technology Office launched the Federal Virtual/Augmented Reality program to coordinate the 136
collaboration for the research and refinement of AR and VR business cases and pilot programs (GSA, 137
2017). The US federal agencies expect that AR and VR technologies can potentially expand and 138
improve their services in a wide range of applications from post-traumatic social disorder treatment, to 139
5
educating farmers on the installation of solar panels, and disaster management preparedness and 140
response (GSA, 2017). 141
AR is considered as an essential technology to improve construction projects (Woyke, 2016). Research 142
on both AR and VR has been carried out for many decades, but recently the field has resurged driven 143
by the development of new, more capable HMDs. Nevertheless, adoption in the AEC sectors of these 144
technologies remains very low and circumscribed to very specific use cases. For example, client 145
engagement using VR. The Manufacturing Technology Centre (MTC), in collaboration with i3P, a 146
consortium of large construction companies and infrastructure providers, carried out an exploratory 147
study into the maturity and applicability of AR and VR in construction companies in 2017 (MTC, 2017). 148
The report reveals that only 37% of construction companies have some experience with AR and VR. 149
This result is aligned with the authors’ own research, which estimates that only 32.4% of construction 150
companies in the UK have used AR or VR at some capacity (Davila Delgado et al., 2019a). 151
There are many varied use cases of AR for architecture, engineering and construction. However the 152
main use case reported in literature is to assist with construction tasks, assembly operations and 153
construction of pre-fabricated construction elements (e.g. Webster et al., 1996). Ahn et al. (2019) 154
presented a projection-based AR approach for visualizing vital information within a user’s field of view 155
during panel manufacturing for construction. The authors state that their approach will improve the 156
quality of the final manufactured products by reducing the offset distances and ensuring that are within 157
the tolerance levels. Fazel and Izadi (2018) presented an AR system that supports construction workers 158
to construct complex double-curved brick walls. The presented system uses a marker-based approach, 159
in which a camera tracks two markers, one located on the floor and another one on the worker’s HMD. 160
The AR system computes the correct location of the wall to be constructed using the relative position 161
and orientation of both markers. Then, visual guides are displayed on the worker’s HMD indicating the 162
correct position and orientation of the bricks required for constructing the wall. Chalhoub and Ayer 163
(2018) presented an AR system that supports workers to install electrical installations at the correct 164
positions. Using AR, a 3D model of electrical conduits is overlaid at the correct position in the room, 165
obviating the need for 2D drawings. Deshpande and Kim (2018) investigated the effects of AR to 166
support assembly tasks. The authors developed an AR system that provided visual guides to assemble 167
furniture pieces and found indications that AR guidelines can improve the understanding of spatial 168
relationships among components. 169
Other AR use cases include: (1) see-through opaque surfaces (e.g. walls, floor, road surfaces, etc.) to 170
visualize construction elements and infrastructure assets (e.g. gas, water, or electricity underground 171
cables) (Schall et al., 2009). (2) Support finding assets (e.g. power distribution boxes, pipe mains, etc.) 172
in complex sites (Neges and Koch, 2016), (3) Support design reviews (Dong et al., 2013; Schubert et 173
al., 2015). For example, Lin et al. (2019) presented an AR system that visualizes the results of computer 174
6
fluid dynamics simulations of indoor thermal environments on mobile devices. (4) Support 175
collaborative design and the development of layouts (Nee et al., 2012). (5) Improve the information 176
retrieval process during construction (Behzadi, 2016). Chu et al. (2018) investigated how AR can be 177
used to improve information retrieval from BIM models using markers. (6) Enhance collaboration and 178
facilitate remote support (Billinghurst and Kato, 2002). (7) Query physical objects by querying aligned 179
but hidden model elements (Seo and Lee, 2013) (8) Verify whether new equipment will fit and for clash 180
detection (Friedrich, Jahn and Schmidt, 2002). (9) Improve building site monitoring and inspections 181
(Golparvar-Fard, Peña-Mora and Savarese, 2009). For example, Zhou et al. (2017) presented an AR 182
approach to support the inspection of segment displacement during tunneling construction. The 183
approach enables to overlay a quality control baseline model onto the real segment and measure the 184
differences. (10) Support asset and facility management (Schall, Mendez and Schmalstieg, 2008; 185
Palmarini et al., 2018). For instance, Baek et al. (2019) presented an AR approach for facility 186
management that presents location-specific data in AR using image-based indoor localization. The 187
marker-less approach estimates the user's indoor position and orientation by comparing the user's 188
perspective with a predefined BIM model. Neges et al. (2017) presented an AR framework that digitally 189
supports facility maintenance operators when navigating indoors. The framework combines a step 190
counter device and visual live video feed to provide accurate indoor navigation support. (11) Support 191
education and training (e.g. Eiris Pereira et al., 2019). Turkan et al. (2017) presented an AR system to 192
teach structural analysis and to help students understanding the behavior of structural elements in a 193
three-dimensional context. The AR system enables students to define simple structural systems and 194
interactively change the loads and observe the reaction with the instant feedback provided by the AR 195
interface. 196
The application of VR in the AEC sector is arguably more mature than that of AR. The textbook by 197
Whyte and Nikolic (2018), reviews the practical applications of VR in the design, construction, and 198
management of the built environment. The main use cases include: (i) support with design reviews 199
(Dunston et al., 2011; Aromaa and Väänänen, 2016; Berg and Vance, 2016). For example, Boton (2018) 200
proposed a method to support constructability analysis meetings using VR environments. The method 201
enables to export BIM-based construction simulations into a VR application for immersive 202
visualization. Wolfartsberger (2019) presented a VR system for engineering design review, in which 203
faults in designs were easier to identify, and the review process was carried out faster compared with 204
traditional review processes. (ii) Support with immersive design and drafting (Whyte et al., 2000; Roach 205
and Demirkiran, 2017). For instance, Lin et al. (2018) developed a VR approach to support the design 206
of healthcare facilities by improving the communication between the design teams and healthcare 207
stakeholders. Du et al. (2018b) presented an approach that enables real-time synchronization of BIM 208
data with VR applications. The approach enables to update a BIM model based on the changes made in 209
VR application automatically and simultaneously, e.g. changing object dimensions, changing object 210
7
locations and changing object types. (iii) Facilitate the creation of more useful simulations and testing 211
of design solutions. (Mujber, Szecsi and Hashmi, 2004; Rekapalli and Martinez, 2011). Motamedi et 212
al. (2017) presented an approach to test the effectiveness of signages of Japanese subway stations on 213
VR environments. Most notably, Ergan et al. (2019) used a set of biometric sensors, and physiological 214
metrics such as skin conductance, brain activity, and heart rate to provide an indication of the levels of 215
stress and anxiety users experienced in VR environments. The authors claim that their approach 216
provides a systematic way for architectural design firms to get accurate user feedback before the design 217
is finalized. (iv) Improve education and training (Boud et al., 1999; Zhao and Lucas, 2015). Fogarty et 218
al. (2018) investigated how VR can be used to improve the student’s spatial understanding of complex 219
spaces. (v) Improve health and safety. For example, Albert et al. (2014) presented a VR method for 220
hazard identification in construction sites. Lovreglio et al. (2018) developed a VR solution to assess the 221
level of preparedness for building evacuations during earthquakes. Shi et al. (2019) used VR to assess 222
distinct types reinforced learning methods on the behavior of construction workers associated with fall 223
risks. Dris et al. (2019) proposed a VR approach that supports risk identification and improves the data 224
exchange between BIM models and VR applications. Lastly, (vi) improving stakeholders’ engagement 225
and communication (Annetta et al., 2009; Du, Shi, et al., 2018; Hassan, Taib and Rahman, 2018). 226
Pratama and Dossick (2019) conducted a study with AEC companies and identified that majority of 227
companies use VR for generating immersive building walkthroughs. 228
Note that there are no studies reported in literature that analyze the limiting and driving factors 229
influencing the adoption of AR and VR in construction. Most of the studies addressing adoption 230
limitations focus only on technical aspects e.g. the work by Behzadan et al. (2015) and Palmarini et al. 231
(2018); or on specific use-cases e.g. the work of Li et al. (2018) on construction safety. Nevertheless, 232
section 8.1 presents a detailed comparison of the findings of this study with the studies above and with 233
other AR and VR adoption studies carried out in other fields (Tourism, Healthcare, and Education). 234
3 Research Methodology 235
A mixed research method, as presented by Creswell (2017), was used for this study. It combines 236
qualitative data collection and analysis and quantitative data collection and analysis. This type of mixed 237
research method has been proved to be a powerful tool to investigate complex processes and systems 238
in other areas, such as the healthcare sector (Fetters, Curry and Creswell, 2013). For this reason, they 239
were selected to be used in this study. These types of mixed methods are very useful in identifying 240
underlying factors in complex systems by supporting and guiding the quantitative data collection and 241
analysis with qualitative research activities. The combination of both qualitative and quantitative 242
analyses helps to explain, categorize and generalize findings (Fetters, Curry and Creswell, 2013). Figure 243
3 presents a diagram of the research methodology used. The first step, qualitative analysis, was to 244
conduct four exploratory workshops with experts in the field, from industry and academia, in which a 245
8
series of focus group discussions (FGDs) were conducted (Table 2). Findings from the FGDs were 246
compiled into two lists of factors that limit and drive adoption. In the second step, quantitative analysis, 247
the results from the previous step were used to develop a quantitative data collection instrument, i.e. 248
questionnaire. The questionnaire was administered to specialists and academics with expertise in AR 249
and VR based in the UK; the sampling method used, and the distribution of the participants are detailed 250
in section 5.1. Using the results of the questionnaire, the identified factors were ranked and categorized 251
using principal component analysis (PCA). A reliability analysis was carried out on the questionnaire 252
results to validate the internal consistency of the results, and multivariate analysis of covariance was 253
carried out to test whether there were significant statistical differences in the responses that could be 254
attributed to the varied profiles of the respondents. Lastly, using the results of the qualitative and the 255
quantitative analysis, relevant insights into the factors limiting and driving the adoption of AR and VR 256
in the construction industry were drawn and explained. 257
4 Qualitative sampling and analysis 258
The main activities conducted in the qualitative part of the study were four exploratory workshops, in 259
which two FGDs were carried out at each workshop. In total, 8 FGDs were held with durations between 260
30 and 45 minutes. Fifty-four experts from 36 organizations, companies, and academic institutions 261
based in the UK participated in workshops. The intention was to assemble multidisciplinary expert 262
groups with varied expertise; therefore, experts from academia, construction companies, design offices, 263
engineering consultancies, and technology development companies were invited to participate. The 264
invited experts had to be working on AR and VR, have more than 3-year experience, and working on a 265
company from the categories mentioned above. The size of the groups was capped at ~15 experts so 266
that the discussions could be managed more easily, and all the participants could have the opportunity 267
to participate. All the participants were different for each workshop. An overview of the participants 268
and the FGDs are presented in Table 2. 269
The FGDs were used to collect the opinion of experts on the field regarding factors that limit and drive 270
the adoption of AR and VR in the construction industry. FGDs are very effective tools for qualitative 271
and exploratory analysis as they allow the participants to build on arguments from the other participants 272
(Kvale, 1994). This is not the case with individual interviews, in which important factors could be 273
missed in the study. A thematic analysis based on an example from literature was used for the qualitative 274
part of the study, which includes: (1) data familiarization, (2) data coding and segmentation, (3) 275
development of themes, and (4) grouping of related themes. Each FGD consisted of two activities: a 276
factor identification activity, in which small groups of participants identified factors; and a group 277
discussion session, in which all the identified factors were discussed among all the participants. In all 278
the activities, a member of the research team was present to guide the activities. The FGDs were audio-279
recorded and notes were taken by hand. All the data generated in the FGDs were compiled and 280
9
categorized into tables. Tables 3 and 4 present samples of the type of data compiled from the FGDs. 281
This data was used to develop a quantitative data collection instrument, which is explained in the next 282
section. 283
5 Quantitative sampling and analysis 284
Based on the findings of the FGDs and the qualitative analysis, 21 limiting factors and 21 driving factors 285
for the adoption of AR and VR in the construction industry were defined, as shown in Tables 6 and 7, 286
respectively. A questionnaire was developed to validate and quantify the importance of both sets of 287
factors. A 1 to 5 Likert scale was used in the questionnaire to codify the responses, in which 1 288
corresponds to the lowest importance and 5 to the highest importance. The respondents were asked to 289
assign an importance value to each of the limiting and driving factors. The questionnaire was pilot-290
tested by 6 experts (4 from industry and 2 from academia) to ensure the clarity of the questions and the 291
structure and logic of the questionnaire. 292
5.1 Respondents composition 293
Experts from academia, construction companies, engineering consultancies, design firms, and 294
technology development companies, focused on AR and VR and based in the UK, were approached to 295
participate. A combination of convenience and stratified sampling methods was used to target potential 296
participants. Stratification was carried out by dividing the potential participants into categories based 297
on the type and size of their organizations. Between 3 to 5 experts from the following eight categories 298
were targeted to participate: (i) top construction companies by revenue, (ii) small and medium 299
construction companies, (iii) top engineering consultancy companies by number of employees, (iv) 300
small and medium engineering consultancy companies, (v) top design firms by number of employees, 301
(vi) small and medium design firms, (vii) technology development companies, and (viii) academia. 302
Within the defined categories, the experts that were readily available to participate were selected 303
(convenience sampling), instead of selecting experts randomly. 304
In total, 45 experts were contacted, and 34 completed questionnaires were received, which represents a 305
75.5% response rate. The distribution of the respondents is as follows (see Table 5): 11.8% are 306
researchers from academic institutions, 20.6% work in construction companies, 32.4% work in 307
engineering consultancies, and 17.6% work in design or architecture offices and in technology 308
development companies. Based on the participants' responses, an expertise level factor was developed 309
to provide an indication of the relevant experience of the respondents. This factor is the average of the 310
following self-declared attributes of the participants: (1) years of professional experience, (2) years of 311
experience using AR&VR, (3) level of implementation complexity in VR, and (4) level of 312
implementation complexity in AR. The distribution of the expertise level factor of the participants is 313
10
presented in Table 5, in which more than 75% of the respondents identify themselves as advanced or 314
experts in the field. 315
5.2 Reliability analysis and multivariate analysis of covariance 316
A reliability analysis was conducted to test the internal consistency of the factors included in the 317
questionnaire. Two metrics were used for the reliability analysis, i.e., Cronbach's Alpha, which is a 318
correlation estimate for randomly equivalent measures; and Gutman’s lambda-2, which estimates 319
correlation for parallel measures. The Cronbach's Alpha and Gutman’s lambda-2 for the limiting factors 320
are 0.749 and 0.791 (Table 6), and for the driving factors are 0.669 and 0.729 (Table 7). The obtained 321
metrics, for both limiting and driving factors, indicate an acceptable internal consistency of the collected 322
data (Nunnally and Bernstein, 1994). A multivariate analysis of covariance was conducted as well to 323
identify whether the different roles of the participants had a significant statistical influence in their 324
responses while controlling for their difference in expertise level. The Pillai’s Trace test statistic was 325
used for the multivariate analysis of covariance, which resulted higher than 0.05 for both the limiting 326
factors (0.478) and the driving factors (0.514) (Table 6 and 7 respectively). This indicates that the 327
different roles do not have a significant effect when controlling for the difference in expertise level 328
(Morrison, 2005). 329
5.3 Results 330
Table 6 and Table 7 present the limiting and driving factors ranked according to the mean value of all 331
the responses, respectively. The median, standard deviation (SD), and skewness are presented as well. 332
The median is presented because it is not affected by outliers, so that very disparate answers do not 333
affect the overall results. The SD provides an indication of how dissimilar the answers are. In this case, 334
it indicates how dissimilar the answers are among respondents. Low SD indicates that respondents agree 335
on the importance of the factors, and high SD indicates disagreement. The highest SD for this study is 336
1.4, which can be considered a low value and may indicate a good agreement among respondents. 337
Skewness measures the degree and direction of asymmetry. A negative skewness indicates that the 338
mean is less than the median and that the distribution of responses is concentrated in high values. A 339
large positive skewness indicates that the distribution of the responses is concentrated in low values; 340
and a skewness equal to zero indicates a normal distribution. Figures 2 and 3 present the distribution of 341
the importance of the limiting and driving factors using Letter-Value plots (Hofmann, Wickham and 342
Kafadar, 2017). Letter-Value plots are a variation of box plots that show more quantiles and provide 343
more information about tail behavior. Letter-Value plots provide a non-parametric representation of a 344
distribution in which all features correspond to actual observations. Using Letter-Value plots is possible 345
to visualize smaller differences among distributions that box plots cannot present. The vertical scales 346
in Figures 2 and 3 indicate the importance of each factor. Different shades of color have been used to 347
11
indicate the varying medians of each factor. Darker shades indicate higher medians, while lighter shades 348
indicate lower medians. 349
The highest-ranked limiting factor is (L11) Expensive hardware and training. It has the lowest SD and 350
a negative skewness, which indicates that for most of the respondents this factor is the most important. 351
The lowest-ranked factor is (L18) It is seen as a cause for job insecurity, which has one of the highest 352
SD and a positive skewness. This indicates variation of opinions between respondents and an overall 353
low importance. The overall standard deviation for limiting factors is 1.18, which indicates that the 354
responses between respondents varied on average less than 1.2 points in the Likert scale. Looking at 355
Figure 4 is possible to identify that six limiting factors (L2, L8, L9, L11, L16, and L21) are regarded as 356
the most important with a median of 4. Limiting factor L4 has the second level of importance (median 357
of 3.5), and the rest have medium importance (median of 3), with the exception of limiting factor L18, 358
which is the less important (median of 2.5). 359
The highest-ranked driving factor is (D11) A way to provide new and better services. It has an average 360
SD and a large negative skewness, which indicates that for most of the respondents this factor is the 361
most important. The lowest-ranked factor is (D4) to be part of the trend, which has one of the highest 362
SD and a large positive skewness. This indicates a variation of opinions between respondents and 363
overall low importance. Similarly, to the limiting factors, the overall standard deviation for driving 364
factors is 1.183. Figure 5 presents D8 and D11 as the most important driving factors with a median of 365
4.5. Thirteen driving factors are considered as very important with a median of 4 and seven as somewhat 366
important with medians of 3.5 and 3. 367
5.4 Principal component analysis 368
Principal Component Analysis (PCA) is a data reduction tool that enables to represent a complex 369
scenario with a large number of correlated variables with fewer uncorrelated variables. In this case, 370
PCA was carried out to identify a smaller set of underlying factors from the previously identified 371
limiting and driving factors. The intention of this analysis is to identify underlying correlations among 372
the identified factors and group them into a smaller set of components. In other words, the intention is 373
to create groups of similar and related factors. Reducing the 42 identified factors into a more 374
manageable number of grouped factors facilitates understanding and contributes to devising actions to 375
drive up adoption. PCA was used to capture as much information in the original factors based on the 376
correlations among them. Tables 8 and 9 present the results of the PCA conducted on the limiting and 377
driving factors, respectively. Four components, or groups of factors, were extracted from the limiting 378
factors and four from the driving factors. Tables 8 and 9 present (1) the percentage of variance, an 379
indication of how much certain component and its grouped factors contribute to representing the 380
complex scenario that the factors described. A higher percentage indicates that the component 381
12
represents better the correlation between factors. (2) The defining factor loading, an indication of how 382
much a factor belongs to a certain component, and (3) the factors communalities, which are estimates 383
of the variance accounted by the factors. Communalities are a metric between 0 and 1, with high values 384
indicating that the extracted components represent the variables well. Note that the factors within each 385
component are ordered based on their defining factor loading and not their importance. 386
Table 8 shows that the four components account for more than 75% of the variance in the responses for 387
the limiting factors. In other words, these four categories represent the underlying key points of 75% of 388
the most important limiting factors. Table 9 shows that the four components account for more than 77% 389
of the variance for the driving factors. The factor loadings and communalities from the limiting and the 390
driving factors indicate that the extracted components represent well all the underlying factors. The 391
components were interpreted into categories and named based on the assigned factors. For the limiting 392
factors, the four categories defined are: (1) “Immature technologies”, (2) “Non-technical issues”, (3) 393
“Special requirements for implementation”, and (4) “Sector structure and client-contractor dynamics”. 394
For the driving factors the four categories defined are: (i) “Improving performance in projects”, (ii) 395
“Improving the companies’ image”, (iii) “Improving companies’ overall performance”, and (iv) 396
“Bolstering research and development”. Note that the categories are ordered based on the percentage 397
of variance that they represent. These eight categories represent the main factors limiting and driving 398
the adoption of AR and VR in the construction industry and are discussed in the next sections. 399
6 Limitations for the adoption of AR and VR in the construction industry 400
This section provides an explanation of the four extracted categories and the corresponding limiting 401
factors presented in Table 8. Note that PCA only defines groups of correlated factors, but it does not 402
specify the correlations. This section seeks to specify and explain these correlations, considering the 403
construction industry context and dynamics. Note as well that the categories are ordered based on their 404
percentage of variance and not on the importance of their individual factors. 405
6.1 Immature technologies 406
The main limitation for the adoption of AR and VR in construction is the perception that they are 407
immature technologies that cannot be fully used in practice yet. Battery limitations (The battery of AR 408
headset usually lasts only 30 minutes), narrow fields of view, low tracking accuracy, low resolutions, 409
uncomfortable HMDs are commonly cited factors that disincentivize the use of AR and VR 410
technologies in real-life projects. Construction and engineering applications demand higher levels of 411
accuracy, consistency, and efficacy. For example, the very complex 3D information models commonly 412
used in construction and engineering cannot be handled by current AR devices. In this respect, most of 413
the AR and VR devices have been developed for the entertainment sector; thus, their lack of capabilities 414
for the engineering and construction sectors. Devices that address the specific high-level requirements 415
13
of professional sectors need to be developed. However, using existing devices for construction and 416
engineering applications is an effective exercise to identify which capabilities need to be improved for 417
the “engineering-level devices” and identify additional ones such as water resistance, ruggedness, etc. 418
Regarding labor dynamics, the construction industry is not yet a mature field, unlike the entertainment 419
industry. It is very difficult for construction firms to attract AR and VR experts who usually prefer the 420
entertainment and gaming industries. There are not enough graduates with the required skills, and only 421
large firms manage to have teams dedicated to AR and VR development. In addition, the workforce in 422
the construction industry needs to be upskilled, which might represent a huge challenge as, in general 423
the construction industry does not have a trained workforce, and upskilling has not been widely 424
employed (Hampson, Kraatz and Sanchez, 2014). 425
6.2 Non-technical issues 426
The second category in importance includes factors related to non-technical issues that limit adoption. 427
For example, it is difficult for firms to get access to expert knowledge and advice. Construction firms 428
do not have knowledge of the AR and VR hardware and software market and its dynamics, and it is 429
difficult to get advice on plans for procurement and to compare devices. It is difficult for firms to get 430
access to finance and justify the investments required because the cost implications and potential 431
benefits are not clear. The immaturity of the AR and VR market and the lack of expert advice are largely 432
responsible for these issues. Also, AR and VR technologies do not have a good reputation in the 433
construction and engineering field. AR and VR technologies are perceived as technologies for 434
entertainment and with limited potential for complex engineering activities. This notion is rightly based 435
on the factors explained in the previous sub-section. However, this notion does not consider the huge 436
potential benefits that “engineering-grade” AR and VR technologies can bring to the AEC sectors. The 437
idea that AR and VR technologies are only for entertainment limits adoption efforts as not enough time 438
is allowed for experimentation. One approach to counter this notion is to highlight the use of other 439
entertainment tools for engineering applications. For example, game engines have been used to develop 440
simulation environments to train driverless cars (Fayjie et al., 2018) and for structural monitoring 441
(Davila Delgado et al., 2018). Lastly, as with every other digital technology, issues with the aversion 442
to change, job insecurity, data security, and data ownership exist. Such issues are particularly pertinent 443
as the construction industry is known for its poor data management practices (Jonassen, 2010), low 444
digitization (Manyika et al., 2015), and untrained workforce (Castro-Lacouture, 2009). 445
6.3 Special requirements for implementation 446
The third category includes limiting factors that concern the special requirements needed to adopt AR 447
and VR technologies. VR requires head-mounted displays (HMDs), special controllers, movement 448
tracking sensors and a powerful personal computer with a high-end graphics processing unit. Only 449
14
specific personal computers and laptops can run VR applications. Mobile VR requires high-end mobile 450
phones and head-mounted adapter. AR requires very expensive HDMs. Mobile AR requires newer 451
versions of mobile phones and tablets. All this equipment can represent a very significant investment, 452
particularly if a wide adoption is planned for which many sets of equipment will be required. More 453
importantly, AR and VR require large spaces or dedicated rooms to set up the equipment. Allocating 454
large empty spaces for AR and VR can represent large costs for small and medium firms. 455
This category also includes the lack of capabilities to ensure a seamless and robust information 456
exchange. This lack of capabilities is amplified by the poor data management and data exchange 457
practices typical in the construction industry (Vähä et al., 2013; Davila Delgado et al., 2016, 2017), 458
and the impossibility of playing content developed for a specific AR or VR device on another one. This 459
lack of interoperability among AR and VR devices limits adoption greatly as construction firms are 460
forced to choose between different platforms. 461
Lastly, AR and VR content is experienced by a single individual. This is perceived as a major limitation 462
for adoption even though multiuser capabilities for AR and VR are now in development. For example, 463
up to 3 people can wear an AR HMD and experience the same content in the same physical location. 464
In the case of VR, up to approximately 25 people can be in the same virtual room while in different 465
physical locations. Nevertheless, these capabilities have not been fully developed. AR multiuser is 466
limited by the bandwidth of the wireless connection, and more importantly, multiuser experiences in 467
which some people use VR HMDs and others use AR HMDs have not been fully developed yet. The 468
lack of effective multiuser capabilities is the reason why AR and VR are perceived as technologies that 469
can improve communication, but that also increase isolation and inhibit collaboration. 470
6.4 Sector structure and client-contractor dynamics 471
The last category in importance includes factors related to the structure of the construction industry and 472
the dynamics between clients and contractors. The AEC sectors are highly fragmented, which limits the 473
adoption of emerging digital technologies (Jonassen, 2010; Vähä et al., 2013). Construction projects 474
are delivered by a large and varied group of small companies (Hampson, Kraatz and Sanchez, 2014), 475
and the supply chain is highly fragmented. The successful adoption of digital technologies like AR and 476
VR will require a lower level of fragmentation and alignment of interests within the supply chain. For 477
example, other sectors such as aerospace and automotive also have very complex and varied supply 478
chains; however, the level of fragmentation is considerably lower, and the digitization is considerably 479
higher as well. The other main factor limiting adoption in this category is the lack of client requirements 480
to use AR and VR technologies in projects. Lack of client requirement has been identified as a 481
significant limitation for the uptake of other digital technologies in the AEC sectors as well (Eadie et 482
al., 2015). The client plays a very important role for adoption, given the high-risk low-profit 483
15
characteristic of the construction sector (Castro-Lacouture, 2009), in which the adoption of new 484
technologies, productivity, and quality improvements are not a priority. 485
7 Drivers for the adoption of AR and VR in the construction industry 486
Similar to the previous section, in here an explanation of the four extracted categories and their 487
corresponding limiting factors (Table 9) is presented. 488
7.1 Improving performance in projects 489
The main driver for the adoption of AR and VR technologies in the AEC sectors is that it can improve 490
the delivery of construction projects. Construction companies recognize that AR and VR can contribute 491
to improve communication and collaboration, improve project understanding, improve productivity, 492
and reduce spending in projects. There is no hard evidence of these benefits in the construction industry, 493
but experiences from other industries are an indication that they can be achieved. For example, Boeing 494
(2018) reported up to a 40% increase in productivity for assembly tasks using AR and other 495
improvements in productivity for industrial applications have been also reported in literature (e.g. 496
Ramírez et al., 2015). Other factors in this category relate to issues that affect project delivery, e.g. the 497
decreasing budgets for construction, the notion of doing more with less, the difficulties in accessing 498
labor, and the lack of government incentives. 499
7.2 Improving the companies’ image 500
The second category includes driving factors related to the potential of AR and VR adoption to improve 501
the image of companies. Nowadays, there is the idea that every successful company is a technology 502
development company. Construction companies are rebranding themselves as smart engineering 503
solutions providers. Construction companies identify the need to adopt digital technologies to improve 504
the reputation of the company. Strong motivators to adopt AR&VR are the desire to not be left out and 505
to have a differentiating advantage in the market. These motivations are accentuated as large technology 506
companies, e.g. IBM (Murchu, Platt and Webb, 2016) and Oracle (Ali, 2018), are venturing into 507
construction. Their expertise in digital technologies such as Big Data and Artificial Intelligence pose 508
huge potentials to revolutionize the global AEC sectors (Bilal et al., 2016; Davila Delgado et al., 2019); 509
which its global market is expected to reach $10 trillion by 2020 (Farnham, 2018). The importance of 510
the construction sector is further emphasized by its share of national GDP, which can represent up to 511
15% of GDP in most countries (Oesterreich and Teuteberg, 2016); and the growing venture capital 512
investment on construction technology start-ups, which reached more than $1 billion in the first half of 513
2018 (Jones, Lang and Lasalle, 2018). In this regard, AR and VR adoption can be driven by a strategic 514
decision from top management or by client requirements, as identified by factors D1 and D2 in Table 515
9. There are indications that suggest that top management decisions on adoption of digital technologies 516
16
are very effective on driving adoption; as highly-digitized companies closely tie their digital and 517
corporate strategies and adapt significantly their corporate strategies to the adoption of new digital 518
technologies (Bughin, LaBerge and Mellbye, 2017). 519
7.3 Improving companies’ overall performance 520
This category includes the factors representing the desire of companies to strive for the success of the 521
company as a whole. The adoption of AR and VR technologies is regarded as a way to provide new 522
and better services and to expand to other the markets. For example, companies from sectors ranging 523
from commerce consultancies to retail and beauty products, are investing significantly in AR and VR 524
technologies. It is also seen as a way to improve the organization’s work culture and to increase overall 525
productivity. The adoption of any emerging digital technology can contribute to improving work culture 526
in organizations (Buchanan, Kelley and Hatch, 2016). The adoption of AR and VR is also considered 527
as a way to reduce risks, which is very important for the construction industry, as is regarded as a high-528
risk sector (Castro-Lacouture, 2009). 529
7.4 Bolstering research and development 530
Bolstering Research and Development (R&D) is the last category of factors that drive adoption, which 531
includes factors D6 (Fostering research curiosity of the employees) and D12 (Increasing R&D 532
investment in the construction sector). The construction industry has not invested sufficiently in R&D 533
(Hampson and Newton, 2009; Bock, 2015), and the scope of the research carried out is too narrow to 534
foster step-change innovations (Forbes and Ahmed, 2011). The lack of sufficient investment in R&D 535
and its narrow scope contribute to a weak innovation culture in the construction industry (Manley et 536
al., 2008). This is exemplified by the remarkably low adoption of digital technologies in the 537
construction industry, as its digitization index is one of the lowest out of 22 different industries surveyed 538
(Manyika et al., 2015). There are strong indications from examples in other sectors, such as automotive 539
and aerospace (Gandhi, Khanna and Ramaswamy, 2016), that increasing the R&D investment in the 540
AEC sectors will drive adoption of digital technologies including AR and VR. Globally, the investment 541
in R&D in construction has doubled in the last decade (Blanco et al., 2018). The UK construction 542
industry has increased its R&D investments 18-fold in last 11 years up to 2017 (Prescott, 2018); moving 543
construction from the bottom of the R&D sector list to an intermediate position. Still, the UK aerospace 544
industry R&D investment is ~4 times larger and the automotive is ~10 times bigger (Prescott, 2018). 545
The levels of R&D investment in the construction industry must continue and accelerate to catch up 546
with the other leading sectors. Notably, the results of this study also indicate that resources —time in 547
particular— must be allocated to foster and enable workers to experiment with emerging technologies. 548
During the FGDs, anecdotical evidence was provided, which indicated that the adoption of AR and VR 549
17
yielded better results when it was driven by a group of enthusiastic workers with enough freedom and 550
time than by a top management decision. 551
Note that factor D17 is not grouped in any of the categories above because is not strongly correlated to 552
them. This factor is the fifth in importance representing a 7.63% percentage of the variance. Factor D17 553
identifies that adequate branding and marketing strategies to present AR and VR solutions as capable 554
of supporting construction and engineering tasks would benefit uptake. 555
8 Discussion 556
The main limitation for adoption is that AR and VR technologies are regarded as expensive and 557
immature technologies. To tackle these issues, R&D efforts should be focused on developing 558
technologies for the specific requirements of the AEC sectors. Given the large investments required to 559
implement AR and VR in terms of equipment, space, time, and upskilling; only by developing AR and 560
VR hardware and software specific for the AEC sectors the investments can be justified. In this respect, 561
further studies are needed to identify what capabilities are required for the AEC sectors and are missing 562
in current AR and VR hardware and software. R&D should address non-technical issues as well. Better 563
AR and VR devices will not be enough. Evidence of accrued value from real-life projects is required as 564
well. Detailed cost-benefit studies and real-life demonstrators have the potential to provide evidence 565
and improve the reputation of the technologies. Future research should consider a more granular study 566
regarding the limitations of AR and VR technologies for specific construction tasks and identify in 567
which phases of the built asset life cycle the implementation is easier and in which phases represent the 568
largest benefits for adoption. 569
Improvements in project delivery and providing new and better services are the main drivers for 570
adoption. R&D efforts should focus on boosting and showcasing these factors. For example, (i) 571
developing workflows that integrate AR and VR into current standard practices, (ii) developing new 572
business models that leverage AR and VR capabilities, and, most importantly, (iii) defining actions to 573
develop a digitally empowered workforce. A study by Gandhi et al., (2016), identified providing digital 574
tools in the hands of their employees is the a key factor to ramp up productivity. In this respect, 575
promoting the use of AR and VR can kick-start a virtuous cycle, in which adoption of AR and VR can 576
improve productivity and the adoption of other emerging digital technologies as well. A more digitized 577
construction industry will potentially help addressing the massive labor shortage in the construction 578
industry as well. For example, in the US there were ~430,000 vacant construction jobs as of April 2019 579
(US-Labor-Bureau, 2019). Nowadays, workers avoid construction jobs, perceiving them as dangerous, 580
difficult, and dirty, as they prefer take on jobs in retail or transportation (Cilia, 2019). A more digitized 581
construction industry will make the industry more appealing and help attract young talent. 582
18
Lastly, stakeholders should explore alternative and innovative use-cases of AR and VR, which will help 583
to justify the investments required to adopt AR and VR. A detailed agenda on future research, new 584
capabilities and innovative use-cases has been presented in a recent report by the authors (Davila 585
Delgado et al., 2019a). Some of the most notable are: (i) AR and VR teleoperation and plant control 586
(Lipton et al., 2018), (ii) diminished reality (Mori, Ikeda and Saito, 2017), and (iii) AR and VR archival 587
(Hahn et al., 2019). 588
Regarding implications for practice, this study provides stakeholders with a manageable number of 589
categories of limiting and driving factors. These categories are explained, and insights are provided 590
considering the specific context and dynamics of the construction industry. Stakeholders can use these 591
insights to devise actions to mitigate the limiting factors and to boost the driving factors. For example, 592
stakeholders can use the information provided in this study to define specific strategies to facilitate the 593
adoption of AR and VR within organizations and to educate clients as well. In this regard, Section 8.1 594
presents a set of short-term and medium-term actions that can help stakeholders to device an action plan 595
to facilitate AR and VR adoption. 596
8.1 Roadmap for improving adoption 597
Based on the limiting factors and informed by the driving factors presented in Tables 8 and 9, a roadmap 598
to improve adoption of AR and VR technologies has been developed. This roadmap sets out a series of 599
short-term and medium-term actions that AEC companies can carry out to increase the adoption of AR 600
and VR technologies within the built environment. The timescales in this table are derived by factoring 601
in the importance of the limitation and the feasibility of its resolution. Short-term refers to actions that 602
can be carried out within a year, and medium-term refers to actions to be carried out within 3 years. 603
The short-term actions are: (i) Increased training opportunities for AEC professionals in AR and VR. 604
Many AEC professionals lack skills in these technologies, and increased training opportunities are 605
required to fill this gap. This can be achieved through increased continuing professional development 606
opportunities and integration of AR and VR skills within university education. Note that digitally 607
engaged workforces are a crucial factor for success of leading companies, which can have employees 608
that are more than 10 times more engaged with digital technologies (Gandhi, Khanna and Ramaswamy, 609
2016). (ii) Increased access to expert knowledge. Many AEC organizations lack expert knowledge to 610
properly leverage AR and VR technologies. To overcome this, a directory of consultants and other 611
organizations able to support organizations through the adoption of these technologies should be 612
established. Additionally, development of in-house expertise should be fostered by attracting talent 613
from other sectors and upskilling of the current workforce. (iii) Correction of industry perceptions and 614
better branding of AR and VR technologies. Industry perceptions of AR and VR technologies are often 615
that they are primarily for “gaming” purposes. To widen the adoption of these technologies this 616
19
perception should be dispelled through an awareness driving initiative and an improved branding of 617
products to signify their professional usage. (iv) Increasing client awareness and decreasing aversion 618
to the possibilities of AR and VR. Construction clients are generally unaware of the benefits of AR and 619
VR technologies and thus reluctant to include this within project costs. Awareness driving activities 620
are required to overcome this. 621
The medium-term actions are: (i) Implementation of systematic and semi-automated workflows to 622
create AR and VR content. AEC companies that have already tested AR and VR should invest in 623
developing automated workflows that facilitate the use of BIM models and project data to generate AR 624
and VR content. Developing systematic and semi-automated workflows facilitates greatly content 625
creation and will increase adoption. For example, the work of Du et al. (2018b) can potentially be very 626
useful to enable real-time synchronization of BIM data with VR applications. (ii) Implementation of 627
data exchange standards and open-source conversion tools. Current AR and VR technologies are not 628
compatible with AEC standard data exchange formats (e.g. Industry Foundation Classes), making the 629
integration of standard AEC software packages and AR and VR software tools difficult. Thus, AEC 630
companies should engage and aid standardization bodies to include support for AR and VR formats. 631
AEC companies should also collaborate on developing open-source conversion tools between AEC file 632
formats and AR and VR formats. In this case, the work of Dris et al. (2019) is very relevant as ontologies 633
that enable bi-directional links between the BIM models and VR applications are essential to ensure 634
robust data exchanges. (iii) Increased support for data security and ownership matters. AR and VR 635
toolchains do not generally address information security and privacy issues out of the box. These are 636
key concerns for many use cases, and AR and VR software tools need to be expanded to provide support 637
for security and privacy out of the box. AEC companies must ask software providers to better support 638
these cases. 639
8.2 Comparison with similar studies 640
Recently there has been a big increase in research reported in literature regarding AR and VR. However, 641
there are no relevant studies that investigate the factors limiting and driving the adoption of both AR 642
and VR in the construction industry. Behzadan et al. (2015) presented a literature review that focuses 643
only on AR for civil infrastructure. The study focuses only on the technical aspects of AR 644
implementation. The authors identify the two main technical problems that AR solutions face for 645
implementation, i.e.: (1) the registration problem, which relates to the difficulties to solve the spatial 646
alignment of real and virtual entities. (2) The occlusion problem, which relates to the visual illusions 647
required so that the virtual and real-world coexist in a credible manner. The main use cases identified 648
by the authors are: support with damage identification, localization of buried elements and support for 649
collaborative design. Li et al. (2018) considered AR and VR together, however, the literature review 650
focuses only on construction safety, for which articles published between 2000 and 2017 were analyzed. 651
20
The authors conclude that the top applications reported in the literature include hazards identification, 652
safety education and training, and safety inspection and instruction. Guo et al. (2017) also presented a 653
review on visualization methods for construction safety management, which addressed AR and VR only 654
in a limited manner. Palmarini et al. (2018) presented a technical review of AR research reported in 655
literature for industrial maintenance tasks in various fields such as aviation, nuclear, consumer 656
technology and plant and mechanical maintenance. The authors conclude that AR is still not sufficiently 657
mature and reliable to comply with industrial requirements. These studies are the most closely related 658
to the investigation presented here. However, the studies above are focused only on a limited set of 659
applications and do not focus on the factors that limit or drive adoption. More importantly, all the studies 660
above arrive at conclusions only based on literature analyses, which limits the amount of information 661
that can be collected and analyzed. The study presented here uses a more robust research method that 662
enables to capture more information with practical relevance about the actual factors limiting and 663
driving adoption. The information was captured directly from practitioners across various types and 664
sizes of AEC companies, which reflects the actual structure of the construction sector in practice. 665
Therefore, the findings presented in this study can capture the whole complex dynamic of AR and VR 666
adoption more effectively. For example, this study describes the non-technical issues that limit 667
adoption, it addresses how the structure and dynamics of the construction sector may affect adoption, 668
and, it defines the factors that AEC companies can leverage to drive adoption; which none of the other 669
studies addressed. 670
Reviews and studies on AR and VR in other fields have been carried out recently as well. Here, 671
examples from Tourism, Healthcare, and Education are presented, which arrived at similar conclusions 672
as this study. This is an indication of the relevance and the potential generalization of the findings 673
presented in this study. Yung and Khoo-Lattimore (2017) presented a literature review on AR and VR 674
research in Tourism. The authors identified the following use cases (i) marketing, (ii) tourism education, 675
(iii) experience enhancement, (iv) improved communication among individuals, and (v) food safety 676
training. The authors note that there are prevalent issues such as a lack of awareness of the technology, 677
poor usability, large time commitment for implementation, and the unwillingness to accept a virtual 678
substitute. Glegg and Levac (2018) presented a scoping review to identify barriers and facilitators to 679
support the implementation of VR in medical rehabilitation. The identified barriers and facilitators were 680
grouped in three categories (1) technology development, which is the level that the technology can meet 681
the user’s objectives or needs; (2) competency development, which is the level of technical skills 682
required to use the technology clinically effectively and safely; and (3) clinical implementation, which 683
is the set of technical, time, training, and spatial requirements necessary to implement the technology. 684
The authors note that there is the need to study the actual effectiveness of the technology; and for 685
targeted development of implementation research, which should help with the development testing and 686
implementation processes. Akçayır and Akçayır (2017) presented a literature review that studied, 687
21
among other topics, the challenges for AR adoption in education. The authors note that the most 688
common problems are (i) the usability difficulties for students to use AR applications, (ii) the additional 689
time requirements, (iii), and the lack of robustness and sensitivity to trigger AR interactions. Ibáñez 690
and Delgado-Kloos (2018) also presented a review, but in this case, it focused on the effects of AR on 691
students. The authors note that there are indications that AR could promote distraction and that it 692
increases cognitive loads. Similar studies should be carried out in the construction sector as well to 693
identify potential negative effects that AR and VR can have on the workers’ performance. 694
8.3 Limitations of this study 695
The main limitation is that the UK was the focus of the study and only academics and professionals 696
based in the UK were engaged. Therefore, the results presented here are not entirely generalizable to 697
other regions (e.g. North America, South America, Europe, Australia, and Asia, etc.) due to the different 698
structures, dynamics, markets, stakeholders, companies, clients, labor, etc. of construction industries in 699
different regions. In this sense, that main limiting and driving factors and the categories presented here 700
might be different in different parts of the world. Hence, other studies that investigate the limiting and 701
driving factors in other parts of the world are required. These studies will help to (i) identify regional 702
differences in the limiting and driving factors, (ii) identify differences in their importance and 703
categorization, and (iii) validate the results presented here. 704
However, the findings and insights presented in this paper could be relevant for AEC practitioners and 705
academics across the developed world, because (i) studies have found existing similarities among the 706
construction industries of developed economies. For example, Barbosa et al. (2017) found that the 707
construction industry’s labor productivity and labor productivity growth are very similar in most 708
European countries, the US, Australia, and Israel. (ii) Many of the experts that participated in this study 709
work for transnational companies and they are either based-on or have experience working in developed 710
economies, including the US, Canada, and the EU. Therefore, the experience of the international 711
participants enriched and broaden the findings of the study presented here. 712
More importantly, as detailed in section 8.1, other studies on AR and VR adoption carried out in other 713
fields (Tourism, Healthcare, and Education) arrived at similar conclusions as this study. This is an 714
indication of the relevance and the potential generalization of the findings here. For example, Yung and 715
Khoo-Lattimore (2017), found that the main limiting factors for adoption are lack of awareness of the 716
technology, poor usability, large time commitment for implementation, and the unwillingness to accept 717
a virtual substitute; which all have been identified in this study as well. 718
Overall, this study can be useful for practitioners and academics outside the UK by providing (i) a good 719
indication of what type of factors could be important for adoption, (ii) an example of AR and VR 720
22
adoption in the construction industry of a developed economy, (iii) and an example of a methodology 721
that can be used in other regions to identify which limiting and driving factors are at play locally. 722
9 Conclusions 723
This paper presented a mixed research study into the factors that limit and drive the adoption of AR and 724
VR in the construction industry. The two main objectives of this paper were (i) to identify, categorize, 725
and rank the relevant factors that limit and drive adoption of AR and VR and (ii) to provide a clear and 726
understandable explanation of these factors to use as the basis to develop mitigating actions. 727
Exploratory workshops and focus group discussions were carried out, in which 54 experts participated 728
from 36 UK organizations from industry and academia. Twenty-one limiting factors and twenty-one 729
driving factors were identified. The importance of the factors was ranked using a quantitative tool and 730
statistical methods. The most important limiting factor is the high cost for equipment and training, and 731
the most important driving factor is that this technology enables new and better services to be provided. 732
PCA was carried out to identify the correlations between the two sets of factors and define a smaller 733
number of manageable factors. Four categories of limiting factors were defined, i.e.: (1) Immature 734
technologies, (2) Non-technical issues, (3) Specific requirements for implementation, and (4) Sector 735
structure and client-contractor dynamics. Four categories of driving factors were also defined, i.e.: (i) 736
Improving performance in projects, (ii) Improving the companies’ image, (iii) Improving companies’ 737
overall performance (iv) Bolstering research and development. The main limitation of adoption is that 738
AR and VR technologies are regarded as expensive and immature technologies. Improvements in 739
project delivery and providing new and better services are the main drivers for adoption. The complex 740
context and dynamics of the construction sector limit the adoption of AR and VR. This study presented 741
a systematic study that contributes to identifying the essential and underlying factors and provides the 742
insights required to devise effective actions to drive adoption. Finally, a roadmap is proposed to 743
implement key short-term and medium-term actions to help overcome these factors. The main 744
contribution to knowledge of this study is that it grouped and characterized a myriad of limiting and 745
driving factors into easily understandable categories; so that, the limiting factors can be effectively 746
mitigated, and the driving factors potentiated. 747
Data Availability Statement 748
Data generated or analyzed during the study are available from the corresponding author by request. 749
Acknowledgements 750
The authors would like to gratefully acknowledge the Cambridge Centre for Digital Built Britain 751
(CDBB) for funding this research, under the Vision Network project via Innovate UK and the 752
Department for Business, Energy and Industrial Strategy. The contribution of the Vision Network core 753
23
members Stephané Côte, Andrew Gamblen, Amer Hijazi, Andrew Jordaan, Mac Muzviwe, Hasan 754
Omar, Hadeel Sadoon, Mohammad Samie and Zakwan Skaf is also acknowledged. 755
10 References 756 Ahn, S., Han, S. and Al-Hussein, M. (2019) ‘2D Drawing Visualization Framework for Applying Projection-Based 757 Augmented Reality in a Panelized Construction Manufacturing Facility: Proof of Concept’, Journal of Computing in 758 Civil Engineering, 33(5), p. 04019032. doi: 10.1061/(ASCE)CP.1943-5487.0000843. 759 Akçayır, M. and Akçayır, G. (2017) ‘Advantages and challenges associated with augmented reality for education: A 760 systematic review of the literature’, Educational Research Review. Elsevier, 20, pp. 1–11. doi: 761 10.1016/J.EDUREV.2016.11.002. 762 Albert, A. et al. (2014) ‘Enhancing Construction Hazard Recognition with High-Fidelity Augmented Virtuality’, 763 Journal of Construction Engineering and Management, 140(7), p. 04014024. doi: 10.1061/(ASCE)CO.1943-764 7862.0000860. 765 Ali, B. (2018) The Silicon Valley giant that wants to reinvent construction, Construction News. Available at: 766 https://www.constructionnews.co.uk/best-practice/technology/the-silicon-valley-giant-that-wants-to-reinvent-767 construction/10034264.article (Accessed: 8 February 2019). 768 Annetta, L. et al. (2009) ‘Bridging Realty to Virtual Reality: Investigating gender effect and student engagement on 769 learning through video game play in an elementary school classroom’, International Journal of Science Education. 770 Routledge , 31(8), pp. 1091–1113. doi: 10.1080/09500690801968656. 771 Aromaa, S. and Väänänen, K. (2016) ‘Suitability of virtual prototypes to support human factors/ergonomics evaluation 772 during the design’, Applied Ergonomics. Elsevier, 56, pp. 11–18. doi: 10.1016/J.APERGO.2016.02.015. 773 Baek, F., Ha, I. and Kim, H. (2019) ‘Augmented reality system for facility management using image-based indoor 774 localization’, Automation in Construction. Elsevier, 99, pp. 18–26. doi: 10.1016/J.AUTCON.2018.11.034. 775 Barbosa, F. et al. (2017) Reinventing construction through a productivity revolution. Available at: 776 https://www.mckinsey.com/industries/capital-projects-and-infrastructure/our-insights/reinventing-construction-777 through-a-productivity-revolution (Accessed: 22 June 2019). 778 Behzadan, A. H., Dong, S. and Kamat, V. R. (2015) ‘Augmented reality visualization: A review of civil infrastructure 779 system applications’, Advanced Engineering Informatics. Elsevier, 29(2), pp. 252–267. doi: 780 10.1016/J.AEI.2015.03.005. 781 Behzadi, A. (2016) ‘Using Augmented and Virtual Reality Technology in the Construction Industry’, American 782 Journal of Engineering Research, 5(12), pp. 350–353. Available at: 783 https://pdfs.semanticscholar.org/2fc8/2c3dfd09f7439fa75a6015c5a8eea1ff19fc.pdf (Accessed: 30 January 2019). 784 Benford, S. et al. (1998) ‘Understanding and constructing shared spaces with mixed-reality boundaries’, ACM 785 Transactions on Computer-Human Interaction. ACM, 5(3), pp. 185–223. doi: 10.1145/292834.292836. 786 Berg, L. P. and Vance, J. M. (2016) ‘An Industry Case Study: Investigating Early Design Decision Making in Virtual 787 Reality’, Journal of Computing and Information Science in Engineering. American Society of Mechanical Engineers, 788 17(1), p. 011001. doi: 10.1115/1.4034267. 789 Bilal, M. et al. (2016) ‘Big Data in the construction industry: A review of present status, opportunities, and future 790 trends’, Advanced Engineering Informatics. Elsevier Ltd, 30(3), pp. 500–521. doi: 10.1016/j.aei.2016.07.001. 791 Billinghurst, M. and Kato, H. (2002) ‘Collaborative augmented reality’, Communications of the ACM. ACM, 45(7), 792 pp. 64–70. doi: 10.1145/514236.514265. 793 Blanco, J. L. et al. (2018) Seizing opportunity in today’s construction technology ecosystem. Available at: 794 https://www.mckinsey.com/industries/capital-projects-and-infrastructure/our-insights/seizing-opportunity-in-todays-795 construction-technology-ecosystem. 796 Bock, T. (2015) ‘The future of construction automation: Technological disruption and the upcoming ubiquity of 797 robotics’, Automation in Construction. Elsevier, 59, pp. 113–121. doi: 10.1016/J.AUTCON.2015.07.022. 798 Boeing (2018) Boeing Tests Augmented Reality in the Factory, Boeing Innovation and Technology. Available at: 799 https://www.boeing.com/features/2018/01/augmented-reality-01-18.page (Accessed: 7 February 2019). 800 Boton, C. (2018) ‘Supporting constructability analysis meetings with Immersive Virtual Reality-based collaborative 801 BIM 4D simulation’, Automation in Construction. Elsevier, 96, pp. 1–15. doi: 10.1016/J.AUTCON.2018.08.020. 802 Boud, A. C. et al. (1999) ‘Virtual reality and augmented reality as a training tool for assembly tasks’, in 1999 IEEE 803 International Conference on Information Visualization (Cat. No. PR00210). IEEE Comput. Soc, pp. 32–36. doi: 804 10.1109/IV.1999.781532. 805
24
Bray, B. and Zeller, M. (2018) What is mixed reality? Microsoft. Available at: https://docs.microsoft.com/en-806 us/windows/mixed-reality/mixed-reality. 807 Buchanan, J., Kelley, B. and Hatch, A. (2016) Digital workplace and culture: How digital technologies are changing 808 the workforce and how enterprises can adapt and evolve. 809 Bughin, J., LaBerge, L. and Mellbye, A. (2017) The case for digital reinvention. Available at: 810 https://www.mckinsey.com/business-functions/mckinsey-digital/our-insights/the-case-for-digital-reinvention. 811 Castro-Lacouture, D. (2009) ‘Construction Automation’, in Springer Handbook of Automation. Berlin, Heidelberg: 812 Springer Berlin Heidelberg, pp. 1063–1078. doi: 10.1007/978-3-540-78831-7_61. 813 Chalhoub, J. and Ayer, S. K. (2018) ‘Using Mixed Reality for electrical construction design communication’, 814 Automation in Construction. Elsevier, 86, pp. 1–10. doi: 10.1016/J.AUTCON.2017.10.028. 815 Chu, M., Matthews, J. and Love, P. E. D. (2018) ‘Integrating mobile Building Information Modelling and Augmented 816 Reality systems: An experimental study’, Automation in Construction. Elsevier, 85, pp. 305–316. doi: 817 10.1016/J.AUTCON.2017.10.032. 818 Cilia, J. (2019) The Construction Labor Shortage: Will Developers Deploy Robotics?, Forbes. Available at: 819 https://www.forbes.com/sites/columbiabusinessschool/2019/07/31/the-construction-labor-shortage-will-developers-820 deploy-robotics/#1d0df4e71988. 821 Creswell, J. (2017) Research design: Qualitative, quantitative, and mixed methods approaches. Sage Publications. 822 Available at: https://scholar.google.com/scholar_lookup?title=Research Design%3A Qualitative%2C 823 Quantitative%2C and Mixed Methods Approaches&author=J.W. Creswell&publication_year=2014 (Accessed: 30 824 October 2018). 825 Davila Delgado, J. M. et al. (2017) ‘Management of structural monitoring data of bridges using BIM’, Proceedings of 826 the Institution of Civil Engineers - Bridge Engineering. Thomas Telford Ltd, 170(3), pp. 204–218. doi: 827 10.1680/jbren.16.00013. 828 Davila Delgado, J. M. et al. (2018) ‘Structural performance monitoring using a dynamic data-driven BIM 829 environment’, Journal of Computing in Civil Engineering, 32(3). 830 Davila Delgado, Juan Manuel et al. (2019) ‘Big Data analytics system for costing power transmission projects’, 831 Journal of Construction Engineering and Management, in press. 832 Davila Delgado, J.M. et al. (2019a) Vision Network Augmented Reality and Virtual Reality for Digital Built Britain. 833 doi: https://doi.org/10.17863/CAM.40454. 834 Davila Delgado, J. M., Brilakis, I. and Middleton, C. R. (2016) ‘Modelling, management, and visualisation of 835 structural performance monitoring data on BIM’, in Transforming the Future of Infrastructure through Smarter 836 Information, Proceedings of the International Conference on Smart Infrastructure and Construction, pp. 543–549. 837 Available at: 838 https://www.researchgate.net/profile/Ioannis_Brilakis/publication/305303327_Modelling_management_and_visualisat839 ion_of_structural_performance_monitoring_data_on_BIM/links/578754e708aea50b6b18f48d.pdf. 840 DeFanti, T. A. et al. (2009) ‘The StarCAVE, a third-generation CAVE and virtual reality OptIPortal’, Future 841 Generation Computer Systems. North-Holland, 25(2), pp. 169–178. doi: 10.1016/J.FUTURE.2008.07.015. 842 Deshpande, A. and Kim, I. (2018) ‘The effects of augmented reality on improving spatial problem solving for object 843 assembly’, Advanced Engineering Informatics. Elsevier, 38, pp. 760–775. doi: 10.1016/J.AEI.2018.10.004. 844 Dong, S. et al. (2013) ‘Collaborative visualization of engineering processes using tabletop augmented reality’, 845 Advances in Engineering Software. Elsevier, 55, pp. 45–55. doi: 10.1016/J.ADVENGSOFT.2012.09.001. 846 Dris, A.-S. et al. (2019) ‘OpenBIM Based IVE Ontology: An Ontological Approach to Improve Interoperability for 847 Virtual Reality Applications’, in Advances in Informatics and Computing in Civil and Construction Engineering. 848 Cham: Springer International Publishing, pp. 129–136. doi: 10.1007/978-3-030-00220-6_16. 849 Du, J., Shi, Y., et al. (2018) ‘CoVR: Cloud-Based Multiuser Virtual Reality Headset System for Project 850 Communication of Remote Users’, Journal of Construction Engineering and Management, 144(2), p. 04017109. doi: 851 10.1061/(ASCE)CO.1943-7862.0001426. 852 Du, J., Zou, Z., et al. (2018) ‘Zero latency: Real-time synchronization of BIM data in virtual reality for collaborative 853 decision-making’, Automation in Construction. Elsevier, 85, pp. 51–64. doi: 10.1016/J.AUTCON.2017.10.009. 854 Dunston, P. S. et al. (2011) ‘An Immersive Virtual Reality Mock-Up for Design Review of Hospital Patient Rooms’, 855 in Collaborative Design in Virtual Environments. Dordrecht: Springer Netherlands, pp. 167–176. doi: 10.1007/978-856 94-007-0605-7_15. 857 Eadie, R. et al. (2015) ‘A survey of current status of and perceived changes required for BIM adoption in the UK’, 858 Built Environment Project and Asset Management. Emerald Group Publishing Limited , 5(1), pp. 4–21. doi: 859 10.1108/BEPAM-07-2013-0023. 860
25
Eiris Pereira, R. et al. (2019) ‘Development and Usability Testing of a Panoramic Augmented Reality Environment 861 for Fall Hazard Safety Training’, in Advances in Informatics and Computing in Civil and Construction Engineering. 862 Cham: Springer International Publishing, pp. 271–279. doi: 10.1007/978-3-030-00220-6_33. 863 Ergan, S. et al. (2019) ‘Quantifying Human Experience in Architectural Spaces with Integrated Virtual Reality and 864 Body Sensor Networks’, Journal of Computing in Civil Engineering, 33(2), p. 04018062. doi: 865 10.1061/(ASCE)CP.1943-5487.0000812. 866 Farnham, D. (2018) Global Construction Industry Expected to Reach $10 trillion by 2020, Case Study Research: 867 Design & Methods: Applied Social Research Methods Series. Available at: http://scalar.usc.edu/works/farnham-868 research/global-construction-industry-expected-to-reach-10-trillion-by-2020 (Accessed: 8 February 2019). 869 Fayjie, A. R. et al. (2018) ‘Driverless Car: Autonomous Driving Using Deep Reinforcement Learning in Urban 870 Environment’, in 2018 15th International Conference on Ubiquitous Robots (UR). IEEE, pp. 896–901. doi: 871 10.1109/URAI.2018.8441797. 872 Fazel, A. and Izadi, A. (2018) ‘An interactive augmented reality tool for constructing free-form modular surfaces’, 873 Automation in Construction. Elsevier, 85, pp. 135–145. doi: 10.1016/J.AUTCON.2017.10.015. 874 Fetters, M. D., Curry, L. A. and Creswell, J. W. (2013) ‘Achieving Integration in Mixed Methods Designs-Principles 875 and Practices’, Health Services Research. Wiley/Blackwell (10.1111), 48(6pt2), pp. 2134–2156. doi: 10.1111/1475-876 6773.12117. 877 Fogarty, J., McCormick, J. and El-Tawil, S. (2018) ‘Improving Student Understanding of Complex Spatial 878 Arrangements with Virtual Reality’, Journal of Professional Issues in Engineering Education and Practice, 144(2), p. 879 04017013. doi: 10.1061/(ASCE)EI.1943-5541.0000349. 880 Forbes, L. H. and Ahmed, S. M. (2011) Modern construction : lean project delivery and integrated practices. CRC 881 Press. 882 Friedrich, W., Jahn, D. and Schmidt, L. (2002) ‘ARVIKA: augmented reality for development, production and 883 service’, in ISMAR 2002. New York, New York, USA: ACM Press, pp. 151–152. doi: 10.1145/354666.354688. 884 Gandhi, P., Khanna, S. and Ramaswamy, S. (2016) ‘Which Industries Are the Most Digital (and Why)?’, Harvard 885 Business Review, April. Available at: https://hbr.org/2016/04/a-chart-that-shows-which-industries-are-the-most-886 digital-and-why. 887 Glegg, S. M. N. and Levac, D. E. (2018) ‘Barriers, Facilitators and Interventions to Support Virtual Reality 888 Implementation in Rehabilitation: A Scoping Review’, PM&R. No longer published by Elsevier, 10(11), pp. 1237-889 1251.e1. doi: 10.1016/J.PMRJ.2018.07.004. 890 Golparvar-Fard, M., Peña-Mora, F. and Savarese, S. (2009) ‘D4AR a 4-dimensional augmented reality model for 891 automating construction progress monitoring data collection, processing and communication’, Journal of information 892 technology in construction, 14(13), pp. 129–153. Available at: 893 https://pdfs.semanticscholar.org/338e/04a889d11a6c6d46827dada3e67dda1833ce.pdf (Accessed: 30 January 2019). 894 GSA, . (2017) Virtual and Augmented Reality Initiative, GSA IT Initiatives. Available at: 895 https://www.gsa.gov/technology/government-it-initiatives/emerging-citizen-technology/virtual-and-augmented-reality 896 (Accessed: 21 June 2019). 897 Guo, H., Yu, Y. and Skitmore, M. (2017) ‘Visualization technology-based construction safety management: A 898 review’, Automation in Construction. Elsevier, 73, pp. 135–144. doi: 10.1016/J.AUTCON.2016.10.004. 899 Hahn, J. et al. (2019) ‘Institutionalizing and Sustaining Virtual Reality Experiences’, in 2019 ACM/IEEE Joint 900 Conference on Digital Libraries (JCDL). IEEE, pp. 325–326. doi: 10.1109/JCDL.2019.00053. 901 Hampson, K. D., Kraatz, J. A. and Sanchez, A. (2014) ‘The global construction industry and R&D’, in R&D 902 Investment in the global construction industry, pp. 1–16. 903 Hampson, K. and Newton, P. (2009) ‘Transforming the built environment through construction innovation’, in 904 Technology, design and process innovation in the built environment. Spoon Press, pp. 29–54. Available at: 905 https://www.taylorfrancis.com/books/e/9781134041831/chapters/10.4324%2F9780203928325-9 (Accessed: 2 October 906 2018). 907 Hassan, H., Taib, N. and Rahman, Z. A. (2018) ‘Virtual Design and Construction: a new communication in 908 construction industry’, in Proceedings of the 2nd International Conference on Digital Signal Processing - ICDSP 909 2018. New York, New York, USA: ACM Press, pp. 110–113. doi: 10.1145/3193025.3193062. 910 Heather Bellini (2016) The Real Deal with Virtual and Augmented Reality, Golman Sacks Technology. Available at: 911 https://www.goldmansachs.com/insights/pages/virtual-and-augmented-reality.html (Accessed: 7 February 2019). 912 Hofmann, H., Wickham, H. and Kafadar, K. (2017) ‘Letter-Value Plots: Boxplots for Large Data’, Journal of 913 Computational and Graphical Statistics. Taylor & Francis, 26(3), pp. 469–477. doi: 10.1080/10618600.2017.1305277. 914 Ibáñez, M.-B. and Delgado-Kloos, C. (2018) ‘Augmented reality for STEM learning: A systematic review’, 915
26
Computers & Education. Pergamon, 123, pp. 109–123. doi: 10.1016/J.COMPEDU.2018.05.002. 916 Jonassen, J. O. (2010) Report on integrated practice. Changing business models in BIM-driven integrated practice. 917 Jones, J., Lang, J. and Lasalle, J. (2018) The state of construction technology. Available at: 918 http://jll.postclickmarketing.com/construction-technology#Section-2A (Accessed: 8 February 2019). 919 Kaiser, R. and Scatsky, D. (2017) For more companies, new ways of seeing, Deloitte Insights. Available at: 920 https://www2.deloitte.com/insights/us/en/focus/signals-for-strategists/augmented-and-virtual-reality-enterprise-921 applications.html (Accessed: 7 February 2019). 922 Kvale, S. (1994) Interviews: An introduction to qualitative research interviewing. Sage Publications. Available at: 923 https://psycnet.apa.org/record/1996-97829-000 (Accessed: 1 March 2019). 924 Li, X. et al. (2018) ‘A critical review of virtual and augmented reality (VR/AR) applications in construction safety’, 925 Automation in Construction. Elsevier, 86, pp. 150–162. doi: 10.1016/J.AUTCON.2017.11.003. 926 Lin, J.-R. et al. (2019) ‘Visualization of indoor thermal environment on mobile devices based on augmented reality 927 and computational fluid dynamics’, Automation in Construction. Elsevier, 103, pp. 26–40. doi: 928 10.1016/J.AUTCON.2019.02.007. 929 Lin, Y.-C. et al. (2018) ‘Integrated BIM, game engine and VR technologies for healthcare design: A case study in 930 cancer hospital’, Advanced Engineering Informatics. Elsevier, 36, pp. 130–145. doi: 10.1016/J.AEI.2018.03.005. 931 Lipton, J. I., Fay, A. J. and Rus, D. (2018) ‘Baxter’s Homunculus: Virtual Reality Spaces for Teleoperation in 932 Manufacturing’, IEEE Robotics and Automation Letters, 3(1), pp. 179–186. doi: 10.1109/LRA.2017.2737046. 933 Lovreglio, R. et al. (2018) ‘Prototyping virtual reality serious games for building earthquake preparedness: The 934 Auckland City Hospital case study’, Advanced Engineering Informatics. Elsevier, 38, pp. 670–682. doi: 935 10.1016/J.AEI.2018.08.018. 936 Manley, K. et al. (2008) ‘The potential contribution of small firms to innovation in the built environment’. Available 937 at: http://eprints.qut.edu.au/17182 (Accessed: 2 October 2018). 938 Manyika, J. et al. (2015) Digital America: A tale of haves and have-mores. 939 Milgram, P. (1994) ‘A Taxonomy of Mixed Reality Visual Displays’, IEICE Transactions on Information Systems, 940 E77-D(12). Available at: http://vered.rose.utoronto.ca/people/paul_dir/IEICE94/ieice.html (Accessed: 12 September 941 2018). 942 Mori, S., Ikeda, S. and Saito, H. (2017) ‘A survey of diminished reality: Techniques for visually concealing, 943 eliminating, and seeing through real objects’, IPSJ Transactions on Computer Vision and Applications. SpringerOpen, 944 9(1), p. 17. doi: 10.1186/s41074-017-0028-1. 945 Morrison, D. F. (2005) ‘Multivariate Analysis of Variance’, in Encyclopedia of Biostatistics. Chichester, UK: John 946 Wiley & Sons, Ltd. doi: 10.1002/0470011815.b2a13045. 947 Motamedi, A. et al. (2017) ‘Signage visibility analysis and optimization system using BIM-enabled virtual reality 948 (VR) environments’, Advanced Engineering Informatics. Elsevier, 32, pp. 248–262. doi: 10.1016/J.AEI.2017.03.005. 949 MTC (2017) VR, AR and MR discovery project. Available at: http://www.the-mtc.org/our-projects/i3p-programme. 950 Mujber, T. S., Szecsi, T. and Hashmi, M. S. J. (2004) ‘Virtual reality applications in manufacturing process 951 simulation’, Journal of Materials Processing Technology. Elsevier, 155–156, pp. 1834–1838. doi: 952 10.1016/J.JMATPROTEC.2004.04.401. 953 Murchu, E., Platt, D. and Webb, G. (2016) The performance advantages of digitizing the built environment. Available 954 at: https://www-01.ibm.com/common/ssi/cgi-bin/ssialias?htmlfid=PQW12354USEN (Accessed: 8 February 2019). 955 National Infrastructure Commission (2017) Data for the Public Good. Available at: https://www.nic.org.uk/wp-956 content/uploads/Data-for-the-Public-Good-NIC-Report.pdf (Accessed: 12 September 2018). 957 Nee, A. Y. C. et al. (2012) ‘Augmented reality applications in design and manufacturing’, CIRP Annals. Elsevier, 958 61(2), pp. 657–679. doi: 10.1016/J.CIRP.2012.05.010. 959 Neges, M. et al. (2017) ‘Combining visual natural markers and IMU for improved AR based indoor navigation’, 960 Advanced Engineering Informatics. Elsevier, 31, pp. 18–31. doi: 10.1016/J.AEI.2015.10.005. 961 Neges, M. and Koch, C. (2016) ‘Augmented reality supported work instructions for onsite facility maintenance’. 962 Available at: http://eprints.nottingham.ac.uk/34761/ (Accessed: 30 January 2019). 963 Nunnally, J. C. and Bernstein, I. H. (1994) Psychometric theory. McGraw-Hill. Available at: 964 https://books.google.co.uk/books/about/Psychometric_Theory.html?id=r0fuAAAAMAAJ&source=kp_book_descripti965 on&redir_esc=y (Accessed: 5 November 2018). 966 Oesterreich, T. D. and Teuteberg, F. (2016) ‘Understanding the implications of digitisation and automation in the 967 context of Industry 4.0: A triangulation approach and elements of a research agenda for the construction industry’, 968
27
Computers in Industry. Elsevier, 83, pp. 121–139. doi: 10.1016/J.COMPIND.2016.09.006. 969 Palmarini, R. et al. (2018) ‘A systematic review of augmented reality applications in maintenance’, Robotics and 970 Computer-Integrated Manufacturing. Pergamon, 49, pp. 215–228. doi: 10.1016/J.RCIM.2017.06.002. 971 Panneta, K. (2018) Gartner Top 10 Strategic Technology Trends for 2019. 972 Pratama, L. A. and Dossick, C. S. (2019) ‘Workflow in Virtual Reality Tool Development for AEC Industry’, in 973 Advances in Informatics and Computing in Civil and Construction Engineering. Cham: Springer International 974 Publishing, pp. 297–306. doi: 10.1007/978-3-030-00220-6_36. 975 Prescott, C. (2018) ‘Dataset: Business enterprise research and development (2006-2017)’. Office for National 976 Statistics. Available at: 977 https://www.ons.gov.uk/economy/governmentpublicsectorandtaxes/researchanddevelopmentexpenditure/datasets/ukb978 usinessenterpriseresearchanddevelopment. 979 Ramírez, H. et al. (2015) ‘Application of Augmented Reality in Statistical Process Control, to Increment the 980 Productivity in Manufacture’, Procedia Computer Science. Elsevier, 75, pp. 213–220. doi: 981 10.1016/J.PROCS.2015.12.240. 982 Rekapalli, P. V. and Martinez, J. C. (2011) ‘Discrete-Event Simulation-Based Virtual Reality Environments for 983 Construction Operations: Technology Introduction’, Journal of Construction Engineering and Management, 137(3), 984 pp. 214–224. doi: 10.1061/(ASCE)CO.1943-7862.0000270. 985 Research and Markets (2018) Augmented Reality and Virtual Reality Market by Offering (Hardware & 986 Software), Device Type (HMD, HUD, Handheld Device, Gesture Tracking), Application (Enterprise, Consumer, 987 Commercial, Healthcare, Automotive), and Geography-Global Forecast to 2023. Available at: 988 https://www.researchandmarkets.com/research/qq837j/global_augmented?w=4 (Accessed: 7 February 2019). 989 Roach, D. M. and Demirkiran, I. (2017) ‘Computer aided drafting virtual reality interface’, in 2017 IEEE/AIAA 36th 990 Digital Avionics Systems Conference (DASC). IEEE, pp. 1–13. doi: 10.1109/DASC.2017.8102142. 991 Schall, G. et al. (2009) ‘Handheld Augmented Reality for underground infrastructure visualization’, Personal and 992 Ubiquitous Computing. Springer-Verlag, 13(4), pp. 281–291. doi: 10.1007/s00779-008-0204-5. 993 Schall, G., Mendez, E. and Schmalstieg, D. (2008) ‘Virtual redlining for civil engineering in real environments’, in 994 2008 7th IEEE/ACM International Symposium on Mixed and Augmented Reality. IEEE, pp. 95–98. doi: 995 10.1109/ISMAR.2008.4637332. 996 Schubert, G. et al. (2015) ‘Tangible Mixed Reality On-Site: Interactive Augmented Visualisations from Architectural 997 Working Models in Urban Design’, in. Springer, Berlin, Heidelberg, pp. 55–74. doi: 10.1007/978-3-662-47386-3_4. 998 Seo, D. W. and Lee, J. Y. (2013) ‘Physical query interface for tangible augmented tagging and interaction’, Expert 999 Systems with Applications. Pergamon, 40(6), pp. 2032–2042. doi: 10.1016/J.ESWA.2012.10.020. 1000 Shi, Y. et al. (2019) ‘Impact assessment of reinforced learning methods on construction workers’ fall risk behavior 1001 using virtual reality’, Automation in Construction. Elsevier, 104, pp. 197–214. doi: 10.1016/J.AUTCON.2019.04.015. 1002 Skulmowski, A. et al. (2016) ‘Embodied learning using a tangible user interface: The effects of haptic perception and 1003 selective pointing on a spatial learning task’, Computers & Education. Pergamon, 92–93, pp. 64–75. doi: 1004 10.1016/J.COMPEDU.2015.10.011. 1005 Turkan, Y. et al. (2017) ‘Mobile augmented reality for teaching structural analysis’, Advanced Engineering 1006 Informatics. Elsevier, 34, pp. 90–100. doi: 10.1016/J.AEI.2017.09.005. 1007 US-Labor-Bureau (2019) ‘Job openings levels and rates by industry and region, seasonally adjusted’. Washington DC: 1008 U.S. Bureau of Labor Statistics. Available at: https://www.bls.gov/news.release/jolts.t01.htm. 1009 Vähä, P. et al. (2013) ‘Extending automation of building construction — Survey on potential sensor technologies and 1010 robotic applications’, Automation in Construction. Elsevier, 36, pp. 168–178. doi: 10.1016/J.AUTCON.2013.08.002. 1011 Webster, A. et al. (1996) ‘Augmented reality in architectural construction, inspection and renovation’, in Proc. ASCE 1012 Third Congress on Computing in Civil Engineering. Available at: 1013 https://www.researchgate.net/profile/Blair_Macintyre/publication/2826659_Augmented_Reality_in_Architectural_Co1014 nstruction_Inspection_and_Renovation/links/0f31753c52918b1309000000.pdf (Accessed: 30 January 2019). 1015 Whyte, J. et al. (2000) ‘From CAD to virtual reality: modelling approaches, data exchange and interactive 3D building 1016 design tools’, Automation in Construction. Elsevier, 10(1), pp. 43–55. doi: 10.1016/S0926-5805(99)00012-6. 1017 Whyte, J. and Nikolic, D. (2018) Virtual Reality and the Built Environment. Second Edi. Routledge. doi: 1018 10.4324/9780080520667. 1019 Wolfartsberger, J. (2019) ‘Analyzing the potential of Virtual Reality for engineering design review’, Automation in 1020 Construction. Elsevier, 104, pp. 27–37. doi: 10.1016/J.AUTCON.2019.03.018. 1021 Woyke, E. (2016) ‘Augmented Reality Could Speed Up Construction Projects’, MIT Technology Review. 1022

28
Yiannakopoulou, E. et al. (2015) ‘Virtual reality simulators and training in laparoscopic surgery’, International 1023 Journal of Surgery. Elsevier, 13, pp. 60–64. doi: 10.1016/J.IJSU.2014.11.014. 1024 Young, T.-C. and Smith, S. (2016) ‘An Interactive Augmented Reality Furniture Customization System’, in. Springer, 1025 Cham, pp. 662–668. doi: 10.1007/978-3-319-39907-2_63. 1026 Yung, R. and Khoo-Lattimore, C. (2017) ‘New realities: a systematic literature review on virtual reality and 1027 augmented reality in tourism research’, Current Issues in Tourism. Routledge, pp. 1–26. doi: 1028 10.1080/13683500.2017.1417359. 1029 Zhao, D. and Lucas, J. (2015) ‘Virtual reality simulation for construction safety promotion’, International Journal of 1030 Injury Control and Safety Promotion. Taylor & Francis, 22(1), pp. 57–67. doi: 10.1080/17457300.2013.861853. 1031 Zhou, Y., Luo, H. and Yang, Y. (2017) ‘Implementation of augmented reality for segment displacement inspection 1032 during tunneling construction’, Automation in Construction. Elsevier, 82, pp. 112–121. doi: 1033 10.1016/J.AUTCON.2017.02.007. 1034
1035
1036
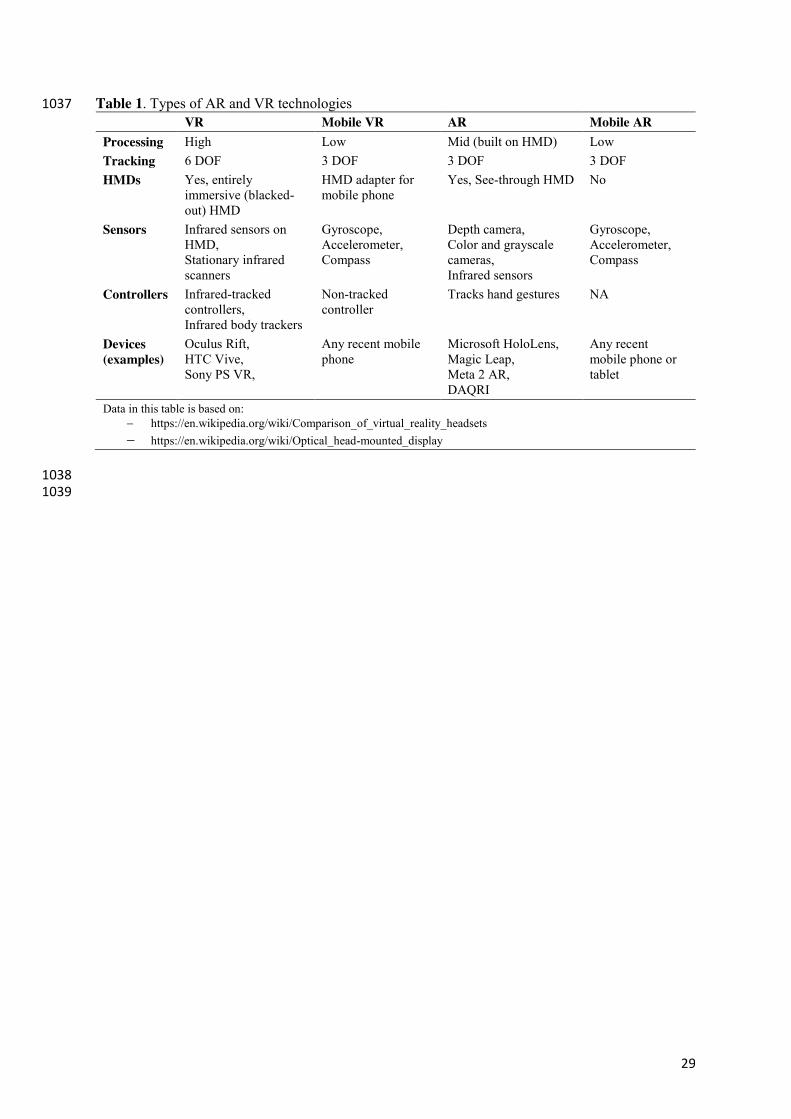
29
Table 1. Types of AR and VR technologies 1037 VR Mobile VR AR Mobile AR Processing High Low Mid (built on HMD) Low Tracking 6 DOF 3 DOF 3 DOF 3 DOF HMDs Yes, entirely
immersive (blacked-out) HMD
HMD adapter for mobile phone
Yes, See-through HMD No
Sensors Infrared sensors on HMD, Stationary infrared scanners
Gyroscope, Accelerometer, Compass
Depth camera, Color and grayscale cameras, Infrared sensors
Gyroscope, Accelerometer, Compass
Controllers Infrared-tracked controllers, Infrared body trackers
Non-tracked controller
Tracks hand gestures NA
Devices (examples)
Oculus Rift, HTC Vive, Sony PS VR,
Any recent mobile phone
Microsoft HoloLens, Magic Leap, Meta 2 AR, DAQRI
Any recent mobile phone or tablet
Data in this table is based on: � https://en.wikipedia.org/wiki/Comparison_of_virtual_reality_headsets � https://en.wikipedia.org/wiki/Optical_head-mounted_display
1038 1039
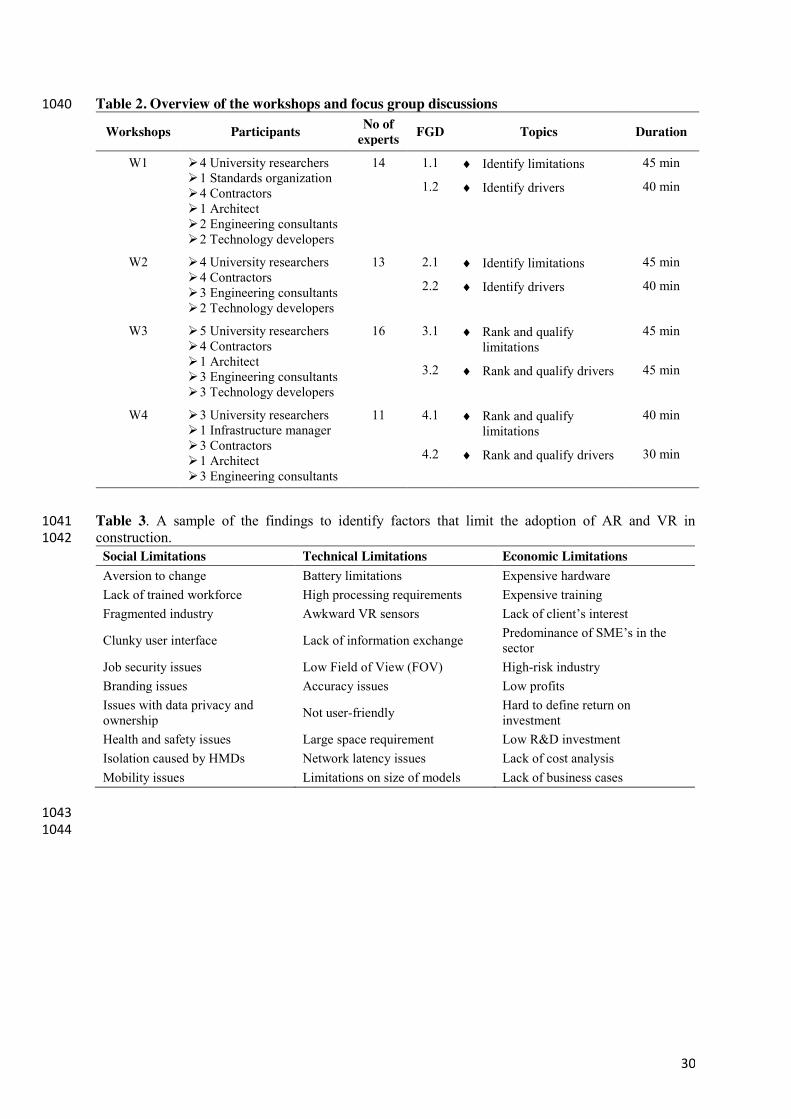
30
Table 2. Overview of the workshops and focus group discussions 1040
Workshops Participants No of experts FGD Topics Duration
W1 ¾ 4 University researchers ¾ 1 Standards organization ¾ 4 Contractors ¾ 1 Architect ¾ 2 Engineering consultants ¾ 2 Technology developers
14 1.1 i Identify limitations 45 min
1.2 i Identify drivers 40 min
W2 ¾ 4 University researchers ¾ 4 Contractors ¾ 3 Engineering consultants ¾ 2 Technology developers
13 2.1 i Identify limitations 45 min
2.2 i Identify drivers 40 min
W3 ¾ 5 University researchers ¾ 4 Contractors ¾ 1 Architect ¾ 3 Engineering consultants ¾ 3 Technology developers
16 3.1 i Rank and qualify limitations
45 min
3.2 i Rank and qualify drivers 45 min
W4 ¾ 3 University researchers ¾ 1 Infrastructure manager ¾ 3 Contractors ¾ 1 Architect ¾ 3 Engineering consultants
11 4.1 i Rank and qualify limitations
40 min
4.2 i Rank and qualify drivers 30 min
Table 3. A sample of the findings to identify factors that limit the adoption of AR and VR in 1041 construction. 1042
Social Limitations Technical Limitations Economic Limitations Aversion to change Battery limitations Expensive hardware Lack of trained workforce High processing requirements Expensive training Fragmented industry Awkward VR sensors Lack of client’s interest
Clunky user interface Lack of information exchange Predominance of SME’s in the sector
Job security issues Low Field of View (FOV) High-risk industry Branding issues Accuracy issues Low profits Issues with data privacy and ownership Not user-friendly Hard to define return on
investment Health and safety issues Large space requirement Low R&D investment Isolation caused by HMDs Network latency issues Lack of cost analysis Mobility issues Limitations on size of models Lack of business cases
1043 1044
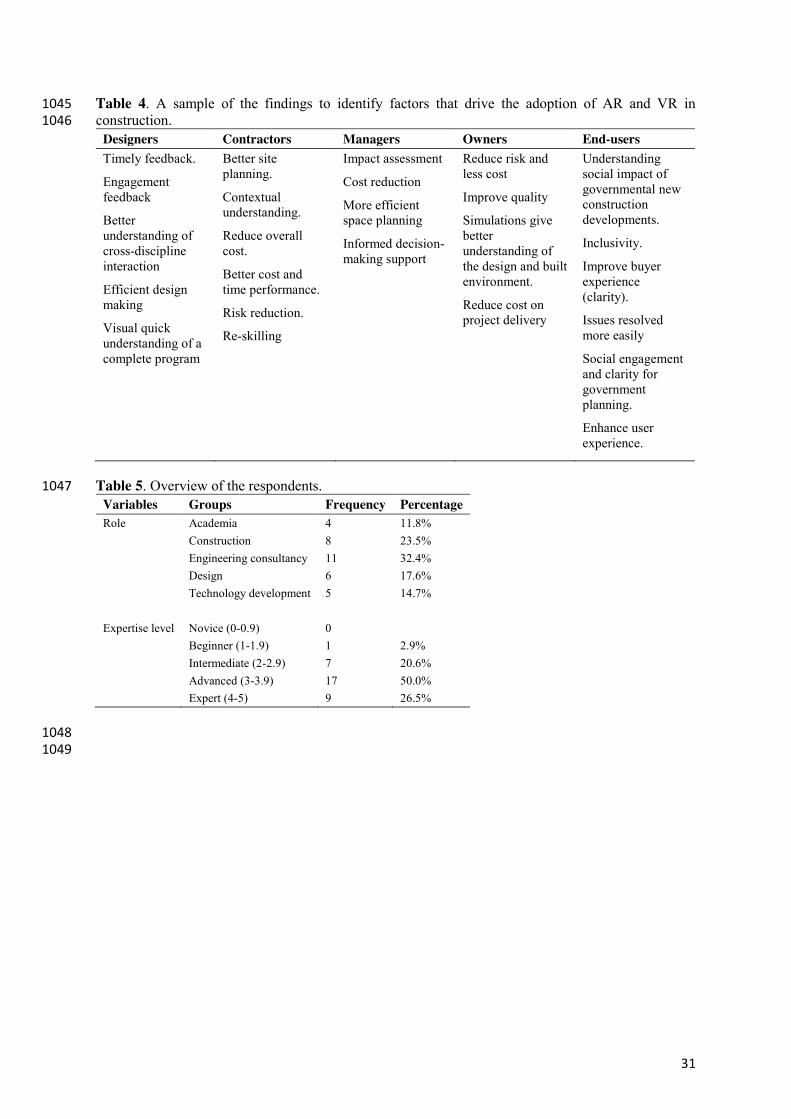
31
Table 4. A sample of the findings to identify factors that drive the adoption of AR and VR in 1045 construction. 1046
Designers Contractors Managers Owners End-users Timely feedback.
Engagement feedback
Better understanding of cross-discipline interaction
Efficient design making
Visual quick understanding of a complete program
Better site planning.
Contextual understanding.
Reduce overall cost.
Better cost and time performance.
Risk reduction.
Re-skilling
Impact assessment
Cost reduction
More efficient space planning
Informed decision-making support
Reduce risk and less cost
Improve quality
Simulations give better understanding of the design and built environment.
Reduce cost on project delivery
Understanding social impact of governmental new construction developments.
Inclusivity.
Improve buyer experience (clarity).
Issues resolved more easily
Social engagement and clarity for government planning.
Enhance user experience.
Table 5. Overview of the respondents. 1047 Variables Groups Frequency Percentage Role Academia 4 11.8% Construction 8 23.5% Engineering consultancy 11 32.4% Design 6 17.6% Technology development 5 14.7% Expertise level Novice (0-0.9) 0 Beginner (1-1.9) 1 2.9% Intermediate (2-2.9) 7 20.6% Advanced (3-3.9) 17 50.0% Expert (4-5) 9 26.5%
1048 1049
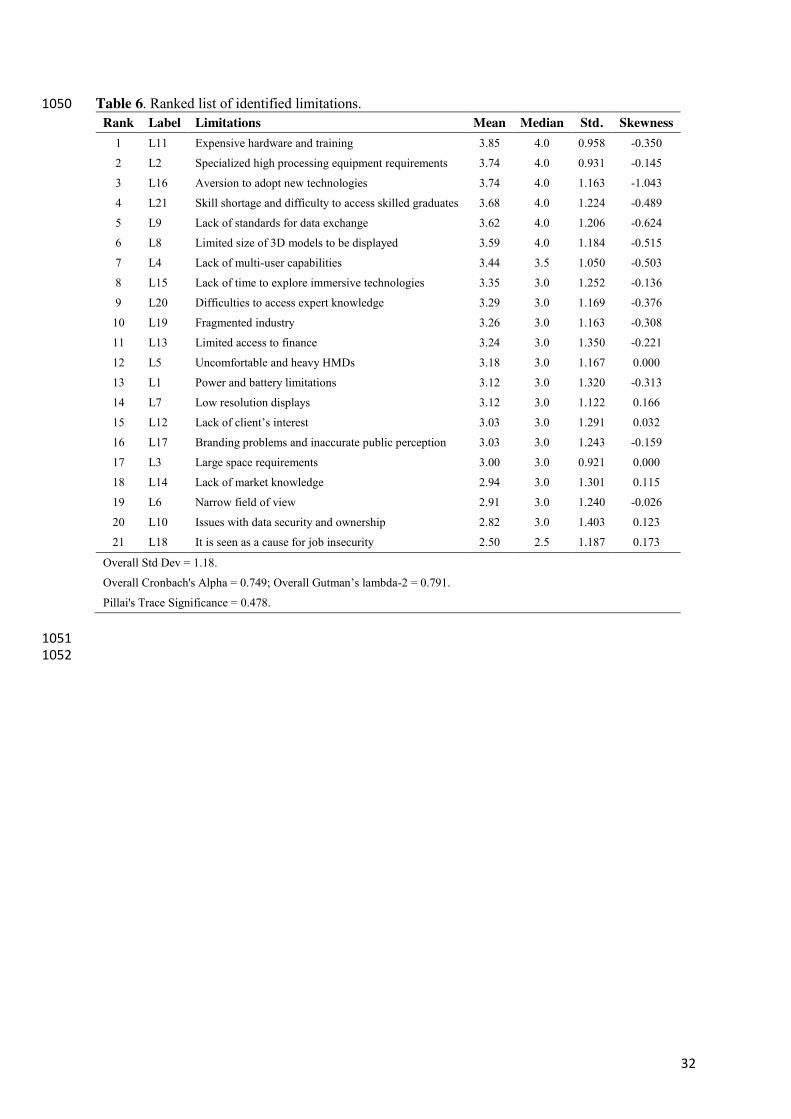
32
Table 6. Ranked list of identified limitations. 1050 Rank Label Limitations Mean Median Std. Skewness
1 L11 Expensive hardware and training 3.85 4.0 0.958 -0.350
2 L2 Specialized high processing equipment requirements 3.74 4.0 0.931 -0.145
3 L16 Aversion to adopt new technologies 3.74 4.0 1.163 -1.043
4 L21 Skill shortage and difficulty to access skilled graduates 3.68 4.0 1.224 -0.489
5 L9 Lack of standards for data exchange 3.62 4.0 1.206 -0.624
6 L8 Limited size of 3D models to be displayed 3.59 4.0 1.184 -0.515
7 L4 Lack of multi-user capabilities 3.44 3.5 1.050 -0.503
8 L15 Lack of time to explore immersive technologies 3.35 3.0 1.252 -0.136
9 L20 Difficulties to access expert knowledge 3.29 3.0 1.169 -0.376
10 L19 Fragmented industry 3.26 3.0 1.163 -0.308
11 L13 Limited access to finance 3.24 3.0 1.350 -0.221
12 L5 Uncomfortable and heavy HMDs 3.18 3.0 1.167 0.000
13 L1 Power and battery limitations 3.12 3.0 1.320 -0.313
14 L7 Low resolution displays 3.12 3.0 1.122 0.166
15 L12 Lack of client’s interest 3.03 3.0 1.291 0.032
16 L17 Branding problems and inaccurate public perception 3.03 3.0 1.243 -0.159
17 L3 Large space requirements 3.00 3.0 0.921 0.000
18 L14 Lack of market knowledge 2.94 3.0 1.301 0.115
19 L6 Narrow field of view 2.91 3.0 1.240 -0.026
20 L10 Issues with data security and ownership 2.82 3.0 1.403 0.123
21 L18 It is seen as a cause for job insecurity 2.50 2.5 1.187 0.173
Overall Std Dev = 1.18.
Overall Cronbach's Alpha = 0.749; Overall Gutman’s lambda-2 = 0.791.
Pillai's Trace Significance = 0.478.
1051 1052
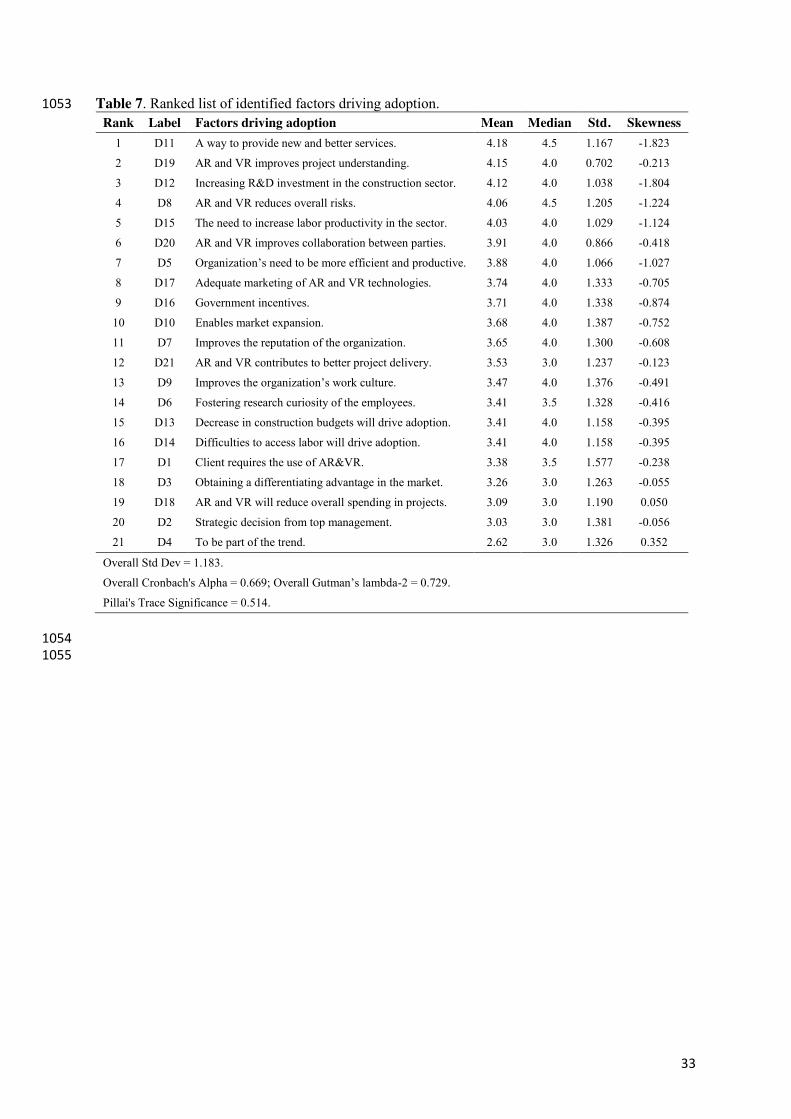
33
Table 7. Ranked list of identified factors driving adoption. 1053 Rank Label Factors driving adoption Mean Median Std. Skewness
1 D11 A way to provide new and better services. 4.18 4.5 1.167 -1.823
2 D19 AR and VR improves project understanding. 4.15 4.0 0.702 -0.213
3 D12 Increasing R&D investment in the construction sector. 4.12 4.0 1.038 -1.804
4 D8 AR and VR reduces overall risks. 4.06 4.5 1.205 -1.224
5 D15 The need to increase labor productivity in the sector. 4.03 4.0 1.029 -1.124
6 D20 AR and VR improves collaboration between parties. 3.91 4.0 0.866 -0.418
7 D5 Organization’s need to be more efficient and productive. 3.88 4.0 1.066 -1.027
8 D17 Adequate marketing of AR and VR technologies. 3.74 4.0 1.333 -0.705
9 D16 Government incentives. 3.71 4.0 1.338 -0.874
10 D10 Enables market expansion. 3.68 4.0 1.387 -0.752
11 D7 Improves the reputation of the organization. 3.65 4.0 1.300 -0.608
12 D21 AR and VR contributes to better project delivery. 3.53 3.0 1.237 -0.123
13 D9 Improves the organization’s work culture. 3.47 4.0 1.376 -0.491
14 D6 Fostering research curiosity of the employees. 3.41 3.5 1.328 -0.416
15 D13 Decrease in construction budgets will drive adoption. 3.41 4.0 1.158 -0.395
16 D14 Difficulties to access labor will drive adoption. 3.41 4.0 1.158 -0.395
17 D1 Client requires the use of AR&VR. 3.38 3.5 1.577 -0.238
18 D3 Obtaining a differentiating advantage in the market. 3.26 3.0 1.263 -0.055
19 D18 AR and VR will reduce overall spending in projects. 3.09 3.0 1.190 0.050
20 D2 Strategic decision from top management. 3.03 3.0 1.381 -0.056
21 D4 To be part of the trend. 2.62 3.0 1.326 0.352
Overall Std Dev = 1.183.
Overall Cronbach's Alpha = 0.669; Overall Gutman’s lambda-2 = 0.729.
Pillai's Trace Significance = 0.514.
1054 1055
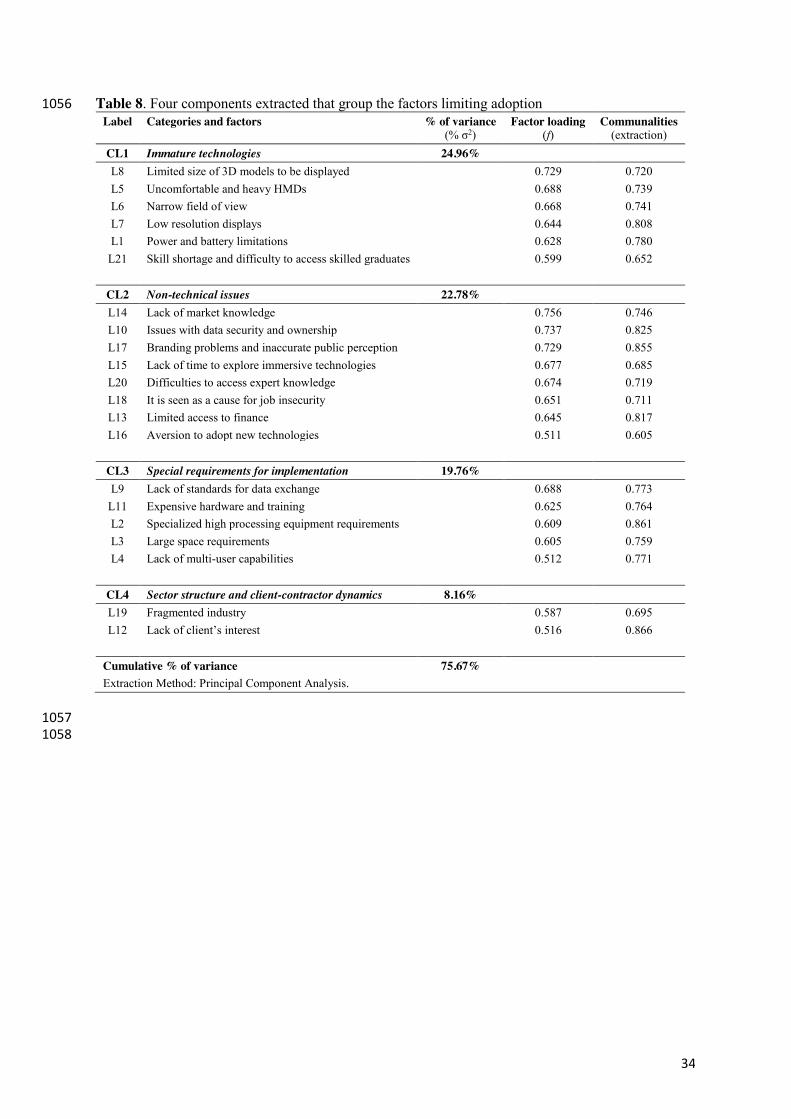
34
Table 8. Four components extracted that group the factors limiting adoption 1056 Label Categories and factors % of variance
(% σ2) Factor loading
(f) Communalities
(extraction) CL1 Immature technologies 24.96% L8 Limited size of 3D models to be displayed 0.729 0.720 L5 Uncomfortable and heavy HMDs 0.688 0.739 L6 Narrow field of view 0.668 0.741 L7 Low resolution displays 0.644 0.808 L1 Power and battery limitations 0.628 0.780
L21 Skill shortage and difficulty to access skilled graduates 0.599 0.652
CL2 Non-technical issues 22.78% L14 Lack of market knowledge 0.756 0.746 L10 Issues with data security and ownership 0.737 0.825 L17 Branding problems and inaccurate public perception 0.729 0.855 L15 Lack of time to explore immersive technologies 0.677 0.685 L20 Difficulties to access expert knowledge 0.674 0.719 L18 It is seen as a cause for job insecurity 0.651 0.711 L13 Limited access to finance 0.645 0.817 L16 Aversion to adopt new technologies 0.511 0.605
CL3 Special requirements for implementation 19.76% L9 Lack of standards for data exchange 0.688 0.773
L11 Expensive hardware and training 0.625 0.764 L2 Specialized high processing equipment requirements 0.609 0.861 L3 Large space requirements 0.605 0.759 L4 Lack of multi-user capabilities 0.512 0.771
CL4 Sector structure and client-contractor dynamics 8.16% L19 Fragmented industry 0.587 0.695 L12 Lack of client’s interest 0.516 0.866
Cumulative % of variance 75.67% Extraction Method: Principal Component Analysis.
1057 1058
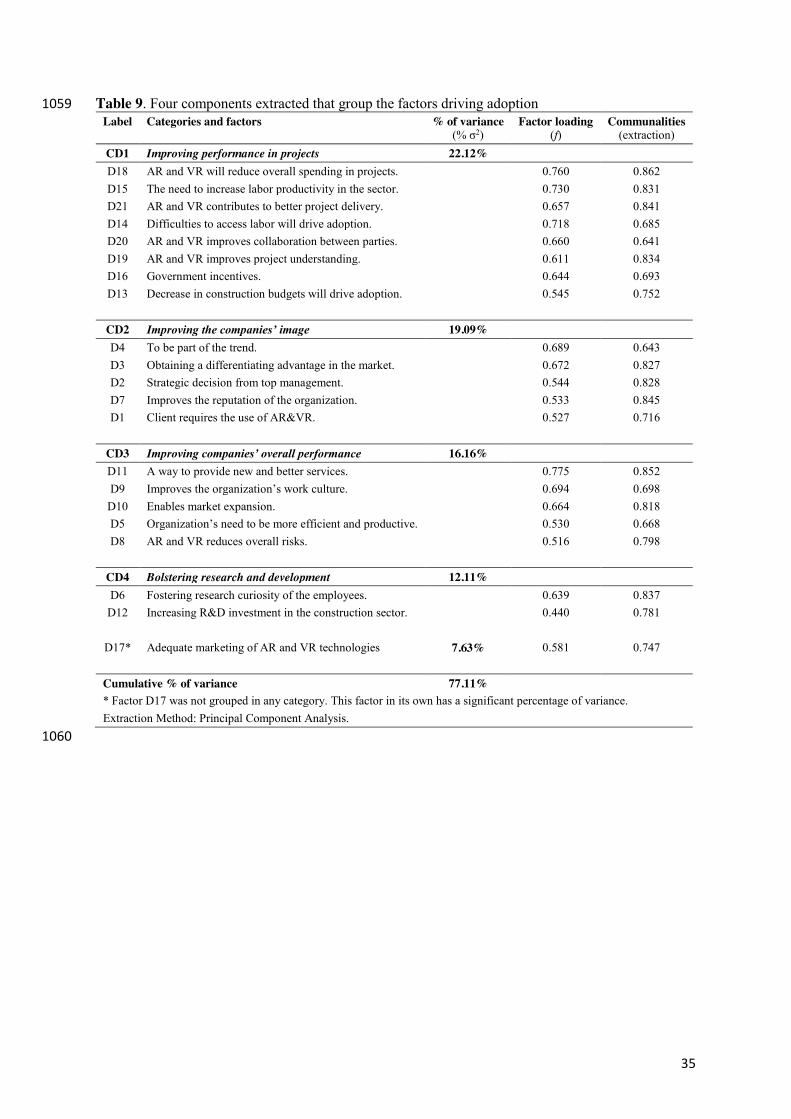
35
Table 9. Four components extracted that group the factors driving adoption 1059 Label Categories and factors % of variance
(% σ2) Factor loading
(f) Communalities
(extraction) CD1 Improving performance in projects 22.12% D18 AR and VR will reduce overall spending in projects. 0.760 0.862 D15 The need to increase labor productivity in the sector. 0.730 0.831 D21 AR and VR contributes to better project delivery. 0.657 0.841 D14 Difficulties to access labor will drive adoption. 0.718 0.685 D20 AR and VR improves collaboration between parties. 0.660 0.641 D19 AR and VR improves project understanding. 0.611 0.834 D16 Government incentives. 0.644 0.693 D13 Decrease in construction budgets will drive adoption. 0.545 0.752
CD2 Improving the companies’ image 19.09% D4 To be part of the trend. 0.689 0.643 D3 Obtaining a differentiating advantage in the market. 0.672 0.827 D2 Strategic decision from top management. 0.544 0.828 D7 Improves the reputation of the organization. 0.533 0.845 D1 Client requires the use of AR&VR. 0.527 0.716
CD3 Improving companies’ overall performance 16.16% D11 A way to provide new and better services. 0.775 0.852 D9 Improves the organization’s work culture. 0.694 0.698
D10 Enables market expansion. 0.664 0.818 D5 Organization’s need to be more efficient and productive. 0.530 0.668 D8 AR and VR reduces overall risks. 0.516 0.798
CD4 Bolstering research and development 12.11% D6 Fostering research curiosity of the employees. 0.639 0.837
D12 Increasing R&D investment in the construction sector. 0.440 0.781
D17* Adequate marketing of AR and VR technologies 7.63% 0.581 0.747
Cumulative % of variance 77.11% * Factor D17 was not grouped in any category. This factor in its own has a significant percentage of variance. Extraction Method: Principal Component Analysis.
1060
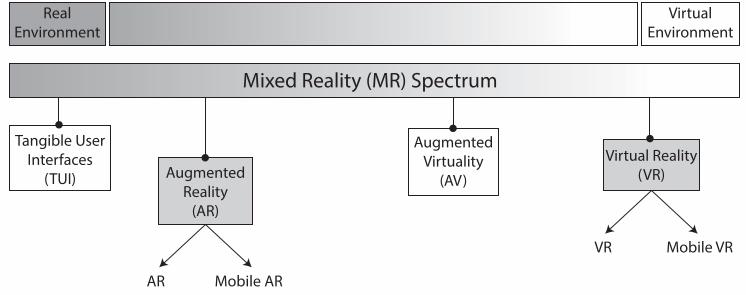
Mixed Reality (MR) Spectrum
RealEnvironment
Tangible UserInterfaces
(TUI) Augmented Reality
(AR)
Mobile ARAR
VR Mobile VR
Augmented Virtuality
(AV)Virtual Reality
(VR)
VirtualEnvironment
Figure1 Click here to access/download;Figure;Fig1.pdf
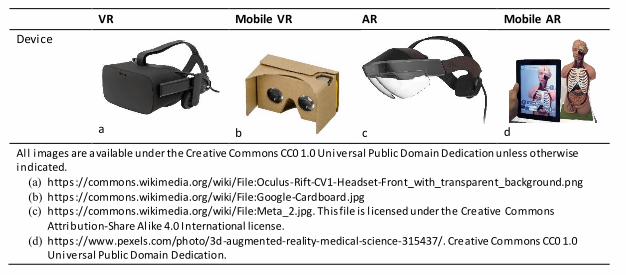
VR Mobile VR AR Mobile AR Device
a b
c
d
Al l images are available under the Creative Commons CC0 1.0 Universal Public Domain Dedication unless otherwise indicated. (a) https ://commons.wikimedia.org/wiki/File:Oculus-Rift-CV1-Headset-Front_with_transparent_background.png (b) https ://commons.wikimedia.org/wiki/File:Google-Cardboard.jpg (c) https ://commons.wikimedia.org/wiki/File:Meta_2.jpg. This file is l icensed under the Creative Commons
Attribution-Share Al ike 4.0 International license. (d) https ://www.pexels.com/photo/3d-augmented-reality-medical-science-315437/. Creative Commons CC0 1.0
Universal Public Domain Dedication.
Figure2 Click here to access/download;Figure;Fig2.pdf
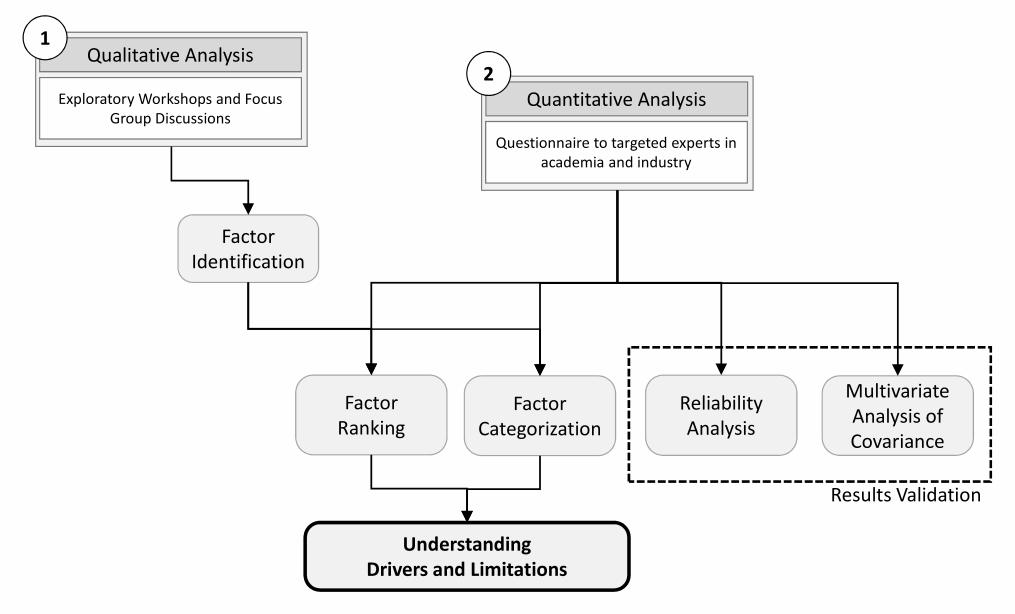
Questionnaire to targeted experts in academia and industry
Quantitative Analysis
Qualitative Analysis
Factor Identification
Factor Ranking
Factor Categorization
Reliability Analysis
Understanding Drivers and Limitations
Results Validation
Multivariate Analysis of Covariance
Exploratory Workshops and Focus Group Discussions
1
2
Figure3 Click here to access/download;Figure;Fig3.pdf
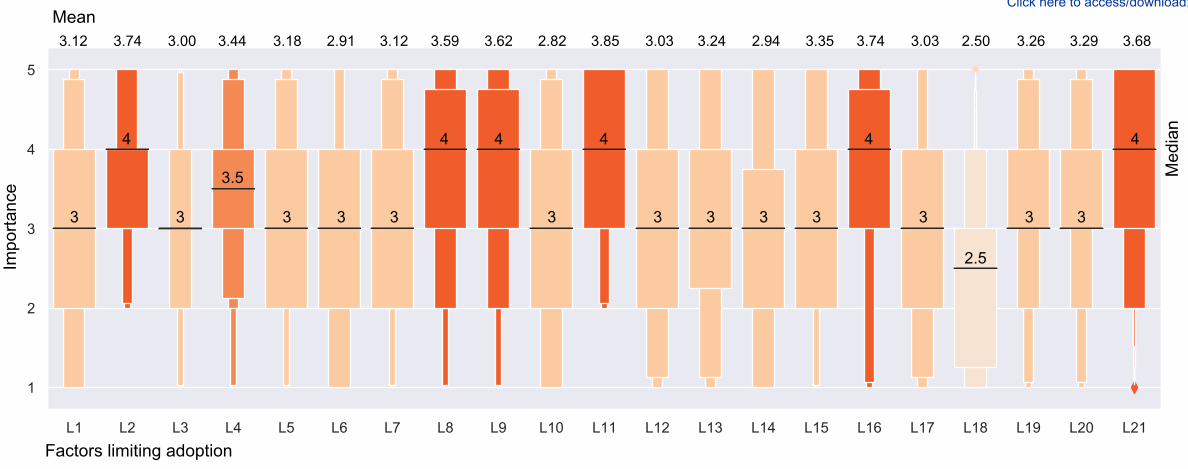
Factors limiting adoption
Impo
rtanc
eMean3.12 3.74 3.00 3.44 3.18 2.91 3.12 3.59 3.62 2.82 3.85 3.03 3.24 2.94 3.35 3.74 3.03 2.50 3.26 3.29 3.68
44444
3333
4
3 333333
3.5
3 3
2.5
Med
ian
Figure4 Click here to access/download;Figure;Fig4.pdf
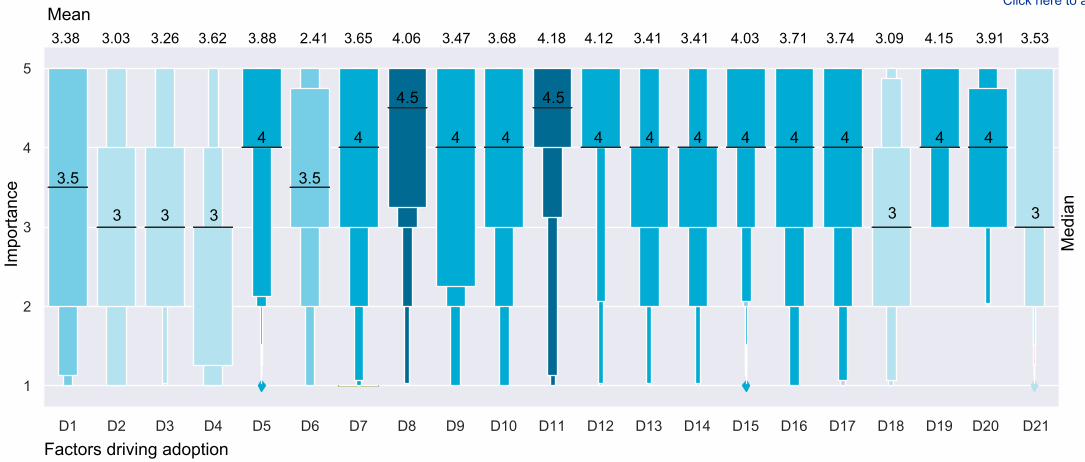
Factors driving adoption
Mean3.38 3.03 3.26 3.62 3.88 2.41 3.65 4.06 3.47 3.68 4.18 4.12 3.41 3.41 4.03 3.71 3.74 3.09 4.15 3.91 3.53
33
444444444
4.54.5
444
3
3.53.5
33
Med
ian
Impo
rtanc
eFigure5 Click here to access/download;Figure;Fig5.pdf