Embed Size (px)
Citation preview
Auditory Display of Biomedical Signals through
a Sonic Representation: ECG and EEG
Sonification
V. Avbelj
Jožef Stefan Institute, Department of communication systems, Ljubljana, Slovenia
Abstract - Visualization is a common way of data
presentation in many fields where processing of visual
information is further done by the human visual system.
Signals from the heart (ECG) and from the brain (EEG) are
normally presented as graphs and are also visually
processed. Such signals can be transformed into sound
(sonification) and then processed by the human auditory
system. We made sonifications of ECG and EEG recordings
to demonstrate the processing capabilities of the auditory
system for these types of signals.
I. INTRODUCTION
An electrocardiogram (ECG) is a recording of electrical activity of the heart. In non-invasive measurements the electrodes are placed on the skin at several strategic locations. The result of the measurement is normally presented as a graph for visual inspection and analysis. With a standard 12-lead ECG, which is routinely used in medicine as diagnostic tool, the interpretation of its recordings are made automatically by the machine itself based on the knowledge accumulated in the last century. An ECG is used also for other purposes, namely for monitoring of patients during surgeries and in intensive care units, in implantable pacing and defibrillator devices, in long term ECG recorders for arrhythmia analysis etc. An electroencephalogram (EEG) is a recording of electrical activity of the brain. The electrodes are placed on the head at a number of places, even at up to several hundred of them. As with the ECG, the recording is presented as a graph of many traces for visual inspection and analysis.
Sonification is a procedure where a signal (or any other information), that is not a sound by its nature, is transformed into sound. As such, the analysis of the sound can be made by the human auditory system. ECG is the result of an electrical activation (depolarization, repolarization) of many hundred million heart cells working in highly synchronized manner. Could we hear this music [1]? On the other hand, EEG is the result of an orchestrated action of nearly 10
11 neurons in the brain
where an average frequency of neuron activity is 1.7 Hz [2].
The heart sounds are the result of mechanical movement of the heart, blood and tissues that can be heard by a stethoscope directly. Transformation of ECG and EEG signals into sound and listening (auditory display)
gives a different insight into biological signals than graphical presentation [3].
II. SONIFICATION OF ECG AND EEG RECORDINGS
A. Human sound processing capabilities
The complexity of the auditory system is comparable to the complexity of the visual one. Although much is known about the sensory organ and the interconnections in the brain where the sound gets processed, it will be a challenge for future researchers to understand how this complex system analyzes and utilizes auditory information [4].
To demonstrate the capabilities of the human auditory system, we simultaneously played five songs performed by the same singer [3]. First the listener heard only one of the five songs and then he/she tried to track it in the mixture of all five songs being played together (Fig. 1).
This task is not too hard for the human auditory system even though the signal to be tracked is deeply buried in the noise of other four songs. The question of sonification is how to use such sound processing capabilities for other tasks; namely for analyses of ECG and EEG recordings.
Figure 1. Short traces (0.5 s) of stereo recordings of five songs
performed by the same singer. The task for the listener is to track the first song (darker) in the mixture of all five songs played together.
MIPRO 2012/DC-VIS 491
B. Sonification of ECG
It has been recently shown that the heartbeats of pregnant mother and unborn child are interconnected [5, 6]. They found a definite increase in synchronization epochs mostly at high maternal respiratory rates through the synchronization analysis of ECG recordings. Sonification of maternal and fetal ECG was made in the Fetal Heart Music Project of the Paracelsus Clinic [7]. The maternal heart rate was sonified as a cello and additionally as a piano. The fetal heart rate was sonified as a flute. The instantaneous heart rate was calculated for every consecutive heartbeat and given a musical note value, according to whether the rate is rising or falling. If the heart rate remained constant, the note was prolonged. A short example of the music produced is shown in Fig. 2.
Another way of ECG sonification is achieved by fast playback of the original recording. We can examine 24-hour ECG recording in a few minutes. Yet another way of sonification is to pre-process an ECG, extracting characteristics such as the time interval between ECG waves or the amplitude of a particular wave (P, Q, R, S, T and U), or an ST-segment denivelation. Thus extracted features are then sonified.
C. Sonification of EEG
The frequencies of EEG signals measured on the head are well below human auditory perception. However, EEG signals are easily heard when speed up 20 times during reproduction. To show the performance of human auditory system, we sonified an EEG recording obtained during a routine EEG test (20 minutes). During the test, the patient opened and closed the eyes several times, respired deeply and rapidly (hyperventilation) and was exposed to flashing light with different frequencies (eyes closed).
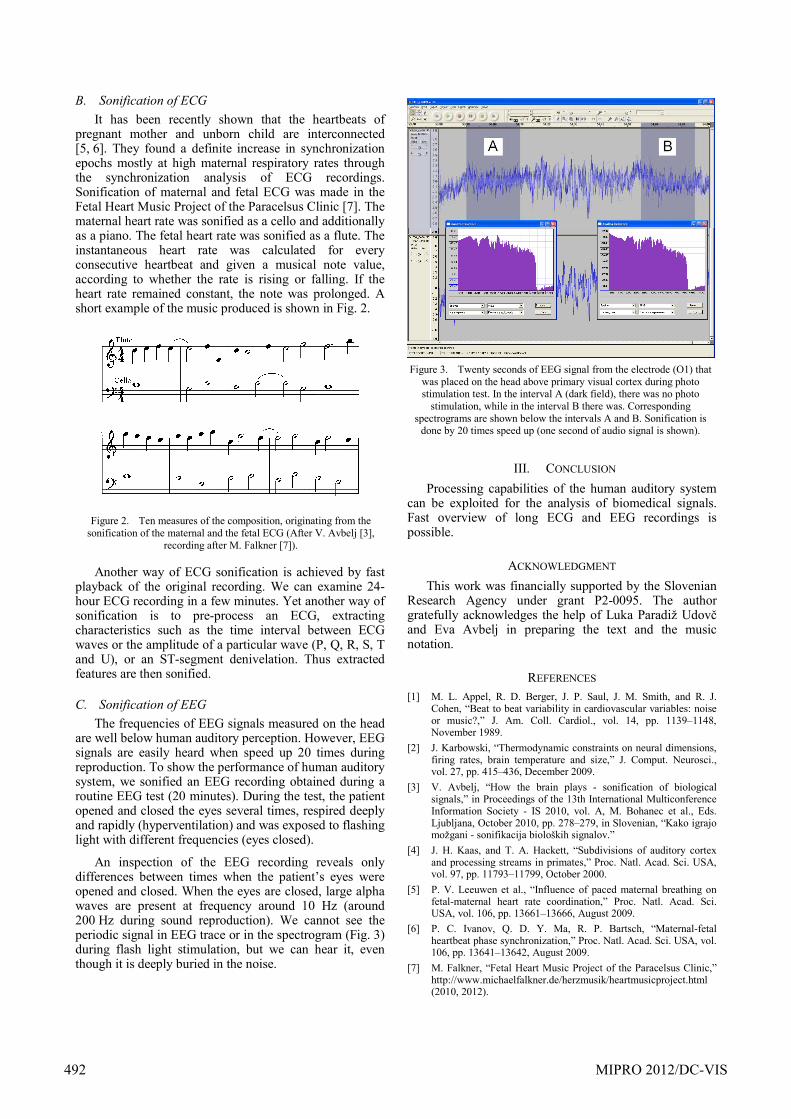
An inspection of the EEG recording reveals only differences between times when the patient’s eyes were opened and closed. When the eyes are closed, large alpha waves are present at frequency around 10 Hz (around 200 Hz during sound reproduction). We cannot see the periodic signal in EEG trace or in the spectrogram (Fig. 3) during flash light stimulation, but we can hear it, even though it is deeply buried in the noise.
III. CONCLUSION
Processing capabilities of the human auditory system can be exploited for the analysis of biomedical signals. Fast overview of long ECG and EEG recordings is possible.
ACKNOWLEDGMENT
This work was financially supported by the Slovenian Research Agency under grant P2-0095. The author gratefully acknowledges the help of Luka Paradiž Udovč and Eva Avbelj in preparing the text and the music notation.
REFERENCES
[1] M. L. Appel, R. D. Berger, J. P. Saul, J. M. Smith, and R. J. Cohen, “Beat to beat variability in cardiovascular variables: noise or music?,” J. Am. Coll. Cardiol., vol. 14, pp. 1139–1148, November 1989.
[2] J. Karbowski, “Thermodynamic constraints on neural dimensions, firing rates, brain temperature and size,” J. Comput. Neurosci., vol. 27, pp. 415–436, December 2009.
[3] V. Avbelj, “How the brain plays - sonification of biological signals,” in Proceedings of the 13th International Multiconference Information Society - IS 2010, vol. A, M. Bohanec et al., Eds. Ljubljana, October 2010, pp. 278–279, in Slovenian, “Kako igrajo možgani - sonifikacija bioloških signalov.”
[4] J. H. Kaas, and T. A. Hackett, “Subdivisions of auditory cortex and processing streams in primates,” Proc. Natl. Acad. Sci. USA, vol. 97, pp. 11793–11799, October 2000.
[5] P. V. Leeuwen et al., “Influence of paced maternal breathing on fetal-maternal heart rate coordination,” Proc. Natl. Acad. Sci. USA, vol. 106, pp. 13661–13666, August 2009.
[6] P. C. Ivanov, Q. D. Y. Ma, R. P. Bartsch, “Maternal-fetal heartbeat phase synchronization,” Proc. Natl. Acad. Sci. USA, vol. 106, pp. 13641–13642, August 2009.
[7] M. Falkner, “Fetal Heart Music Project of the Paracelsus Clinic,” http://www.michaelfalkner.de/herzmusik/heartmusicproject.html (2010, 2012).
Figure 2. Ten measures of the composition, originating from the
sonification of the maternal and the fetal ECG (After V. Avbelj [3],
recording after M. Falkner [7]).
Figure 3. Twenty seconds of EEG signal from the electrode (O1) that
was placed on the head above primary visual cortex during photo stimulation test. In the interval A (dark field), there was no photo
stimulation, while in the interval B there was. Corresponding
spectrograms are shown below the intervals A and B. Sonification is done by 20 times speed up (one second of audio signal is shown).
492 MIPRO 2012/DC-VIS