Embed Size (px)
Citation preview

Cryosite Limited ABN 86 090 919 476
Appendix 4E Full year report
0BResults for announcement to the market
1. Details of Reporting Period The financial information contained in this report is for the year ended 30 June 2018. Comparative amounts (unless otherwise indicated) relate to the year ended 30 June 2017.
2. Results for Announcement to the Market $A'000 2.1 Revenue from ordinary activities: Up 0.67% to 5,923 2.2 Profit(loss) from ordinary activities after tax attributable to members:
Down 651% to (1,240)
2.3 Net profit (loss)for the period attributable to members:
Down 651% to (1,240)
3. Dividends The Board of Cryosite has recommended that no dividends be paid. 4. Commentary on the results to the market
The audited annual accounts are attached. Please refer to these for full results and commentary.
1B5. NTA backing
Current period
Previous corresponding
Period Net tangible asset backing per ordinary security
4.0 cents 5.5 cents
8
For
per
sona
l use
onl
y
CRYOSITE LIMITED ABN 86 090 919 476
Annual Report for the year ended 30 June 2018
For
per
sona
l use
onl
y

Table of Contents
Page
Corporate Information 1
Chairman’s Letter to Shareholders 2
Directors’ Report 4
Auditor’s Independence Declaration 20
Corporate Governance Statement 21
Directors’ Declaration 22
Consolidated Statement of Comprehensive Income 23
Consolidated Statement of Financial Position 24
Consolidated Statement of Changes in Equity 25
Consolidated Statement of Cash Flow 26
Notes to the Financial Statements 1 Corporate Information 27 2 Summary of Significant Accounting Policies 27 3 Significant Accounting Judgements, Estimates and Assumptions 41 4 Segment Information 44 5 Revenue 46 6 Expenses 46 7 Income Tax 47 8 Earnings Per Share 49 9 Dividends Paid and Proposed 51
10 Cash and Cash Equivalents 51 11 Cash Flow Statement Reconciliation 52 12 Current Assets - Trade and Other Receivables 52 13 Current Assets – Inventories 54 14 Prepayments 54 15 Non-Current - Trade and Other Receivables 54 16 Non-Current Assets – Investments in Subsidiaries 55 17 Non-Current Assets - Plant and Equipment 55 18 Non-Current Assets - Intangible Assets 56 19 Trade and Other Payables 58 20 Current Liabilities – Unearned Income 59 21 Non-Current Liabilities - Unearned Income 59 22 Non-Current Liabilities – Provisions 59 23 Contributed Equity and Accumulated Losses 61 24 Reserves 62 25 Commitments and Contingencies 62 26 Events After Balance Date 63 27 Auditors’ Remuneration 63 28 Related Party Disclosures 63 29 Shared-Based Payments Expense 64 30 Key Management Personnel 66 31 Financial Instruments 67 32 Parent Entity Financial Information 72 33 Discontinued Operations 73 34 Legal Settlement 74
Independent Audit Report
ASX Additional Shareholder Information
For
per
sona
l use
onl
y

CRYOSITE LIMITED – ANNUAL REPORT
Corporate Information
ABN 86 090 919 476
DIRECTORS
Mr. Bryan Dulhunty (Non-Executive Chairman) Mr. Andrew Kroger (Non-Executive Director)
Mrs Nicola Swift (Non-Executive Director)
COMPANY SECRETARY
Mr. Bryan Dulhunty (CoSA Life Science - Corporate)
REGISTERED OFFICE AND PRINCIPAL PLACE OF BUSINESS
13a Ferndell Street SOUTH GRANVILLE NSW 2142 Telephone: +61 2 8865 2000 Fax: +61 2 8865 2090
Email: [email protected]
SHARE REGISTER
Link Market Services Limited Level 8, 580 George Street SYDNEY NSW, 2000
Telephone: +61 2 8260 7111
AUDITORS
Mazars Risk & Assurance Pty Limited Level 12, 90 Arthur Street NORTH SYDNEY NSW, 2060 Telephone: +61 2 9922 1166
INTERNET ADDRESS
www.cryosite.comFor
per
sona
l use
onl
y
Chairman’s Letter to Shareholders
2
Dear Shareholders,
Cryosite Group’s financial year has been disappointing, incurring a loss before tax of $1,240,439. This loss largely reflects the impact of the closure of part of the Company’s Cord Blood and Tissue business, the future collection, processing and storage of cord blood and tissue, following declining demand for these services.
In June 2017, the company announced that it had entered into a binding agreement to license, under the Cryosite brand, the future collection, processing and storage of cord blood and tissue and to sell certain cord blood and tissue banking assets to Cell Care Australia Pty Ltd. The company received an upfront cash payment in June 2017 and the deal was subject to shareholder and regulatory approval.
In August 2017, the company was notified by the Australian Competition and Consumer Commission (ACCC) that it would publicly review the proposed transaction to license the future collection, processing and storage of cord blood and tissue and to sell certain assets of its business.
In December 2017, the ACCC informed the company it had discontinued its review of the proposed transaction between Cryosite and Cell Care without making a decision. The company noted that the ACCC was to continue to investigate the circumstances surrounding the entry into the agreement and the closing of the Cryosite cord blood and tissue collection operations.
The ACCC did not however confirm in writing to Cryosite that it would not oppose the transaction. This was a condition precedent of the sale contract and therefore meant that the transaction could not proceed as the condition was not fulfilled. The parties however had the right to waive the condition precedent under the sale agreement.
In January 2018, Cryosite was informed by Cell Care that it was unwilling to waive its rights. Cryosite had already indicated that it was willing to waive its rights under the sale agreement. As a direct consequence, Cryosite was unable to complete the transaction with Cell Care.
On the 11th July 2018, the Company was notified by the ACCC that it would commence civil proceedings against Cryosite in the Federal Court of Australia. As a result, the Company expects it will incur substantial legal costs with the potential to incur financial penalties in the 2019 financial year.
The decision to cease the future collection and processing of cord blood and tissue required a board review of all non-financial assets associated with that business. In October 2017, the company completed the closure of the laboratory and departure of staff associated with the collection and processing of cord blood and tissue. As a consequence of the business closure, subsequent write downs and legal costs related to the ACCC action, the residual business result was a post-tax loss from discontinued operations of $995,743.
Following the closure of the future collection, processing and banking of cord blood and tissue samples in financial year 2018, the Company now has two operating segments.
• Cord Blood and Tissue Storage for existing clients under long term contracts; and
• Logistics management of pharmaceutical products used in clinical trials and biological materials
Cord Blood and Tissue Storage
Cord Blood and Tissue Storage under long term contracts: The Company continues to provide long term storage for existing clients of their Cord Blood and Tissue samples under both long- term contracts and annual contracts. F
or p
erso
nal u
se o
nly

Chairman’s Letter to Shareholders
3
This segment will be significantly impacted by the introduction on 1st July 2018 of a new accounting standard AASB 15 relating to the recognition of revenue.
A requirement of this standard requires the balance sheet of the company to be restated as if this accounting standard was always in effect. Full details of the effect of this standard and a proforma balance sheet are set out in Note 2 to the accounts. All adjustments are non-cash and all adjustments are expected to reverse over the period of the contracts.
The initial effect of the introduction of this standard will be to reduce the Net Assets of the Company by approximately $2million on the 1st July 2018. In the 12 months ending 30 June 2019, it will result in the Company booking an accounting (non- cash) net profit from the storage of Cord Blood and Tissue under long term contracts of approximately $600,000 after tax.
Logistics management of pharmaceutical products used in clinical trials and biological materials
The company sees and has identified significant opportunities to further build on its expertise in long term cold, frozen and cryogenic storage, logistics and distribution.
The company executed the infrastructure investments foreshadowed in the 2017 annual report by acquiring new alarm and monitoring systems and upgrading the air conditioning systems for our storage facilities and by acquiring and commencing the implementation of new technology platform.
The company further continued to execute on a strategy of expansion and investment. There has been capital investment in a refurbishment at our South Granville headquarters to add additional processing capacity for individual client specific solutions. The company has developed and launched a “green” reusable packaging solution for its clients. The “Credo Shipper” is a reusable passive thermal container which has allowed the company to offer a sustainable reusable cold chain packaging solution that lessens their carbon footprint and reduces waste.
At the start of the 2019 financial year, as a result of a client consolidating their warehousing and logistics management of a commercial scale product with an international distribution business, we expect to see a significant negative impact in revenue and profits in the first half of the year. However, as a result of the Company’s investment in 2018 in additional staff, marketing and infrastructure we expect the Company will replace these lost sales by the end of the financial year.
Clearly 2019 will be a challenging year for the Company, however the Company expects to end the year with a clear focus and a profitable and growing clinical trial logistic business supported by the long-term storage Cord Blood and Tissue contracts.
Your faithfully
Bryan Dulhunty Chairman
For
per
sona
l use
onl
y

Directors’ Report
4
The directors present their report together with the financial statements on the consolidated entity (the Group) consisting of Cryosite Limited (the Company) and the entity it controlled for the year ended 30 June 2018.
DIRECTORS
The following persons were non-executive directors of Cryosite Limited during the whole of the financial year and up to date of this report unless otherwise stated:
Mr. Bryan Dulhunty (Chairman) - appointed 2/3/2018 Mr. Andrew Kroger Mrs. Nicola Swift Mr. Stephen Roberts – resigned 2/3/2018
Names, qualifications, experience, interests and special responsibilities
Bryan Dulhunty, BEc, CA
Mr. Dulhunty brings a wealth of life science experience to the position having been involved in the industry for the past 20 years. Mr. Dulhunty provides a range of consulting services to the life science industry. Mr. Dulhunty has served as a director of a number of listed ASX and non-listed life science companies, including holding the positions of Executive Chairman and Managing Director of Viralytics Ltd from 2005 to 2012. Mr. Dulhunty is a Chartered Accountant and holds an Economics Degree from Sydney University. Mr. Dulhunty was appointed to the Board on 2nd March 2018.
Interest in shares at date of report 30,0000
Special responsibilities Chairman of the Company Chair of the Audit and Risk Committee Company Secretary
Mr. Andrew Kroger, BEc. LLB, Non-Executive Director
Mr. Kroger has had a career in stockbroking, law and general management including two years running Forsayth Group in 1990 which was Australia’s ninth largest gold producer at that time. Mr. Kroger is the owner of Process Wastewater Technologies LLC, a company with its major business being in wastewater in the United States. Mr. Kroger has a Bachelor of Economics and a Bachelor of Laws from Monash University. Mr. Kroger was appointed to the Cryosite Limited board in November 2011.
Interest in shares at date of report 17,315,291
Special responsibilities None
For
per
sona
l use
onl
y

Directors’ Report continued
5
Mrs. Nicola Swift, BA (Mod) Legal Science, MA, CFA, GAICD, Non-Executive Director
Mrs. Swift has an extensive background in the international investment management and securities industry as a research director, portfolio manager and equity analyst. She has over 16 years of experience gained in London, Sydney and Boston with various global institutional investors. Mrs Swift is a Chartered Financial Analyst, a graduate of the Australian Institute of Corporate Directors and holds an Honours Law degree and a Masters of Arts from Trinity College Dublin. She is also a Director of Ascham Foundation Ltd and Ascham School Ltd. Mrs. Swift was appointed to the Board on 3 November 2016.
Interest in shares at date of report Nil
Special responsibilities Chair of the Remuneration and Nominations committee
COMPANY SECRETARY
Bryan Dulhunty, BEc, CA
Company Secretarial Services for Cryosite Limited are provided by CoSA Life Science - Corporate, a Company Secretarial firm specialising in the Life science industries.
EARNINGS PER SHARE
Basic earnings per share (2.65) cents (2017: 0.48 cents) Diluted earnings per share (2.61) cents (2017: 0.48 cents)
DIVIDENDS
No dividends were paid during the financial year. The total dividends declared were $nil (2017: $468,567).
PRINCIPAL ACTIVITIES
The company’s principal activities are the provision of long term storage, supply chain logistics management of pharmaceutical products used in clinical trials and biological materials.
Cryosite operates through two operating segments:
Cord Blood and Tissues Storage (formerly Individualised Consumer Biologics)
This business provides long term storage for cord blood and tissue samples.
Clinical Trials Logistics & Biorepository (formerly Scientific Processing and Logistics)
This business includes biorepository services, clinical trials logistics, commercial drug distribution and the other storage and distribution based services including the importation and distribution of laboratory diagnostic products.
It should be noted that previously biorepository services where include in Individualised Consumer Biologics and has been moved to this segment as is more aligned to this part of the business.
For
per
sona
l use
onl
y

Directors’ Report continued
6
REVIEW OF OPERATIONS
Operating profit from both our operating segments decreased during the year and were offset by reductions in overheads resulting in total net operating profit for continuing operations before interest and tax (NPBIT) increasing to $259,441 (2017: $(89,986)). During the year the Group incurred a number of one off costs being:
- Discontinued operations loss after tax of $995,743 driven by costs associated with the closure of thelaboratory
- Costs of $169,416 (post tax) associated with the settlement of a legal matter- Income tax expense was impacted by an additional $269,866 due to decision not to recognize losses
After taking this all into account the Group posted an overall profit (loss) after tax of $(1,240,439). (2017:225,100).
Financial Performance
2018 2017 % Change
Cord Blood and Tissue Storage Revenue 553,313 626,668 -12%Operating expenses* 423,815 489,823 -13%
Net operating profit (NOP) before overheads 129,498 136,845 -5%% NOP/ Revenue 23% 22%
Clinical Trials & Biorepository Revenue 5,310,826 5,187,453 2% Operating expenses* 2,918,120 2,571,244 13%
Net operating profit (NOP) before overheads 2,392,706 2,616,209 -9%% NOP/ Revenue 45% 50%
Total Revenue from continuing operations 5,864,139 5,814,121 1% Total Net operating profit (NOP) before overheads 2,522,204 2,753,054 -8%Overheads* 2,262,763 2,843,041 -20%
Total Net operating profit (loss) for continuing operations before interest and tax (NPBIT) 259,441 (89,986) -388%% NPBIT/Total Revenue 4% -2%
Interest revenue 58,926 69,232 -15%Income tax expense (excluding tax losses not recognised) 123,781 2,699 4487%
Net Profit (loss) after tax for continuing operations before non-recurring items 194,586 (23,453) -930%
Non-recurring Legal Settlement net of tax (169,416) (118,656) 43% Discontinued Operations net of tax** (995,743) 367,209 -371%Income tax expense attributable to tax losses not recognised (269,866) 0 100%
Statutory profit (loss) after tax (1,240,439) 225,100 -651%
* includes depreciation and amortisation
**2017 results included an upfront non-refundable amount of $500,000 in respect to the sale agreement with Cell Care Australia Pty Ltd.
Please note: Financial results have been presented to show separately the impact of discontinued operations and settlement of a legal matter. Prior year numbers have been restated to reflect this disclosure. F
or p
erso
nal u
se o
nly

Directors’ Report continued
7
Cord Blood and Tissue Storage
During the year, this segment has undergone significant changes which will continue to evolve into the future.
Operational Changes
As previously disclosed in the 2017 Annual Report, the Company ceased the future collection and processing of cord blood and tissue as the demand for these services had declined and this segment of our Cord Blood and Tissue business had experienced downward pressure on profitability. Final closure of the laboratories and the departure of associated staff occurred during the 2018 financial year. Operationally this resulted in the termination of operations associated with collection and processing of cord blood and tissue samples. (“Discontinued Operations”). The remaining business (“Cord Blood and Tissue Storage”) now operates solely as a long-term storage facility for cord blood and tissues samples previously deposited by past customers. Financial performance of these operations are noted below.
Cord Blood and Tissue Storage
This business provides long term storage for cord blood and tissue samples.
It comprises of two revenue streams being:
-revenue from previous annual plans which are still being invoiced annually until the end of their contracts and-revenue brought to account from unearned income. In prior years customers paid upfront for the entire contractwhich gave rise to unearned income. Each year the company brings to account a portion of this unearned income asrevenue.
Revenue decreased by 12% during the year due to no new annual plans being written in 2018. The majority of operating expenses relate to the maintenance of the tanks where the samples are stored. These expenses are lower in line with revenue changes resulting in stable 23% Net operating profit before overheads (2017:22%). Given there will be no new samples stored in the future, over time we would expect these costs to remain relatively stable.
Discontinued Operations
In October 2017, the Company completed the closure of the laboratory and departure of staff associated with the future collection and processing of cord blood and tissue.
As a consequence of the business closure, subsequent write downs and legal costs, the residual business result was a post-tax loss from discontinued operations of $ (995,743). (2017:367,209). Costs included an impairment loss ($555,586), redundancies ($182,527) and related legal costs ($220,673). It should be noted that the positive result of 2017 included an upfront non-refundable amount of $500,000 in respect to the sale agreement with Cell Care Australia Pty Ltd.
Financial details are outlined in note 32.
Adoption of Accounting Standard AASB 1015
On the 1st July 2018, the Company will adopt Accounting Standard AASB 15 – Recognition of Revenue. While this will not impact the 2018 results, there will be some significant impact on future results of the Cord Blood and Tissue Storage, as the standard changes the timing and recognition of revenue and associated costs of long-term contracts.
Due to this change we expect to book an accounting (non-cash) net profit from the storage of Cord Blood and Tissue under long term contracts of approximately $600,000 after tax for the year ended 30th June 2019. We will continue to book accounting (non-cash) net profits in the future as the contracts expire over time.
For
per
sona
l use
onl
y

Directors’ Report continued
8
There is no impact on cash and all adjustments are expected to reverse over the period of the contracts.
It should be noted that at a Group level the initial effect of the introduction of this standard will be to reduce the net assets of the Company by $2 million on the 1st July 2018
Full details of this adoption are outlined in the Note 2 – Summary of Significant Accounting Policies.
Clinical Trials Logistics & Biorepository
The Board re-affirms its decision to provide investment to grow the clinical trial logistics and biorepository services segment. This segment posted a net operating profit (NOP) before overheads of $2,392,706 (2017: $2,616,209).
This segment’s revenue grew marginally by 2% over the last 12 months due to change in mix and volume of across our customer base. As outlined in the 31 December 2017 half year report, the Company continues to execute a strategy of expansion and investment in this segment which has resulted in operating expenses growing 13% over the year. Investments include:
-the launching of “green” reusable packaging solution called the “Credo Shipper”. This has allowed the Company tooffer a sustainable reusable cold chain packaging solution that lessens our and our clients' carbon footprint andreduces waste. This offering has been received positively by our clients-establishment of a marketing and business development function to focus on growing this segment. Investment
included attending the global Biotech conference in the US for the first time to help build our brand and networkacquisition and implementation of a new technology platform to improve customer service and operationalefficiencies.
At the start of the 2019 financial year a large contract was not renewed due to the customer’s global strategy to consolidate its warehousing within Australia. This is expected to result in a significant decrease in revenue and profits in the first half of the year. However long term we believe that there are significant opportunities to further build on our expertise in long term cold, frozen and cryogenic storage, logistics and distribution growth. As such the Board is confident that these lost sales will be recovered through the ongoing investment in sales and marketing which is focused on attracting new customers, new clinical trials and expanding product offerings. Further we expect to see increased efficiencies on the back of our investment into a new technology platform.
Overheads
There is a high focus on streamlining the overheads of the business. In 2018, these were reduced by 20% reflecting the smaller business as a result of the discontinued operations. The Board will continue to monitor these costs closely to ensure that business is appropriately leveraged with the right amount of overheads in respect to revenue.
Income tax expense
During the year the Board decided not to recognize any tax losses going forward. While the Board remains positive about the future of the business, it felt that at this stage of its development it was more prudent not to recognize these tax losses. The Board will reassess this position periodically.
Legal Settlement
As noted in 2017, a former Director and former employee made a claim for an additional payment of statutory entitlements and a separate claim for an additional termination entitlement. During the year this matter was settled which resulted in settlement, net of tax of $169,416 (2017: $118,656). Details are outlined in note 33.
For
per
sona
l use
onl
y

Directors’ Report continued
9
Cash Position
Cash on hand decreased by $401,007 during the year resulting in a year end balance of $4,688,104 (2017: $5,089,110). The key cashflows movements were: Net cashflow from operating activities
Net cashflow from operating activities decreased by $(261,906) (2017: $1,626,789) driven by number of different factors as outlined below:
Net cashflow from operating activities 2018 2017
Net cashflows from continuing operations
Receipts from customers inclusive GST 6,491,913 6,751,204
Payments to suppliers and employees inclusive of GST (6,278,320) (5,346,807)
Interest received 7,193 5,180
Net cashflows from continuing operations 220,786 1,409,577
Net cashflows from discontinued operations
Receipts from customers inclusive GST* 1,227,112 4,078,691
Payments to suppliers and employees inclusive of GST (877,255) (3,691,971)
Net cashflows from discontinued operations 349,857 386,720
Other cashflows
Investment in new technology platform (438,873) 0
Legal Settlement (393,676) (169,508)
Net cashflows from operating activities (261,906) 1,626,789 *2017 includes an upfront non-refundable amount of $500,000 in respect to the sale agreement with Cell Care Australia Pty Ltd
Cashflow from operating activities within continuing operations was positive $220,786 but lower than 2017 as result of timing associated with supplier payments and investment in business development and marketing. Cashflows from operating activities within discontinued operations in 2018 remained positive.
Net Cash from investing activities
During the year the Company invested capital $180,781 into a number of initiatives to upgrade our operations facilities and equipment including:
-refurbishment at our South Granville operations to add additional processing capacity-new alarm and monitoring systems to improve monitoring of facilities-upgrading the air conditioning systems for our storage facilities
It is expected that these initiatives will enhance our quality of services and increase efficiency within operations.
For
per
sona
l use
onl
y
Directors’ Report continued
10
Australian Competition and Consumer Commission (“ACCC”) & Proposed Sale
In June 2017, the Company announced that it had entered into an agreement to license, under Cryosite brand, the collection, processing and storage of umbilical cord blood and tissue and to sell certain cord blood and tissue banking assets (“Transaction”) to Cell Care Australia Pty Ltd (“Cell Care”). The Company received an upfront cash payment in June 2017 and the deal was subject to shareholder and regulatory approval.
In August 2017, the Company was notified by the ACCC that it would publicly review the proposed transaction. In December 2017, the ACCC informed the Company it had discontinued its review of the proposed transaction between Cryosite and Cell Care without a decision.
The ACCC did not however confirm in writing to Cryosite that it would not oppose the transaction. This was a condition precedent of the sale contract and therefore meant that the transaction could not proceed as the condition was not fulfilled. The parties however had the right to waive this condition precedent under the sale agreement.
In January 2018, Cryosite was informed by Cell Care that it was unwilling to waive their rights. Cryosite had, already, indicted that it was willing to waive its rights under the sale agreement. As a direct consequence, Cryosite was unable to complete the transaction with Cell Care.
On the 11th July 2018, the Company was notified by the ACCC that it would commence civil proceedings against Cryosite in the Federal Court of Australia.
As a result of the action by the ACCC, the Company expects it will incur substantial legal costs with the potential to incur financial penalties in the 2019 financial year.
EMPLOYEES
The Company employed 23 full-time equivalent employees as at 30 June 2018 (2017: 37 employees).
The Company recognises the value of diversity in the workplace and is committed to providing equal opportunity for all its staff with 62% of current employees being female. There are numerous religions and cultures and where possible offer flexible work practices and work life balance as a key retention tool. Cryosite is committed to providing a workplace free from any form of harassment, bullying and discrimination.
In January 2018, the board appointed Mark Byrne as CEO. Mark had previously held the position of Company CFO since June 2016 and interim CEO since June 2017.
PERFORMANCE RIGHTS PLAN
In February 2017, the Cryosite Employee Incentive Plan (CEIP) was introduced to assist with the attraction, retention and motivation of Key Management Personnel to strengthen their alignment with shareholder interests. This plan was ratified at the 2017 AGM.
As at the date of this report, there were 1,009,249 (2017: 211,002) unissued ordinary shares under the CEIP. Please refer to the remuneration report for further details. The circumstances under which a Key Management Personnel is entitled to retain these performance rights if he or she should leave the Company before the vesting date is controlled by the terms of the CEIP and is at the discretion of the Board.
SIGNIFICANT CHANGES IN THE STATE OF AFFAIRS
As previously disclosed in the 2017 Annual Report, the Company ceased the future collection and processing of cord blood and tissue as the demand for these services had declined and this segment of our Cord Blood and Tissue
For
per
sona
l use
onl
y

Directors’ Report continued
11
business had experienced downward pressure on profitability. Final closure of the laboratories and the departure of associated staff occurred during the 2018 financial year.
Other than detailed in the above there were no significant changes in the state of affairs of the Group during the year.
SIGNIFICANT EVENTS AFTER THE BALANCE DATE
On the 11th July 2018, the Company was notified by the ACCC that it would commence civil proceedings against Cryosite in the Federal Court of Australia.
LIKELY DEVELOPMENTS AND EXPECTED RESULTS
As noted above the ACCC has commenced proceedings against Cryosite. As a result, the Company will incur substantial legal costs in the 2019 financial year. However, the Board expects to end the 2019 financial year with a clear focus on a growing clinical trial logistics and biorepository business supported by the long-term storage of cord blood and tissue for existing clients.
ENVIRONMENTAL REGULATIONS
The Company provides a range of services that require compliance to a variety of regulatory and statutory bodies, including the Therapeutic Goods Administration (TGA), the Department of Agriculture, Fisheries and Forestry (DAFF), the NSW Department of Health, and the Office of the Gene Technology Regulator (OGTR). Additionally, the Company must comply with the quality system requirements of many of its customers. The Company has implemented a Company-wide quality management system to ensure that it meets or exceeds the requirements of all these interests. During 2018 Cryosite held accreditation for ISO 15189 (Medical Laboratories) from the Australian National Association of Testing Authorities (NATA) which was not renewed in August 2018.
There have been no significant known breaches of the consolidated entity’s licence conditions or any regulations to which it is subject. The Company, to the best of its knowledge, is not subject to any specific environmental regulations.
BUSINESS RISKS
Most of the services that Cryosite provide to generate income require some form of statutory licensing or compliance authority. The failure by Cryosite to attain and maintain such licences and approvals would have a significant negative effect on the Company’s ability to continue to provide such services and to maintain its viability. As referred to in other parts of this report, Cryosite is committed to mitigating risks in this area by the implementation and maintenance of a Company-wide Quality Management System.
INSURANCE OF DIRECTORS AND OFFICERS
The Company has paid a premium in respect of a contract insuring all the Directors and Officers against liability, except willful breach of duty, of a nature that is required to be disclosed under section 300(8) of the Corporations Act 2001. In accordance with commercial practice, further details of the nature of the liabilities insured against and the amount of the premium have not been disclosed.
In addition to the above, the Directors and certain Officers of the Company have entered into a Deed of Indemnity and Access confirming the Company’s obligation to maintain an adequate Director and Officer Liability insurance policy and confirming the individual Directors’ and Officers’ right to access board papers and other Company documents. In return, the individual Directors and Officers have agreed to allow the Company to conduct the defence should the event arise.
For
per
sona
l use
onl
y

Directors’ Report continued
12
The Company has not otherwise, during or since the end of the financial year, indemnified or agreed to indemnify
an Officer or Auditor of the Company or of any related body corporate against a liability incurred as such an Officer or Auditor.
REMUNERATION REPORT (Audited)
This remuneration report outlines the director and executive remuneration arrangements of the Company and the Group in accordance with the requirements of the Corporations Act 2001 and Regulations. For the purposes of this report, key management personnel (KMP) of the Group are defined as those persons having authority and responsibility for planning, directing and controlling the major activities of the Company and the Group, directly or indirectly, including any director (whether executive or otherwise) of the parent Company, and includes the two executives in the Parent and the Group receiving the highest remuneration.
This has been audited by Mazars Risk & Assurance Pty Limited and is included within the scope of the audit report on pages 75 to 80.
Key Management Personnel
Details of the nature and amount of each element of remuneration for key management personnel of the Company which includes those key management personnel receiving the highest compensation for the financial year are as follows: -
Mr. Bryan Dulhunty Non-Executive Chairman (appointed 2/3/2018) Mr. Andrew Kroger Non-Executive Director Mrs. Nicola Swift Non-Executive Director Mr. Mark Byrne Chief Executive Officer Mr. Stephen Roberts Non-Executive Director (resigned 2/3/2018)
On 17th January 2018, the board appointed as the Company’s CEO, Mark Byrne. Mark had previously held the position of Company CFO since June 2016 and interim CEO since June 2017 on the resignation of former CEO Andrew Shine.
Due to the relatively small number of employees, apart from Mark Byrne, there were or are no other executives having authority and responsibility for planning, directing and controlling the activities of the entity either directly or indirectly during the current year.
The role of the Nominations and Remuneration Committee
While the Board maintains the authority and responsibility for the oversight of the Company’s remuneration policy and the principles and processes which underpins the policy, on 9 December 2016, the Board established a Nominations and Remuneration committee to provide advice and recommendations to the Board
• on the structure and level of remuneration for the directors, senior executives and Company secretary
• on the design and award of all executive incentive plans
The members of the committee are independent non-executive directors, Mrs. Nicola Swift (Chair) and Mr. Bryan Dulhunty.
Use of external remuneration consultants
As necessary the Nominations and Remuneration Committee obtained independent external recommendations and advice from Crichton and Associates Pty Ltd on matters including the design of a long-term incentive plan for employees, its implementation and management. No remuneration recommendations as defined in section 9B of
For
per
sona
l use
onl
y
Directors’ Report continued
13
the Corporations Act 2001 were received from Crichton and Associates Pty Ltd during this time period.
Crichton and Associates Pty Ltd were paid $4,451.17 for services including the management of the Cryosite Employee Incentive Plan (CEIP).
Remuneration philosophy
The Company recognises the importance of structuring remuneration packages of its key management personnel so as to attract and retain people with the qualifications, skills and experience to help the Company achieve the required objectives. However, the Company understands that a prudent position must be observed in the total remuneration expense.
Non-Executive Directors
Cryosite has two non-executive directors and a non-executive Chairman. The remuneration of non-executive directors including the non-executive Chairman consists of fixed annual fees exclusive of statutory superannuation as below. Apart from reimbursement of expenses incurred on the Company’s behalf, non-executive directors are not eligible for any additional payments.
Chairman of the Board: $75,000 per annum Non-Executive Directors: $60,000 per annum
Performance based compensation is not part of the remuneration structure offered to non-executive directors. No performance rights or options are held by any non-executive director.
Total remuneration paid to non-executive directors is determined by the Board from time to time for presentation to and resolution by shareholders at the Annual General Meeting. The current maximum aggregate remuneration paid to non-executive directors is $350,000 per year. During 2018 total aggregate remuneration paid to non- executive directors was $238,114.
Executive Remuneration
Key management personnel (other than non-executive directors) are employed on standard contracts which include a three month notice.
The Company may terminate the employee's contract without notice if serious misconduct has occurred. Where termination with cause occurs, the executive is only entitled to that portion of remuneration that is fixed, and only up to the date of termination. On termination with cause, any performance rights that have granted but not vested will be forfeited.
The Company does compare remuneration paid to key management personnel with other similar companies to ensure consistency.
Executive total remuneration consists of the following components:
Fixed Remuneration
This comprised of a fixed base salary and statutory superannuation. This is reviewed annually although there is no guaranteed increase.
For
per
sona
l use
onl
y

Directors’ Report continued
14
Performance Based Compensation
Short Term Incentive Plan (STIP)-2017
During 2017, the Company established a short-term incentive plan for its key executives. This plan provides the opportunity for executives to earn a short-term incentive inclusive of superannuation as an annual bonus if certain individual and Company-wide key performance indicators (KPIs) are met within the financial year.
The following Key Management Personnel were entitled to the following % of their total fixed remuneration as a short-term incentive opportunity for 2017:
Andrew Shine 30% Mark Byrne 20%
Each year the Board will determine the KPIs to be set. At the end of the year, upon receipt of audited financials, the board will review the results against these KPIs and approve bonuses that are appropriate. Bonuses will be paid within 1 month of the announcement to the result to the Australian Stock Exchange.
Executives need to be employees at the time of payment.
In 2017, EBITDA was set as the KPI for calculation of these bonuses. It was scaled up to a maximum 100% payout if EBITDA achieved a certain target. In 2017, no bonuses under the Short Term Incentive Plan were paid for the 2017 year.
2018 Bonus
Due to the significant challenges facing the Company in 2018, no formal STIP plan was put in place. However, the Board has awarded limited discretionary bonuses to executives on a reasonable basis, taking into account the Company’s financial performance, in recognition of the efforts undertaken by the individuals.
Long Term Incentive Plan : Cryosite Employee Incentive Plan (CEIP)
On the 23rd February 2017, the Cryosite Employee Incentive Plan (CEIP) was established by the Company. On invitation, the CEIP provides executives the opportunity to receive a long-term equity based incentive, currently a grant of performance rights, in each financial year. The issue and granting of these performance rights is governed by the CEIP Plan Rules.
The annual grant value, subject to shareholder approvals, is defined as a % of fixed remuneration or as otherwise agreed. The following %’s of fixed remuneration were used in determining the grant value for each executive. The grant value was converted into the number of performance rights to be issued using the WVAP of Cryosite shares in the 30 trading days following the release of the Annual Report.:
2018 2017
Andrew Shine - 30%Mark Byrne 30% 20%
The following components of the CEIP are as follows;
Vesting date Up to 36 months from date of grant. Vesting conditions Performance rights will only vest after certain performance and conditions are
met. Performance conditions Compound Annual Growth Rates (CAGR) of the Earnings per Share (EPS)
over measurement period need to be achieved from a base year.
For
per
sona
l use
onl
y
Directors’ Report continued
15
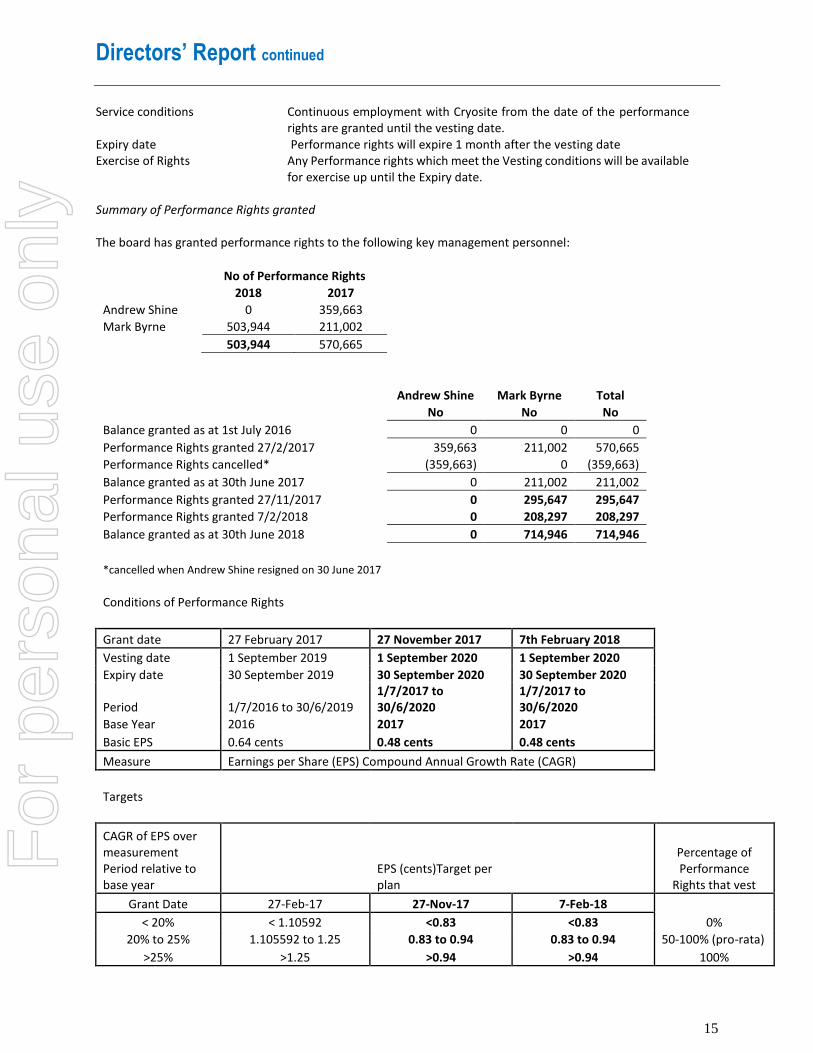
Service conditions Continuous employment with Cryosite from the date of the performance rights are granted until the vesting date.
Expiry date Performance rights will expire 1 month after the vesting date Exercise of Rights Any Performance rights which meet the Vesting conditions will be available
for exercise up until the Expiry date.
Summary of Performance Rights granted
The board has granted performance rights to the following key management personnel:
No of Performance Rights
2018 2017
Andrew Shine 0 359,663
Mark Byrne 503,944 211,002
503,944 570,665
Andrew Shine Mark Byrne Total
No No No
Balance granted as at 1st July 2016 0 0 0
Performance Rights granted 27/2/2017 359,663 211,002 570,665
Performance Rights cancelled* (359,663) 0 (359,663)
Balance granted as at 30th June 2017 0 211,002 211,002
Performance Rights granted 27/11/2017 0 295,647 295,647
Performance Rights granted 7/2/2018 0 208,297 208,297
Balance granted as at 30th June 2018 0 714,946 714,946
*cancelled when Andrew Shine resigned on 30 June 2017
Conditions of Performance Rights
Grant date 27 February 2017 27 November 2017 7th February 2018
Vesting date 1 September 2019 1 September 2020 1 September 2020
Expiry date 30 September 2019 30 September 2020 30 September 2020
Period 1/7/2016 to 30/6/2019 1/7/2017 to 30/6/2020
1/7/2017 to 30/6/2020
Base Year 2016 2017 2017
Basic EPS 0.64 cents 0.48 cents 0.48 cents
Measure Earnings per Share (EPS) Compound Annual Growth Rate (CAGR)
Targets
CAGR of EPS over measurement Period relative to base year
EPS (cents)Target per plan
Percentage of Performance
Rights that vest
Grant Date 27-Feb-17 27-Nov-17 7-Feb-18
< 20% < 1.10592 <0.83 <0.83 0%
20% to 25% 1.105592 to 1.25 0.83 to 0.94 0.83 to 0.94 50-100% (pro-rata)
>25% >1.25 >0.94 >0.94 100%
For
per
sona
l use
onl
y
Directors’ Report continued
16
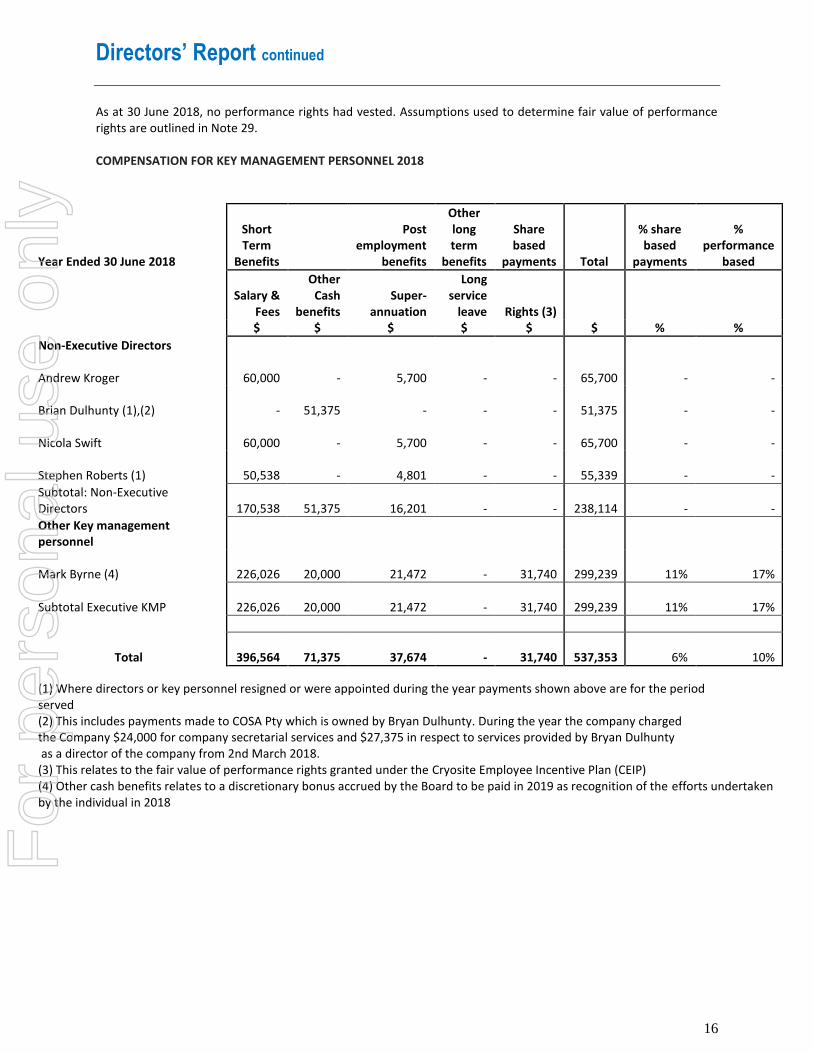
As at 30 June 2018, no performance rights had vested. Assumptions used to determine fair value of performance rights are outlined in Note 29.
COMPENSATION FOR KEY MANAGEMENT PERSONNEL 2018
Year Ended 30 June 2018
Short Term
Benefits
Post employment
benefits
Other long term
benefits
Share based
payments Total
% share based
payments
% performance
based
Salary & Fees
Other Cash
benefits Super-
annuation
Long service
leave Rights (3) $ $ $ $ $ $ % %
Non-Executive Directors
Andrew Kroger 60,000 - 5,700 - - 65,700 - -
Brian Dulhunty (1),(2) - 51,375 - - - 51,375 - -
Nicola Swift 60,000 - 5,700 - - 65,700 - -
Stephen Roberts (1) 50,538 - 4,801 - - 55,339 - -
Subtotal: Non-Executive Directors 170,538 51,375 16,201 - - 238,114 - -
Other Key management personnel
Mark Byrne (4) 226,026 20,000 21,472 - 31,740 299,239 11% 17%
Subtotal Executive KMP 226,026 20,000 21,472 - 31,740 299,239 11% 17%
Total 396,564 71,375 37,674 - 31,740 537,353 6% 10%
(1) Where directors or key personnel resigned or were appointed during the year payments shown above are for the periodserved(2) This includes payments made to COSA Pty which is owned by Bryan Dulhunty. During the year the company chargedthe Company $24,000 for company secretarial services and $27,375 in respect to services provided by Bryan Dulhuntyas a director of the company from 2nd March 2018.
(3) This relates to the fair value of performance rights granted under the Cryosite Employee Incentive Plan (CEIP)(4) Other cash benefits relates to a discretionary bonus accrued by the Board to be paid in 2019 as recognition of the efforts undertakenby the individual in 2018
For
per
sona
l use
onl
y

Directors’ Report continued
17
COMPENSATION FOR KEY MANAGEMENT PERSONNEL 2017
Year Ended 30 June 2017
Short Term
Benefits
Post employment
benefits
Other long term
benefits
Share based
payments Total
% share based
payments
% performance
based
Salary & Fees
Other Cash
benefits (2)
Super-annuation
Long service
leave Rights (3) $ $ $ $ $ $ % %
Non-Executive Directors
Andrew Kroger 60,000 - 5,700 - - 65,700 - -
Nicola Swift (1) 40,000 - 3,800 - - 43,800 - -
Stephen Roberts 73,653 - 6,997 - - 80,650 - -
Subtotal: Non-Executive Directors 173,653 - 16,497 - - 190,150 - -
Executive directors
Graeme Moore (1) 142,649 - 15,767 23,316 - 181,732 - - Other Key management personnel
Andrew Shine (4) 224,657 - 22,297 - 8,677 255,631 3% 3%
Mark Byrne 193,185 - 18,353 - 5,091 216,629 2% 2%
Subtotal Executive KMP 417,842 - 40,649 - 13,768 472,259 3% 3%
Total 734,144 - 72,913 23,316 13,768 844,141 2% 2%
(1) Where directors or key personnel resigned or were appointed during the year payments shown above arethe period served.(2) This includes payments made under the Short Term Incentive Plan (STIP) which was established on the 23rd February 2017(3) This relates to the fair value of performance rights granted under the Cryosite Employee Incentive Plan (CEIP)(4) Andrew Shine resigned on the 30th June 2017 and his performance rights were cancelled on that date.
For
per
sona
l use
onl
y

Directors’ Report continued
18
SHAREHOLDINGS OF KEY MANAGEMENT PERSONNEL
Shares held in Cryosite Limited Balance 1st July 2017
Balance on appointment /
(resignation) Share purchases Balance 30 June
2018 Ord Ord Ord Ord
Bryan Dulhunty 30,000 30,000 - 30,000Andrew Kroger 16,016,906 0 1,298,385 17,315,291Stephen Roberts * 669,519 (967,662) 298,143 -
16,716,425 - 937,662 1,596,528 17,345,291
Shares held in Cryosite Limited Balance 1st July 2016
Balance on appointment /
(resignation) share purchases Balance 30 June
2017 Ord Ord Ord Ord
Andrew Kroger 13,316,906 - 2,700,000 16,016,906 Stephen Roberts* 644,873 - 24,646 669,519
13,961,779 - 2,724,646 16,686,425
*resigned 2/3/2018
LOANS TO KEY MANAGEMENT PERSONNEL
There were no loans to key management personnel at the beginning of the year, at any time during the year, or at the end of the year.
OTHER TRANSACTIONS AND BALANCES WITH KEY MANAGEMENT PERSONNEL
During the year the Company settled a legal matter with a former Director and former employee for an amount of $276,818. Details of this are outlined in note 33. There were no other transactions during the year with key management personnel or with any key management personnel related entities.
DIRECTORS’ MEETINGS
During the financial year, the following meetings incurred and were attended by directors:
Directors Meetings Audit Risk Committee
Meetings Remuneration and
Nomination Meetings
Directors Eligible to
attend Eligible
attended Eligible to
attend Eligible
attended Eligible to
attend Eligible
attended
Andrew Kroger 14 14 0 0 0 0
Bryan Dulhunty 3 3 1 1 1 1
Nicola Swift 14 14 3 3 2 2
Stephen Roberts 10 10 2 2 1 1 For
per
sona
l use
onl
y
Directors’ Report continued
19
PROCEEDING ON BEHALF OF THE COMPANY
No person has applied to the Court under section 237 of the Corporate Act 2001 for leave to bring proceedings on behalf of the Company, or to intervene in any proceedings to which the Company is a party, for the purpose of taking responsibility on behalf of the Company for all or part of those proceedings.
AUDITOR’s INDEPENDENCE DECLARATION AND NON-AUDIT SERVICES
The directors have received the auditor’s independence declaration which is included on Page 17 of this report. No director of Cryosite Limited is currently or was formerly a partner of Mazars Risk and Assurance Pty Ltd.
Non-audit services were provided by the entity’s auditor, Mazars Risk and Assurance Pty Ltd, during the financial year. Details of the services provided are disclosed in Note 27 of the Financial Statements. The directors are satisfied that the provision of non-audit services is compatible with the general standard of independence for auditors imposed by the Corporations Act 2001.
The directors are of the opinion that the services disclosed in Note 27 to the financial statements do not compromise the external auditor’s independence requirements of the Corporations Act 2001 for the following reasons:
- All non-audit services have been reviewed and approved to ensure that they do not impact the integrity orobjectivity of the auditor;
None of the services undermine the general principles relating to auditor independence as set out in APES 110 Code of Ethics for Professional Accountants issued by the Accounting Professional and Ethical Standards Board, including reviewing or auditing the auditor’s own work, acting in a management or decisionmaking capacity for the Company, acting as an advocate for the Company or jointly sharing economic risks and rewards.
This report is made in accordance with a resolution of directors, pursuant to section 298(2)(a) of the Corporations Act 2001.
On behalf of the directors
Bryan Dulhunty Chairman
Date: 30th August 2018
For
per
sona
l use
onl
y

MAZARS RISK & ASSURANCE PTY LIMITED ABN: 39 151 805 275 LEVEL 12, 90 ARTHUR STREET, NORTH SYDNEY NSW 2060 PO BOX 1994, NORTH SYDNEY NSW 2059 TEL: +61 2 9922 1166 - FAX: +61 2 9922 2044 EMAIL: [email protected]
LIABILITY LIMITED BY A SCHEME, APPROVED UNDER THE PROFESSIONAL STANDARDS LEGISLATION
AUDITOR’S INDEPENDENCE DECLARATION UNDER SECTION 307C OF THE CORPORATIONS ACT 2001 TO THE DIRECTORS OF CRYOSITE LIMITED AND CONTROLLED ENTITIES
I declare that, to the best of my knowledge and belief during the year ended 30 June 2018, there have been:
— no contraventions of the auditor independence requirements as set out in the Corporations Act 2001 in relation to the audit; and
— no contraventions of any applicable code of professional conduct in relation to the audit. MAZARS RISK AND ASSURANCE PTY LTD Paul Collins Director Sydney, on this 30th day of August 2018
For
per
sona
l use
onl
y

Corporate Governance
21
Cryosite is committed to implementing the highest possible standards of corporate governance. In determining what
those high standards should involve, Cryosite has turned to the ASX Corporate Governance Council’s Corporate Governance Principles and Recommendations (ASX Principles) and has a corporate governance framework that reflects those recommendations within the structure of the Company.
The Board of Cryosite approved an updated series of policies and charters in line with the amendments to the ASX Principles. The Company’s policies and charters together form the basis of the Company’s governance framework were in place for the financial year ended 30 June 2018 and to the date of signing of the directors’ report.
Within this framework:
- the Board of Directors is accountable to shareholders for the performance of the Company;- the Company’s goals to achieve milestones are set and promulgated;- the risks of the business are identified and managed, and- the Company’s established values and principles underpin the way in which it undertakes its operations.
The Company has in place an entrenched, well developed governance culture which has its foundations in the ethical values that the Board, management and staff bring to the Company and their commitment to positioning the Company as a leader in its field.
In certain instances, due to the size and stage of development of Cryosite and its operations, it may not be practicable or necessary to implement the ASX Principles in their entirety. In these instances, Cryosite has identified the areas of divergence.
In accordance with its Shareholder Communications Policy, Cryosite has made its corporate governance policies and charters publicly available on its website (www.cryosite.com).
For
per
sona
l use
onl
y

Directors Declaration
22
(1) In the opinion of the directors:
(a) the financial statements and notes of the consolidated entity are in accordance with theCorporations Act 2001, including:
(i) giving a true and fair view of the consolidated entity’s financial position as at 30 June2018 and of its performance for the year ended on that date; and
(ii) complying with Accounting Standards, Corporations Regulations 2001 and othermandatory professional reporting requirements; and
(b) there are reasonable grounds to believe that the Company will be able to pay its debts as andwhen they become due and payable.
(2) Note 2(a) confirms that the financial statements also comply with International Financial
Reporting Standards as issued by the International Accounting Standards Board.
(3) This declaration has been made after receiving the declarations required to be made to directors inaccordance with section 295A of the Corporations Act 2001 for the financial year ended 30 June2018.
On behalf of the Board
Bryan Dulhunty Chairman
Date: 30th August 2018
For
per
sona
l use
onl
y

Consolidated Statement of Profit and Loss and Other Comprehensive Income
23
FOR THE YEAR ENDED 30 June 2018
Notes 2018
$ 2017
$
Sale of goods and rendering of services 5 5,864,139 5,814,121
Other revenue 5 58,926 69,232
Revenue 5,923,065 5,883,353
Cost of providing services (2,873,786) (2,868,167)
Marketing expenses (152,297) (6,962)
Occupancy expenses (615,769) (585,761)
Administration expenses (1,962,848) (2,443,217)
Total expenses (5,604,700) (5,904,107)
Profit (loss)from continuing operations before tax 318,365 (20,754)
Income tax (expense) benefit 7 (393,645) (2,699)
Loss after tax from continuing operations (75,280) (23,453)
Legal settlement, net of tax 34 (169,416) (118,656)
Loss after tax from continuing operations and legal settlement (244,696) (142,109)
Discontinued operations
Profit/(loss) after tax from discontinued operations 33 (995,743) 367,209
Net profit (loss)attributable to members of the Company (1,240,439) 225,100
Other comprehensive income
Performance rights cancelled - 8,677
Other comprehensive income for the year, net of tax - 8,677
Total comprehensive income for the year (1,240,439) 233,777
Earnings per share Cents Cents Basic, profit for the year attributable to ordinary equity holders of the parent 8 (2.65) 0.48 Diluted, profit for the year attributable to ordinary equity holders of the parent 8 (2.61) 0.48
Earnings per share for continuing operations 8 (0.002) (0.001) Basic, profit for the year attributable to ordinary equity holders of the parent Diluted, profit for the year attributable to ordinary equity holders of the parent
8 (0.002) (0.001)
The above consolidated statement of profit and loss and other comprehensive income should be read in conjunction with the accompanying notes.
For
per
sona
l use
onl
y
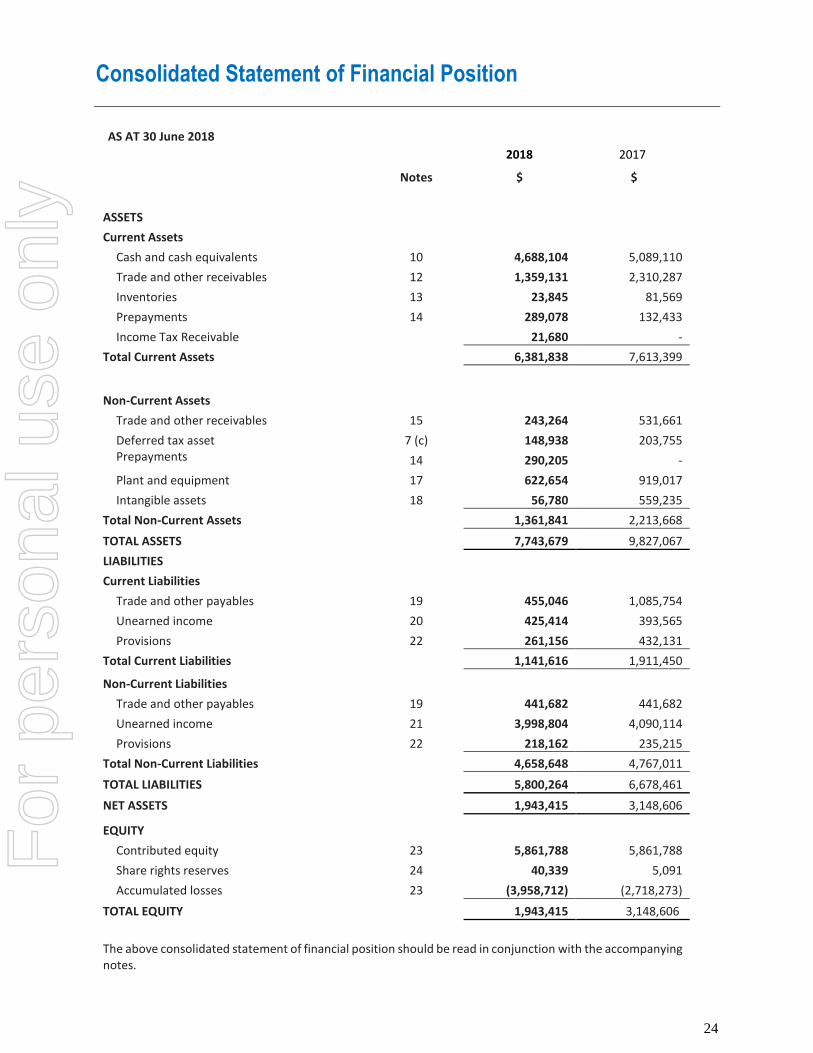
Consolidated Statement of Financial Position
24
AS AT 30 June 2018
2018 2017
Notes $ $
ASSETS
Current Assets
Cash and cash equivalents 10 4,688,104 5,089,110
Trade and other receivables 12 1,359,131 2,310,287
Inventories 13 23,845 81,569
Prepayments 14 289,078 132,433
Income Tax Receivable 21,680 -
Total Current Assets 6,381,838 7,613,399
Non-Current Assets
Trade and other receivables 15 243,264 531,661
Deferred tax asset 7 (c) 148,938 203,755 Prepayments 14 290,205 -
Plant and equipment 17 622,654 919,017
Intangible assets 18 56,780 559,235
Total Non-Current Assets 1,361,841 2,213,668
TOTAL ASSETS 7,743,679 9,827,067
LIABILITIES
Current Liabilities
Trade and other payables 19 455,046 1,085,754
Unearned income 20 425,414 393,565
Provisions 22 261,156 432,131
Total Current Liabilities 1,141,616 1,911,450
Non-Current Liabilities
Trade and other payables 19 441,682 441,682
Unearned income 21 3,998,804 4,090,114
Provisions 22 218,162 235,215
Total Non-Current Liabilities 4,658,648 4,767,011
TOTAL LIABILITIES 5,800,264 6,678,461
NET ASSETS 1,943,415 3,148,606
EQUITY
Contributed equity 23 5,861,788 5,861,788
Share rights reserves 24 40,339 5,091
Accumulated losses 23 (3,958,712) (2,718,273)
TOTAL EQUITY 1,943,415 3,148,606
The above consolidated statement of financial position should be read in conjunction with the accompanying notes.
For
per
sona
l use
onl
y
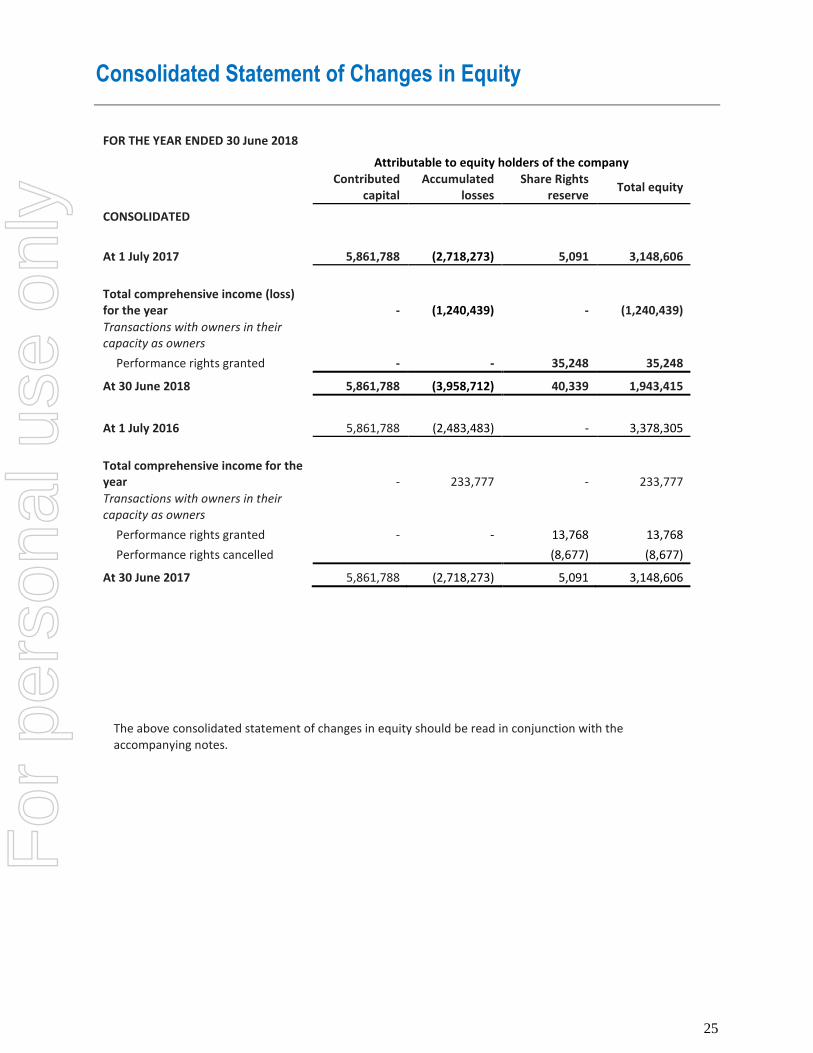
Consolidated Statement of Changes in Equity
25
FOR THE YEAR ENDED 30 June 2018
Attributable to equity holders of the company Contributed
capital Accumulated
losses Share Rights
reserve Total equity
CONSOLIDATED
At 1 July 2017 5,861,788 (2,718,273) 5,091 3,148,606
Total comprehensive income (loss) for the year - (1,240,439) - (1,240,439)
Transactions with owners in their capacity as owners
Performance rights granted - - 35,248 35,248
At 30 June 2018 5,861,788 (3,958,712) 40,339 1,943,415
At 1 July 2016 5,861,788 (2,483,483) - 3,378,305
Total comprehensive income for the year - 233,777 - 233,777
Transactions with owners in their capacity as owners
Performance rights granted - - 13,768 13,768
Performance rights cancelled (8,677) (8,677)
At 30 June 2017 5,861,788 (2,718,273) 5,091 3,148,606
The above consolidated statement of changes in equity should be read in conjunction with the accompanying notes.
For
per
sona
l use
onl
y
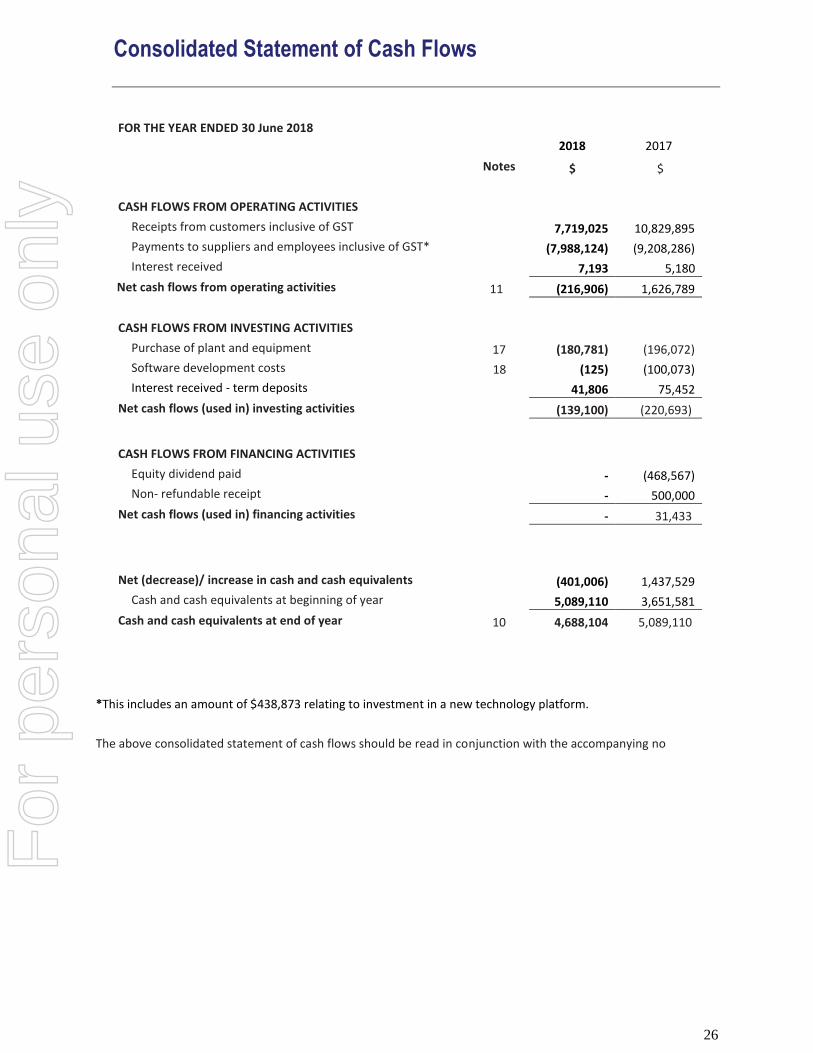
Consolidated Statement of Cash Flows
26
*This includes an amount of $438,873 relating to investment in a new technology platform.
The above consolidated statement of cash flows should be read in conjunction with the accompanying no
FOR THE YEAR ENDED 30 June 2018
2018 2017
Notes $ $
CASH FLOWS FROM OPERATING ACTIVITIES
Receipts from customers inclusive of GST 7,719,025 10,829,895
Payments to suppliers and employees inclusive of GST* (7,988,124) (9,208,286)
Interest received 7,193 5,180
Net cash flows from operating activities 11 (216,906) 1,626,789
CASH FLOWS FROM INVESTING ACTIVITIES
Purchase of plant and equipment 17 (180,781) (196,072)
Software development costs 18 (125) (100,073)
Interest received - term deposits 41,806 75,452
Net cash flows (used in) investing activities (139,100) (220,693)
CASH FLOWS FROM FINANCING ACTIVITIES
Equity dividend paid - (468,567)
Non- refundable receipt - 500,000
Net cash flows (used in) financing activities - 31,433
Net (decrease)/ increase in cash and cash equivalents (401,006) 1,437,529
Cash and cash equivalents at beginning of year 5,089,110 3,651,581
Cash and cash equivalents at end of year 10 4,688,104 5,089,110
For
per
sona
l use
onl
y
Notes to the Financial Statements For the Year Ended 30 June 2018
27
1 CORPORATE INFORMATION
The financial report of Cryosite Limited and the controlled entity (the Group) for the year ended 30 June 2018 was authorised for issue in accordance with a resolution of the directors on 30th August 2018.
Cryosite Limited is a company limited by shares incorporated in Australia whose shares are publicly traded on the Australian Stock Exchange.
The nature of the operations and principal activities of the Group are described in the Directors’ Report.
2 SUMMARY OF SIGNIFICANT ACCOUNTING POLICIES
Basis of preparation
The financial report is a general purpose financial report, which has been prepared in accordance with the requirements of the Corporations Act 2001, and Australian Accounting Standards and other authoritative
pronouncements of the Australian Accounting Standards Board.
The financial report has been prepared on a historical cost basis, except when otherwise stated.
(a) Compliance with IFRS
The financial report complies with International Financial Reporting Standards (IFRS) as issued by the International Accounting Standards Board (IASB).
(b) Changes in accounting policy, accounting standards and interpretations.
(i) Amendments to AASBs and the new Interpretation that are mandatorily effective for the current period
The accounting policies adopted are consistent with those of the previous financial years except the following which the Group adopted from 1 July 2017:
• AASB 2017-2 Amendments to Australian Accounting Standards – Further Annual Improvements 2014-2016 Cycle
The adoption of these standard did not have any impact on the current period or any prior period and is not likely to affect future periods.
For
per
sona
l use
onl
y

Notes to the Financial Statements For the Year Ended 30 June 2018
28
2 SUMMARY OF SIGNIFICANT ACCOUNTING POLICIES CONTINUED
(ii) Standards and Interpretations in issue not yet adopted
At the date of authorisation of the financial statements, the Standards and Interpretations that were issued but not yet effective are listed below:
The adoption of these standard did not have any impact on the current period or any prior period.
The relevant standards for the Group follow:
AASB 9 Financial Instruments. Revised principles for accounting for financial assets and liabilities: recognition and derecognition, classification, measurement, hedge accounting and impairment. The standard will be effective from 1 July 2018 and is available for early adoption.
The Company has determined not to early adopt this standard and will assess the impact of the standard within the required time frame. However, this standard may result in potential increase in provision for impairment losses on receivables for the year ending 30 June 2019.
Standard/Interpretation
Effective date (annual periods beginning on or after)
Expected to be initially applied in the financial year ending
AASB 9 Financial Instruments and the relevant amending standards 1 January 2018 30 June 2019
AASB 15 Revenue from Contracts with Customers, AASB 2014-5, Amendments to Australian Accounting Standards arising from AASB 15 and AASB 2016-8 Amendments to Australian Accounting Standards – Effective date of AASB 15
1 January 2018 30 June 2019
AASB 16 Leases 1 January 2019 30 June 2020
AASB 2016-5 Amendments to Australian Accounting Standards – Classification and Measurement of Share-based Payment Transactions
1 January 2018 30 June 2019
AASB 2017-4 Amendments to Australian Accounting Standards – Uncertainty over Income Tax Treatments
1 January 2019 30 June 2019
AASB 2018-1 Amendments to Australian Accounting Standards – Annual Improvements 2015-2017
1 January 2019 30 June 2019
Interpretation 22 Foreign Currency Transactions and Advance Consideration
1 January 2018 30 June 2019
For
per
sona
l use
onl
y

Notes to the Financial Statements For the Year Ended 30 June 2018
29
2 SUMMARY OF SIGNIFICANT ACCOUNTING POLICIES CONTINUED
IFRS 15 Revenue from Contracts with Customers. (‘AASB 15’) Introduces a single revenue recognition model based on the transfer of goods and services and the consideration expected to be received for that transfer. The standard will be effective from 1 July 2018.
In 2017 the Company elected to apply the modified retrospective transition method with respect to implementation of AASB 15. In this case AASB 15 is applied retrospectively to only the current period presented in the financial statements with no restatement of the comparative period. As such, the cumulative effect of initially applying AASB 15 will be recognised as an adjustment to retained earnings as at 1 July 2018 (the date of initial application). On this basis, there is no impact to retained earnings as at the 30th June 2018. The financial statements for the year ending 30 June 2019 will fully reflect AASB 15 with the comparative results for the year ending 30 June 2018 restated.
During 2017, the Company undertook a review, which included obtaining independent third party advice, aimed to assess the potential effects on the financial statements and verify the need to adjust internal control system over financial reporting. The first step in this process was to assess which customer contracts would be accounted for differently under the new standard which included reviewing performance obligations, pricing and costing. This analysis confirmed that only the Cord Blood and Tissue Storage segment is impacted by AASB 15.
The introduction of AASB 15 is expected to have a significant impact on the reported revenue and costs and balance sheet of Cryosite. There is no change to the profit on each contract over the life of the contract. The new standard simply recognises profit over a different reporting period from the existing accounting standard. It is important to note there is no change to the expected timing or amount of cash impact collected from the cord blood and tissue contracts.
Currently Cryosite recognises the majority of revenue and all costs associated with the storage of cord blood and tissue at the time of completion of collection and processing of samples. A small amount of revenue is then recognised over the life of the contract representing storage income. AASB 15 requires all revenue and costs to be recognised over the life of the contract.
AASB 15 requires the accounting effects to be made retrospectively. This means that the Company is required to restate the results from 1 July 2018 as if this standard have applied from the date of the contract. Therefore, revenue and costs which have previously been reported in the annual profit and loss will, to an extent, be reversed and will be recognised again post 1 July 2018. The effect is to materially reduce the amount of revenue and costs that have been recognised on these contracts in prior years with amounts recognised as deferred revenue and costs on the balance sheet to be recognised through the income statement over the expected life of the related contract.
As at the 30 June 2018, Cryosite has completed extensive work on the financial impact of AASB 15. Based on this work, the quantitative effect on the balance sheet at the date of adoption of this standard (1st July 2018 for the financial year ended 30 June 2019) is expected to be: F
or p
erso
nal u
se o
nly

Notes to the Financial Statements For the Year Ended 30 June 2018
30
2 SUMMARY OF SIGNIFICANT ACCOUNTING POLICIES CONTINUED
AASB 1015 Opening Adjustment 1st July 2018
30th June 2018 Deferred Revenue* Deferred Costs* 1st July 2018
Total Assets 7,935,368 - 22,823,306 30,758,674
Total Liabilities 5,991,953 24,787,981 - 30,779,934
Total Net Assets 1,943,415 (24,787,981) 22,823,306 (21,260)
Share Capital 5,902,127 - - 5,902,127
Retained Earnings (3,958,712) (24,787,981) 22,823,306 (5,923,387)
Total Equity 1,943,415 (24,787,981) 22,823,306 (21,260)
* these adjustments are net of tax
These deferred balance sheet assets and liabilities will then be taken to revenue and expense over the life of each individual contract which ranges from18 years to 25 years.
The Company has obtained legal advice which confirms that due to the impact from AASB 15 adoption which has resulted in negative net assets, the ability for the Company to declare dividends in the future will be restricted until the business returns to positive net assets.
AASB 16 Leases. Recognise right of use assets and liabilities arising from all leases, with exceptions for low value and short term leases. The standard will be effective from 1 January 2019.
The Group has determined not to early adopt this standard and will assess the impact of the standard within the required time frame.
(c) Basis of consolidation
The consolidated financial statements comprise the financial statements of Cryosite Limited (the Company) and
its subsidiary (‘the Group’) as at 30 June each year.
Subsidiaries are all entities (including structured entities) over which the group has control. The group controls an entity when the group is exposed to, or has rights to, variable returns from its involvement with the entity and has the ability to affect those returns through its power to direct the activities of the entity. Subsidiaries are fully consolidated from the date on which control is transferred to the group. They are deconsolidated from the date that control ceases.
The financial statements of the subsidiary are prepared for the same reporting year as the parent company, using consistent accounting policies.
Adjustments are made to bring into line any dissimilar accounting policies that may exist.
All inter-company balances and transactions have been eliminated in full. Subsidiaries are consolidated from the date on which control is transferred to the Group and cease to be consolidated from the date on which control is transferred out of the Group. Investments in subsidiaries held by the Company are accounted for at cost in the separate financial statements of the parent entity, less any impairment charges.
For
per
sona
l use
onl
y

Notes to the Financial Statements For the Year Ended 30 June 2018
31
2 SUMMARY OF SIGNIFICANT ACCOUNTING POLICIES CONTINUED
(d) Foreign currency translation
Both the functional and presentation currency of the Company and its Australian subsidiary is Australian dollars (A$). Transactions in foreign currencies are initially recorded in the functional currency at the exchange rates ruling at the date of the transaction. Monetary assets and liabilities denominated in foreign currencies are retranslated at the rate of exchange ruling at the balance sheet date.
(e) Plant and equipment
Plant and equipment is stated at cost less accumulated depreciation and any accumulated impairment losses. Such cost includes the cost of replacing parts that are eligible for capitalisation when the cost of replacing the parts is incurred. Similarly, when each major inspection is performed, its cost is recognised in the carrying amount of the plant and equipment as a replacement only if it is eligible for capitalisation. All other repairs and maintenance are recognised in the statement of comprehensive income as incurred.
Depreciation is calculated on a straight line basis over the estimated useful life of the asset as follows:
Major Depreciation rates are: 2018 2017
Leasehold improvements Lease term Lease term Plant and equipment: -Fixture and fittings 5-10 years 5-10 years-Information technology 2-3 years 2-3 years-Warehouse equipment 4-10 years 4-10 years-Office furniture and equipment 2.5-8 years 2.5-8 years -Plant and equipment under lease 5 years 5 years
The assets’ residual values, useful lives and amortisation methods are reviewed and adjusted if appropriate.
An item of plant and equipment is derecognised upon disposal or when no future economic benefits are expected from its use or disposal.
(f) Segment reporting
Operating segments are reported in a manner consistent with the internal reporting provided to the chief operating decision maker. The chief operating decision maker, who is responsible for allocating resources and assessing performance of the operating segments, has been identified as the Board.
For
per
sona
l use
onl
y

Notes to the Financial Statements For the Year Ended 30 June 2018
32
2 SUMMARY OF SIGNIFICANT ACCOUNTING POLICIES CONTINUED
(g) Intangible assets
The useful lives of intangible assets are assessed as either finite or indefinite.
Intangible assets with finite lives are amortised over the useful economic life and assessed for impairment whenever there is an indication that the intangible asset may be impaired. The amortisation period and the amortisation method for an intangible asset with a finite useful life are reviewed at least at the end of each reporting period. Changes in the expected useful life or the expected pattern of consumption of future economic benefits embodied in the asset are considered to modify the amortisation period or method, as appropriate, and are treated as changes in accounting estimates. The amortisation expense on intangible assets with finite lives is recognised in the statement of profit or loss as the expense category that is consistent with the function of the intangible assets.
Intangible assets with indefinite useful lives are not amortised, but are tested for impairment annually, either individually or at the cash-generating unit level. The assessment of indefinite life is reviewed annually to determine whether the indefinite life continues to be supportable. If not, the change in useful life from indefinite to finite is made on a prospective basis.
Licence fees
Where licences are acquired for the purposes of assisting in research and development or for the entity’s use
of patented techniques or processes in conducting operations, the costs are capitalised. Licenses acquired during the financial year have been assessed as having a useful life in line with that of the underlying patent and associated methodologies.
Software development
Software development costs are capitalised at the direct costs and amortised on a straight line basis over the period of their expected benefit being their finite life of 3 years. Amortisation starts at the time that the technology is activated and is used by both internal and external customers. The capitalised costs of platform technology include the direct costs of external consultants and any supporting software acquired from a third party.
Intellectual Property
The costs of the Stemlife assets are capitalised and amortised on a straight line basis over the period of their expected benefit being their finite life of 9 years. Amortisation starts at the time of the acquisition. These costs include the direct costs paid to Stemlife for the assets and the legal fees incurred in the transaction.
The assessment of useful life is reviewed annually by the Board to determine whether the assumptions made continue to be appropriate and supportable. If not, the useful life assessment is changed on a prospective basis. F
or p
erso
nal u
se o
nly

Notes to the Financial Statements For the Year Ended 30 June 2018
33
2 SUMMARY OF SIGNIFICANT ACCOUNTING POLICIES CONTINUED
(h) Prepayments
Payments made in advance of services are recognized at the time of payment and classed as prepayments on the balance sheet. As the services are incurred, the relevant amounts are recognized as an expense in the profit and loss statement.
Costs incurred in relation to the implementation & development of applications are capitalised as a prepayment reflecting the economic benefits to be consumed over the contract service period. Any costs in relation to training & data conversion are expensed as incurred.
An assessment confirmed that these costs do not meet the recognition criteria as capitalized costs under AASB 138, specifically the control criteria. This is on the basis the hardware and applications are controlled by the contracted service provider and cannot be transferred to another party or host under the agreement. In absence of specific guidance under AASB, the accounting hierarchy under AASB 108 para 12 has been applied which allows the use of recent pronouncements of other standard setting bodies.
(i) Inventories
Inventories consist of consumables used in the provision of services. Inventories are valued at the lower of cost and net realisable value. Cost is determined by actual purchase price. Net realisable value is the estimated selling price in the ordinary course of business, less estimated costs of completion and the estimated costs necessary to make the sale.
(j) Trade and other receivables
Trade receivables (current), which generally have 30 day terms, are recognised initially at fair value less an allowance for impairment.
Collectability of trade receivables is reviewed on an ongoing basis and individual debts that are known to be uncollectible are written off when identified. An impairment provision is recognised when there is objective evidence that the group may not be able to collect the receivable.
Trade receivables (non-current), which generally have terms in excess of 24 months, are carried at their net present value. The expected net cash flows have been discounted to their present value using a market determined risk adjusted discount rate of 13.9% (2017: 13.9%).
(k) Cash and cash equivalents
Cash and cash equivalents in the statement of financial position comprise cash at bank, in hand and short-term deposits with an original maturity of three months or less that are readily convertible to known amounts of cash and which are subject to an insignificant risk of changes in value.
For the purposes of the statement of cash flows, cash and cash equivalents consist of cash and cash equivalents as defined above, net of outstanding bank overdrafts.
(l) Trade and other payables
Trade and other payables are carried at amortised costs and due to their short term nature, they are not discounted. They represent liabilities for goods and services provided to the Group prior to the end of the
For
per
sona
l use
onl
y

Notes to the Financial Statements For the Year Ended 30 June 2018
34
2 SUMMARY OF SIGNIFICANT ACCOUNTING POLICIES CONTINUED
(l) Trade and other payables continued
financial year that are unpaid and arise when the Group becomes obliged to make future payments in respect of the purchase of these goods and services. The amounts are unsecured and are usually paid within 30 days of recognition.
(m) Employee leave benefits
Wages, Salaries and Annual Leave
Liabilities for wages and salaries, including non-monetary benefits and annual leave expected to be settled
within 12 months of the reporting date are recognised in provisions in respect of employees’ services up to the reporting date. They are measured at the amounts expected to be paid when the liabilities are settled. Expenses for non- accumulating sick leave are recognised when the leave is taken and are measured at the rates paid or payable. Unused sick leave on termination of employment is forfeited.
Long Service Leave
The liability for long service leave is recognised and measured as the present value of expected future payments
to be made in respect of services provided by employees up to the reporting date using the projected unit credit method. Consideration is given to the expected future wage and salary levels, experience of employee departures, and periods of service. Expected future payments are discounted using market yields at the reporting date on national government bonds with terms to maturity and currencies that match, as closely as possible, the estimated future cash outflows.
(n) Provisions
Provisions are recognised when the Group has a present obligation (legal or constructive) as a result of a past event, it is probable that an outflow of resources embodying economic benefits will be required to settle the
obligation and a reliable estimate can be made of the amount of the obligation.
Where the Group expects some or all of a provision to be reimbursed, the reimbursement is recognised as a separate asset but only when the reimbursement is virtually certain. The expense relating to any provision is presented in the statement of comprehensive income net of any reimbursement.
If the effect of the time value of money is material, provisions are determined by discounting the expected future cash flows at a pre-tax rate that reflects current market assessments of the time value of money and, where appropriate, the risks specific to the liability.
For
per
sona
l use
onl
y
Notes to the Financial Statements For the Year Ended 30 June 2018
35
2 SUMMARY OF SIGNIFICANT ACCOUNTING POLICIES CONTINUED
(o) Share-based payment transactions
The group provides benefits to employees including executive directors of the Group in the form of share based payment transactions, whereby the employees render services in exchange for rights over shares (‘equity-settled transactions’) under the Cryosite Employee Incentive Plan (CEIP) or individually negotiated share based payment arrangements.
The cost of these equity-settled transactions with employees is measured by reference to the fair value at the date at which they are granted. The fair value is determined using a binomial model.
In valuing equity-settled transactions, no account is taken of any performance conditions, other than conditions linked to the price of the shares of the Company (‘market conditions’).
The cost of equity-settled transactions is recognised, together with a corresponding increase in equity, over the period in which the performance conditions are fulfilled, ending on the date on which the relevant employees become fully entitled to the award (‘vesting date’).
The cumulative expense recognised for equity-settled transactions at each reporting date until vesting date reflects:
(i) the extent to which the vesting period has expired and(ii) the number of awards that, in the opinion of directors of the Group, will ultimately vest. This opinion
is formed based on the best available information at balance date.
No adjustment is made for the likelihood of market performance conditions being met as the effect of these conditions is included in the determination of fair value at grant date.
No expense is recognised for awards that do not ultimately vest, except for awards where vesting is conditional upon a market condition.
Where the terms of an equity-settled award are modified, as a minimum, an expense is recognised as if the terms had not been modified. In addition, an expense is recognised for any increase in the value of the transaction as a result of the modification, as measured at the date of modification.
Where an equity-settled award is cancelled, it is treated as if it had vested on the date of cancellation, and any expense not yet recognised for the award is recognised immediately. However, if a new award is substituted for the cancelled award, and designated as a replacement award on the date that it was granted, the cancelled and new award are treated as if they were a modification of the original award, as described in the previous paragraph.
In the case where outstanding equity-settled awards have expired, the relevant amounts in respect to these awards in the share reserves are transferred to retained earnings.F
or p
erso
nal u
se o
nly

Notes to the Financial Statements For the Year Ended 30 June 2018
36
2 SUMMARY OF SIGNIFICANT ACCOUNTING POLICIES CONTINUED
(p) Leases
Leases where the lessor retains substantially all the risks and benefits of ownership of the asset are classified as operating leases. Initial direct costs incurred in negotiating an operating lease are added to the carrying amount of the leased asset and recognised over the lease term on the same bases as the lease income.
Operating lease payments are recognised as an expense in the statement of comprehensive income on a straight-line basis over the lease term. Operating lease incentives are recognised as a liability when received and subsequently reduced by allocating lease payments between rental expense and reduction of the liability.
(q) Revenue
Revenue is recognised and measured at the fair value of the consideration received or receivable to the extent that it is probable that the economic benefits will flow to the Group and the revenue can be reliably measured. The following specific recognition criteria must also be met before revenue is recognised:
- Revenue from the archival storage of biological samples is recognised over the period that storage occurs.- Revenue from the rendering of non-storage services, such as collection or distribution of biological samples,
is recognised upon the delivery of the service to the customers.- Revenue from cord blood and tissue services is recognised in the accounting period in which the services are
rendered. Where the Group has a longterm contract with its customers to provide cord blood services, areceivable is recognised at its net present value with a corresponding amount recognised as unearnedincome in the statement of financial position (Refer Note 19 and 20).
- Interest revenue is recognised as interest accrues using the effective interest method. This is a method ofcalculating the amortised cost of a financial asset and allocating the interest income over the relevant periodusing the effective interest rate, which is the rate that exactly discounts estimated future cash receiptsthrough the expected life of the financial asset to the net carrying amount of the financial asset.
- Dividends: revenue is recognised when the Company’s right to receive the payment is established.
Please note that on the 23rd June 2017, the company entered into a binding agreement (subject to certain conditions being met which included shareholder and regulatory approval) to license, under the Cryosite brand, the collection, processing and storage of umbilical cord blood and tissue and to sell certain of its Cord Blood and Tissue Banking assets to Cell Care Australia Pty Ltd. As part of this agreement the company received an upfront non-refundable payment $500,000 prior to the 30 June 2017. This amount was recognized as revenue as non-refundable income in the Cord Blood and Tissue storage in 2017. This income is part of the discontinued operations for 2017 comparisons.
(r) Income tax and other taxes
Current tax assets and liabilities for the current and prior periods are measured at the amount expected to be recovered from or paid to the taxation authorities based on the current period’s taxable income. The tax rates and tax laws used to compute the amount are those that are enacted or substantively enacted by the balance date. F
or p
erso
nal u
se o
nly

Notes to the Financial Statements For the Year Ended 30 June 2018
37
2 SUMMARY OF SIGNIFICANT ACCOUNTING POLICIES CONTINUED
Deferred income tax is provided on all temporary differences at the balance date between the tax bases of assets and liabilities and their carrying amounts for financial reporting purposes.
Deferred income tax liabilities are recognised for all taxable temporary differences:
- Except where the deferred income tax liability arises from the initial recognition of an asset or liability in atransaction that is not a business combination and, at the time of the transaction, affects neither theaccounting profit nor taxable profit or loss; and
- In respect of taxable temporary differences associated with investments in subsidiaries, associates andinterests in joint ventures, except where the timing of the reversal of the temporary differences can becontrolled and it is probable that the temporary differences will not reverse in the foreseeable future.
Deferred income tax assets are recognised for all deductible temporary differences, carry-forward of unused tax assets and unused tax losses, to the extent that it is probable that the taxable profit will be available against which the deductible temporary differences, and the carry-forward of unused tax assets and unused tax losses can be utilised:
- Except where the deferred income tax asset relating to the deductible temporary difference arises from theinitial recognition of an asset or liability in a transaction that is not a business combination and, at the timeof the transaction, affects neither the accounting profit nor taxable profit or loss; or
In respect of deductible temporary differences associated with investments in subsidiaries, associates and interests in joint ventures, deferred tax assets are only recognised to the extent that it is probable that the temporary differences will reverse in the foreseeable future and taxable profit will be available against which the temporary differences can be utilised. The carrying amount of deferred income tax assets is reviewed at each balance date and reduced to the extent that it is no longer probable that sufficient taxable profit will be available to allow all or part of the deferred income tax asset to be utilised.
Unrecognised deferred income tax assets are reassessed at each balance date and are recognised to the extent that it has become probable that future tax profit will allow the deferred tax asset to be recovered.
Deferred income tax assets and liabilities are measured at the tax rates that are expected to apply to the year when the asset is realised or the liability is settled, based on tax rates (and tax laws) that have been enacted or substantively enacted at the balance date.
Deferred tax assets and deferred tax liabilities are offset only if a legally enforceable right exists to set off current tax assets against current tax liabilities and the deferred tax assets and liabilities relate to the same taxable entity and the same taxation authority.
Income taxes relating to items recognised directly in equity are recognised in equity and not in the statement of comprehensive income.
For
per
sona
l use
onl
y

Notes to the Financial Statements For the Year Ended 30 June 2018
38
2 SUMMARY OF SIGNIFICANT ACCOUNTING POLICIES CONTINUED
Revenues, expenses and assets are recognised net of the amount of GST except:
- where the GST incurred on a purchase of goods and services is not recoverable from the taxation authority,in which case the GST is recognised as part of the cost of acquisition of the asset or as part of the expenseitem as applicable; and
- receivables and payables are stated with the amount of GST included the net amount of GST recoverablefrom, or payable to, the taxation authority is included as part of receivables or payables in the statement offinancial position.
Cash flows are included in the Statement of Cash Flows on a gross basis and the GST component of cash flows arising from investing and financing activities, which is recoverable from, or payable to, the taxation authority, are classified as operating cash flows.
Commitments and contingencies are disclosed net of the amount of GST recoverable from, or payable to, the taxation authority.
(s) Contributed equity
Contributed capital bares no special terms or conditions affecting income or capital entitlements of the shareholders. Ordinary share capital is recognised at the fair value of the consideration received by the company. Any transaction costs arising on the issue of ordinary shares are recognised directly in equity as a reduction of the share proceeds received.
(t) Share options reserve
The share options reserve captures the equity component of the company’s equity settled transactions of the share based payments schemes.
(u) Impairment of assets
Assets are tested for impairment whenever events or changes in circumstances indicate that the carrying amount may not be recoverable. An impairment loss is recognised for the amount by which the asset's carrying amount exceeds its recoverable amount. The recoverable amount is the higher of an asset's fair value less costs to sell and value in use. For the purposes of assessing impairment, assets are grouped at the lowest levels for which there a separately identifiable cash inflows which are largely independent of the cash inflows from other assets or groups of assets (cash-generating units). Non-financial assets other than goodwill that suffered impairment are reviewed for possible reversal of the impairment at the end of each reporting period.
(v) Earnings per share
Basic EPS is calculated as net profit attributable to members of the parent, adjusted to exclude costs of servicing equity (other than dividends) and preference share dividends, divided by the weighted average number of ordinary shares, adjusted for any bonus element. F
or p
erso
nal u
se o
nly

Notes to the Financial Statements For the Year Ended 30 June 2018
39
2 SUMMARY OF SIGNIFICANT ACCOUNTING POLICIES CONTINUED Diluted EPS is calculated as net profit attributable to members of the parent, adjusted for:
- Costs of servicing equity (other than dividends) and preference share dividends;
- The after tax effect of dividends and interest associated with dilutive potential ordinary shares that have been recognised as expenses; and
- Other non-discretionary changes in revenues or expenses during the year that would result from the dilution of potential ordinary shares
Divided by the weighted average number of ordinary shares and dilutive potential ordinary shares, adjusted for any bonus element. The basic EPS and diluted EPS for continuing operations are calculated as above based on net profit after tax from continuing operations rather than net profit attributable to members of the parent.
(w) Fair value measurement
The Group measures financial instruments at fair value at each balance sheet date. Fair values of financial instruments measured at amortised cost are disclosed at Note 31.
Fair value is the price that would be received to sell an asset or pair to transfer a liability in an orderly transaction between market participants at the measurement date. The fair value measurement is based on the presumption that the transaction to sell the asset or transfer the liability takes place either:
- In the principle market for the asset or liability; or
- In the absence of a principal market, in the most advantageous market for the asset or liability accessible to the Group.
A fair value measurement of a non-financial asset takes into account a market participant’s ability to generate economic benefits by using the asset in its highest and best use or by selling it to another market participant that would use the asset in the highest and best use.
The Group uses valuation techniques that are appropriate in the circumstances and for which sufficient data are available to measure fair value, maximising the use of relevant observable inputs and minimising the use of unobservable inputs.
For the purpose of fair value disclosure, the Group has determined classes of assets and liabilities on the basis of the nature, characteristics and risks of the asset or liability and the level of the fair value hierarchy.
For
per
sona
l use
onl
y
Notes to the Financial Statements For the Year Ended 30 June 2018
40
2 SUMMARY OF SIGNIFICANT ACCOUNTING POLICIES CONTINUED
(x) Current versus non-current classification
The Group presents assets and liabilities in statement of financial position based on current/non-current classification.
An asset as current when it is: - Expected to be realised or intended to sold or consumed in normal operating cycle; - Held primarily for the purpose of trading; - Expected to be realised within 12 months after the reporting period, or - Cash or cash equivalent unless restricted from being exchanged or used to settle a liability for at least twelve
months after the reporting period.
All other assets are classified as noncurrent. A liability is current when: - It is expected to be settled in normal operating cycle; - It is held primarily for the purpose of trading; - It is due to be settled within 12 months after the reporting period, or - There is no unconditional right to defer the settlement of the liability for at least 12 months after the
reporting period The Group classifies all other liabilities as non-current. Deferred tax assets and liabilities are classified as non-current assets and liabilities.
(y) Current versus non-current classification
A discontinued operation is a component of an entity that either has been disposed of, discontinued or is classified as held for sale, and
(i) represents a separate major line of business or geographical area of operations; (ii) is part of a single co-ordinated plan to dispose of a separate major line or geographical area of
operations; or, (iii) is a subsidiary acquired exclusively with a view to resale.
Discontinued operations are excluded from the results of continuing operations and are presented as a single amount as profit or loss after tax from discontinued operations in the statement of profit or loss. Additional disclosures are provided in Note 32. All other notes to the financial statements include amounts for continuing operations, unless indicated otherwise.
For
per
sona
l use
onl
y

Notes to the Financial Statements For the Year Ended 30 June 2018
41
3. SIGNIFICANT ACCOUNTING JUDGEMENTS, ESTIMATES AND ASSUMPTIONS
The preparation of the financial statements requires management to make judgements, estimates that affect the reported amounts in the financial statements. Management continually evaluates its judgements and estimates in relation to assets, liabilities, contingent liabilities, revenue and expenses. Management bases its judgements and estimates on historical experience and on other various factors it believes to be reasonable under the circumstances, the result of which form the basis of the carrying values of assets and liabilities that are not readily apparent from the source. Actual results may differ from these estimates and estimates under different assumptions and conditions.
Management has identified the following critical accounting estimates and judgements:
Capitalised Development Costs Initial capitalisation of development costs is based on management’s judgement that technological and economic feasibility is confirmed, usually when a product development project has reached a defined milestone. In determining the amounts to be capitalised, management makes assumptions regarding the expected future cash generation of the project, discount rates to be applied and the expected period of benefit. At 30 June 2018, the carrying amount of capitalised development costs was $nil. (2017: $163,383).
Revenue Recognition - Long Term Cord Blood and Tissue Storage Contracts Long term cord blood storage contracts involve the calculation of an estimate of the costs of providing the storage service over the term of the contract. As these contracts are long term in nature, estimates are required in respect of the following: - Cost of provision of up front service; - Cost of provision of ongoing long- term storage service; and - Interest component in relation to deferred payment.
These calculations impact the overall balance of revenue, unearned revenue and debtors at year end. In determining these amounts, a present value calculation is performed in respect of the deferred components of the contract, which involves the determination of an appropriate discount rate. The estimate of the discount rate is reviewed on an annual basis by the directors to ensure that it is reasonable and reflective of current risks and returns.
Further, in determining the costs of providing these services, the incremental costs incurred in the storage of cord blood is assessed and reviewed annually and forms the basis upon which the amount of revenue and profit is recognised. As noted in accounting policy note 2 (b), the revenue recognition associated with long-term cord blood and tissue storage contracts will change from 1st July 2018 with the adoption of AASB 1015. Taxation Uncertainties exist with respect to the interpretation of complex tax regulations, changes in tax laws and the amount and timing of future taxable income. The group’s accounting policy for taxation requires management’s judgement as to the types of arrangements considered to be a tax on income in contrast to an operating cost.
For
per
sona
l use
onl
y

Notes to the Financial Statements For the Year Ended 30 June 2018
42
3. SIGNIFICANT ACCOUNTING JUDGEMENTS, ESTIMATES AND ASSUMPTIONS CONTINUED Taxation continued Judgement is also required in assessing whether deferred tax assets and certain deferred tax liabilities are recognised in the statement of financial position. Deferred tax assets, including those arising from un recouped tax losses, capital losses and temporary differences, are recognised only where it is considered more likely than not that they will be recovered, which is dependent on the generation of sufficient future taxable profits. The Group has $981,322 unconfirmed (2017: $44,958) tax losses carried forward which have not been recognised on the statement of financial position. Assumptions about the generation of future taxable profits and repatriation of retained earnings depend on management’s estimates of future cash flows. Judgements are also required about the application of income tax legislation. These judgements and assumptions are subject to risk and uncertainty, hence there is a possibility that changes in circumstances will alter expectations, which may impact on the amount of deferred tax liabilities or assets recognised on the statement of financial position and the amount of other tax losses and temporary differences not yet recognised. In such circumstances, some or all of the carrying amounts of recognised deferred tax assets and liabilities may require adjustment, resulting in a corresponding credit or charge to the statement of comprehensive income. Share Based Payment Transactions The group measures the cost of equity-settled transactions with employees by reference to the fair value of the
equity instruments at the date at which they are granted. The fair value is determined using a binomial model. The accounting estimates and assumptions relating to equity-settled share based payments would have no impact on the carrying amounts of assets and liabilities within the next annual reporting period but may impact on expenses and equity.
Estimated Useful Lives of Assets The estimation of the useful lives of assets and their residual values has been based on historical experience as well as manufacturers’ warranties. In addition, the condition of assets is assessed at least once per year and considered against the remaining useful life. Adjustments to useful lives are made when considered necessary. The estimated useful life of licenses acquired has been based upon the useful life of the patents and associated methodologies underpinning the license. The assessment of useful life is reviewed annually by the Board to determine whether the assumptions made continue to be appropriate and supportable given the license conditions and underlying patents. If the useful life assessment is assessed as inappropriate, either due to a change in license conditions or patents, it is changed on a prospective basis.
As result of the decision to cease the collection and processing of cord blood and tissue samples, the board reviewed and concluded that these licences were impaired. Refer Note 17 for the details of the impairment loss recognized.
Long Service Leave Provision
The liability for long service leave is recognised and measured at the present value of the estimated future cash flows to be made in respect of all employees at the reporting date. In determining the present value of the liability, estimates of attrition rates and pay increases through promotion and inflation have been taken into account.
For
per
sona
l use
onl
y

Notes to the Financial Statements For the Year Ended 30 June 2018
43
3 SIGNIFICANT ACCOUNTING JUDGEMENTS, ESTIMATES AND ASSUMPTIONS CONTINUED
Make Good Provisions
A provision has been made for the present value of anticipated costs for future restoration of leased premises.
This provision includes future cost estimates associated with dismantling, closure, decontamination and permanent storage of historical residues. The calculation of any provision requires assumptions such as application of environmental legislation, plant closure dates, available technologies and engineering cost estimates. These uncertainties may result in future actual expenditure differing from amounts provided. Any provision recognised will be periodically reviewed and updated based on the facts and circumstances available at the time. Changes to the estimated future costs are recognised in the statement of financial position by adjusting both the expense or asset and provision. The appropriateness of the make good provision is assessed annually.
Impairment of Receivable Balances Included in the receivable balance at year end is an allowance for impairment loss of $45,590 (2017: $40,515). A provision is recognised when there is objective evidence that an individual receivable is impaired. The provision for impairment if receivable requires a degree of estimation and judgement. The level of the provision is regularly assessed and considers client activity with the group, ageing of receivables, historical collections and other specific knowledge of the individual debtor.
Impairment of Non-Financial Assets other than Indefinite Life Intangible Assets The Company assesses impairment of non-financial assets other than indefinite life intangible assets at each reporting date by evaluating conditions specific to the Company and to the particular asset that may lead to impairment. If an impairment trigger exists, the recoverable amount of the asset is determined. This involves fair value less costs of disposal or value-in-use calculations, which incorporate a number of key estimates and assumptions.
During the year, following management’s decision to cease the collection and processing of cord blood and cord tissue samples, board reviewed all non-financial assets associated with these operations and, as a result of this review, concluded that these assets were impaired. Refer to Note 33 for the impairment loss recognized.
Prepayments
During the year the Company incurred costs in the implementation & development of a new technology applications. The board reviewed these costs and determine that these costs should be expensed over a period of time to reflect the economic benefits that will be consumed as a result of using this technology over this period. Costs incurred in relation to the implementation & development of applications are capitalised as a prepayment
reflecting the economic benefits to be consumed over the contract service period. Any costs in relation to training & data conversion are expensed as incurred.
For
per
sona
l use
onl
y

Notes to the Financial Statements For the Year Ended 30 June 2018
44
3 SIGNIFICANT ACCOUNTING JUDGEMENTS, ESTIMATES AND ASSUMPTIONS CONTINUED
Discontinued Operations
In October 2017, the Company completed the closure of the laboratory operations and the departure of staff
associated with the collection and processing of cord blood and tissue samples. This resulted in the termination of operations associated with collection and processing of cord blood and tissue samples which has been disclosed separately in the accounts as discontinued operations.
Discontinued operations result for 2018 includes revenue from a small number of contracts collected and processed in 2018. It also includes normal operating and employment costs associated with the activities of collection and processing which were separately identified up to the time of closure. Additional costs, such as redundancies and legal fees, associated with the actual closure have also been included. Further, as result of the decision to cease the collection and processing of cord blood and tissue samples, the
board reviewed all non-financial assets associated with these operations and, as a result of this review, concluded that these assets were impaired. Consequently they have resolved to write down these assets by $555,586 in 2018.
Comparatives for discontinued operations were calculated on the same basis as 2018. Costs also included marketing expenses but excluded costs associated with the actual closure.
4 SEGMENT INFORMATION
Identification of Reportable Segments The Company has identified its operating segments within it’s continuing operations based on the internal reports that are reviewed and used by the Board of Directors (the chief operating decision makers(”CODM”)) in assessing performance and in determining the allocation of resources. The segment information provided is consistent with the internal management reporting. Two reportable segments have been identified as follows: Cord Blood and Tissue Storage Long term storage of cord blood and tissue samples. Clinical Trials Logistics and Biorepository These services include biorepository services, clinical trials logistics, commercial drug distribution and the other storage and distribution based services including the importation and distribution of laboratory diagnostic products. It should be noted that previously biorepository services where include in Individualised Consumer Biologics and has been moved to this segment as is more aligned to this part of the business.
The CODM reviews each segment’s net operating profit (loss) before tax and interest (NPBIT) after the allocation of overheads. The accounting policies adopted for internal reporting to the CODM are consistent with those adopted in the financial statements.
For
per
sona
l use
onl
y

Notes to the Financial Statements For the Year Ended 30 June 2018
45
4 SEGMENT INFORMATION CONTINUED
A reconciliation of operating EBITDA is provided as follows:
The information reported to the CODM is at least on a monthly basis.
Cord Blood and Tissue Storage
Clinical Trials Logistics and Biorepository
Total
$ $ $
30 June 2018 - Consolidated
Total segment revenue 558,873 5,364,193 5,923,065
Segment profit before ITDA 5,630 592,257 597,887
30 June 2017 - Consolidated
Total segment revenue 641,005 5,242,348 5,883,353
Segment profit before ITDA (552,491) 987,036 434,545
Total Segment assets 30 June 2018 1,504,245 6,239,434 7,743,679
30 June 2017 6,068,701 3,758,366 9.827,067
Consolidated
30-Jun-18 30-Jun-17
$ $
Operating EBITDA 597,887 434,545
Interest revenue 58,926 69,232
Depreciation and amortisation (338,448) (524,531)
Profit before tax from continuing operations 318,365 (20,754)
For
per
sona
l use
onl
y

Notes to the Financial Statements For the Year Ended 30 June 2018
46
5 REVENUE Consolidated
30-Jun-18 30-Jun-17 $ $
Revenue
Sale of goods and rendering of services 5,310,826 5,187,453
Storage Revenue 553,313 626,668
Total Revenue 5,864,139 5,814,121
Other Revenue
Interest income 58,926 69,232
Total Revenue 5,923,065 5,883,353
6 EXPENSES
(a) Legal costs
Legal costs 370,990 281,227
(b) Lease payments Lease payments-operating leases 318,753 312,093
(c) Employee benefits expense Wages and salaries 2,481,166 3,310,380
Superannuation costs 243,017 363,224 2,724,183 3,673,604
(d) Depreciation- Plant & Equipment Depreciation – plant & equipment 16 362,866 483,140
(e) Impairment loss
Impairment loss 16 555,586 -
(f) Amortisation of Intangibles
Amortisation of Intangibles 17 61,882 104,511
Legal costs incurred in 2017 include $169,508 (pre -tax) relating to the legal settlement outlined in Note 33. These costs were disclosed as Administration expenses in 2017 accounts.
For
per
sona
l use
onl
y
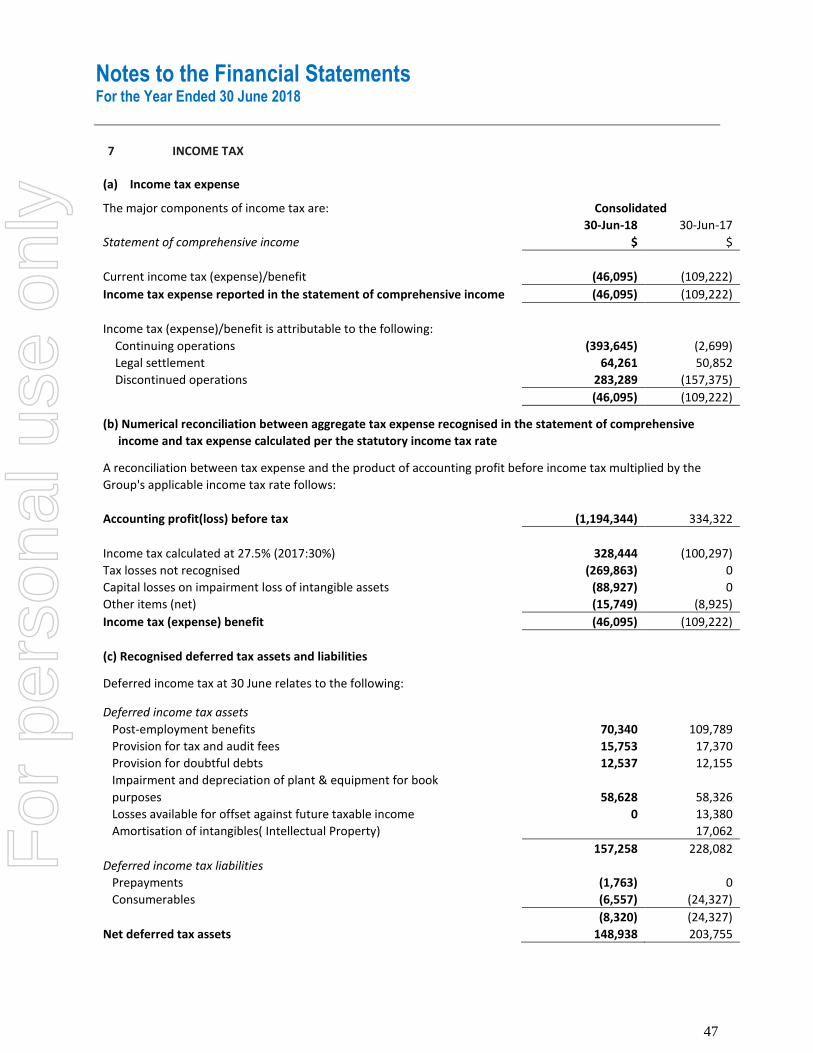
Notes to the Financial Statements For the Year Ended 30 June 2018
47
7 INCOME TAX
(a) Income tax expense The major components of income tax are: Consolidated
30-Jun-18 30-Jun-17
Statement of comprehensive income $ $
Current income tax (expense)/benefit (46,095) (109,222)
Income tax expense reported in the statement of comprehensive income (46,095) (109,222)
Income tax (expense)/benefit is attributable to the following: Continuing operations (393,645) (2,699)
Legal settlement 64,261 50,852
Discontinued operations 283,289 (157,375)
(46,095) (109,222)
(b) Numerical reconciliation between aggregate tax expense recognised in the statement of comprehensive
income and tax expense calculated per the statutory income tax rate A reconciliation between tax expense and the product of accounting profit before income tax multiplied by the
Group's applicable income tax rate follows:
Accounting profit(loss) before tax (1,194,344) 334,322
Income tax calculated at 27.5% (2017:30%) 328,444 (100,297)
Tax losses not recognised (269,863) 0
Capital losses on impairment loss of intangible assets (88,927) 0
Other items (net) (15,749) (8,925)
Income tax (expense) benefit (46,095) (109,222)
(c) Recognised deferred tax assets and liabilities Deferred income tax at 30 June relates to the following: Deferred income tax assets Post-employment benefits 70,340 109,789
Provision for tax and audit fees 15,753 17,370
Provision for doubtful debts 12,537 12,155
Impairment and depreciation of plant & equipment for book purposes 58,628 58,326
Losses available for offset against future taxable income 0 13,380
Amortisation of intangibles( Intellectual Property) 17,062
157,258 228,082
Deferred income tax liabilities Prepayments (1,763) 0
Consumerables (6,557) (24,327)
(8,320) (24,327)
Net deferred tax assets 148,938 203,755
For
per
sona
l use
onl
y

Notes to the Financial Statements For the Year Ended 30 June 2018
48
7 INCOME TAX CONTINUED
(d) Tax (expense) benefit related to items of other comprehensive income.
There were no items of comprehensive income during the year giving rise to any income expense (benefit).
(e) Tax losses
The Group has unconfirmed tax losses arising in Australia of $981,322 (2017: $43,289) that are available for offset against future taxable profits of the company. The deferred income tax asset of $269,863 (2017: $13,380) arising from these losses has not been brought to account at reporting date, as realisation of the benefit is unprobable at this point in time. The Group will continue to review this regularly to determine whether to recognize these tax losses as deferred tax asset in the future.
Tax consolidation Effective from 1 July 2002, Cryosite Limited and its 100% owned subsidiary formed a tax consolidated group. On formation of the tax consolidated group, the entities in the tax consolidated group agreed to enter into a tax sharing deed which will, in the opinion of the directors, limit the joint and several liabilities of the wholly-owned entities in the case of default by the head entity Cryosite Limited. The tax sharing deed was signed on 12 May 2011.
The entities have also agreed to enter into a tax funding agreement under which the wholly-owned entities fully compensate the Company for any current tax payable assumed and are compensated by the Company for any current tax loss, deferred tax assets and tax credits that are transferred to the Company under the tax consolidation legislation. The tax consolidated current tax liability or current year tax loss and other deferred tax assets are required to be allocated to the members of the tax consolidated group in accordance with UIG 1052. The group uses a group allocation method for this purpose where the allocated current tax payable, current tax loss, deferred tax assets and other tax credits for each member of the tax consolidated group is determined as if the company is a stand-alone taxpayer but modified as necessary to recognise membership of a tax consolidated group. The funding amounts are determined by reference to the amounts recognised in the wholly-owned entities’ financial statements which is determined having regard to membership of the tax consolidated group. The amounts receivable/payable under the tax funding agreement are due upon receipt of the funding advice from the head entity, which is issued as soon as practicable after the end of each financial year. The head entity may also require payment of interim funding amounts to assist with its obligations to pay tax instalments. The funding amounts are recognised as current inter-company receivables or payables.
For
per
sona
l use
onl
y

Notes to the Financial Statements For the Year Ended 30 June 2018
49
8 EARNINGS PER SHARE
Consolidated
30-Jun-18 30-Jun-17 $ $
The following reflects the income used in the basic and diluted earnings per share computations:
Basic earnings per share
(2.65)
0.48
Diluted earnings per share (2.61) 0.48
Basic EPS disclosure
Earnings used in EPS calculation (1,240,439) 225,100 Net profit attributable to ordinary equity holders of the parent
(1,240,439) 225,100
No. of shares
Weighted average number of ordinary shares for basic earnings per share 46,859,563 46,859,563
Diluted EPS disclosure
Earnings used in diluted EPS calculation (1,240,439) 225,100 Net profit attributable to ordinary equity holders of the parent
(1,240,439) 225,100
No. of shares
Weighted average number of ordinary shares for basic earnings per share
46,859,563 46,859,563
Shares deemed to be used for no consideration – performance rights & options
640,114 71,105
Weighted average number of ordinary shares used in the calculation of diluted EPS 47,499,677 46,930,668
There have been no other transactions involving ordinary shares or potential ordinary shares since the reporting date and before completion of these financial statements
For
per
sona
l use
onl
y

Notes to the Financial Statements For the Year Ended 30 June 2018
50
8 EARNINGS PER SHARE CONTINUED
Consolidated
30-Jun-18 30-Jun-17 $ $
The following reflects the income used in the basic and diluted earnings per share for continuing operations computations:
Basic earnings per share
(0.002)
(0.001)
Diluted earnings per share (0.002) (0.001)
Basic EPS for continuing operations disclosure
Earnings used in EPS for continuing operations calculation
(75,280) (23,453)
Net profit attributable to ordinary equity holders of the parent
(75,280) (23,453)
No. of shares
Weighted average number of ordinary shares for basic earnings per share for continuing operations 46,859,563 46,859,563
Diluted EPS for continuing operations disclosure
Earnings used in diluted EPS for continuing operations calculation
(75,280) (23,453)
Net profit attributable to ordinary equity holders of the parent
(75,280) (23,453)
No. of shares
Weighted average number of ordinary shares for basic earnings per share
46,859,563 46,859,563
Shares deemed to be used for no consideration – performance rights & options
640,114 71,105
Weighted average number of ordinary shares used in the calculation of diluted EPS 47,499,677 46,930,668
There have been no other transactions involving ordinary shares or potential ordinary shares since the reporting date and before completion of these financial statements F
or p
erso
nal u
se o
nly

Notes to the Financial Statements For the Year Ended 30 June 2018
51
9 DIVIDENDS PAID OR PROPOSED ON ORDINARY SHARES
Consolidated
2018 2017
Declared and paid during the year: $ $
Declared Final unfranked dividend nil cents per share for 2018 (0.5 cents per share for 2017) - 234,298 Interim unfranked dividend nil cents per share for 2018 (0.5 cents per share for 2017)
- 234,269
Total Declared - 468,567
Total Dividends Paid - 468,597
No further dividends have been declared or recommended at the date of this report.
10 CASH AND CASH EQUIVALENTS
Cash at bank and on hand 534,181 591,056
Short-term deposits 4,153,923 4,498,054
4,688,104 5,089,110
Cash at bank and on hand earns interest at floating rates based on daily bank deposit rates. Short-term deposits are made for varying periods of between one day and six months depending on the immediate cash requirements of the group and earn interest at the respective short-term deposit rates.
The fair value of cash and cash equivalents for the consolidated group and parent entity is $4,688,104 (2017: $5,089,110).
Reconciliation of cash
For purposes of the Statement of Cash Flow, cash and cash equivalents as at 30 June 2018 and the prior year are as shown above.
For
per
sona
l use
onl
y

Notes to the Financial Statements For the Year Ended 30 June 2018
52
11 STATEMENT OF CASH FLOW RECONCILIATION
Reconciliation of the net profit after tax to the net cash flows from operations Consolidated
2018 2017
$ $
Net profit (1,240,439) 225,100
Less: Transfer to investing activities (42,680) (75,452)
Less: Transfer to financing activities - (500,000)
Adjustments for non-cash items Depreciation and amortisation of non-current assets 424,138 587,651
Impairment loss for discontinued operations 555,586 -
Increase (Decrease) in employee benefits – LSL (49,145) (49,347)
Grant of Performance rights 35,248 13,768
Changes in assets and liabilities (Increase) Decrease in trade and other receivables 1,214,737 722,182
Decrease (Increase) in inventory 57,240 38,902
Decrease (Increase) in other assets* (446,850) 158,018
Decrease in deferred tax asset 54,817 109,222
Increase (Decrease) in trade and other creditors (626,214) (24,308)
Decrease (Increase) in unearned income (59,461) 502,191
Increase (Decrease) in income tax provision - (52,088)
Decrease in employee claims provision (130,000) 130,000
Increase (Decrease) in bonus provision 41,501 -
Increase (Decrease) in dividend provision 22 -
Increase in employee benefits – annual leave (50,406) (159,050)
Net cash flow from operating activities (261,906) 1,626,789
*Includes prepayment of $362,756 relating to new technology platform
12 TRADE AND OTHER RECEIVABLES - CURRENT
Trade receivables 1,319,588 2,220,279
Allowance for impairment loss (a) (45,590) (40,515) 1,273,998 2,179,764
Other receivables 85,133 130,523
Carrying amount of trade and other receivables 1,359,131 2,310,287
F
or p
erso
nal u
se o
nly

Notes to the Financial Statements For the Year Ended 30 June 2018
53
12 TRADE AND OTHER RECEIVABLES - CURRENT CONTINUED
(a) Allowance for impairment loss
Trade receivables are non-interest bearing. Term payment plans are offered to customers under cord blood collection contracts. Customers have an option of payment in full, over 12 to 24 months or annually. A provision for impairment loss is recognised when there is objective evidence that an individual trade receivable is impaired, or trade receivables collectively. When there is an impairment loss, it has been included in the administration expense item. No individual debtor amount within the impairment allowance at year end is material.
Movements in the provision for impairment loss were as follows:
Consolidated
2018 2017 $ $ At the beginning of the year
40,515 92,603
Increase/(reduction) in impairment loss during the year 5,075 (52,088)
At the end of the year 45,590 40,515
(b) Analysis of trade receivables
At 30 June, the ageing analysis of trade receivables is as follows:
Not yet 0-30 31-60 61-90 +91 +91
Total due Days Days Days Days Days
PDNI* PDNI* CI** $ $ $ $ $ $ $ 2018 Current 1,319,588 799,829 197,058 42,163 41,682 192,661 45,590 Non-Current cURRENTDDDDDDDcUCurrent
243,264 243,264 - - - - - Total Consolidated 1,562,852 1,043,093 197,058 42,163 41,682 192,661 45,590
2017
Current 2,220,279 1,821,490 237,394 51,752 3,003 80,685 25,955 Non-Current 531,661 531,661 - - - - -
Total Consolidated 2,751,940 2,353,151 237,394 51,752 3,003 80,685 25,955
* Past due not impaired (“PDNI”) ** Past due considered impaired (“CI”)
Receivables past due but not considered impaired have been reviewed and it is believed that payment will be received in full. Other balances within trade and other receivables do not contain impaired assets and are not past due. It is expected that these other balances will be received when due.
For
per
sona
l use
onl
y
Notes to the Financial Statements For the Year Ended 30 June 2018
54
12 TRADE AND OTHER RECEIVABLES - CURRENT CONTINUED
(c) Fair value and credit risk
Due to the nature of these receivables, their carrying value is assumed to approximate their fair value. The maximum exposure to credit risk is the fair value of receivables. Collateral is not held as security, nor is it the Group’s policy to transfer (on-sell) receivables to special purpose entities.
13 INVENTORIES
Consolidated
2018 2017
$ $
Consumables at cost 23,845 81,569
Total Inventories at cost 23,845 81,569
14 PREPAYMENTS
Consolidated
2018 2017 $ $
Current 289,078 132,433
Non-Current 290,205 -
Total Prepayments* 579,283 -
*Prepayments includes a payment for a new technology platform which will be expensed over the next 5 years. This has been split into current of $72,551 and non-current of $290,205.
15 TRADE AND OTHER RECEIVABLES – NON CURRENT
Consolidated
2018 2017
$ $
Trade receivables 243,264 531,661
Carrying amount of non-current trade and other receivables 243,264 531,661
Trade receivables Trade receivables due under term payment plans 243,264 531,661
The maximum exposure to credit risk at the time of reporting is the carrying value of the receivables. F
or p
erso
nal u
se o
nly

Notes to the Financial Statements For the Year Ended 30 June 2018
55
16 INVESTMENT IN CONTROLLED ENTITY
Equity interest held by the consolidated entity
Investment
Name – Cryosite Distribution Pty Limited 2018 2017 2018 2017
% % $ $
Country of incorporation – Australia 100 100 20 20
17 PLANT AND EQUIPMENT
Leasehold Improvements
Fixtures and fittings
Information Technology
Warehouse Equipment
Office furniture & equipment Total
$ $ $ $ $ $
Cost At 1 July 2016 200,000 72,521 217,284 4,072,361 13,995 4,576,161
Additions - 36,114 17,271 142,324 363 196,072
Disposals - - - - - -
At 30 June 2017 200,000 108,635 234,555 4,214,685 14,358 4,772,233
Additions 11,612.73 25,194 28,823 98,989 16,896 181,515
Disposals
At 30 June 2018 211,613 133,829 263,378 4,313,674 31,254 4,953,748
Depreciation and Impairment At 1 July 2016 (200,000) (72,521) (135,808) (2,953,202) (8,581) (3,370,112)
Depreciation charge - (554) (63,364) (416,260) (2,926) (483,104)
Disposals - - - - - -
At 30 June 2017 (200,000) (73,075) (199,172) (3,369,462) (11,507) (3,853,216)
Depreciation charge (734) (5,911) (30,081) (321,523) (4,617) (362,866)
Disposals - - - - - -
Impairment loss* - - - (115,012) - (115,012)
At 30 June 2018 (200,734) (78,986) (229,253) (3,805,997) (16,124) (4,331,094)
Net Book Value - 30 June 2017 - 35,560 35,383 845,223 2,851 919,017
Net Book Value - 30 June 2018 10,879 54,843 34,125 507,677 15,130 622,654
*As result of the decision to cease the collection and processing of cord blood and tissue samples, the board reviewed the assets associated with these operations and, as a result of this review, concluded that these assets were impaired and consequently they have resolved to write down these assets by $115,012.
For
per
sona
l use
onl
y
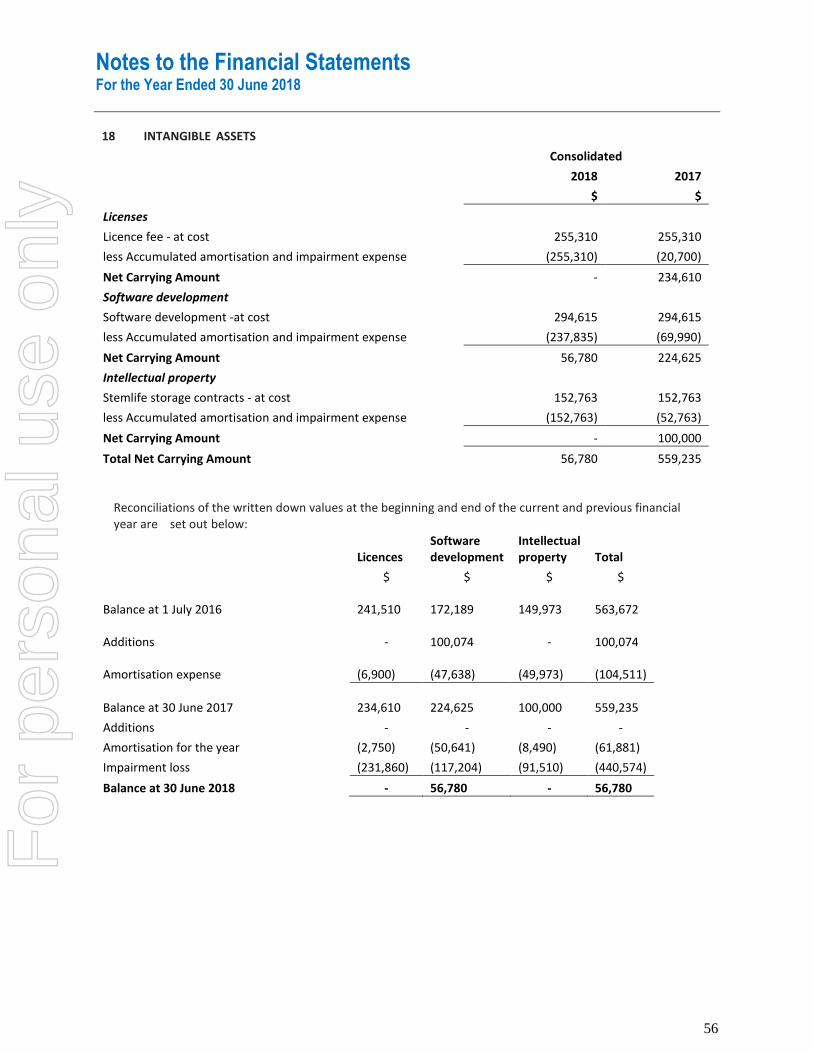
Notes to the Financial Statements For the Year Ended 30 June 2018
56
18 INTANGIBLE ASSETS
Consolidated
2018 2017
$ $
Licenses Licence fee - at cost 255,310 255,310
less Accumulated amortisation and impairment expense (255,310) (20,700)
Net Carrying Amount - 234,610
Software development Software development -at cost 294,615 294,615
less Accumulated amortisation and impairment expense (237,835) (69,990)
Net Carrying Amount 56,780 224,625
Intellectual property Stemlife storage contracts - at cost 152,763 152,763
less Accumulated amortisation and impairment expense (152,763) (52,763)
Net Carrying Amount - 100,000
Total Net Carrying Amount 56,780 559,235
Reconciliations of the written down values at the beginning and end of the current and previous financial year are set out below:
Licences Software development
Intellectual property Total
$ $ $ $
Balance at 1 July 2016 241,510
172,189
149,973 563,672
Additions - 100,074 -
100,074
Amortisation expense (6,900)
(47,638)
(49,973)
(104,511)
Balance at 30 June 2017 234,610
224,625
100,000
559,235
Additions - - - -
Amortisation for the year (2,750) (50,641) (8,490) (61,881)
Impairment loss (231,860) (117,204) (91,510) (440,574)
Balance at 30 June 2018 - 56,780 - 56,780
For
per
sona
l use
onl
y

Notes to the Financial Statements For the Year Ended 30 June 2018
57
18 INTANGIBLE ASSETS CONTINUED
Licence Fee
During the 2014 financial year, the Company entered into an exclusive licensing agreement within Australia and New Zealand to assist with the in-house development of new technologies to develop the range of stem cell service offerings. The Directors have assessed a finite life to the licence in line with the underlying patents and associated methodologies. Amortisation of $2,750 (2017: $6,900) has been charged for this year. The assessment of useful life is reviewed annually by the Directors to determine whether the assumptions made continue to be appropriate and supportable. If not, the useful life assessment is changed on a prospective basis. In 2018, the Company has ceased the collection and processing of new cord blood and cord tissue samples. As a result, the remaining net book value of the licence fee is fully impaired during the year. Refer to Note 33.
Software Development
During the 2016 and 2017 financial years, the Company has invested in the development of in-house software to enhance its operating capability. These costs include the direct costs of external consultants and any supporting software acquired from a third party. The assessment of useful life is reviewed annually by the Board to determine whether the assumptions made continue to be appropriate and supportable. If not, the useful life assessment is changed on a prospective basis. In 2018, the Company has ceased the collection and processing of new cord blood and cord tissue samples. As a result, software associated with this segment is considered fully impaired during the year. Refer to Note 33.
Intellectual Property In 2017, the Company acquired the storage contracts from a liquidated company called Stemlife. The cost reflects the direct costs paid to Stemlife and the legal fees incurred in the transaction. The assessment of useful life is reviewed annually by the Directors to determine whether the assumptions made continue to be appropriate and supportable. If not, the useful life assessment is changed on a prospective basis. In 2018, the Company has ceased the collection and processing of new cord blood and cord tissue samples. As a result, the remaining net book value of intellectual property is fully impaired during the year. Refer to Note 33.
For
per
sona
l use
onl
y

Notes to the Financial Statements For the Year Ended 30 June 2018
58
19 TRADE AND OTHER PAYABLES
Consolidated 2018 2017 $ $
CURRENT LIABILTIES
Trade payables
163,486 387,440
Other payables
291,560 698,314
Total current payables
455,046 1,085,754
NON-CURRENT LIABILTIES
Client deposits
441,682 441,682
Total non-current payables
441,682 441,682
Fair value
Trade payables are non-interest bearing and are normally settled on 30 to 90 day terms. Therefore, their carrying value is assumed to be their fair value.
Other payables are non-interest bearing and are on ranging from 30 days to 12 month terms. Their carrying value is assumed to be fair value.
At 30 June, the ageing analysis of trade payables is as follows:
Total
Not Yet due
0-30 Days
31-60 Days
61-90 Days
+91 Days
$ $ $ $ $ $
2018 Consolidated
163,486
114,149
43,379
-
5,958
-
2017 Consolidated
387,440
378,503
270
(354)
9,021
-
Other balances within trade and other payables are not past due. It is expected that these other balances will be paid.
For
per
sona
l use
onl
y

Notes to the Financial Statements For the Year Ended 30 June 2018
59
Consolidated
2018 2017 $ $
20 UNEARNED INCOME - CURRENT
Unearned service revenue 425,414 393,565
Represents cord blood and tissue revenues received in advance for services to be rendered under long-term storage contracts.
21 UNEARNED INCOME – NON CURRENT
Unearned service revenue 3,998,804 4,090,114
Represents cord blood and tissue revenues received in advance for services to be rendered under long-term storage contract.
22 PROVISIONS
Consolidated
2018 2017 $ $
Current
Annual leave 177,895 228,300
Long service leave 40,358 72,449
Provision for Bonuses 41,501 -
Dividend payable 1,382 1,382
Provision for Employee Claims - 130,000
261,156 432,131
Non-current
Long service leave 18,162 35,215
Lease make good 200,000 200,000 218,162 235,215
(a) Movements in provisions
Annual leave
Balance at beginning of the year 228,301 387,350
Arising /(taken) during the year (50,406) (159,050) 177,895 228,301
Long Service Leave Balance at beginning of the year
72,449 157,011
Arising / (taken) during the year (32,091) (84,562) 40,358 72,449
Nature and timing of long service leave provision is based on the accounting policy and the significant
For
per
sona
l use
onl
y

Notes to the Financial Statements For the Year Ended 30 June 2018
60
22 PROVISIONS CONTINUED
estimations and assumptions applied in the measurement of this provision as in Note 3.
Consolidated
2018 2017
$ $
Provision for Bonuses Balance at beginning of the year
- -
Raised during the year 41,501 - 41,501 -
Dividends Payable
Balance at beginning of the year 1,382 1,382
Declared during the year - 468,567 Final 2017 plus 2018 Interim dividends paid during the year
- (468,567)
1,382 1,382
Lease make-good provision
Balance at beginning of the year 200,000 200,000
Arising during the year - 200,000 200,000
Nature and timing of lease make-good provision
In accordance with the current lease agreement with Allsup Pty Limited for the premises in Granville, at the end of the lease term in October 2019, the Group may either restore the leased premises in Granville to its original condition or alternatively remove unfixed chattels and equipment and pay an amount of $150,000 (excluding GST). The current lease agreement provides for an extension and the current provision is considered adequate based on the Company’s current renewal negotiation with Allsup Pty Limited and the understanding reached to date.
The provision of $200,000 has been raised in respect of the Group’s obligation to reflect this arrangement regarding the leased premises and is included in the carrying amount of plant and equipment. Because of the long-term nature of the liability, the greatest uncertainty in estimating the provision is the actual cost that may ultimately be renegotiated and finalised with Allsup Pty Limited covering either a renewal of the existing or negotiating a new lease with them though $200,000 is considered fairly stated in either circumstance.
For the relevant accounting policy and the significant estimations and assumptions applied in the measurement of this provision refer to Note 3. F
or p
erso
nal u
se o
nly

Notes to the Financial Statements For the Year Ended 30 June 2018
61
22 PROVISIONS CONTINUED
Consolidated
2018 2017 $ $
Provision for Employee Claims
Balance at beginning of the year 130,000 -
Raised during the year (130,000) 130,000 - 130,000
In 2017 a former Director and former employee made a claim for an additional payment of statutory entitlements and a separate claim for an additional termination entitlement. At the time the Board had the view that both of these claims are without merit but made a provision for a portion of the claims and legal fees out of prudence. The matter was settled in 2018 with details outlined in note 34.
23 CONTRIBUTED EQUITY Consolidated
2018 $
2017 $
Ordinary shares 5,861,788 5,861,788
Movement in ordinary shares on issue
2018 2017 Shares No. $ Shares No. $
Beginning of the financial year 46,859,563 5,861,788 46,859,563 5,861,788 Issuance of capital - - Return of capital - - - -
End of the financial year 46,859,563 5,861,788 46,859,563 5,861,788
Terms of conditions of contributed equity Ordinary shares carry the right to receive dividends and entitle their holder to one vote, either in person or by proxy, at a meeting of the Company.
Movement in accumulated losses
Consolidated
2018 2017
$ $
Balance at the beginning of the year (2,718,273) (2,483,483) Share option reserve adjustment for expiry of options - Share rights reserve adjustment for cancellation of rights - 8,677
Net profit for the year (1,240,439) 225,100
Equity dividends declared - (468,567)
Balance at the end of the year (3,958,712) (2,718,273)
For
per
sona
l use
onl
y

Notes to the Financial Statements For the Year Ended 30 June 2018
62
24 RESERVES Consolidated
2018 2017
$ $
Share rights reserve 5,091 5,091
Movements in share options reserve Balance at the beginning of the year
5,091 -
Performance rights granted 35,248 13,768 Performance rights cancelled
(8,677) - - - - Balance at the end of the year 40,339 5,091 -
During the year performance rights valued at $35,248 were granted to employees. The purpose of the share rights reserve is to record the value of share-based payments provided to employees as part of their remuneration. Refer to Note 28 for further details of these plans.
25 COMMITMENTS AND CONTINGENCIES
(a) Operating lease commitments – Group as lessee
Commercial property On 1 November 2016, the company entered into a four-year lease over a commercial property at South
Granville in Sydney.
Future minimum rentals payable under commercial property leases as at 30 June are as follows:
Consolidated
2018 2017 $ $
Within one year 247,490 242,637
After one year but not more than five years 83,040 330,530 330,530 573,167
Commercial Property Security deposits The security deposit for the lease at Granville is covered by a bank guarantee for $152,227 issued by the Commonwealth Bank of Australia. No collateral is held as security.
Plant and equipment The Group currently has a number of operating leases on items of plant and equipment used in day to day operations of the business. Leases have an average life of five years with renewal terms included in the contracts. Renewals are at the option of the specific entity that holds the lease.
There are no restrictions placed upon the lessee by entering into these leases.
For
per
sona
l use
onl
y

Notes to the Financial Statements For the Year Ended 30 June 2018
63
25 COMMITMENTS AND CONTINGENCIES CONTINUED Future minimum rentals payable under non-cancellable operating leases as at 30 June are as follows:
Consolidated
2018 2017 $ $
Within one year 14,640 14,640
After one year but not more than five years 4,880 19,520 19,520 34,160
(a) Plant and equipment commitments
There are no capital expenditure commitments at reporting date. (b) Contingent Liabilities
The Group is not aware of any contingent liabilities at reporting date. 26 EVENTS OCCURRING AFTER THE REPORTING PERIOD On the 11th July 2018, the Company was notified by the ACCC that it would commence civil proceedings against Cryosite in the Federal Court of Australia. As a result of this and other action by the ACCC, the Company expects it will incur substantial legal costs with the potential to incur financial penalties in the 2019 financial year.
27 AUDITOR’S REMUNERATION
Consolidated 2018 2017
$ $
Amounts received or due and receivable by Mazars for: - Audit or review of the financial report of the entity and any other entity in
the consolidated group 75,104 77,333 - Other services in relation to the entity and any other entity in the
consolidated group 4,300 5,500 79,404 82,833
28 RELATED PARTY DISCLOSURES The consolidated financial statements include the financial statements of Cryosite Limited and its wholly owned subsidiary Cryosite Distribution Pty Limited. For details, refer to Note 15.
During the year total payments of $51,375 were made to COSA Pty Ltd which is owned by Bryan Dulhunty, a director of the Company. COSA Pty Ltd charged the Company $24,000 for company secretarial services and $27,375 in respect to services provided by Bryan Dulhunty as a director of the company from 2nd March 2018. Cryosite Limited is the ultimate parent entity.
For
per
sona
l use
onl
y
Notes to the Financial Statements For the Year Ended 30 June 2018
64
Cryosite Distribution Pty Limited neither has a bank account nor does it hold any cash in its own right. All receipts and payments for this entity are made by Cryosite Limited, with the amounts charged against an inter-company loan account. No interest is payable on this balance and no amounts are due and payable.
Cryosite Limited and Cryosite Distribution Pty Limited are part of a tax consolidation group and has entered into a tax funding agreement. Under this agreement, payments are to be made for tax losses transferred between entities in the group. Refer to Note 7. Cryosite Limited has received a dividend from Cryosite Distribution Pty Limited for $3,500,000 in 2018 (2017: $6,700,000). 29 SHARE-BASED PAYMENTS EXPENSE
Consolidated
2018 2017 $ $
Total Expense recognized in the profit and loss relating to share based payments Performance rights granted 35,248 13,678
35,248 13,678
Long Term Incentive Plan : Cryosite Employee Incentive Plan (CEIP)
On the 23rd February 2017, the Cryosite Employee Incentive Plan (CEIP) was established by the Company. On invitation, the CEIP provides executives the opportunity to receive a long-term equity based incentive, currently a grant of performance rights, in each financial year. The issue and granting of these performance rights is governed by the CEIP Plan Rules. The annual grant value, subject to shareholder approvals, is defined as a % of fixed remuneration or as otherwise agreed. A %’s of fixed remuneration were used in determining the grant value for each executive. The grant value was converted into the number of performance rights to be issued using the WVAP of Cryosite shares in the 30 trading days following the release of the Annual Report. Full details of the performance rights issued to executive are noted in the remuneration report which forms part of the Directors’ Report. The following components of the CEIP are as follows; Vesting date Up to 36 months from date of grant. Vesting conditions Performance rights will only vest after certain performance and conditions are met. Performance conditions Compound Annual Growth Rates (CAGR) of the Earnings per Share (EPS) over
measurement period need to be achieved from a base year. Service conditions Continuous employment with Cryosite from the date of the performance rights
are granted until the vesting date. Expiry date Performance rights will expire 1 month after the vesting date Exercise of Rights Any Performance rights which meet the Vesting conditions will be available for
exercise up until the Expiry date.
For
per
sona
l use
onl
y

Notes to the Financial Statements For the Year Ended 30 June 2018
65
29 SHARE-BASED PAYMENT EXPENSE CONTINUED
Summary of Performance Rights granted
The board has granted following number of performance rights to employees:
Key management personnel Staff** Total
No No No
Balance granted as at 1st July 2016 0 0 0
Performance Rights granted 27/2/2017 570,665 0 570,665 Performance Rights cancelled* (359,663) 0 (359,663)
Balance granted as at 30th June 2017 211,002 0 211,002
Performance Rights granted 27/11/2017 295,647 294,303 589,950 Performance Rights granted 7/2/2018 208,297 0 208,297
Balance granted as at 30th June 2018 714,946 294,303 1,009,249
*cancelled when Andrew Shine resigned on 30 June 2017 **performance rights were issued to other staff not considered key management personnel in 2018
Conditions of Performance Rights
Grant date 27 February 2017 27 November 2017 7th February 2018 Vesting date 1 September 2019 1 September 2020 1 September 2020 Expiry date 30 September 2019 30 September 2020 30 September 2020
Period 1/7/2016 to 30/6/2019
1/7/2017 to 30/6/2020
1/7/2017 to 30/6/2020
Base Year 2016 2017 2017 Basic EPS 0.64 cents 0.48 cents 0.48 cents Measure Earning per Share (EPS) Compound Annual Growth Rate (CAGR) Targets CAGR of EPS over measurement Period relative to base year
EPS (cents)Target per plan
Percentage of Performance
Rights that vest
Grant Date 27-Feb-17 27-Nov-17 7-Feb-18
< 20% < 1.10592 <0.83 <0.83 0%
20% to 25% 1.105592 to 1.25 0.83 to 0.94 0.83 to 0.94 50-100% (pro-rata)
>25% >1.25 >0.94 >0.94 100%
As at 30 June 2018, no performance rights had vested.
No of Performance Rights
2018 2017 Key management personnel 503,944 570,665 Staff 294,303 0
798,247 570,665
For
per
sona
l use
onl
y

Notes to the Financial Statements For the Year Ended 30 June 2018
66
29 SHARE-BASED PAYMENT EXPENSE CONTINUED Assumptions used to determine fair value of performance rights
The fair value of the performance rights granted was calculated using a Black Scholes model
using the following assumptions:
Date of effective valuation: 27-Feb-17 27-Nov-17 7-Feb-18
Fair value at valuation date $0.178 $0.135 $0.100
Risk-free rate: 1.93% 1.90% 2.11%
Standard deviation (annualised): 45% 50% 50% Closing share price at Effective Date: $0.200 $0.135 $0.100
Exercise price: $0.000 $0.000 $0.000
Expected life of right (years)
2.51
2.77
2.54
Annualised Dividend Rate: 4.6% 0.0% 0.0%
30 KEY MANAGEMENT PERSONNEL
(a) Key management Personnel
Non- Executive Directors
Mr Bryan Dulhunty
Mr Andrew Kroger
Mrs Nicola Swift
Chairman (Non-executive) (appointed 2/3/2018)
Director (Non-executive)
Director (Non-executive) (appointed 3/11/2016)
Key management personnel Mr Andrew Shine Chief Executive Officer (resigned 30/6/2017) Mr Mark Byrne Chief Executive Officer
In January 2018, the board appointed as the company’s CEO, Mark Byrne. Mark had previously held the position of company CFO since June 2016 and interim CEO since June 2017.
Due to the relatively small number of employees, there is only one key management personnel having authority and responsibility for planning, directing and controlling the activities of the entity either directly or indirectly.
For
per
sona
l use
onl
y
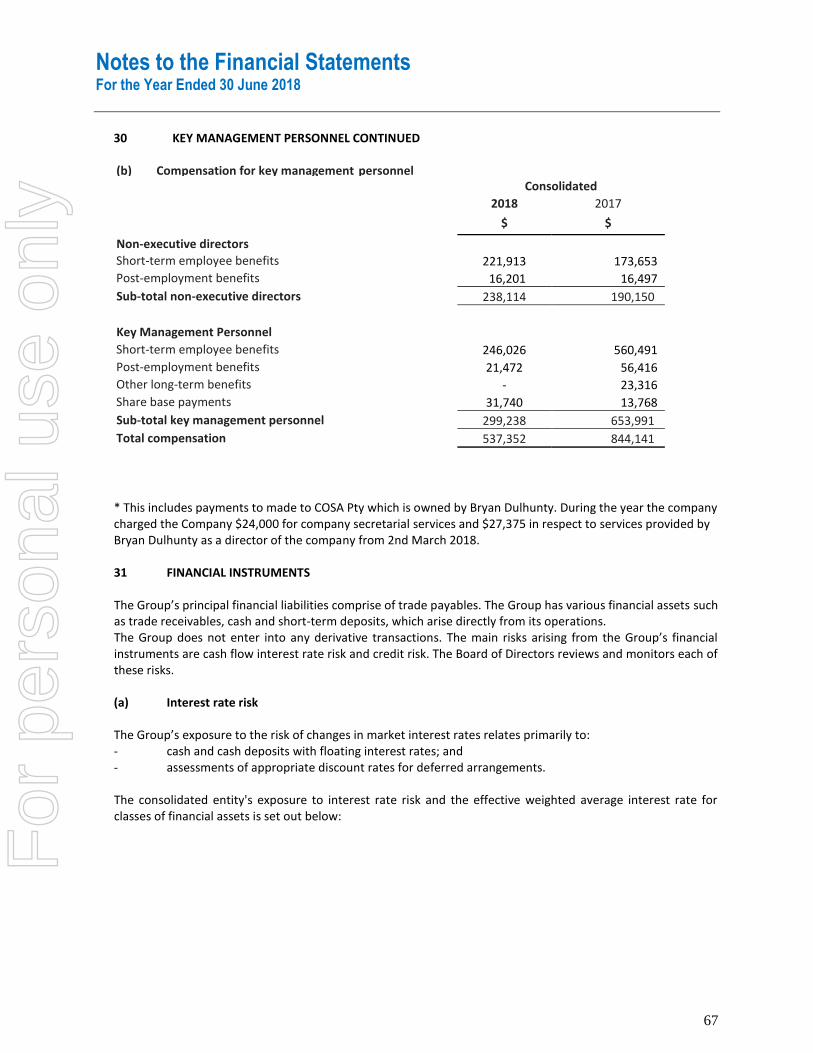
Notes to the Financial Statements For the Year Ended 30 June 2018
67
30 KEY MANAGEMENT PERSONNEL CONTINUED
(b) Compensation for key management personnel
Consolidated
2018 2017
$ $
Non-executive directors
Short-term employee benefits 221,913 173,653
Post-employment benefits 16,201 16,497
Sub-total non-executive directors 238,114 190,150
Key Management Personnel Short-term employee benefits 246,026 560,491
Post-employment benefits 21,472 56,416
Other long-term benefits - 23,316
Share base payments 31,740 13,768
Sub-total key management personnel 299,238 653,991
Total compensation 537,352 844,141
* This includes payments to made to COSA Pty which is owned by Bryan Dulhunty. During the year the company charged the Company $24,000 for company secretarial services and $27,375 in respect to services provided by Bryan Dulhunty as a director of the company from 2nd March 2018. 31 FINANCIAL INSTRUMENTS The Group’s principal financial liabilities comprise of trade payables. The Group has various financial assets such as trade receivables, cash and short-term deposits, which arise directly from its operations. The Group does not enter into any derivative transactions. The main risks arising from the Group’s financial instruments are cash flow interest rate risk and credit risk. The Board of Directors reviews and monitors each of these risks. (a) Interest rate risk The Group’s exposure to the risk of changes in market interest rates relates primarily to: - cash and cash deposits with floating interest rates; and - assessments of appropriate discount rates for deferred arrangements. The consolidated entity's exposure to interest rate risk and the effective weighted average interest rate for classes of financial assets is set out below: F
or p
erso
nal u
se o
nly

Notes to the Financial Statements For the Year Ended 30 June 2018
68
31 FINANCIAL INSTRUMENTS CONTINUED
Weighted
2018
average effective interest
rate
Floating interest rate
Fixed interest
rates
Non- interest bearing
Total
CONSOLIDATED Note % $ $ $ $
Financial assets
Interest bearing deposits –
maturing at various dates
during year ending 30 June 2018 10
1.85
4,153,923
-
-
4,153,923
Cash and cash equivalents 10 0.59 534,181 - - 534,181
Current receivables – maturing at
various dates 12 - - - 1,380,811 1,380,811
Non-current receivables 15 - - - 243,264 243,264
4,688,104 - 1,624,075 6,312,179 Financial liabilities Trade creditors and accruals – maturing at various dates
during the year ended 30 June
2018.
19
2.2
114,149
- 340,897
455,046
Weighted
2017
average effective interest
rate
Floating interest
rate
Fixed interest
rates
Non- interest bearing
Total
CONSOLIDATED Note % $ $ $ $
Financial assets
Interest bearing deposits –
maturing at various dates
during year ended 30 June 2017 10
2.27
4,498,054
-
-
4,498,054
Cash and cash equivalents 10 0.78 591,056 - - 591,056
Current receivables – maturing at
various dates 12 - - - 2,310,287 2,310,287
Non-current receivables 15 - - - 531,661 531,661
5,089,110 - 2,841,948 7,931,058 Financial liabilities Trade creditors and accruals –
maturing at various dates
during the year ended 30 June
2017.
19
2.2
378,503
- 707,251
1,085,754
For
per
sona
l use
onl
y

Notes to the Financial Statements For the Year Ended 30 June 2018
69
31 FINANCIAL INSTRUMENTS CONTINUED
Interest rate sensitivity analysis
The Group has no material exposure to any probable interest volatility.
(b) Credit risk
Credit risk arises from the financial assets of the Group, which comprise cash and cash equivalents, trade and other receivables. The Group's exposure to credit risk arises from potential default of the counter party, with a maximum exposure equal to the carrying amount of these instruments. Exposure at balance date is addressed in each applicable note.
The Group trades with a number of types of customers, the main ones being:
- Incorporated companies
- Research institutes both private and academic
- Individuals.
Incorporated Companies: The Group trades with recognised, publicly listed companies and large unlisted proprietary companies and as such collateral is not requested nor is it the Group's policy to securitise its trade and other receivables.
Research institutes both private and academic The Group also trades with research institutes that are either publicly, privately or government owned along with recognised universities. Such customers are subject to credit search and collateral is not requested nor is it the Group’s policy to securitise its trade and other receivables.
Individuals: The Group ensures that credit card information is obtained for all individual customers.It is the Group's policy that all customers who wish to trade on credit terms are subject to credit verification procedures including an assessment of their independent credit rating, financial position, past experience and industry reputation. Risk limits are set for each individual customer in accordance with parameters set by the Board. These risk limits are regularly monitored.
There are no significant concentrations of credit risk within the Group. There are no transactions that are not denominated in the functional currency of the Group.
(c) Liquidity risk
The Group has assessed liquidity risk to be low at balance date and at the date of this report based on total current assets, including cash and equivalents, of $6,381,838 at balance date less current liabilities of $1,141,616 an excess of current assets over current liabilities amounting to $4,967,222. The Group generated a negative ($261,906) cash flow from operations during the current year. Liquidity risks are managed by matching the payment and receipt cycle.F
or p
erso
nal u
se o
nly

Notes to the Financial Statements For the Year Ended 30 June 2018
70
31 FINANCIAL INSTRUMENTS CONTINUED
Maturity analysis of financial assets and liabilities based on management’s expectation. Year ended
30 June 2018 Less than 6 months
6-12 months 1-5 years
Greater than 5 years
Total
$ $ $ $ $
Consolidated Financial Assets
Cash and cash equivalents 4,688,104 - - - 4,688,104
Trade and other receivables 1,266,988 113,823 233,098 10,166 1,624,075
5,955,092
113,823 233,098 10,166 6,312,179
Consolidated Financial liabilities
Trade and other payables 455,046 - - - 455,046
Net maturity 5,500,046 113,823 233,098 10,166 5,857,133
Year ended
30 June 2017 Less than 6 months
6-12 months 1-5 years
Greater than 5 years
Total
$ $ $ $ $
Consolidated Financial Assets
Cash and cash equivalents 5,089,110 - - - 5,089,110
Trade and other receivables 1,817,201 406,081 487,790 40,868 2,751,940
6,906,311 406,081 487,790 40,868 7,841,050
Consolidated Financial liabilities
Trade and other payables 1,085,754 - - - 1,085,754
Net maturity 5,820,557 406,081 487,790 40,868 6,755,296
The risk implied from the values shown in the table above, reflects a balanced view of cash inflows and outflows. Trade payables and other financial liabilities mainly originate from investment in working capital such as inventories and trade receivables. These assets are considered in the Group’s overall liquidity risk. To monitor existing financial assets and liabilities as well as enable an effective controlling of future risks the Directors monitor the expected settlement of financial assets and liabilities.
For
per
sona
l use
onl
y

Notes to the Financial Statements For the Year Ended 30 June 2018
71
31 FINANCIAL INSTRUMENTS CONTINUED
(d) Capital management
When managing capital, the boards’ objective is to ensure the entity continues as a going concern as well as to maintain returns to shareholders. The board also aims to maintain a capital structure that ensures the lowest cost of capital available to the entity. As part of regular reviews, management considers the cost of capital and the risks associated with each class of capital. Upon review, the Group will balance its overall capital structure through the payment of dividends, new share issues as well as the issue of new debt or the redemption of existing debt. The Group's overall strategy remains unchanged from 2017.
The Board of Directors is responsible for assessing financial risks, related controls and other financial risk management strategies. The Company deploys its assets and liabilities so as to manage risk at commercially appropriate levels, bearing in mind the constraints imposed by the consolidated entity’s size, results and other financial circumstances. The Company aims to balance opportunities to improve profitability against related risks of losses of assets or the incurrence of additional liabilities.
(e) Fair value
All financial assets and liabilities have been disclosed in the financial statements and notes thereto at their carrying value, which approximates their net fair values.
The fair value of the assets and liabilities is included at the amount at which the instrument could be exchanged in a current transaction between willing parties, other than in a forced or liquidation sale.
Fair values of balances related to long term revenue contracts are determined using a discounted cash flow method using discount rates that reflect the appropriate level of risk over the life of the long term revenue stream.
For
per
sona
l use
onl
y

Notes to the Financial Statements For the Year Ended 30 June 2018
72
32 PARENT ENTITY FINANCIAL INFORMATION
The individual financial statements for the parent entity show the following aggregate amounts:
(e) GUARANTEES ENTERED INTO BY THE PARENT ENTITY No guarantees have been entered into by the parent entity in relation to the debts of its subsidiaries. (f) COMMITMENTS AND CONTINGENCIES OF THE PARENT ENTITY Commitments and contingencies for the parent entity are the same as those disclosed in Note 24.
30 June 2018 2018 2017
$ $
(a) ASSETS Total Current Assets 5,777,743 6,946,861
Total Non-Current Assets 1,361,861 2,213,689
TOTAL ASSETS 7,139,603 9,160,550
(b) LIABILITIES Total Current Liabilities 1,161,023 1,745,365
Total Non-Current Liabilities 4,658,649 4,767,012
TOTAL LIABILITIES 5,819,672 6,512,377
(c) EQUITY Contributed equity 5,861,788 5,861,788
Share option reserves 40,339 5,091
Accumulated losses (4,582,196) (3,218,706)
TOTAL EQUITY 1,319,931 2,648,173
(d) TOTAL COMPREHENSIVE INCOME Net Profit of the parent entity for the year net of income tax (1,363,490) 2,898,278
Performance rights cancelled - 8,677
TOTAL COMPREHENSIVE INCOME FOR THE YEAR (1,363,490) 2,906,955
For
per
sona
l use
onl
y

Notes to the Financial Statements For the Year Ended 30 June 2018
73
33 DISCONTINUED OPERATIONS In October 2017, the Company completed the closure of the laboratory operations and the departure of staff
associated with the collection and processing of cord blood and tissue samples. The Company will continue to
service its existing storage contracts until the full contract terms of either 18 or 25 years.
As result of the decision to cease the collection and processing of cord blood and tissue samples, the board
reviewed all non-financial assets associated with these operations and, as a result of this review, concluded that
these assets were impaired. Consequently they have resolved to write down these assets by the following
amounts:
2018 $ Property, plant and equipment 115,012 Licence fees 231,860 Intellectual property 91,510 Software 117,204
Total impairment loss 555,586
No impairment was deemed necessary for the assets related to the storage and maintenance of cord blood and
tissue samples. The results of operations related to collection and processing of cord blood and tissue samples are presented
below:
2018 2017
$ $ Revenue 240,108 4,279,675 Expenses (963,554) (3,755,091) Impairment loss (555,586) - Pre-tax profit/(loss) for the financial year (1,279,032) 524,584 Income tax credit/(expense) 283,289 (157,375) Post-tax profit/(loss) for the financial year from discontinued operations (995,743) 367,209
The storage revenue from existing cord blood and storage contracts are presented as part of continuing
operations from Individualised Consumer Biologics segment (see Note 4 and Note 5).
For
per
sona
l use
onl
y

Notes to the Financial Statements For the Year Ended 30 June 2018
74
34 LEGAL SETTLEMENT
As noted in the 30 June 2017 annual report, a former Director and former employee made a claim against the company in respect to statutory entitlements and an additional termination entitlement. Subsequently the company has settled the claim with the net profit and loss impact after tax being:
Total amount paid in the settlement was $276,818 made up of $195,000 final settlement plus legal fees of $81,818.
2018 2017 $ $
Final settlement (195,000) - Legal expenses incurred (198,677) (169,508) Provision for employee claims reversed 130,000 - Accruals reversed 30,000 - Pre-tax profit/(loss) for the financial year (233,677) (169,508) Income tax credit/(expense) 64,261 50,852 Post-tax profit/(loss) for the financial year from legal settlement (169,416) (118,656)
For
per
sona
l use
onl
y
MAZARS RISK & ASSURANCE PTY LIMITED ABN: 39 151 805 275 LEVEL 12, 90 ARTHUR STREET, NORTH SYDNEY NSW 2060 PO BOX 1994, NORTH SYDNEY NSW 2059 TEL: +61 2 9922 1166 - FAX: +61 2 9922 2044 EMAIL: [email protected]
LIABILITY LIMITED BY A SCHEME, APPROVED UNDER THE PROFESSIONAL STANDARDS LEGISLATION
INDEPENDENT AUDITOR’S REPORT TO THE DIRECTORS OF CRYOSITE LIMITED AND CONTROLLED ENTITIES
Report on the Financial Report Opinion We have audited the accompanying financial report of Cryosite Limited and controlled entities (the “Group”), which comprises the statement of financial position as at 30 June 2018 and statement of profit or loss and other comprehensive income, statement of changes in equity and statement of cash flows for the year ended on that date, other selected explanatory notes and the directors’ declaration as set out on pages 23 to 74. In our opinion, the accompanying financial report of the Group is in accordance with the Corporations Act 2001, including:
(i) giving a true and fair view of the Group’s financial position as at 30 June 2018 and of its financial performance for the year then ended; and
(ii) complying with Australian Accounting Standards to the extent described in Note 2 and the Corporations Regulations 2001.
Basis of Opinion We conducted our audit in accordance with Australian Auditing Standards. Our responsibilities under those standards are further described in the Auditor’s Responsibilities for the Audit of the Financial Report section of our report. We are independent of the Group in accordance with the auditor independence requirements of the Corporations Act 2001 and the ethical requirements of the Accounting Professional and Ethical Standards Board’s APES 110 Code of Ethics for Professional Accounts (the Code) that are relevant to our audit of the financial report in Australia. We have also fulfilled our other ethical responsibilities in accordance with the Code. We confirm that the independence declaration required by the Corporations Act 2001, which has been given to the directors of the Group, would be in the same terms if given to the directors as at the time of this auditor’s report. We believe that the audit evidence we have obtained is sufficient and appropriate to provide a basis for our opinion.
For
per
sona
l use
onl
y
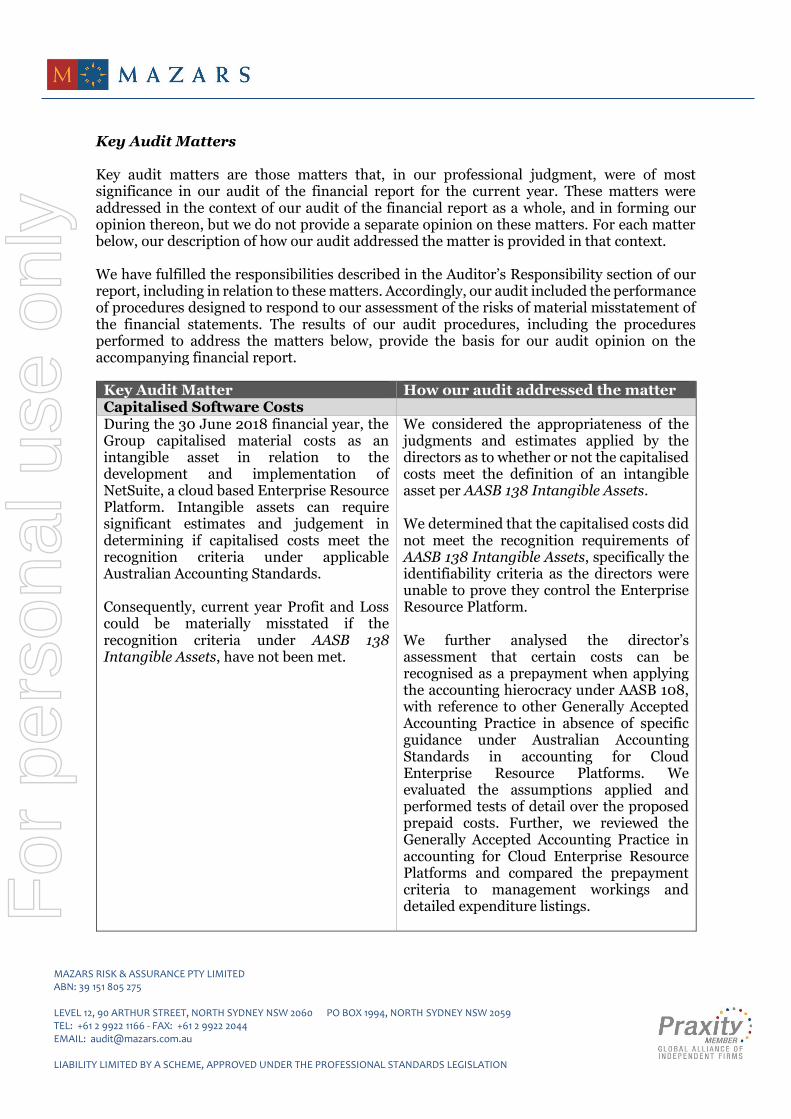
MAZARS RISK & ASSURANCE PTY LIMITED ABN: 39 151 805 275 LEVEL 12, 90 ARTHUR STREET, NORTH SYDNEY NSW 2060 PO BOX 1994, NORTH SYDNEY NSW 2059 TEL: +61 2 9922 1166 - FAX: +61 2 9922 2044 EMAIL: [email protected]
LIABILITY LIMITED BY A SCHEME, APPROVED UNDER THE PROFESSIONAL STANDARDS LEGISLATION
Key Audit Matters Key audit matters are those matters that, in our professional judgment, were of most significance in our audit of the financial report for the current year. These matters were addressed in the context of our audit of the financial report as a whole, and in forming our opinion thereon, but we do not provide a separate opinion on these matters. For each matter below, our description of how our audit addressed the matter is provided in that context. We have fulfilled the responsibilities described in the Auditor’s Responsibility section of our report, including in relation to these matters. Accordingly, our audit included the performance of procedures designed to respond to our assessment of the risks of material misstatement of the financial statements. The results of our audit procedures, including the procedures performed to address the matters below, provide the basis for our audit opinion on the accompanying financial report.
Key Audit Matter How our audit addressed the matter Capitalised Software Costs During the 30 June 2018 financial year, the Group capitalised material costs as an intangible asset in relation to the development and implementation of NetSuite, a cloud based Enterprise Resource Platform. Intangible assets can require significant estimates and judgement in determining if capitalised costs meet the recognition criteria under applicable Australian Accounting Standards. Consequently, current year Profit and Loss could be materially misstated if the recognition criteria under AASB 138 Intangible Assets, have not been met.
We considered the appropriateness of the judgments and estimates applied by the directors as to whether or not the capitalised costs meet the definition of an intangible asset per AASB 138 Intangible Assets. We determined that the capitalised costs did not meet the recognition requirements of AASB 138 Intangible Assets, specifically the identifiability criteria as the directors were unable to prove they control the Enterprise Resource Platform. We further analysed the director’s assessment that certain costs can be recognised as a prepayment when applying the accounting hierocracy under AASB 108, with reference to other Generally Accepted Accounting Practice in absence of specific guidance under Australian Accounting Standards in accounting for Cloud Enterprise Resource Platforms. We evaluated the assumptions applied and performed tests of detail over the proposed prepaid costs. Further, we reviewed the Generally Accepted Accounting Practice in accounting for Cloud Enterprise Resource Platforms and compared the prepayment criteria to management workings and detailed expenditure listings.
For
per
sona
l use
onl
y

MAZARS RISK & ASSURANCE PTY LIMITED ABN: 39 151 805 275 LEVEL 12, 90 ARTHUR STREET, NORTH SYDNEY NSW 2060 PO BOX 1994, NORTH SYDNEY NSW 2059 TEL: +61 2 9922 1166 - FAX: +61 2 9922 2044 EMAIL: [email protected]
LIABILITY LIMITED BY A SCHEME, APPROVED UNDER THE PROFESSIONAL STANDARDS LEGISLATION
Key Audit Matter How our audit addressed the matter
AASB 15 Disclosure The Group will be effected by the adoption of new accounting standard AASB 15 Revenue from Contracts with Customers. The adoption of this standard required the directors to make a number of critical judgements and estimates in determining the financial impact this standard is anticipated to have on the Group for disclosure in the 30 June 2018 financial report.
We assessed the director’s application of AASB 15 in accordance with the provisions of the standard. We analysed the calculations and supporting documentation underpinning the director’s assessment of the financial impact on the Group. We reviewed contracts on a test basis and performed recalculations of the anticipated financial impact.
Responsibilities of the Directors for the Financial Report The directors of the Group are responsible for the preparation of the financial report that gives a true and fair view and have determined that the basis of preparation described in Note 2 to the financial report is appropriate to meet the requirements of the Corporations Act 2001 and is appropriate to meet the needs of the members. The directors’ responsibility also includes such internal control as the directors determine is necessary to enable the preparation of a financial report that gives a true and fair view and is free from material misstatement, whether due to fraud or error. In preparing the financial report, the directors are responsible for assessing the ability of the Group to continue as a going concern, disclosing, as applicable, matters related to going concern and using the going concern basis of accounting unless the directors either intend to liquidate the Group or to cease operations, or have no realistic alternative but to do so. Auditor’s Responsibilities for the Audit of the Financial Report Our objectives are to obtain reasonable assurance about whether the financial report as a whole is free from material misstatement, whether due to fraud or error, and to issue an auditor’s report that includes our opinion. Reasonable assurance is a high level of assurance, but is not a guarantee that an audit conducted in accordance with the Australian Auditing Standards will always detect a material misstatement when it exists. Misstatements can arise from fraud or error and are considered material if, individually or in the aggregate, they could reasonably be expected to influence the economic decisions of users taken on the basis of the financial report.
For
per
sona
l use
onl
y

MAZARS RISK & ASSURANCE PTY LIMITED ABN: 39 151 805 275 LEVEL 12, 90 ARTHUR STREET, NORTH SYDNEY NSW 2060 PO BOX 1994, NORTH SYDNEY NSW 2059 TEL: +61 2 9922 1166 - FAX: +61 2 9922 2044 EMAIL: [email protected]
LIABILITY LIMITED BY A SCHEME, APPROVED UNDER THE PROFESSIONAL STANDARDS LEGISLATION
As part of an audit in accordance with the Australian Auditing Standards, we exercise professional judgement and maintain professional scepticism throughout the audit. We also:
Identify and assess the risks of material misstatement of the financial report, whether due to fraud or error, designs and performs audit procedures responsive to those risks, and obtains audit evidence that is sufficient and appropriate to provide a basis for the auditor’s opinion. The risk of not detecting a material misstatement resulting from fraud is higher than for one resulting from error, as fraud may involve collusion, forgery, intentional omissions, misrepresentations, or the override of internal control.
Obtain an understanding of internal control relevant to the audit in order to design audit procedures that are appropriate in the circumstances, but not for the purpose of expressing an opinion on the effectiveness of the Group’s internal control.
Evaluate the appropriateness of accounting policies used and the reasonableness of accounting estimates and related disclosures made by management.
Conclude on the appropriateness of the director’s use of the going concern basis of accounting and, based on the audit evidence obtained, whether a material uncertainty exists related to events or conditions that may cast significant doubt on the Group’s ability to continue as a going concern. If the auditor concludes that a material uncertainty exists, we are required to draw attention in the auditor’s report to the related disclosures in the financial report or, if such disclosures are inadequate, to modify our opinion. Our conclusions are based on the audit evidence obtained up to the date of the auditor’s report. However, future events or conditions may cause the Group to cease to continue as a going concern.
Evaluate the overall presentation, structure and content of the financial report, including the disclosures, and whether the financial report represents the underlying transactions and events in a manner that achieves fair presentation.
We communicate with the directors regarding, among other matters, the planned scope and timing of the audit and significant audit findings, including any significant deficiencies in internal control that the auditor identifies during the audit. We also provide the directors with a statement that we have complied with relevant ethical requirements regarding independence, and to communicate with them all relationships and other matters that may reasonably be thought to bear on our independence, and where applicable related safeguards. Report on the Remuneration Report We have audited the Remuneration Report for the year ended 30 June 2018 as outlined on pages 12 to 17 of the financial report. The directors of the company are responsible for the preparation and presentation of the Remuneration Report in accordance with section 300A of the Corporations Act 2001. Our responsibility is to express an opinion on the Remuneration Report, based on our audit conducted in accordance with Australian Auditing Standards.
For
per
sona
l use
onl
y
MAZARS RISK & ASSURANCE PTY LIMITED ABN: 39 151 805 275 LEVEL 12, 90 ARTHUR STREET, NORTH SYDNEY NSW 2060 PO BOX 1994, NORTH SYDNEY NSW 2059 TEL: +61 2 9922 1166 - FAX: +61 2 9922 2044 EMAIL: [email protected]
LIABILITY LIMITED BY A SCHEME, APPROVED UNDER THE PROFESSIONAL STANDARDS LEGISLATION
Auditor’s Opinion In our opinion, the Remuneration Report of Cryosite Limited for the year ended 30 June 2018, complies with section 300A of the Corporations Act 2001. MAZARS RISK AND ASSURANCE PTY LTD Paul Collins Director Sydney, on this 30th day of August 2018
For
per
sona
l use
onl
y
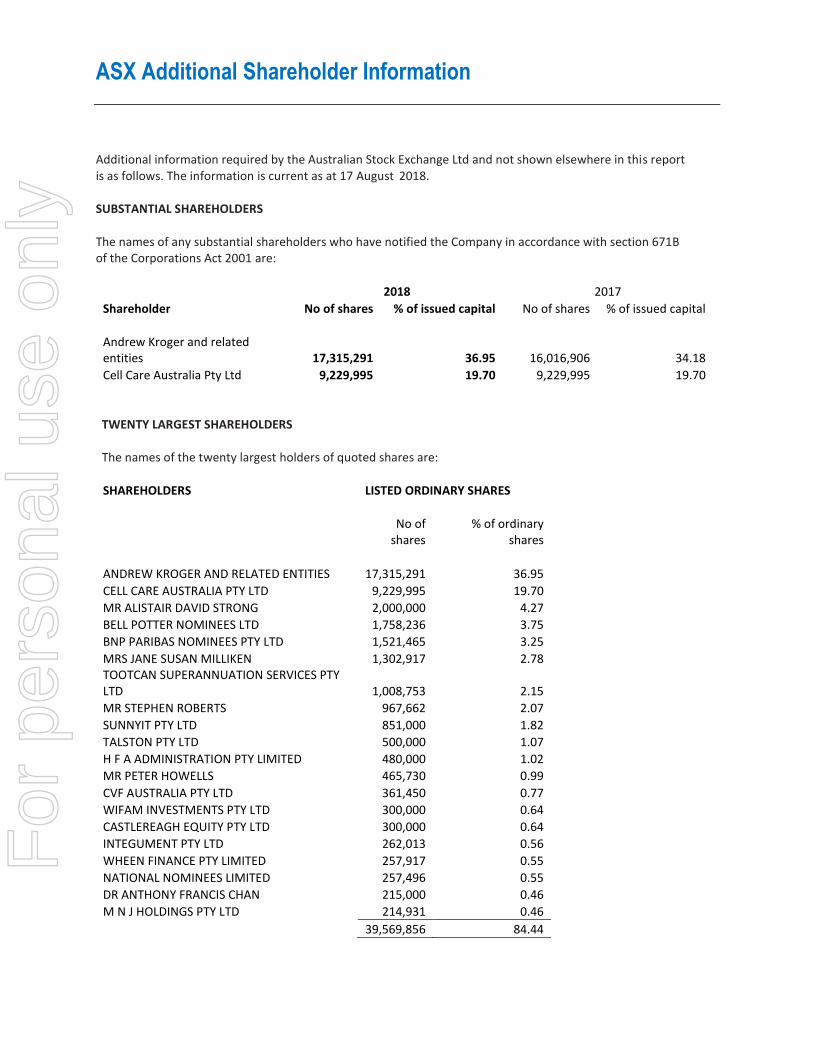
ASX Additional Shareholder Information
Additional information required by the Australian Stock Exchange Ltd and not shown elsewhere in this report is as follows. The information is current as at 17 August 2018.
SUBSTANTIAL SHAREHOLDERS
The names of any substantial shareholders who have notified the Company in accordance with section 671B of the Corporations Act 2001 are:
2018 2017
Shareholder No of shares % of issued capital No of shares % of issued capital
Andrew Kroger and related entities 17,315,291 36.95 16,016,906 34.18
Cell Care Australia Pty Ltd 9,229,995 19.70 9,229,995 19.70
TWENTY LARGEST SHAREHOLDERS
The names of the twenty largest holders of quoted shares are:
SHAREHOLDERS LISTED ORDINARY SHARES
No of shares
% of ordinary shares
ANDREW KROGER AND RELATED ENTITIES 17,315,291 36.95
CELL CARE AUSTRALIA PTY LTD 9,229,995 19.70
MR ALISTAIR DAVID STRONG 2,000,000 4.27
BELL POTTER NOMINEES LTD 1,758,236 3.75
BNP PARIBAS NOMINEES PTY LTD 1,521,465 3.25
MRS JANE SUSAN MILLIKEN 1,302,917 2.78 TOOTCAN SUPERANNUATION SERVICES PTY LTD 1,008,753 2.15
MR STEPHEN ROBERTS 967,662 2.07
SUNNYIT PTY LTD 851,000 1.82
TALSTON PTY LTD 500,000 1.07
H F A ADMINISTRATION PTY LIMITED 480,000 1.02
MR PETER HOWELLS 465,730 0.99
CVF AUSTRALIA PTY LTD 361,450 0.77
WIFAM INVESTMENTS PTY LTD 300,000 0.64
CASTLEREAGH EQUITY PTY LTD 300,000 0.64
INTEGUMENT PTY LTD 262,013 0.56
WHEEN FINANCE PTY LIMITED 257,917 0.55
NATIONAL NOMINEES LIMITED 257,496 0.55
DR ANTHONY FRANCIS CHAN 215,000 0.46
M N J HOLDINGS PTY LTD 214,931 0.46
39,569,856 84.44
For
per
sona
l use
onl
y
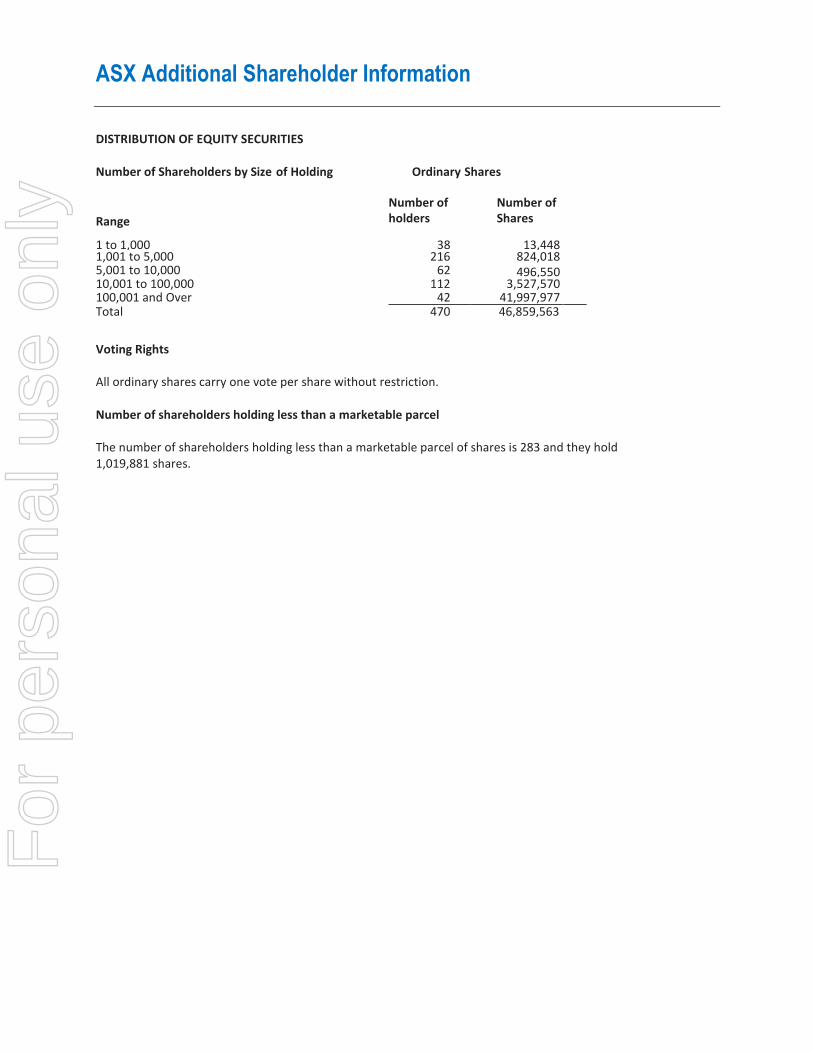
ASX Additional Shareholder Information
DISTRIBUTION OF EQUITY SECURITIES
Number of Shareholders by Size of Holding Ordinary Shares
Range
Number of holders
Number of Shares
1 to 1,000 38 13,448 1,001 to 5,000 216 824,018 5,001 to 10,000 62 496,550 10,001 to 100,000 112 3,527,570
100,001 and Over 42 41,997,977 Total 470 46,859,563
Voting Rights All ordinary shares carry one vote per share without restriction.
Number of shareholders holding less than a marketable parcel The number of shareholders holding less than a marketable parcel of shares is 283 and they hold 1,019,881 shares.
For
per
sona
l use
onl
y