Embed Size (px)
Citation preview
Audited Consolidated Financial Report
For The Year Ended June 30, 2020

WILLIAM & MARY,
VIRGINIA INSTITUTE OF MARINE SCIENCE
AND RICHARD BLAND COLLEGE
ANNUAL FINANCIAL REPORT 2019 - 2020
Contents
Management's Discussion and Analysis 1-10
Financial Statements
Statement of Net Position 12
Statement of Revenues, Expenses and Changes in Net Position 13
Statement of Cash Flows 14-15
Notes to Financial Statements 17-100
Required Supplementary Information and Notes to the Required
Supplementary Information 101-118
Independent Auditor's Report 119-121
University and College Officials 122
1
William & Mary, Virginia Institute of Marine Science,
and Richard Bland College Consolidated Financial Statements
MANAGEMENT’S DISCUSSION AND ANALYSIS
(Unaudited) This Management’s Discussion and Analysis (MD&A) is required supplemental information to the consolidated financial statements designed to assist readers in understanding the accompanying financial statements. The following information includes a comparative analysis between the current fiscal year ended June 30, 2020 and the prior year ended June 30, 2019. Significant changes between the two fiscal years and important management decisions are highlighted. The summarized information presented in the MD&A should be reviewed in conjunction with both the financial statements and associated footnotes in order for the reader to have a comprehensive understanding of the institution’s financial status and results of operations for fiscal year ended June 30, 2020. William & Mary’s (W&M) management has prepared the MD&A, along with the financial statements and footnotes. W&M’s management is responsible for all of the information presented for William & Mary, the Virginia Institute of Marine Science (VIMS), and their affiliated foundations. Richard Bland College’s (RBC) management is responsible for all of the information presented for RBC and its affiliated foundation. The financial statements have been prepared in accordance with the Governmental Accounting Standards Board (GASB) reporting model. Accordingly, the three financial statements required are the Statement of Net Position, the Statement of Revenues, Expenses, and Changes in Net Position, and the Statement of Cash Flows. The aforementioned statements are summarized and analyzed in the MD&A. These financial statements are consolidated statements that include W&M, VIMS, and RBC. All three entities are agencies of the Commonwealth of Virginia reporting to the Board of Visitors of The College of William and Mary in Virginia. W&M and VIMS, which serves as the university’s School of Marine Science, are referred to collectively as the “university” and Richard Bland College is referred to as the “college” within the MD&A as well as in the consolidated financial statements. The institutions’ affiliated foundations are component units and are included in the accompanying financial statements in separate columns. However, the following MD&A does not include the foundations’ financial condition and activities. Financial Summary Statement of Net Position The Statement of Net Position provides a combined snapshot of the university and college’s financial positions, specifically the assets, deferred outflows of resources, liabilities, deferred inflows of resources and resulting net position as of June 30, 2020. The information allows the reader to determine the combined assets available for future operations of all three entities, amounts owed by the university and college, and the categorization of net position as follows:
(1) Net Investment in Capital Assets – reflects the university and college’s capital assets net of accumulated depreciation and any debt attributable to their acquisition, construction or improvements.
(2) Restricted – reflects the university and college’s endowment and similar funds whereby the donor has
stipulated that the gift or the income from the principal, where the principal is to be preserved, is to be used to support specific programs. Donor restricted funds are grouped into generally descriptive categories of scholarships, research, departmental uses, etc.
2
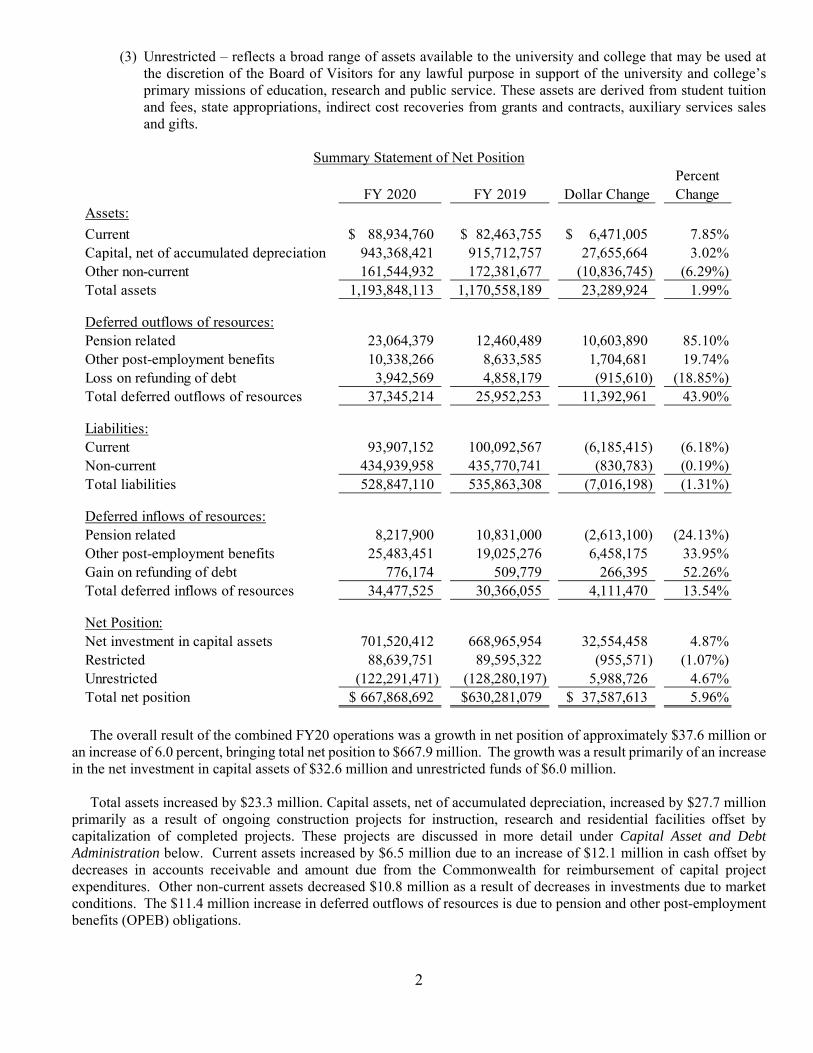
(3) Unrestricted – reflects a broad range of assets available to the university and college that may be used at the discretion of the Board of Visitors for any lawful purpose in support of the university and college’s primary missions of education, research and public service. These assets are derived from student tuition and fees, state appropriations, indirect cost recoveries from grants and contracts, auxiliary services sales and gifts.
Summary Statement of Net Position
FY 2020 FY 2019 Dollar ChangePercent Change
Assets:
Current 88,934,760$ 82,463,755$ 6,471,005$ 7.85%Capital, net of accumulated depreciation 943,368,421 915,712,757 27,655,664 3.02%Other non-current 161,544,932 172,381,677 (10,836,745) (6.29%)Total assets 1,193,848,113 1,170,558,189 23,289,924 1.99%
Deferred outflows of resources:Pension related 23,064,379 12,460,489 10,603,890 85.10%Other post-employment benefits 10,338,266 8,633,585 1,704,681 19.74%Loss on refunding of debt 3,942,569 4,858,179 (915,610) (18.85%)Total deferred outflows of resources 37,345,214 25,952,253 11,392,961 43.90%
Liabilities:Current 93,907,152 100,092,567 (6,185,415) (6.18%)Non-current 434,939,958 435,770,741 (830,783) (0.19%)Total liabilities 528,847,110 535,863,308 (7,016,198) (1.31%)
Deferred inflows of resources:Pension related 8,217,900 10,831,000 (2,613,100) (24.13%)Other post-employment benefits 25,483,451 19,025,276 6,458,175 33.95%Gain on refunding of debt 776,174 509,779 266,395 52.26%Total deferred inflows of resources 34,477,525 30,366,055 4,111,470 13.54%
Net Position:Net investment in capital assets 701,520,412 668,965,954 32,554,458 4.87%Restricted 88,639,751 89,595,322 (955,571) (1.07%)Unrestricted (122,291,471) (128,280,197) 5,988,726 4.67%Total net position 667,868,692$ 630,281,079$ 37,587,613$ 5.96%
The overall result of the combined FY20 operations was a growth in net position of approximately $37.6 million or an increase of 6.0 percent, bringing total net position to $667.9 million. The growth was a result primarily of an increase in the net investment in capital assets of $32.6 million and unrestricted funds of $6.0 million.
Total assets increased by $23.3 million. Capital assets, net of accumulated depreciation, increased by $27.7 million primarily as a result of ongoing construction projects for instruction, research and residential facilities offset by capitalization of completed projects. These projects are discussed in more detail under Capital Asset and Debt Administration below. Current assets increased by $6.5 million due to an increase of $12.1 million in cash offset by decreases in accounts receivable and amount due from the Commonwealth for reimbursement of capital project expenditures. Other non-current assets decreased $10.8 million as a result of decreases in investments due to market conditions. The $11.4 million increase in deferred outflows of resources is due to pension and other post-employment benefits (OPEB) obligations.
3
Current liabilities decreased $6.2 million, and non-current liabilities decreased $0.8 million, which reflects a net decrease in total liabilities of $7.0 million. The change in current liabilities was attributable to a decrease in accounts payable and accrued expenses primarily due to the timing of payments for goods or services and construction projects as well as a decrease in unearned revenue. Non-current liabilities decreased slightly by $0.8 million due to normal payment of debt and fluctuations in pension and OPEB obligations. The increase in deferred inflows of resources is primarily attributed to actuarial calculations related to pension and OPEB liabilities.
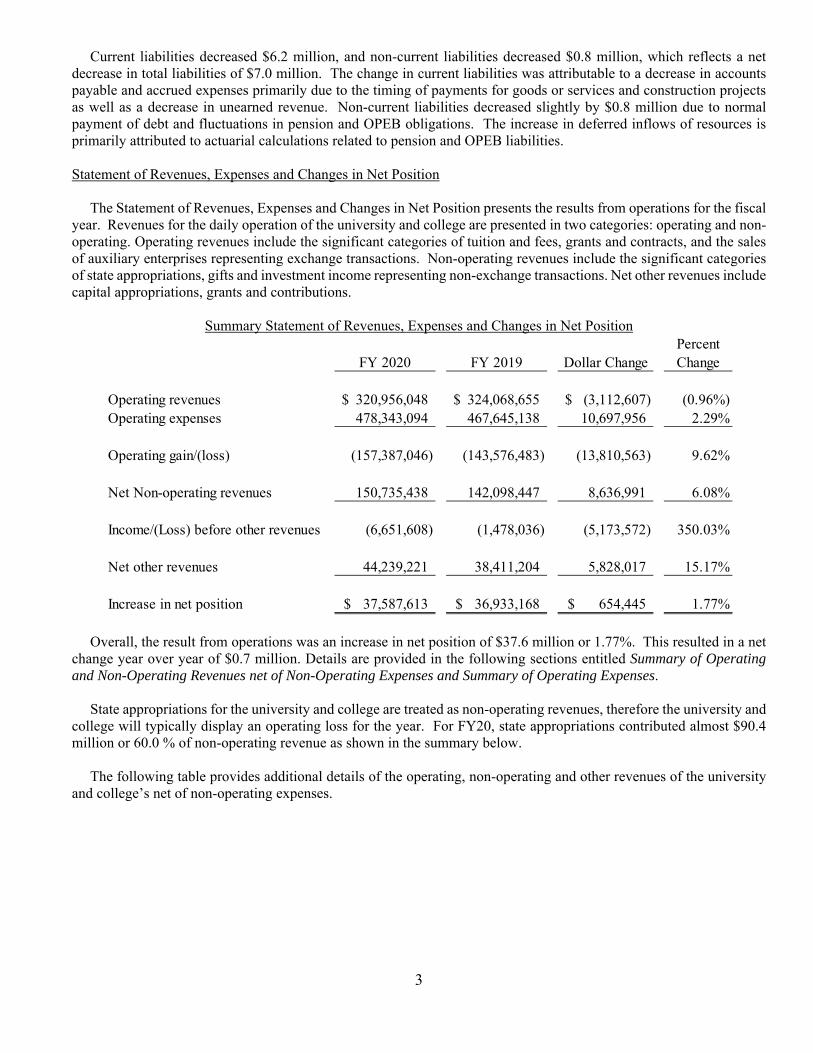
Statement of Revenues, Expenses and Changes in Net Position The Statement of Revenues, Expenses and Changes in Net Position presents the results from operations for the fiscal year. Revenues for the daily operation of the university and college are presented in two categories: operating and non-operating. Operating revenues include the significant categories of tuition and fees, grants and contracts, and the sales of auxiliary enterprises representing exchange transactions. Non-operating revenues include the significant categories of state appropriations, gifts and investment income representing non-exchange transactions. Net other revenues include capital appropriations, grants and contributions.
Summary Statement of Revenues, Expenses and Changes in Net Position
FY 2020 FY 2019 Dollar ChangePercent Change
Operating revenues 320,956,048$ 324,068,655$ (3,112,607)$ (0.96%)Operating expenses 478,343,094 467,645,138 10,697,956 2.29%
Operating gain/(loss) (157,387,046) (143,576,483) (13,810,563) 9.62%
Net Non-operating revenues 150,735,438 142,098,447 8,636,991 6.08%
Income/(Loss) before other revenues (6,651,608) (1,478,036) (5,173,572) 350.03%
Net other revenues 44,239,221 38,411,204 5,828,017 15.17%
Increase in net position 37,587,613$ 36,933,168$ 654,445$ 1.77%
Overall, the result from operations was an increase in net position of $37.6 million or 1.77%. This resulted in a net change year over year of $0.7 million. Details are provided in the following sections entitled Summary of Operating and Non-Operating Revenues net of Non-Operating Expenses and Summary of Operating Expenses.
State appropriations for the university and college are treated as non-operating revenues, therefore the university and college will typically display an operating loss for the year. For FY20, state appropriations contributed almost $90.4 million or 60.0 % of non-operating revenue as shown in the summary below. The following table provides additional details of the operating, non-operating and other revenues of the university and college’s net of non-operating expenses.

4
Summary of Operating and Non-Operating Revenues net of Non-Operating Expenses
FY 2020 FY 2019 Dollar ChangePercent Change
Operating Revenues:
Student Tuition and Fees, net of scholarship allowances 182,318,974$ 176,441,292$ 5,877,682$ 3.33%
Federal, State, Local and Non-governmental grants and contracts 43,403,344 44,739,494 (1,336,150) (2.99%)
Auxiliary Enterprise, net of scholarship allowances 88,387,631 95,113,461 (6,725,830) (7.07%)
Other 6,846,099 7,774,408 (928,309) (11.94%)
Total Operating Revenues 320,956,048 324,068,655 (3,112,607) (0.96%)
Non-Operating:
State Appropriations 90,401,326 80,754,614 9,646,712 11.95%
Gifts, Investment Income and other income and expenses 60,334,112 61,343,833 (1,009,721) (1.65%)
Total Non-Operating 150,735,438 142,098,447 8,636,991 6.08%
Other Revenues, Gains and (Losses):
Capital Appropriations 22,807,700 24,279,423 (1,471,723) (6.06%)
Capital Grants and Gifts 21,642,116 14,396,010 7,246,106 50.33%
Loss on disposal of assets (210,595) (264,229) 53,634 (20.30%)
Total Other Revenues, Gains and (Losses) 44,239,221 38,411,204 5,828,017 15.17%
Total Revenues 515,930,707$ 504,578,306$ 11,352,401$ 2.25%
Within the operating revenue category there was a slight decrease in operating revenues of $3.1 million or less than 1% as compared to the prior year. There was an increase in student tuition and fees of $5.9 million or 3.3% offset by a reduction in auxiliary enterprise revenue due primarily to student rebates for housing and meal plans. Non-operating revenues grew, with increases in State Appropriations, CARES Act and Coronavirus funding offset by decreases in gifts and investment income. The university and college experienced an increase in Total Other Revenues due to capital grants and gifts.
Details of the operating expenses of the university and college are summarized below:

5
Summary of Operating Expenses
FY 2020 FY 2019 Dollar ChangePercent Change
Operating Expenses:Instruction 140,310,110$ 134,988,703$ 5,321,407$ 3.94%Research 55,648,171 51,838,208 3,809,963 7.35%Public Service 62,837 82,624 (19,787) (23.95%)Academic Support 42,482,406 38,961,505 3,520,901 9.04%Student Services 16,975,860 18,089,368 (1,113,508) (6.16%)Institutional Support 47,483,518 46,678,912 804,606 1.72%Operation and Maintenance of Plant 29,319,059 27,775,075 1,543,984 5.56%Student Aid 20,011,482 17,476,356 2,535,126 14.51%Auxiliary Enterprise 88,121,892 95,311,784 (7,189,892) (7.54%)Depreciation 37,702,243 36,412,541 1,289,702 3.54%Other Operating Expenses 225,516 30,062 195,454 650.17%
Total Operating Expenses 478,343,094$ 467,645,138$ 10,697,956$ 2.29%
For FY20, the increase in operating expenses was a result of increases in Instruction, Research, Academic Support and Student Aid offset by decreases primarily in Auxiliary enterprises. Statement of Cash Flows The Statement of Cash Flows provides detailed information about the university and college’s sources and uses of cash during the fiscal year. Cash flow information is presented in four distinct categories: Operating, Non-Capital Financing, Capital Financing and Investing Activities. This statement aids in the assessment of the university and college’s ability to generate cash to meet current and future obligations.
Summary Statement of Cash Flows
Dollar PercentFY 2020 FY 2019 Change Change
Cash Flows from:
Operating Activities (119,762,492)$ (110,016,945)$ (9,745,547)$ (8.86%)
Non-Capital Financing 154,217,177 143,366,475 10,850,702 7.57%
Capital and Related Financing (35,913,568) (8,388,637) (27,524,931) (328.12%)
Investing Activities 9,718,245 6,947,499 2,770,746 39.88%
Net Increase/(Decrease) in Cash 8,259,362$ 31,908,392$ (23,649,030)$ (74.12%)
Cash flow from operations and non-capital financing reflects the sources and uses of cash to support the core mission of the university and college. The primary sources of cash supporting the core mission of the university and college in FY 20 were: tuition and fees - $178.4 million, auxiliary enterprise revenues - $90.1 million, state appropriations - $90.4 million, gifts – $53.0 million and grants and contracts - $41.6 million. The primary uses of operating cash in FY20 were payments to employees - $274.5 million representing salaries, wages, and fringe benefits and payments to suppliers of goods and services - $128.7 million.
6
Cash flow from capital financing activities reflects the activities associated with the acquisition and construction of capital assets including related debt payments. The primary sources of cash in FY20 were: capital appropriations - $24.2 million, capital grants and contributions - $21.4 million and proceeds from capital debt - $10.7 million. The primary uses of cash were for capital expenditures - $62.7 million and debt payments - $29.0 million.
The change in cash flows from investing activities is due to investment income and purchase and sale of investments. Capital Asset and Debt Administration
William & Mary The following list provides highlights of capital projects completed, in progress, or in design during FY20.
Projects Completed in FY20 – Three projects were placed into service in FY20. The West Utility Plant, the Tribe Field Hockey Center and the Alumni House Expansion and Renovation were completed in FY20. These projects will be closed out as soon as warranty inspections are completed.
Projects in Progress – Including the 12 projects highlighted on this document, there are over 50 projects currently in some phase of progress – concept development, design, construction, or close out.
Projects in Design – A brief description of each project in design at the end of the fiscal year is provided below:
- Hearth: Memorial to the Enslaved, a concept design selected from a multi-national competition to honor the
enslaved persons that helped establish William & Mary, will be designed and constructed in the vicinity of the Wren Building.
- Lake Matoaka Dam Spillway Improvement project addresses Virginia dam safety regulations, which require that high risk dams have the capacity to pass off 90% of the flow created by probable maximum precipitation. The capacity will be created by hardening the downstream face of the dam using roller compacted concrete in order to allow passage of flow by overtopping without damage to the earthen embankment.
- Muscarelle Museum Renovation and Expansion will renovate the existing 19,000 square foot museum and construct approximately a 30,000 square foot addition. This will provide a more modern, program oriented facility which will include exhibit space and teaching space.
- Blow Hall IT Data Center Renovation installs a new HVAC system for computer rack cooling to meet current cooling loads. The project also adds redundant power sources with two new uninterrupted power supplies and a new generator power source.
- Integrated Science Center, Phase 4 (ISC4) will support the Mathematics, Computer Science, Engineering Design and Kinesiology & Health Sciences programs which are currently housed in facilities that lack sufficient space and robust building systems. This new facility will accommodate state of the art instruction and research by constructing approximately 116,000 square feet of new space and renovating 10,000 square feet of existing space in order to connect ISC 4 to the adjacent ISC 1. The facility will be constructed on the site of the former Millington Hall. The project has been authorized for preliminary design, but the state has not yet provided funding to complete the design and move to construction. Those funds will be requested in the 2021 legislative session.

7
- Sadler West Addition constructs a 46,000-square foot addition to the western side of the Sadler Center and renovates 8,000 square feet in the old Student Health Center. This project will allow for the relocation and consolidation of the university’s mission essential student affairs programs, which are currently spread across multiple facilities on campus.
- Kaplan Arena Renovation & Addition provides a new, enlarged arena entry lobby and concourse, bowl improvements and the construction of an adjacent, connected Sports Performance Center. The project will renovate portions of the existing building to improve locker room and other student athlete spaces. Building systems will be improved as necessary. Bowl improvements will include seating upgrades, club seating and other fan experience improvements. The Sports Performance Center will provide a practice basketball/volleyball court, strength training, and sports therapy spaces.
- Swem Library Patio project constructs an accessible outdoor seating and gathering area to the east of the main entrance to Swem Library. The project will consist of brick pavers, steps, access ramp and associated landscaping.
Projects in Construction - A brief description of each project in construction at the end of the fiscal year is provided below: - Fine and Performing Arts Phase I and II will expand and renovate Phi Beta Kappa (PBK) Hall, construct a new
music building, and improve pedestrian and vehicular circulation in the immediate vicinity. PBK will house Theater, Dance, and Speech and feature a 100 seat student laboratory, a 250 seat studio (black box) theater and a 499 seat renovated main theater. The music building will feature a 125 seat recital hall and a 450 seat recital hall. Both facilities will be uniquely suited to the instructional and acoustic needs of the supported programs. Construction is underway with a completion target of Fall 2022.
- Reveley Garden will construct a version of the 1926 Charles Gillette garden that was designed as part of William & Mary’s Beaux-Arts campus plan but never built. The project will create new places of repose and beauty on the south side of W&M’s campus, as well as move towards fulfilling Gillette’s thoughtful and compelling design for the early twentieth-century campus. Construction is underway with a Fall 2020 completion.
- The One Tribe Place renovations provided necessary structural repairs, remediated issues with storm water and waterproofing and addressed climate control issues in student rooms. Work continues to replace portions of the roof which is expected to conclude in Fall 2020.
- Law School Patio Renovations project provides improvements to the hardscape of the patio, addition of landscape plantings and a pergola. Construction contract is in the award phase.
Looking ahead, W&M will be centered on significant construction efforts in the coming year with Fine and Performing Arts Phases I and II, Muscarelle Museum, Sadler Center and Kaplan Arena all active in 2021. W&M will also explore academic, auxiliary and administrative space needs balanced against existing inventory and master plan data to determine best courses of action for renovations or new construction to support current and future programs
Virginia Institute of Marine Science
The following list provides highlights of projects completed and in progress or in design during FY20. Projects Completed in FY20 – Two projects were placed into service in FY20. The Consolidated Scientific
Research Facility and Facilities Management Building were completed in FY20. The Consolidated Scientific
8
Research Facility is waiting for the archaeologist to finalize their report and submit to the Department of Historical Resources for approval.
Projects in Progress or Design - VIMS had several projects either in design or under construction in FY20.
- The New Research Facility project involves the planning of a new building to replace the existing Chesapeake Bay Hall building with a new 65,000 square foot building to provide research, education, and office space for the Departments of Aquatic Health Sciences, Biological Sciences, Fisheries Science, and Physical Sciences. Schematic design was completed to identify scope and program requirements. The schematic cost estimates indicated that the construction budget was higher than the approved targeted project budget. VIMS reviewed both scope and cost to align with approved budgets.
- The Eastern Shore Laboratory Complex project involves the planning and construction for a new building
complex totaling 22,218 square feet that includes a new administration building, education building, visiting scientist/student center, shellfish aquaculture hatchery, maintenance shop, and a storage shop. Construction documents were reviewed by the Division of Engineering and Buildings (DEB) for final code analysis and permitting. One final resubmission is required. Bids were received by the General Contactor short list. VIMS and the design team worked with the responsible low bidder to align the construction costs with the available budget through negotiations and value engineering.
- The Oyster Hatchery project involves the planning for a new state-of-the-art 22,000 square foot oyster hatchery which will house space for research, education, and training as well as space for outreach activities with industry that promotes economic development. Construction documents were reviewed by DEB for final code analysis and permitting. Responses to DEB’s comments were finalized by Quinn Evans Architects. Kjellstrom and Lee, Inc (Construction Manager) priced the final documents.
Richard Bland College
The following list provides highlights of capital projects completed, in progress, or in design during FY20.
Project in Design in FY20-The Academic Innovation Center project includes new space for active learning, student collaboration, and student engagement as well as access to specialized high tech equipment for use by faculty and students. The new innovation center will include space for partnership classrooms, regular classrooms, collaboration classrooms, and recording studios. By renovating the second floor of the existing library and connecting the new spaces to the library, the innovation center and the library will combine to foster a seamless and natural flow of learning, information, research, experimentation, and discovery for students in every course offered by the college.
Debt Activity
The university and college’s long-term debt is comprised of bonds payable, notes payable, capital lease payable and installment purchases. The bonds payable are Section 9(c) bonds, which are general obligation bonds issued and backed by the Commonwealth of Virginia on behalf of the university and college. These bonds are used to finance capital projects which will produce revenue to repay the debt. The university and college’s notes payable consist of Section 9(d) bonds, which are issued by the Virginia College Building Authority’s (VCBA) Pooled Bond Program. These bonds are backed by pledges against the university and college’s general revenues. As of June 30, 2020, the university and college had $74.5 million and $172.0 million in outstanding balances for Section 9(c) and 9(d) bonds, respectively.
9
The outstanding balance of 9(c) bonds can be summarized in five major categories: (1) Renovation of Dormitories - $42.7 million, (2) New Dormitory - $17.2 million, (3) Commons Dining Hall - $3.7 million, (4) Graduate Housing - $3.0 million, and (5) RBC Student Housing Conversion - $2.2 million. The remaining difference reflects $5.7 million in unamortized premiums.
The majority of the 9(d) balance at June 30, 2020 is related to: Plant Renovations – $29.8 million, Expansion of Sadler Center - $30.0 million, One Tribe Place - $18.0 million, Miller Hall School of Business - $11.7 million, Barksdale dormitories - $10.2 million, Integrated Science Center - $9.9 million, McLeod Tyler Wellness Center - $8.3, Marshall-Wythe Law School Library - $7.4 million, Improvement of Auxiliary facilities $8.3 million, the Parking Deck -$4.4 million, Recreation Sports Center - $3.8 million, Athletic related projects – $12.4 million, and various other projects – $3.6 million. The remaining difference reflects $14.2 million in unamortized premiums.
Economic Outlook
The university ended fiscal year 2020 strong. Overall net assets increased and cost savings measures implemented in the last quarter of the year resulted in a net savings of approximately $6 million. The university’s economic health continues to reflect its strong student demand for a W&M degree, its ability to respond to changes quickly to reallocate funds to the university’s highest priorities, and continued funding from the Commonwealth of Virginia, particularly for targeted initiatives and capital projects. The university continues to focus on diversifying sources of revenue that align with its overall strategic direction.
W&M continues to recruit, admit and retain top-caliber students even as the university competes against the most selective public and private institutions in the country. The freshman applicant pool continues to be strong, with 14,202 students seeking admission for Fall 2020. With an incoming class size of 1,526 undergraduate students, W&M has almost 9.3 applicants for every student enrolled. Given its robust applicant pool, the credentials of admitted students remain strong, reflecting the university’s highly selective nature. These statistics, coupled with the university’s academic reputation, suggest a strong continuing student demand for the future. Similarly, VIMS continues to see significant success in its academic, research and advisory programs, particularly in high profile areas such as coastal flooding, sea-level rise, and water quality. Over the past several years, enrollment at RBC, a separate two-year college governed by the Board of Visitors has fluctuated as the college has raised its admissions standards. Yet, over the past two academic years, enrollments stabilized as the college’s investments in academic advising, student support services, and retention programs began to pay off. Given uncertainty around student responses to the novel coronavirus (COVID-19) pandemic, the college continues to forecast revenues conservatively, monitor enrollments closely, and manage its budget tightly.
Heading in to fiscal year 2021, the university’s board of visitors approved an operating budget assuming no growth in enrollments over fiscal year 2020. Summer 2020 enrollments and related revenues were higher than the prior year, and while fall 2020 undergraduate registrations are slightly below prior year (less than 1% decline), graduate registration has led to a current overall increase of approximately 8%. The university has moved deliberately to provide students with significant options to meet their educational needs while the university continues to operate in the midst of a pandemic which is evident in the number of students choosing to take courses remotely or in a blended fashion. For students who are living on campus or residing locally, the university has taken an aggressive approach to COVID-19 testing, seeking to identify asymptomatic positives among the student population to limit spread. In addition, the university has adopted Healthy Together, a university-wide commitment to behavioral norms and expectations given the current public health crisis. Given the high level of uncertainty in the current environment, the university continues to monitor and plan for adjustments to the adopted fiscal year 2021 budget as needed, including ongoing cost-containment efforts and a mission critical budget review to ensure that resource allocations align with the university’s most immediate needs and long-term strategic initiatives. By reducing expenditures on a one-time basis and an ongoing basis, the university remains well positioned to adjust its spending plan should circumstances change over the next 12 months. In addition, while adjusting to the immediate circumstance, the university continues to take a long-term view, allowing it to implement sustained and strategic solutions even in the midst of the current public health and economic uncertainty.

10
State support for operations is a function of general economic conditions and the priority assigned to higher education among competing demands for Commonwealth resources. The 2020-2022 Appropriation Act, Chapter 1289, adopted by the General Assembly and signed into law by the Governor, held funding constant with FY 2020 with the only changes related to funds held in central appropriations for past salary and fringe benefit changes moved to William & Mary’s base General Fund allocation. Early indications from the ongoing special session are that there will be no FY 2021 reductions for higher education. We continue to monitor the ongoing discussions for any impact to William & Mary general fund allocations.
As of June 30, 2020 the market value of W&M’s total endowment was greater than $967.7 million. The portfolio remained strong with only a slight decrease over the prior year. The Board of Visitors’ endowment and the William & Mary Investment Trust together remain the largest of the investment portfolios and both remain highly diversified across asset classes.
William & Mary continues to benefit from the generosity of alumni and friends, foundations, and corporations. This year, the university completed its boldest fundraising campaign yet, with $1.04 billion raised. Ties among alumni and alma mater strengthened its status as the No. 1 public university for alumni participation cemented several years in a row. Even in the midst of a pandemic and uncertainty in the world, the university raised more than $149.9 million fiscal year 2020 — the single largest fundraising year ever for the university.
Investments in academic facilities and infrastructure remain strong. With support from the Commonwealth for construction and renovation of academic facilities, W&M is well under way in the construction of state-of-the-art educational and performance facilities for its music, theater, dance and speech programs. The last phase of the Integrated Science Center is in design and will accommodate state-of-the-art instruction and research space along with the expansion of the Sadler Center that will support the consolidation of activities and programs for Student Affairs. Likewise, with support from the Commonwealth, VIMS is also continuing to invest in its facilities and physical inventory, with the completion of construction of a new research vessel and Consolidated Scientific Research Facility. The New Research Facility, Oyster Hatchery, and Eastern Shore Research Facilities are under way.
11
Consolidated Financial Statements

William & Mary, Virginia Institute of Marine Science and Richard Bland College - Consolidated Report
Statement of Net Position
As of June 30, 2020
Component
ASSETS University Units
Current assets:
Cash and cash equivalents (Note 3) 44,876,280$ 34,196,478$
Investments (Note 3) 19,496,715 35,072,315
Appropriation available 1,050,796 -
Receivables, net of allowance for doubtful accounts (Note 5) 16,664,257 3,879,138
Notes receivable (Note 5) 340,042 -
Due from commonwealth 2,514,237 -
Inventories 623,315 12,009
Pledges receivable - 14,445,570
Prepaid expenses 3,139,456 362,712
Other assets 229,662 73,950
Total current assets 88,934,760 88,042,172
Non-current assets:
Restricted cash and cash equivalents (Note 3) 41,066,489 16,065,659
Restricted investments (Note 3) 89,807,270 470,123,913
Investments (Note 3) 26,890,593 279,499,158
Receivables - 19,049,529
Notes receivable, net of allowance for doubtful accounts (Note 5) 1,216,799 -
Pledges receivable - 39,252,556
Capital assets, nondepreciable (Note 6) 155,077,122 16,263,555
Capital assets, depreciable net of accumulated depreciation (Note 6) 788,291,299 25,680,455
Other assets - 2,587,909
Other restricted assets 2,563,781 157,221,728
Total non-current assets 1,104,913,353 1,025,744,462
Total assets 1,193,848,113 1,113,786,634
DEFERRED OUTFLOWS OF RESOURCES
Pension related (Note 14) 23,064,379
Other postemployment benefits (Note 15) 10,338,266
Loss on refunding of debt 3,942,569
Total deferred outflows of resources 37,345,214
Total assets and deferred outflows of resources 1,231,193,327
LIABILITIES
Current liabilities:
Accounts payable and accrued expenses (Note 7) 45,783,592 1,304,536
Unearned revenue 14,592,320 187,460
Deposits held in custody for others 907,702 281,529
Obligations under securities lending program 137,182 -
Long-term liabilities-current portion (Note 9) 32,452,994 2,317,792
Other liabilities 33,362 29,423
Total current liabilities 93,907,152 4,120,740
Long-term liabilities-non-current portion (Note 9) 434,939,958 63,106,157
Total liabilities 528,847,110 67,226,897
DEFERRED INFLOWS OF RESOURCES
Pension related (Note 14) 8,217,900
Other postemployment benefits (Note 15) 25,483,451
Gain on refunding of debt 776,174
Total deferred inflows of resources 34,477,525
Total liabilities and deferred inflows of resources 563,324,635
NET POSITION
Net investment in capital assets 701,520,412 16,148,741
Restricted for:
Nonexpendable:
Scholarships and fellowships 10,665,226 171,959,097
Research - 26,437,746
Loans - 24,230
Departmental uses 44,497,055 180,277,764
Other - 207,369,530
Expendable:
Scholarships and fellowships 9,409,318 109,859,717
Research 464,878 8,066,907
Debt service 2,861,119 -
Capital projects 953,030 32,019,362
Loans 527,860 -
Departmental uses 19,261,265 181,739,214
Other - 52,451,031
Unrestricted (122,291,471) 60,206,398
Total net position 667,868,692$ 1,046,559,737$
The accompanying Notes to the Financial Statements are an integral part of this statement.
12
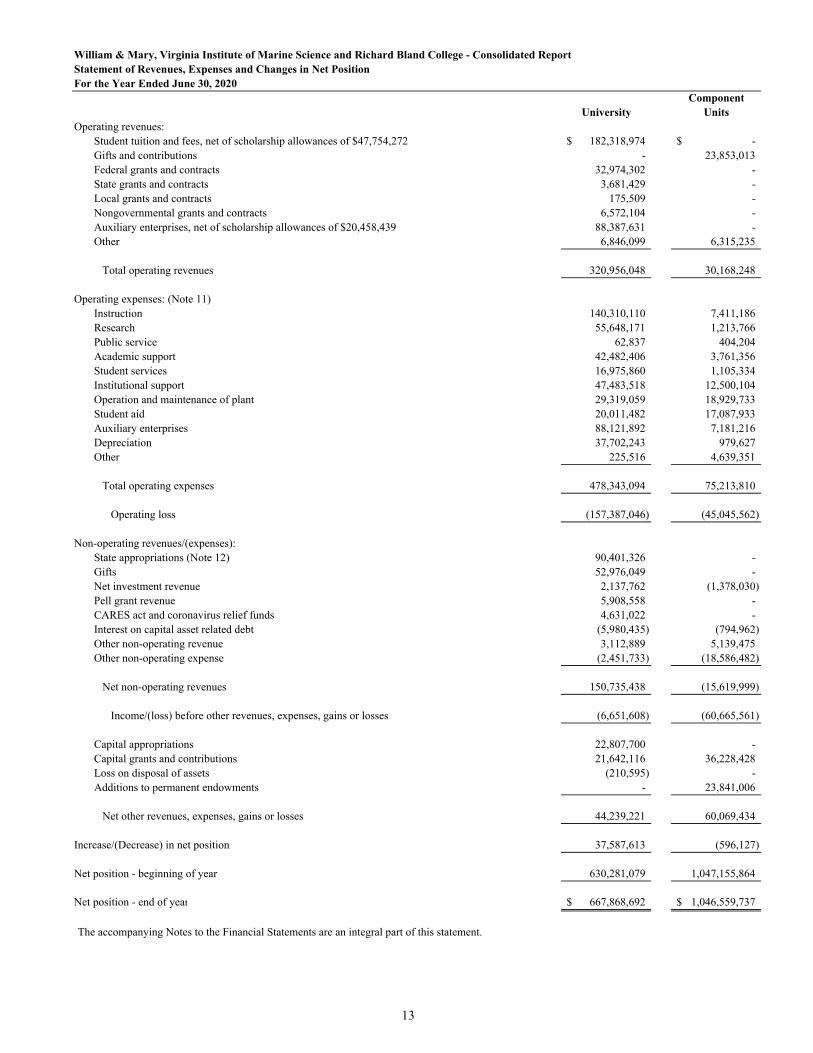
William & Mary, Virginia Institute of Marine Science and Richard Bland College - Consolidated ReportStatement of Revenues, Expenses and Changes in Net PositionFor the Year Ended June 30, 2020
ComponentUniversity Units
Operating revenues: Student tuition and fees, net of scholarship allowances of $47,754,272 182,318,974$ -$ Gifts and contributions - 23,853,013 Federal grants and contracts 32,974,302 - State grants and contracts 3,681,429 - Local grants and contracts 175,509 - Nongovernmental grants and contracts 6,572,104 - Auxiliary enterprises, net of scholarship allowances of $20,458,439 88,387,631 - Other 6,846,099 6,315,235
Total operating revenues 320,956,048 30,168,248
Operating expenses: (Note 11)Instruction 140,310,110 7,411,186 Research 55,648,171 1,213,766 Public service 62,837 404,204 Academic support 42,482,406 3,761,356 Student services 16,975,860 1,105,334 Institutional support 47,483,518 12,500,104 Operation and maintenance of plant 29,319,059 18,929,733 Student aid 20,011,482 17,087,933 Auxiliary enterprises 88,121,892 7,181,216 Depreciation 37,702,243 979,627 Other 225,516 4,639,351
Total operating expenses 478,343,094 75,213,810
Operating loss (157,387,046) (45,045,562)
Non-operating revenues/(expenses):State appropriations (Note 12) 90,401,326 - Gifts 52,976,049 - Net investment revenue 2,137,762 (1,378,030) Pell grant revenue 5,908,558 - CARES act and coronavirus relief funds 4,631,022 - Interest on capital asset related debt (5,980,435) (794,962) Other non-operating revenue 3,112,889 5,139,475 Other non-operating expense (2,451,733) (18,586,482)
Net non-operating revenues 150,735,438 (15,619,999)
Income/(loss) before other revenues, expenses, gains or losses (6,651,608) (60,665,561)
Capital appropriations 22,807,700 - Capital grants and contributions 21,642,116 36,228,428 Loss on disposal of assets (210,595) - Additions to permanent endowments - 23,841,006
Net other revenues, expenses, gains or losses 44,239,221 60,069,434
Increase/(Decrease) in net position 37,587,613 (596,127)
Net position - beginning of year 630,281,079 1,047,155,864
Net position - end of year 667,868,692$ 1,046,559,737$
The accompanying Notes to the Financial Statements are an integral part of this statement.
13

William & Mary, Virginia Institute of Marine Science and Richard Bland College - Consolidated ReportStatement of Cash FlowsFor the Year Ended June 30, 2020
Cash flows from operating activities:Tuition and fees 178,382,619$ Scholarships (18,748,053) Research grants and contracts 41,632,933 Auxiliary enterprise charges 90,132,531 Payments to suppliers (128,696,252) Payments to employees (274,487,144) Payments for operation and maintenance of facilities (14,100,388) Collection of loans to students and employees 512,240 Other receipts 5,839,616 Other payments (230,594)
Net cash used by operating activities (119,762,492)
Cash flows from noncapital financing activities:State appropriations 90,401,326 Gifts 52,976,049 Custodial receipts 645,916 Custodial payments (1,167,716) Direct Loan receipts 45,884,460 Direct Loan disbursements (45,884,460) Other non-operating receipts 13,697,699 Other non-operating disbursements (2,336,097)
Net cash provided by noncapital financing activities 154,217,177
Cash flows from capital financing activities:Proceeds from issuance of capital debt 10,727,938 Capital appropriations 24,178,332 Capital grants and contributions 21,446,043 Payment to the Treasurer of Virginia (796,803) Insurance payments 223,704 Capital expenditures (62,731,682) Principal paid on capital-related debt (18,741,330) Interest paid on capital-related debt (10,279,391) Proceeds from sale of capital assets 59,621
Net cash used by capital and related financing activities (35,913,568)
Cash flows from investing activities:Investment income 4,096,420 Investment expense (242,472) Proceeds from sale of investments 57,905,261 Purchase of investments (52,040,964)
Net cash provided by investing activities 9,718,245
Net increase/(decrease) in cash 8,259,362
Cash-beginning of year 77,546,225
Cash-end of year 85,805,587$
14

William & Mary, Virginia Institute of Marine Science and Richard Bland College - Consolidated ReportStatement of Cash FlowsFor the Year Ended June 30, 2020
Reconciliation of Cash-end of year-Cash Flow Statement, to Cash and Cash Equivalents-Statement of Net Position Statement of Net Position
Cash and cash equivalents 44,876,280$ Restricted cash and cash equivalents 41,066,489
Less: Securities lending -Treasurer of Virginia (137,182)
Net cash and cash equivalents 85,805,587$
Reconciliation of net operating expenses to net cash used by operating activitiesNet operating loss (157,387,046)$ Adjustments to reconcile net operating expenses to cash used by operating activities
Depreciation expense 37,702,243 Changes in assets, deferred outflows of resources, liabilities and deferred inflows of resources
Receivables-net 3,127,963 Inventories (84,508) Prepaid expense 422,087 Accounts payable (1,594,166) Unearned revenue (2,018,544) Custodial funds 101,217 Federal loan contribution (888,020) Compensated absences 919,807 Pension liability 16,346,172 Deferred outflows of resources related to pension obligations (10,603,890) Deferred inflows of resources related to pension obligations (2,613,100) Other post-employment benefits liability (8,346,343) Other post-employment benefits asset 405,219 Deferred outflows of resources related to other post-employment benefits (1,704,681) Deferred inflows of resources related to other post-empoyment benefits 6,458,175 Other liability (5,077)
Net cash used in operating activities (119,762,492)$
Amortization of deferred loss 661,303$ Donated capital assets 196,073$ Loss on disposal of assets 210,594$ Capital assets acquired through accounts payable 10,689,622$ Amortization of bond premium 2,773,654$ Net change in value of investments (1,577,506)$
The accompanying Notes to Financial Statements are an integral part of this statement
NONCASH INVESTING, NONCAPITAL FINANCING, AND CAPITALAND RELATED FINANCING TRANSACTIONS
15
This Page Intentionally Left Blank
16
17
Notes to
Financial Statements
Year Ended June 30, 2020

18
William & Mary, Virginia Institute of Marine Science, and Richard Bland College - Consolidated Report
NOTES TO FINANCIAL STATEMENTS 1. SUMMARY OF SIGNIFICANT ACCOUNTING POLICIES Reporting Entity The consolidated financial statements of William & Mary include the financial statements of William & Mary (W&M) located in Williamsburg, Virginia, Virginia Institute of Marine Science (VIMS), which serves as the school of Marine Science, collectively referred to as the “university” and Richard Bland, referred to as the “college”. All three entities are recognized as distinct state agencies within the Commonwealth of Virginia’s statewide system of public higher education with a shared governing board appointed by the Governor of Virginia. In this capacity, the Board of Visitors is responsible for overseeing governance of all three entities. The university and college are a component unit of the Commonwealth of Virginia and are included in the general purpose financial statements of the Commonwealth. The accompanying financial statements present all funds for which the university and college’s Board of Visitors are financially accountable. Related foundations and similar non-profit corporations for which the university and college are not financially accountable are also a part of the accompanying financial statements in accordance with the Governmental Accounting Standards Board (GASB) reporting model. These entities are legally separate and tax exempt organizations formed to promote the achievements and further the aims and purposes of the university and college. These component units are described in Note 13. The university and college have nine component units – the William & Mary Foundation, The Marshall-Wythe School of Law Foundation, the William & Mary Alumni Association, the William & Mary Athletic Educational Foundation, the William & Mary School of Business Foundation, the Virginia Institute of Marine Science Foundation, the Richard Bland College Foundation, the William & Mary Real Estate Foundation, and the Intellectual Property Foundation. These organizations are separately incorporated tax-exempt entities and have been formed to promote the achievements and further the aims and purposes of the university and college. The Foundations are private, non-profit organizations, and as such the financial statement presentation follows the recommendation of accounting literature related to non-profits. As a result, reclassifications have been made to convert the Foundation’s financial information to GASB format. Although the university and college do not control the timing or amount of receipts from the Foundations, the majority of resources or income which the Foundations hold and invest are restricted to the activities of the university and college by the donors. Because these restricted resources held by the Foundations can only be used by or for the benefit of the university and college, the Foundations are considered component units of the university and college and are discretely presented in the financial statements with the exception of the Intellectual Property Foundation. The Intellectual Property Foundation is presented blended in the university column because the university has a voting majority of the governing board of the Foundation. The William & Mary Foundation is a private, not-for-profit corporation organized under the laws of the Commonwealth of Virginia to “aid, strengthen, and expand in every proper and useful way” the work of William & Mary. For additional information on the William & Mary Foundation, contact the Foundation at Post Office Box 8795, Williamsburg, Virginia, 23187. The Marshall-Wythe School of Law Foundation is a non-stock, not-for-profit corporation organized under the laws of the Commonwealth of Virginia, established for the purpose of soliciting and receiving gifts to support the William & Mary Law School. The Foundation supports the law school through the funding of scholarships and fellowships, instruction and research activities, and academic support. For additional information on The Marshall-Wythe School of Law Foundation, contact the Foundation Office at Post Office Box 8795, Williamsburg, Virginia, 23187.

19
The William & Mary Alumni Association is a private, not-for-profit corporation organized under the laws of the Commonwealth of Virginia which provides aid to W&M in its work and promotes and strengthens the bonds of interest between and among William & Mary and its alumni. For additional information on the Alumni Association, contact the Alumni Association Office at Post Office Box 2100, Williamsburg, Virginia, 23187-2100.
The William & Mary Athletic Educational Foundation is a not-for-profit corporation organized under the laws of the Commonwealth of Virginia. The purpose of the Foundation is to promote, foster, encourage and further education, in all enterprises of all kinds at William & Mary, but it principally supports W&M’s Athletic Department. For additional information on the Athletic Educational Foundation, contact the Foundation Office at 751 Ukrop Drive, Williamsburg, Virginia, 23187. The William & Mary Business School Foundation is a non-stock, not-for-profit corporation organized under the laws of the Commonwealth of Virginia. The purpose of the Business School Foundation is to solicit and receive gifts to endow the W&M School of Business Administration and to support the School through the operations of the Foundation. For additional information on the William & Mary Business School Foundation, contact the Foundation Office at Post Office Box 2220, Williamsburg, Virginia, 23187. The Virginia Institute of Marine Science Foundation is a not-for-profit corporation organized under the laws of the Commonwealth of Virginia. The purpose of the Foundation is to support VIMS primarily through contributions from the public. For additional information on the Virginia Institute of Marine Science Foundation, contact the Foundation Office at Post Office Box 1346, Gloucester Point, Virginia, 23062. The Richard Bland College Foundation is a private, not-for-profit corporation organized under the laws of the Commonwealth of Virginia which provides scholarships, financial aid, and books to RBC’s students, along with support for faculty development and cultural activities. For additional information on the Richard Bland College Foundation, contact the Foundation Office at 11301 Johnson Road, South Prince George, Virginia, 23805. The William & Mary Real Estate Foundation is a non-profit organization incorporated under the laws of the Commonwealth of Virginia in September 2006. Its purpose is to acquire, hold, manage, sell, lease and participate in the development of real properties in support of the educational goals of William & Mary and VIMS. For additional information on the William & Mary Real Estate Foundation, contact the Foundation Office at Post Office Box 8795, Williamsburg, Virginia, 23187-8795. The Intellectual Property Foundation is a nonprofit organization incorporated under the laws of the Commonwealth of Virginia in September 2007. Its purpose is to handle all aspects of the intellectual property of William & Mary in support of the educational goals of the university. For additional information on the William & Mary Intellectual Property Foundation, contact the Foundation Office at Post Office Box 8795, Williamsburg, Virginia, 23187-8795. Basis of Presentation The accompanying financial statements have been prepared in accordance with generally accepted accounting principles as prescribed by the GASB, including all applicable GASB pronouncements. Pursuant to the provisions of GASB Statement No. 34, Basic Financial Statements – and Management’s Discussion and Analysis – for State and Local Governments, and Statement No. 35, Basic Financial Statements - and Management’s Discussion and Analysis - for Public Colleges and Universities, the university and college follow accounting and reporting standards for reporting as a special-purpose government engaged in business-type activities and accordingly, are reported within a single column in the basic financial statements. Basis of Accounting The financial statements of the university and college have been prepared using the economic resources measurement focus and the accrual basis of accounting, including depreciation expense related to capitalized fixed assets. Under the accrual basis, revenues are recognized when earned, and expenses are recorded when an obligation has been incurred. Bond premiums and discounts are deferred and amortized over the life of the debt. All significant

20
intra-agency transactions have been eliminated. Newly Adopted Accounting Pronouncements The GASB has extended the effective dates of implementation of new standards due to the impacts of COVID 19. However, the Commonwealth is proceeding with implementing GASB Statement No. 84, Fiduciary Activities, and GASB Statement No. 90, Majority Equity Interests. GASB Statement No. 84, Fiduciary Activities, establishes criteria for identifying fiduciary activities. Activities that meet the criteria are to be reported in separate fiduciary fund statements. GASB Statement No. 90, Majority Equity Interests, defines a majority equity interest and specifies that a majority equity interest in a legally separate organization should be reported as an investment if a government’s holding of the equity interest meets the definition of an investment. The university determined that it did not have any material fiduciary activity or majority equity interest in a legally separate organization and the financial statements were unaffected by the implementation of GASB 84 and GASB 90. Cash and Cash Equivalents In accordance with the GASB Statement No. 9, Reporting Cash Flows of Proprietary and Nonexpendable Trust Funds and Governmental Entities That Use Proprietary Fund Accounting, definition, cash and cash equivalents consist of cash on hand, money market funds, and temporary highly liquid investments with an original maturity of three months or less. Investments GASB Statement No. 31, Accounting and Financial Reporting for Certain Investments and for External Investment Pools, requires that purchased investments, interest-bearing temporary investments classified with cash, and investments received as gifts be recorded at fair value, and reported in accordance with GASB Statement No. 72, Fair Value Measurement and Application (See Note 3). Realized and unrealized gains and losses are reported in investment income as non-operating revenue in the Statement of Revenues, Expenses, and Changes in Net Position. Receivables Receivables consist of tuition and fee charges to students and auxiliary enterprises’ sales and services. Receivables also include amounts due from the federal government, state and local governments, or private sources, in connection with reimbursement of allowable expenditures made pursuant to grants and contracts. Receivables are recorded net of estimated uncollectible amounts. Inventories Inventories at the university are reported using the consumption method and valued at average cost. RBC does not report any inventory. Prepaid Expenses As of June 30, 2020, the university and college’s prepaid expenses included items such as insurance premiums, membership dues, conference registrations and publication subscriptions for FY21 that were paid in advance. Capital Assets Capital assets are recorded at historical cost at the date of acquisition or acquisition value at the date of donation in the case of gifts. Construction expenses for capital assets and improvements are capitalized when expended. Interest expense of $2,153,346 relating to construction is capitalized net of interest income earned on resources set aside for this purpose for the year ended June 30, 2020. The university and college’s capitalization policy on equipment includes all items with an estimated useful life of two years or more. The university and college capitalize all items with a unit price greater than or equal to $5,000. The university capitalizes buildings, improvements other than buildings and
21
infrastructure with a cost greater than or equal to $100,000. Richard Bland College capitalizes buildings and improvements other than buildings with a cost greater than or equal to $5,000. Library materials for the academic or research libraries are capitalized as a collection and are valued at cost. The university capitalizes intangible assets with a cost greater than or equal to $50,000 except for internally generated computer software which is capitalized at a cost of $100,000 or greater. Richard Bland College capitalizes intangible assets with a cost greater than or equal to $20,000. Depreciation is computed using the straight-line method over the estimated useful lives of the respective assets as follows: Buildings 40-50 years Infrastructure 10-50 years Equipment 2-30 years Library Books 10 years Intangible Assets – computer software 3-20 years Collections of works of art and historical treasures are capitalized at cost or acquisition value at the date of donation. These collections, which include rare books, are considered inexhaustible and therefore are not depreciated. Deferred Outflows of Resources Deferred outflows of resources are defined as the consumption of net assets applicable to a future reporting period. The deferred outflows of resources have a positive effect on net position similar to assets. Unearned Revenue Unearned revenue represents revenue collected but not earned as of June 30, 2020. This is primarily comprised of revenue for student tuition and fees paid in advance of the semester, amounts received from grant and contract sponsors that have not yet been earned and advance ticket sales for athletic events. Compensated Absences Employees’ compensated absences are accrued when earned. The liability and expense incurred are recorded at year-end as accrued compensated absences in the Statement of Net Position, and as a component of compensation and benefit expense in the Statement of Revenues, Expenses, and Changes in Net Position. The applicable share of employer related taxes payable on the eventual termination payments is also included. Noncurrent Liabilities Noncurrent liabilities include principal amounts of bonds payable, notes payable, capital lease payable and installment purchase agreements with contractual maturities greater than one year as well as estimated amounts for accrued compensated absences that will not be paid within the next fiscal year. Also included is pension liability for defined benefit plans and other postemployment benefits administered through the Virginia Retirement System and other postemployment benefits administered through the Department of Human Resource Management. Pensions The Virginia Retirement System (VRS) State Employee Retirement Plan and the Virginia Law Officers’ System (VaLORS) Retirement Plan are single-employer pension plans that are treated like cost-sharing plans. For the purposes of measuring the net pension liability, deferred outflows of resources and deferred inflows of resources related to pensions, pension expense, information about the fiduciary net position of the VRS State Employee Retirement Plan and the VaLORS Retirement Plan, as well as the additions to/deductions from the VRS State Retirement Plan’s and the VaLORS Retirements Plan’s net fiduciary position have been determined on the same basis as they were reported by VRS. For this purpose, benefit payments (including refunds of employee contributions) are recognized when due and payable in accordance with the benefit terms. Investments are reported at fair value.
22
Other Postemployment Benefits The Virginia Retirement System (VRS) Group Life Insurance Program is a multiple-employer, cost-sharing plan. It provides coverage to state employees, teachers, and employees of participating political subdivisions. For purposes of measuring the net Group Life Insurance Program OPEB liability, deferred outflows of resources, deferred inflows of resources and OPEB expense, information about the fiduciary net position of the Virginia Retirement System (VRS) Group Life Insurance program OPEB and the additions to/deductions from the VRS Group Life Insurance Program OPEB’s net fiduciary position have been determined on the same basis as they were reported by VRS. In addition, benefit payments are recognized when due and payable in accordance with the benefit terms. Investments are reported at fair value. The Virginia Retirement System (VRS) State Employee Health Insurance Credit Program is a single-employer plan that is presented as a multiple-employer, cost-sharing plan. For purposes of measuring the net State Employee Health Insurance Credit Program OPEB liability, deferred outflows of resources, deferred inflows of resources and OPEB expense, information about the fiduciary net position of the Virginia Retirement System (VRS) State Employee Health Insurance Credit Program and the additions to/deductions from the VRS State Employee Health Insurance Credit Program’s net fiduciary position have been determined on the same basis as they were reported by VRS. For this purpose, benefit payments are recognized when due and payable in accordance with the benefit terms. Investments are reported at fair value. The Virginia Retirement System (VRS) Disability Insurance Program (Virginia Sickness and Disability Program) is a single-employer plan that is presented as a multiple-employer, cost-sharing plan. For purposes of measuring the net Disability Insurance Program OPEB liability (asset), deferred outflows of resources, deferred inflows of resources and OPEB expense, information about the fiduciary net position of the Virginia Retirement System (VRS) Disability Insurance Program OPEB Plan and the additions to/deductions from the VRS Disability Insurance Program OPEB Plan’s net fiduciary position have been determined on the same basis as they were reported by VRS. In addition, benefit payments are recognized when due and payable in accordance with the benefit terms. Investments are reported at fair value. The Virginia Retirement System (VRS) Line of Duty Act Program (LODA) is a multiple-employer, cost-sharing plan. For purposes of measuring the net Line of Duty Act Program OPEB liability, deferred outflows of resources, deferred inflows of resources and OPEB expense, information about the fiduciary net position of the Virginia Retirement System (VRS) Line of Duty Act Program OPEB Plan and the additions to/deductions from the VRS Line of Duty Act Program OPEB Plan’s net fiduciary position have been determined on the same basis as they were reported by VRS. In addition, benefit payments are recognized when due and payable in accordance with the benefit terms. Investments are reported at fair value. Pre-Medicare Retiree Healthcare is a single-employer defined benefit OPEB plan that is treated like a cost-sharing plan for financial reporting purposes and is administered by the Department of Human Resource Management. The employer does not pay a portion of the retirees’ healthcare premium; however, since both active employees and retirees are included in the same pool for purposes of determining health insurance rates, this generally results in a higher rate for active employees. Therefore, the employer effectively subsidizes the costs of the participating retirees’ healthcare through payment of the employer’s portion of the premiums for active employees. Deferred Inflows of Resources Deferred inflows of resources are defined as the acquisition of net assets applicable to a future reporting period. The deferred inflows of resources have a negative effect on net position similar to liabilities. Net Position The university and college’s net position is classified as follows:
Net Investment in Capital Assets – consists of total investment in capital assets, net of accumulated

23
depreciation and outstanding debt obligations. Restricted Net Position – Nonexpendable – includes endowments and similar type assets whose use is limited by donors or other outside sources and as a condition of the gift, the principal is to be maintained in perpetuity. Restricted Net Position – Expendable – represents funds that have been received for specific purposes and the university and college are legally or contractually obligated to spend the resources in accordance with restrictions imposed by external parties. Unrestricted Net Position – represents resources derived from student tuition and fees, state appropriations, unrestricted gifts, interest income, and sales and services of educational departments and auxiliary enterprises. When an expense is incurred that can be paid using either restricted or unrestricted resources, the university and college’s policy is to first apply the expense toward restricted resources and then toward unrestricted.
Scholarship Allowances Student tuition and fee revenues and certain other revenues from charges to students are reported net of scholarship allowances in the Statement of Revenues, Expenses, and Changes in Net Position. Scholarship allowances are the difference between the actual charge for goods and services provided by the university and college, and the amount that is paid by students and/or third parties on the students’ behalf. Financial aid to students is reported in the financial statements under the alternative method as prescribed by the National Association of College and University Business Officers (NACUBO). The alternative method is a simple calculation that computes scholarship discounts and allowances on a university-wide basis by allocating the cash payments to students, excluding payments for services, on the ratio of total aid to the aid not considered to be third party aid. Student financial assistance grants and other Federal, State or nongovernmental programs are recorded as either operating or non-operating revenues in the accompanying Statement of Revenues, Expenses, and Changes in Net Position. To the extent that revenues from these programs are used to satisfy tuition, fees, and other charges, the university and college have recorded a scholarship allowance. Federal Financial Assistance Programs The university and college participate in federally funded Pell Grants, Supplemental Educational Opportunity Grants (SEOG), Federal Work Study, Perkins Loans, and Direct Loans, which includes Stafford Loans, Parent Loans for Undergraduate Students (PLUS) and Graduate PLUS Loans. Federal programs are audited in accordance with 2 CFR 200, subpart F. Classification of Revenues and Expenses The university and college present revenues and expenses as operating or non-operating based on the following criteria:
Operating revenues - includes activities that have the characteristics of exchange transactions, such as (1) student tuition and fees, net of scholarship allowances, (2) sales and services of auxiliary enterprises, (3) most Federal, State and Local grants and contracts and (4) interest on student loans. Non-operating revenues - includes activities that have the characteristics of non-exchange transactions, such as gifts and contributions, and other revenue sources that are defined as non-operating revenues by GASB Statement No. 9, and GASB Statement No. 34, such as State appropriations and investment income.
Operating and Non-operating expenses - includes interest on debt related to the purchase of capital assets and losses on the disposal of capital assets. All other expenses are classified as operating expenses.
24
2. RESTATEMENT OF NET POSITION There were no restatements to net position reported in the university’s financial statements as of June 30, 2019. 3. CASH, CASH EQUIVALENTS AND INVESTMENTS Cash and Cash Equivalents Pursuant to Section 2.2-1800, et. seq., Code of Virginia, all state funds of the university and college are maintained by the Treasurer of Virginia, who is responsible for the collection, disbursement, custody and investment of State funds. Cash held by the university and college is maintained in accounts that are collateralized in accordance with the Virginia Securities for Public Deposits Act, Section 2.2-4400, et. seq. Code of Virginia with the exception of cash held by the university and college in foreign currency, when applicable. The Virginia Security for Public Deposits Act eliminates any custodial credit risk for the university and college. The university has cash equivalents with the Virginia State Non-Arbitrage Program (SNAP). SNAP offers a professionally managed money market mutual fund, which provides a temporary pooled investment vehicle for proceeds pending expenditure, and with record keeping, depository and arbitrage rebate calculations. SNAP complies with all standards of GASB Statement 79. SNAP investments are reported using the net asset value per share, which is calculated on an amortized cost basis that provides a NAV per share that approximates fair value. Investments The investment policy of the university and college is established by the Board of Visitors and monitored by the Board’s Financial Affairs Committee. In accordance with the Board of Visitors' Resolution 21, September 25-27, 2019, investments can be made in the following instruments: cash, U.S. Treasury and Federal agency obligations, commercial bank certificates of deposit, commercial paper, bankers' acceptances, corporate notes and debentures, money market funds, mutual funds, convertible securities and equities. Money market funds are cash equivalents and are presented at amortized cost. Credit Risk Credit risk is the risk that an issuer or other counterparty to an investment will not fulfill its obligations. GASB Statement No. 40, Deposit and Investment Risk Disclosures, requires the disclosure of the credit quality rating on any investments subject to credit risk. Concentration of Credit Risk Concentration of credit risk requires the disclosure by amount and issuer of any investments in any one issuer that represents five percent or more of total investments. Investments explicitly guaranteed by the U.S. government and investments in mutual funds or external investment pools and other pooled investments are excluded from this requirement. The university and college’s investment policy does not limit the amount invested in U.S. Government or Agency Securities. As of June 30, 2020, the university had 6.12% of its total investments in the Federal National Mortgage Association and 5.06% in the Federal Home Loan Mortgage Corporation. Custodial Credit Risk Custodial credit risk is the risk that, in the event of failure of the counterparty, the university and college will not be able to recover the value of its investment or collateral securities that are in the possession of the outside party. All investments are registered and held in the name of the university and college, and therefore, the university and college do not have this risk. Interest Rate Risk Interest rate risk is the risk that changes in interest rates will adversely affect the fair value of an investment. The
25
university and college limit their exposure to interest rate risk by limiting their maximum maturity lengths of investments and structuring its portfolio to maintain adequate liquidity to ensure the university and college’s ability to meet their operating requirements. Foreign Currency Risk Foreign currency risk is the risk that changes in exchange rates will adversely affect the fair value of an investment or a deposit. The university had no investments in foreign currency or foreign deposits as of June 30, 2020. The university does not have a foreign currency risk policy. Fair Value Measurement Certain assets and liabilities of the university and college are reflected in the accompanying financial statements at fair value. The university and college follow the provisions in GASB Statement 72, Fair Value Measurement and Application. Fair value is the price that would be received to sell an asset or paid to transfer a liability in an orderly transaction between market participants at the measurement date (an exit price). GASB 72 establishes a fair value hierarchy and specifies that the valuation techniques used to measure fair value shall maximize the use of observable inputs and minimize the use of unobservable inputs. Accordingly, the fair value hierarchy gives the highest priority to quoted prices (unadjusted) in active markets for identical assets or liabilities (Level 1) and the lowest priority to unobservable inputs (Level 3). The three levels of the fair value hierarchy under GASB 72 are described below:
Level 1—Quoted prices (unadjusted) in active markets for identical assets or liabilities that the university and college have the ability to access at the measurement date.
Level 2—Quoted prices for similar assets or liabilities in active markets, quoted prices for identical or similar assets or liabilities in inactive markets, or inputs other than quoted prices that are observable (directly or indirectly) for the asset or liability.
Level 3—Prices, inputs or sophisticated modeling techniques, which are both significant to the fair value measurement and unobservable (supported by little or no market activity).
As required by GASB 72, assets and liabilities are classified within the level of the lowest significant input considered in determining fair value.
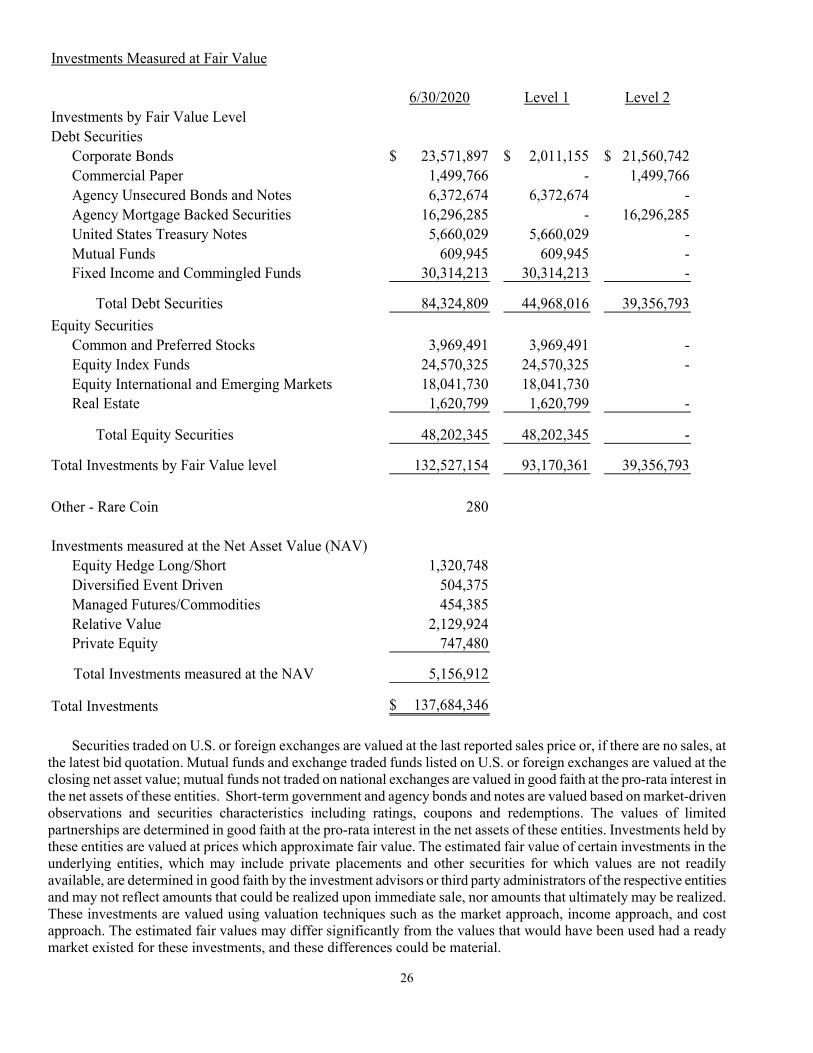
GASB 72 permits a governmental unit to establish the fair value of investments in non-governmental entities that do not have a readily determinable fair value by using the Net Asset Value (“NAV”) per share (or its equivalent), such as member units or an ownership interest in partners’ capital. The university and college use the NAV or its equivalent as provided by the investment funds to value its investments in certain limited partnerships. Investments valued using the NAV or its equivalent are not categorized within the fair value hierarchy. The university and college categorize fair value measurements within the fair value hierarchy established by generally accepted accounting principles. The following table presents investments as of June 30, 2020:
26
Investments Measured at Fair Value
6/30/2020 Level 1 Level 2Investments by Fair Value LevelDebt Securities
Corporate Bonds 23,571,897$ 2,011,155$ 21,560,742$ Commercial Paper 1,499,766 - 1,499,766 Agency Unsecured Bonds and Notes 6,372,674 6,372,674 - Agency Mortgage Backed Securities 16,296,285 - 16,296,285 United States Treasury Notes 5,660,029 5,660,029 - Mutual Funds 609,945 609,945 - Fixed Income and Commingled Funds 30,314,213 30,314,213 -
Total Debt Securities 84,324,809 44,968,016 39,356,793
Equity SecuritiesCommon and Preferred Stocks 3,969,491 3,969,491 - Equity Index Funds 24,570,325 24,570,325 - Equity International and Emerging Markets 18,041,730 18,041,730 Real Estate 1,620,799 1,620,799 -
Total Equity Securities 48,202,345 48,202,345 -
Total Investments by Fair Value level 132,527,154 93,170,361 39,356,793
Other - Rare Coin 280
Investments measured at the Net Asset Value (NAV)Equity Hedge Long/Short 1,320,748 Diversified Event Driven 504,375 Managed Futures/Commodities 454,385 Relative Value 2,129,924 Private Equity 747,480
Total Investments measured at the NAV 5,156,912
Total Investments 137,684,346$
Securities traded on U.S. or foreign exchanges are valued at the last reported sales price or, if there are no sales, at the latest bid quotation. Mutual funds and exchange traded funds listed on U.S. or foreign exchanges are valued at the closing net asset value; mutual funds not traded on national exchanges are valued in good faith at the pro-rata interest in the net assets of these entities. Short-term government and agency bonds and notes are valued based on market-driven observations and securities characteristics including ratings, coupons and redemptions. The values of limited partnerships are determined in good faith at the pro-rata interest in the net assets of these entities. Investments held by these entities are valued at prices which approximate fair value. The estimated fair value of certain investments in the underlying entities, which may include private placements and other securities for which values are not readily available, are determined in good faith by the investment advisors or third party administrators of the respective entities and may not reflect amounts that could be realized upon immediate sale, nor amounts that ultimately may be realized. These investments are valued using valuation techniques such as the market approach, income approach, and cost approach. The estimated fair values may differ significantly from the values that would have been used had a ready market existed for these investments, and these differences could be material.

27
The following table summarizes liquidity provisions related to the university and college’s investments measured at Net Asset Value:
Investments Measured at NAVUnfunded Redemption Redemption
Fair Value Commitments Frequency Notice Period
Equity Hedge Long/Short 1,320,748$ -$ Monthly, Quarterly 35-95 daysDiversified Event Driven 504,375 - Quarterly 95 daysManaged Futures/Commodities 454,385 - Monthly 10 daysRelative Value 2,069,583 - Quarterly, Semi-Annual 65-100 daysRelative Value 60,341 - LiquidatingPrivate Equity 747,480 2,097,922 Illiquid
Total Investments measured at NAV 5,156,912$ 2,097,922$
Interest Rate Risk: Maturities
GreaterType of Investment June 30, 2020 Less than 1 year 1-5 years 6-10 years than 10 years
Agency unsecured bonds and notes:Federal Home Loan Bank 2,249,843$ 2,249,843$ -$ -$ -$ Federal Home Loan Mortgage Corp 1,207,716 1,207,716 - - - Federal National Mortgage Assn 2,915,115 1,658,877 1,256,238 - - United States Treasury Notes 5,660,029 4,004,461 1,655,568 - -
Agency mortgage backed securities:Federal Home Loan Mortgage Corp 8,033,225 11,091 4,760,953 3,261,181 - Federal National Mortgage Assn 8,263,060 - 2,343,455 5,919,605 -
Commercial Paper 1,499,766 1,499,766 - - - Corporate Bonds 23,571,897 13,045,435 10,526,462 - - Fixed Income and Commingled Funds 30,314,213 - 2,039,312 18,162,965 10,111,936 Mutual and money market funds:
Money market 11,133,363 11,133,363 - - - Mutual funds - Green Funds 229,079 - - 229,079 - Mutual funds - Wells Fargo 380,866 - 380,866 - -
State non-arbitrage program 33,626,919 33,626,919 - - -
129,085,091$ 68,437,471$ 22,962,854$ 27,572,830$ 10,111,936$

28
Credit & Concentration of Credit Risks
Moody's S&P Credit Fitch
June 30, 2020 Credit Rating Rating Credit Rating Unrated
Cash EquivalentsMoney market - AAA 11,133,363$ -$ 11,133,363$ -$ -$ Commercial Paper 1,499,766 - - - 1,499,766 State non-arbitrage program - AAAm 33,626,919 - 33,626,919 - - Securities lending 137,182 - - - 137,182
Total cash equivalents 46,397,230 - 44,760,282 - 1,636,948
InvestmentsAgency unsecured bonds and notes:
Federal Home Loan Bank 2,249,843$ -$ -$ -$ 2,249,843$ Federal Home Loan Mortgage Corp - AA+ 1,207,716 - 1,207,716 - - Federal National Mortgage Assn - AA+ 2,915,115 - 2,915,115 - -
Agency mortgage backed securities:Federal Home Loan Mortgage Corp 8,033,225 - - - 8,033,225 Federal National Mortgage Assn 8,263,060 - - - 8,263,060
Corporate Bonds:AA 620,775 - 620,775 - - AA- 151,901 - 151,901 - - A+ 2,637,496 - 2,637,496 - - A 8,489,078 - 6,499,038 1,990,040 - A2 1,301,804 1,301,804 - - - A3 4,112,685 4,112,685 - - - A- 6,258,158 - 6,258,158 - -
Fixed Income and Commingled Funds 30,314,213 - - 30,314,213 Mutual funds:
Green Funds AA 36,290 - 36,290 - - A 79,288 - 79,288 - - BBB 113,501 - 113,501 - - Wells Fargo 380,866 - - - 380,866
Total investments 77,165,014$ 5,414,489$ 20,519,278$ 1,990,040$ 49,241,207$
Other InvestmentsEquity and other investments 59,022,686 Rare coins 280 Property held as investment for endowments 6,600
Total other investments 59,029,566
Total cash equivalents and investments 182,591,810$
29
4. DONOR RESTRICTED ENDOWMENTS Investments of the university’s endowment funds are pooled and consist primarily of gifts and bequests, the use of which is restricted by donor-imposed limitations. The Uniform Prudent Management of Institutional Funds Act, Code of Virginia Section 64.2-1100 et. seq., permits the spending policy adopted by the Board of Visitors to appropriate an amount of realized and unrealized endowment appreciation as the Board determines to be prudent. In determining the amount of appreciation to appropriate, the Board is required by the Act to consider such factors as long- and short-term needs of the institution, present and anticipated financial requirements, expected total return on investments, price level trends, and general economic conditions. The amount available for spending is determined by applying the payout percentage to the average market value of the investment portfolio for the three previous calendar year-ends. The payout percentage is reviewed and adjusted annually as deemed prudent.
William & Mary, at FY20 year-end, had a net appreciation of $13,070,061 which is available to be spent and is reported in the Statement of Net Position in the following categories: Restricted Expendable for Scholarships and Fellowships - $7,070,173, Restricted Expendable for Departmental Uses - $4,834,375 and Unrestricted - $1,165,513. The amount for Research was reclassified to Unrestricted because the total net position for Restricted Expendable for Research was negative for the university. 5. ACCOUNTS AND NOTES RECEIVABLES
Receivables include transactions related to accounts and notes receivable and are shown net of allowance for doubtful accounts for the year ending June 30, 2020 as follows:
Accounts receivable consisted of the following at June 30, 2020:
Student Tuition and Fees 4,979,156$ Auxiliary Enterprises 453,007 Federal, State and Non-Governmental Grants & Contracts 7,468,829 Other Activities 3,820,789
Gross Receivables 16,721,781 Less: allowance for doubtful accounts (57,524)
Net Receivables 16,664,257$
Notes receivable consisted of the following at June 30, 2020:
Current portion: Federal student loans and promissory notes 340,042$
Non-current portion: Federal student loans and promissory notes 1,293,979$ Less: allowance for doubtful accounts (77,180)
Net non-current notes receivable 1,216,799$
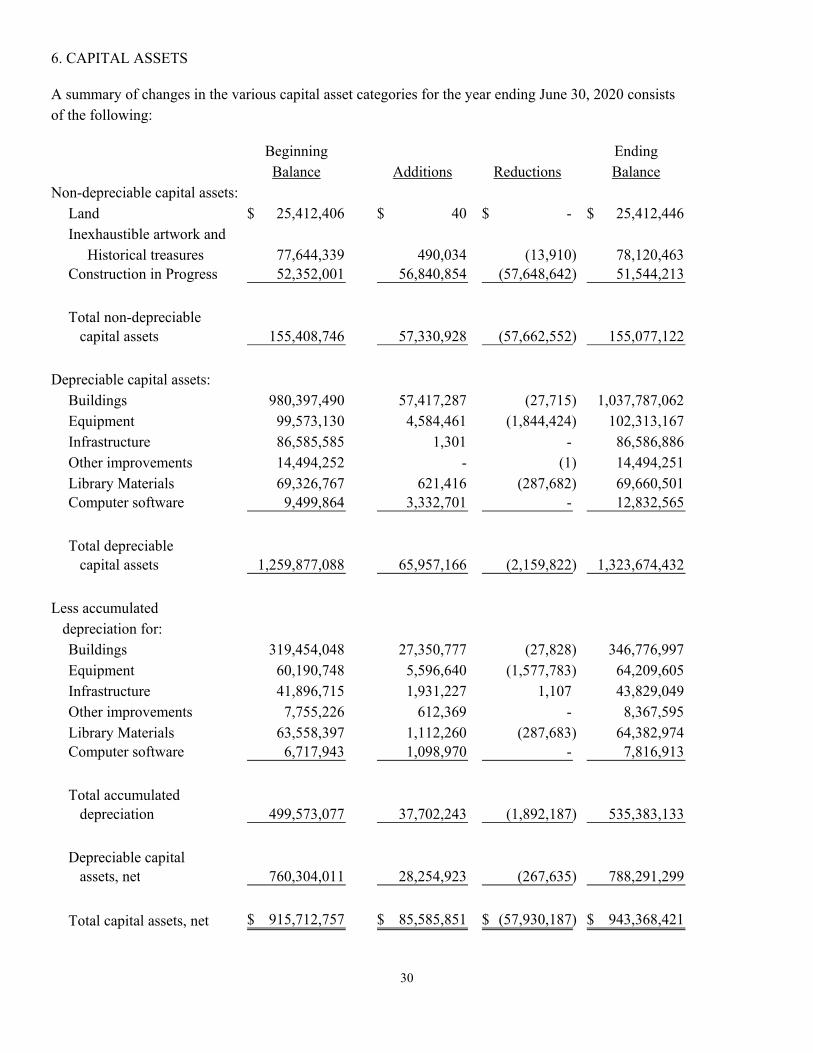
30
6. CAPITAL ASSETS
A summary of changes in the various capital asset categories for the year ending June 30, 2020 consistsof the following:
Beginning EndingBalance Additions Reductions Balance
Non-depreciable capital assets:Land 25,412,406$ 40$ -$ 25,412,446$ Inexhaustible artwork and Historical treasures 77,644,339 490,034 (13,910) 78,120,463 Construction in Progress 52,352,001 56,840,854 (57,648,642) 51,544,213
Total non-depreciable capital assets 155,408,746 57,330,928 (57,662,552) 155,077,122
Depreciable capital assets:Buildings 980,397,490 57,417,287 (27,715) 1,037,787,062 Equipment 99,573,130 4,584,461 (1,844,424) 102,313,167 Infrastructure 86,585,585 1,301 - 86,586,886 Other improvements 14,494,252 - (1) 14,494,251 Library Materials 69,326,767 621,416 (287,682) 69,660,501 Computer software 9,499,864 3,332,701 - 12,832,565
Total depreciable capital assets 1,259,877,088 65,957,166 (2,159,822) 1,323,674,432
Less accumulated depreciation for:
Buildings 319,454,048 27,350,777 (27,828) 346,776,997 Equipment 60,190,748 5,596,640 (1,577,783) 64,209,605 Infrastructure 41,896,715 1,931,227 1,107 43,829,049 Other improvements 7,755,226 612,369 - 8,367,595 Library Materials 63,558,397 1,112,260 (287,683) 64,382,974 Computer software 6,717,943 1,098,970 - 7,816,913
Total accumulated depreciation 499,573,077 37,702,243 (1,892,187) 535,383,133
Depreciable capital assets, net 760,304,011 28,254,923 (267,635) 788,291,299
Total capital assets, net 915,712,757$ 85,585,851$ (57,930,187)$ 943,368,421$

31
Capitalization of Library Books The methods employed to value the general collections of W&M’s Earl Gregg Swem Library, W&M’s Marshall-Wythe Law Library, VIMS’ Hargis Library, and RBC’s Library are based on average cost determined by each library. The average cost of the Swem Library purchases of books was $46.57 for FY20. The average cost of the Law Library purchases of books was $142.50 for FY20. Special collections maintained by each library are valued at historical cost or acquisition value. The average cost of library books purchased for VIMS was $83.81 for FY20. The average cost of library books purchased for RBC was $27.81 for FY20. The changes reflected in the valuation are due to the recognition of depreciation in accordance with GASB Statements No. 34 and 35, as well as purchases, donations and disposals.
7. ACCOUNTS PAYABLE AND ACCRUED EXPENSES Accounts payable and accrued expenses consisted of the following at June 30, 2020:
Current Liabilities:
Employee salaries, wages, and fringe benefits payable 29,118,243$ Vendors and supplies accounts payable 5,472,679 Capital projects accounts and retainage payable 8,609,958 Accrued interest payable 2,582,712
Total current liabilities-accounts payable and accrued liabilities 45,783,592$
8. COMMITMENTS At June 30, 2020, outstanding construction commitments totaled approximately $204,440,654. Commitments also exist under various operating leases for buildings, equipment and computer software. In general, the leases are for one to three year terms with renewal options on the buildings, equipment and certain computer software for additional one-year terms. In most cases, these leases will be replaced by similar leases. Rental expense for the fiscal year ending June 30, 2020, was $4,312,133. As of June 30, 2020, the following total future minimum rental payments are due under the above leases:
Year Ending June 30, 2020 Amount
2021 3,281,700$ 2022 2,410,451 2023 2,144,817 2024 335,243
Total 8,172,211$
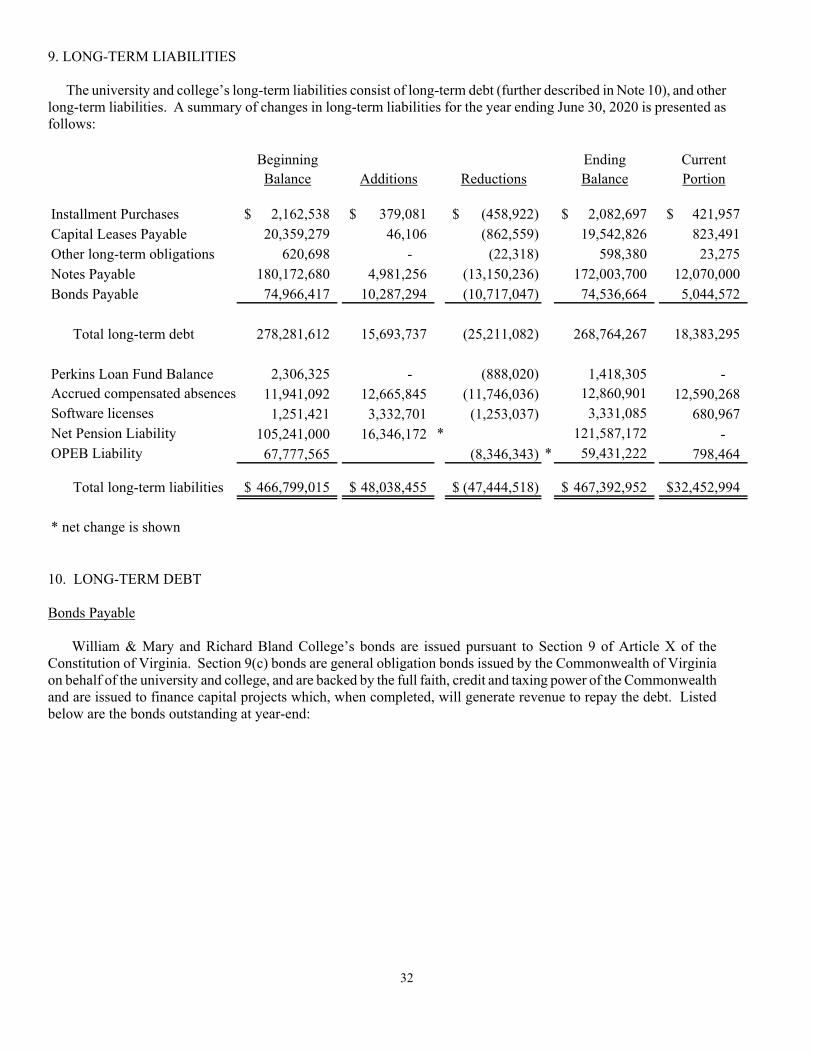
32
9. LONG-TERM LIABILITIES The university and college’s long-term liabilities consist of long-term debt (further described in Note 10), and other long-term liabilities. A summary of changes in long-term liabilities for the year ending June 30, 2020 is presented as follows:
Beginning Ending CurrentBalance Additions Reductions Balance Portion
Installment Purchases 2,162,538$ 379,081$ (458,922)$ 2,082,697$ 421,957$ Capital Leases Payable 20,359,279 46,106 (862,559) 19,542,826 823,491 Other long-term obligations 620,698 - (22,318) 598,380 23,275 Notes Payable 180,172,680 4,981,256 (13,150,236) 172,003,700 12,070,000 Bonds Payable 74,966,417 10,287,294 (10,717,047) 74,536,664 5,044,572
Total long-term debt 278,281,612 15,693,737 (25,211,082) 268,764,267 18,383,295
Perkins Loan Fund Balance 2,306,325 - (888,020) 1,418,305 - Accrued compensated absences 11,941,092 12,665,845 (11,746,036) 12,860,901 12,590,268 Software licenses 1,251,421 3,332,701 (1,253,037) 3,331,085 680,967 Net Pension Liability 105,241,000 16,346,172 * 121,587,172 - OPEB Liability 67,777,565 (8,346,343) * 59,431,222 798,464
Total long-term liabilities 466,799,015$ 48,038,455$ (47,444,518)$ 467,392,952$ 32,452,994$
* net change is shown 10. LONG-TERM DEBT Bonds Payable William & Mary and Richard Bland College’s bonds are issued pursuant to Section 9 of Article X of the Constitution of Virginia. Section 9(c) bonds are general obligation bonds issued by the Commonwealth of Virginia on behalf of the university and college, and are backed by the full faith, credit and taxing power of the Commonwealth and are issued to finance capital projects which, when completed, will generate revenue to repay the debt. Listed below are the bonds outstanding at year-end:

33
Interest Fiscal year Balance as of
Description Rates (%) Maturity June 30, 2020
Section 9(c) bonds payable:
Renovate Residence Halls, Series 2010A2 3.150 - 4.400 2030 2,525,000$ Dormitory, Series 2012A 5.000 2024 779,720 Dormitory, Series 2013A 2.000 - 5.000 2033 3,420,000 Dormitory, Series 2013B 4.000 2026 844,462 Dormitory, Series 2014A 3.000 - 5.000 2034 7,090,000 Dormitory, Series 2015A 3.000 - 5.000 2035 9,120,000
Dormitory, Series 2018A 3.000 - 5.000 2038 12,625,000
Dormitory, Series 2019A 2.000 - 5.000 2039 4,725,000 Dormitory, Series 2019B 5.000 2022 1,590,000
Renovation of Dormitories 42,719,182
Graduate Housing, Series 2013B 4.000 2026 1,200,361
Graduate Housing, Series 2015B 5.000 2028 1,243,951 Graduate Housing, Series 2019B 5.000 2022 510,000
Graduate Housing 2,954,312
Construct New Dormitory, Series 2010A2 3.150 - 4.400 2030 1,150,000 Construct New Dormitory, Series 2011A 2.700 - 5.000 2031 9,565,000 Construct New Dormitory, Series 2013A 2.000 - 5.000 2033 6,440,000
Construct New Dormitory 17,155,000
Renovate Commons Dining Hall, Series 2012A 5.000 2024 1,289,537 Renovate Commons Dining Hall, Series 2013B 4.000 2026 1,389,450 Renovate Commons Dining Hall, Series 2019B 5.000 2022 1,065,000
Commons Dining Hall 3,743,987
RBC Student Housing Conversion 2016A 3.000 - 5.000 2036 2,200,000
Total bonds payable 68,772,481 Net unamortized premiums (discounts) 5,764,183
Net bonds payable 74,536,664$
Notes Payable Section 9(d) bonds, issued through the Virginia College Building Authority’s Pooled Bond Program, are backed by pledges against the general revenues of William & Mary and Richard Bland College and are issued to finance other capital projects. The principal and interest on bonds and notes are secured by the net income of specific auxiliary activities or from designated fee allocations. The following are notes outstanding at year-end:

34
OutstandingInterest Fiscal year Balance as of
Description Rates (%) Maturity June 30, 2020
Section 9(d) Bonds:Barksdale Dormitory, Series 2010B 5.000 2021 120,000$ Barksdale Dormitory, Series 2012A 5.000 2024 365,000 Barksdale Dormitory, Series 2012A 3.000 - 5.000 2025 3,630,000 Barksdale Dormitory, Series 2012A 3.000 - 5.000 2025 4,235,000 Barksdale Dormitory, Series 2014B 4.000 2026 980,000 Barksdale Dormitory, Series 2014B 5.000 2024 445,000 Barksdale Dormitory, Series 2016A 3.000 2027 375,000
Barksdale Dormitory 10,150,000
Parking Deck, Series 2010B 5.000 2021 255,000 Parking Deck, Series 2012A 5.000 2024 770,000 Parking Deck, Series 2012A 3.000 - 5.000 2025 780,000 Parking Deck, Series 2012A 3.000 - 5.000 2025 2,100,000 Parking Deck, Series 2014B 4.000 2026 485,000
Parking Deck 4,390,000
Recreation Sports Center, Series 2010B 5.000 2021 60,000 Recreation Sports Center, Series 2012A 5.000 2024 180,000 Recreation Sports Center, Series 2012A 3.000 - 5.000 2025 2,575,000 Recreation Sports Center, Series 2012A 3.000 - 5.000 2025 820,000 Recreation Sports Center, Series 2014B 4.000 2026 190,000
Recreation Sports Center 3,825,000
Improve Athletics Facilities, Series 2012A 3.000 - 5.000 2025 1,105,000 Improve Athletics Facilities, Series 2014B 4.000 2026 260,000 Improve Athletics Facilities, Series 2014B 5.000 2024 170,000 Improve Athletics Facilities, Series 2016A 3.000 2027 150,000 Improve Athletics Facilities II, Series 2013A&B 3.000 - 5.000 2034 1,250,000 Improve Athletics Facilities II, Series 2017A 2.125 - 5.000 2038 2,000,000 Improve Athletics Facilities, Series 2019A 5.000 2030 4,180,000
Improve Athletics Facilities 9,115,000
Law School Library, Series 2010B 5.000 2021 70,000 Law School Library, Series 2012A 5.000 2024 220,000 Law School Library, Series 2014B 4.000 - 5.000 2026 1,290,000 Law School Renovations, Series 2013A&B 3.000 - 5.000 2034 5,295,000 Law School Library, Series 2016A 3.000 - 5.000 2028 525,000
Law School Library 7,400,000
Magnet Facility, Series 2010B 5.000 2021 155,000 Magnet Facility, Series 2012A 5.000 2024 455,000
Magnet Facility 610,000

35
Outstanding
Interest Fiscal year Balance as ofDescription Rates (%) Maturity June 30, 2020
School of Business, Series 2014B 4.000 - 5.000 2026 8,315,000 School of Business, Series 2016A 3.000 - 5.000 2028 3,425,000
School of Business 11,740,000
Integrated Science Center, Series 2009A 3.250 2021 15,000 Integrated Science Center, Series 2014B 4.000 - 5.000 2026 4,360,000 Integrated Science Center, Series 2015B 3.000 - 5.000 2029 3,755,000 Integrated Science Center, Series 2016A 3.000 - 5.000 2028 1,800,000
Integrated Science Center 9,930,000
Cooling Plant & Utilities, Series 2010A1&A2 4.000 - 5.500 2031 7,090,000 Cooling Plant & Utilities, Series 2016A 3.000 - 5.000 2030 7,360,000
Cooling Plant & Utilities 14,450,000
Power Plant Renovations, Series 2014B 4.000 - 5.000 2026 1,715,000 Power Plant Renovations, Series 2016A 3.000 - 5.000 2028 700,000
Power Plant Renovations 2,415,000
Busch Field Astroturf Replacement, Series 2016A 3.000 - 5.000 2030 860,000
Improve Aux Facilities Project 2017A 2.125 - 5.000 2038 7,505,000
West Utilities Plant 2017A 2.125 - 5.000 2038 12,940,000
Williamsburg Hospital/School of Education 2014B 5.000 2024 560,000 Williamsburg Hospital/School of Education, 2016A 3.000 2027 470,000
Williamsburg Hospital/School of Education 1,030,000
J. Laycock Football Facility, Series 2014B 5.000 2024 1,285,000 J. Laycock Football Facility, Series 2016A 3.000 2027 1,100,000
J. Laycock Football Facility 2,385,000
Residence Hall Fire Safety Systems, Series 2014B 5.000 2024 450,000 Residence Hall Fire Safety Systems, Series 2016A 3.000 2027 375,000
Residence Hall Fire Safety Systems 825,000
Ash Lawn-Highland Barn, Series 2010A1&A2 4.000 - 5.500 2031 495,000
Expand Sadler Center, Series 2012B 3.000 - 5.000 2033 5,360,000 Expand Sadler Center, Series 2013A&B 3.000 - 5.000 2034 785,000 Sadler Center West, Series 2018A&B 4.000 - 5.000 2039 23,840,000
Sadler Center 29,985,000

36
OutstandingInterest Fiscal year Balance as of
Description Rates (%) Maturity June 30, 2020
One Tribe Place, Series 2013A&B 3.000 - 5.000 2034 17,935,000
Integrative Wellness Center 2015A 3.000 - 5.000 2036 8,330,000
RBC Student Housing Conversion 2017A 2.125 - 5.000 2038 1,490,000
Total 9(d) bonds 157,805,000 Net unamortized premiums (discounts) 14,198,700
Net notes payable 172,003,700$
Installment Purchases
At June 30, 2020, installment purchases consist of the current and long-term portions of obligations resulting from
various contracts used to finance energy performance contracts and the acquisition of equipment. The lengths of purchase agreements range from five to fifteen years, and the interest rate charges are from 1.61 to 4.70 percent. The outstanding balance of William & Mary’s Energy Conservation Program installment purchase as of June 30, 2020 is $41,910. Under the terms of this agreement, the university may not dispose of any item of the equipment without prior written consent of lessor, notwithstanding the fact that proceeds constitute a part of the equipment. The university has agreed to provide insurance in the amount of full replacement cost of the equipment against the risk of any direct physical loss or damage to the equipment as well as comprehensive general liability insurance. Prepayments cannot be made unless the university shall have given lessor not less than thirty days’ prior notice. In the event of default, the lessor may retake possession of the equipment or items thereof.
VIMS has three outstanding installment purchases; one for energy efficient equipment, one for video conferencing
equipment and one for research equipment. All of these are sub-contracts of the Commonwealth’s MELP (Master Equipment Leasing Program). For these agreements, The Commonwealth of Virginia is the lessee. The amount outstanding at June 30, 2020 is $1,473,979. RBC has an outstanding installment purchase which was used to finance energy efficient equipment. This is also a
sub-contract of the Commonwealth’s MELP (Master Equipment Leasing Program). The amount outstanding at June 30, 2020 is $566,808. Capital Leases Richard Bland College (RBC) has entered into a thirty year capital lease with Richard Bland College Foundation (RBCF) for the provision of a student housing complex with two dormitories on the RBC campus. RBC has accounted for the acquisition of the complex and its furniture and equipment as a capital lease, and therefore has recorded the facility and furnishings as depreciable capital assets and has also recorded a corresponding lease liability in long-term debt on the Statement of Net Position. The RBC student housing complex is included in depreciable capital assets in the amount of $24,148,380. Accumulated amortization on the assets acquired under the capital lease is included with depreciation expense in the Statement of Revenues, Expenses and Changes in Net Position. The outstanding balance of the lease liability as of June 30, 2020 is $19,347,616. RBC has also recorded an Other Long-Term Obligation which is payable to RBCF for repayment of the bonds for the dormitories for the amount due on the bonds which is greater than the total fair value of assets received. The outstanding balance as of June 30, 2020 is $598,380. William & Mary has entered into capital lease agreements for the purchase of printers and copiers. The outstanding balance of these agreements as of June 30, 2020 is $195,210.
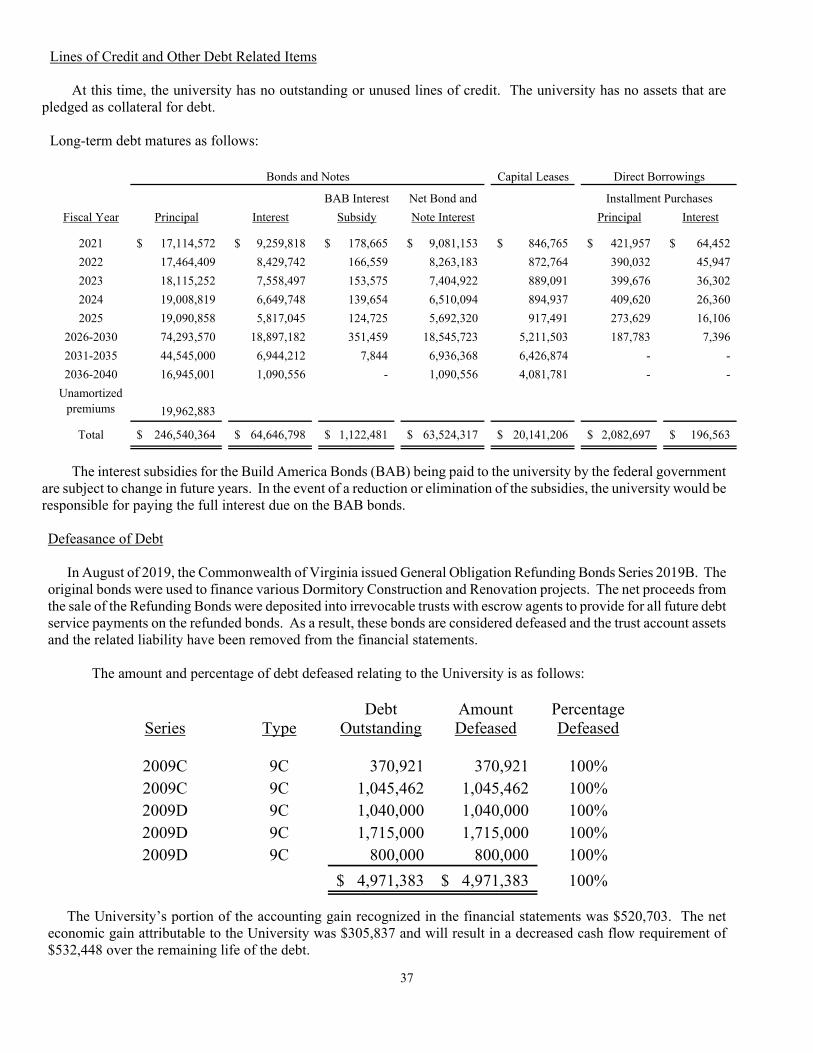
37
Lines of Credit and Other Debt Related Items At this time, the university has no outstanding or unused lines of credit. The university has no assets that are
pledged as collateral for debt. Long-term debt matures as follows:
Capital Leases
BAB Interest Net Bond and
Fiscal Year Principal Interest Subsidy Note Interest Principal Interest
2021 17,114,572$ 9,259,818$ 178,665$ 9,081,153$ 846,765$ 421,957$ 64,452$
2022 17,464,409 8,429,742 166,559 8,263,183 872,764 390,032 45,947
2023 18,115,252 7,558,497 153,575 7,404,922 889,091 399,676 36,302
2024 19,008,819 6,649,748 139,654 6,510,094 894,937 409,620 26,360
2025 19,090,858 5,817,045 124,725 5,692,320 917,491 273,629 16,106
2026-2030 74,293,570 18,897,182 351,459 18,545,723 5,211,503 187,783 7,396
2031-2035 44,545,000 6,944,212 7,844 6,936,368 6,426,874 - -
2036-2040 16,945,001 1,090,556 - 1,090,556 4,081,781 - -
Unamortized premiums 19,962,883
Total 246,540,364$ 64,646,798$ 1,122,481$ 63,524,317$ 20,141,206$ 2,082,697$ 196,563$
Bonds and Notes Direct Borrowings
Installment Purchases
The interest subsidies for the Build America Bonds (BAB) being paid to the university by the federal government are subject to change in future years. In the event of a reduction or elimination of the subsidies, the university would be responsible for paying the full interest due on the BAB bonds. Defeasance of Debt In August of 2019, the Commonwealth of Virginia issued General Obligation Refunding Bonds Series 2019B. The original bonds were used to finance various Dormitory Construction and Renovation projects. The net proceeds from the sale of the Refunding Bonds were deposited into irrevocable trusts with escrow agents to provide for all future debt service payments on the refunded bonds. As a result, these bonds are considered defeased and the trust account assets and the related liability have been removed from the financial statements. The amount and percentage of debt defeased relating to the University is as follows:
Debt Amount PercentageSeries Type Outstanding Defeased Defeased
2009C 9C 370,921 370,921 100%2009C 9C 1,045,462 1,045,462 100%2009D 9C 1,040,000 1,040,000 100%2009D 9C 1,715,000 1,715,000 100%2009D 9C 800,000 800,000 100%
4,971,383$ 4,971,383$ 100%
The University’s portion of the accounting gain recognized in the financial statements was $520,703. The net economic gain attributable to the University was $305,837 and will result in a decreased cash flow requirement of $532,448 over the remaining life of the debt.

38
11. EXPENSES BY NATURAL CLASSIFICATIONS The following table shows a classification of expenses both by function as listed in the Statement of Revenues, Expenses, and Change in Net Position and by natural classification which is the basis for amounts shown in the Statement of Cash Flow.
Salaries, Scholarships
Wages and Services and and Plant and
Fringe Benefits Supplies Fellowships Equipment Depreciation Total
Instruction 123,144,925 14,436,394 1,048,717 1,680,074 - 140,310,110
Research 40,402,086 13,723,301 411,477 1,111,307 - 55,648,171
Public service 7,340 49,435 - 6,062 - 62,837
Academic support 30,976,412 6,144,931 159,296 5,201,767 - 42,482,406
Student services 10,129,637 6,510,646 145,060 190,517 - 16,975,860
Institutional support 38,831,627 7,893,194 165,806 592,891 - 47,483,518
Operation and
maintenance of plant 6,058,142 20,300,200 - 2,960,717 - 29,319,059
Scholarships and
related expenses 3,271,253 64,980 16,670,249 5,000 - 20,011,482
Auxiliary enterprises 27,061,677 58,577,098 138,103 2,345,014 - 88,121,892
Depreciation - - - - 37,702,243 37,702,243
Other 220,106 4,716 - 694 - 225,516
Total 280,103,205 127,704,895 18,738,708 14,094,043 37,702,243 478,343,094
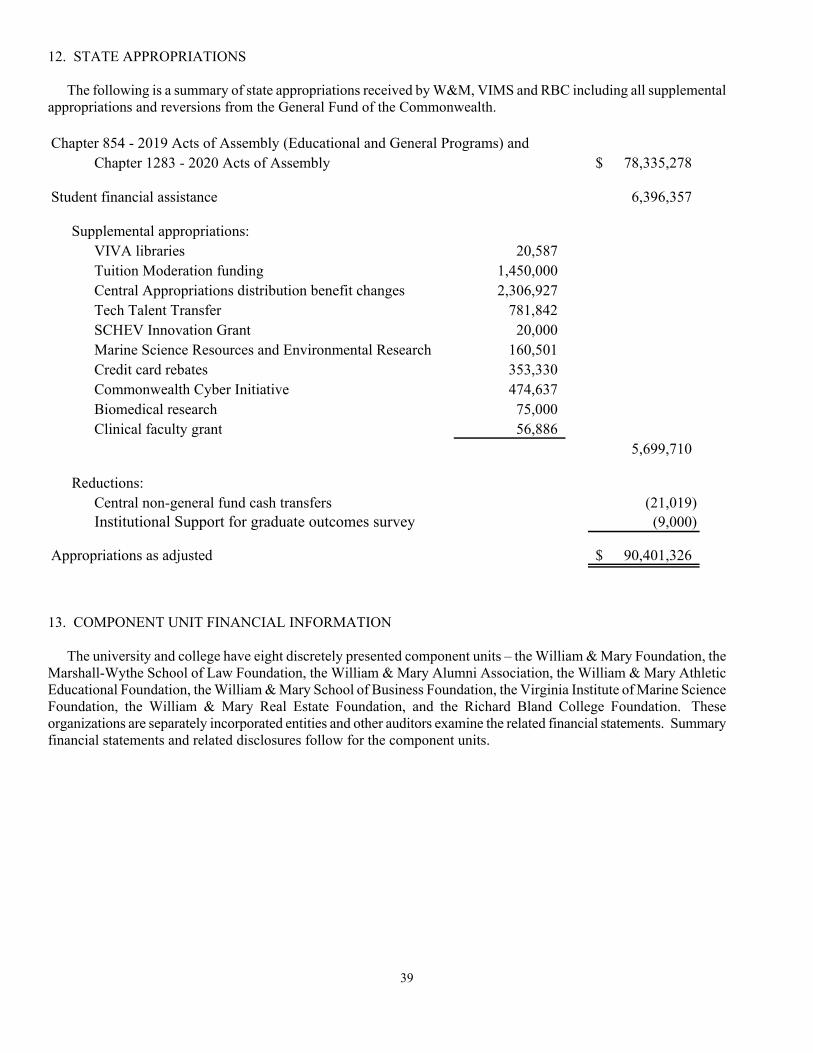
39
12. STATE APPROPRIATIONS The following is a summary of state appropriations received by W&M, VIMS and RBC including all supplemental appropriations and reversions from the General Fund of the Commonwealth. Chapter 854 - 2019 Acts of Assembly (Educational and General Programs) and
Chapter 1283 - 2020 Acts of Assembly 78,335,278$
Student financial assistance 6,396,357
Supplemental appropriations:VIVA libraries 20,587 Tuition Moderation funding 1,450,000 Central Appropriations distribution benefit changes 2,306,927 Tech Talent Transfer 781,842 SCHEV Innovation Grant 20,000 Marine Science Resources and Environmental Research 160,501 Credit card rebates 353,330 Commonwealth Cyber Initiative 474,637 Biomedical research 75,000 Clinical faculty grant 56,886
5,699,710
Reductions:Central non-general fund cash transfers (21,019) Institutional Support for graduate outcomes survey (9,000)
Appropriations as adjusted 90,401,326$
13. COMPONENT UNIT FINANCIAL INFORMATION The university and college have eight discretely presented component units – the William & Mary Foundation, the Marshall-Wythe School of Law Foundation, the William & Mary Alumni Association, the William & Mary Athletic Educational Foundation, the William & Mary School of Business Foundation, the Virginia Institute of Marine Science Foundation, the William & Mary Real Estate Foundation, and the Richard Bland College Foundation. These organizations are separately incorporated entities and other auditors examine the related financial statements. Summary financial statements and related disclosures follow for the component units.

40
Summary of Statement of Net Position - Component Units
William & Mary
Foundation
Marshall-Wythe
School of Law
Foundation
William & Mary
Business School
Foundation
William & Mary
Alumni Association
ASSETSCurrent assets
Cash and cash equivalents 22,553,547$ 735,557$ 5,370,815$ 483,939$ Investments 34,074,413 - 997,902 - Pledges receivable, net - current portion 10,654,215 1,103,787 896,188 50,860 Receivables, net 1,806,479 436 34,751 27,617 Inventories - - - 12,009 Prepaids 302,144 1,649 10,738 18,786 Due from the University 483,744 37,558 70,416 400 Other assets - - - - Total current assets 69,874,542 1,878,987 7,380,810 593,611
Non-current assetsRestricted cash and cash equivalents 934 4,033,255 10,220,755 - Restricted investments 354,135,513 41,313,945 52,260,442 712,680 Restricted other assets 155,327,722 510,336 1,338,931 - Investments 261,974,900 6,846,328 681,142 8,660,651 Pledges receivable, net 29,779,816 1,483,504 4,054,923 192,724 Capital assets, nondepreciable 9,485,671 325,127 - - Capital assets, net of accumulated depreciation 5,049,054 - 917 63,641 Due from the University - - - - Other assets 2,369,699 - - - Total non-current assets 818,123,309 54,512,495 68,557,110 9,629,696 Total assets 887,997,851 56,391,482 75,937,920 10,223,307
LIABILITIESCurrent liabilities
Accounts payable and accrued expenses 256,329 73,058 66,681 80,642 Deferred revenue 37,839 18,630 15,000 - Deposits held in custody for others 263,081 - 18,448 - Long-term liabilities - current portion 954,272 - - - Due to the University 372,709 - - - Due to other foundations 3,175 - - - Other liabilities - - - 29,423 Total current liabilities 1,887,405 91,688 100,129 110,065
Non-current liabilitiesOther long-term liabilities 452,528 179,386 - - Long-term liabilities 27,439,189 - - - Total liabilities 29,779,122 271,074 100,129 110,065
NET POSITIONNet investment in capital assets 5,312,730 325,127 917 63,641 Restricted for:
Nonexpendable: Scholarships and fellowships 151,858,465 10,683,469 4,899,594 - Research 10,884,272 - 1,037,500 - Loans - - 24,230 - Departmental uses 135,984,057 9,196,903 35,096,804 - Other 207,242,082 - 127,448 - Expendable: Scholarships and fellowships 97,816,701 9,587,926 2,455,090 - Research 7,766,055 - 300,852 - Capital projects 27,151,606 3,948,800 918,956 - Loans - - - - Departmental uses 131,975,267 14,119,357 25,956,856 905,404 Other 48,963,014 919,728 69,044 -
Unrestricted 33,264,480 7,339,098 4,950,500 9,144,197 Total net position 858,218,729$ 56,120,408$ 75,837,791$ 10,113,242$
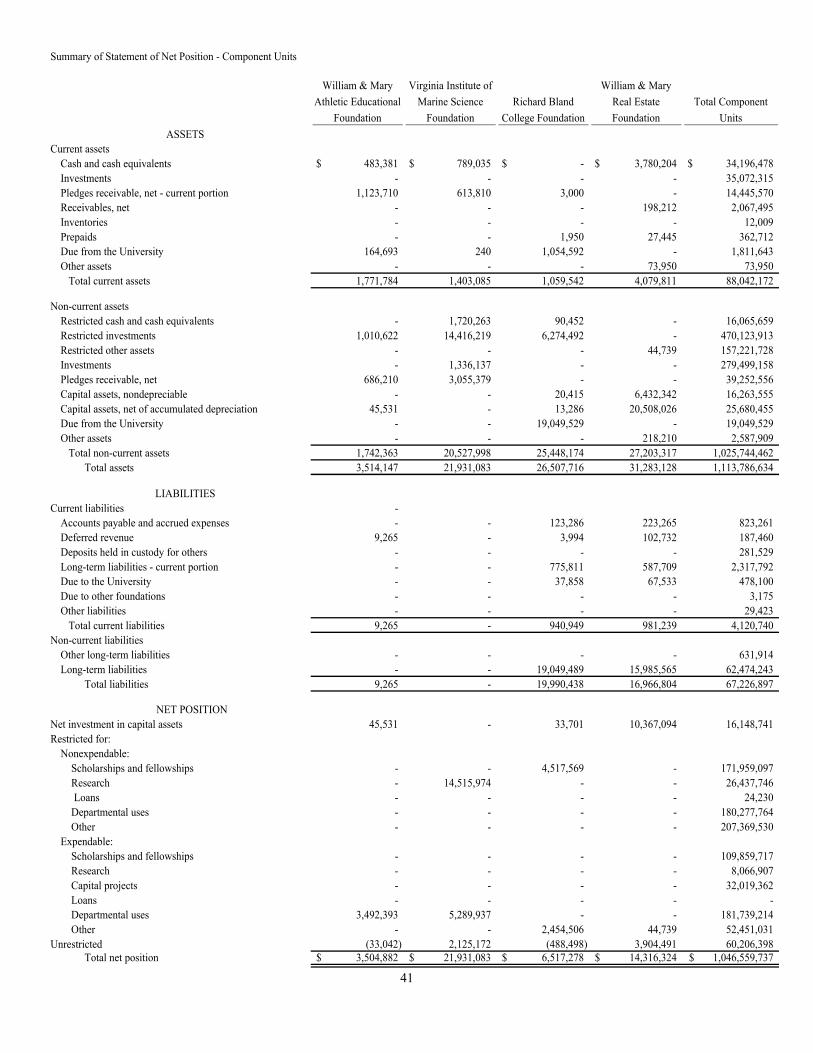
41
Summary of Statement of Net Position - Component Units
William & Mary
Athletic Educational
Foundation
Virginia Institute of
Marine Science
Foundation
Richard Bland
College Foundation
William & Mary
Real Estate
Foundation
Total Component
Units
ASSETSCurrent assets
Cash and cash equivalents 483,381$ 789,035$ -$ 3,780,204$ 34,196,478$ Investments - - - - 35,072,315 Pledges receivable, net - current portion 1,123,710 613,810 3,000 - 14,445,570 Receivables, net - - - 198,212 2,067,495 Inventories - - - - 12,009 Prepaids - - 1,950 27,445 362,712 Due from the University 164,693 240 1,054,592 - 1,811,643 Other assets - - - 73,950 73,950 Total current assets 1,771,784 1,403,085 1,059,542 4,079,811 88,042,172
Non-current assetsRestricted cash and cash equivalents - 1,720,263 90,452 - 16,065,659 Restricted investments 1,010,622 14,416,219 6,274,492 - 470,123,913 Restricted other assets - - - 44,739 157,221,728 Investments - 1,336,137 - - 279,499,158 Pledges receivable, net 686,210 3,055,379 - - 39,252,556 Capital assets, nondepreciable - - 20,415 6,432,342 16,263,555 Capital assets, net of accumulated depreciation 45,531 - 13,286 20,508,026 25,680,455 Due from the University - - 19,049,529 - 19,049,529 Other assets - - - 218,210 2,587,909 Total non-current assets 1,742,363 20,527,998 25,448,174 27,203,317 1,025,744,462 Total assets 3,514,147 21,931,083 26,507,716 31,283,128 1,113,786,634
LIABILITIESCurrent liabilities -
Accounts payable and accrued expenses - - 123,286 223,265 823,261 Deferred revenue 9,265 - 3,994 102,732 187,460 Deposits held in custody for others - - - - 281,529 Long-term liabilities - current portion - - 775,811 587,709 2,317,792 Due to the University - - 37,858 67,533 478,100 Due to other foundations - - - - 3,175 Other liabilities - - - - 29,423 Total current liabilities 9,265 - 940,949 981,239 4,120,740
Non-current liabilitiesOther long-term liabilities - - - - 631,914 Long-term liabilities - - 19,049,489 15,985,565 62,474,243 Total liabilities 9,265 - 19,990,438 16,966,804 67,226,897
NET POSITIONNet investment in capital assets 45,531 - 33,701 10,367,094 16,148,741 Restricted for:
Nonexpendable: Scholarships and fellowships - - 4,517,569 - 171,959,097 Research - 14,515,974 - - 26,437,746 Loans - - - - 24,230 Departmental uses - - - - 180,277,764 Other - - - - 207,369,530 Expendable: Scholarships and fellowships - - - - 109,859,717 Research - - - - 8,066,907 Capital projects - - - - 32,019,362 Loans - - - - - Departmental uses 3,492,393 5,289,937 - - 181,739,214 Other - - 2,454,506 44,739 52,451,031
Unrestricted (33,042) 2,125,172 (488,498) 3,904,491 60,206,398 Total net position 3,504,882$ 21,931,083$ 6,517,278$ 14,316,324$ 1,046,559,737$

42
Summary of Statement of Revenues, Expenses, and Changes in Net Position - Component Units
William & Mary
Foundation
Marshall-Wythe
School of Law
Foundation
William & Mary
Business School
Foundation
William & Mary
Alumni Association
Operating revenues:Gifts and contributions 10,195,817$ 2,663,794$ 4,516,815$ 667,229$ Other 1,454,502 716,586 134,539 391,848
Total operating revenues 11,650,319 3,380,380 4,651,354 1,059,077
Operating expenses:Instruction 5,801,095 1,293,521 242,365 - Research 717,370 - 245,710 - Public service 36,734 7,225 287,114 - Academic support 2,857,187 686,073 177,983 - Student services 295,016 13,360 796,958 - Institutional support 8,388,029 482,125 2,316,259 92,445 Operation and maintenance of plant 18,212,841 705,725 - - Scholarships & fellowships 10,607,605 5,055,924 841,880 71,522 Auxiliary enterprises 1,215,138 - 22,294 - Depreciation 458,306 802 1,875 7,720 Hospitals - - - - Independent operations - - - - Other 1,835,754 - - 1,214,512
Total operating expenses 50,425,075 8,244,755 4,932,438 1,386,199
Operating gain/(loss) (38,774,756) (4,864,375) (281,084) (327,122)
Non-operating revenues and expenses:Net investment revenue (expense) (1,534,275) (9,344) 154,579 (148,230) Interest on capital asset related debt (304,439) - - - Other non-operating revenue 5,139,475 - - - Other non-operating expenses (18,586,482) - - -
Net non-operating revenues (15,285,721) (9,344) 154,579 (148,230)
Income before other revenues (54,060,477) (4,873,719) (126,505) (475,352)
Other revenues:Capital grants and contributions 35,649,392 - 579,036 - Additions to permanent endowments 18,993,955 2,106,344 2,239,776 -
Net other revenues 54,643,347 2,106,344 2,818,812 -
Change in net position, before transfers 582,870 (2,767,375) 2,692,307 (475,352)
(297,714) 6,500 - 282,467
Transfers (297,714) 6,500 - 282,467
Change in net position 285,156 (2,760,875) 2,692,307 (192,885)
Net position - beginning of year, restated 857,933,573 58,881,283 73,145,484 10,306,127
Net position - end of year 858,218,729$ 56,120,408$ 75,837,791$ 10,113,242$
Contribution between Foundations

43
Summary of Statement of Revenues, Expenses, and Changes in Net Position - Component Units
William & Mary
Athletic Educational
Foundation
Virginia Institute of
Marine Science
Foundation
Richard Bland
College Foundation
William & Mary Real
Estate Foundation
Total Component
Units
Operating revenues:Gifts and contributions 3,208,354$ 1,740,337$ 187,881$ 672,786$ 23,853,013$ Other 185,091 - 894,754 2,537,915 6,315,235
Total operating revenues 3,393,445 1,740,337 1,082,635 3,210,701 30,168,248
Operating expenses:Instruction - 74,205 - - 7,411,186 Research - 250,686 - - 1,213,766 Public service - 73,131 - - 404,204 Academic support - 40,113 - - 3,761,356 Student services - - - - 1,105,334 Institutional support 180,295 476,304 116,232 448,415 12,500,104 Operation and maintenance of plant - 11,167 - - 18,929,733 Scholarships & fellowships - 217,631 293,371 - 17,087,933 Auxiliary enterprises 5,911,304 - - 32,480 7,181,216 Depreciation 13,134 - - 497,790 979,627 Hospitals - - - - - Independent operations - - - 561,088 561,088 Other - 221,257 806,740 - 4,078,263
Total operating expenses 6,104,733 1,364,494 1,216,343 1,539,773 75,213,810
Operating gain/(loss) (2,711,288) 375,843 (133,708) 1,670,928 (45,045,562)
Non-operating revenues and expenses:Net investment revenue (expense) 60,357 (80,172) 175,020 4,035 (1,378,030) Interest on capital asset related debt - - - (490,523) (794,962) Other non-operating revenue - - - - 5,139,475 Other non-operating expenses - - - - (18,586,482)
Net non-operating revenues 60,357 (80,172) 175,020 (486,488) (15,619,999)
Income before other revenues (2,650,931) 295,671 41,312 1,184,440 (60,665,561)
Other revenues:Capital grants and contributions - - - - 36,228,428 Additions to permanent endowments - 500,931 - - 23,841,006
Net other revenues - 500,931 - - 60,069,434
Change in net position, before transfers (2,650,931) 796,602 41,312 1,184,440 (596,127)
(9,989) - - 18,736 -
Transfers (9,989) - - 18,736 -
Change in net position (2,660,920) 796,602 41,312 1,203,176 (596,127)
Net position - beginning of year, restated 6,165,802 21,134,481 6,475,966 13,113,148 1,047,155,864
Net position - end of year 3,504,882$ 21,931,083$ 6,517,278$ 14,316,324$ 1,046,559,737$
Contribution between Foundations

44
Investments
William &
Mary
Foundation
Marshall-
Wythe School
of Law
Foundation
William &
Mary
Business
School
Foundation
William &
Mary Alumni
Association
William &
Mary
Athletic
Educational
Foundation
Virginia
Institute of
Marine
Science
Foundation
Richard
Bland
College
Foundation Total
Certificatesof deposit -$ -$ 297,689$ -$ 999,274$ -$ -$ 1,296,963$
Mutual and moneymarket funds 4,911,784 - - 9,373,331 11,348 - 6,274,492 20,570,955
Corporate bonds - - 48,950 - - - - 48,950 U.S. treasury and
agency securities 36,320,366 1,276,358 4,606,512 - - - - 42,203,236 Common and
preferred stocks 138,632 - 876,149 - - - - 1,014,781 Notes
receivable 750,000 - - - - - - 750,000 Pooled
investments 606,741,533 46,883,915 47,212,847 - - 15,752,356 - 716,590,651 Real estate 987,982 - - - - - - 987,982 Other 334,529 - 897,339 - - - - 1,231,868
TotalInvestments 650,184,826$ 48,160,273$ 53,939,486$ 9,373,331$ 1,010,622$ 15,752,356$ 6,274,492$ 784,695,386$
Each component unit holds various investments based on the investment policies established by the governing board of the individual foundation. The following table shows the various investment types held by each component unit.
Pledges Receivable
William & Mary
Foundation
Marshall-
Wythe School
of Law
Foundation
William & Mary
Business School
Foundation
William &
Mary Alumni
Association
Foundation
William &
Mary Athletic
Educational
Foundation
Virginia
Institute of
Marine Science
Foundation
Richard Bland
College
Foundation Total
Total pledges receivable 43,799,728$ 2,769,142$ 5,016,550$ 243,584$ 1,983,792$ 3,950,598$ 3,000$ 57,766,394$ Less:
Allowance for uncollectibles (1,788,342) (130,262) (3,500) - (104,200) - - (2,026,304) Discounting to present value (1,577,355) (51,589) (61,939) - (69,672) (281,409) - (2,041,964)
Net pledges receivable 40,434,031 2,587,291 4,951,111 243,584 1,809,920 3,669,189 3,000 53,698,126 Less:
Current pledges receivable (10,654,215) (1,103,787) (896,188) (50,860) (1,123,710) (613,810) (3,000) (14,445,570)
Total non-current
pledges receivable 29,779,816$ 1,483,504$ 4,054,923$ 192,724$ 686,210$ 3,055,379$ -$ 39,252,556$
Unconditional promises to give (pledges) are recorded as receivables and revenues and are assigned net asset categories inaccordance with donor imposed restrictions. Pledges expected to be collected within one year are recorded at net realizable value.Pledges that are expected to be collected in future years are recorded at net present value of their estimated future cash flows. Thediscounts on these amounts are computed using risk free interest rates applicable to the years in which the payments will be received.The foundations record an allowance against pledges receivable for estimated uncollectible amounts. The William & Mary Real EstateFoundation did not have any pledges receivable at year end.

45
Capital Assets
William &
Mary
Foundation
Marshall-
Wythe School
of Law
Foundation
William &
Mary
Business
School
Foundation
William &
Mary Alumni
Association
William &
Mary Athletic
Educational
Foundation
Richard Bland
College
Foundation
William &
Mary Real
Estate
Foundation Total
Nondepreciable:Land 3,365,927$ 262,916$ -$ -$ -$ 5,500$ 6,432,342$ 10,066,685$ Construction in
progress - - - - - - - - Historical treasures
and inexhaustableworks of art 6,119,744 62,211 - - - 14,915 - 6,196,870
Total nondepreciablecapital assets 9,485,671$ 325,127$ -$ -$ -$ 20,415$ 6,432,342$ 16,263,555$
Depreciable:Building 7,431,415$ 378,914$ -$ -$ 23,015,844$ 30,826,173$ Equipment, vehicles
and furniture 7,395,369 84,722 1,310 337,767 65,672 18,000 380,869 8,283,709 Improvements,
other than building 338,138 - - - - - - 338,138
15,164,922 84,722 1,310 716,681 65,672 18,000 23,396,713 39,448,020 Less accumulated
depreciation (10,115,868) (84,722) (393) (653,040) (20,141) (4,714) (2,888,687) (13,767,565)
Total depreciablecapital assets 5,049,054$ -$ 917$ 63,641$ 45,531$ 13,286$ 20,508,026$ 25,680,455$
Long-term Liabilities
William & Mary
Foundation
Richard Bland
College
Foundation
William & Mary
Real Estate
Foundation Total
Compensated absences 456,583$ -$ -$ 456,583$ Notes payable 325,003 - 12,932,599 13,257,602 Bonds payable 8,077,177 19,825,300 3,640,675 31,543,152 Trust & Annuity Obligations 2,798,094 - - 2,798,094 Other liabilities 16,736,604 - - 16,736,604
Total long-term liabilities 28,393,461 19,825,300 16,573,274 64,792,035
Less current portion 954,272 775,811 587,709 2,317,792
Total long-term liabilities 27,439,189$ 19,049,489$ 15,985,565$ 62,474,243$

46
WILLIAM & MARY FOUNDATION Long-term Liabilities
During the fiscal year ended June 30, 2009, the Foundation entered into a borrowing arrangement with Truist Bank (formerly SunTrust Bank) in the amount of $2,636,140 for renovation of the university’s Admissions Office. The terms of the loan were revised during the fiscal year ended June 30, 2011. Under the revised terms, interest accrues at a rate of 4.99% and is payable monthly. Principal is payable annually over a ten-year term, with the final amount due on February 1, 2021. Truist Bank is granted a security interest in all deposits and investments maintained with Truist and any of its affiliates. The terms of the note require the Foundation to maintain at all times net assets without donor restrictions and net assets restricted by the donor due to the passage of time or for a specified purpose and subject to the Foundation’s spending policy and appropriation in excess of 200% of the Foundation’s total funded debt. The balance outstanding at June 30, 2020 and 2019 was $325,003 and $634,560, respectively. The balance outstanding as of June 30, 2020 is due in the year ending June 30, 2021. Interest paid during the fiscal years ended June 30, 2020 and 2019, on the loans was $25,713 and $40,891, respectively. The Foundation and its affiliates are in compliance with all debt covenants. Bonds Payable In December 2011, the Economic Development Authority of James City County, Virginia (“Authority”) issued a revenue refunding bond in the amount of $8,090,000 (“Series 2011 Bond”), and loaned the proceeds to the Foundation and College of William & Mary Foundation Ventures (“Obligors”). The Series 2011 Bond was acquired by Truist Bank, as Series 2011 Bondholder. Proceeds from sale of the Series 2011 Bond were used to redeem bonds issued in December 2006 by the Authority to finance the cost of property acquisition, construction and equipping of a three-story building in New Town in James City County, Virginia, for use by the Foundation, CWMF Ventures or the university. The Series 2011 Bond bore interest at a fixed rate of 2.96% per annum through December 31, 2017. As of January 1, 2018, the series 2011 Bond bears interest at a fixed rate of 3.59752% per annum, subject to the put rights of the Series 2011 Bondholder. The Series 2011 Bondholder has the option to tender the Series 2011 Bond for payment on December 1, 2021, the first optional put date, unless extended under the terms of the loan agreement to not earlier than December 1, 2026. An additional extension may be made to not earlier than December 1, 2031. The final maturity date is December 1, 2036. The Obligors are required to maintain assets so that at all times, net assets without donor restrictions and net assets restricted by the donor due to the passage of time or for a specified purpose and subject to the Foundation’s spending policy and appropriation in excess of 200% of the total funded debt of the Obligors. The Foundation is in compliance with all bond covenants. The MARSHALL-WYTHE SCHOOL OF LAW FOUNDATION Law Library Bond Issuance The construction and renovations of the Wolf Law Library and Hixon Center at the Marshall-Wythe School of Law were funded by proceeds allocated to the Marshall-Wythe School of Law from William & Mary’s 2007A(9D) Bond Issue and the 2013 A&B(9d) Bond Issue (the “Bonds”). The Foundation makes principal and interest payments to the university on the Bonds using private contributions restricted for the Law Library and Hixon Center additions. However, the Bonds were issued to and in the name of the university, and the Foundation is not obligated to make these debt service payments. Bond payments made to the university totaled $705,725, including principal and interest, in 2020 and are included in management and general expenses on the Foundation’s statement of activities.
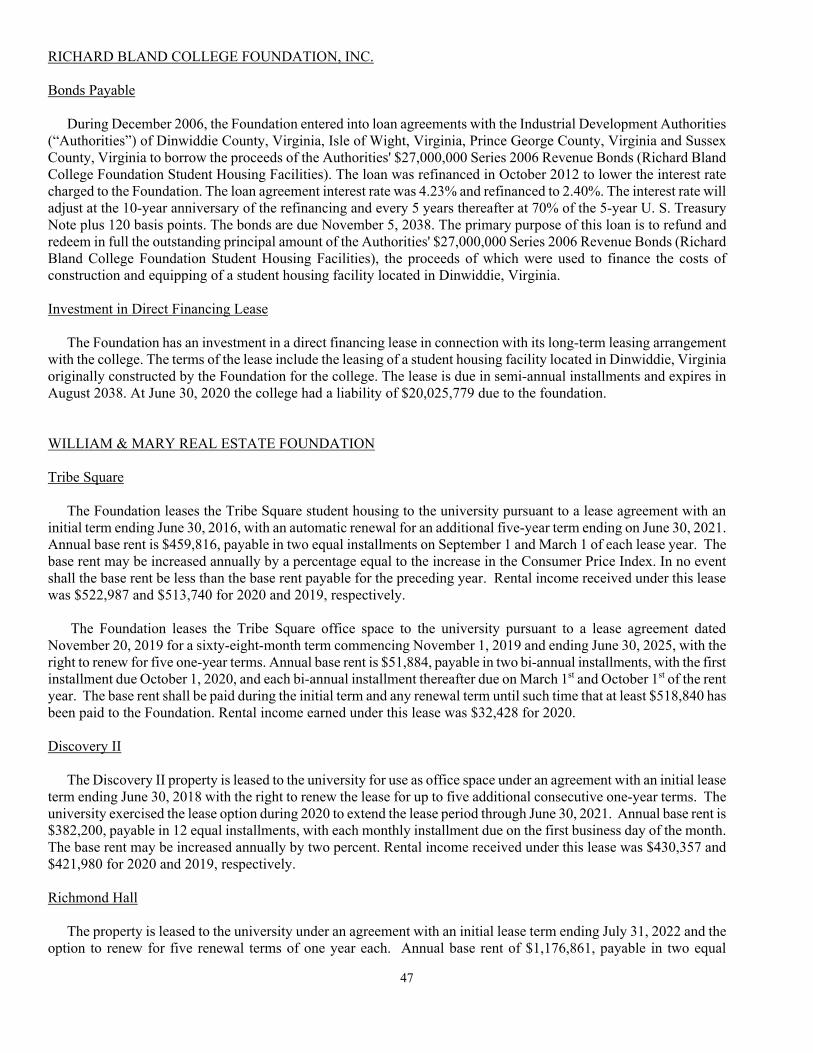
47
RICHARD BLAND COLLEGE FOUNDATION, INC. Bonds Payable During December 2006, the Foundation entered into loan agreements with the Industrial Development Authorities (“Authorities”) of Dinwiddie County, Virginia, Isle of Wight, Virginia, Prince George County, Virginia and Sussex County, Virginia to borrow the proceeds of the Authorities' $27,000,000 Series 2006 Revenue Bonds (Richard Bland College Foundation Student Housing Facilities). The loan was refinanced in October 2012 to lower the interest rate charged to the Foundation. The loan agreement interest rate was 4.23% and refinanced to 2.40%. The interest rate will adjust at the 10-year anniversary of the refinancing and every 5 years thereafter at 70% of the 5-year U. S. Treasury Note plus 120 basis points. The bonds are due November 5, 2038. The primary purpose of this loan is to refund and redeem in full the outstanding principal amount of the Authorities' $27,000,000 Series 2006 Revenue Bonds (Richard Bland College Foundation Student Housing Facilities), the proceeds of which were used to finance the costs of construction and equipping of a student housing facility located in Dinwiddie, Virginia. Investment in Direct Financing Lease The Foundation has an investment in a direct financing lease in connection with its long-term leasing arrangement with the college. The terms of the lease include the leasing of a student housing facility located in Dinwiddie, Virginia originally constructed by the Foundation for the college. The lease is due in semi-annual installments and expires in August 2038. At June 30, 2020 the college had a liability of $20,025,779 due to the foundation. WILLIAM & MARY REAL ESTATE FOUNDATION Tribe Square The Foundation leases the Tribe Square student housing to the university pursuant to a lease agreement with an initial term ending June 30, 2016, with an automatic renewal for an additional five-year term ending on June 30, 2021. Annual base rent is $459,816, payable in two equal installments on September 1 and March 1 of each lease year. The base rent may be increased annually by a percentage equal to the increase in the Consumer Price Index. In no event shall the base rent be less than the base rent payable for the preceding year. Rental income received under this lease was $522,987 and $513,740 for 2020 and 2019, respectively. The Foundation leases the Tribe Square office space to the university pursuant to a lease agreement dated November 20, 2019 for a sixty-eight-month term commencing November 1, 2019 and ending June 30, 2025, with the right to renew for five one-year terms. Annual base rent is $51,884, payable in two bi-annual installments, with the first installment due October 1, 2020, and each bi-annual installment thereafter due on March 1st and October 1st of the rent year. The base rent shall be paid during the initial term and any renewal term until such time that at least $518,840 has been paid to the Foundation. Rental income earned under this lease was $32,428 for 2020. Discovery II The Discovery II property is leased to the university for use as office space under an agreement with an initial lease term ending June 30, 2018 with the right to renew the lease for up to five additional consecutive one-year terms. The university exercised the lease option during 2020 to extend the lease period through June 30, 2021. Annual base rent is $382,200, payable in 12 equal installments, with each monthly installment due on the first business day of the month. The base rent may be increased annually by two percent. Rental income received under this lease was $430,357 and $421,980 for 2020 and 2019, respectively. Richmond Hall The property is leased to the university under an agreement with an initial lease term ending July 31, 2022 and the option to renew for five renewal terms of one year each. Annual base rent of $1,176,861, payable in two equal
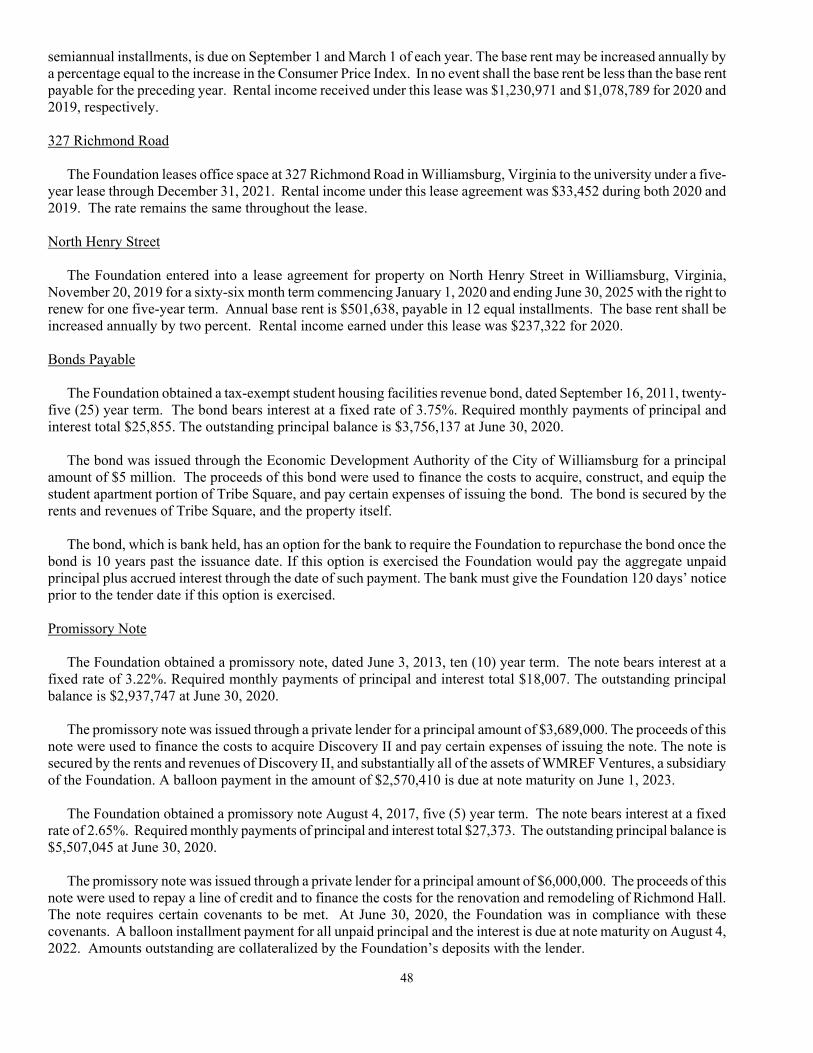
48
semiannual installments, is due on September 1 and March 1 of each year. The base rent may be increased annually by a percentage equal to the increase in the Consumer Price Index. In no event shall the base rent be less than the base rent payable for the preceding year. Rental income received under this lease was $1,230,971 and $1,078,789 for 2020 and 2019, respectively. 327 Richmond Road The Foundation leases office space at 327 Richmond Road in Williamsburg, Virginia to the university under a five-year lease through December 31, 2021. Rental income under this lease agreement was $33,452 during both 2020 and 2019. The rate remains the same throughout the lease. North Henry Street The Foundation entered into a lease agreement for property on North Henry Street in Williamsburg, Virginia, November 20, 2019 for a sixty-six month term commencing January 1, 2020 and ending June 30, 2025 with the right to renew for one five-year term. Annual base rent is $501,638, payable in 12 equal installments. The base rent shall be increased annually by two percent. Rental income earned under this lease was $237,322 for 2020. Bonds Payable The Foundation obtained a tax-exempt student housing facilities revenue bond, dated September 16, 2011, twenty-five (25) year term. The bond bears interest at a fixed rate of 3.75%. Required monthly payments of principal and interest total $25,855. The outstanding principal balance is $3,756,137 at June 30, 2020. The bond was issued through the Economic Development Authority of the City of Williamsburg for a principal amount of $5 million. The proceeds of this bond were used to finance the costs to acquire, construct, and equip the student apartment portion of Tribe Square, and pay certain expenses of issuing the bond. The bond is secured by the rents and revenues of Tribe Square, and the property itself. The bond, which is bank held, has an option for the bank to require the Foundation to repurchase the bond once the bond is 10 years past the issuance date. If this option is exercised the Foundation would pay the aggregate unpaid principal plus accrued interest through the date of such payment. The bank must give the Foundation 120 days’ notice prior to the tender date if this option is exercised. Promissory Note The Foundation obtained a promissory note, dated June 3, 2013, ten (10) year term. The note bears interest at a fixed rate of 3.22%. Required monthly payments of principal and interest total $18,007. The outstanding principal balance is $2,937,747 at June 30, 2020. The promissory note was issued through a private lender for a principal amount of $3,689,000. The proceeds of this note were used to finance the costs to acquire Discovery II and pay certain expenses of issuing the note. The note is secured by the rents and revenues of Discovery II, and substantially all of the assets of WMREF Ventures, a subsidiary of the Foundation. A balloon payment in the amount of $2,570,410 is due at note maturity on June 1, 2023. The Foundation obtained a promissory note August 4, 2017, five (5) year term. The note bears interest at a fixed rate of 2.65%. Required monthly payments of principal and interest total $27,373. The outstanding principal balance is $5,507,045 at June 30, 2020. The promissory note was issued through a private lender for a principal amount of $6,000,000. The proceeds of this note were used to repay a line of credit and to finance the costs for the renovation and remodeling of Richmond Hall. The note requires certain covenants to be met. At June 30, 2020, the Foundation was in compliance with these covenants. A balloon installment payment for all unpaid principal and the interest is due at note maturity on August 4, 2022. Amounts outstanding are collateralized by the Foundation’s deposits with the lender.
49
The Foundation obtained a promissory note dated November 19, 2019, ten (10) year term. The note bears interest at a fixed rate of 3.06%. Required monthly payments of interest total $21,537. The outstanding principal balance is $4,500,000 at June 30, 2020. The promissory note was issued through a private lender for a principal amount of $4,500,000. The proceeds of this note were used to finance the purchase of real property referred to as North Henry Street. This note required interest only payments through August 1, 2020. The note requires certain covenants to be met. At June 30, 2020, the Foundation was in compliance with these covenants. A balloon installment payment for all unpaid principal and interest is due at note maturity on August 1, 2030. Amounts outstanding are collateralized by real property and assignment of rents and leases. Significant activity between the university and component units Direct Payments to the university from the William & Mary Foundation, the Marshall-Wythe School of Law Foundation, the William & Mary Athletic Educational Foundation, and the William & Mary School of Business Foundation for the year ended June 30, 2020 totaled $39,142,160; $7,553,316; $5,541,847; and $4,186,480 respectively. This includes gift transfers, payments for facilities and payments for services. Direct payments from the university to the William & Mary Foundation for the year ended June 30, 2020 totaled $1,529,773 for services provided by College Enterprises Inc. and rent for facilities. 14. RETIREMENT PLANS Optional Retirement Plan Full-time faculty and certain administrative staff may participate in a retirement annuity program through various optional retirement plans other than the Virginia Retirement System. As of January 1, 2018 TIAA-CREF is the university’s plan administrator. Employees who became a member prior to January 1, 2018 have the option to choose either TIAA-CREF or Fidelity Investments as their investment provider. This is a fixed-contribution program where the retirement benefits received are based upon the employer's contributions of approximately 10.4 percent or 8.5 percent depending on whether the employee is in Plan 1 or Plan 2, plus interest and dividends. Plan 1 consists of employees who became a member prior to July 1, 2010. Plan 2 consists of employees who became a member on or after July 1, 2010 and are required to make a 5% contribution to their retirement account. Individual contracts issued under the plan provide for full and immediate vesting of contributions of William & Mary, including the Virginia Institute of Marine Science, and Richard Bland College and their employees. Total pension costs under this plan were $10,522,960 for the year ended June 30, 2020. Contributions to the optional retirement plans were calculated using the base salary amount of $110,402,107 for fiscal year 2020. William & Mary, which includes the Virginia Institute of Marine Science, and Richard Bland College's total payroll for fiscal year 2020 was $218,685,675. Deferred Compensation Employees of the university and college are employees of the Commonwealth of Virginia. State employees may participate in the Commonwealth’s Deferred Compensation Plan. Participating employees can contribute to the plan each pay period with the Commonwealth matching up to $20 per pay period. The dollar amount of the match can change depending on the funding available in the Commonwealth’s budget. The Deferred Compensation Plan is a qualified defined contribution plan under Section 401(a) of the Internal Revenue Code. Employer contributions under the Deferred Compensation Plan were approximately $744,065 for fiscal year 2020. General Information about the Pension Plan Plan Description
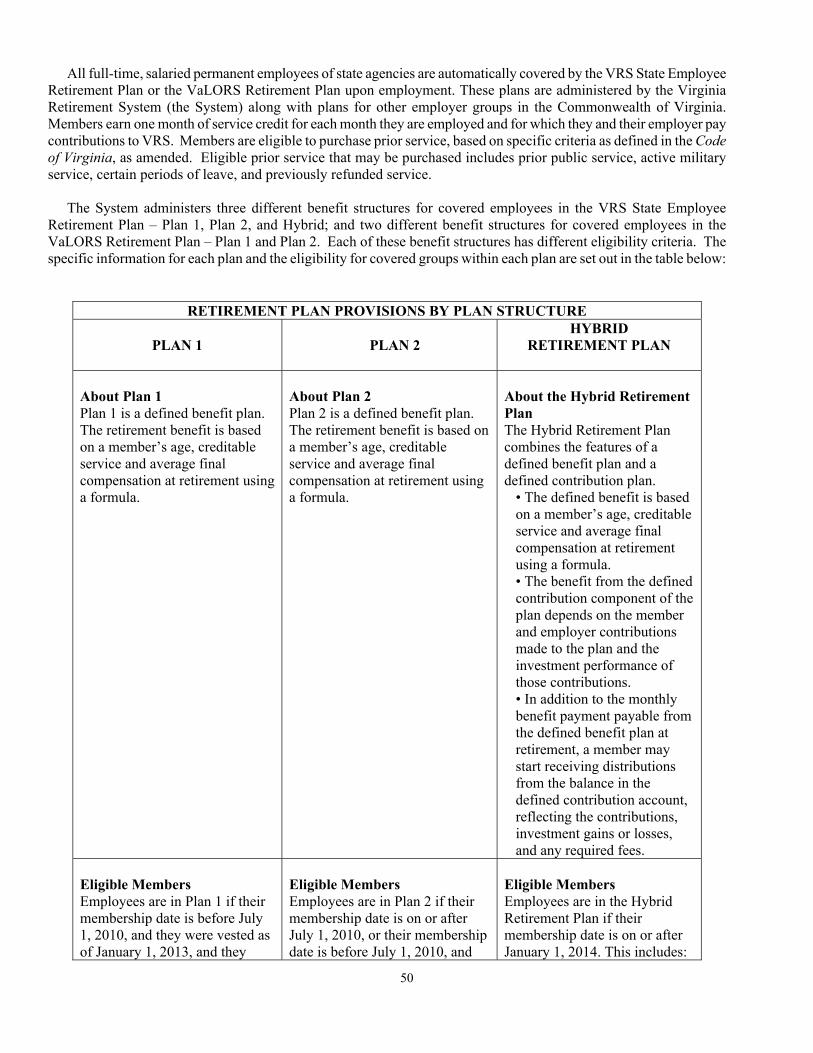
50
All full-time, salaried permanent employees of state agencies are automatically covered by the VRS State Employee Retirement Plan or the VaLORS Retirement Plan upon employment. These plans are administered by the Virginia Retirement System (the System) along with plans for other employer groups in the Commonwealth of Virginia. Members earn one month of service credit for each month they are employed and for which they and their employer pay contributions to VRS. Members are eligible to purchase prior service, based on specific criteria as defined in the Code of Virginia, as amended. Eligible prior service that may be purchased includes prior public service, active military service, certain periods of leave, and previously refunded service. The System administers three different benefit structures for covered employees in the VRS State Employee Retirement Plan – Plan 1, Plan 2, and Hybrid; and two different benefit structures for covered employees in the VaLORS Retirement Plan – Plan 1 and Plan 2. Each of these benefit structures has different eligibility criteria. The specific information for each plan and the eligibility for covered groups within each plan are set out in the table below:
RETIREMENT PLAN PROVISIONS BY PLAN STRUCTURE
PLAN 1
PLAN 2 HYBRID
RETIREMENT PLAN
About Plan 1 Plan 1 is a defined benefit plan. The retirement benefit is based on a member’s age, creditable service and average final compensation at retirement using a formula.
About Plan 2 Plan 2 is a defined benefit plan. The retirement benefit is based on a member’s age, creditable service and average final compensation at retirement using a formula.
About the Hybrid Retirement Plan The Hybrid Retirement Plan combines the features of a defined benefit plan and a defined contribution plan.
• The defined benefit is based on a member’s age, creditable service and average final compensation at retirement using a formula. • The benefit from the defined contribution component of the plan depends on the member and employer contributions made to the plan and the investment performance of those contributions. • In addition to the monthly benefit payment payable from the defined benefit plan at retirement, a member may start receiving distributions from the balance in the defined contribution account, reflecting the contributions, investment gains or losses, and any required fees.
Eligible Members Employees are in Plan 1 if their membership date is before July 1, 2010, and they were vested as of January 1, 2013, and they
Eligible Members Employees are in Plan 2 if their membership date is on or after July 1, 2010, or their membership date is before July 1, 2010, and
Eligible Members Employees are in the Hybrid Retirement Plan if their membership date is on or after January 1, 2014. This includes:
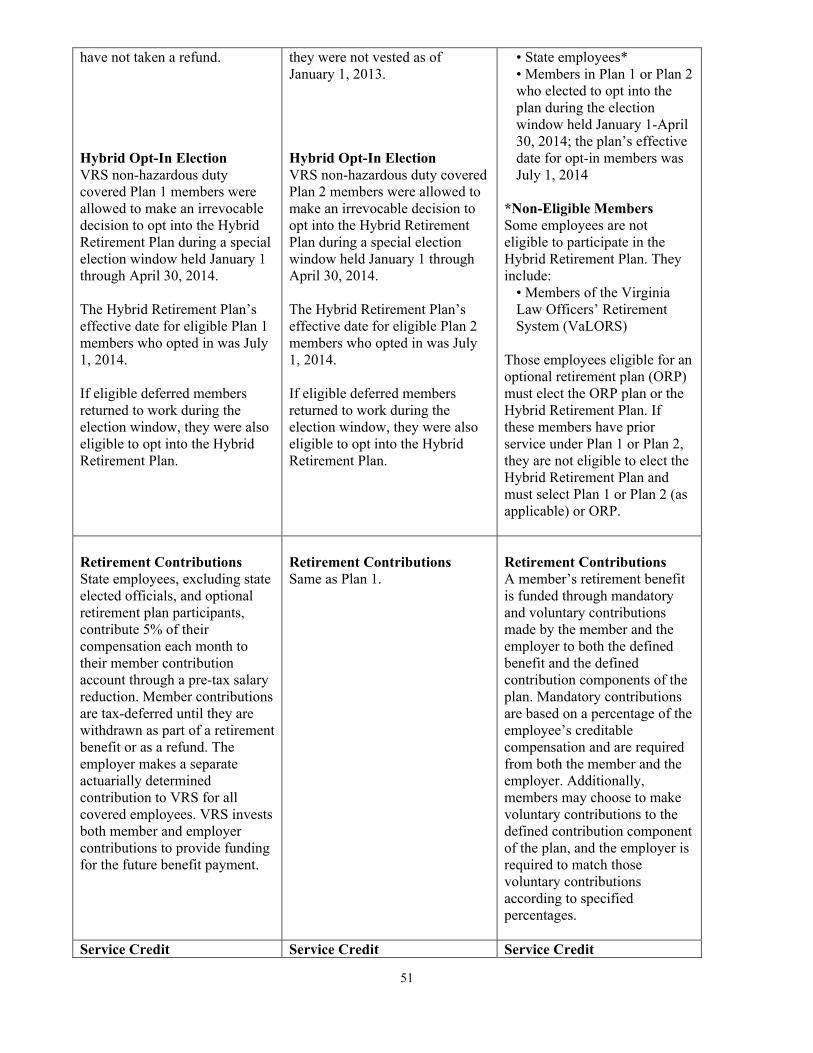
51
have not taken a refund. Hybrid Opt-In Election VRS non-hazardous duty covered Plan 1 members were allowed to make an irrevocable decision to opt into the Hybrid Retirement Plan during a special election window held January 1 through April 30, 2014. The Hybrid Retirement Plan’s effective date for eligible Plan 1 members who opted in was July 1, 2014. If eligible deferred members returned to work during the election window, they were also eligible to opt into the Hybrid Retirement Plan.
they were not vested as of January 1, 2013. Hybrid Opt-In Election VRS non-hazardous duty covered Plan 2 members were allowed to make an irrevocable decision to opt into the Hybrid Retirement Plan during a special election window held January 1 through April 30, 2014. The Hybrid Retirement Plan’s effective date for eligible Plan 2 members who opted in was July 1, 2014. If eligible deferred members returned to work during the election window, they were also eligible to opt into the Hybrid Retirement Plan.
• State employees* • Members in Plan 1 or Plan 2 who elected to opt into the plan during the election window held January 1-April 30, 2014; the plan’s effective date for opt-in members was July 1, 2014
*Non-Eligible Members Some employees are not eligible to participate in the Hybrid Retirement Plan. They include:
• Members of the Virginia Law Officers’ Retirement System (VaLORS)
Those employees eligible for an optional retirement plan (ORP) must elect the ORP plan or the Hybrid Retirement Plan. If these members have prior service under Plan 1 or Plan 2, they are not eligible to elect the Hybrid Retirement Plan and must select Plan 1 or Plan 2 (as applicable) or ORP.
Retirement Contributions State employees, excluding state elected officials, and optional retirement plan participants, contribute 5% of their compensation each month to their member contribution account through a pre-tax salary reduction. Member contributions are tax-deferred until they are withdrawn as part of a retirement benefit or as a refund. The employer makes a separate actuarially determined contribution to VRS for all covered employees. VRS invests both member and employer contributions to provide funding for the future benefit payment.
Retirement Contributions Same as Plan 1.
Retirement Contributions A member’s retirement benefit is funded through mandatory and voluntary contributions made by the member and the employer to both the defined benefit and the defined contribution components of the plan. Mandatory contributions are based on a percentage of the employee’s creditable compensation and are required from both the member and the employer. Additionally, members may choose to make voluntary contributions to the defined contribution component of the plan, and the employer is required to match those voluntary contributions according to specified percentages.
Service Credit Service Credit Service Credit

52
Service credit includes active service. Members earn service credit for each month they are employed in a covered position. It also may include credit for prior service the member has purchased or additional service credit the member was granted. A member’s total service credit is one of the factors used to determine their eligibility for retirement and to calculate their retirement benefit. It also may count toward eligibility for the health insurance credit in retirement, if the employer offers the health insurance credit.
Same as Plan 1. Defined Benefit Component: Under the defined benefit component of the plan, service credit includes active service. Members earn service credit for each month they are employed in a covered position. It also may include credit for prior service the member has purchased or additional service credit the member was granted. A member’s total service credit is one of the factors used to determine their eligibility for retirement and to calculate their retirement benefit. It also may count toward eligibility for the health insurance credit in retirement, if the employer offers the health insurance credit. Defined Contributions Component: Under the defined contribution component, service credit is used to determine vesting for the employer contribution portion of the plan.
Vesting Vesting is the minimum length of service a member needs to qualify for a future retirement benefit. Members become vested when they have at least five years (60 months) of service credit. Vesting means members are eligible to qualify for retirement if they meet the age and service requirements for their plan. Members also must be vested to receive a full refund of their member contribution account balance if they leave employment and request a refund. Members are always 100% vested in the contributions that they make.
Vesting Same as Plan 1.
Vesting Defined Benefit Component: Defined benefit vesting is the minimum length of service a member needs to qualify for a future retirement benefit. Members are vested under the defined benefit component of the Hybrid Retirement Plan when they reach five years (60 months) of service credit. Plan 1 or Plan 2 members with at least five years (60 months) of service credit who opted into the Hybrid Retirement Plan remain vested in the defined benefit component. Defined Contributions Component: Defined contribution vesting refers to the minimum length of service a member needs to be

53
eligible to withdraw the employer contributions from the defined contribution component of the plan. Members are always 100% vested in the contributions that they make. Upon retirement or leaving covered employment, a member is eligible to withdraw a percentage of employer contributions to the defined contribution component of the plan, based on service.
• After two years, a member is 50% vested and may withdraw 50% of employer contributions. • After three years, a member is 75% vested and may withdraw 75% of employer contributions. • After four or more years, a member is 100% vested and may withdraw 100% of employer contributions.
Distributions not required, except as governed by law.
Calculating the Benefit The basic benefit is determined using the average final compensation, service credit and plan multiplier. An early retirement reduction is applied to this amount if the member is retiring with a reduced benefit. In cases where the member has elected an optional form of retirement payment, an option factor specific to the option chosen is then applied.
Calculating the Benefit See definition under Plan 1.
Calculating the Benefit Defined Benefit Component: See definition under Plan 1 Defined Contribution Component: The benefit is based on contributions made by the member and any matching contributions made by the employer, plus net investment earnings on those contributions.
Average Final Compensation A member’s average final compensation is the average of the 36 consecutive months of highest compensation as a covered employee.
Average Final Compensation A member’s average final compensation is the average of their 60 consecutive months of highest compensation as a covered employee.
Average Final Compensation Same as Plan 2. It is used in the retirement formula for the defined benefit component of the plan.

54
Service Retirement Multiplier VRS: The retirement multiplier is a factor used in the formula to determine a final retirement benefit. The retirement multiplier for non-hazardous duty members is 1.70%. VaLORS: The retirement multiplier for VaLORS employees is 1.70% or 2.00%.
Service Retirement Multiplier VRS: Same as Plan 1 for service earned, purchased or granted prior to January 1, 2013. For non-hazardous duty members the retirement multiplier is 1.65% for service credit earned, purchased or granted on or after January 1, 2013. VaLORS: The retirement multiplier for VaLORS employees is 2.00%.
Service Retirement Multiplier Defined Benefit Component: VRS: The retirement multiplier for the defined benefit component is 1.00%. For members who opted into the Hybrid Retirement Plan from Plan 1 or Plan 2, the applicable multipliers for those plans will be used to calculate the retirement benefit for service credited in those plans. VaLORS: Not applicable. Defined Contribution Component: Not applicable.
Normal Retirement Age VRS: Age 65. VaLORS: Age 60.
Normal Retirement Age VRS: Normal Social Security retirement age. VaLORS: Same as Plan 1.
Normal Retirement Age Defined Benefit Component: VRS: Same as Plan 2. VaLORS: Not applicable. Defined Contribution Component: Members are eligible to receive distributions upon leaving employment, subject to restrictions.
Earliest Unreduced Retirement Eligibility VRS: Age 65 with at least five years (60 months) of service credit or at age 50 with at least 30 years of service credit. VaLORS: Age 60 with at least five years of service credit or age 50 with at least 25 years of service credit.
Earliest Unreduced Retirement Eligibility VRS: Normal Social Security retirement age with at least five years (60 months) of service credit or when their age and service equal 90. VaLORS: Same as Plan 1.
Earliest Unreduced Retirement Eligibility Defined Benefit Component: VRS: Normal Social Security retirement age and have at least five years (60 months) of service credit or when their age and service equal 90. VaLORS: Not applicable. Defined Contribution Component: Members are eligible to receive distributions upon leaving employment, subject to restrictions.
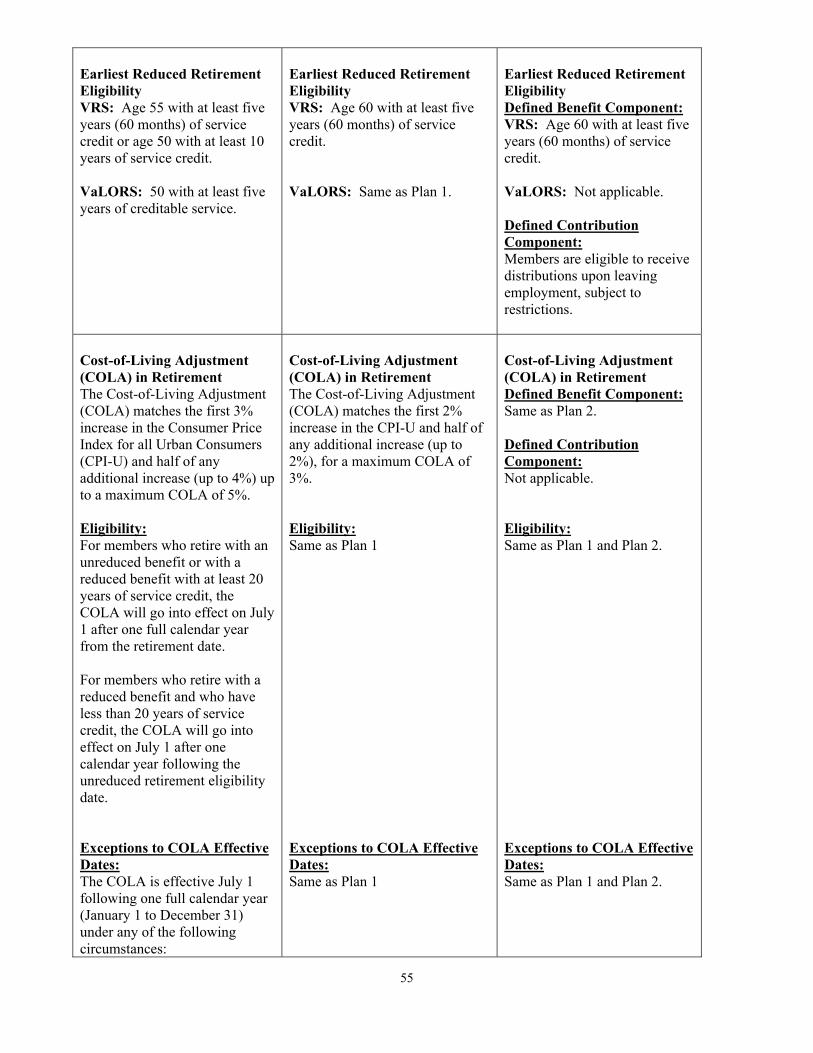
55
Earliest Reduced Retirement Eligibility VRS: Age 55 with at least five years (60 months) of service credit or age 50 with at least 10 years of service credit. VaLORS: 50 with at least five years of creditable service.
Earliest Reduced Retirement Eligibility VRS: Age 60 with at least five years (60 months) of service credit. VaLORS: Same as Plan 1.
Earliest Reduced Retirement Eligibility Defined Benefit Component: VRS: Age 60 with at least five years (60 months) of service credit. VaLORS: Not applicable. Defined Contribution Component: Members are eligible to receive distributions upon leaving employment, subject to restrictions.
Cost-of-Living Adjustment (COLA) in Retirement The Cost-of-Living Adjustment (COLA) matches the first 3% increase in the Consumer Price Index for all Urban Consumers (CPI-U) and half of any additional increase (up to 4%) up to a maximum COLA of 5%. Eligibility: For members who retire with an unreduced benefit or with a reduced benefit with at least 20 years of service credit, the COLA will go into effect on July 1 after one full calendar year from the retirement date. For members who retire with a reduced benefit and who have less than 20 years of service credit, the COLA will go into effect on July 1 after one calendar year following the unreduced retirement eligibility date. Exceptions to COLA Effective Dates: The COLA is effective July 1 following one full calendar year (January 1 to December 31) under any of the following circumstances:
Cost-of-Living Adjustment (COLA) in Retirement The Cost-of-Living Adjustment (COLA) matches the first 2% increase in the CPI-U and half of any additional increase (up to 2%), for a maximum COLA of 3%. Eligibility: Same as Plan 1 Exceptions to COLA Effective Dates: Same as Plan 1
Cost-of-Living Adjustment (COLA) in Retirement Defined Benefit Component: Same as Plan 2. Defined Contribution Component: Not applicable. Eligibility: Same as Plan 1 and Plan 2. Exceptions to COLA Effective Dates: Same as Plan 1 and Plan 2.

56
• The member is within five years of qualifying for an unreduced retirement benefit as of January 1, 2013.
• The member retires on disability.
• The member retires directly from short-term or long-term disability.
• The member is involuntarily separated from employment for causes other than job performance or misconduct and is eligible to retire under the Workforce Transition Act or the Transitional Benefits Program.
• The member dies in service and the member’s survivor or beneficiary is eligible for a monthly death-in-service benefit.
The COLA will go into effect on July 1 following one full calendar year (January 1 to December 31) from the date the monthly benefit begins. Disability Coverage Members who are eligible to be considered for disability retirement and retire on disability, the retirement multiplier is 1.7% on all service, regardless of when it was earned, purchased or granted. Most state employees are covered under the Virginia Sickness and Disability Program (VSDP), and are not eligible for disability retirement. VSDP members are subject to a one-year waiting period before becoming eligible for non-work-related disability benefits.
Disability Coverage Members who are eligible to be considered for disability retirement and retire on disability, the retirement multiplier is 1.65% on all service, regardless of when it was earned, purchased or granted. Most state employees are covered under the Virginia Sickness and Disability Program (VSDP), and are not eligible for disability retirement. VSDP members are subject to a one-year waiting period before becoming eligible for non-work related disability benefits.
Disability Coverage State employees (including Plan 1 and Plan 2 opt-ins) participating in the Hybrid Retirement Plan are covered under the Virginia Sickness and Disability Program (VSDP), and are not eligible for disability retirement. Hybrid members (including Plan 1 and Plan 2 opt-ins) covered under VSDP are subject to a one-year waiting period before becoming eligible for non-work-related disability benefits.
Purchase of Prior Service Members may be eligible to purchase service from previous
Purchase of Prior Service Same as Plan 1.
Purchase of Prior Service Defined Benefit Component: Same as Plan 1, with the
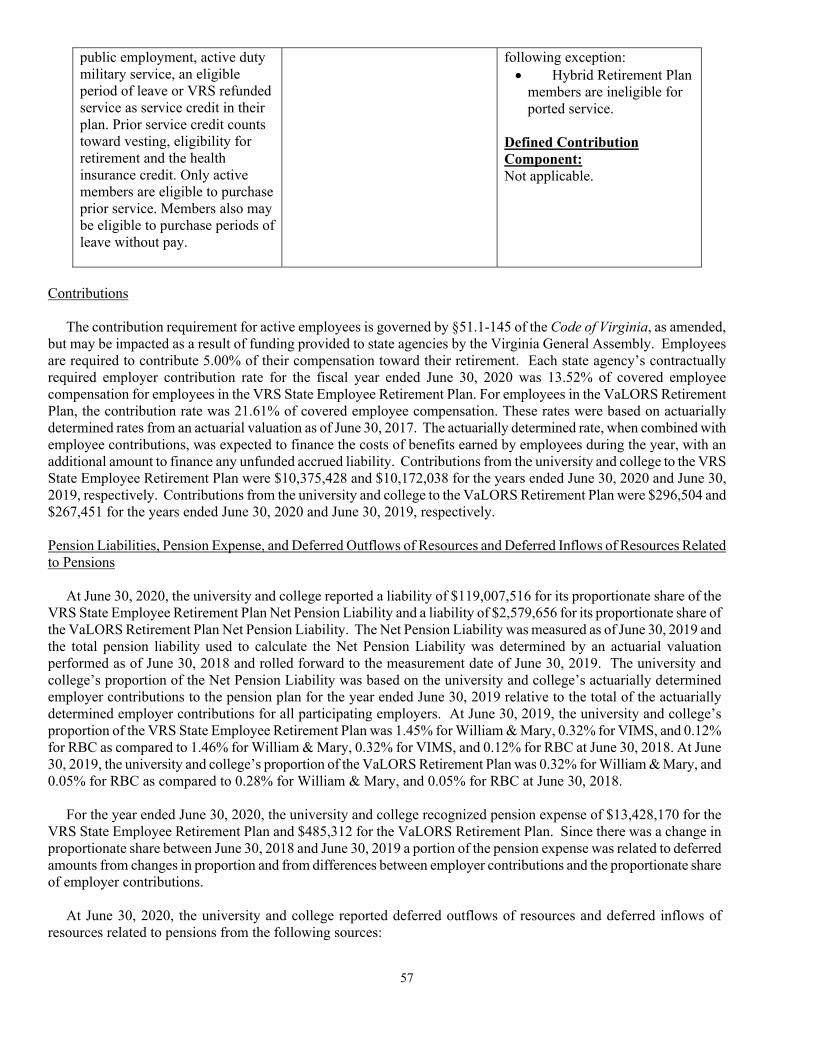
57
public employment, active duty military service, an eligible period of leave or VRS refunded service as service credit in their plan. Prior service credit counts toward vesting, eligibility for retirement and the health insurance credit. Only active members are eligible to purchase prior service. Members also may be eligible to purchase periods of leave without pay.
following exception: Hybrid Retirement Plan
members are ineligible for ported service.
Defined Contribution Component: Not applicable.
Contributions The contribution requirement for active employees is governed by §51.1-145 of the Code of Virginia, as amended, but may be impacted as a result of funding provided to state agencies by the Virginia General Assembly. Employees are required to contribute 5.00% of their compensation toward their retirement. Each state agency’s contractually required employer contribution rate for the fiscal year ended June 30, 2020 was 13.52% of covered employee compensation for employees in the VRS State Employee Retirement Plan. For employees in the VaLORS Retirement Plan, the contribution rate was 21.61% of covered employee compensation. These rates were based on actuarially determined rates from an actuarial valuation as of June 30, 2017. The actuarially determined rate, when combined with employee contributions, was expected to finance the costs of benefits earned by employees during the year, with an additional amount to finance any unfunded accrued liability. Contributions from the university and college to the VRS State Employee Retirement Plan were $10,375,428 and $10,172,038 for the years ended June 30, 2020 and June 30, 2019, respectively. Contributions from the university and college to the VaLORS Retirement Plan were $296,504 and $267,451 for the years ended June 30, 2020 and June 30, 2019, respectively. Pension Liabilities, Pension Expense, and Deferred Outflows of Resources and Deferred Inflows of Resources Related to Pensions At June 30, 2020, the university and college reported a liability of $119,007,516 for its proportionate share of the VRS State Employee Retirement Plan Net Pension Liability and a liability of $2,579,656 for its proportionate share of the VaLORS Retirement Plan Net Pension Liability. The Net Pension Liability was measured as of June 30, 2019 and the total pension liability used to calculate the Net Pension Liability was determined by an actuarial valuation performed as of June 30, 2018 and rolled forward to the measurement date of June 30, 2019. The university and college’s proportion of the Net Pension Liability was based on the university and college’s actuarially determined employer contributions to the pension plan for the year ended June 30, 2019 relative to the total of the actuarially determined employer contributions for all participating employers. At June 30, 2019, the university and college’s proportion of the VRS State Employee Retirement Plan was 1.45% for William & Mary, 0.32% for VIMS, and 0.12% for RBC as compared to 1.46% for William & Mary, 0.32% for VIMS, and 0.12% for RBC at June 30, 2018. At June 30, 2019, the university and college’s proportion of the VaLORS Retirement Plan was 0.32% for William & Mary, and 0.05% for RBC as compared to 0.28% for William & Mary, and 0.05% for RBC at June 30, 2018. For the year ended June 30, 2020, the university and college recognized pension expense of $13,428,170 for the VRS State Employee Retirement Plan and $485,312 for the VaLORS Retirement Plan. Since there was a change in proportionate share between June 30, 2018 and June 30, 2019 a portion of the pension expense was related to deferred amounts from changes in proportion and from differences between employer contributions and the proportionate share of employer contributions. At June 30, 2020, the university and college reported deferred outflows of resources and deferred inflows of resources related to pensions from the following sources:
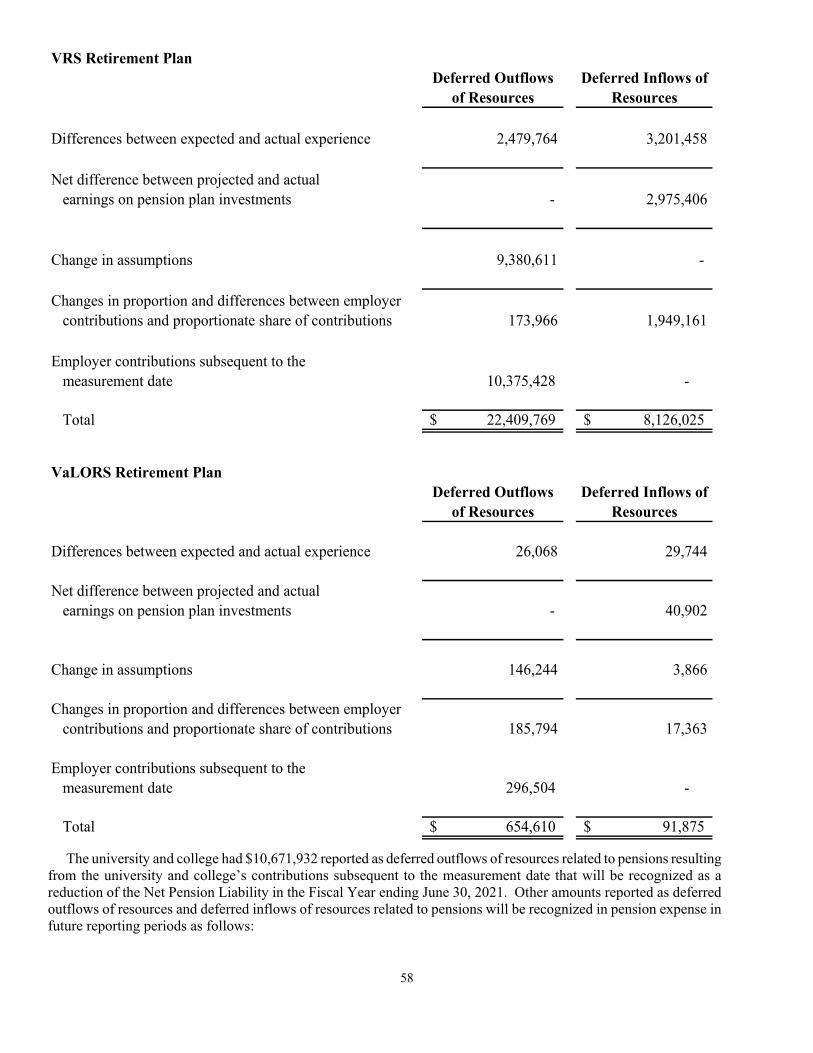
58
VRS Retirement Plan
Differences between expected and actual experience
Net difference between projected and actual earnings on pension plan investments
Change in assumptions
Changes in proportion and differences between employer contributions and proportionate share of contributions
Employer contributions subsequent to the measurement date 10,375,428 -
Total 22,409,769$ 8,126,025$
VaLORS Retirement Plan
Differences between expected and actual experience
Net difference between projected and actual earnings on pension plan investments
Change in assumptions
Changes in proportion and differences between employer contributions and proportionate share of contributions
Employer contributions subsequent to the measurement date 296,504 -
Total 654,610$ 91,875$
173,966 1,949,161
Deferred Outflows of Resources
Deferred Inflows of Resources
26,068 29,744
Deferred Outflows of Resources
Deferred Inflows of Resources
2,479,764 3,201,458
- 2,975,406
9,380,611 -
- 40,902
146,244 3,866
185,794 17,363
The university and college had $10,671,932 reported as deferred outflows of resources related to pensions resulting from the university and college’s contributions subsequent to the measurement date that will be recognized as a reduction of the Net Pension Liability in the Fiscal Year ending June 30, 2021. Other amounts reported as deferred outflows of resources and deferred inflows of resources related to pensions will be recognized in pension expense in future reporting periods as follows:

59
($ thousands)VRS Retirement Plan VaLORS Retirement Plan
FY 2020 1,898$ 166$ FY 2021 (808)$ 96$ FY 2022 2,583$ -$ FY 2023 236$ 4$ FY 2024 -$ -$
Actuarial Assumptions The total pension liability for the VRS State Employee Retirement Plan was based on an actuarial valuation as of June 30, 2018, using the Entry Age Normal actuarial cost method and the following assumptions, applied to all periods included in the measurement and rolled forward to the measurement date of June 30, 2019. Inflation 2.50%
Salary increases, including inflation 3.5%-5.35% Investment rate of return 6.75%, net of pension plan investment expenses, including inflation*
* Administrative expenses as a percent of the market value of assets for the last experience study were found to be approximately 0.06% of the market assets for all of the VRS plans. This would provide an assumed investment return rate for GASB purposes of slightly more than the assumed 6.75%. However, since the difference was minimal, and a more conservative 6.75% investment return assumption provided a projected plan net position that exceeded the projected benefit payments, the long-term expected rate of return on investments was assumed to be 6.75% to simplify preparation of pension liabilities.
Mortality rates:
Pre-Retirement:
RP-2014 Employee Rates to age 80, Healthy Annuitant Rates to 81 and older projected with Scale BB to 2020; males set back 1 year, 85% of rates; females set back 1 year.
Post-Retirement:
RP-2014 Employee Rates to age 49, Healthy Annuitant Rates at ages 50 and older projected with Scale BB to 2020; males set forward 1 year; females set back 1 year with 1.5% increase compounded from ages 70 to 85.
Post-Disablement:
RP-2014 Disability Life Mortality Table projected with Scale BB to 2020; males 115% of rates; females 130% of rates.
The actuarial assumptions used in the June 30, 2018 valuation were based on the results of an actuarial experience study for the period from July 1, 2012 through June 30, 2016, except the change in the discount rate, which was based on VRS Board action effective as of July 1, 2019. Changes to the actuarial assumptions as a result of the experience study and VRS Board action are as follows:

60
Mortality Rates (Pre-retirement, post-retirement healthy, and disabled
Update to a more current mortality table – RP-2014 projected to 2020
Retirement Rates Lowered rates at older ages and changed final retirement from 70 to 75
Withdrawal Rates Adjusted rates to better fit experience at each year age and service through 9 years of service
Disability Rates Adjusted rates to better match experience
Salary Scale No change
Line of Duty Disability Increase rate from 14% to 25%
Discount Rate Decrease rate from 7.00% to 6.75%
The total pension liability for the VaLORS Retirement Plan was based on an actuarial valuation as of June 30, 2018, using the Entry Age Normal actuarial cost method and the following assumptions, applied to all periods included in the measurement and rolled forward to the measurement date of June 30, 2019. Inflation 2.50%
Salary increases, including inflation 3.5%-4.75% Investment rate of return 6.75%, net of pension plan investment expenses, including inflation*
* Administrative expenses as a percent of the market value of assets for the last experience study were found to be approximately 0.06% of the market assets for all of the VRS plans. This would provide an assumed investment return rate for GASB purposes of slightly more than the assumed 6.75%. However, since the difference was minimal, and a more conservative 6.75% investment return assumption provided a projected plan net position that exceeded the projected benefit payments, the long-term expected rate of return on investments was assumed to be 6.75% to simplify preparation of pension liabilities.
Mortality rates: Pre-Retirement:
RP-2014 Employee Rates to age 80, Healthy Annuitant Rates to 81 and older projected with Scale BB to 2020; males 90% of rates; females set forward 1 year.
Post-Retirement:
RP-2014 Employee Rates to age 49, Healthy Annuitant Rates at ages 50 and older projected with Scale BB to 2020; males set forward 1 year with 1.0% increase compounded from ages 70 to 90; females set forward 1 year.
Post-Disablement:
RP-2014 Disability Life Mortality Table projected with Scale BB to 2020; males set forward 2 years; unisex using 100% male.
The actuarial assumptions used in the June 30, 2018, valuation were based on the results of an actuarial experience study for the period from July 1, 2012 through June 30, 2016, except the change in the discount rate, which was based on VRS Board action effective as of July 1, 2019. Changes to the actuarial assumptions as a result of the experience study and VRS Board action are as follows:

61
Mortality Rates (Pre-retirement, post-retirement healthy, and disabled
Update to a more current mortality table – RP-2014 projected to 2020 and reduced margin for future improvement in accordance with experience
Retirement Rates Increased age 50 rates and lowered rates at older ages
Withdrawal Rates Adjusted rates to better fit experience at each year age and service through 9 years of service
Disability Rates Adjusted rates to better match experience Salary Scale No change Line of Duty Disability Decrease rate from 50% to 35% Discount Rate Decrease rate from 7.00% to 6.75%
Net Pension Liability The net pension liability (NPL) is calculated separately for each system and represents that particular system’s total pension liability determined in accordance with GASB Statement No. 67, less that system’s fiduciary net position. As of June 30, 2019, NPL amounts for the VRS State Employee Retirement Plan and the VaLORS Retirement Plan are as follows (amounts expressed in thousands): State Employee VaLORS Retirement Plan Retirement Plan Total Pension Liability $ 25,409,842 $ 2,190,025 Plan Fiduciary Net Position 19,090,110 1,495,990 Employers’ Net Pension Liability (Asset) $ 6,319,732 $ 694,035 Plan Fiduciary Net Position as a Percentage of the Total Pension Liability 75.13% 68.31% The total pension liability is calculated by the System’s actuary, and each plan’s fiduciary net position is reported in the System’s financial statements. The net pension liability is disclosed in accordance with the requirements of GASB Statement No. 67 in the System’s notes to the financial statements and required supplementary information. Long-Term Expected Rate of Return The long-term expected rate of return on pension System investments was determined using a log-normal distribution analysis in which best-estimate ranges of expected future real rates of return (expected returns, net of pension System investment expense and inflation) are developed for each major asset class. These ranges are combined to produce the long-term expected rate of return by weighting the expected future real rates of return by the target asset allocation percentage and by adding expected inflation. The target asset allocation and best estimate of arithmetic real rates of return for each major asset class are summarized in the following table:

62
Arithmetic Weighted Average
Long-Term Long-Term
Expected Expected
Asset Class (Strategy) Rate of Return Rate of Return*
Public Equity 34.00% 5.61% 1.91%
Fixed Income 15.00% 0.88% 0.13%
Credit Strategies 14.00% 5.13% 0.72%
Real Assets 14.00% 5.27% 0.74%
Private Equity 14.00% 8.77% 1.23%
MAPS - Multi -Asset Public Strategies 6.00% 3.52% 0.21%
PIP- Private Investment Partnership 3.00% 6.29% 0.19%
Total 100.00% 5.13%
Inflation 2.50%
7.63%Expected arithmetic nominal return *
Target Allocation
* The above allocation provides a one-year return of 7.63%. However, one-year returns do not take into account the volatility present in each of the asset classes. In setting the long-term expected return for the system, stochastic projections are employed to model future returns under various economic conditions. The results provide a range of returns over various time periods that ultimately provide a median return of 7.11%, including expected inflation of 2.50%. The VRS Board elected a long-term rate of 6.75% which is roughly at the 40th percentile of expected long-term results of the VRS fund asset allocation. Discount Rate The discount rate used to measure the total pension liability was 6.75%. The projection of cash flows used to determine the discount rate assumed that System member contributions will be made per the VRS Statutes and the employer contributions will be made in accordance with the VRS funding policy at rates equal to the difference between actuarially determined contribution rates adopted by the VRS Board of Trustees and the member rate. Through the fiscal year ending June 30, 2019, the rate contributed by the state agency for the VRS State Employee Retirement Plan and the VaLORS Retirement Plan will be subject to the portion of the VRS Board-certified rates that are funded by the Virginia General Assembly which was 100% of the actuarially determined contribution rate. From July 1, 2019 on, all agencies are assumed to continue to contribute 100% of the actuarially determined contribution rates. Based on those assumptions, the pension plan’s fiduciary net position was projected to be available to make all projected future benefit payments of current active and inactive employees. Therefore, the long-term expected rate of return was applied to all periods of projected benefit payments to determine the total pension liability. Sensitivity of the University and College’s Proportionate Share of the Net Pension Liability to Changes in the Discount Rate The following presents the university and college’s proportionate share of the VRS State Employee Retirement Plan net pension liability using the discount rate of 6.75%, as well as what the university and college’s proportionate share of the net pension liability would be if it were calculated using a discount rate that is one percentage point lower (5.75%) or one percentage point higher (7.75%) than the current rate:

63
1.00% Decrease Current Discount 1.00% Increase($ thousands) (5.75%) Rate (6.75%) (7.75%)
The university and college's proportionate share of the VRS State Employee $ 174,821 $ 119,008 $ 72,089 Retirement PlanNet Pension Liability The following presents the university and college’s proportionate share of the VaLORS Retirement Plan net pension liability using the discount rate of 6.75%, as well as what the university and college’s proportionate share of the net pension liability would be if it were calculated using a discount rate that is one percentage point lower (5.75%) or one percentage point higher (7.75%) than the current rate:
1.00% Decrease Current Discount 1.00% Increase($ thousands) (5.75%) Rate (6.75%) (7.75%)
The university and college's proportionate share of the VaLORS Employee $ 3,623 $ 2,580 $ 1,718 Retirement PlanNet Pension Liability Pension Plan Fiduciary Net Position Detailed information about the VRS State Employee Retirement Plan’s Fiduciary Net Position or the VaLORS Retirement Plan’s Fiduciary Net Position is available in the separately issued VRS 2019 Comprehensive Annual Financial Report (CAFR). A copy of the 2019 VRS CAFR may be downloaded from the VRS website at http://www.varetire.org/pdf/publications/2019-annual-report.pdf, or by writing to the System’s Chief Financial Officer at P.O. Box 2500, Richmond, VA, 23218-2500. Payables to the Pension Plan The university and college reported $428,312 in payables to VRS. 15. OTHER POSTEMPLOYMENT BENEFITS The university and college participate in postemployment benefit programs that are sponsored by the Commonwealth and administered by the Virginia Retirement System. These programs include the Group Life Insurance Program, Virginia Sickness and Disability Program, Retiree Health Insurance Credit Program, and the Line of Duty Act Program. The university and college also participate in the Pre-Medicare Retiree Healthcare Plan, which is sponsored by the Commonwealth and administered by the Department of Human Resource Management. General Information about the Group Life Insurance Program Plan Description All full-time, salaried permanent employees of the state agencies, teachers and employees of participating political subdivisions are automatically covered by the VRS Group Life Insurance Program upon employment. This plan is administered by the Virginia Retirement System (the System), along with pensions and other OPEB plans, for public employer groups in the Commonwealth of Virginia.
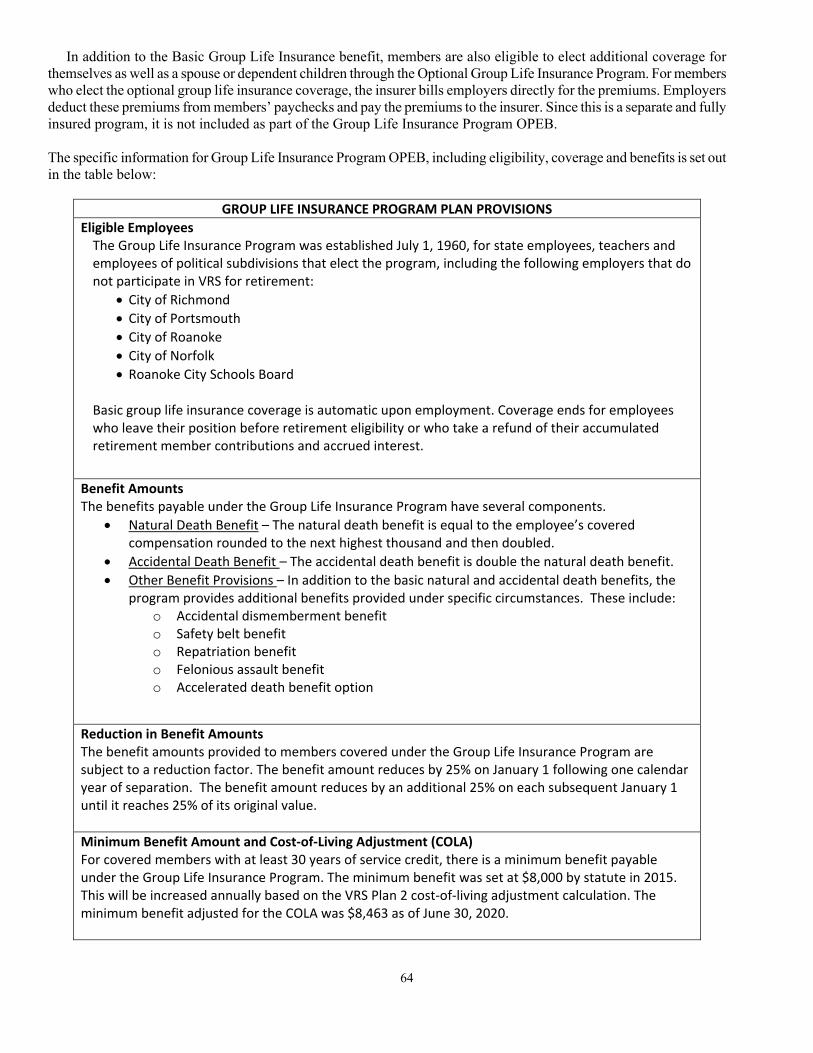
64
In addition to the Basic Group Life Insurance benefit, members are also eligible to elect additional coverage for themselves as well as a spouse or dependent children through the Optional Group Life Insurance Program. For members who elect the optional group life insurance coverage, the insurer bills employers directly for the premiums. Employers deduct these premiums from members’ paychecks and pay the premiums to the insurer. Since this is a separate and fully insured program, it is not included as part of the Group Life Insurance Program OPEB. The specific information for Group Life Insurance Program OPEB, including eligibility, coverage and benefits is set out in the table below:
GROUP LIFE INSURANCE PROGRAM PLAN PROVISIONS
Eligible Employees The Group Life Insurance Program was established July 1, 1960, for state employees, teachers and employees of political subdivisions that elect the program, including the following employers that do not participate in VRS for retirement:
City of Richmond
City of Portsmouth
City of Roanoke City of Norfolk Roanoke City Schools Board
Basic group life insurance coverage is automatic upon employment. Coverage ends for employees who leave their position before retirement eligibility or who take a refund of their accumulated retirement member contributions and accrued interest.
Benefit Amounts The benefits payable under the Group Life Insurance Program have several components.
Natural Death Benefit – The natural death benefit is equal to the employee’s covered compensation rounded to the next highest thousand and then doubled.
Accidental Death Benefit – The accidental death benefit is double the natural death benefit.
Other Benefit Provisions – In addition to the basic natural and accidental death benefits, the program provides additional benefits provided under specific circumstances. These include:
o Accidental dismemberment benefit o Safety belt benefit o Repatriation benefit o Felonious assault benefit o Accelerated death benefit option
Reduction in Benefit Amounts The benefit amounts provided to members covered under the Group Life Insurance Program are subject to a reduction factor. The benefit amount reduces by 25% on January 1 following one calendar year of separation. The benefit amount reduces by an additional 25% on each subsequent January 1 until it reaches 25% of its original value.
Minimum Benefit Amount and Cost‐of‐Living Adjustment (COLA) For covered members with at least 30 years of service credit, there is a minimum benefit payable under the Group Life Insurance Program. The minimum benefit was set at $8,000 by statute in 2015. This will be increased annually based on the VRS Plan 2 cost‐of‐living adjustment calculation. The minimum benefit adjusted for the COLA was $8,463 as of June 30, 2020.

65
Contributions The contribution requirements for the Group Life Insurance Program are governed by §51.1-506 and §51.1-508 of the Code of Virginia, as amended, but may be impacted as a result of funding provided to state agencies and school divisions by the Virginia General Assembly. The total rate for the Group Life Insurance Program was 1.31% of covered employee compensation. This was allocated into an employee and an employer component using a 60/40 split. The employee component was 0.79% (1.31% X 60%) and the employer component was 0.52% (1.31% X 40%). Employers may elect to pay all or part of the employee contribution, however the employer must pay all of the employer contribution. Each employer’s contractually required employer contribution rate for the year ended June 30, 2020, was 0.52% of covered employee compensation. This rate was based on an actuarially determined rate from an actuarial valuation as of June 30, 2017. The actuarially determined rate, when combined with employee contributions, was expected to finance the costs of benefits payable during the year, with an additional amount to finance any unfunded accrued liability. Contributions to the Group Life Insurance Program from the university and college were $1,008,969 and $967,560 for the years ended June 30, 2020 and June 30, 2019, respectively. GLI OPEB Liabilities, GLI OPEB Expense, and Deferred Outflows of Resources and Deferred Inflows of Resources Related to the Group Life Insurance Program OPEB At June 30, 2020, the university and college reported a liability of $15,428,924 for its proportionate share of the Net GLI OPEB Liability. The Net GLI OPEB Liability was measured as of June 30, 2019 and the total GLI OPEB liability used to calculate the Net GLI OPEB Liability was determined by an actuarial valuation performed as of June 30, 2018, and rolled forward to the measurement date of June 30, 2019. The university and college’s proportion of the Net GLI OPEB Liability was based on the university and college’s actuarially determined employer contributions to the Group Life Insurance Program for the year ended June 30, 2019, relative to the total of the actuarially determined employer contributions for all participating employers. At June 30, 2019, the university and college’s proportion was 0.81% for William & Mary, 0.11% for VIMS, and 0.03% for RBC as compared to 0.83% for William & Mary, 0.11% for VIMS, and 0.04% for RBC at June 30, 2018. For the year ended June 30, 2020, the university and college recognized GLI OPEB expense of $353,518. Since there was a change in proportionate share between measurement dates, a portion of the GLI OPEB expense was related to deferred amounts from changes in proportion. At June 30, 2020, the employer reported deferred outflows of resources and deferred inflows of resources related to the GLI OPEB from the following sources:
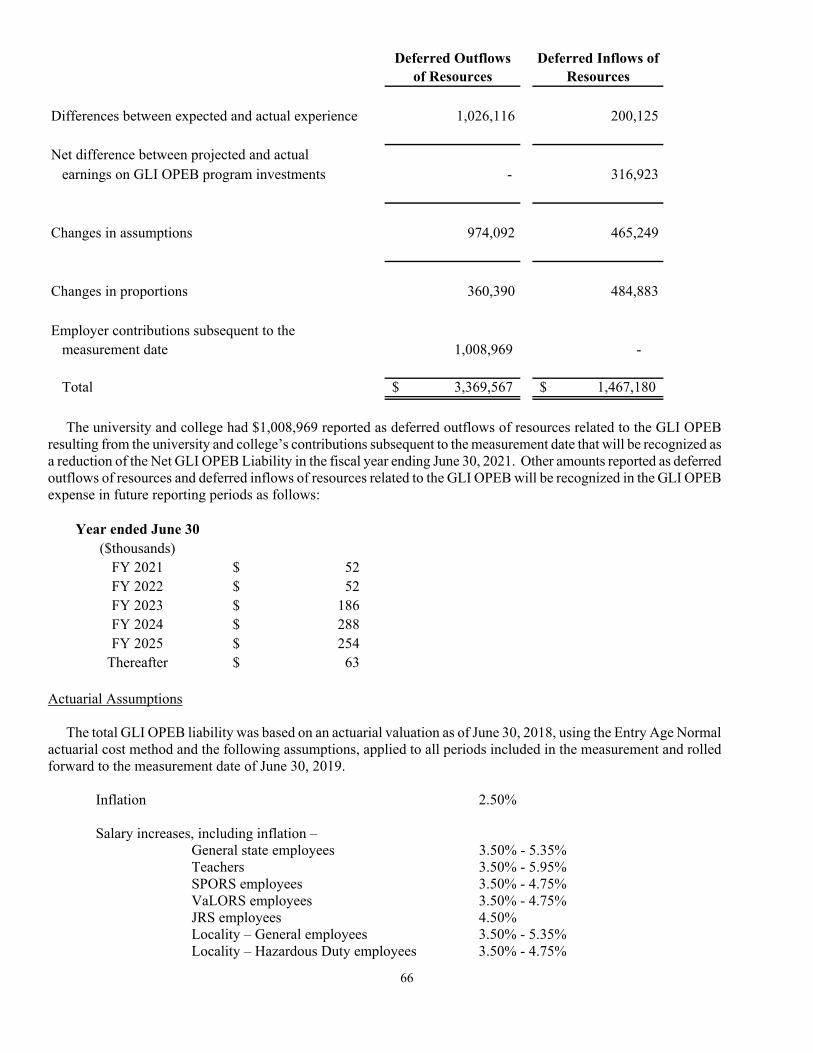
66
Differences between expected and actual experience
Net difference between projected and actual earnings on GLI OPEB program investments
Changes in assumptions
Changes in proportions
Employer contributions subsequent to the measurement date 1,008,969 -
Total 3,369,567$ 1,467,180$
Deferred Outflows of Resources
Deferred Inflows of Resources
360,390 484,883
1,026,116 200,125
- 316,923
465,249 974,092
The university and college had $1,008,969 reported as deferred outflows of resources related to the GLI OPEB resulting from the university and college’s contributions subsequent to the measurement date that will be recognized as a reduction of the Net GLI OPEB Liability in the fiscal year ending June 30, 2021. Other amounts reported as deferred outflows of resources and deferred inflows of resources related to the GLI OPEB will be recognized in the GLI OPEB expense in future reporting periods as follows:
Year ended June 30($thousands)
FY 2021 52$ FY 2022 52$ FY 2023 186$ FY 2024 288$ FY 2025 254$
Thereafter 63$ Actuarial Assumptions The total GLI OPEB liability was based on an actuarial valuation as of June 30, 2018, using the Entry Age Normal actuarial cost method and the following assumptions, applied to all periods included in the measurement and rolled forward to the measurement date of June 30, 2019.
Inflation 2.50%
Salary increases, including inflation – General state employees 3.50% - 5.35%
Teachers 3.50% - 5.95% SPORS employees 3.50% - 4.75% VaLORS employees 3.50% - 4.75% JRS employees 4.50% Locality – General employees 3.50% - 5.35%
Locality – Hazardous Duty employees 3.50% - 4.75%

67
Investment rate of return 6.75%, net of investment expenses, including inflation*
* Administrative expenses as a percent of the market value of assets for the last experience study were found to be approximately 0.06% of the market assets for all of the VRS plans. This would provide an assumed investment return rate for GASB purposes of slightly more than the assumed 6.75%. However, since the difference was minimal, and a more conservative 6.75% investment return assumption provided a projected plan net position that exceeded the projected benefit payments, the long-term expected rate of return on investments was assumed to be 6.75% to simplify preparation of the OPEB liabilities.
Mortality rates – General State Employees
Pre-Retirement: RP-2014 Employee Rates to age 80, Healthy Annuitant Rates to 81 and older projected with Scale BB to
2020; males set back 1 year, 85% of rates; females set back 1 year. Post-Retirement:
RP-2014 Employee Rates to age 49, Healthy Annuitant Rates at ages 50 and older projected with Scale BB to 2020; males set forward 1 year; females set back 1 year with 1.5% increase compounded from ages 70 to 85.
Post-Disablement:
RP-2014 Disability Life Mortality Table projected with scale BB to 2020; males 115% of rates; females 130% of rates.
The actuarial assumptions used in the June 30, 2018, valuation were based on the results of an actuarial experience study for the period from July 1, 2012 through June 30, 2016, except the change in the discount rate, which was based on VRS Board action effective as of July 1, 2019. Changes to the actuarial assumptions as a result of the experience study and VRS Board action are as follows:
Mortality Rates (Pre-retirement, post-retirement healthy, and disabled)
Updated to a more current mortality table – RP-2014 projected to 2020
Retirement Rates Lowered rates at older ages and changed final retirement from 70 to 75
Withdrawal Rates Adjusted rates to better fit experience at each year age and service through 9 years of service
Disability Rates Adjusted rates to better match experience
Salary Scale No change
Line of Duty Disability Increased rate from 14% to 25%
Discount Rate Decrease rate from 7.00% to 6.75%
Mortality rates – Teachers
Pre-Retirement:
RP-2014 White Collar Employee Rates to age 80, White Collar Healthy Annuitant Rates at ages 81 and older projected with scale BB to 2020.
Post-Retirement:
RP-2014 White Collar Employee Rates to age 49, White Collar Health Annuitant Rates at ages 50 and older projected with scale BB to 2020; males 1% increase compounded from ages 70 to 90; females set back 3
68
years with 1.5% increase compounded from ages 65 to 70 and 2.0% increase compounded from ages 75 to 90.
Post-Disablement:
RP-2014 Disability Mortality Rates projected with Scale BB to 2020; 115% of rates for males and females.
The actuarial assumptions used in the June 30, 2018, valuation were based on the results of an actuarial experience study for the four-year period from July 1, 2012 through June 30, 2016, except the change in the discount rate, which was based on VRS Board action effective as of July 1, 2019. Changes to the actuarial assumptions as a result of the experience study and VRS Board action are as follows:
Mortality Rates (Pre-retirement, post-retirement healthy, and disabled)
Updated to a more current mortality table – RP-2014 projected to 2020
Retirement Rates Lowered rates at older ages and changed final retirement from 70 to 75
Withdrawal Rates Adjusted rates to better fit experience at each year age and service through 9 years of service
Disability Rates Adjusted rates to better match experience
Salary Scale No change
Discount Rate Decrease rate from 7.00% to 6.75%
Mortality rates – SPORS Employees
Pre-Retirement:
RP-2014 Employee Rates to age 80, Healthy Annuitant Rates to 81 and older projected with Scale BB to 2020; males 90% of rates; females set forward 1 year.
Post-Retirement:
RP-2014 Employee Rates to age 49, Healthy Annuitant Rates at ages 50 and older projected with Scale BB to 2020; males set forward 1 year with 1.0% increase compounded from ages 70 to 90; females set forward 3 years.
Post-Disablement:
RP-2014 Disability Life Mortality Table projected with scale BB to 2020; males set forward 2 years; unisex using 100% male.
The actuarial assumptions used in the June 30, 2018, valuation were based on the results of an actuarial experience study for the period from July 1, 2012 through June 30, 2016, except the change in the discount rate, which was based on VRS Board action effective as of July 1, 2019. Changes to the actuarial assumptions as a result of the experience study and VRS Board action are as follows:

69
Mortality Rates (Pre-retirement, post-retirement healthy, and disabled)
Updated to a more current mortality table – RP-2014 projected to 2020 and reduced margin for future improvement in accordance with experience
Retirement Rates Increased age 50 rates and lowered rates at older ages
Withdrawal Rates Adjusted rates to better fit experience
Disability Rates Adjusted rates to better match experience
Salary Scale No change
Line of Duty Disability Increased rate from 60% to 85%
Discount Rate Decrease rate from 7.00% to 6.75%
Mortality rates – VaLORS Employees
Pre-Retirement:
RP-2014 Employee Rates to age 80, Healthy Annuitant Rates to 81 and older projected with Scale BB to 2020; males 90% of rates; females set forward 1 year.
Post-Retirement:
RP-2014 Employee Rates to age 49, Healthy Annuitant Rates at ages 50 and older projected with Scale BB to 2020; males set forward 1 year with 1.0% increase compounded from ages 70 to 90; females set forward 3 years.
Post-Disablement:
RP-2014 Disability Life Mortality Table projected with scale BB to 2020; males set forward 2 years; unisex using 100% male.
The actuarial assumptions used in the June 30, 2018, valuation were based on the results of an actuarial experience study for the period from July 1, 2012 through June 30, 2016, except the change in the discount rate, which was based on VRS Board action effective as of July 1, 2019. Changes to the actuarial assumptions as a result of the experience study and VRS Board action are as follows:
Mortality Rates (Pre-retirement, post-retirement healthy, and disabled)
Updated to a more current mortality table – RP-2014 projected to 2020 and reduced margin for future improvement in accordance with experience
Retirement Rates Increased age 50 rates and lowered rates at older ages
Withdrawal Rates Adjusted rates to better fit experience at each year age and service through 9 years of service
Disability Rates Adjusted rates to better match experience
Salary Scale No change
Line of Duty Disability Decreased rate from 50% to 35%
Discount Rate Decrease rate from 7.00% to 6.75%
Mortality rates – JRS Employees
Pre-Retirement:
RP-2014 Employee Rates to age 80, Healthy Annuitant Rates at ages 81 and older projected with scale BB to 2020; males set back 1 year, 85% of rates; females set back 1 year.
Post-Retirement:

70
RP-2014 Employee Rates to age 49, Healthy Annuitant Rates at ages 50 and older projected with scale BB to 2020; males set forward 1 year; females set back 1 year with 1.5% compounding increase from ages 70 to 85.
Post-Disablement:
RP-2014 Disability Mortality Rates projected with Scale BB to 2020; males 115% of rates; females 130% of rates.
The actuarial assumptions used in the June 30, 2018, valuation were based on the results of an actuarial experience study for the four-year period from July 1, 2012 through June 30, 2016, except the change in the discount rate, which was based on VRS Board action effective as of July 1, 2019. Changes to the actuarial assumptions as a result of the experience study and VRS Board action are as follows:
Mortality Rates (Pre-retirement, post-retirement healthy, and disabled)
Updated to a more current mortality table – RP-2014 projected to 2020
Retirement Rates Decreased rates at first retirement eligibility
Withdrawal Rates No change
Disability Rates Removed disability rates
Salary Scale No change
Discount Rate Decrease rate from 7.00% to 6.75%
Mortality rates – Largest Ten Locality Employers - General Employees
Pre-Retirement:
RP-2014 Employee Rates to age 80, Healthy Annuitant Rates to 81 and older projected with Scale BB to 2020; males 95% of rates; females 105% of rates.
Post-Retirement:
RP-2014 Employee Rates to age 49, Healthy Annuitant Rates at ages 50 and older projected with Scale BB to 2020; males set forward 3 years; females 1.0% increase compounded from ages 70 to 90.
Post-Disablement:
RP-2014 Disability Life Mortality Table projected with scale BB to 2020; males set forward 2 years, 110% of rates; females 125% of rates.
The actuarial assumptions used in the June 30, 2018, valuation were based on the results of an actuarial experience study for the period from July 1, 2012 through June 30, 2016, except the change in the discount rate, which was based on VRS Board action effective as of July 1, 2019. Changes to the actuarial assumptions as a result of the experience study and VRS Board action are as follows:
71
Mortality Rates (Pre-retirement, post-retirement healthy, and disabled)
Updated to a more current mortality table – RP-2014 projected to 2020
Retirement Rates Lowered retirement rates at older ages and extended final retirement age from 70 to 75
Withdrawal Rates Adjusted termination rates to better fit experience at each age and service year
Disability Rates Lowered disability rates
Salary Scale No change
Line of Duty Disability Increased rate from 14% to 20%
Discount Rate Decrease rate from 7.00% to 6.75%
Mortality rates – Non-Largest Ten Locality Employers - General Employees
Pre-Retirement:
RP-2014 Employee Rates to age 80, Healthy Annuitant Rates to 81 and older projected with Scale BB to 2020; males 95% of rates; females 105% of rates.
Post-Retirement:
RP-2014 Employee Rates to age 49, Healthy Annuitant Rates at ages 50 and older projected with Scale BB to 2020; males set forward 3 years; females 1.0% increase compounded from ages 70 to 90.
Post-Disablement:
RP-2014 Disability Life Mortality Table projected with scale BB to 2020; males set forward 2 years, 110% of rates; females 125% of rates.
The actuarial assumptions used in the June 30, 2018, valuation were based on the results of an actuarial experience study for the period from July 1, 2012 through June 30, 2016, except the change in the discount rate, which was based on VRS Board action effective as of July 1, 2019. Changes to the actuarial assumptions as a result of the experience study and VRS Board action are as follows:
Mortality Rates (Pre-retirement, post-retirement healthy, and disabled)
Updated to a more current mortality table – RP-2014 projected to 2020
Retirement Rates Lowered retirement rates at older ages and extended final retirement age from 70 to 75.
Withdrawal Rates Adjusted termination rates to better fit experience at each age and service year
Disability Rates Lowered disability rates
Salary Scale No change
Line of Duty Disability Increased rate from 14% to 15%
Discount Rate Decrease rate from 7.00% to 6.75%
Mortality rates – Largest Ten Locality Employers – Hazardous Duty Employees
Pre-Retirement:
RP-2014 Employee Rates to age 80, Healthy Annuitant Rates to 81 and older projected with Scale BB to 2020; males 90% of rates; females set forward 1 year.
72
Post-Retirement: RP-2014 Employee Rates to age 49, Healthy Annuitant Rates at ages 50 and older projected with Scale BB to
2020; males set forward 1 year with 1.0% increase compounded from ages 70 to 90; females set forward 3 years.
Post-Disablement:
RP-2014 Disability Life Mortality Table projected with scale BB to 2020; males set forward 2 years; unisex using 100% male.
The actuarial assumptions used in the June 30, 2018, valuation were based on the results of an actuarial experience study for the period from July 1, 2012 through June 30, 2016, except the changes in the discount rate, which was based on VRS Board action effective as of July 1, 2019. Changes to the actuarial assumptions as a result of the experience study and VRS Board action are as follows:
Mortality Rates (Pre-retirement, post-retirement healthy, and disabled)
Updated to a more current mortality table – RP-2014 projected to 2020
Retirement Rates Lowered retirement rates at older ages
Withdrawal Rates Adjusted termination rates to better fit experience at each age and service year
Disability Rates Increased disability rates
Salary Scale No change
Line of Duty Disability Increased rate from 60% to 70%
Discount Rate Decrease rate from 7.00% to 6.75%
Mortality rates – Non-Largest Ten Locality Employers – Hazardous Duty Employees
Pre-Retirement:
RP-2014 Employee Rates to age 80, Healthy Annuitant Rates to 81 and older projected with Scale BB to 2020; males 90% of rates; females set forward 1 year.
Post-Retirement:
RP-2014 Employee Rates to age 49, Healthy Annuitant Rates at ages 50 and older projected with Scale BB to 2020; males set forward 1 year with 1.0% increase compounded from ages 70 to 90; females set forward 3 years.
Post-Disablement:
RP-2014 Disability Life Mortality Table projected with scale BB to 2020; males set forward 2 years; unisex using 100% male.
The actuarial assumptions used in the June 30, 2018, valuation were based on the results of an actuarial experience study for the period from July 1, 2012 through June 30, 2016, except the changes in the discount rate, which was based on VRS Board action effective as of July 1, 2019. Changes to the actuarial assumptions as a result of the experience study and VRS Board action are as follows:

73
Mortality Rates (Pre-retirement, post-retirement healthy, and disabled)
Updated to a more current mortality table – RP-2014 projected to 2020
Retirement Rates Increased age 50 rates and lowered rates at older ages
Withdrawal Rates Adjusted termination rates to better fit experience at each age and service year
Disability Rates Adjusted rates to better match experience
Salary Scale No change
Line of Duty Disability Decreased rate from 60% to 45%
Discount Rate Decrease rate from 7.00% to 6.75%
Net GLI OPEB Liability The net OPEB liability (NOL) for the Group Life Insurance Program represents the program’s total OPEB liability determined in accordance with GASB Statement No. 74, less the associated fiduciary net position. As of the Measurement Date of June 30, 2019, NOL amounts for the Group Life Insurance Program are as follows (amounts expressed in thousands): Group Life Insurance OPEB Program Total GLI OPEB Liability $ 3,390,238 Plan Fiduciary Net Position 1,762,972 GLI Net OPEB Liability (Asset) $ 1,627,266 Plan Fiduciary Net Position as a Percentage of the Total GLI OPEB Liability 52.00% The total GLI OPEB liability is calculated by the System’s actuary, and each plan’s fiduciary net position is reported in the System’s financial statements. The net GLI OPEB liability is disclosed in accordance with the requirements of GASB Statement No. 74 in the System’s notes to the financial statements and required supplementary information. Long-Term Expected Rate of Return The long-term expected rate of return on the System’s investments was determined using a log-normal distribution analysis in which best-estimate ranges of expected future real rates of return (expected returns, net of System’s investment expense and inflation) are developed for each major asset class. These ranges are combined to produce the long-term expected rate of return by weighting the expected future real rates of return by the target asset allocation percentage and by adding expected inflation. The target asset allocation and best estimate of arithmetic real rates of return for each major asset class are summarized in the following table:
74
Arithmetic Weighted Average
Long-Term Expected Long-Term Expected
Asset Class (Strategy) Target Allocation Rate of Return Rate of Return*
Public Equity 34.00 % 5.61 % 1.91 %
Fixed Income 15.00 % 0.88 % 0.13 %
Credit Strategies 14.00 % 5.13 % 0.72 %
Real Assets 14.00 % 5.27 % 0.74 %
Private Equity 14.00 % 8.77 % 1.23 %
MAPS - Multi -Asset Public Strategies 6.00 % 3.52 % 0.21 %
PIP- Private Investment Partnership 3.00 % 6.29 % 0.19 %
Total 100.00 % 5.13 %
Inflation 2.50 %
Expected arithmetic nominal return * 7.63 %
* The above allocation provides a one-year return of 7.63%. However, one-year returns do not take into account the volatility present in each of the asset classes. In setting the long-term expected return for the system, stochastic projections are employed to model future returns under various economic conditions. The results provide a range of returns over various time periods that ultimately provide a median return of 7.11%, including expected inflation of 2.50%. The VRS Board elected a long-term rate of 6.75% which is roughly at the 40th percentile of expected long-term results of the VRS fund asset allocation. Discount Rate The discount rate used to measure the total GLI OPEB liability was 6.75%. The projection of cash flows used to determine the discount rate assumed that member contributions will be made per the VRS guidance and the employer contributions will be made in accordance with the VRS funding policy at rates equal to the difference between actuarially determined contribution rates adopted by the VRS Board of Trustees and the member rate. Through the fiscal year ending June 30, 2019, the rate contributed by the university and college for the GLI OPEB will be subject to the portion of the VRS Board-certified rates that are funded by the Virginia General Assembly which was 100% of the actuarially determined contribution rate. From July 1, 2019 on, employers are assumed to continue to contribute 100% of the actuarially determined contribution rates. Based on those assumptions, the GLI OPEB’s fiduciary net position was projected to be available to make all projected future benefit payments of eligible employees. Therefore, the long-term expected rate of return was applied to all periods of projected benefit payments to determine the total GLI OPEB liability. Sensitivity of the University and College’s Proportionate Share of the Net GLI OPEB Liability to Changes in the Discount Rate The following presents the university and college’s proportionate share of the net GLI OPEB liability using the discount rate of 6.75%, as well as what the university and college’s proportionate share of the net GLI OPEB liability would be if it were calculated using a discount rate that is one percentage point lower (5.75%) or one percentage point higher (7.75%) than the current rate:

75
1.00% Decrease Current Discount 1.00% Increase($thousands) (5.75)% Rate (6.75%) (7.75)%
Employer's proportionateshare of the Group Life
Insurance Program 20,269$ 15,429$ 11,503$
Net OPEB liability
Group Life Insurance Program Fiduciary Net Position Detailed information about the Group Life Insurance Program’s Fiduciary Net Position is available in the separately issued VRS 2019 Comprehensive Annual Financial Report (CAFR). A copy of the 2019 VRS CAFR may be downloaded from the VRS website at http://www.varetire.org/pdf/publications/2019-annual-report.pdf, or by writing to the System’s Chief Financial Officer at P.O. Box 2500, Richmond, VA, 23218-2500. Payables to the VRS Group Life Insurance OPEB Plan The university and college reported $96,587 in payables to the VRS Group Life Insurance OPEB plan. General Information about the State Employee Health Insurance Credit Program Plan Description All full-time, salaried permanent employees of state agencies are automatically covered by the VRS State Employee Health Insurance Credit Program. This plan is administered by the Virginia Retirement System (the System), along with pension and other OPEB plans, for public employer groups in the Commonwealth of Virginia. Members earn one month of service credit toward the benefit for each month they are employed and for which their employer pays contributions to VRS. The health insurance credit is a tax-free reimbursement in an amount set by the General Assembly for each year of service credit against qualified health insurance premiums retirees pay for single coverage, excluding any portion covering the spouse or dependents. The credit cannot exceed the amount of the premiums and ends upon the retiree’s death. The specific information about the State Health Insurance Credit Program OPEB, including eligibility, coverage and benefits is set out in the table below:
STATE EMPLOYEE HEALTH INSURANCE CREDIT PROGRAM (HIC) PLAN PROVISIONS
Eligible Employees
The State Employee Retiree Health Insurance Credit Program was established January 1, 1990 for retired state employees covered under VRS, SPORS, VaLORS and JRS who retire with at least 15 years of service credit. Eligible employees are enrolled automatically upon employment. They include:
Full-time and part-time permanent salaried state employees covered under VRS, SPORS, VaLORS and JRS.
Benefit Amounts The State Employee Retiree Health Insurance Credit Program provides the following benefits for eligible employees:
At Retirement – For State employees who retire with at least 15 years of service credit, the monthly benefit is $4.00 per year of service per month with no cap on the benefit amount.

76
Disability Retirement – For State employees, other than state police officers, who retire on disability or go on long-term disability under the Virginia Sickness and Disability Program (VSDP), the monthly benefit is $120.00 or $4.00 per year of service, whichever is higher. For State police officer employees with a non-work-related disability who retire on disability or go on long-term disability under the Virginia Sickness and Disability Program (VSDP) the monthly benefit is $120.00 or $4.00 per year of service, whichever is higher. For State police officers with a work-related disability, there is no benefit provided under the State Employee Retiree Health Insurance Credit Program if the premiums are being paid under the Virginia Line of Duty Act. However, they may receive the credit for premiums paid for other qualified health plans.
Health Insurance Credit Program Notes:
The monthly Health Insurance Credit benefit cannot exceed the individual’s premium amount. Employees who retire after being on long-term disability under VSDP must have at least 15 years
of service credit to qualify for the Health Insurance Credit as a retiree.
Contributions The contribution requirement for active employees is governed by §51.1-1400(D) of the Code of Virginia, as amended, but may be impacted as a result of funding provided to state agencies by the Virginia General Assembly. Each state agency’s contractually required employer contribution rate for the year ended June 30, 2020 was 1.17% of covered employee compensation for employees in the VRS State Employee Health Insurance Credit Program. This rate was based on an actuarially determined rate from an actuarial valuation as of June 30, 2017. The actuarially determined rate was expected to finance the costs of benefits earned by employees during the year, with an additional amount to finance any unfunded accrued liability. Contributions from the university and college to the VRS State Employee Health Insurance Credit Program were $2,247,148 and $2,153,476 for the years ended June 30, 2020 and June 30, 2019, respectively. State Employee Health Insurance Credit Program OPEB Liabilities, State Employee Health Insurance Credit Program OPEB Expense, and Deferred Outflows of Resources and Deferred Inflows of Resources Related to State Employee Health Insurance Credit Program OPEB At June 30, 2020, the university and college reported a liability of $25,086,861 for its proportionate share of the VRS State Employee Health Insurance Credit Program Net OPEB Liability. The Net VRS State Employee Health Insurance Credit Program OPEB Liability was measured as of June 30, 2019 and the total VRS State Employee Health Insurance Credit Program OPEB liability used to calculate the Net VRS State Employee Health Insurance Credit Program OPEB Liability was determined by an actuarial valuation performed as of June 30, 2018, and rolled forward to the measurement date of June 30, 2019. The university and college’s proportion of the Net VRS State Employee Health Insurance Credit Program OPEB Liability was based on the university and college’s actuarially determined employer contributions to the VRS State Employee Health Insurance Credit Program OPEB plan for the year ended June 30, 2019 relative to the total of the actuarially determined employer contributions for all participating state employers. At June 30, 2019, the university and college’s proportion of the VRS State Employee Health Insurance Credit Program was 2.32% for William & Mary, 0.30% for VIMS, and 0.10% for RBC as compared to 2.35% for William & Mary, 0.31% for VIMS, and 0.11% for RBC at June 30, 2018. For the year ended June 30, 2020, the university and college recognized VRS State Employee Health Insurance Credit Program OPEB expense of $2,185,362. Since there was a change in proportionate share between measurement dates, a portion of the VRS State Employee Health Insurance Credit Program Net OPEB expense was related to deferred amounts from changes in proportion.
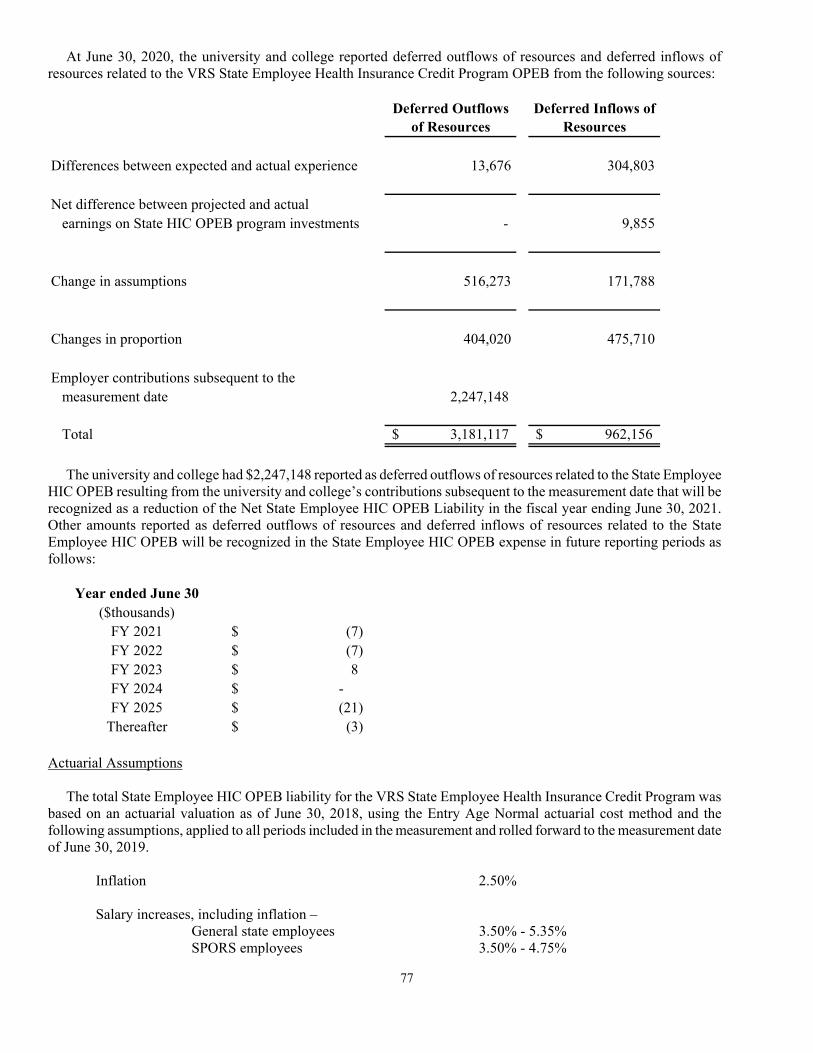
77
At June 30, 2020, the university and college reported deferred outflows of resources and deferred inflows of resources related to the VRS State Employee Health Insurance Credit Program OPEB from the following sources:
Differences between expected and actual experience
Net difference between projected and actual earnings on State HIC OPEB program investments
Change in assumptions
Changes in proportion
Employer contributions subsequent to the measurement date 2,247,148
Total 3,181,117$ 962,156$
404,020 475,710
Deferred Outflows of Resources
Deferred Inflows of Resources
13,676 304,803
- 9,855
516,273 171,788
The university and college had $2,247,148 reported as deferred outflows of resources related to the State Employee HIC OPEB resulting from the university and college’s contributions subsequent to the measurement date that will be recognized as a reduction of the Net State Employee HIC OPEB Liability in the fiscal year ending June 30, 2021. Other amounts reported as deferred outflows of resources and deferred inflows of resources related to the State Employee HIC OPEB will be recognized in the State Employee HIC OPEB expense in future reporting periods as follows:
Year ended June 30($thousands)
FY 2021 (7)$ FY 2022 (7)$ FY 2023 8$ FY 2024 -$ FY 2025 (21)$
Thereafter (3)$ Actuarial Assumptions The total State Employee HIC OPEB liability for the VRS State Employee Health Insurance Credit Program was based on an actuarial valuation as of June 30, 2018, using the Entry Age Normal actuarial cost method and the following assumptions, applied to all periods included in the measurement and rolled forward to the measurement date of June 30, 2019. Inflation 2.50%
Salary increases, including inflation – General state employees 3.50% - 5.35%
SPORS employees 3.50% - 4.75%
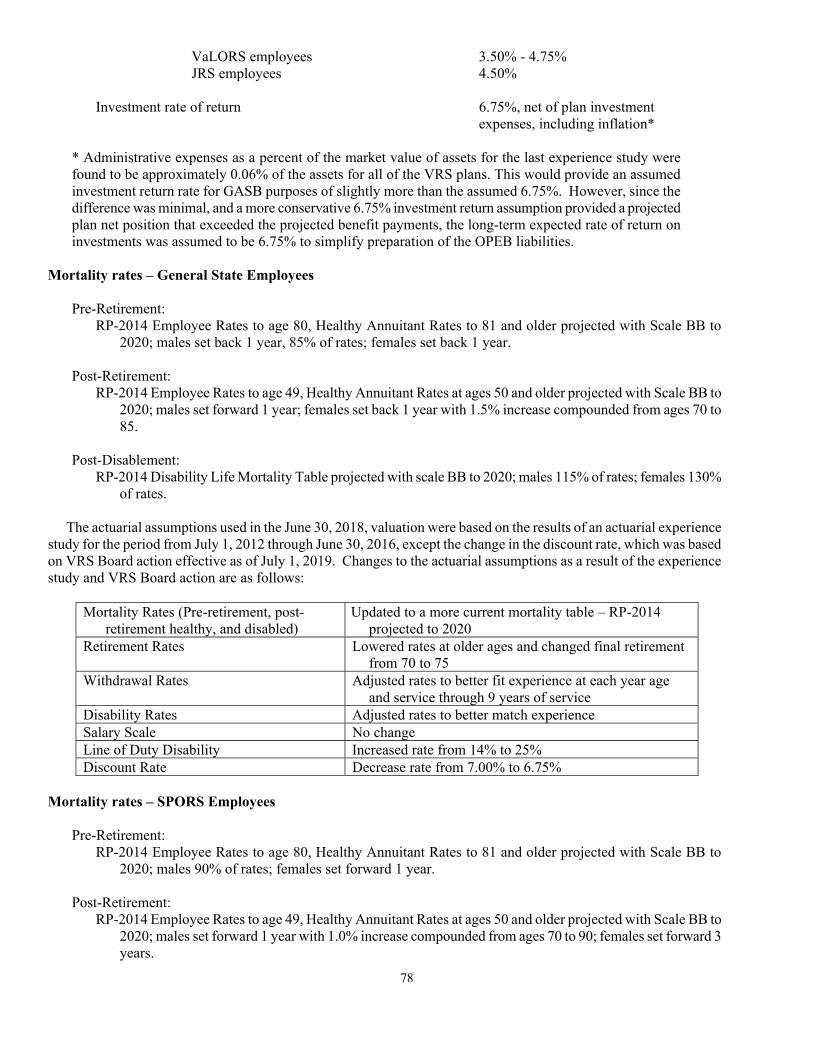
78
VaLORS employees 3.50% - 4.75% JRS employees 4.50% Investment rate of return 6.75%, net of plan investment
expenses, including inflation*
* Administrative expenses as a percent of the market value of assets for the last experience study were found to be approximately 0.06% of the assets for all of the VRS plans. This would provide an assumed investment return rate for GASB purposes of slightly more than the assumed 6.75%. However, since the difference was minimal, and a more conservative 6.75% investment return assumption provided a projected plan net position that exceeded the projected benefit payments, the long-term expected rate of return on investments was assumed to be 6.75% to simplify preparation of the OPEB liabilities.
Mortality rates – General State Employees
Pre-Retirement: RP-2014 Employee Rates to age 80, Healthy Annuitant Rates to 81 and older projected with Scale BB to
2020; males set back 1 year, 85% of rates; females set back 1 year. Post-Retirement:
RP-2014 Employee Rates to age 49, Healthy Annuitant Rates at ages 50 and older projected with Scale BB to 2020; males set forward 1 year; females set back 1 year with 1.5% increase compounded from ages 70 to 85.
Post-Disablement:
RP-2014 Disability Life Mortality Table projected with scale BB to 2020; males 115% of rates; females 130% of rates.
The actuarial assumptions used in the June 30, 2018, valuation were based on the results of an actuarial experience study for the period from July 1, 2012 through June 30, 2016, except the change in the discount rate, which was based on VRS Board action effective as of July 1, 2019. Changes to the actuarial assumptions as a result of the experience study and VRS Board action are as follows:
Mortality Rates (Pre-retirement, post-retirement healthy, and disabled)
Updated to a more current mortality table – RP-2014 projected to 2020
Retirement Rates Lowered rates at older ages and changed final retirement from 70 to 75
Withdrawal Rates Adjusted rates to better fit experience at each year age and service through 9 years of service
Disability Rates Adjusted rates to better match experience Salary Scale No change Line of Duty Disability Increased rate from 14% to 25% Discount Rate Decrease rate from 7.00% to 6.75%
Mortality rates – SPORS Employees
Pre-Retirement:
RP-2014 Employee Rates to age 80, Healthy Annuitant Rates to 81 and older projected with Scale BB to 2020; males 90% of rates; females set forward 1 year.
Post-Retirement:
RP-2014 Employee Rates to age 49, Healthy Annuitant Rates at ages 50 and older projected with Scale BB to 2020; males set forward 1 year with 1.0% increase compounded from ages 70 to 90; females set forward 3 years.

79
Post-Disablement: RP-2014 Disability Life Mortality Table projected with scale BB to 2020; males set forward 2 years; unisex
using 100% male.
The actuarial assumptions used in the June 30, 2018, valuation were based on the results of an actuarial experience study for the period from July 1, 2012 through June 30, 2016, except the change in the discount rate, which was based on VRS Board action effective as of July 1, 2019. Changes to the actuarial assumptions as a result of the experience study and VRS Board action are as follows:
Mortality Rates (Pre-retirement, post-retirement healthy, and disabled)
Updated to a more current mortality table – RP-2014 projected to 2020 and reduced margin for future improvement in accordance with experience
Retirement Rates Increased age 50 rates and lowered rates at older ages Withdrawal Rates Adjusted rates to better fit experience Disability Rates Adjusted rates to better match experience Salary Scale No change Line of Duty Disability Increased rate from 60% to 85% Discount Rate Decrease rate from 7.00% to 6.75%
Mortality rates – VaLORS Employees
Pre-Retirement:
RP-2014 Employee Rates to age 80, Healthy Annuitant Rates to 81 and older projected with Scale BB to 2020; males 90% of rates; females set forward 1 year.
Post-Retirement:
RP-2014 Employee Rates to age 49, Healthy Annuitant Rates at ages 50 and older projected with Scale BB to 2020; males set forward 1 year with 1.0% increase compounded from ages 70 to 90; females set forward 3 years.
Post-Disablement:
RP-2014 Disability Life Mortality Table projected with scale BB to 2020; males set forward 2 years; unisex using 100% male.
The actuarial assumptions used in the June 30, 2018, valuation were based on the results of an actuarial experience study for the period from July 1, 2012 through June 30, 2016, except the change in the discount rate, which was based on VRS Board action effective as of July 1, 2019. Changes to the actuarial assumptions as a result of the experience study and VRS Board action are as follows:
Mortality Rates (Pre-retirement, post-retirement healthy, and disabled)
Updated to a more current mortality table – RP-2014 projected to 2020 and reduced margin for future improvement in accordance with experience
Retirement Rates Increased age 50 rates and lowered rates at older ages Withdrawal Rates Adjusted rates to better fit experience at each year age and
service through 9 years of service Disability Rates Adjusted rates to better match experience Salary Scale No change Line of Duty Disability Decreased rate from 50% to 35% Discount Rate Decrease rate from 7.00% to 6.75%
Mortality rates – JRS Employees
Pre-Retirement:
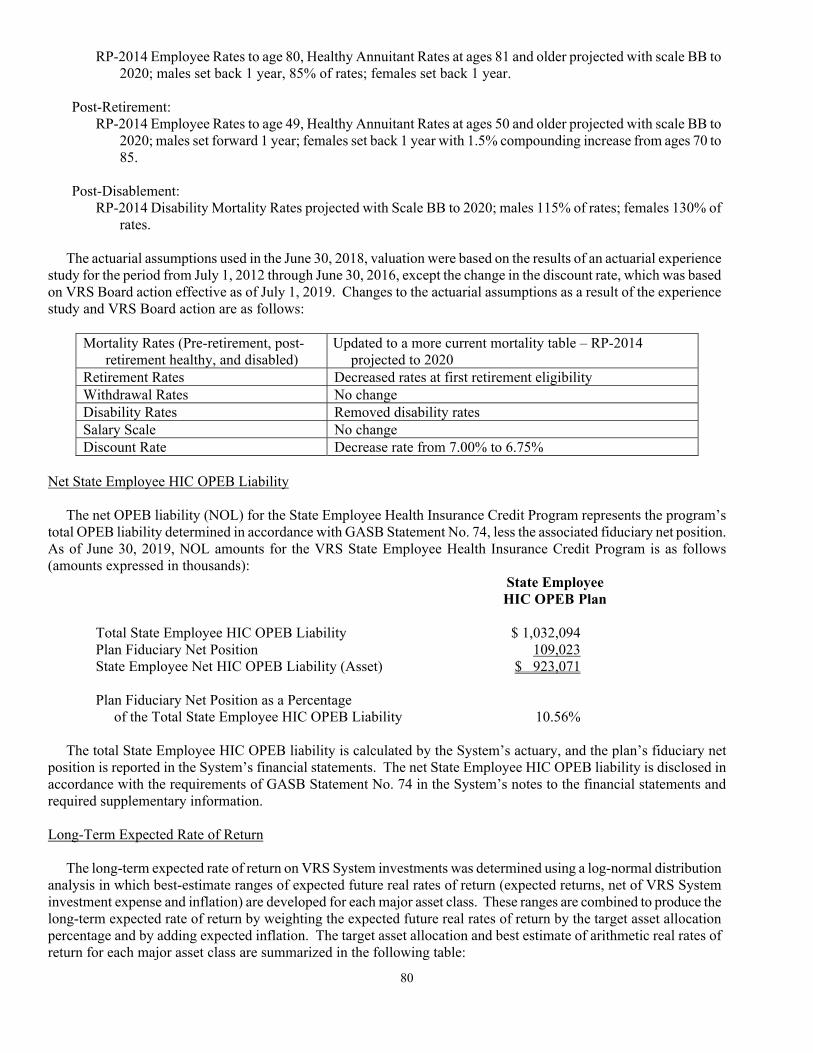
80
RP-2014 Employee Rates to age 80, Healthy Annuitant Rates at ages 81 and older projected with scale BB to 2020; males set back 1 year, 85% of rates; females set back 1 year.
Post-Retirement:
RP-2014 Employee Rates to age 49, Healthy Annuitant Rates at ages 50 and older projected with scale BB to 2020; males set forward 1 year; females set back 1 year with 1.5% compounding increase from ages 70 to 85.
Post-Disablement:
RP-2014 Disability Mortality Rates projected with Scale BB to 2020; males 115% of rates; females 130% of rates.
The actuarial assumptions used in the June 30, 2018, valuation were based on the results of an actuarial experience study for the period from July 1, 2012 through June 30, 2016, except the change in the discount rate, which was based on VRS Board action effective as of July 1, 2019. Changes to the actuarial assumptions as a result of the experience study and VRS Board action are as follows:
Mortality Rates (Pre-retirement, post-retirement healthy, and disabled)
Updated to a more current mortality table – RP-2014 projected to 2020
Retirement Rates Decreased rates at first retirement eligibility Withdrawal Rates No change Disability Rates Removed disability rates Salary Scale No change Discount Rate Decrease rate from 7.00% to 6.75%
Net State Employee HIC OPEB Liability The net OPEB liability (NOL) for the State Employee Health Insurance Credit Program represents the program’s total OPEB liability determined in accordance with GASB Statement No. 74, less the associated fiduciary net position. As of June 30, 2019, NOL amounts for the VRS State Employee Health Insurance Credit Program is as follows (amounts expressed in thousands): State Employee HIC OPEB Plan Total State Employee HIC OPEB Liability $ 1,032,094 Plan Fiduciary Net Position 109,023 State Employee Net HIC OPEB Liability (Asset) $ 923,071 Plan Fiduciary Net Position as a Percentage of the Total State Employee HIC OPEB Liability 10.56% The total State Employee HIC OPEB liability is calculated by the System’s actuary, and the plan’s fiduciary net position is reported in the System’s financial statements. The net State Employee HIC OPEB liability is disclosed in accordance with the requirements of GASB Statement No. 74 in the System’s notes to the financial statements and required supplementary information. Long-Term Expected Rate of Return The long-term expected rate of return on VRS System investments was determined using a log-normal distribution analysis in which best-estimate ranges of expected future real rates of return (expected returns, net of VRS System investment expense and inflation) are developed for each major asset class. These ranges are combined to produce the long-term expected rate of return by weighting the expected future real rates of return by the target asset allocation percentage and by adding expected inflation. The target asset allocation and best estimate of arithmetic real rates of return for each major asset class are summarized in the following table:
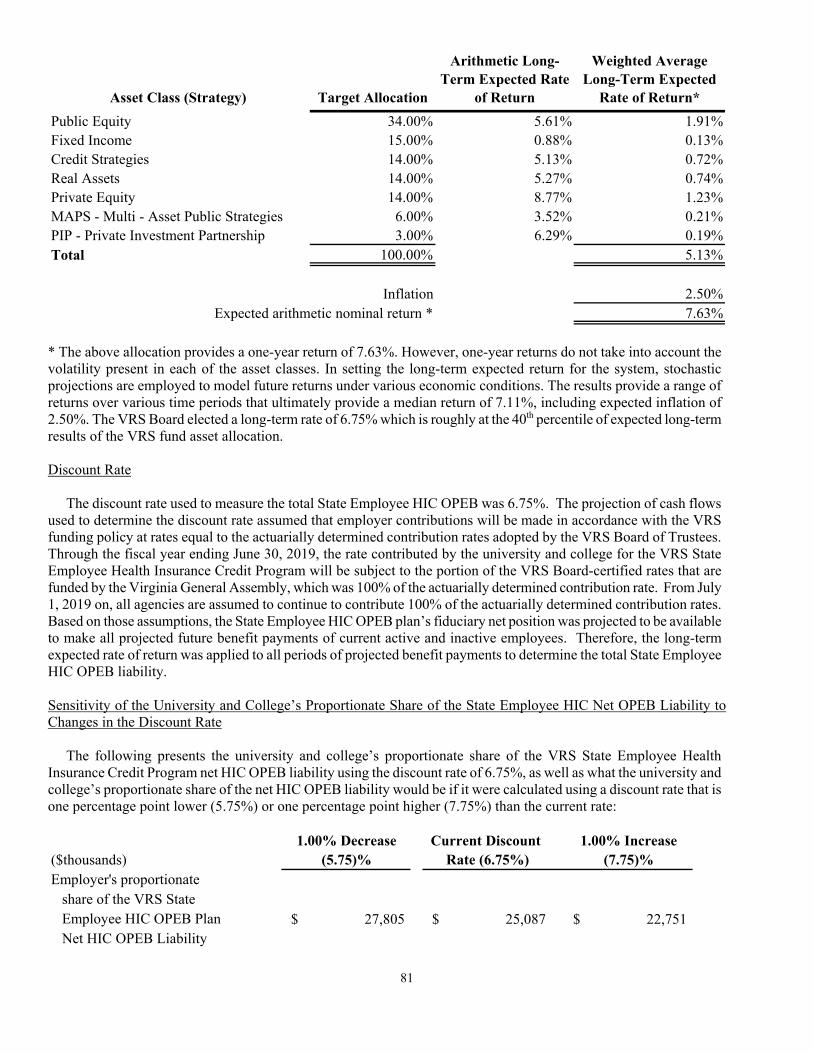
81
Asset Class (Strategy) Target Allocation
Arithmetic Long-Term Expected Rate
of Return
Weighted Average Long-Term Expected
Rate of Return*
Public Equity 34.00% 5.61% 1.91%Fixed Income 15.00% 0.88% 0.13%Credit Strategies 14.00% 5.13% 0.72%Real Assets 14.00% 5.27% 0.74%Private Equity 14.00% 8.77% 1.23%MAPS - Multi - Asset Public Strategies 6.00% 3.52% 0.21%PIP - Private Investment Partnership 3.00% 6.29% 0.19%Total 100.00% 5.13%
Inflation 2.50%Expected arithmetic nominal return * 7.63%
* The above allocation provides a one-year return of 7.63%. However, one-year returns do not take into account the volatility present in each of the asset classes. In setting the long-term expected return for the system, stochastic projections are employed to model future returns under various economic conditions. The results provide a range of returns over various time periods that ultimately provide a median return of 7.11%, including expected inflation of 2.50%. The VRS Board elected a long-term rate of 6.75% which is roughly at the 40th percentile of expected long-term results of the VRS fund asset allocation. Discount Rate The discount rate used to measure the total State Employee HIC OPEB was 6.75%. The projection of cash flows used to determine the discount rate assumed that employer contributions will be made in accordance with the VRS funding policy at rates equal to the actuarially determined contribution rates adopted by the VRS Board of Trustees. Through the fiscal year ending June 30, 2019, the rate contributed by the university and college for the VRS State Employee Health Insurance Credit Program will be subject to the portion of the VRS Board-certified rates that are funded by the Virginia General Assembly, which was 100% of the actuarially determined contribution rate. From July 1, 2019 on, all agencies are assumed to continue to contribute 100% of the actuarially determined contribution rates. Based on those assumptions, the State Employee HIC OPEB plan’s fiduciary net position was projected to be available to make all projected future benefit payments of current active and inactive employees. Therefore, the long-term expected rate of return was applied to all periods of projected benefit payments to determine the total State Employee HIC OPEB liability. Sensitivity of the University and College’s Proportionate Share of the State Employee HIC Net OPEB Liability to Changes in the Discount Rate The following presents the university and college’s proportionate share of the VRS State Employee Health Insurance Credit Program net HIC OPEB liability using the discount rate of 6.75%, as well as what the university and college’s proportionate share of the net HIC OPEB liability would be if it were calculated using a discount rate that is one percentage point lower (5.75%) or one percentage point higher (7.75%) than the current rate:
1.00% Decrease Current Discount 1.00% Increase($thousands) (5.75)% Rate (6.75%) (7.75)%Employer's proportionate share of the VRS State Employee HIC OPEB Plan $ 27,805 $ 25,087 $ 22,751 Net HIC OPEB Liability

82
State Employee HIC OPEB Fiduciary Net Position Detailed information about the VRS State Employee Health Insurance Credit Program’s Fiduciary Net Position is available in the separately issued VRS 2019 Comprehensive Annual Financial Report (CAFR). A copy of the 2019 VRS CAFR may be downloaded from the VRS website at http://www.varetire.org/pdf/publications/2019-annual-report.pdf, or by writing to the System’s Chief Financial Officer at P.O. Box 2500, Richmond, VA, 23218-2500. Payables to the State Employee Health Insurance Credit Program OPEB Plan The university and college reported $89,358 in payables to the Health Insurance Credit Program OPEB Plan. General Information about the VRS Disability Insurance Program Plan Description All full-time and part-time permanent salaried state employees who are covered under the Virginia Retirement System (VRS), the State Police Officers’ Retirement System (SPORS), or the Virginia Law Officers’ Retirement System (VaLORS) hired on or after January 1, 1999, are automatically covered by the Disability Insurance Program (VSDP) upon employment. The Disability Insurance Program also covers state employees hired before January 1, 1999, who elected to transfer to VSDP rather than retain their eligibility to be considered for disability retirement. This plan is administered by the Virginia Retirement System (the System), along with pensions and other OPEB plans, for public employer groups in the Commonwealth of Virginia. The specific information for Disability Insurance Program OPEB, including eligibility, coverage and benefits is set out in the table below:
DISABILITY INSURANCE PROGRAM (VSDP) PLAN PROVISIONS Eligible Employees
The Virginia Sickness and Disability Program (VSDP), also known as the Disability Insurance Trust Fund was established January 1, 1999 to provide short-term and long-term disability benefits for non-work-related and work-related disabilities. Eligible employees are enrolled automatically upon employment. They include:
Full-time and part-time permanent salaried state employees covered under VRS, SPORS and VaLORS (members new to VaLORS following its creation on October 1, 1999, have been enrolled since the inception of VSDP).
State employees hired before January 1, 1999, who elected to transfer to VSDP rather than retain their eligibility to be considered for VRS disability retirement.
Public college and university faculty members who elect the VRS defined benefit plan. They may participate in VSDP or their institution’s disability program, if offered. If the institution does not offer the program or the faculty member does not make an election, he or she is enrolled in VSDP.
Benefit Amounts The Virginia Sickness and Disability Program (VSDP) provides the following benefits for eligible employees:
Leave – Sick, family and personal leave. Eligible leave benefits are paid by the employer. Short-Term Disability – The program provides a short-term disability benefit beginning after a
seven-calendar-day waiting period from the first day of disability. The benefit provides income replacement beginning at 100% of the employee’s pre-disability income, reducing to 80% and then 60% based on the period of the disability and the length of service of the employee. Short-
83
term disability benefits are paid by the employer. Long-Term Disability (LTD) – The program provides a long-term disability benefit beginning
after 125 workdays of short-term disability and continuing until the employee reaches his or her normal retirement age. The benefit provides income replacement of 60% of the employee’s pre-disability income. If an employee becomes disabled within five years of his or her normal retirement age, the employee will receive up to five years of VSDP benefits, provided he or she remains medically eligible. Long-term disability benefits are paid for by the Virginia Disability Insurance Program (VSDP) OPEB Plan.
Income Replacement Adjustment – The program provides for an income replacement adjustment to 80% for catastrophic conditions.
VSDP Long-Term Care Plan – The program also includes a self-funded long-term care plan that assists with the cost of covered long-term care services.
Disability Insurance Program (VSDP) Plan Notes:
Employees hired or rehired on or after July 1, 2009, must satisfy eligibility periods before becoming eligible for non-work-related short-term disability benefits and certain income-replacement levels.
A state employee who is approved for VSDP benefits on or after the date that is five years prior to his or her normal retirement date is eligible for up to five years of VSDP benefits.
Employees on work-related short-term disability receiving only a workers’ compensation payment may be eligible to purchase service credit for this period if retirement contributions are not being withheld from the workers’ compensation payment. The rate will be based on 5.00% of the employee’s compensation.
Cost-of-Living Adjustment (COLA)
During periods an employee receives long-term disability benefits, the LTD benefit may be increased annually by an amount recommended by the actuary and approved by the Board.
o Plan 1 employees vested as of 1/1/2013 – 100% of the VRS Plan 1 COLA (The first 3% increase in the Consumer Price Index for all Urban Consumers (CPI-U) and half of any additional increase (up to 4%) up to a maximum COLA of 5%).
o Plan 1 employee non-vested as of 1/1/2013, Plan 2 and Hybrid Plan employees – 100% of the VRS Plan 2 and Hybrid COLA (The first 2% increase in the Consumer Price Index for all Urban Consumers (CPI-U) and half of any additional increase (up to 2%) up to a maximum COLA of 3%).
For participating full-time employees taking service retirement, the creditable compensation may be increased annually by an amount recommended by the actuary and approved by the Board, from the date of the commencement of the disability to the date of retirement.
o 100% of the increase in the pay over the previous plan year for continuing VSDP members in the State, SPORS and VaLORS Plans, with a maximum COLA of 4.00%.
For participating full-time employees receiving supplemental (work-related) disability benefits, the creditable compensation may be increased annually by an amount recommended by the actuary and approved by the Board, from the date of the commencement of the disability to the date of retirement.
o 100% of the increase in the pay over the previous plan year for continuing VSDP members in the State, SPORS and VaLORS Plans, with a maximum COLA of 4.00%.
Contributions The contribution requirements for the Disability Insurance Program (VSDP) are governed by §51.1-1140 of the Code of Virginia, as amended, but may be impacted as a result of funding provided to state agencies by the Virginia General Assembly. Each employer’s contractually required employer contribution rate for the Disability Insurance
84
Program (VSDP) for the year ended June 30, 2020 was 0.62% of covered employee compensation. This rate was based on an actuarially determined rate from an actuarial valuation as of June 30, 2017. The actuarially determined rate was expected to finance the costs of benefits payable during the year, with an adjustment to amortize the accrued OPEB assets. Contributions to the Disability Insurance Program (VSDP) from the entity were $335,231 and $403,834 for the years ended June 30, 2020 and June 30, 2019, respectively. Disability Insurance Program (VSDP) OPEB Liabilities (Assets), VSDP OPEB Expense, and Deferred Outflows of Resources and Deferred Inflows of Resources Related to the VSDP OPEB At June 30, 2020, the university and college reported an asset of $2,563,781 for its proportionate share of the Net VSDP OPEB Asset. The Net VSDP OPEB Asset was measured as of June 30, 2019 and the total VSDP OPEB liability used to calculate the Net VSDP OPEB Asset was determined by an actuarial valuation as of June 30, 2018, and rolled forward to the measurement date of June 30, 2019. The university and college’s proportion of the Net VSDP OPEB Asset was based on the university and college’s actuarially determined employer contributions to the VSDP OPEB plan for the year ended June 30, 2019 relative to the total of the actuarially determined employer contributions for all participating employers. At June 30, 2019, the university and college’s proportion was 1.04% for William & Mary, 0.22% for VIMS, and 0.05% for RBC as compared to 1.05% for William & Mary, 0.22% for VIMS, and 0.05% for RBC at June 30, 2018. For the year ended June 30, 2020, the university and college recognized VSDP OPEB expense of $256,707. Since there was a change in proportionate share between measurement dates, a portion of the VSDP OPEB expense was related to deferred amounts from changes in proportion. At June 30, 2020, the university and college reported deferred outflows of resources and deferred inflows of resources related to the VSDP OPEB from the following sources:
Differences between expected and actual experience
Net difference between projected and actual earnings on VSDP OPEB program investments
Change in assumptions
Changes in proportion
Employer contributions subsequent to the measurement date 335,231
Total 968,875$ 373,766$
258,858 25,541
Deferred Outflows of Resources
Deferred Inflows of Resources
328,254 103,205
- 99,006
46,532 146,014
The university and college had $335,231 reported as deferred outflows of resources related to the VSDP OPEB resulting from the university and college’s contributions subsequent to the measurement date that will be recognized as an adjustment of the Net VSDP OPEB Asset in the Fiscal Year ending June 30, 2021. Other amounts reported as deferred outflows of resources and deferred inflows of resources related to the VSDP OPEB will be recognized in VSDP OPEB expense in future reporting periods as follows:

85
Year ended June 30($thousands)
FY 2021 10$ FY 2022 10$ FY 2023 62$ FY 2024 66$ FY 2025 62$
Thereafter 50$ Actuarial Assumptions The total VSDP OPEB liability was based on an actuarial valuation as of June 30, 2018, using the Entry Age Normal actuarial cost method and the following assumptions, applied to all periods included in the measurement and rolled forward to the measurement date of June 30, 2019.
Inflation 2.50%
Salary increases, including Inflation – General state employees 3.50% - 5.35% SPORS employees 3.50% - 4.75% VaLORS employees 3.50% - 4.75% Investment rate of return 6.75%, net of investment expenses, including inflation*
* Administrative expenses as a percent of the market value of assets for the last experience study were found to be approximately 0.06% of the market assets for all of the VRS plans. This would provide an assumed investment return rate for GASB purposes of slightly more than the assumed 6.75%. However, since the difference was minimal, and a more conservative 6.75% investment return assumption provided a projected plan net position that exceeded the projected benefit payments, the long-term expected rate of return on investments was assumed to be 6.75% to simplify preparation of OPEB liabilities.
Mortality rates – General State Employees
Pre-Retirement: RP-2014 Employee Rates to age 80, Healthy Annuitant Rates to 81 and older projected with Scale BB to
2020; males set back 1 year, 85% of rates; females set back 1 year. Post-Retirement:
RP-2014 Employee Rates to age 49, Healthy Annuitant Rates at ages 50 and older projected with Scale BB to 2020; males set forward 1 year; females set back 1 year with 1.5% increase compounded from ages 70 to 85.
Post-Disablement:
RP-2014 Disability Life Mortality Table projected with scale BB to 2020; males 115% of rates; females 130% of rates.
The actuarial assumptions used in the June 30, 2018 valuation were based on the results of an actuarial experience study for the period from July 1, 2012 through June 30, 2016, except the change in the discount rate, which was based on VRS Board action effective as of July 1, 2019. Changes to the actuarial assumptions as a result of the experience study and VRS Board action are as follows:
Mortality Rates (Pre-retirement, post- Updated to a more current mortality table – RP-2014

86
retirement healthy, and disabled) projected to 2020 Retirement Rates Lowered rates at older ages and changed final retirement
from 70 to 75 Withdrawal Rates Adjusted rates to better fit experience at each year age
and service through 9 years of service Disability Rates Adjusted rates to better match experience Salary Scale No change Line of Duty Disability Increased rate from 14% to 25% Discount Rate Decrease rate from 7.00% to 6.75%
Mortality rates – SPORS Employees
Pre-Retirement:
RP-2014 Employee Rates to age 80, Healthy Annuitant Rates to 81 and older projected with Scale BB to 2020; males 90% of rates; females set forward 1 year.
Post-Retirement:
RP-2014 Employee Rates to age 49, Healthy Annuitant Rates at ages 50 and older projected with Scale BB to 2020; males set forward 1 year with 1.0% increase compounded from ages 70 to 90; females set forward 3 years.
Post-Disablement:
RP-2014 Disability Life Mortality Table projected with scale BB to 2020; males set forward 2 years; unisex using 100% male.
The actuarial assumptions used in the June 30, 2018 valuation were based on the results of an actuarial experience study for the period from July 1, 2012 through June 30, 2016, except the change in the discount rate, which was based on VRS Board action effective as of July 1, 2019. Changes to the actuarial assumptions as a result of the experience study and VRS Board action are as follows:
Mortality Rates (Pre-retirement, post-retirement healthy, and disabled)
Updated to a more current mortality table – RP-2014 projected to 2020 and reduced margin for future improvement in accordance with experience
Retirement Rates Increased age 50 rates and lowered rates at older ages Withdrawal Rates Adjusted rates to better fit experience Disability Rates Adjusted rates to better match experience Salary Scale No change Line of Duty Disability Increased rate from 60% to 85% Discount Rate Decrease rate from 7.00% to 6.75%
Mortality rates – VaLORS Employees
Pre-Retirement:
RP-2014 Employee Rates to age 80, Healthy Annuitant Rates to 81 and older projected with Scale BB to 2020; males 90% of rates; females set forward 1 year.
Post-Retirement:
RP-2014 Employee Rates to age 49, Healthy Annuitant Rates at ages 50 and older projected with Scale BB to 2020; males set forward 1 year with 1.0% increase compounded from ages 70 to 90; females set forward 3 years.
Post-Disablement:
RP-2014 Disability Life Mortality Table projected with scale BB to 2020; males set forward 2 years; unisex using 100% male.
87
The actuarial assumptions used in the June 30, 2018 valuation were based on the results of an actuarial experience study for the period from July 1, 2012 through June 30, 2016, except the change in the discount rate, which was based on VRS Board action effective as of July 1, 2019. Changes to the actuarial assumptions as a result of the experience study and VRS Board action are as follows:
Mortality Rates (Pre-retirement, post-retirement healthy, and disabled)
Updated to a more current mortality table – RP-2014 projected to 2020 and reduced margin for future improvement in accordance with experience
Retirement Rates Increased age 50 rates and lowered rates at older ages Withdrawal Rates Adjusted rates to better fit experience at each year age and
service through 9 years of service Disability Rates Adjusted rates to better match experience Salary Scale No change Line of Duty Disability Decreased rate from 50% to 35% Discount Rate Decrease rate from 7.00% to 6.75%
Net VSDP OPEB Liability (Asset) The net OPEB asset (NOA) for the Disability Insurance Program (VSDP) represents the program’s total OPEB liability determined in accordance with GASB Statement No. 74, less the associated fiduciary net position. As of the Measurement Date of June 30, 2019, NOA amounts for the Disability Insurance Program (VSDP) are as follows (amounts expressed in thousands): Virginia Sickness and Disability Program Total VSDP OPEB Liability $ 292,046 Plan Fiduciary Net Position 488,241 VSDP Net OPEB Liability (Asset) ($ 196,195) Plan Fiduciary Net Position as a Percentage of the Total VSDP OPEB Liability 167.18% The total VSDP OPEB liability is calculated by the System’s actuary, and each plan’s fiduciary net position is reported in the System’s financial statements. The net OPEB asset is disclosed in accordance with the requirements of GASB Statement No. 74 in the System’s notes to the financial statements and required supplementary information. Long-Term Expected Rate of Return The long-term expected rate of return on System investments was determined using a log-normal distribution analysis in which best-estimate ranges of expected future real rates of return (expected returns, net of VRS System investment expense and inflation) are developed for each major asset class. These ranges are combined to produce the long-term expected rate of return by weighting the expected future real rates of return by the target asset allocation percentage and by adding expected inflation. The target asset allocation and best estimate of arithmetic real rates of return for each major asset class are summarized in the following table:

88
Asset Class (Strategy) Target Allocation
Arithmetic Long-Term Expected Rate
of Return
Weighted Average Long-Term Expected
Rate of Return*
Public Equity 34.00% 5.61% 1.91%Fixed Income 15.00% 0.88% 0.13%Credit Strategies 14.00% 5.13% 0.72%Real Assets 14.00% 5.27% 0.74%Private Equity 14.00% 8.77% 1.23%MAPS - Multi - Asset Public Strategies 6.00% 3.52% 0.21%PIP - Private Investment Partnership 3.00% 6.29% 0.19%Total 100.00% 5.13%
Inflation 2.50%Expected arithmetic nominal return * 7.63%
* The above allocation provides a one-year return of 7.63%. However, one-year returns do not take into account the volatility present in each of the asset classes. In setting the long-term expected return for the system, stochastic projections are employed to model future returns under various economic conditions. The results provide a range of returns over various time periods that ultimately provide a median return of 7.11%, including expected inflation of 2.50%. The VRS Board elected a long-term rate of 6.75% which is roughly at the 40th percentile of expected long-term results of the VRS fund asset allocation. Discount Rate The discount rate used to measure the total VSDP OPEB liability was 6.75%. The projection of cash flows used to determine the discount rate assumed that employer contributions will be made per the VRS Statutes and that they will be made in accordance with the VRS funding policy and at rates equal to the actuarially determined contribution rates adopted by the VRS Board of Trustees. Through the fiscal year ending June 30, 2019, the rate contributed by participating employers to the VSDP OPEB Program will be subject to the portion of the VRS Board-certified rates that are funded by the Virginia General Assembly which was 100% of the actuarially determined contribution rate. From July 1, 2019 on, participating employers are assumed to continue to contribute 100% of the actuarially determined contribution rates. Based on those assumptions, the VSDP OPEB Program’s fiduciary net position was projected to be available to make all projected future benefit payments of current active and inactive employees. Therefore, the long-term expected rate of return was applied to all periods of projected benefit payments to determine the total VSDP OPEB liability. Sensitivity of the University and College’s Proportionate Share of the Net VSDP OPEB Asset to Changes in the Discount Rate The following presents the university and college’s proportionate share of the net VSDP OPEB asset using the discount rate of 6.75%, as well as what the university and college’s proportionate share of the net VSDP OPEB asset would be if it were calculated using a discount rate that is one percentage point lower (5.75%) or one percentage point higher (7.75%) than the current rate:
1.00% Decrease Current Discount 1.00% Increase($thousands) (5.75)% Rate (6.75%) (7.75)%Employer’s proportionate share of the total VSDP Net OPEB Liability (Asset) $ (2,328) $ (2,564) $ (2,773)

89
VSDP OPEB Fiduciary Net Position Detailed information about the Disability Insurance Program (VSDP) Fiduciary Net Position is available in the separately issued VRS 2019 Comprehensive Annual Financial Report (CAFR). A copy of the 2019 VRS CAFR may be downloaded from the VRS website at http://www.varetire.org/pdf/publications/2019-annual-report.pdf, or by writing to the System’s Chief Financial Officer at P.O. Box 2500, Richmond, VA, 23218-2500. Payables to the Disability Insurance Program (VSDP) OPEB Plan The university and college reported $15,449 in payables to the VSDP OPEB Plan. General Information about the Line of Duty Act Program Plan Description All paid employees and volunteers in hazardous duty positions in Virginia localities and hazardous duty employees who are covered under the Virginia Retirement System (VRS), the State Police Officers’ Retirement System (SPORS), or the Virginia Law Officers’ Retirement System (VaLORS) are automatically covered by the Line of Duty Act Program (LODA). As required by statute, the Virginia Retirement System (the System) is responsible for managing the assets of the program. Participating employers made contributions to the program beginning in FY 2012. The employer contributions are determined by the System’s actuary using anticipated program costs and the number of covered individuals associated with all participating employers. The specific information for the Line of Duty Act Program OPEB, including eligibility, coverage and benefits is set out in the table below:
LINE OF DUTY ACT PROGRAM (LODA) PLAN PROVISIONS Eligible Employees
The eligible employees of the Line of Duty Act Program (LODA) are paid employees and volunteers in hazardous duty positions in Virginia localities and hazardous duty employees who are covered under the Virginia Retirement System (VRS), the State Police Officers’ Retirement System (SPORS), or the Virginia Law Officers’ Retirement System (VaLORS).
Benefit Amounts The Line of Duty Act Program (LODA) provides death and health insurance benefits for eligible individuals:
Death – The Line of Duty Act program death benefit is a one-time payment made to the beneficiary or beneficiaries of a covered individual. Amounts vary as follows:
o $100,000 when a death occurs as the direct or proximate result of performing duty as of January 1, 2006, or after.
o $25,000 when the cause of death is attributed to one of the applicable presumptions and occurred earlier than five years after the retirement date.
o An additional $20,000 benefit is payable when certain members of the National Guard and U.S. military reserves are killed in action in any armed conflict on or after October 7, 2001.
Health Insurance – The Line of Duty Act program provides health insurance benefits. o Prior to July 1, 2017, these benefits were managed through the various employer plans
and maintained the benefits that existed prior to the employee’s death or disability. These premiums were reimbursed to the employer by the LODA program.
o Beginning July 1, 2017, the health insurance benefits are managed through the Virginia Department of Human Resource Management (DHRM). The health benefits are
90
modeled after the State Employee Health Benefits Program plans and provide consistent, premium-free continued health plan coverage for LODA-eligible disabled individuals, survivors and family members. Individuals receiving the health insurance benefits must continue to meet eligibility requirements as defined by the Line of Duty Act.
Contributions The contribution requirements for the Line of Duty Act Program (LODA) are governed by §9.1-400.1 of the Code of Virginia, as amended, but may be impacted as a result of funding provided to state agencies by the Virginia General Assembly. Each employer’s contractually required employer contribution rate for the Line of Duty Act Program (LODA) for the year ended June 30, 2020 was $705.77 per covered full-time-equivalent employee. This rate was based on an actuarially determined rate from an actuarial valuation as of June 30, 2017 and represents the pay-as-you-go funding rate and not the full actuarial cost of the benefits under the program. The actuarially determined pay-as-you-go rate was expected to finance the costs and related expenses of benefits payable during the year. Contributions to the Line of Duty Act Program (LODA) from the university and college were $28,231 and $15,527 for the years ended June 30, 2020 and June 30, 2019, respectively. Line of Duty Act Program (LODA) OPEB Liabilities, LODA OPEB Expense, and Deferred Outflows of Resources and Deferred Inflows of Resources Related to the LODA OPEB At June 30, 2020, the university and college reported a liability of $415,044 for its proportionate share of the Net LODA OPEB Liability. The Net LODA OPEB Liability was measured as of June 30, 2019 and the total LODA OPEB liability used to calculate the Net LODA OPEB Liability was determined by an actuarial valuation as of June 30, 2018, and rolled forward to the measurement date of June 30, 2019. The university and college’s proportion of the Net LODA OPEB Liability was based on the university and college’s actuarially determined pay-as-you-go employer contributions to the LODA OPEB plan for the year ended June 30, 2019 relative to the total of the actuarially determined pay-as-you-go employer contributions for all participating employers. At June 30, 2019, the university and college’s proportion was 0.09% for William & Mary, and 0.02% for RBC as compared to 0.07% for William & Mary, and 0.06% for RBC at June 30, 2018. For the year ended June 30, 2020, the university and college recognized LODA OPEB expense of $32,449. Since there was a change in proportionate share between measurement dates, a portion of the LODA OPEB expense was related to deferred amounts from changes in proportion. At June 30, 2020, the university and college reported deferred outflows of resources and deferred inflows of resources related to the LODA OPEB from the following sources:

91
Differences between expected and actual experience
Net difference between projected and actual earnings on LODA OPEB program investments
Change in assumptions
Changes in proportion
Employer contributions subsequent to the measurement date 28,231
Total 211,018$ 160,396$
102,987 123,595
Deferred Outflows of Resources
Deferred Inflows of Resources
60,326 -
- 821
19,474 35,980
The university and college had $28,231 reported as deferred outflows of resources related to the LODA OPEB resulting from the university and college’s contributions subsequent to the measurement date that will be recognized as a reduction of the Net LODA OPEB Liability in the Fiscal Year ending June 30, 2021. Other amounts reported as deferred outflows of resources and deferred inflows of resources related to the LODA OPEB will be recognized in LODA OPEB expense in future reporting periods as follows:
Year ended June 30($thousands)
FY 2021 3$ FY 2022 3$ FY 2023 4$ FY 2024 4$ FY 2025 4$
Thereafter 4$ Actuarial Assumptions The total LODA OPEB liability was based on an actuarial valuation as of June 30, 2018, using the Entry Age Normal actuarial cost method and the following assumptions, applied to all periods included in the measurement and rolled forward to the measurement date of June 30, 2019.
Inflation 2.50% Salary increases, including Inflation –
General state employees N/A SPORS employees N/A VaLORS employees N/A Locality employees N/A
Medical cost trend rates assumption –
Under age 65 7.25% - 4.75%
92
Ages 65 and older 5.50% - 4.75% Year of ultimate trend rate Post-65 Fiscal year ended 2023 Pre-65 Fiscal year ended 2028 Investment rate of return 3.50%, including inflation*
* Administrative expenses as a percent of the market value of assets for the last experience study were found to be approximately 0.06% of the market assets for all of the VRS plans. This would provide an assumed investment return rate for GASB purposes of slightly more than the assumed 3.50%. However, since the difference was minimal, a more conservative 3.50% investment return assumption has been used. Since LODA is funded on a current-disbursement basis, the assumed annual rate of return of 3.50% was used since it approximates the risk-free rate of return.
Mortality rates – General State Employees
Pre-Retirement: RP-2014 Employee Rates to age 80, Healthy Annuitant Rates to 81 and older projected with Scale BB to
2020; males set back 1 year, 85% of rates; females set back 1 year. Post-Retirement:
RP-2014 Employee Rates to age 49, Healthy Annuitant Rates at ages 50 and older projected with Scale BB to 2020; males set forward 1 year; females set back 1 year with 1.5% increase compounded from ages 70 to 85.
Post-Disablement:
RP-2014 Disability Life Mortality Table projected with scale BB to 2020; males 115% of rates; females 130% of rates.
The actuarial assumptions used in the June 30, 2018 valuation were based on the results of an actuarial experience study for the period from July 1, 2012 through June 30, 2016. Changes to the actuarial assumptions as a result of the experience study are as follows:
Mortality Rates (Pre-retirement, post-retirement healthy, and disabled)
Updated to a more current mortality table – RP-2014 projected to 2020
Retirement Rates Lowered rates at older ages and changed final retirement from 70 to 75
Withdrawal Rates Adjusted rates to better fit experience at each year age and service through 9 years of service
Disability Rates Adjusted rates to better match experience Salary Scale No change Line of Duty Disability Increased rate from 14% to 25%
Mortality rates – SPORS Employees
Pre-Retirement:
RP-2014 Employee Rates to age 80, Healthy Annuitant Rates to 81 and older projected with Scale BB to 2020; males 90% of rates; females set forward 1 year.
Post-Retirement:
RP-2014 Employee Rates to age 49, Healthy Annuitant Rates at ages 50 and older projected with Scale BB to 2020; males set forward 1 year with 1.0% increase compounded from ages 70 to 90; females set forward 3 years.
93
Post-Disablement: RP-2014 Disability Life Mortality Table projected with scale BB to 2020; males set forward 2 years; unisex using 100% male.
The actuarial assumptions used in the June 30, 2018 valuation were based on the results of an actuarial experience study for the period from July 1, 2012 through June 30, 2016. Changes to the actuarial assumptions as a result of the experience study are as follows:
Mortality Rates (Pre-retirement, post-retirement healthy, and disabled)
Updated to a more current mortality table – RP-2014 projected to 2020 and reduced margin for future improvement in accordance with experience
Retirement Rates Increased age 50 rates and lowered rates at older ages Withdrawal Rates Adjusted rates to better fit experience Disability Rates Adjusted rates to better match experience Salary Scale No change Line of Duty Disability Increased rate from 60% to 85%
Mortality rates – VaLORS Employees
Pre-Retirement:
RP-2014 Employee Rates to age 80, Healthy Annuitant Rates to 81 and older projected with Scale BB to 2020; males 90% of rates; females set forward 1 year.
Post-Retirement:
RP-2014 Employee Rates to age 49, Healthy Annuitant Rates at ages 50 and older projected with Scale BB to 2020; males set forward 1 year with 1.0% increase compounded from ages 70 to 90; females set forward 3 years.
Post-Disablement:
RP-2014 Disability Life Mortality Table projected with scale BB to 2020; males set forward 2 years; unisex using 100% male.
The actuarial assumptions used in the June 30, 2018 valuation were based on the results of an actuarial experience study for the period from July 1, 2012 through June 30, 2016. Changes to the actuarial assumptions as a result of the experience study are as follows:
Mortality Rates (Pre-retirement, post-retirement healthy, and disabled)
Updated to a more current mortality table – RP-2014 projected to 2020 and reduced margin for future improvement in accordance with experience
Retirement Rates Increased age 50 rates and lowered rates at older ages Withdrawal Rates Adjusted rates to better fit experience at each year age and
service through 9 years of service Disability Rates Adjusted rates to better match experience Salary Scale No change Line of Duty Disability Decreased rate from 50% to 35%
Mortality rates – Largest Ten Locality Employers With Public Safety Employees
Pre-Retirement:
RP-2014 Employee Rates to age 80, Healthy Annuitant Rates to 81 and older projected with Scale BB to 2020; males 90% of rates; females set forward 1 year.
Post-Retirement:

94
RP-2014 Employee Rates to age 49, Healthy Annuitant Rates at ages 50 and older projected with Scale BB to 2020; males set forward 1 year with 1.0% increase compounded from ages 70 to 90; females set forward 3 years.
Post-Disablement:
RP-2014 Disability Life Mortality Table projected with scale BB to 2020; males set forward 2 years; unisex using 100% male.
The actuarial assumptions used in the June 30, 2018 valuation were based on the results of an actuarial experience study for the period from July 1, 2012 through June 30, 2016. Changes to the actuarial assumptions as a result of the experience study are as follows:
Mortality Rates (Pre-retirement, post-retirement healthy, and disabled)
Updated to a more current mortality table – RP-2014 projected to 2020
Retirement Rates Lowered retirement rates at older ages Withdrawal Rates Adjusted termination rates to better fit experience at each
age and service year Disability Rates Increased disability rates Salary Scale No change Line of Duty Disability Increased rate from 60% to 70%
Mortality rates – Non- Largest Ten Locality Employers With Public Safety Employees
Pre-Retirement:
RP-2014 Employee Rates to age 80, Healthy Annuitant Rates to 81 and older projected with Scale BB to 2020; males 90% of rates; females set forward 1 year.
Post-Retirement:
RP-2014 Employee Rates to age 49, Healthy Annuitant Rates at ages 50 and older projected with Scale BB to 2020; males set forward 1 year with 1.0% increase compounded from ages 70 to 90; females set forward 3 years.
Post-Disablement:
RP-2014 Disability Life Mortality Table projected with scale BB to 2020; males set forward 2 years; unisex using 100% male.
The actuarial assumptions used in the June 30, 2018 valuation were based on the results of an actuarial experience study for the period from July 1, 2012 through June 30, 2016. Changes to the actuarial assumptions as a result of the experience study are as follows:
Mortality Rates (Pre-retirement, post-retirement healthy, and disabled)
Updated to a more current mortality table – RP-2014 projected to 2020
Retirement Rates Increased age 50 rates and lowered rates at older ages Withdrawal Rates Adjusted rates to better fit experience at each age and
service year Disability Rates Adjusted rates to better match experience Salary Scale No change Line of Duty Disability Decreased rate from 60% to 45%
Net LODA OPEB Liability The net OPEB liability (NOL) for the Line of Duty Act Program (LODA) represents the program’s total OPEB liability determined in accordance with GASB Statement No. 74, less the associated fiduciary net position. As of the

95
Measurement Date of June 30, 2019, NOL amounts for the Line of Duty Act Program (LODA) are as follows (amounts expressed in thousands): Line of Duty Program Act Total LODA OPEB Liability $ 361,626 Plan Fiduciary Net Position 2,839 LODA Net OPEB Liability (Asset) $ 358,787 Plan Fiduciary Net Position as a Percentage of the Total LODA OPEB Liability 0.79% The total LODA OPEB liability is calculated by the System’s actuary, and each plan’s fiduciary net position is reported in the System’s financial statements. The net OPEB liability is disclosed in accordance with the requirements of GASB Statement No. 74 in the System’s notes to the financial statements and required supplementary information. Long-Term Expected Rate of Return The long-term expected rate of return on LODA OPEB Program’s investments was set at 3.50% for this valuation. Since LODA is funded on a current-disbursement basis, it is not able to use the VRS Pooled Investments 6.75% assumption. Instead, the assumed annual rate of return of 3.50% was used since it approximates the risk-free rate of return. This Single Equivalent Interest Rate (SEIR) is the applicable municipal bond index rate based on the Bond Buyer General Obligation 20-year Municipal Bond Index as of the measurement date of June 30, 2019. Discount Rate The discount rate used to measure the total LODA OPEB liability was 3.50%. The projection of cash flows used to determine the discount rate assumed that employer contributions will be made per the VRS Statutes and that they will be made in accordance with the VRS funding policy and at rates equal to the actuarially determined contribution rates adopted by the VRS Board of Trustees. Through the fiscal year ending June 30, 2019, the rate contributed by participating employers to the LODA OPEB Program will be subject to the portion of the VRS Board-certified rates that are funded by the Virginia General Assembly. Sensitivity of the University and College’s Proportionate Share of the Net LODA OPEB Liability to Changes in the Discount Rate The following presents the university and college’s proportionate share of the net LODA OPEB liability using the discount rate of 3.50%, as well as what the university and college’s proportionate share of the net LODA OPEB liability would be if it were calculated using a discount rate that is one percentage point lower (2.50%) or one percentage point higher (4.50%) than the current rate:
1.00% Decrease Current Discount 1.00% Increase($thousands) (2.50%) Rate (3.50%) (4.50%)Covered employer’s proportionate share of the total LODA $ 481 $ 415 $ 362
Net OPEB Liability Sensitivity of the University and College’s Proportionate Share of the Net LODA OPEB Liability to Changes in the Health Care Trend Rate Because the Line of Duty Act Program (LODA) contains a provision for the payment of health insurance premiums, the liabilities are also impacted by the health care trend rates. The following presents the university and college’s proportionate share of the net LODA OPEB liability using health care trend rate of 7.75% decreasing to 4.75%, as well

96
as what the university and college’s proportionate share of the net LODA OPEB liability would be if it were calculated using a health care trend rate that is one percentage point lower (6.75% decreasing to 3.75%) or one percentage point higher (8.75% decreasing to 5.75%) than the current rate:
1.00% DecreaseCurrent Health
Trend Rate 1.00% Increase
($thousands)6.75% decreasing to
3.75%7.75% decreasing to
4.75%8.75% decreasing to
5.75%
$ 351 $ 415 $ 496 Covered employers proportionate share of the LODA Net OPEB Liability LODA OPEB Plan Fiduciary Net Position Detailed information about the Line of Duty Act Program (LODA) Fiduciary Net Position is available in the separately issued VRS 2019 Comprehensive Annual Financial Report (CAFR). A copy of the 2019 VRS CAFR may be downloaded from the VRS website at http://www.varetire.org/pdf/publications/2019-annual-report.pdf, or by writing to the System’s Chief Financial Officer at P.O. Box 2500, Richmond, VA, 23218-2500. General Information about the Pre-Medicare Retiree Healthcare Plan Plan Description The Commonwealth provides a healthcare plan established by Title 2.2, Chapter 28 of the Code of Virginia for retirees who are not yet eligible to participate in Medicare.
Following are eligibility requirements for Virginia Retirement System retirees: You are a retiring state employee who is eligible for a monthly retirement benefit from the Virginia Retirement
System (VRS), and You start receiving (do not defer) your retirement benefit immediately upon retirement*, and Your last employer before retirement was the Commonwealth of Virginia, and You were eligible for (even if you were not enrolled) coverage as an active employee in the State Health
Benefits Program until your retirement date (not including Extended Coverage/COBRA), and You enroll no later than 31 days from your retirement date.
*For VRS retirees, this means that your employing agency reported a retirement contribution or leave without pay status for retirement in the month immediately prior to your retirement date. Some faculty members may also be eligible if they are paid on an alternate pay cycle but maintain eligibility for active coverage until their retirement date.
Effective January 1, 2017**, following are eligibility requirements for Optional Retirement Plan retirees: You are a terminating state employee who participates in one of the qualified Optional Retirement Plans, and Your last employer before termination was the Commonwealth of Virginia, and You were eligible for (even if you were not enrolled) coverage in the State Employee Health Benefits Program
for active employees at the time of your termination, and You meet the age and service requirements for an immediate retirement benefit under the non-ORP Virginia
Retirement System plan that you would have been eligible for on your date of hire had you not elected the ORP, and
97
You enroll in the State Retiree Health Benefits Program no later than 31 days from the date you lose coverage (or lose eligibility for coverage) in the State Health Benefits Program for active employees due to your termination of employment.
**This change applies to ORP terminations effective January 1, 2017, or later. Eligibility for those who terminated employment prior to January 1 should be determined based on the policy in place at the time of their termination.
The employer does not pay a portion of the retirees’ healthcare premium; however, since both active employees and retirees are included in the same pool for purposes of determining health insurance rates, this generally results in a higher rate for active employees. Therefore, the employer effectively subsidizes the costs of the participating retirees’ healthcare through payment of the employer’s portion of the premiums for active employees.
This fund is reported as part of the Commonwealth’s Healthcare Internal Service Fund. Benefit payments are recognized when due and payable in accordance with the benefit terms. Pre-Medicare Retiree Healthcare is a single-employer defined benefit OPEB plan that is treated like a cost-sharing plan for financial reporting purposes and is administered by the Department of Human Resource Management. There were approximately 4,800 retirees and 89,000 active employees in the program in fiscal year 2019. There are no inactive employees entitled to future benefits who are not currently receiving benefits. There are no assets accumulated in a trust to pay benefits.
Actuarial Assumptions and Methods The total Pre-Medicare Retiree Healthcare OPEB liability was based on an actuarial valuation with a valuation date of June 30, 2019. The Department of Human Resource Management selected the economic, demographic and healthcare claim cost assumptions. The actuary provided guidance with respect to these assumptions. Initial healthcare costs trend rates used were 7.00 percent for medical and pharmacy and 4.0 percent for dental. The ultimate trend rates used were 4.50 percent for medical and pharmacy and 4.0 percent for dental.
Valuation Date Actuarially determined contribution rates are calculated as of June 30, one year prior to the end of the fiscal year in which contributions are reported.
Measurement Date June 30, 2019 (one year prior to the end of the fiscal year)
Actuarial Cost Method Entry Age Normal
Amortization Method Level dollar, Closed
Effective Amortization Period 6.25 years
Discount Rate 3.51%
Projected Salary Increases 4.0%
Medical Trend Under 65 Medical & Rx: 7.00% to 4.50% Dental: 4.00% Before reflecting Excise tax
Year of Ultimate Trend 2029
Mortality Mortality rates vary by participant status
Pre-Retirement: RP-2014 Employee Rates; males setback 1 year, 85% of rates; females setback 1 year
Post-Retirement RP-2014 Employee Rates to age 49, Healthy Annuitant Rates at ages 50 and older projected with Scale BB to 2020; males
98
set forward 1 year; females setback 1 year
Post-Disablement: RP-2014 Disabled Mortality Rates projected with Scale BB to 2020; males 115% of rates; females 130% of rates
The discount rate was based on the Bond Buyers GO 20 Municipal Bond Index as of the measurement date which is June 30, 2019.
Changes of Assumptions: The following actuarial assumptions were updated since the June 30, 2018 valuation based on recent experience:
Spousal Coverage – reduced the rate from 35% to 25% Retiree Participation - reduced the rate from 60% to 50%
Spousal coverage and retiree participation were both reduced based on a blend of recent experience and the prior year assumptions. The mortality assumption was modified slightly to reflect modified pre-retirement Mortality base rates to exclude age over 65 instead of apply mortality improvement projection scale BB. The excise tax was modified to reflect updated projection of the tax thresholds. Trend rates were updated based on economic conditions as of 6/30/2019. Additionally, the discount rate was decreased from 3.87% to 3.51% based on the Bond Buyers GO 20 Municipal Bond Index. Pre-Medicare Retiree Healthcare OPEB Liabilities, OPEB Expense, and Deferred Outflow of Resources and Deferred Inflows of Resources At June 30, 2020 the university and college reported a liability of $18,500,393 for its proportionate share of the collective total Pre-Medicare Retiree Healthcare OPEB liability of $678.9 million. The Pre-Medicare Retiree Healthcare OPEB liability was measured as of June 30, 2019 and was determined by an actuarial valuation as of June 30, 2019. The covered employer’s proportion of the Pre-Medicare Retiree Healthcare OPEB liability was based on each employer’s healthcare premium contributions as a percentage of the total employer’s healthcare premium contributions for all participating employers. At June 30, 2019, the participating employer’s proportion was 2.7251% as compared to 2.7155% at June 30, 2018. For the year ended June 30, 2020, the participating employer recognized Pre-Medicare Retiree Healthcare OPEB expense of ($1,659,385). At June 30, 2020, the university and college reported deferred outflows of resources and deferred inflows of resources related to Pre-Medicare Retiree Healthcare from the following sources:
Deferred Deferred
Outflows Inflows
(1) Difference between actual and expected experience $ - $ 9,387,336
(2) Change in assumptions - 12,817,347
(3) Changes in proportion 1,820,044 315,270
(4) Rounding adjustment - -
(5) Subtotal 1,820,044 22,519,953
(6) Amounts associated with transactions
subsequent to the measurement date 787,645
(7) Total 2,607,689$ 22,519,953$
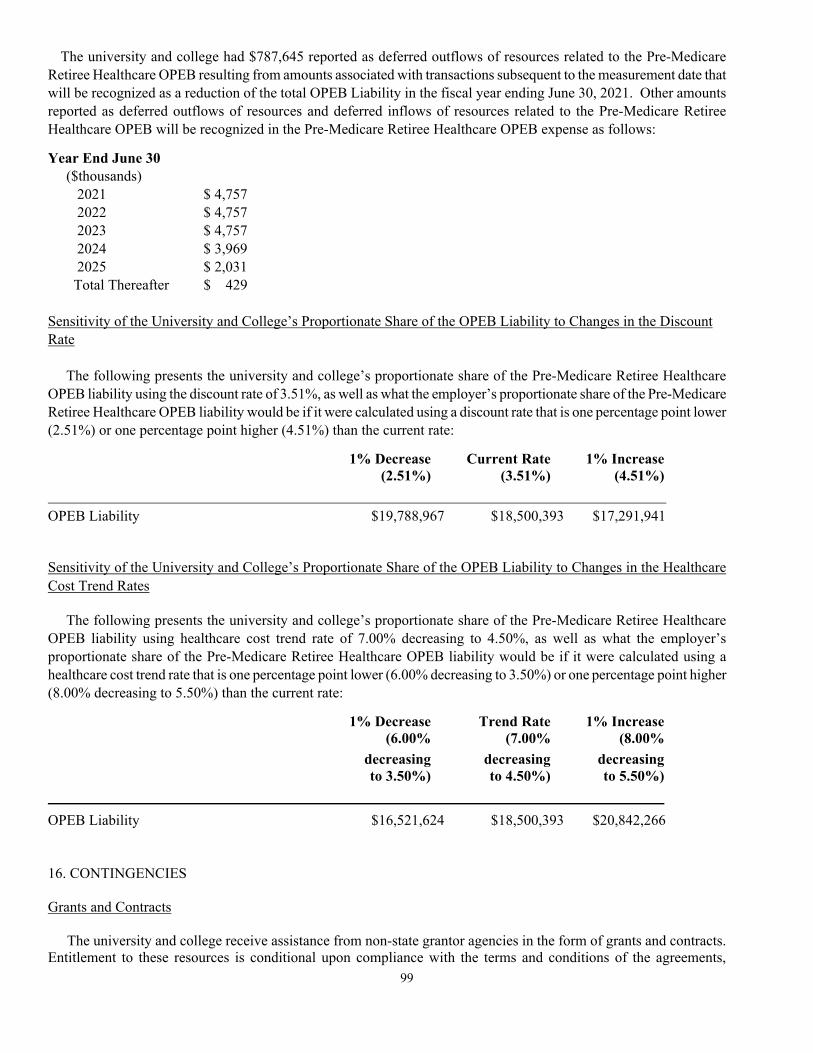
99
The university and college had $787,645 reported as deferred outflows of resources related to the Pre-Medicare Retiree Healthcare OPEB resulting from amounts associated with transactions subsequent to the measurement date that will be recognized as a reduction of the total OPEB Liability in the fiscal year ending June 30, 2021. Other amounts reported as deferred outflows of resources and deferred inflows of resources related to the Pre-Medicare Retiree Healthcare OPEB will be recognized in the Pre-Medicare Retiree Healthcare OPEB expense as follows:
Year End June 30 ($thousands) 2021 $ 4,757 2022 $ 4,757 2023 $ 4,757 2024 $ 3,969 2025 $ 2,031 Total Thereafter $ 429 Sensitivity of the University and College’s Proportionate Share of the OPEB Liability to Changes in the Discount Rate The following presents the university and college’s proportionate share of the Pre-Medicare Retiree Healthcare OPEB liability using the discount rate of 3.51%, as well as what the employer’s proportionate share of the Pre-Medicare Retiree Healthcare OPEB liability would be if it were calculated using a discount rate that is one percentage point lower (2.51%) or one percentage point higher (4.51%) than the current rate:
1% Decrease Current Rate 1% Increase (2.51%) (3.51%) (4.51%)
OPEB Liability $19,788,967 $18,500,393 $17,291,941
Sensitivity of the University and College’s Proportionate Share of the OPEB Liability to Changes in the Healthcare Cost Trend Rates
The following presents the university and college’s proportionate share of the Pre-Medicare Retiree Healthcare OPEB liability using healthcare cost trend rate of 7.00% decreasing to 4.50%, as well as what the employer’s proportionate share of the Pre-Medicare Retiree Healthcare OPEB liability would be if it were calculated using a healthcare cost trend rate that is one percentage point lower (6.00% decreasing to 3.50%) or one percentage point higher (8.00% decreasing to 5.50%) than the current rate:
1% Decrease Trend Rate 1% Increase (6.00% (7.00% (8.00%
decreasing decreasing decreasing to 3.50%) to 4.50%) to 5.50%)
OPEB Liability $16,521,624 $18,500,393 $20,842,266
16. CONTINGENCIES Grants and Contracts The university and college receive assistance from non-state grantor agencies in the form of grants and contracts. Entitlement to these resources is conditional upon compliance with the terms and conditions of the agreements,

100
including the expenditure of resources for eligible purposes. Substantially all grants and contracts are subject to financial and compliance audits by the grantors. Any disallowances as a result of these audits become a liability. As of June 30, 2020, the university and college estimate that no material liabilities will result from such audits. Litigation Neither the university nor college are involved in any litigation at this time. 17. RISK MANAGEMENT The university and college are exposed to various risks of loss related to torts; theft of, damage to, and destruction of assets; errors and omissions; non-performance of duty; injuries to employees; and natural disasters. The university and college participate in insurance plans maintained by the Commonwealth of Virginia. The state employee health care and worker’s compensation plans are administered by the Department of Human Resource Management and the risk management insurance plans are administered by the Department of Treasury, Division of Risk Management. Risk management insurance includes property, general liability, medical malpractice, faithful performance of duty bond, automobile, and air and watercraft plans. The university and college pay premiums to each of these departments for its insurance coverage. Information relating to the Commonwealth’s insurance plans is available at the statewide level in the Commonwealth of Virginia’s Comprehensive Annual Financial Report. 18. ADVANCE FROM THE TREASURER OF VIRGINIA Section 4-3.02 of the Appropriation Act describes the circumstances under which agencies and institutions may borrow funds from the state treasury, including prefunding for capital projects in anticipation of bond sale proceeds and operating funds in anticipation of federal revenues. As of June 30, 2020, there was $0 in outstanding Advances from the Treasurer. The amount outstanding from June 30, 2019 was repaid with proceeds from bond proceeds used to renovate Landrum Hall Dormitory.
Beginning EndingBalance Additions Reductions Balance
Renovate Landrum 796,803$ - (796,803) -$
19. SUBSEQUENT EVENTS In October of 2020, William & Mary issued Series 2020A Tax Exempt General Revenue Pledge bonds in the amount of $13,665,000. The bonds were issued with interest rates varying from 3 to 5 percent and will mature in 2038. In addition, the university issued Series 2020B Taxable General Revenue Pledge bonds in the amount of $137,495,000. The taxable bonds were issued with interest rates varying from .613 to 3.123 percent and will mature in 2051. $57,819,131 was deposited in an irrevocable trust for the refunding of existing debt. In November of 2020, the Commonwealth of Virginia issued Series 2020B General Obligation Refunding Bonds in which William & Mary was a participating institution. The university’s share of the par amount of the bonds was $9,980,000. The original bonds were used to finance the construction of new fraternity dormitories. The bonds were issued with interest rates varying from 0.55 to 1.410 percent and will mature in 2031. Interest payments will be made semi-annually. Principal payments will be made annually. The refunding generated $1.6 million in present value savings.

101
Required Supplementary Information (RSI) For the Fiscal Year Ended June 30, 2020

102
Required Supplementary Information (RSI) Cost-Sharing Employer Plans – VRS State Employee Retirement Plan
And VaLORS Retirement Plan For the Fiscal Year Ended June 30, 2020
Schedule of Employer's Share of Net Pension LiabilityVRS State Employee Retirement PlanFor the Measurement Dates of June 30, 2019, 2018, 2017, 2016, 2015, and 2014
2019 2018 2017 2016 2015 2014
Employer's Proportion of the Net Pension
Liability (Asset)
Employer's Proportionate Share of the Net
Pension Liability (Asset) 119,007,516$
Employer's Covered Payroll 75,292,682$ 75,543,886$ 69,557,841$ 73,645,076$ 70,307,029$ 66,605,228$
Employer's Proportionate Share of the Net Pension Liability (Asset) as a Percentage 158.06% 136.56% 162.22% 172.86% 163.30% 149.25% of its Covered Payroll
Plan Fiduciary Net Position as a Percentage
of the Total Pension Liability
Schedule is intended to show information for 10 years. Since 2019 is the sixth year for this presentation, there are only six years available.However, additional years will be included as they become available.
74.28%
$ 103,164,000 $ 112,835,000 $ 127,302,000 $ 114,809,000 $ 99,411,000
75.13% 77.39% 75.33% 71.29% 72.81%
1.88% 1.90% 1.94% 1.93% 1.87% 1.78%
Schedule of Employer's Share of Net Pension LiabilityVaLORS Retirement PlanFor the Measurement Dates of June 30, 2019, 2018, 2017, 2016, 2015, and 2014
2019 2018 2017 2016 2015 2014Employer's Proportion of the Net Pension Liability (Asset)
Employer's Proportionate Share of the Net Pension Liability (Asset) 2,579,656$
Employer's Covered Payroll 1,296,489$ 1,032,174$ 1,147,028$ 1,048,421$ 989,861$ 1,101,243$
Employer's Proportionate Share of the Net Pension Liability (Asset) as a Percentage 198.97% 201.23% 191.10% 207.93% 198.82% 183.79% of its Covered Payroll
Plan Fiduciary Net Position as a Percentage of the Total Pension Liability
Schedule is intended to show information for 10 years. Since 2019 is the sixth year for this presentation, there are only six years available.However, additional years will be included as they become available.
$ 2,024,000
63.05%
$ 2,077,000 $ 2,192,000 $ 2,180,000 $ 1,968,000
68.31% 69.56% 67.22% 61.01% 62.64%
0.37% 0.33% 0.34% 0.28% 0.28% 0.30%

103
Schedule of Employer ContributionsVRS State Employee Retirement PlanFor the Years Ended June 30, 2015 through 2020
Contributions in Relation to Contributions
Contractually Contractually Contribution Employer's as a % ofRequired Required Deficiency Covered Covered
Contribution Contribution (Excess) Payroll PayrollDate (1) (2) (3) (4) (5)
2020 10,375,428 10,375,428 - 76,741,331 13.52%2019 10,172,038 10,172,038 - 75,292,682 13.51%2018 10,190,870 10,190,870 - 75,543,886 13.49%2017 9,383,353 9,383,353 - 69,557,841 13.49%2016 10,163,204 10,163,204 - 73,645,076 13.80%2015 8,668,857 8,668,857 - 70,307,029 12.33%
Schedule is intended to show information for 10 years. Since 2020 is the sixth year for this presentation,there are only six years available. However, additional years will be included as they become available.
Schedule of Employer ContributionsVaLORS Retirement PlanFor the Years Ended June 30, 2015 through 2020
Contributions in Relation to Contributions
Contractually Contractually Contribution Employer's as a % ofRequired Required Deficiency Covered Covered
Contribution Contribution (Excess) Payroll PayrollDate (1) (2) (3) (4) (5)
2020 296,504 296,504 - 1,372,067 21.61%2019 267,451 267,451 - 1,296,489 20.63%2018 217,273 217,273 - 1,032,174 21.05%2017 241,450 241,450 - 1,147,028 21.05%2016 196,427 196,427 - 1,048,421 18.74%2015 174,908 174,908 - 989,861 17.67%
Schedule is intended to show information for 10 years. Since 2020 is the sixth year for this presentation,there are only six years available. However, additional years will be included as they become available.
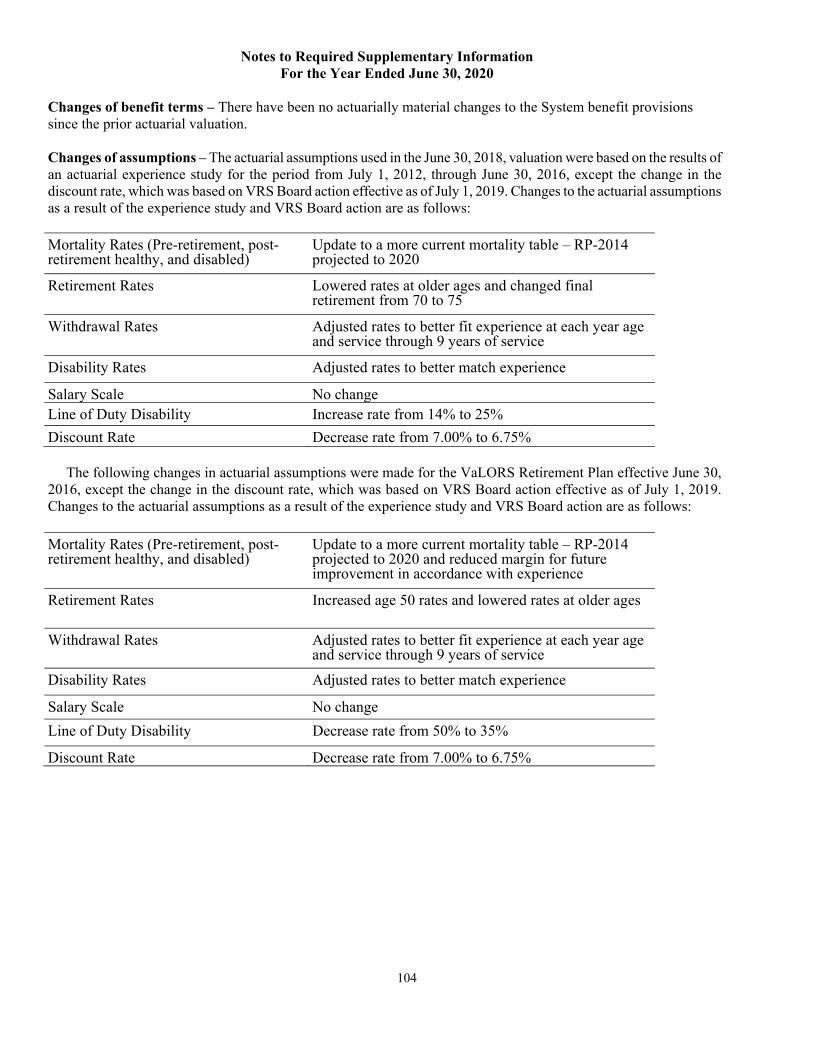
104
Notes to Required Supplementary Information For the Year Ended June 30, 2020
Changes of benefit terms – There have been no actuarially material changes to the System benefit provisions since the prior actuarial valuation. Changes of assumptions – The actuarial assumptions used in the June 30, 2018, valuation were based on the results of an actuarial experience study for the period from July 1, 2012, through June 30, 2016, except the change in the discount rate, which was based on VRS Board action effective as of July 1, 2019. Changes to the actuarial assumptions as a result of the experience study and VRS Board action are as follows: Mortality Rates (Pre-retirement, post-retirement healthy, and disabled)
Update to a more current mortality table – RP-2014 projected to 2020
Retirement Rates Lowered rates at older ages and changed final retirement from 70 to 75
Withdrawal Rates Adjusted rates to better fit experience at each year age and service through 9 years of service
Disability Rates Adjusted rates to better match experience
Salary Scale No change Line of Duty Disability Increase rate from 14% to 25%
Discount Rate Decrease rate from 7.00% to 6.75% The following changes in actuarial assumptions were made for the VaLORS Retirement Plan effective June 30, 2016, except the change in the discount rate, which was based on VRS Board action effective as of July 1, 2019. Changes to the actuarial assumptions as a result of the experience study and VRS Board action are as follows:
Mortality Rates (Pre-retirement, post-retirement healthy, and disabled)
Update to a more current mortality table – RP-2014 projected to 2020 and reduced margin for future improvement in accordance with experience
Retirement Rates Increased age 50 rates and lowered rates at older ages
Withdrawal Rates Adjusted rates to better fit experience at each year age and service through 9 years of service
Disability Rates Adjusted rates to better match experience
Salary Scale No change
Line of Duty Disability Decrease rate from 50% to 35%
Discount Rate Decrease rate from 7.00% to 6.75%
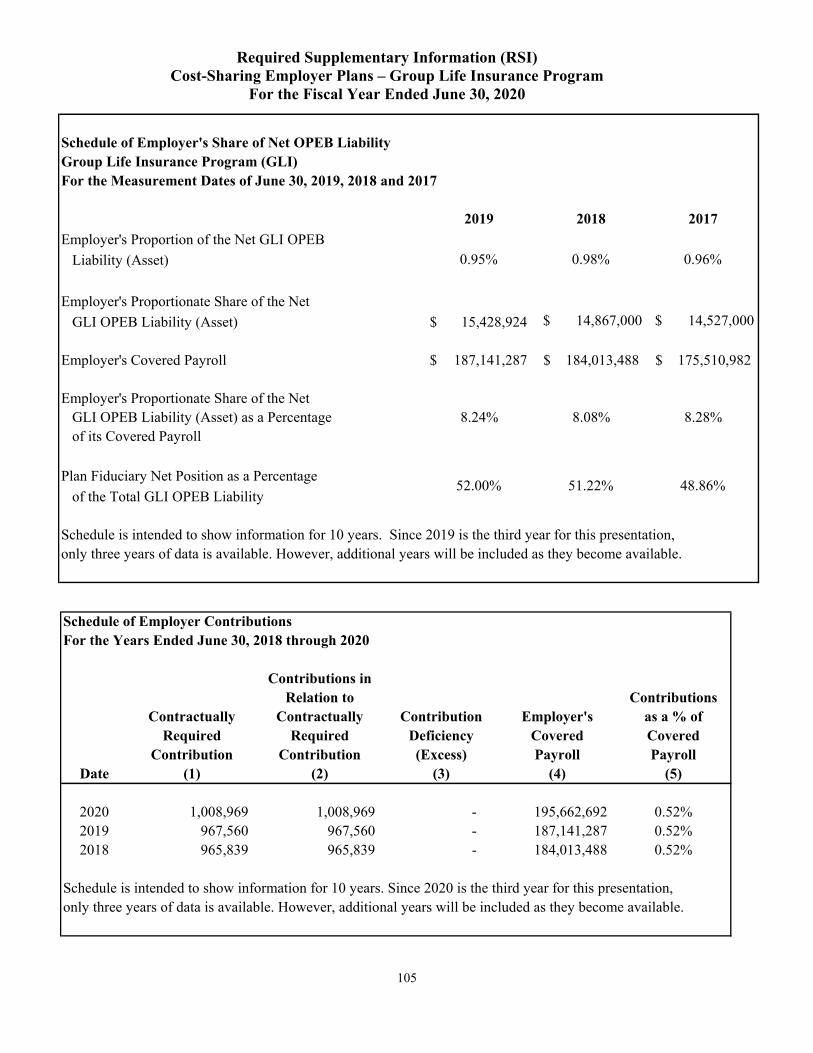
105
Required Supplementary Information (RSI) Cost-Sharing Employer Plans – Group Life Insurance Program
For the Fiscal Year Ended June 30, 2020
Schedule of Employer's Share of Net OPEB LiabilityGroup Life Insurance Program (GLI)For the Measurement Dates of June 30, 2019, 2018 and 2017
2019 2018 2017
Employer's Proportion of the Net GLI OPEB
Liability (Asset)
Employer's Proportionate Share of the Net
GLI OPEB Liability (Asset) 15,428,924$
Employer's Covered Payroll 187,141,287$ 184,013,488$ 175,510,982$
Employer's Proportionate Share of the Net GLI OPEB Liability (Asset) as a Percentage 8.24% 8.08% 8.28% of its Covered Payroll
Plan Fiduciary Net Position as a Percentage
of the Total GLI OPEB Liability
Schedule is intended to show information for 10 years. Since 2019 is the third year for this presentation,only three years of data is available. However, additional years will be included as they become available.
52.00%
0.95% 0.98% 0.96%
$ 14,867,000 $ 14,527,000
51.22% 48.86%
Schedule of Employer ContributionsFor the Years Ended June 30, 2018 through 2020
Contributions in Relation to Contributions
Contractually Contractually Contribution Employer's as a % ofRequired Required Deficiency Covered Covered
Contribution Contribution (Excess) Payroll PayrollDate (1) (2) (3) (4) (5)
2020 1,008,969 1,008,969 - 195,662,692 0.52%2019 967,560 967,560 - 187,141,287 0.52%2018 965,839 965,839 - 184,013,488 0.52%
Schedule is intended to show information for 10 years. Since 2020 is the third year for this presentation,only three years of data is available. However, additional years will be included as they become available.
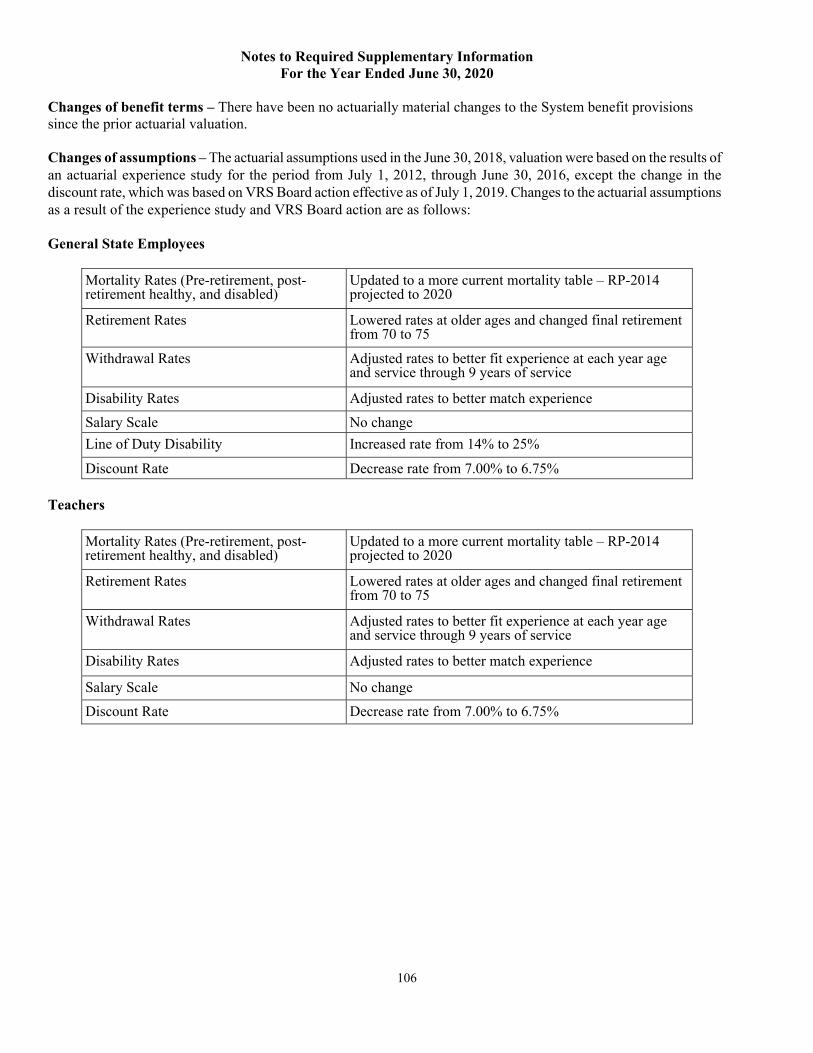
106
Notes to Required Supplementary Information For the Year Ended June 30, 2020
Changes of benefit terms – There have been no actuarially material changes to the System benefit provisions since the prior actuarial valuation. Changes of assumptions – The actuarial assumptions used in the June 30, 2018, valuation were based on the results of an actuarial experience study for the period from July 1, 2012, through June 30, 2016, except the change in the discount rate, which was based on VRS Board action effective as of July 1, 2019. Changes to the actuarial assumptions as a result of the experience study and VRS Board action are as follows: General State Employees
Mortality Rates (Pre-retirement, post-retirement healthy, and disabled)
Updated to a more current mortality table – RP-2014 projected to 2020
Retirement Rates Lowered rates at older ages and changed final retirement from 70 to 75
Withdrawal Rates Adjusted rates to better fit experience at each year age and service through 9 years of service
Disability Rates Adjusted rates to better match experience
Salary Scale No change
Line of Duty Disability Increased rate from 14% to 25%
Discount Rate Decrease rate from 7.00% to 6.75%
Teachers
Mortality Rates (Pre-retirement, post-retirement healthy, and disabled)
Updated to a more current mortality table – RP-2014 projected to 2020
Retirement Rates Lowered rates at older ages and changed final retirement from 70 to 75
Withdrawal Rates Adjusted rates to better fit experience at each year age and service through 9 years of service
Disability Rates Adjusted rates to better match experience
Salary Scale No change
Discount Rate Decrease rate from 7.00% to 6.75%
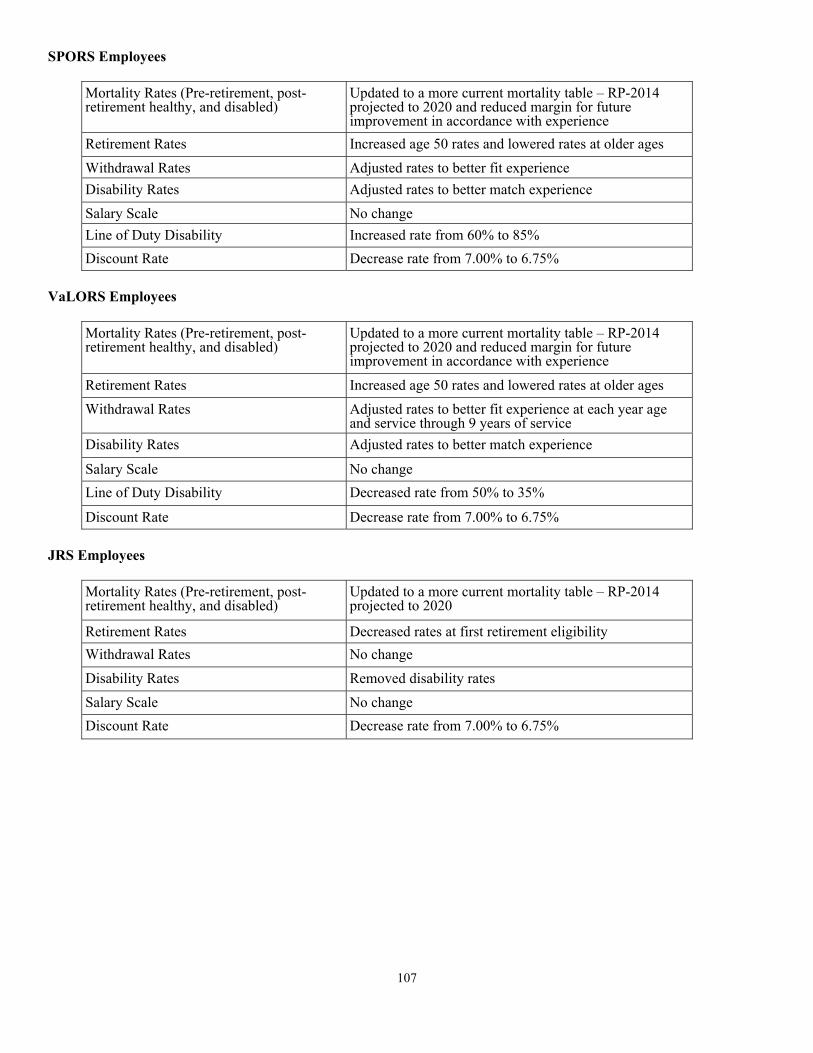
107
SPORS Employees
Mortality Rates (Pre-retirement, post-retirement healthy, and disabled)
Updated to a more current mortality table – RP-2014 projected to 2020 and reduced margin for future improvement in accordance with experience
Retirement Rates Increased age 50 rates and lowered rates at older ages
Withdrawal Rates Adjusted rates to better fit experience
Disability Rates Adjusted rates to better match experience
Salary Scale No change
Line of Duty Disability Increased rate from 60% to 85%
Discount Rate Decrease rate from 7.00% to 6.75%
VaLORS Employees
Mortality Rates (Pre-retirement, post-retirement healthy, and disabled)
Updated to a more current mortality table – RP-2014 projected to 2020 and reduced margin for future improvement in accordance with experience
Retirement Rates Increased age 50 rates and lowered rates at older ages
Withdrawal Rates Adjusted rates to better fit experience at each year age and service through 9 years of service
Disability Rates Adjusted rates to better match experience
Salary Scale No change
Line of Duty Disability Decreased rate from 50% to 35%
Discount Rate Decrease rate from 7.00% to 6.75%
JRS Employees
Mortality Rates (Pre-retirement, post-retirement healthy, and disabled)
Updated to a more current mortality table – RP-2014 projected to 2020
Retirement Rates Decreased rates at first retirement eligibility
Withdrawal Rates No change
Disability Rates Removed disability rates
Salary Scale No change
Discount Rate Decrease rate from 7.00% to 6.75%
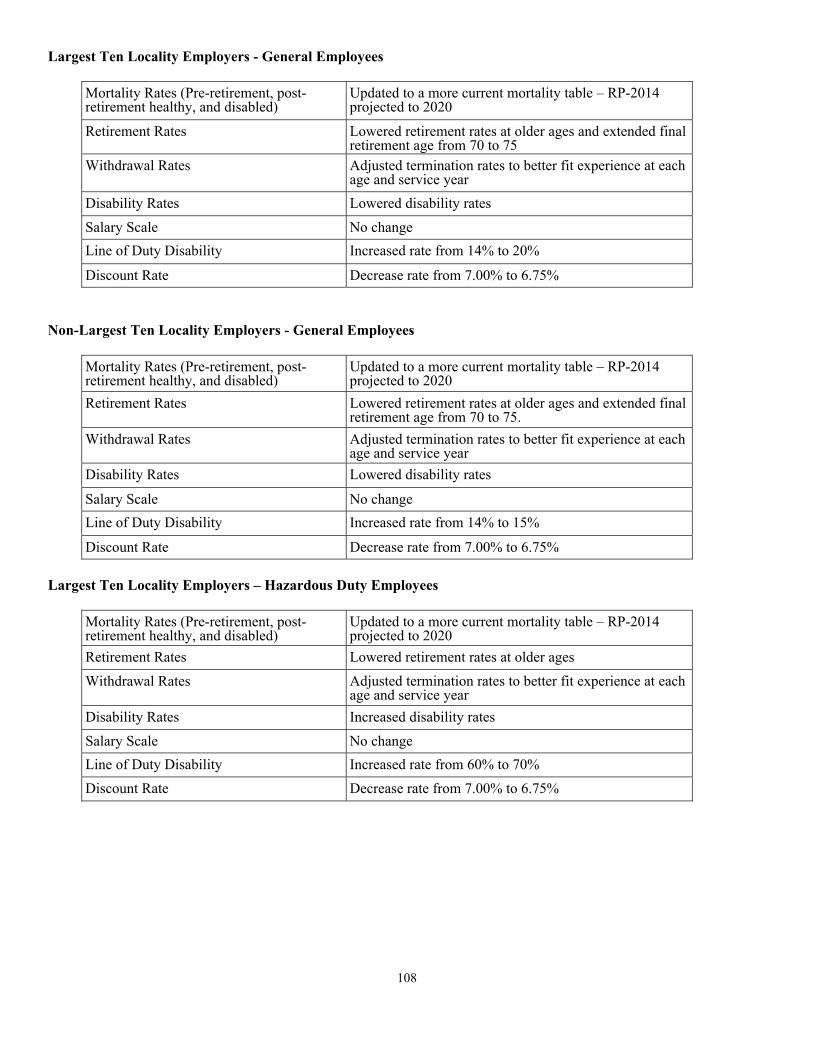
108
Largest Ten Locality Employers - General Employees
Mortality Rates (Pre-retirement, post-retirement healthy, and disabled)
Updated to a more current mortality table – RP-2014 projected to 2020
Retirement Rates Lowered retirement rates at older ages and extended final retirement age from 70 to 75
Withdrawal Rates Adjusted termination rates to better fit experience at each age and service year
Disability Rates Lowered disability rates
Salary Scale No change
Line of Duty Disability Increased rate from 14% to 20%
Discount Rate Decrease rate from 7.00% to 6.75%
Non-Largest Ten Locality Employers - General Employees
Mortality Rates (Pre-retirement, post-retirement healthy, and disabled)
Updated to a more current mortality table – RP-2014 projected to 2020
Retirement Rates Lowered retirement rates at older ages and extended final retirement age from 70 to 75.
Withdrawal Rates Adjusted termination rates to better fit experience at each age and service year
Disability Rates Lowered disability rates
Salary Scale No change
Line of Duty Disability Increased rate from 14% to 15%
Discount Rate Decrease rate from 7.00% to 6.75%
Largest Ten Locality Employers – Hazardous Duty Employees
Mortality Rates (Pre-retirement, post-retirement healthy, and disabled)
Updated to a more current mortality table – RP-2014 projected to 2020
Retirement Rates Lowered retirement rates at older ages
Withdrawal Rates Adjusted termination rates to better fit experience at each age and service year
Disability Rates Increased disability rates
Salary Scale No change
Line of Duty Disability Increased rate from 60% to 70%
Discount Rate Decrease rate from 7.00% to 6.75%

109
Non-Largest Ten Locality Employers – Hazardous Duty Employees
Mortality Rates (Pre-retirement, post-retirement healthy, and disabled)
Updated to a more current mortality table – RP-2014 projected to 2020
Retirement Rates Increased age 50 rates and lowered rates at older ages
Withdrawal Rates Adjusted termination rates to better fit experience at each age and service year
Disability Rates Adjusted rates to better match experience
Salary Scale No change
Line of Duty Disability Decreased rate from 60% to 45%
Discount Rate Decrease rate from 7.00% to 6.75%
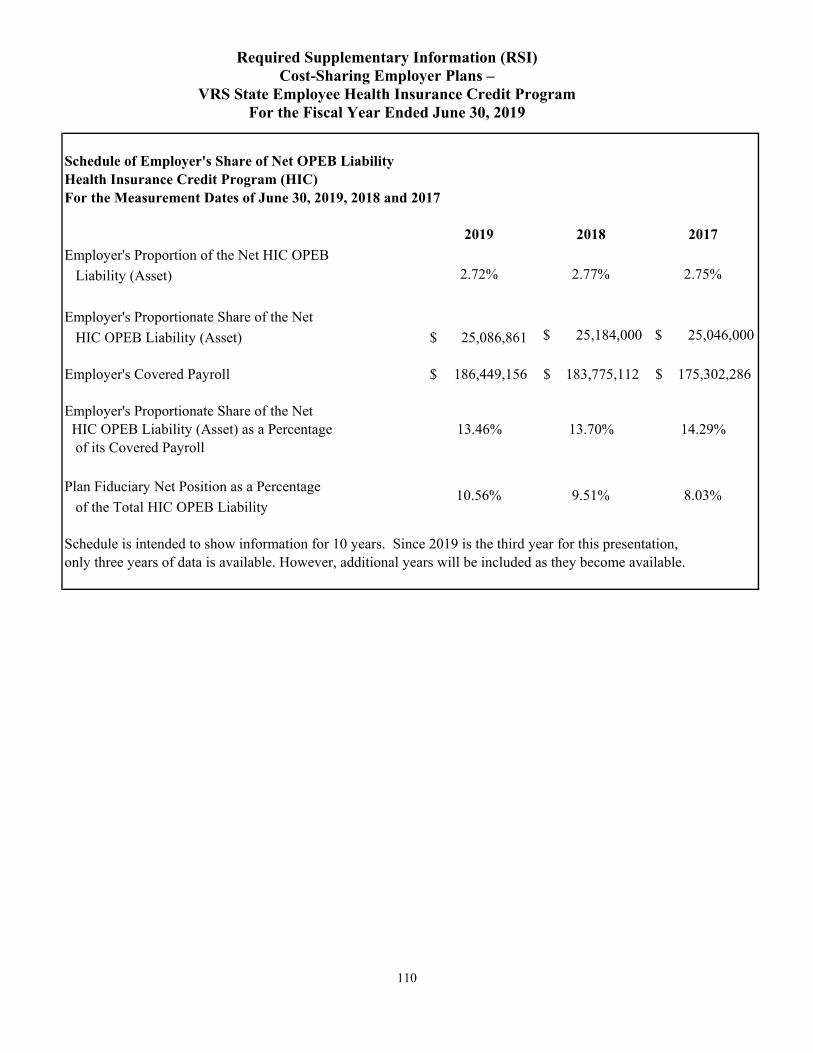
110
Required Supplementary Information (RSI) Cost-Sharing Employer Plans –
VRS State Employee Health Insurance Credit Program For the Fiscal Year Ended June 30, 2019
Schedule of Employer's Share of Net OPEB LiabilityHealth Insurance Credit Program (HIC)For the Measurement Dates of June 30, 2019, 2018 and 2017
2019 2018 2017
Employer's Proportion of the Net HIC OPEB
Liability (Asset)
Employer's Proportionate Share of the Net
HIC OPEB Liability (Asset) 25,086,861$
Employer's Covered Payroll 186,449,156$ 183,775,112$ 175,302,286$
Employer's Proportionate Share of the Net HIC OPEB Liability (Asset) as a Percentage 13.46% 13.70% 14.29% of its Covered Payroll
Plan Fiduciary Net Position as a Percentage
of the Total HIC OPEB Liability
Schedule is intended to show information for 10 years. Since 2019 is the third year for this presentation,only three years of data is available. However, additional years will be included as they become available.
2.72%
10.56%
2.77% 2.75%
$ 25,184,000 $ 25,046,000
9.51% 8.03%
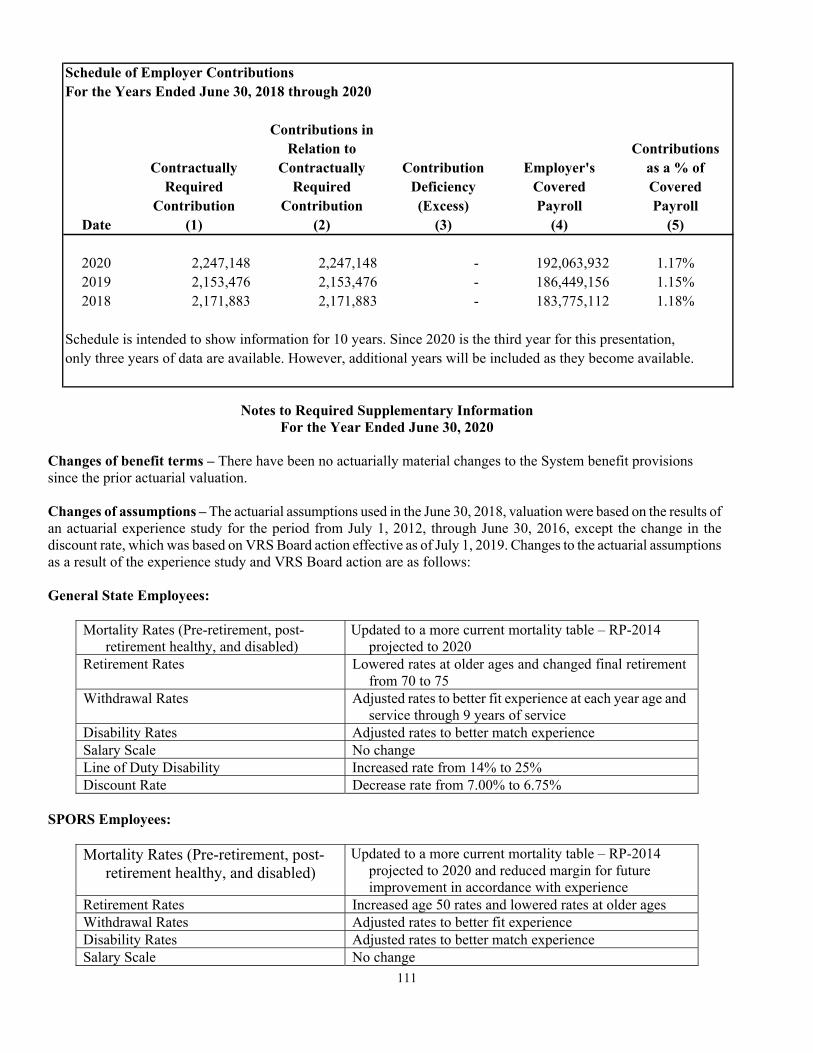
111
Schedule of Employer ContributionsFor the Years Ended June 30, 2018 through 2020
Contributions in Relation to Contributions
Contractually Contractually Contribution Employer's as a % ofRequired Required Deficiency Covered Covered
Contribution Contribution (Excess) Payroll PayrollDate (1) (2) (3) (4) (5)
2020 2,247,148 2,247,148 - 192,063,932 1.17%2019 2,153,476 2,153,476 - 186,449,156 1.15%2018 2,171,883 2,171,883 - 183,775,112 1.18%
Schedule is intended to show information for 10 years. Since 2020 is the third year for this presentation,only three years of data are available. However, additional years will be included as they become available.
Notes to Required Supplementary Information For the Year Ended June 30, 2020
Changes of benefit terms – There have been no actuarially material changes to the System benefit provisions since the prior actuarial valuation. Changes of assumptions – The actuarial assumptions used in the June 30, 2018, valuation were based on the results of an actuarial experience study for the period from July 1, 2012, through June 30, 2016, except the change in the discount rate, which was based on VRS Board action effective as of July 1, 2019. Changes to the actuarial assumptions as a result of the experience study and VRS Board action are as follows: General State Employees:
Mortality Rates (Pre-retirement, post-retirement healthy, and disabled)
Updated to a more current mortality table – RP-2014 projected to 2020
Retirement Rates Lowered rates at older ages and changed final retirement from 70 to 75
Withdrawal Rates Adjusted rates to better fit experience at each year age and service through 9 years of service
Disability Rates Adjusted rates to better match experience Salary Scale No change Line of Duty Disability Increased rate from 14% to 25% Discount Rate Decrease rate from 7.00% to 6.75%
SPORS Employees:
Mortality Rates (Pre-retirement, post-retirement healthy, and disabled)
Updated to a more current mortality table – RP-2014 projected to 2020 and reduced margin for future improvement in accordance with experience
Retirement Rates Increased age 50 rates and lowered rates at older ages Withdrawal Rates Adjusted rates to better fit experience Disability Rates Adjusted rates to better match experience Salary Scale No change

112
Line of Duty Disability Increased rate from 60% to 85% Discount Rate Decrease rate from 7.00% to 6.75%
VaLORS Employees:
Mortality Rates (Pre-retirement, post-retirement healthy, and disabled)
Updated to a more current mortality table – RP-2014 projected to 2020 and reduced margin for future improvement in accordance with experience
Retirement Rates Increased age 50 rates and lowered rates at older ages Withdrawal Rates Adjusted rates to better fit experience at each year age and
service through 9 years of service Disability Rates Adjusted rates to better match experience Salary Scale No change Line of Duty Disability Decreased rate from 50% to 35% Discount Rate Decrease rate from 7.00% to 6.75%
JRS Employees:
Mortality Rates (Pre-retirement, post-retirement healthy, and disabled)
Updated to a more current mortality table – RP-2014 projected to 2020
Retirement Rates Decreased rates at first retirement eligibility Withdrawal Rates No change Disability Rates Removed disability rates Salary Scale No change Discount Rate Decrease rate from 7.00% to 6.75%
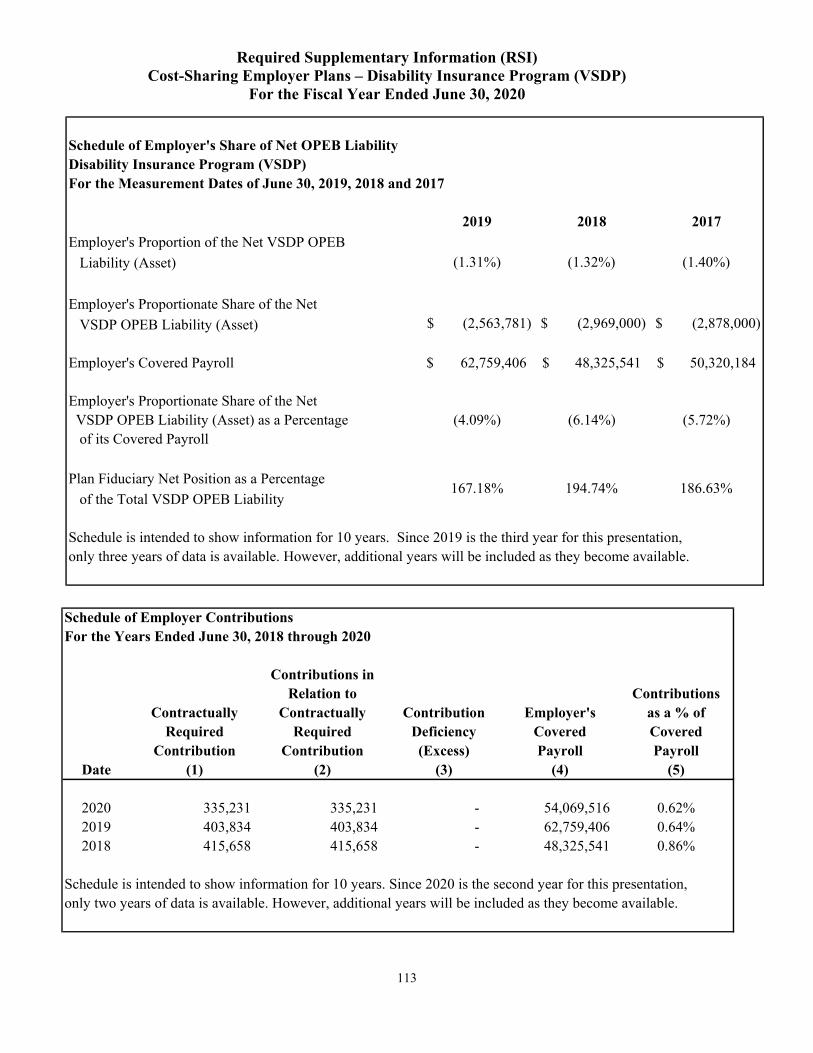
113
Required Supplementary Information (RSI) Cost-Sharing Employer Plans – Disability Insurance Program (VSDP)
For the Fiscal Year Ended June 30, 2020
Schedule of Employer's Share of Net OPEB LiabilityDisability Insurance Program (VSDP)For the Measurement Dates of June 30, 2019, 2018 and 2017
2019 2018 2017
Employer's Proportion of the Net VSDP OPEB
Liability (Asset)
Employer's Proportionate Share of the Net
VSDP OPEB Liability (Asset)
Employer's Covered Payroll 62,759,406$ 48,325,541$ 50,320,184$
Employer's Proportionate Share of the Net VSDP OPEB Liability (Asset) as a Percentage (4.09%) (6.14%) (5.72%) of its Covered Payroll
Plan Fiduciary Net Position as a Percentage
of the Total VSDP OPEB Liability
Schedule is intended to show information for 10 years. Since 2019 is the third year for this presentation, only three years of data is available. However, additional years will be included as they become available.
(1.31%)
167.18%
(2,563,781)$
(1.32%) (1.40%)
$ (2,969,000) $ (2,878,000)
194.74% 186.63%
Schedule of Employer ContributionsFor the Years Ended June 30, 2018 through 2020
Contributions in Relation to Contributions
Contractually Contractually Contribution Employer's as a % ofRequired Required Deficiency Covered Covered
Contribution Contribution (Excess) Payroll PayrollDate (1) (2) (3) (4) (5)
2020 335,231 335,231 - 54,069,516 0.62%2019 403,834 403,834 - 62,759,406 0.64%2018 415,658 415,658 - 48,325,541 0.86%
Schedule is intended to show information for 10 years. Since 2020 is the second year for this presentation,only two years of data is available. However, additional years will be included as they become available.

114
Notes to Required Supplementary Information For the Year Ended June 30, 2020
Changes of benefit terms – There have been no actuarially material changes to the System benefit provisions since the prior actuarial valuation. Changes of assumptions – The actuarial assumptions used in the June 30, 2018 valuation were based on the results of an actuarial experience study for the period from July 1, 2012 through June 30, 2016, except the change in the discount rate, which was based on VRS Board action effective as of July 1, 2019. Changes to the actuarial assumptions as a result of the experience study and VRS Board action are as follows: General State Employees:
Mortality Rates (Pre-retirement, post-retirement healthy, and disabled)
Update to a more current mortality table – RP-2014 projected to 2020
Retirement Rates Lowered rates at older ages and changed final retirement from 70 to 75
Withdrawal Rates Adjusted rates to better fit experience at each year age and service through 9 years of service
Disability Rates Adjusted rates to better match experience Salary Scale No change Line of Duty Disability Increased rate from 14% to 25% Discount Rate Decrease rate of 7.00% to 6.75%
SPORS Employees:
Mortality Rates (Pre-retirement, post-retirement healthy, and disabled)
Update to a more current mortality table – RP-2014 projected to 2020 and reduced margin for future improvement in accordance with experience
Retirement Rates Increased age 50 rates and lowered rates at older ages Withdrawal Rates Adjusted rates to better fit experience Disability Rates Adjusted rates to better match experience Salary Scale No change Line of Duty Disability Increased rate from 60% to 85% Discount Rate Decrease rate of 7.00% to 6.75%
VaLORS Employees:
Mortality Rates (Pre-retirement, post-retirement healthy, and disabled)
Update to a more current mortality table – RP-2014 projected to 2020 and reduced margin for future improvement in accordance with experience
Retirement Rates Increased age 50 rates and lowered rates at older ages Withdrawal Rates Adjusted rates to better fit experience at each year age and
service through 9 years of service Disability Rates Adjusted rates to better match experience Salary Scale No change Line of Duty Disability Decreased rate from 50% to 35% Discount Rate Decrease rate of 7.00% to 6.75%

115
Required Supplementary Information (RSI) Cost-Sharing Employer Plans – Line of Duty Act Program (LODA)
For the Fiscal Year Ended June 30, 2020
Schedule of Employer's Share of Net OPEB LiabilityLine of Duty Act Program (LODA)For the Measurement Dates of June 30, 2019, 2018 and 2017
2019 2018 2017
Employer's Proportion of the Net LODA OPEB
Liability (Asset)
Employer's Proportionate Share of the Net
LODA OPEB Liability (Asset) 415,044$
Covered-Employee Payroll * 1,195,615$ 1,336,159$ 1,246,761$
Employer's Proportionate Share of the Net LODA OPEB Liability (Asset) as a Percentage of its Covered-Employee Payroll
Plan Fiduciary Net Position as a Percentage
of the Total LODA OPEB Liability
Schedule is intended to show information for 10 years. Since 2019 is the third year for this presentation,only three years of data is available. However, additional years will be included as they become available.
* The contributions for the Line of Duty Act Program are based on the number of participants in the Program using a per capita-based contribution versus a payroll-based contribution. Therefore, covered-employee payroll is the relevant measurement, which is the total payroll of the employees in the OPEB plan.
0.60% 1.30%
0.12%
34.71%
0.79%
0.13% 0.12%
$ 418,000 $ 318,000
31.28% 25.51%
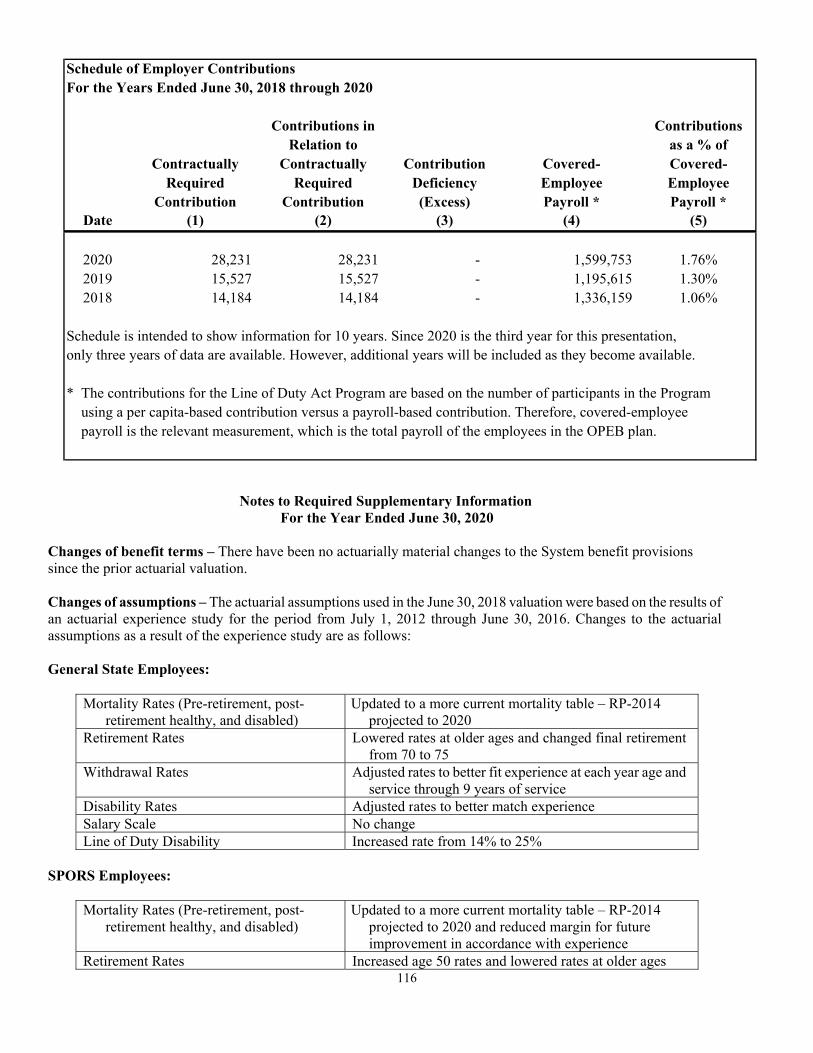
116
Schedule of Employer ContributionsFor the Years Ended June 30, 2018 through 2020
Contributions in Contributions Relation to as a % of
Contractually Contractually Contribution Covered- Covered-Required Required Deficiency Employee Employee
Contribution Contribution (Excess) Payroll * Payroll *Date (1) (2) (3) (4) (5)
2020 28,231 28,231 - 1,599,753 1.76%2019 15,527 15,527 - 1,195,615 1.30%2018 14,184 14,184 - 1,336,159 1.06%
Schedule is intended to show information for 10 years. Since 2020 is the third year for this presentation,only three years of data are available. However, additional years will be included as they become available.
* The contributions for the Line of Duty Act Program are based on the number of participants in the Program using a per capita-based contribution versus a payroll-based contribution. Therefore, covered-employee payroll is the relevant measurement, which is the total payroll of the employees in the OPEB plan.
Notes to Required Supplementary Information
For the Year Ended June 30, 2020
Changes of benefit terms – There have been no actuarially material changes to the System benefit provisions since the prior actuarial valuation. Changes of assumptions – The actuarial assumptions used in the June 30, 2018 valuation were based on the results of an actuarial experience study for the period from July 1, 2012 through June 30, 2016. Changes to the actuarial assumptions as a result of the experience study are as follows: General State Employees:
Mortality Rates (Pre-retirement, post-retirement healthy, and disabled)
Updated to a more current mortality table – RP-2014 projected to 2020
Retirement Rates Lowered rates at older ages and changed final retirement from 70 to 75
Withdrawal Rates Adjusted rates to better fit experience at each year age and service through 9 years of service
Disability Rates Adjusted rates to better match experience Salary Scale No change Line of Duty Disability Increased rate from 14% to 25%
SPORS Employees:
Mortality Rates (Pre-retirement, post-retirement healthy, and disabled)
Updated to a more current mortality table – RP-2014 projected to 2020 and reduced margin for future improvement in accordance with experience
Retirement Rates Increased age 50 rates and lowered rates at older ages

117
Withdrawal Rates Adjusted rates to better fit experience Disability Rates Adjusted rates to better match experience Salary Scale No change Line of Duty Disability Increased rate from 60% to 85%
VaLORS Employees:
Mortality Rates (Pre-retirement, post-retirement healthy, and disabled)
Updated to a more current mortality table – RP-2014 projected to 2020 and reduced margin for future improvement in accordance with experience
Retirement Rates Increased age 50 rates and lowered rates at older ages Withdrawal Rates Adjusted rates to better fit experience at each year age and
service through 9 years of service Disability Rates Adjusted rates to better match experience Salary Scale No change Line of Duty Disability Decreased rate from 50% to 35%
Employees In The Largest Ten Locality Employers With Public Safety Employees
Mortality Rates (Pre-retirement, post-retirement healthy, and disabled)
Updated to a more current mortality table – RP-2014 projected to 2020
Retirement Rates Lowered retirement rates at older ages Withdrawal Rates Adjusted termination rates to better fit experience at each
age and service year Disability Rates Increased disability rates Salary Scale No change Line of Duty Disability Increased rate from 60% to 70%
Employees In The Non- Largest Ten Locality Employers With Public Safety Employees
Mortality Rates (Pre-retirement, post-retirement healthy, and disabled)
Updated to a more current mortality table – RP-2014 projected to 2020
Retirement Rates Increased age 50 rates and lowered rates at older ages Withdrawal Rates Adjusted rates to better fit experience at each age and
service year Disability Rates Adjusted rates to better match experience Salary Scale No change Line of Duty Disability Decreased rate from 60% to 45%
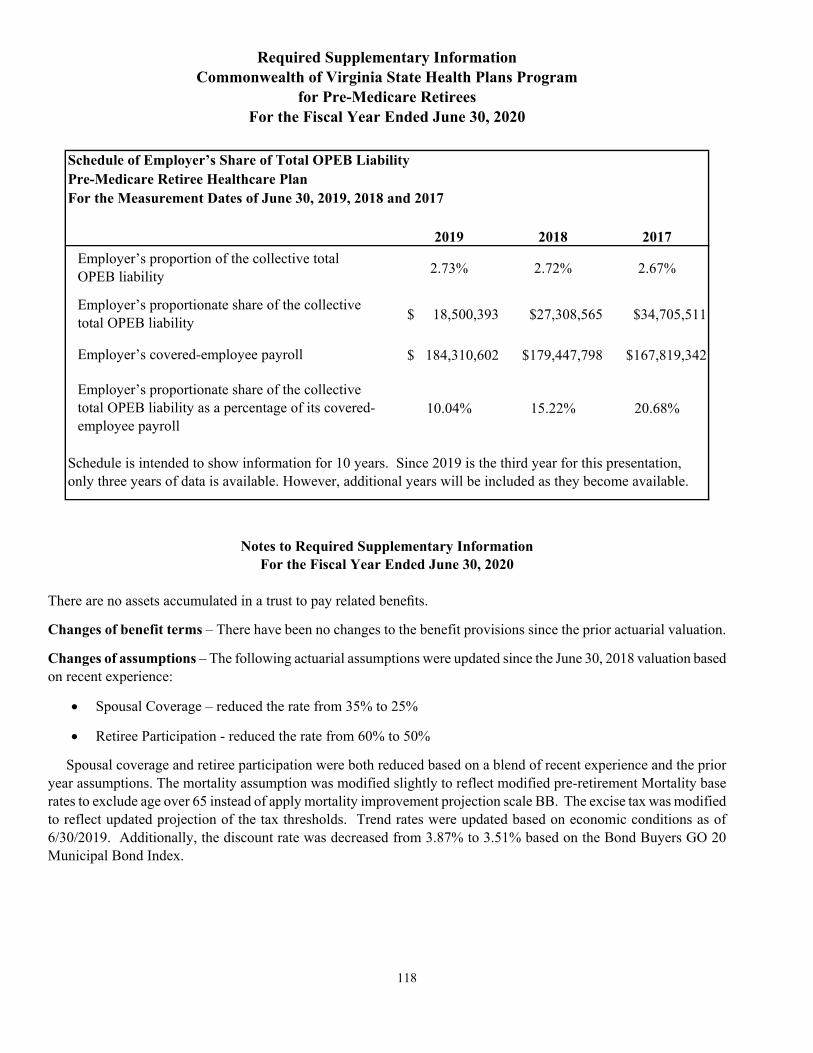
118
Required Supplementary Information Commonwealth of Virginia State Health Plans Program
for Pre-Medicare Retirees For the Fiscal Year Ended June 30, 2020
2019 2018 2017
2.73% 2.72% 2.67%
$ 18,500,393 $27,308,565 $34,705,511
$ 184,310,602 $179,447,798 $167,819,342
10.04% 15.22% 20.68%Employer’s proportionate share of the collective total OPEB liability as a percentage of its covered-employee payroll
Schedule of Employer’s Share of Total OPEB Liability
Schedule is intended to show information for 10 years. Since 2019 is the third year for this presentation, only three years of data is available. However, additional years will be included as they become available.
Employer’s proportionate share of the collective total OPEB liability
Employer’s covered-employee payroll
Employer’s proportion of the collective total OPEB liability
Pre-Medicare Retiree Healthcare PlanFor the Measurement Dates of June 30, 2019, 2018 and 2017
Notes to Required Supplementary Information For the Fiscal Year Ended June 30, 2020
There are no assets accumulated in a trust to pay related benefits.
Changes of benefit terms – There have been no changes to the benefit provisions since the prior actuarial valuation.
Changes of assumptions – The following actuarial assumptions were updated since the June 30, 2018 valuation based on recent experience:
Spousal Coverage – reduced the rate from 35% to 25%
Retiree Participation - reduced the rate from 60% to 50%
Spousal coverage and retiree participation were both reduced based on a blend of recent experience and the prior year assumptions. The mortality assumption was modified slightly to reflect modified pre-retirement Mortality base rates to exclude age over 65 instead of apply mortality improvement projection scale BB. The excise tax was modified to reflect updated projection of the tax thresholds. Trend rates were updated based on economic conditions as of 6/30/2019. Additionally, the discount rate was decreased from 3.87% to 3.51% based on the Bond Buyers GO 20 Municipal Bond Index.

www.apa.virginia.gov | (804) 225-3350 | [email protected]
May 27, 2021
The Honorable Ralph S. Northam Governor of Virginia
The Honorable Kenneth R. Plum Chairman, Joint Legislative Audit and Review Commission
Board of Visitors The College of William and Mary in Virginia
INDEPENDENT AUDITOR’S REPORT
Report on Financial Statements
We have audited the accompanying financial statements of the business-type activities and aggregate discretely presented component units of The College of William and Mary in Virginia, a component unit of the Commonwealth of Virginia, as of and for the year ended June 30, 2020, and the related notes to the financial statements, which collectively comprise the basic financial statements as listed in the table of contents.
Management’s Responsibility for the Financial Statements
Management is responsible for the preparation and fair presentation of these financial statements in accordance with accounting principles generally accepted in the United States of America; this includes the design, implementation, and maintenance of internal control relevant to the preparation and fair presentation of financial statements that are free from material misstatement, whether due to fraud or error.
Auditor’s Responsibility
Our responsibility is to express opinions on these financial statements based on our audit. We did not audit the financial statements of the aggregate discretely presented component units, which are discussed in Notes 1 and 13. Those financial statements were audited by other auditors whose reports
119

thereon have been furnished to us, and our opinion, insofar as it relates to the amounts included for the component units, is based on the reports of the other auditors.
We conducted our audit in accordance with auditing standards generally accepted in the United States of America and the standards applicable to financial audits contained in Government Auditing Standards, issued by the Comptroller General of the United States. Those standards require that we plan and perform the audit to obtain reasonable assurance about whether the financial statements are free of material misstatement. The financial statements of the component units that were audited by other auditors upon whose reports we are relying were audited in accordance with auditing standards generally accepted in the United States of America, but not in accordance with Government Auditing Standards.
An audit involves performing procedures to obtain audit evidence about the amounts and disclosures in the financial statements. The procedures selected depend on the auditor’s judgment, including the assessment of the risks of material misstatement of the financial statements, whether due to fraud or error. In making those risk assessments, the auditor considers internal control relevant to the entity’s preparation and fair presentation of the financial statements in order to design audit procedures that are appropriate in the circumstances, but not for the purpose of expressing an opinion on the effectiveness of the entity’s internal control. Accordingly, we express no such opinion. An audit also includes evaluating the appropriateness of accounting policies used and the reasonableness of significant accounting estimates made by management, as well as evaluating the overall presentation of the financial statements.
We believe that the audit evidence we have obtained is sufficient and appropriate to provide a basis for our audit opinions.
Opinion
In our opinion, based on our audit and the reports of other auditors, the financial statements referred to above present fairly, in all material respects, the financial position of the business-type activities and aggregate discretely presented component units of The College of William and Mary in Virginia as of June 30, 2020, and the respective changes in financial position and cash flows, where applicable, thereof for the year then ended, in accordance with accounting principles generally accepted in the United States of America.
Other Matters
Required Supplementary Information
Accounting principles generally accepted in the United States of America require that the following be presented to supplement the basic financial statements: Management’s Discussion and Analysis on pages 1 through 10; the Schedule of Employer’s Share of Net Pension Liability, the Schedule of Employer Contributions, and the Notes to the Required Supplementary Information on pages 102 through 104; the Schedule of Employer’s Share of Net OPEB Liability, the Schedule of Employer
120

Contributions, and the Notes to the Required Supplementary Information for the Group Life Insurance, Health Insurance Credit, Disability Insurance and Line of Duty programs on pages 105 through 117; the Schedule of Employer’s Share of Total OPEB Liability and the Notes to the Required Supplementary Information for the Pre-Medicare Retiree Healthcare program on page 118. Such information, although not a part of the basic financial statements, is required by the Governmental Accounting Standards Board who considers it to be an essential part of the financial reporting for placing the basic financial statements in an appropriate operational, economic, or historical context. We have applied certain limited procedures to the required supplementary information in accordance with auditing standards generally accepted in the United States of America, which consisted of inquiries of management about the methods of preparing the information and comparing the information for consistency with management’s responses to our inquiries, the basic financial statements, and other knowledge we obtained during our audit of the basic financial statements. We do not express an opinion or provide any assurance on the information because the limited procedures do not provide us with sufficient evidence to express an opinion or provide any assurance.
Other Reporting Required by Government Auditing Standards
In accordance with Government Auditing Standards, we have also issued our report dated May 27, 2021, on our consideration of The College of William and Mary in Virginia’s internal control over financial reporting and on our tests of its compliance with certain provisions of laws, regulations, contracts and grant agreements and other matters. The purpose of that report is to describe the scope of our testing of internal control over financial reporting and compliance and the results of that testing, and not to provide an opinion on the effectiveness of the internal control over financial reporting or on compliance. That report is an integral part of an audit performed in accordance with Government Auditing Standards in considering the entity’s internal control over financial reporting and compliance.
Staci A. Henshaw AUDITOR OF PUBLIC ACCOUNTS
EMS/vks
121
122
William & Mary Richard Bland College
June 30, 2020
The Board of Visitors
John E. Littel - Rector William H. Payne II - Vice Rector
Sue H. Gerdelman - Secretary
Mari Carmen Aponte Mirza Baig
Victor K. Branch Warren W. Buck III S. Douglas Bunch James A. Hixon
Barbara L. Johnson Anne Leigh Kerr Charles E. Poston
Lisa E. Roday J.E. Lincoln Saunders
Karen Kennedy Schultz H. Thomas Watkins III
Brian P. Woolfolk
Student Representatives
Kelsey Vita - William & Mary Solomon Asare - Richard Bland College
Faculty Representatives
Catherine A. Forestell - William & Mary Tiffany Birdsong - Richard Bland College
Staff Liaison
Joseph Wheeless – William & Mary
OFFICERS OF ADMINISTRATION
William & Mary
Katherine A. Rowe, President
Peggy Agouris, Provost Virginia M. Ambler, Vice President for Student Affairs
Henry R. Broaddus, Vice President for Strategic Initiatives & Public Affairs Samuel E. Jones, Senior Vice President for Finance and Administration
Matthew T. Lambert, Vice President for University Advancement Amy S. Sebring, Vice President for Finance and Technology
Richard Bland College
Debbie L. Sydow, President


![Revised Audited Consolidated Financial Results for the financial year ended March 31, 2016 [Result]](https://img.pdfslide.us/doc/110x75/577c79741a28abe05492b611/revised-audited-consolidated-financial-results-for-the-financial-year-ended.jpg)