Embed Size (px)
Citation preview
AUDIT REPORT
CITY OF MIAMI, FLORIDA FOR THE YEAR ENDED SEPTEMBER 30, 2016
CONTENTS
Comprehensive Annual Financial Report (CAFR) Single Audit Reports Management Letter
City of Miami, Florida
FISCAL YEAR ENDED September 30, 2016
COMPREHENSIVEANNUAL
FINANCIAL REPORT

Prepared By:The Finance Department
Jose M. Fernandez, CPADirector
Erica T. Paschal, CPAAssistant Director
Armando J. BlancoTreasurer
Eugene Codner Financial Reporting
& Compliance Manager
FISCAL YEAR ENDED SEPTEMBER 30, 2016
COMPREHENSIVE ANNUAL FINANCIAL REPORT

Page left intentionally blank
City of Miami, Florida
Comprehensive Annual Financial ReportFor the Fiscal Year Ended September 30, 2016
Table of Contents
i
INTRODUCTORY SECTION
Principal City Officials ................................................................................................................................. 3 City Organizational Chart ............................................................................................................................. 4 Letter of Transmittal ..................................................................................................................................... 5 GFOA Certificate of Achievement ............................................................................................................. 17
FINANCIAL SECTION
Independent Auditor’s Report ..................................................................................................................... 20 Management’s Discussion and Analysis ..................................................................................................... 24
Basic Financial Statements:
Government-wide Financial Statements: Statement of Net Position .............................................................................................................. 35 Statement of Activities ................................................................................................................... 36
Fund Financial Statements: Governmental Funds:
Balance Sheet ................................................................................................................................. 37 Reconciliation of the Balance Sheet - Governmental Funds to Government-wide Statement of Net Position ............................................................................................................................... 38 Statement of Revenues, Expenditures and Changes in Fund Balances - Governmental Funds ..... 39 Reconciliation of the Statement of Revenues, Expenditures and Changes in Fund Balances - Governmental Funds to the Statement of Activities ...................................................................... 40
Fiduciary Funds: Statement of Fiduciary Net Position .............................................................................................. 41 Statement of Changes in Fiduciary Net Position ........................................................................... 42
Discretely Presented Component Units: Statement of Net Position .............................................................................................................. 43 Statement of Activities ................................................................................................................... 45
Notes to the Financial Statements ............................................................................................................... 47
ii
Required Supplementary Information:
Budgetary Comparison Schedules of Revenues, Expenditures and Changes in Fund Balances: General Fund ................................................................................................................................ 138 Notes to Required Supplementary Information ........................................................................... 139
Pension Schedules: Schedule of Funding Progress ..................................................................................................... 140 Schedule of Employer Contributions ........................................................................................... 141 Schedule of Changes in the Net Pension Liability and Related Ratios ........................................ 142 Schedule of Contributions ............................................................................................................ 147 Schedule of Investment Returns .................................................................................................. 152
Combining and Individual Fund Financial Statements and Schedules:
Nonmajor Governmental Funds: Combining Balance Sheet ............................................................................................................. 158 Combining Statement of Revenues, Expenditures and Changes in Fund Balances ...................... 165
Budgetary Comparison Schedules: Special Revenue Funds:
OMNI Community Redevelopment Agency (OMNI) Fund ......................................................... 172 Midtown Community Redevelopment Agency (Midtown) Fund ................................................. 173 Southeast Overtown Park West Community Redevelopment Agency (SEOPW) Fund ............... 174 Homeless Program Fund ............................................................................................................... 175 Community Development Fund .................................................................................................... 176 Choice Housing Vouchers (Section 8) Fund ................................................................................. 177 State Housing Initiatives Program (SHIP) Fund ........................................................................... 178 Convention Center Fund ............................................................................................................... 179 Economic Development & Planning Services Fund ..................................................................... 180 Net Offices Fund ........................................................................................................................... 181 Parks and Recreations Fund .......................................................................................................... 182 Police Services Fund ..................................................................................................................... 183 Law Enforcement Trust Fund ....................................................................................................... 184 Public Works Services Fund ......................................................................................................... 185 City Clerk Services Fund .............................................................................................................. 186 Emergency Services Fund ............................................................................................................. 187 Fire Rescue Special Revenue Fund ............................................................................................... 188 General Special Revenue Fund ..................................................................................................... 189 Department Improvement Initiatives Fund ................................................................................... 190Transportation & Transit Fund ..................................................................................................... 191 Miami Ballpark Parking Facilities Fund ....................................................................................... 192 Liberty City Revitalization Trust .................................................................................................. 193 Virginia Key Beach Trust ............................................................................................................. 194 Solid Waste Recycling Trust ......................................................................................................... 195
Debt Service Funds: General Obligation Bonds Fund ................................................................................................... 196 Special Obligation Bonds Funds ................................................................................................... 197
iii
SEOPW Special Obligation Bonds Fund ...................................................................................... 198 Fiduciary Funds:
Combining Statement of Fiduciary Net Position .......................................................................... 200 Combining Statement of Changes in Fiduciary Net Position ....................................................... 201
STATISTICAL SECTION
Financial Trends: Net Position by Component ........................................................................................................... 203 Changes in Net Position ................................................................................................................ 204 Governmental Activities Tax Revenues by Source ....................................................................... 205 Fund Balances - Governmental Funds ........................................................................................... 206 Changes in Fund Balances - Governmental Funds ........................................................................ 207
Revenue Capacity: General Government Tax Revenues by Source ............................................................................. 209 Net Assessed Value and Estimated Actual Value of Taxable Property ........................................ 210 Property Tax Rates – Direct and Overlapping Governments ........................................................ 211 Principal Property Taxpayers ........................................................................................................ 212 Property Tax Levies and Collections ............................................................................................. 213
Debt Capacity: Ratios of Outstanding Debt by Type ............................................................................................. 214 Ratios of General Bonded Debt Outstanding ................................................................................ 215 Direct and Overlapping Governmental Activities Debt ................................................................ 216 Legal Debt Margin Information .................................................................................................... 217 Pledged Revenue Coverage ........................................................................................................... 218
Demographics and Economic Information: Demographics and Economic Statistics ........................................................................................ 219 Principal Employers ...................................................................................................................... 220
Operating Information:Full-Time Equivalent City Government Employees by Function ................................................. 222 Operating Indicators by Function .................................................................................................. 222 Capital Assets Statistics by Function/Program .............................................................................. 223

Page left intentionally blank
1

INTRODUCTORYSECTION
2

CITY OF MIAMI, FLORIDA
TOMÁS P. REGALADOMayor
KEN RUSSELLVice-Chairman
FRANKCAROLLOCommissioner
DANIEL J.ALFONSOCity Manager
WIFREDO“WILLY” GORT
Commissioner
FRANCISSUAREZ
Commissioner
VICTORIAMÉNDEZCity Attorney
KEON HARDEMON
Chairman
September 30, 2016
3
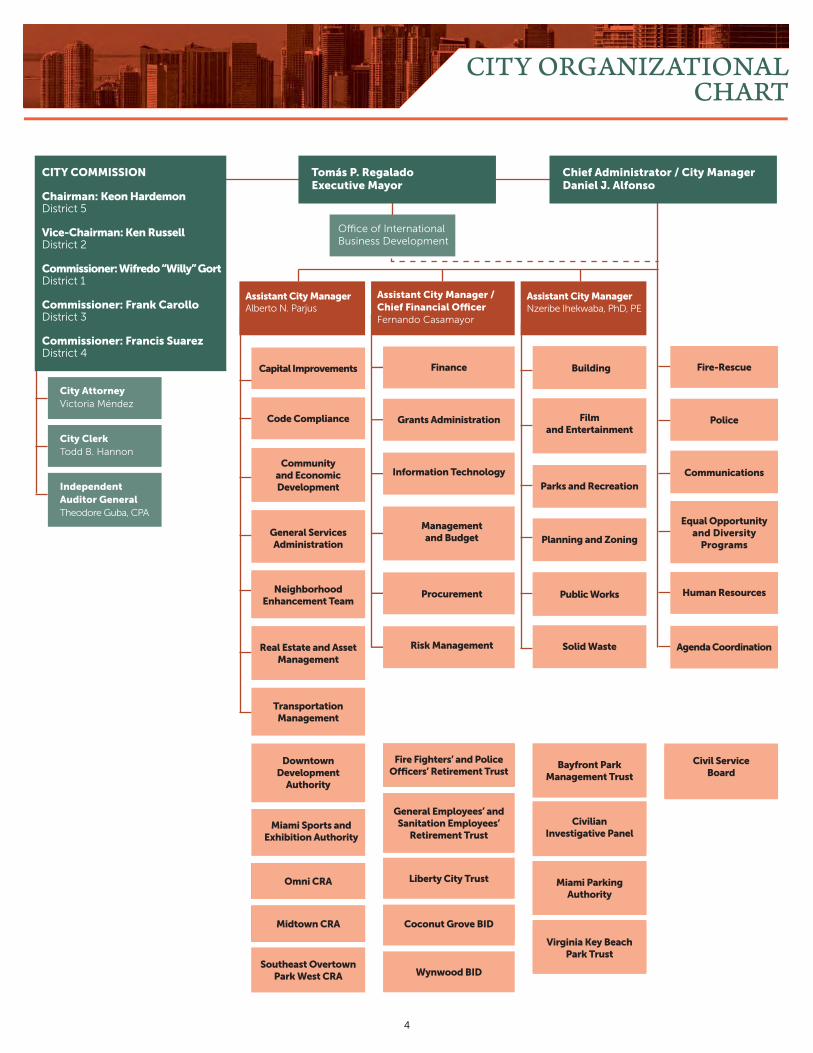
City AttorneyVictoria Méndez
Assistant City ManagerAlberto N. Parjus
Assistant City ManagerNzeribe Ihekwaba, PhD, PE
Code Compliance
Transportation Management
Fire-Rescue
Police
Building
Community and Economic Development
Grants Administration
Finance
Managementand Budget
Procurement
Risk Management
Film and Entertainment
General Services Administration
Parks and Recreation
Solid Waste
Planning and Zoning
Public Works
Real Estate and Asset Management
Fire Fighters’ and Police Officers’ Retirement Trust
General Employees’ and Sanitation Employees’
Retirement Trust
Liberty City Trust
Coconut Grove BID
Wynwood BID
Civil Service Board
Civilian Investigative Panel
Virginia Key Beach Park Trust
Bayfront ParkManagement Trust
Miami ParkingAuthority
Southeast Overtown Park West CRA
Omni CRA
Midtown CRA
DowntownDevelopment
Authority
Miami Sports andExhibition Authority
Information Technology Communications
Equal Opportunityand Diversity
Programs
Human Resources
Agenda Coordination
Assistant City Manager / Chief Financial OfficerFernando Casamayor
Office of International Business Development
City ClerkTodd B. Hannon
IndependentAuditor GeneralTheodore Guba, CPA
CITY COMMISSION
Chairman: Keon HardemonDistrict 5
Vice-Chairman: Ken RussellDistrict 2
Commissioner: Wifredo “Willy” GortDistrict 1
Commissioner: Frank CarolloDistrict 3
Commissioner: Francis SuarezDistrict 4
Tomás P. RegaladoExecutive Mayor
Chief Administrator / City ManagerDaniel J. Alfonso
CITY ORGANIZATIONALCHART
Capital Improvements
NeighborhoodEnhancement Team
4
March 30, 2017
To the Honorable Mayor, Members of the Commission, and Citizens of the City of Miami, Florida:
We are pleased to present the City of Miami, Florida’s (“the City”) Comprehensive Annual Financial Report (“CAFR”) for the fiscal year ended September 30, 2016. The financial statements were prepared in accordance with accounting principles generally accepted in the United States of America (GAAP) as promulgated by the Governmental Accounting Standards Board (GASB).
Management assumes full responsibility for the completeness and reliability of the information contained in this report, based upon a comprehensive framework of internal control that it has established for this purpose. Because the cost of internal control should not exceed anticipated benefits, the objective is to provide reasonable, rather than absolute, assurance that the financial statements are free of any material misstatements.
RSM US LLP, Certified Public Accountants, have issued an unmodified opinion on the City’s basic financial statements for the year ended September 30, 2016. The independent auditor’s report is located at the front of the financial section of this report.
The management’s discussion and analysis (“MD&A”) immediately follows the independent auditor’s report and provides a narrative introduction, overview, and analysis of the basic financial statements. MD&A complements this letter of transmittal and should be read in conjunction with it.
This report may also be accessed via the internet at http://www.miamigov.com/finance.
City Profile & Government Structure
The City is situated at the mouth of the Miami River on the western shores of Biscayne Bay. It is a main port of entry into Florida. Now 120 years old, the City is part of the nation’s eighth largest metropolitan area. Incorporated in 1896, the City is the only municipality conceived and founded by a woman – Julia Tuttle. According to the U.S. Census Bureau, the City’s population in 1900 was 1,700 people. Today it is a city rich in cultural and ethnic diversity of approximately 456,089 residents according to the Bureau of Economic and Business Research, University of Florida, 57.7 percent of them foreign born. In physical size, the City is not large, encompassing only 35.87 square miles. In population, the City is the largest of the 35 municipalities that make up Miami-Dade County.
The City Charter was adopted by the electors of the City of Miami at an election held May 17, 1921 and legalized and validated by Chapter 9024 of the laws of the State of Florida of 1921. The Florida Legislature, in 1955, approved and submitted to a general election, a constitutional amendment designed to give a new form of government to Miami-Dade County, Florida (“the County”). The County is, in effect, a municipality with governmental powers affecting thirty-five cities, including the City and unincorporated areas. The County has not displaced nor replaced the cities’ powers, but supplements them. The County can take over particular activities of the City's operations if the services fall below minimum standards set by the County Commission, or with the consent of the governing body of the City. Accordingly, the County’s financial statements are not included in this report.
5
Since 1997, the City has been governed by a form of government known as the “Mayor-City Commissioner plan.” There are five Commissioners elected from designated districts within the City. City elections are held in November every two years on a non-partisan basis. Candidates for Mayor must run as such and not for the Commission in general. At each election, two or three members of the Commission are elected for four-year terms. Thus, the terms are staggered so that there are always at least two experienced members of the Commission. The Mayor is elected at large every four years.
As official head of the City, the Mayor has veto authority over actions of the Commission. However, the commission can override a mayoral veto if four-fifths of all commissioners present votes in favor of a resolution to override a mayoral veto. The commission action in question shall be deemed enacted or adopted and effective in accordance with its terms; otherwise, the mayoral veto shall be deemed sustained.
The Mayor appoints the City Manager who functions as chief administrative officer. The City Manager serves as the administrative head of the municipal government, charged with the responsibility of managing the City's financial operations and organizing and directing the administrative infrastructure. The City Manager also retains full authority in the appointment and supervision of department directors, preparation of the City's annual budget and initiation of the investigative procedures. In addition, the City Manager takes appropriate action on all administrative matters.
The City provides a full range of services, including police and fire protection; public works activities; refuse collection; building inspections; licenses and permits; vital statistics; the construction and maintenance of streets, and other infrastructure; recreational and cultural activities; and trolley services.
The accompanying financial statements include those of the City and those of its component units. Component units are legally separate organizations for which the City is financially accountable or organizations that should be included in the City’s financial statements because of the nature and significance of their relationship with the City. Additional information on all of these legally separate entities can be found in the notes to the financial statements.
Budget Process and Control
The Mayor is required to prepare and deliver a budgetary address annually to the people of the City any time between one to three months preceding the beginning of the fiscal year.
The City Commission is required to hold public hearings on the proposed budget and to adopt the final budget no later than September 30th preceding the beginning of the fiscal year on October 1st.The annual budget serves as the foundation for the City’s financial planning and control.
Budgets are monitored at varying levels of classification detail that include both personnel and operating as appropriation designations; however, budgetary control is legally maintained at the fund level except for the general fund, which is maintained at the departmental operating level.
6

Budget-to-actual comparisons are provided in this report for each major individual governmental fund for which an appropriated annual budget has been adopted and all non-major governmental funds with appropriated annual budgets.
The major phases of the budget process are detailed in the Notes to the Required Supplementary Information Section of this report.
Local Economic Condition and Outlook
Miami’s local economy continues to improve showing strong growth in home prices and tourism. Miami has become a major center and a leader in finance, commerce, culture, media, entertainment, and the arts. Local unemployment continues a steady decline from previous year. Miami experienced a 5.0 percent unemployment rate as of November 2016, down from 5.5 percent from November 2015. A good business climate has been created for the South Florida economy encouraging growth in construction, motion pictures, financial services, and tourism. With growth in these sectors of the South Florida economy, employment should strengthen as well, and all indicators point towards steady improvement in the local economy.
Local Government Financial Trend
The table below summarizes and compares General Fund revenues and expenditures and transfers over the last four fiscal years. Some of the reasons for these trends are actions taken by the City and discussed further in this letter under the heading of Long-Term Financial Planning.
Housing & Real Estate Market
The City’s housing prices continued its upward trend in 2016. The median sales price for single-family homes in Miami increased 10.4 percent over September 2015, to $314,500. Condominiums median sales price increased 9.2 percent in fiscal year 2016 to $219,000 from $200,500 a year ago.
Overall, the number of existing home and condo sales in Miami-Dade County decreased 14.7 percent compared with September 2015, according to a monthly report released by the Miami Association of Realtors. A lack of affordable housing for locals and a lack of foreclosure inventory for investors continue to slow Miami’s real-estate market.
Summary of General Fund Financial Resultsby Fiscal Year
2016 2015 2014 2013Revenues and Transfers In $ 643,541,725 $ 604,639,526 $ 569,457,047 $ 525,870,000 Expenditures and Transfers Out 659,425,088 569,657,401 532,497,233 507,943,000 Net Change in Fund Balance (15,883,363) 34,982,125 36,959,814 17,927,000 Beginning Fund Balance 147,404,712 112,422,587 75,462,773 57,544,000 Ending Fund Balance $ 131,521,349 $ 147,404,712 $ 112,422,587 $ 75,471,000
7
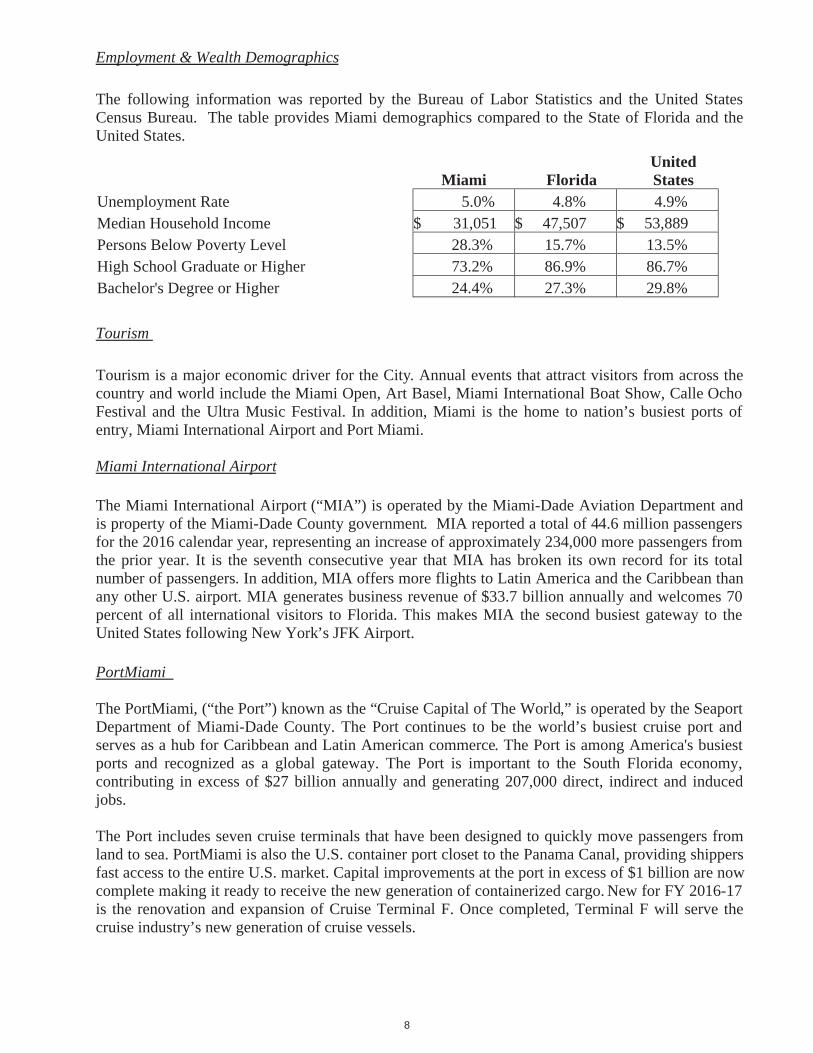
Employment & Wealth Demographics
The following information was reported by the Bureau of Labor Statistics and the United States Census Bureau. The table provides Miami demographics compared to the State of Florida and the United States.
Miami FloridaUnitedStates
Unemployment Rate 5.0% 4.8% 4.9%Median Household Income $ 31,051 $ 47,507 $ 53,889Persons Below Poverty Level 28.3% 15.7% 13.5%High School Graduate or Higher 73.2% 86.9% 86.7%Bachelor's Degree or Higher 24.4% 27.3% 29.8%
Tourism
Tourism is a major economic driver for the City. Annual events that attract visitors from across the country and world include the Miami Open, Art Basel, Miami International Boat Show, Calle Ocho Festival and the Ultra Music Festival. In addition, Miami is the home to nation’s busiest ports of entry, Miami International Airport and Port Miami.
Miami International Airport
The Miami International Airport (“MIA”) is operated by the Miami-Dade Aviation Department and is property of the Miami-Dade County government. MIA reported a total of 44.6 million passengers for the 2016 calendar year, representing an increase of approximately 234,000 more passengers from the prior year. It is the seventh consecutive year that MIA has broken its own record for its total number of passengers. In addition, MIA offers more flights to Latin America and the Caribbean than any other U.S. airport. MIA generates business revenue of $33.7 billion annually and welcomes 70 percent of all international visitors to Florida. This makes MIA the second busiest gateway to the United States following New York’s JFK Airport.
PortMiami
The PortMiami, (“the Port”) known as the “Cruise Capital of The World,” is operated by the Seaport Department of Miami-Dade County. The Port continues to be the world’s busiest cruise port and serves as a hub for Caribbean and Latin American commerce. The Port is among America's busiest ports and recognized as a global gateway. The Port is important to the South Florida economy, contributing in excess of $27 billion annually and generating 207,000 direct, indirect and induced jobs.
The Port includes seven cruise terminals that have been designed to quickly move passengers from land to sea. PortMiami is also the U.S. container port closet to the Panama Canal, providing shippers fast access to the entire U.S. market. Capital improvements at the port in excess of $1 billion are now complete making it ready to receive the new generation of containerized cargo. New for FY 2016-17 is the renovation and expansion of Cruise Terminal F. Once completed, Terminal F will serve the cruise industry’s new generation of cruise vessels.
8
Major Developments
Miami’s Downtown and Brickell area is the heart of major developments for the City. There are huge changes taking place in the area. These developments will bring more entertainment, culture and arts to the Downtown area. Miami will also be home to Brickell City Centre, MiamiCentral Station, and the Film and Television Production facility.
The Brickell City Centre project, located in the center of Brickell’s financial district finally opened its doors to the public on November 3, 2016. Brickell City Centre is a $1.05 billion mixed-use development bringing a whole new level of urban living and catering to the new Miami residents. Brickell City Centre mall spans three city blocks and features more than 100 retail brands. Retail stores include Saks Fifth Avenue serving as an anchor, Audemars Piguet, Armani, All Saints, Ted Baker, Chopard, Diptyque, Hugo Boss, Intermix, Kendra Scott, Lafayette 148 New York, NARS, Nest Casa, Ted Baker London, Tommy Bahama, Victoria’s Secret and many more to come. Brickell City Centre complex also includes two completed 390-unit luxury condominium residences and office buildings.
In the heart of Downtown Miami construction continues with the All Aboard Florida Miami Central station complex. All Aboard Florida’s is a state of the art passenger train connecting Orlando to downtown Miami. Driving from Orlando to Miami takes approximately four hours. The train will allow passengers to travel the same distance in about three hours. This project will attract many visitors to the City, further expanding the tourism industry. Service will begin in 2017, with trips to Fort Lauderdale and West Palm Beach from Miami. Full-service between Miami and Orlando will follow. Prior to the launch of service, All Aboard Florida is making significant improvements to the Florida East Coast Railway corridor.
A new film and television production facility opened in 2016. The new studio was constructed as a public-private partnership by the Omni Community Redevelopment Agency (CRA) and will be operated by EUE/Screen Gems. This facility will serve as a production hub for Viacom’s global entertainment brands including Nickelodeon, MTV and Comedy Central. Located in central Miami, the studio location offers access to a highly skilled, multi-lingual talent pool essential to creating global productions in multiple languages.
Long-Term Financial Planning
In an effort to stabilize the financial management of the City’s resources and focus on the long-term sustainability, while addressing immediate issues and concerns raised by the changing economic climate and drivers within the community, challenging but necessary decisions were required to be made.
Financing
During FY2016, the City successfully refunded $57.2 million Limited General Obligation Bond, Series 2002 and Series 2007B. In addition, the City obtained $10.6 million Lease from Santander Bank, N.A. to replace police and fleet vehicles. See Note 8 Long-Term Debt.
9
Future Outlook
The City and its surrounding area have continued to experience sustained growth. The Local unemployment rate has continued to fall and the national employment picture has continued to show signs of strengthening. The national unemployment rate dropped to 4.9 percent suggesting that the U.S job market continues to improve and progress toward stabilization.
A significant indicator of the health of the U.S. economy is real gross domestic product (GDP), which measures the value of final goods and services produced in the U.S. in a given time period. The U.S. economy ended the year on a positive note as the GDP increased at an annual rate of 1.9 percent in the fourth quarter of 2016, according to the Bureau of Economic Analysis. This increase is reflective of positive contributions from consumer spending, nonresidential fixed investment, and state and local government spending.
With low interest rates and low oil prices, a good business climate has been created for the South Florida economy encouraging growth in construction, trade, financial services, professional and legal services and tourism.
Major Initiatives
In June 2013, the City developed the Strategic Planning Initiative. In the fall of 2014 the Strategic Plan was adopted. Since its adoption, the City has updated the plan each year, demonstrating the City’s commitment to public engagement, performance management, and strategy development. Each year the City surveys its residents and employees and validates those findings against focus groups with community stakeholders. In its third year of the strategic plan, The City continues to focus its resources in alignment with improving the overall quality of life for its residents. The primary areas of importance for our residents continue to be safety and the economy. Having a safe and healthy environment to live, work and play is a critical component of the quality of life in any community.
The City’s strategic plan outlines six key priority areas and goals for years 2015-2017. The six priorities identified are: 1) public safety, 2) clean and beautiful neighborhoods, 3) growth and development, 4) education and economic access, 5) culture and recreation, and 6) efficient and effective government. The details on the key objectives of these priorities and the strategies for achieving these objectives are outlined in the City of Miami Strategic Plan adopted in September 2014, which can be accessed at www.miamigov.com/citymanager/strategicplanning.
In November 2016, The City began the planning phase to completely redesign the City’s website in order to improve online access to information on government services. The first step was getting feedback from the community. The City conducted a broad survey of Miami community members who use the website at home, at work, through community centers or on their phone.
The City completed several projects in FY2016 and anticipates on completing a significant number in FY2017. These projects benefit the City, its residents, and people visiting our beautiful City by maintaining key infrastructure and functionality, maintaining and improving our transportation system, recreational facilities while providing greater safety, and maximizing the use of technology for greater efficiency and service delivery.
10
Capital Improvement Plan
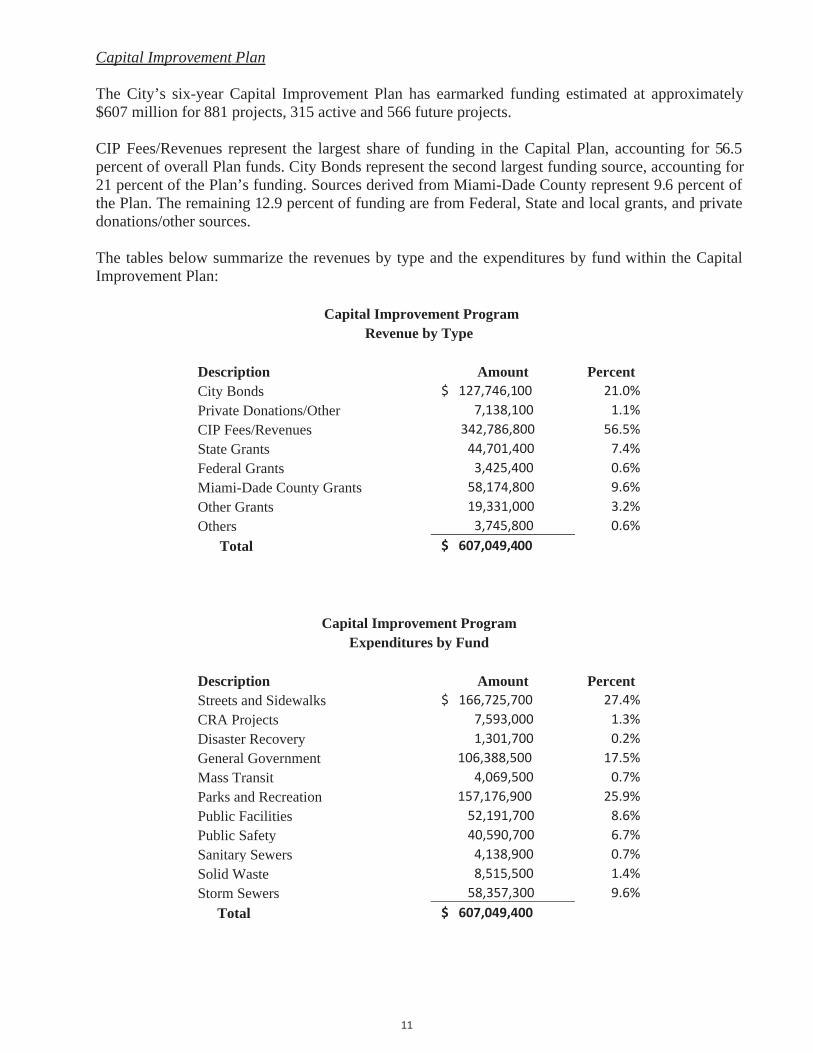
The City’s six-year Capital Improvement Plan has earmarked funding estimated at approximately $607 million for 881 projects, 315 active and 566 future projects.
CIP Fees/Revenues represent the largest share of funding in the Capital Plan, accounting for 56.5 percent of overall Plan funds. City Bonds represent the second largest funding source, accounting for 21 percent of the Plan’s funding. Sources derived from Miami-Dade County represent 9.6 percent of the Plan. The remaining 12.9 percent of funding are from Federal, State and local grants, and private donations/other sources.
The tables below summarize the revenues by type and the expenditures by fund within the Capital Improvement Plan:
Capital Improvement ProgramRevenue by Type
Description Amount PercentCity Bonds $ 127,746,100 21.0%Private Donations/Other 7,138,100 1.1%CIP Fees/Revenues 342,786,800 56.5%State Grants 44,701,400 7.4%Federal Grants 3,425,400 0.6%Miami-Dade County Grants 58,174,800 9.6%Other Grants 19,331,000 3.2%Others 3,745,800 0.6% Total $ 607,049,400
Capital Improvement ProgramExpenditures by Fund
Description Amount PercentStreets and Sidewalks $ 166,725,700 27.4%CRA Projects 7,593,000 1.3%Disaster Recovery 1,301,700 0.2%General Government 106,388,500 17.5%Mass Transit 4,069,500 0.7%Parks and Recreation 157,176,900 25.9%Public Facilities 52,191,700 8.6%Public Safety 40,590,700 6.7%Sanitary Sewers 4,138,900 0.7%Solid Waste 8,515,500 1.4%Storm Sewers 58,357,300 9.6%
Total $ 607,049,400
11
Relevant Financial Policies
The City has adopted a comprehensive set of financial policies. Two of these policies are described below.
Debt Management Policy
The City adopted a revised Debt Management Policy on May 26, 2016, to provide guidance governing the issuance, management, continuing evaluation of and reporting on all debt obligations issued by the City. Additionally, the Policy will provide guidance for the preparation and implementation necessary to assure compliance. It is the responsibility of the Finance Committee to review and make recommendations regarding the issuance of debt obligations and the management of outstanding debt. The Finance Committee shall consist of seven voting members consisting of five members from the local business community appointed by the City Commission, the Mayor or his designee, and the City’s Finance Director as the City Manager’s designee. Others who may be present at meetings of the Finance Committee to provide technical expertise and advice shall include representatives from the City Attorney’s office, the Budget Department, the Department to which the proposed debt may relate, the City’s Financial Advisor, Bond Counsel and Disclosure Counsel. Meetings will be open to all interested parties and official minutes will be taken and copies made available upon request to the City Clerk.
The City’s Finance Committee will consider all issues related to outstanding and proposed debt obligations, and will vote on issues affecting or relating to the credit worthiness, security and repayment of such obligations, including but not limited to procurement of services, structure, repayment terms and covenants of the proposed debt obligation, and issues which may affect the security of the bonds and ongoing disclosure to bondholders and interested parties.
The following policies concerning the issuance and management of debt were established in the Debt Management Policy: (a) the City will not issue debt obligations or use debt proceeds to finance current operations; (b) the City will utilize debt obligations only for acquisition, construction or remodeling of capital improvement projects that cannot be funded from current revenue sources or in such cases wherein it is more equitable to the users of the projects to finance the project over its useful life; and (c) the City will measure the impact of debt service requirements of outstanding and proposed debt obligations on single year, five, ten and twenty year periods. This analysis will consider debt service maturities and payment patterns as well as the City’s commitment to a pay as you go budgetary capital allocation.
As the City periodically addresses its ongoing needs, the City Manager and the City Commission must ensure that the future elected officials will have the flexibility to meet the capital needs of the City. Since neither State law nor the City Charter provides any limits on the amount of debt, which may be incurred (other than the requirement to have General Obligation debt approved in advance by referendum), this policy establishes the following targets and limits which at the same time provide future flexibility: (a) Debt Limit 3 percent, (b) Goal/Target 2.50 percent, and (c) UncommittedGeneral Fund Balance 5 percent to 10 percent of annual operating budget or actual revenues achieved over 5 years.
12
Pursuant to the Debt Management Policy, the City’s debt issuance is subject to the following constraints: (a) the City will issue debt obligations for acquiring, constructing or renovating Capital Improvements or for refinancing existing debt obligations. Projects must be designed as public purpose projects by the City Commission prior to funding, (b) the maximum maturity shall be the earlier of (i) the estimated useful life of the capital improvements being financed or (ii) thirty years or (iii) in the event debt was issued to refinance outstanding debt obligations, the final maturity of the debt obligations being refinanced, unless a longer term is recommended by the Finance Committee, (c) the City shall strive to maintain the Net Debt Per Capita at or below the standard median for cities of comparable size. The Net Debt Per Capita shall not exceed 3 percent of such median as established by the Finance Committee. The Net Debt Per Capita shall be calculated by dividing the Governmental Net Debt by the most current population within the City, (d) the City shall strive to maintain a ratio of Net Debt to Taxable Assessed Value of properties within the City at or below the standard industry median for cities of comparable size. Such ratio shall not exceed 3 percent of such median as established by the Finance Committee. The ratio of Net Debt to Taxable Assessed Value shall be calculated by dividing the Net Debt by the taxable assessed value of all taxable properties within the City, (e) Subject to Federal and State law, interest may be capitalized from date of issuance of debt obligations through the completion of construction for revenue producing projects. Interest may also be capitalized for projects in which the revenue designated to pay the debt service on the bonds will be collected at a future date, not to exceed six months from the estimated completion of construction and offset by earnings in the construction fund, and (f) the City shall comply with all covenants and requirements of the bond resolutions, and State and Federal laws authorizing and governing the issuance and administration of debt obligations.
Investment Management Policy
The City adopted a detailed written investment policy on February 26, 2015, that applies to all cash and investments held or controlled by the City and identified as “general operating funds.” The Investment Policy does not apply to the City’s Pension Funds, Deferred Compensation & Section 401(a) Plans, and funds related to the issuance of debt where there are other existing policies or indentures in effect for such funds. Additionally, any future revenues which have statutory investment requirements conflicting with the City’s Investment Policy, and funds held by State agencies (e.g. Department of Revenue) are not subject to the provisions of the policy.
The primary objective of the investment program is the safety of the principal of those funds within the portfolios. Investment transactions shall seek to keep capital losses at a minimum, whether they are from securities defaults or decline of market value. To attain this objective, diversification is required so that potential losses on individual securities do not exceed the income generated from the remainder of the portfolio. The portfolios are required to be managed in such a manner that funds are available to meet reasonably anticipated cash flow requirements in an orderly manner. Return on Investment is of least importance compared to the safety and liquidity objectives described in the policy.
13
The policy stipulates that in accordance with the City’s Administrative Policies, the responsibility for providing oversight and direction in regard to the management of the investment program resides with the City’s Finance Director, designee or investment advisor approved by the City Commission. The City Manager shall delegate to the Finance Director the responsibility for setting or adjusting policies and overseeing the City’s investments and investment activities. The active management of the City’s investments shall be the responsibility of the City’s Finance Director, or he may delegate such responsibility, in whole or in part, to Treasurer or Assistant Finance Director or, subject to the approval of the City Commission, an investment advisor experienced in municipal finance that is registered with the Securities and Exchange Commission under the Securities Exchange Act of 1934. The City may employ an investment advisor to assist in managing some or all of the City’s portfolios. Such investment advisor must be registered with the Securities and Exchange Commission under the Investment Advisors Act of 1940.
Subject to the exceptions in the City’s investment policy, the City may invest in the following types of securities: (a) The Florida Local Government Surplus Funds Trust Fund, (b) United States Government Securities, (c) United States Government Agencies, (d) Federal Instrumentalities, (e) Interest Bearing Time Deposit or Savings Accounts, (f) Repurchase Agreements, (g) Commercial Paper, (h) Corporate Notes, (i)Municipal Securities, (j) Registered Investment Companies (Money Market Funds), (k) Intergovernmental Investment Pool, (l) Agency Mortgage-Backed Securities, (m) Asset-Backed Securities, (n) Supranationals and (o) Foreign Sovereign Governments.
For the year ending September 30, 2016, the City has complied with its Investment and Debt Management Policies.
The investment policy is adopted by City Resolution. The Finance Director, Treasurer, and the Investment Committee shall review the policy annually and the City Commission shall approve any modifications made thereto.
Financial Integrity Principles
On February 10, 2000, the City enacted Ordinance No. 11890 (“Financial Integrity Ordinance”) establishing thirteen financial integrity principles. The Financial Integrity Ordinance was enacted as a preventative measure setting forth financial practices that would prevent the recurrence of a financial emergency.
The Financial Integrity Ordinance requires the City to establish three reserves: (1) a “contingency” reserve of $5 million to fund unanticipated budget issues which arise for potential expenditure overruns which cannot be offset through other sources or actions; (2) an “unassigned” fund balance reserve equal to ten percent of the prior three years average of general revenues (excluding transfers and including the contingency reserves in (1) above) to fund unexpected mid-year revenue shortfalls or for an emergency such as a natural or man-made disaster, which threatens the health, safety and welfare of the City’s residents, businesses or visitors; and (3) an “assigned” reserve equal to ten percent of the prior three years average of general revenues (excluding transfers) to fund long-term liabilities and commitments of the City, such as compensated absences, self-insurance plan deficits and anticipated adjustments in pension plan payments resulting from market losses.
14
For the 2016 fiscal year, the City’s General Fund reserves decreased by approximately $15.9 million and had an ending fund balance of approximately $131.5 million. Of the ending fund balance, approximately $51.9 million is restricted, approximately $2.0 million is non-spendable; approximately $21.1 is assigned, which includes the $5.0 million Required Contingency Reserve and approximately $56.5 million is unassigned. Consequently, while the overall fund balance exceeded the 20 percent three-year revenue average, the 10 percent of the three-year revenue average required for the assigned fund balance was not met.
The City’s five year forecast assumes increasing the General Fund’s fund balance each of the five years. General Fund revenues are projected to grow by 8 percent over the next five years, while General Fund expenditures are projected to grow by 11 percent over the same period. While meeting the fund balance requirements of the Financial Integrity Principles is a significant accomplishment and reverses the trend of declines experienced in fiscal years 2008 through 2009, the ultimate course will be determined by the City Commission in its review, consideration, and ultimate approval of future budgets submitted by the Administration.
Failure to comply with the Financial Integrity Ordinance is not an event of default under the Ordinance. The City will strive to come into compliance with the Ordinance. However, there can be no assurance that the General Fund Reserves will reach or be maintained at the level required by the Financial Integrity Ordinance. The City continues to recommend balanced budgets, including recommendations to restore General Fund Reserves to required levels as quickly and as reasonably as possible.
Risk Management – Self Insurance Program
The City administers a self-insurance program for workers' compensation, tort liability, property, and group health and life insurance programs, subject to certain stop-loss provisions. The City also offers to its retirees comprehensive medical coverage and life insurance benefits through its self-insurance plan.
The health and life insurance programs are administered by an independent administrator. The City funds the program on a pay as you go basis. Insurance coverage is maintained with independent carriers for property damage to City facilities. The City maintains excess coverage with independent carriers for workers' compensation and general liability. The City allows for cost allocation of pension, health insurance and worker’s compensation benefits in the operating departments and a centralized account from which payments are made.
15

Certificate of Achievement
The Government Finance Officers Association of the United States and Canada (GFOA) awarded a Certificate of Achievement for Excellence in Financial Reporting to the City of Miami, Florida for its Comprehensive Annual Financial Report (CAFR) for the fiscal year ended September 30, 2015. The Certificate of Achievement is the highest form of recognition in the area of governmental accounting and financial reporting. The attainment of this award represents a significant accomplishment by a government and its financial management team.
In order to be awarded a Certificate of Achievement, the government had to publish an easily readable and efficiently organized CAFR that satisfied both generally accepted accounting principles and applicable program requirements. A Certificate of Achievement for Excellence in Financial Reporting is valid for a period of one year only. We believe that our current CAFR continues to meet the Certificate of Achievement for Excellence in Financial Reporting Program’s requirements, and we are submitting it to the GFOA to determine its eligibility for another certificate.
Acknowledgements
The preparation of this report would not have been possible without the skill, effort, and dedication of the entire staff of the Finance Department. The year-end closing, the audit, and compiling and publishing the CAFR could not have been accomplished without hard work, commitment and personal sacrifice.
We wish to thank all government departments for their assistance in providing the data necessary to prepare this report. The guidance and cooperation of the Mayor and City Commission in planning and conducting the financial affairs of the City is greatly appreciated. Lastly, we wish to express our appreciation to the City’s General Services Administration for the reproduction of this report.
Respectfully submitted,
___________________________Daniel J. AlfonsoCity Manager
___________________________Fernando CasamayorAssistant City Manager/CFO
___________________________Jose M. Fernandez, CPAFinance Director
16
17
Government Finance Officers Association
Certificate of Achievement for Excellence
in Financial Reporting
Presented to
City of Miami
Florida
For its Comprehensive Annual Financial Report
for the Fiscal Year Ended
September 30, 2015
Executive Director/CEO

FINANCIAL SECTION
18

Page left intentionally blank
19
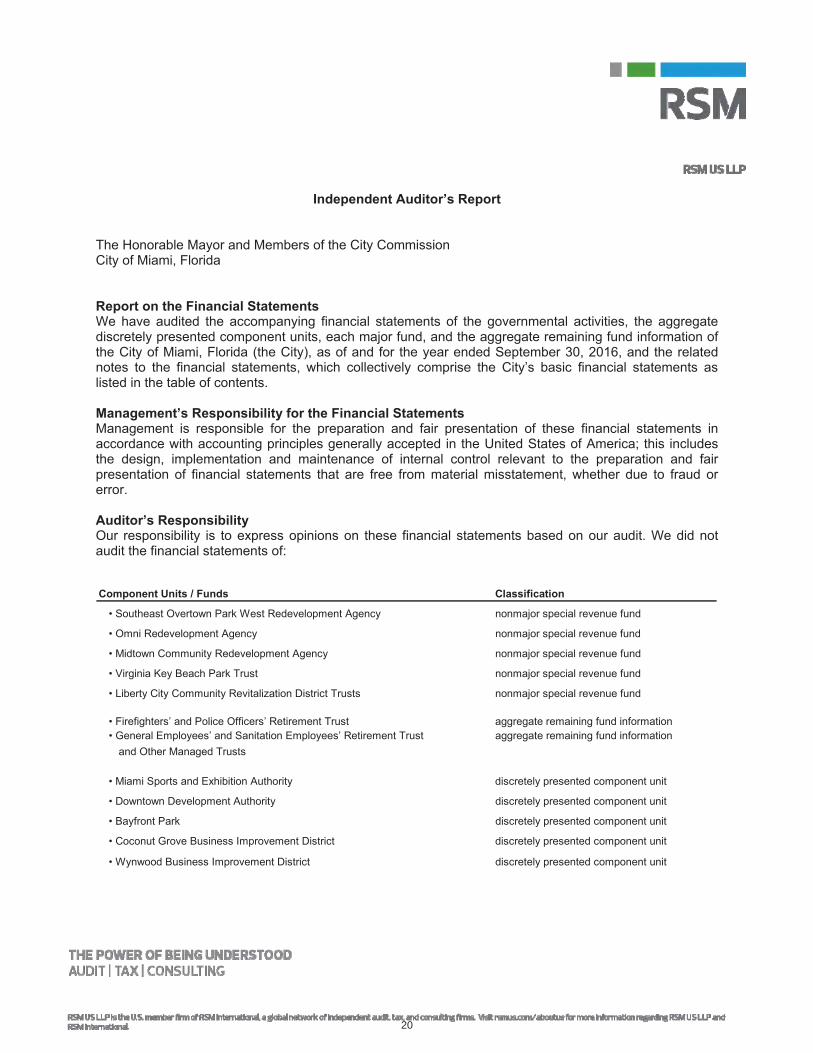
20

Government Auditing Standards
21
Required Supplementary Informationmanagement’s
discussion and analysis, budgetary comparison schedules, and other post-employment benefits and the pension related schedules
Other Information
introductory section, the combining and individual fund financial statements and schedules statistical section,
combining and individual fund financial statements and schedules
combining and individual fund statements and schedules
introductory statistical sections
Government Auditing Standards Government Auditing Standards,
Government Auditing Standards
22

Page left intentionally blank
23

Management’s Discussion and Analysis
As management of the City of Miami, Florida (the “City”), we offer readers of the City ’s financial statements this narrative overview and analysis of the financial activities of the City for the fiscal year ended September 30, 2016. We encourage readers to consider the information presented here in conjunction with additional information that we have furnished in our letter of transmittal, which can be found on pages 5 – 16 of this report.
Financial Highlights
The liabilities and deferred inflows of resources of the City exceeded its assets and deferred outflows of resources at the close of the 2016 fiscal year by approximately $334.5 million (net position deficit).
The City total net position decreased in fiscal year 2016 by $23.0 million compared to a decrease in net position of $37.7 million during fiscal year 2015. Total expenses exceeded total revenues in the current year due primarily to an increase in net pension expense.
At the close of the current fiscal year, the City’s governmental operating fund (General Fund) reporteda fund balance of approximately $131.5 million, a decrease of approximately $15.9 million in comparison with the prior year.
The City’s total outstanding debt had a net decrease of approximately $21.4 million during the current fiscal year because of a reduction of principal in accordance with scheduled retirements of bond payments.
Overview of Financial Statements
This discussion and analysis is intended to serve as an introduction to the City’s basic financial statements. The City’s basic financial statements are comprised of three components: 1) government-wide financial statements 2) fund financial statements, and 3) notes to the financial statements. This report also contains other supplementary information in addition to the basic financial statements themselves.
Government-Wide Financial Statements
The government-wide financial statements are designed to provide readers with a broad overview of the City’s finances, in a manner similar to private-sector business.
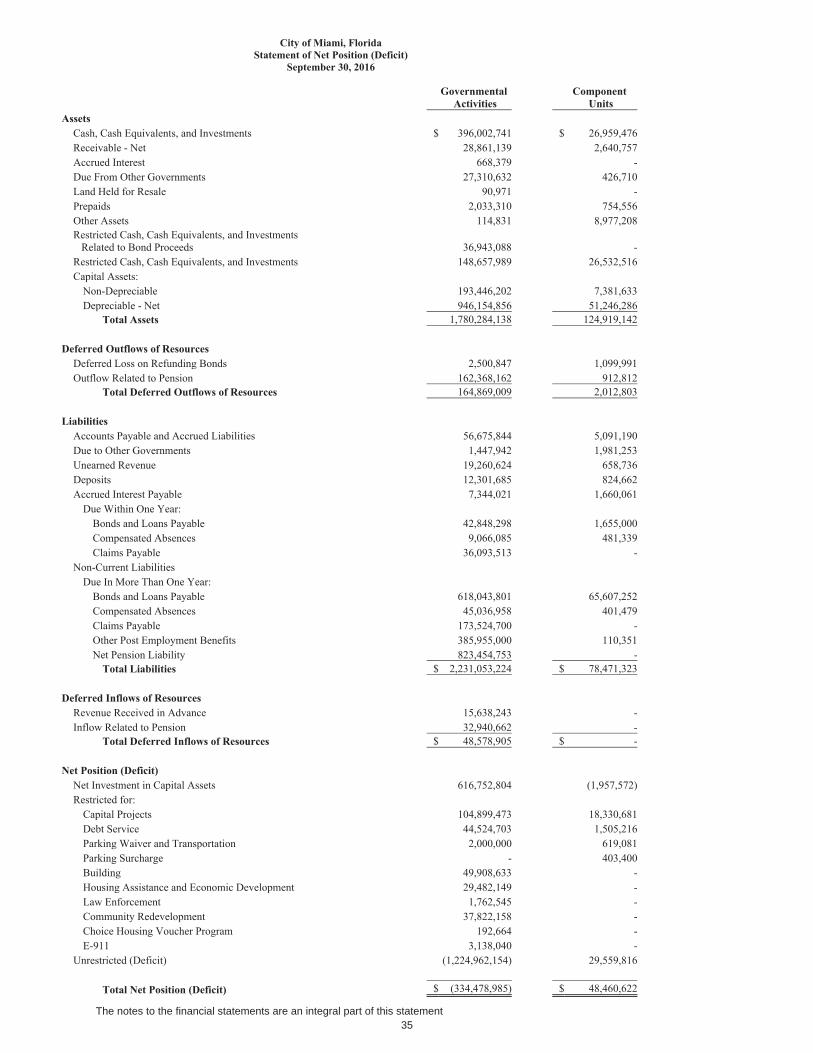
The focus of the statement of net position presents financial information on all of the City ’s assets and liabilities, and deferred inflows/outflows of resources with the difference reported as net position (deficit). Over time, increases or decreases in net position may serve as a useful indicator of whether the financial position of the City is improving or deteriorating.
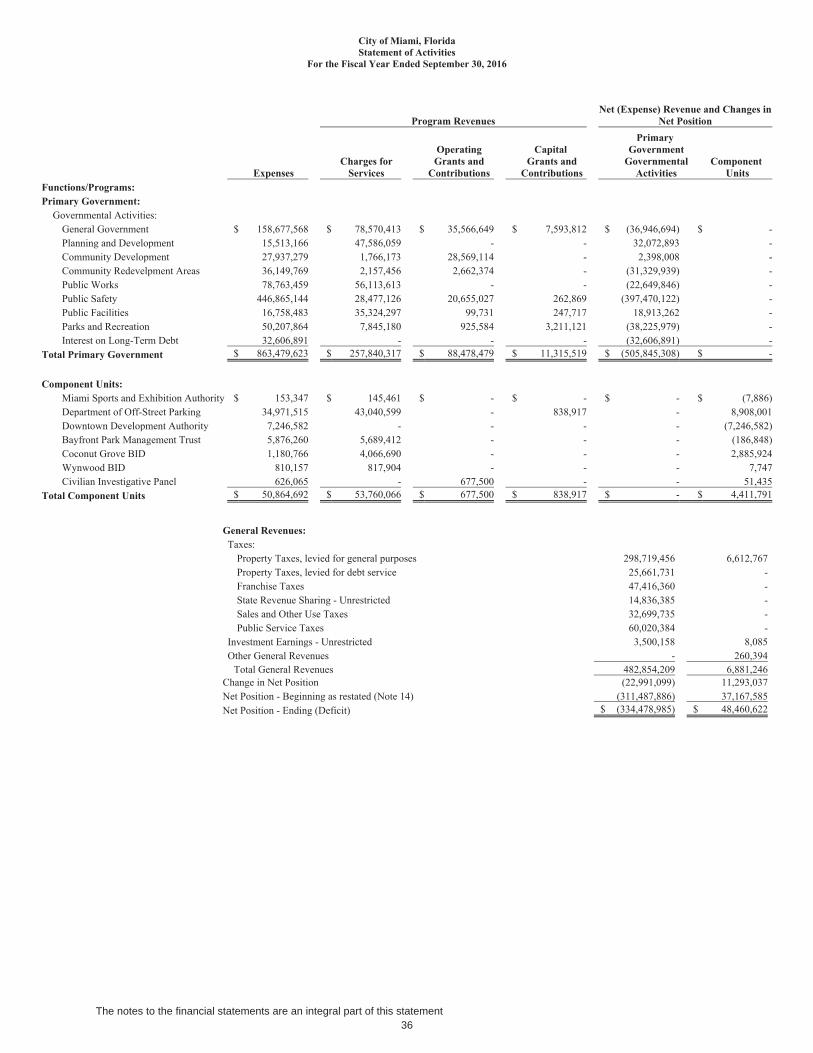
The statement of activities presents information showing how the City’s net position changed during the most recent fiscal year. All changes in net position are reported as soon as the underlying event giving rise to the change occurs, regardless of the timing of related cash flows. Thus, revenues and expenses are reported for some items that will only result in cash flows in future fiscal periods (e.g., uncollected taxes and earned but unused vacation leave). The information is presented with the intent to summarize and simplify the user’s analysis of the cost for the primary government and its component units’ governmental activities.
Both of the government-wide financial statements distinguish functions of the City that are principally supported by taxes and intergovernmental revenues (governmental activities). The governmental activities of the City include general government, planning and development, community development, community redevelopment areas, public works, public safety, public facilities, and parks and recreation.
24
CITY OF MIAMI, FLORIDAMANAGEMENT’S DISCUSSION AND ANALYSIS (Unaudited)September 30, 2016
The government-wide financial statements include not only the City itself (known as the primarygovernment), but also its discretely presented component units, which are other governmental units over which the City can exercise influence and/or may be obligated to provide financial subsidies . Financial information for these component units is reported separately from the financial information presented for the primary government itself. The blended component units, although legally separate, function for all practical purposes as departments of the City, and therefore have been included as an integral part of the primary government.
The government-wide financial statements can be found on pages 35-36 of this report.
Fund Financial Statements
A fund is a grouping of related accounts that is used to maintain control over resources that have been segregated for specific activities or objectives. The City, like other state and local governments, uses fund accounting to ensure and demonstrate compliance with finance-related legal requirements. All of the funds of the City can be divided into two categories: governmental funds and fiduciary funds.
Governmental Funds
Governmental funds are used to account for essentially the same functions reported as governmental activities in the government-wide financial statements. However, unlike the government-wide financial statements, governmental fund financial statements focus on near-term inflows and outflows of spendable resources, as well as on balances of spendable resources available at the end of the fiscal year. Such information may be useful in assessing a government’s near-term financing requirements.
Because the focus of governmental funds is narrower than that of the government-wide financial statements, it is useful to compare the information presented for governmental funds with similar information presented for governmental activities in the government-wide financial statements. By doing so, readers may better understand the long-term impact of the government’s near-term financing decisions. Both the governmental fund balance sheet and the governmental fund statement of revenues, expenditures, and changes in fund balances provide a reconciliation to facilitate this comparison between governmental funds and governmental activities.
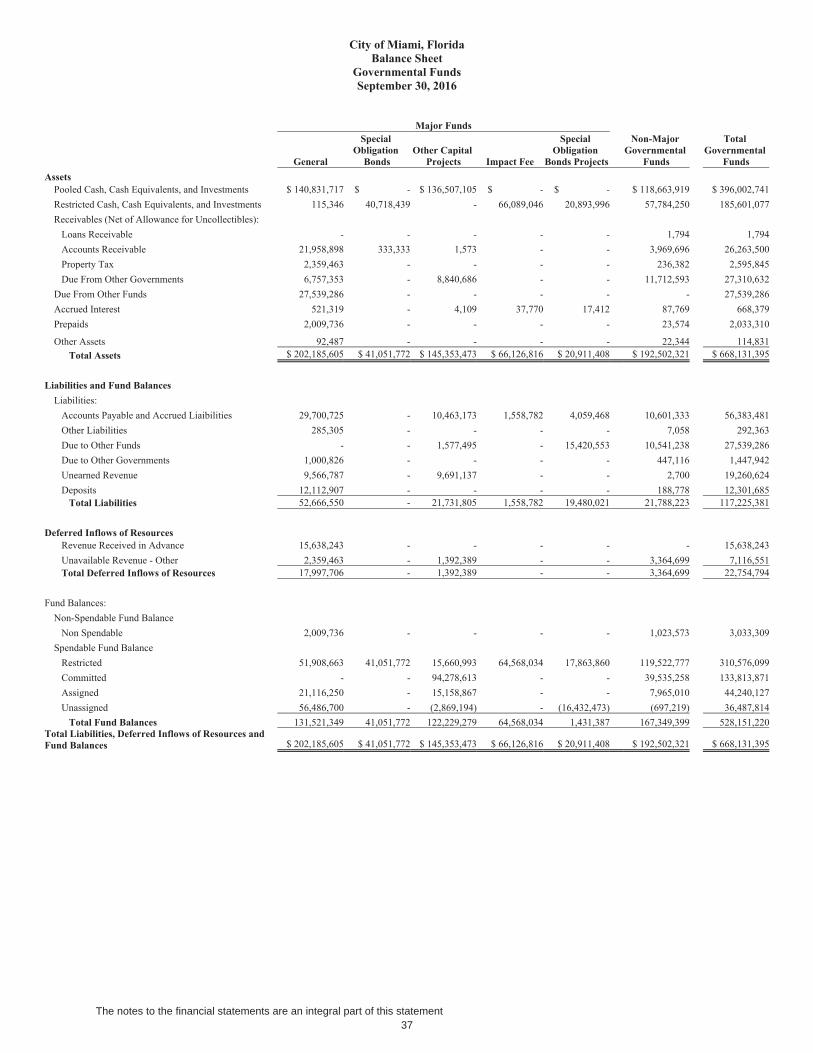
The City maintains thirty-four individual governmental funds. Information is presented separately in the governmental fund balance sheets and in the governmental fund statements of revenues, expenditures and changes in fund balances for the general fund, special obligation bonds debt service fund, other capital projects fund, and impact fee fund, which are considered major funds. Data from the other thirty governmental funds are combined into a single aggregated presentation. Individual fund data for each of these non-major governmental funds is provided in the form of combining statements in the combining and individual fund statements and schedules section of this report.
The City adopts an annual appropriated budget for its general fund, special revenue funds, and debt service funds. Budgetary comparison schedules have been provided for the general fund, special revenue funds and debt service funds.
The basic governmental fund financial statements can be found on pages 37-40 of this report.
25
CITY OF MIAMI, FLORIDAMANAGEMENT’S DISCUSSION AND ANALYSIS (Unaudited)September 30, 2016
Fiduciary Funds
Fiduciary funds are used to account for resources held for the benefit of parties outside the City. Fiduciary funds are not reported in the government-wide financial statements because the resources of those funds are not available to support the City’s own programs and operations.
The basic fiduciary fund financial statements can be found on pages 41-42 of this report.
Notes to the Financial Statements
The notes provide additional information that is necessary to acquire a full understanding of the data provided in the government-wide and fund financial statements. The notes to the financial statements can be found on pages 47-136 of this report.
Other Information
In addition to the basic financial statements and accompanying notes, this report also presents certain required supplementary information concerning budgetary comparisons and the City’s progress in funding its obligations to provide pension benefits to its employees. Required supplementary information can be found on pages 138-152 of this report.
The combining statements referred to earlier in connection with non-major governmental funds are presented immediately following the required supplementary information. Combining and individual fund statements and schedules can be found on pages 158-171 of this report.
Government-Wide Overall Financial Analysis
As noted earlier, net position over time may serve as a useful indicator of a government’s financial position. In the case of the City, the assets and deferred outflows of resources was lower than liabilities and deferred inflows of resources by $334.5 million at the close of the most recent fiscal year, resulting in a net deficit. City’s net position reflects its investment in capital assets (e.g. infrastructure, land, buildings, machinery and equipment); net of accumulated depreciation, less any related debt used to construct or acquire those assets that is still outstanding. The City uses these capital assets to provide services to citizens; consequently, these assets are not available for future spending. Although the City’s investment in capital assets is reported net of related debt, it should be noted that the resources needed to repay this debt must be provided from other sources, since the capital assets themselves are typically not used to liquidate these liabilities. As of September 30, 2016, the City’s net investment in capital assets was approximately $616.8 million.
An additional portion of the City’s net position represents resources that are subject to restrictions on how they may be used. As of September 30, 2016, the City’s portion of restricted net position was approximately $273.7 million.
The remaining portion represents an unrestricted net deficit of approximately $1.2 billion which is primarily due to outstanding borrowings for which there are no off-setting assets, along with an increase in claims payable, net pension liability, and other post-employment benefits (OPEB) liability.
26
CITY OF MIAMI, FLORIDAMANAGEMENT’S DISCUSSION AND ANALYSIS (Unaudited)September 30, 2016
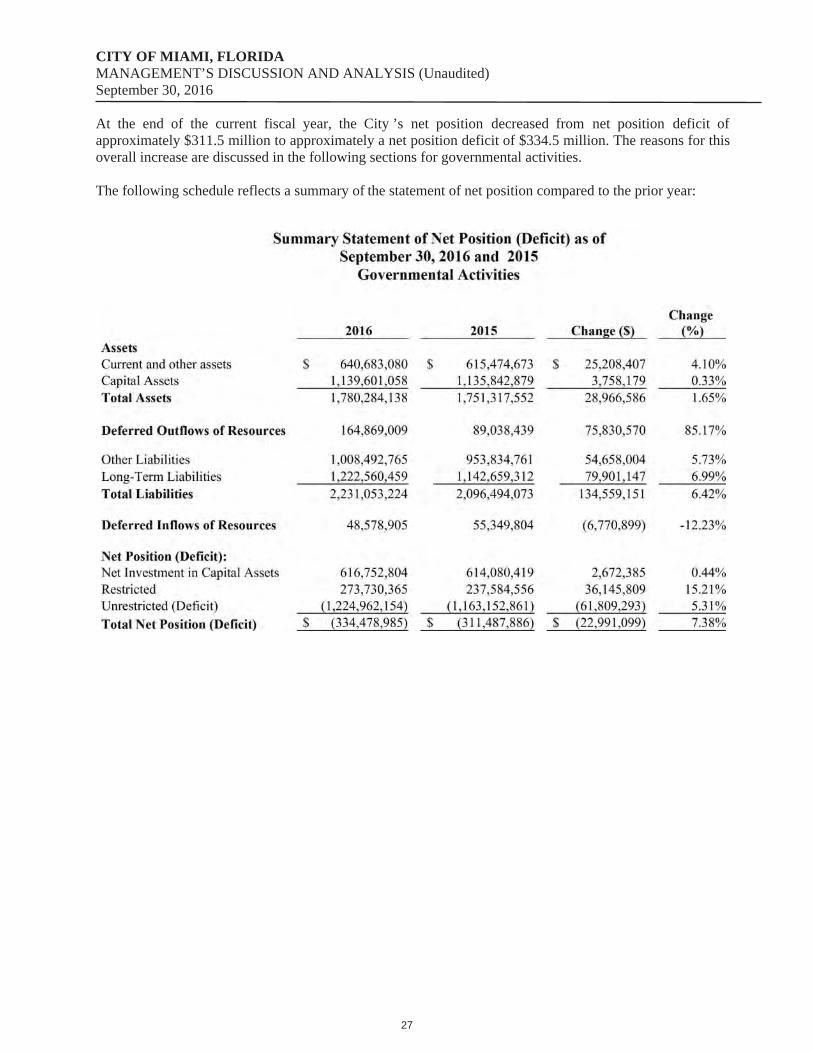
At the end of the current fiscal year, the City ’s net position decreased from net position deficit of approximately $311.5 million to approximately a net position deficit of $334.5 million. The reasons for this overall increase are discussed in the following sections for governmental activities.
The following schedule reflects a summary of the statement of net position compared to the prior year:
27
CITY OF MIAMI, FLORIDAMANAGEMENT’S DISCUSSION AND ANALYSIS (Unaudited)September 30, 2016
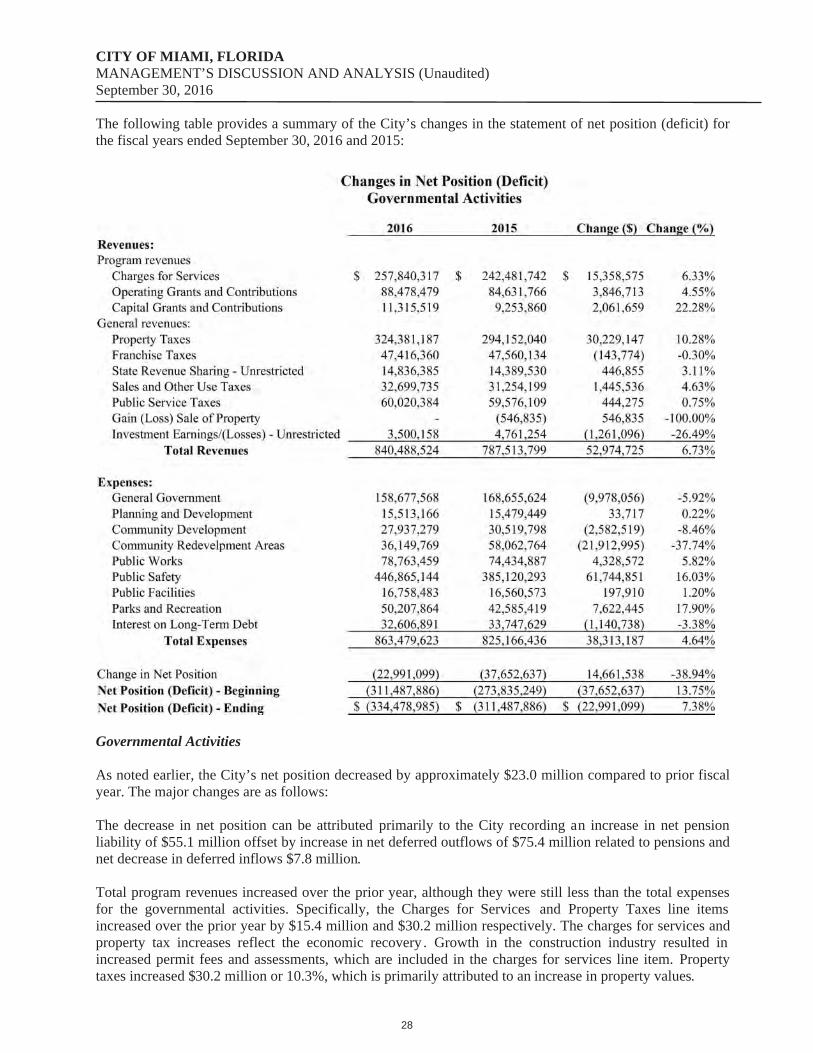
The following table provides a summary of the City’s changes in the statement of net position (deficit) for the fiscal years ended September 30, 2016 and 2015:
Governmental Activities
As noted earlier, the City’s net position decreased by approximately $23.0 million compared to prior fiscal year. The major changes are as follows:
The decrease in net position can be attributed primarily to the City recording an increase in net pension liability of $55.1 million offset by increase in net deferred outflows of $75.4 million related to pensions and net decrease in deferred inflows $7.8 million.
Total program revenues increased over the prior year, although they were still less than the total expenses for the governmental activities. Specifically, the Charges for Services and Property Taxes line items increased over the prior year by $15.4 million and $30.2 million respectively. The charges for services and property tax increases reflect the economic recovery . Growth in the construction industry resulted in increased permit fees and assessments, which are included in the charges for services line item. Property taxes increased $30.2 million or 10.3%, which is primarily attributed to an increase in property values.
28
CITY OF MIAMI, FLORIDAMANAGEMENT’S DISCUSSION AND ANALYSIS (Unaudited)September 30, 2016
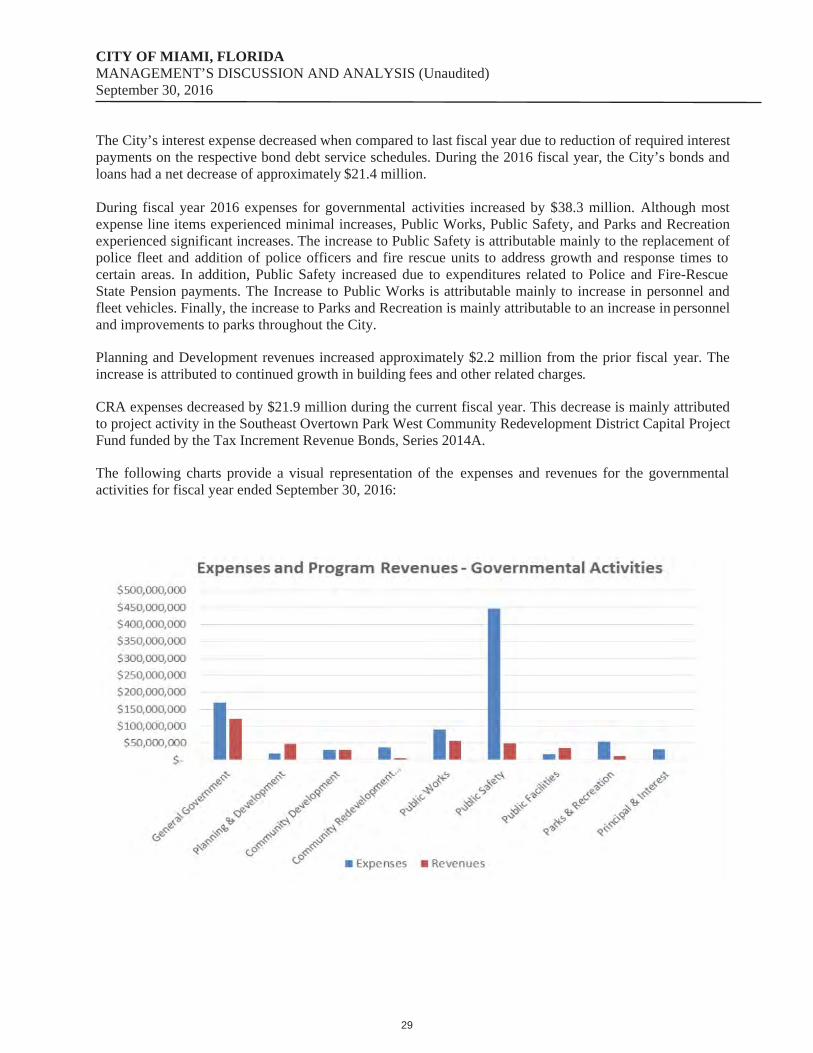
The City’s interest expense decreased when compared to last fiscal year due to reduction of required interest payments on the respective bond debt service schedules. During the 2016 fiscal year, the City’s bonds and loans had a net decrease of approximately $21.4 million.
During fiscal year 2016 expenses for governmental activities increased by $38.3 million. Although most expense line items experienced minimal increases, Public Works, Public Safety, and Parks and Recreation experienced significant increases. The increase to Public Safety is attributable mainly to the replacement of police fleet and addition of police officers and fire rescue units to address growth and response times to certain areas. In addition, Public Safety increased due to expenditures related to Police and Fire-Rescue State Pension payments. The Increase to Public Works is attributable mainly to increase in personnel and fleet vehicles. Finally, the increase to Parks and Recreation is mainly attributable to an increase in personnel and improvements to parks throughout the City.
Planning and Development revenues increased approximately $2.2 million from the prior fiscal year. The increase is attributed to continued growth in building fees and other related charges.
CRA expenses decreased by $21.9 million during the current fiscal year. This decrease is mainly attributed to project activity in the Southeast Overtown Park West Community Redevelopment District Capital Project Fund funded by the Tax Increment Revenue Bonds, Series 2014A.
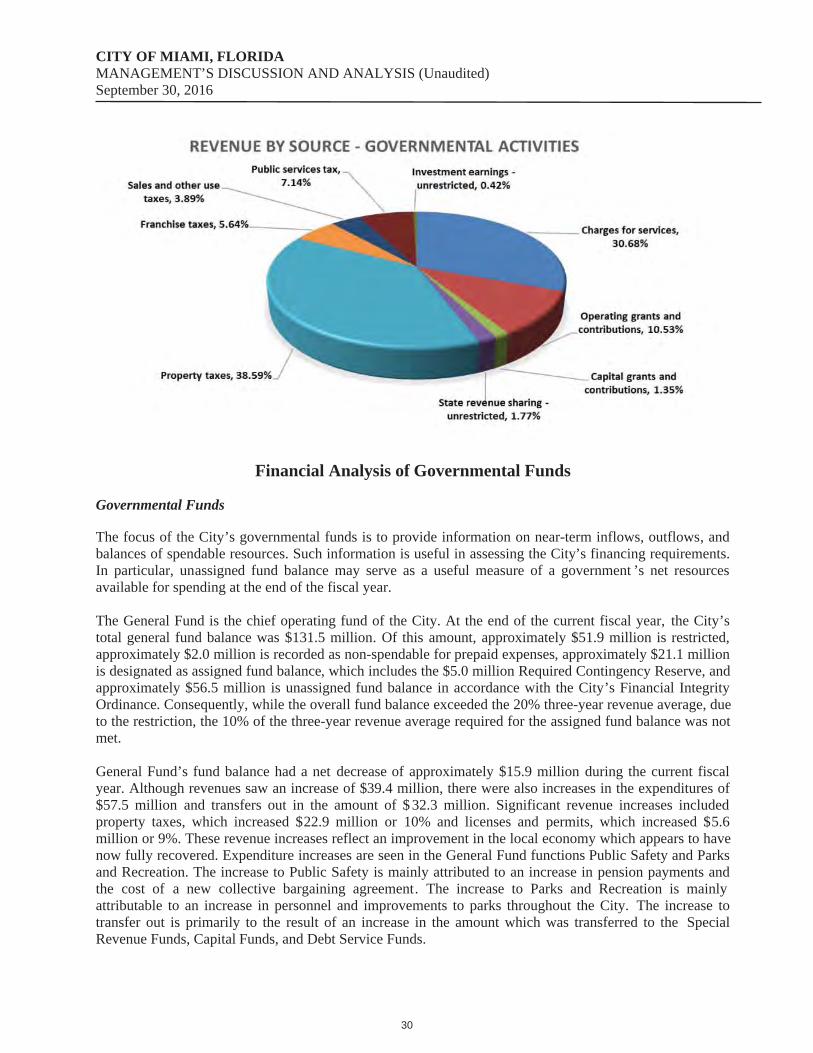
The following charts provide a visual representation of the expenses and revenues for the governmental activities for fiscal year ended September 30, 2016:
29
CITY OF MIAMI, FLORIDAMANAGEMENT’S DISCUSSION AND ANALYSIS (Unaudited)September 30, 2016
Financial Analysis of Governmental Funds
Governmental Funds
The focus of the City’s governmental funds is to provide information on near-term inflows, outflows, and balances of spendable resources. Such information is useful in assessing the City’s financing requirements. In particular, unassigned fund balance may serve as a useful measure of a government ’s net resources available for spending at the end of the fiscal year.
The General Fund is the chief operating fund of the City. At the end of the current fiscal year, the City’s total general fund balance was $131.5 million. Of this amount, approximately $51.9 million is restricted, approximately $2.0 million is recorded as non-spendable for prepaid expenses, approximately $21.1 million is designated as assigned fund balance, which includes the $5.0 million Required Contingency Reserve, and approximately $56.5 million is unassigned fund balance in accordance with the City’s Financial Integrity Ordinance. Consequently, while the overall fund balance exceeded the 20% three-year revenue average, due to the restriction, the 10% of the three-year revenue average required for the assigned fund balance was not met.
General Fund’s fund balance had a net decrease of approximately $15.9 million during the current fiscal year. Although revenues saw an increase of $39.4 million, there were also increases in the expenditures of $57.5 million and transfers out in the amount of $ 32.3 million. Significant revenue increases included property taxes, which increased $22.9 million or 10% and licenses and permits, which increased $5.6 million or 9%. These revenue increases reflect an improvement in the local economy which appears to have now fully recovered. Expenditure increases are seen in the General Fund functions Public Safety and Parks and Recreation. The increase to Public Safety is mainly attributed to an increase in pension payments and the cost of a new collective bargaining agreement. The increase to Parks and Recreation is mainly attributable to an increase in personnel and improvements to parks throughout the City. The increase to transfer out is primarily to the result of an increase in the amount which was transferred to the Special Revenue Funds, Capital Funds, and Debt Service Funds.
30
CITY OF MIAMI, FLORIDAMANAGEMENT’S DISCUSSION AND ANALYSIS (Unaudited)September 30, 2016
Financial highlights of the City’s other major governmental funds are as follows:
The Special Obligation Bond Debt Service Fund has a fund balance of approximately $41.1 million. This represents an increase of approximately $5.8 million. The increase is attributed to an increase in transfers in to maintain the restricted cash requirements.
The Impact Fee Fund has a fund balance of $64.6 million. The increase in fund balance of $15.2 million from the prior year resulted primarily from impact fees associated with an increase in High Rise Residential Units.
The Other Capital Project Fund has a fund balance of $122.2 million. This represents an increase of approximately $41.2 million. The increase can be attributed to additional General Fund contributions to facilitate capital projects throughout the City for Public facilities, Parks & Recreation, Public Safety, and Solid Waste improvements.
General Fund Budgetary Highlights
The FY2016 Adopted Budget maintains funding for current City services, and allows for expanded services in some categories while reducing the overall millage rate from 8.3850 to 8.3351. The Adopted Budget enhances the level of service and support to both the Police and Fire Rescue Departments so that they can continue to provide our residents, visitors, and businesses with excellent public safety, to facilitate a vibrant, safe, and growing community.
The FY2016 City’s Adopted General Fund Budget totaled approximately $643.3 million. During the fiscal year, the General Fund budget was amended twice. These amendments increased the previously adopted budget by approximately $22.6 million to a revised total of approximately $665.9 million. This increase in the General Fund is primarily due to higher than budgeted expenditures in a few departments and the allocation of additional resources to the Capital Project Fund in accordance with capital expenditures that the City Commission previously approved or knew of such as the recent purchase of the helicopter for the Police Department, developing capital needs, and to cover grant expenditures for the Virginia Key Beach Trust Museum. Additionally, this increase appropriated funding per resolution R-15-0475 for the cost of the collective bargaining agreement between the City of Miami and the Miami Association of Firefighters, IAFF Local 587 in the amount of $7.54 million.
The City of Miami utilizes a five-year financial forecast to assist with the strategic decision process and to identify and prepare for future challenges. The Five-Year Financial Forecast demonstrates that anticipated revenue growth will not be sufficient to cover anticipated expenditure growth over the forecast period. Overall, General Fund revenues are projected to grow by 11 percent over the next five years, while General Fund expenditures are projected to grow by 13 percent over the same period. Therefore, with the projected fund balance of $119.84 million for FY2018, the City will fall below the Financial Integrity Principle (FIP) requirement through FY2021. The City’s Administration is committed to continuing to restore fund balance levels over time to achieve compliance with the reserve policies outlined in the Financial Integrity Ordinance.
31
CITY OF MIAMI, FLORIDAMANAGEMENT’S DISCUSSION AND ANALYSIS (Unaudited)September 30, 2016
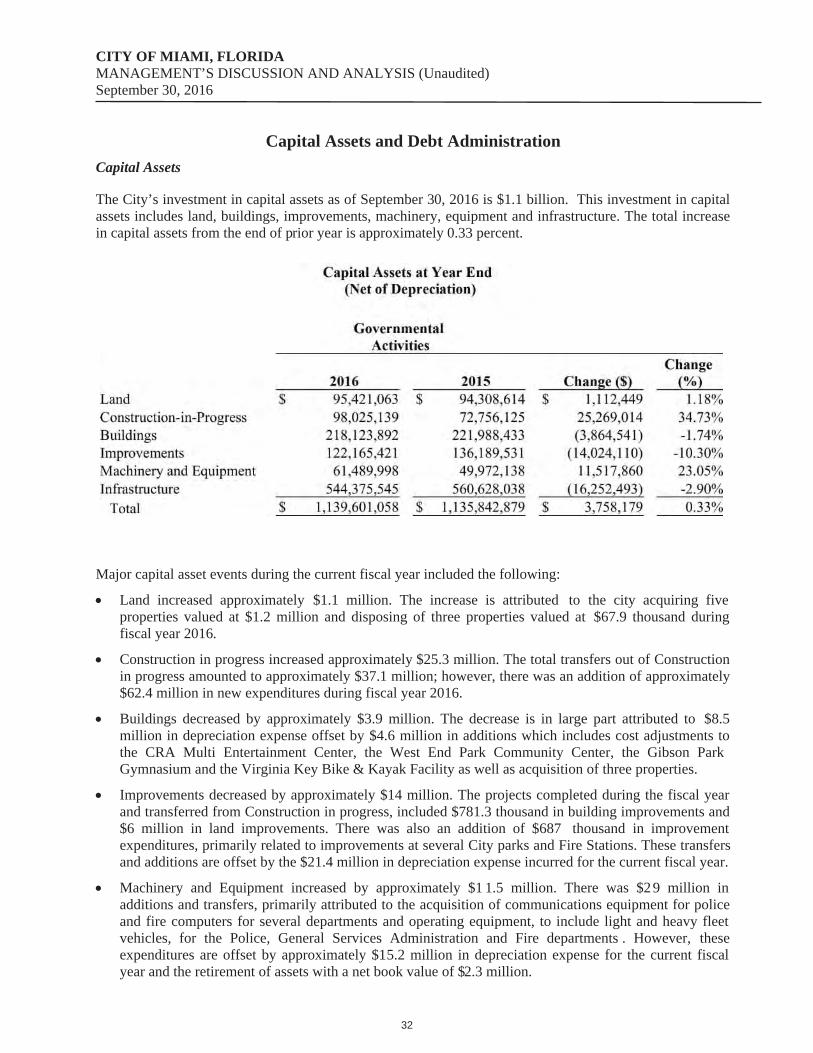
Capital Assets and Debt AdministrationCapital Assets
The City’s investment in capital assets as of September 30, 2016 is $1.1 billion. This investment in capital assets includes land, buildings, improvements, machinery, equipment and infrastructure. The total increase in capital assets from the end of prior year is approximately 0.33 percent.
Major capital asset events during the current fiscal year included the following:
Land increased approximately $1.1 million. The increase is attributed to the city acquiring five properties valued at $1.2 million and disposing of three properties valued at $67.9 thousand during fiscal year 2016.
Construction in progress increased approximately $25.3 million. The total transfers out of Construction in progress amounted to approximately $37.1 million; however, there was an addition of approximately $62.4 million in new expenditures during fiscal year 2016.
Buildings decreased by approximately $3.9 million. The decrease is in large part attributed to $8.5 million in depreciation expense offset by $4.6 million in additions which includes cost adjustments to the CRA Multi Entertainment Center, the West End Park Community Center, the Gibson Park Gymnasium and the Virginia Key Bike & Kayak Facility as well as acquisition of three properties.
Improvements decreased by approximately $14 million. The projects completed during the fiscal year and transferred from Construction in progress, included $781.3 thousand in building improvements and $6 million in land improvements. There was also an addition of $687 thousand in improvement expenditures, primarily related to improvements at several City parks and Fire Stations. These transfers and additions are offset by the $21.4 million in depreciation expense incurred for the current fiscal year.
Machinery and Equipment increased by approximately $1 1.5 million. There was $29 million in additions and transfers, primarily attributed to the acquisition of communications equipment for police and fire computers for several departments and operating equipment, to include light and heavy fleet vehicles, for the Police, General Services Administration and Fire departments . However, these expenditures are offset by approximately $15.2 million in depreciation expense for the current fiscal year and the retirement of assets with a net book value of $2.3 million.
32
CITY OF MIAMI, FLORIDAMANAGEMENT’S DISCUSSION AND ANALYSIS (Unaudited)September 30, 2016
Infrastructure decreased by approximately $16.2 million. There was $18.1 million in transfers, primarily attributed to Roadway Improvements. These transfers were offset by $34.3 million in depreciation expense for the current fiscal year.
Additional information on the City’s capital assets can be found in Note 1 and Note 5 in the notes to the financial statements.
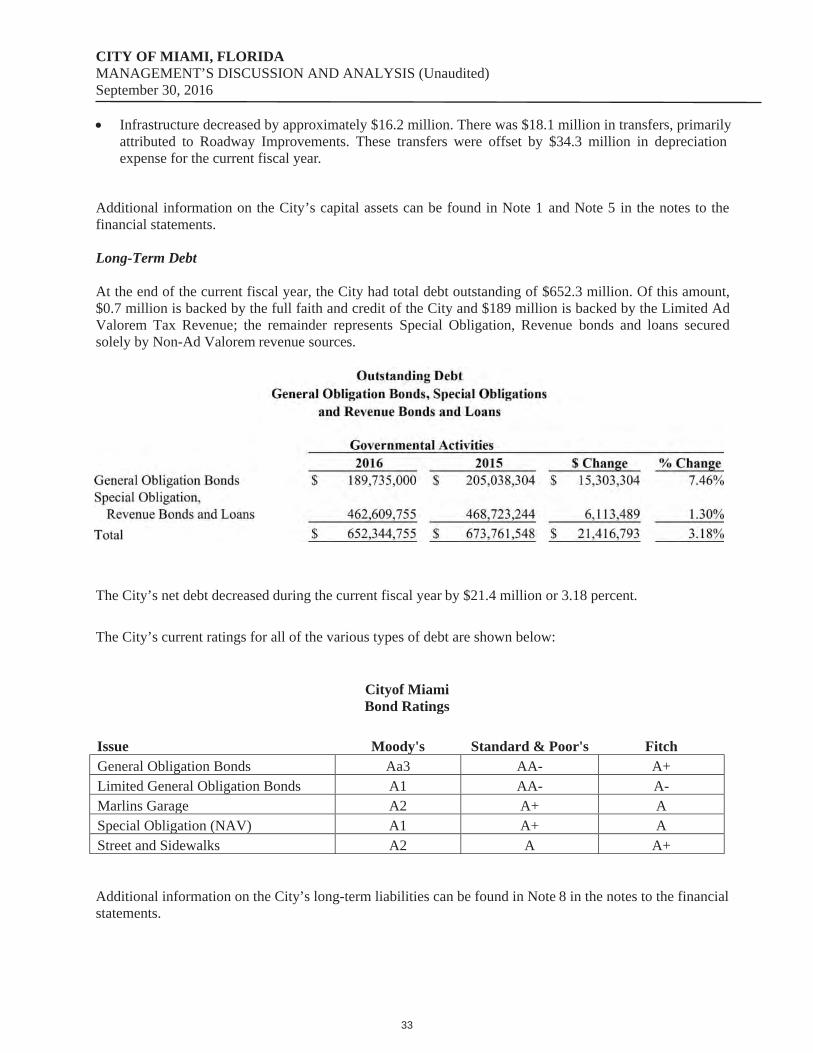
Long-Term Debt
At the end of the current fiscal year, the City had total debt outstanding of $652.3 million. Of this amount, $0.7 million is backed by the full faith and credit of the City and $189 million is backed by the Limited Ad Valorem Tax Revenue; the remainder represents Special Obligation, Revenue bonds and loans secured solely by Non-Ad Valorem revenue sources.
The City’s net debt decreased during the current fiscal year by $21.4 million or 3.18 percent.
The City’s current ratings for all of the various types of debt are shown below:
Cityof MiamiBond Ratings
Issue Moody's Standard & Poor's FitchGeneral Obligation Bonds Aa3 AA- A+Limited General Obligation Bonds A1 AA- A- Marlins Garage A2 A+ ASpecial Obligation (NAV) A1 A+ AStreet and Sidewalks A2 A A+
Additional information on the City’s long-term liabilities can be found in Note 8 in the notes to the financial statements.
33
CITY OF MIAMI, FLORIDAMANAGEMENT’S DISCUSSION AND ANALYSIS (Unaudited)September 30, 2016
Economic Factors and Next Year’s Budget and Rates
The budget is developed based on needs and performance, and follows the direction of policy as set by the elected officials. The process begins with the preparation of the financial outlook, a comprehensive review of allocation needs that are expected to be required by the City for its operations. These allocations include a review of salaries and wages (growth as dictated by negotiated union contracts) ; pension requirement needs, anticipated insurance premium increases, etc. These allocation needs are then compared to the City’s anticipated revenue inflows to determine whether these needs can be satisfied. It is with this analysis, along with the Mayor and City Commissioners’ feedback, and the City’s comprehensive strategic plan, that the guidelines for preparing the budget toolkit are determined and compiled into an all-inclusive instructional booklet that is then distributed to departments for their use in preparing their budget submissions. The City’s elected and appointed officials considered many factors when adopting the fiscal year 2016 budget. Included among these factors were uncertainties regarding pension costs, health insurance costs, other post employment benefit costs, and other various economic indicators.
The City of Miami, like many municipalities throughout the State, is slowly recovering from the economic downturn of the previous years. Recently approved State legislation along with a constitutional amendment passed by Florida voters, lowered the City’s taxable values while establishing controls on its millage rate (discussed below). This legislation and amendment was also a clear indication by the people of the State of Florida that not enough was done in the previous year to provide property owners with tax relief.
Between FY 2017 and FY 2021, General Fund revenues are forecasted to grow by a total of 11.2 percent. The largest components of General Fund revenues are Property Taxes (41.8 percent of FY 2016 General Fund revenues), Franchise Fees and Other Taxes (16.2 percent), Charges for Services (15 percent), Licenses and Permits (9.1 percent), and Intergovernmental Revenues (9.9 percent). Interest, Fines and Forfeitures, Other Revenues, and Transfers In comprise the remaining 8 percent.
In fiscal year 2017, while the total millage decreased, the operating millage remained flat at 7.6465 mills. The budgeted General Fund property tax revenue is approximately $303.61 million. The adopted millage rate is assumed to remain flat over the five-year period. Taxable property values are projected to increase by 9 percent in FY 2018, by 5 percent in FY 2019, by 5 percent in FY 2020, and by 5 percent in FY 2021. This assumption is based on the expectation that the recent increase in development activity in the City will continue over the next two years and will gradually level out by the end of the five-year period. While current tax revenue is projected to increase annually, delinquent tax revenue is projected to decline over the five-year period. The forecast assumes a 10 percent annual decline in delinquent tax revenue.
Requests for Information
This financial report is designed to provide a general overview of the City’s finances for all those with an interest in the government’s finances to demonstrate the City’s accountability. Questions concerning any of the information provided in this report or requests for additional financial information should be addressed to the City of Miami’s Finance Department – Director, 444 Southwest 2 nd Avenue, Suite 618, Miami, Florida 33130, or visit the City’s web site at www.miamigov.com.
34
35
The notes to the financial statements are an integral part of this statement
36
The notes to the financial statements are an integral part of this statement
37
The notes to the financial statements are an integral part of this statement
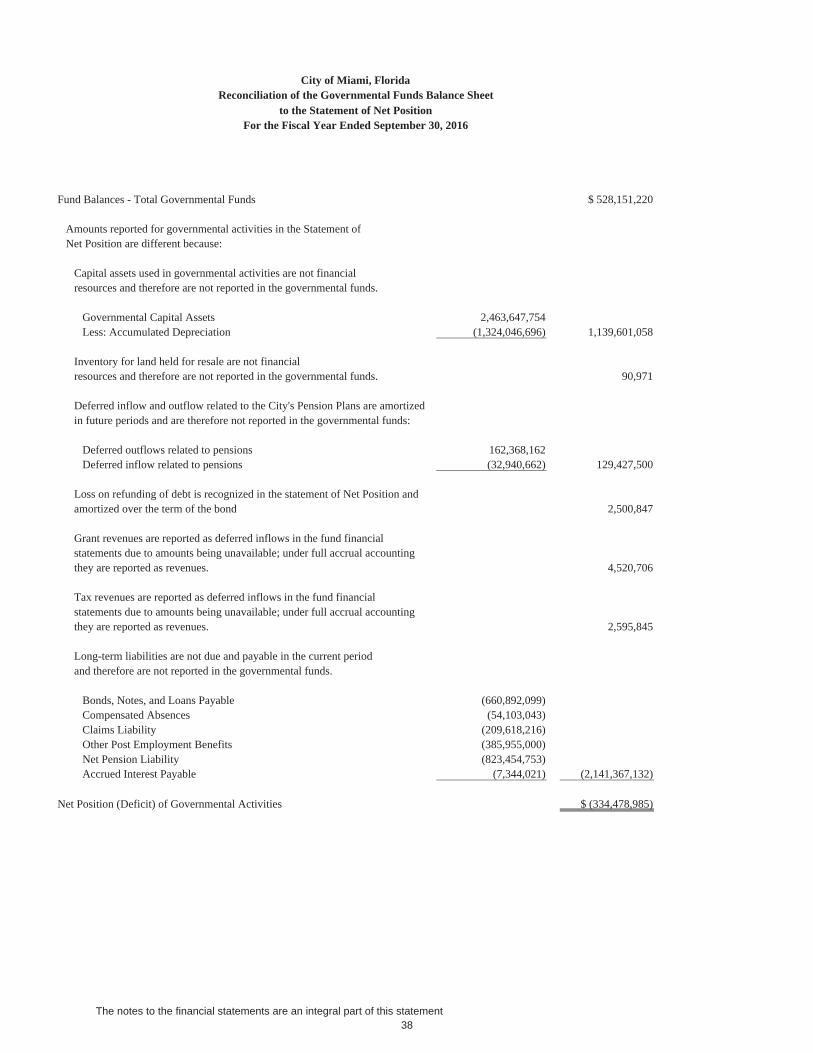
City of Miami, FloridaReconciliation of the Governmental Funds Balance Sheet
to the Statement of Net PositionFor the Fiscal Year Ended September 30, 2016
Fund Balances - Total Governmental Funds $ 528,151,220
Amounts reported for governmental activities in the Statement ofNet Position are different because:
Capital assets used in governmental activities are not financialresources and therefore are not reported in the governmental funds.
Governmental Capital Assets 2,463,647,754Less: Accumulated Depreciation (1,324,046,696) 1,139,601,058
Inventory for land held for resale are not financialresources and therefore are not reported in the governmental funds. 90,971
Deferred inflow and outflow related to the City's Pension Plans are amortizedin future periods and are therefore not reported in the governmental funds:
Deferred outflows related to pensions 162,368,162Deferred inflow related to pensions (32,940,662) 129,427,500
Loss on refunding of debt is recognized in the statement of Net Position and amortized over the term of the bond 2,500,847
Grant revenues are reported as deferred inflows in the fund financialstatements due to amounts being unavailable; under full accrual accountingthey are reported as revenues. 4,520,706
Tax revenues are reported as deferred inflows in the fund financialstatements due to amounts being unavailable; under full accrual accountingthey are reported as revenues. 2,595,845
Long-term liabilities are not due and payable in the current periodand therefore are not reported in the governmental funds.
Bonds, Notes, and Loans Payable (660,892,099)Compensated Absences (54,103,043)Claims Liability (209,618,216)Other Post Employment Benefits (385,955,000)Net Pension Liability (823,454,753)Accrued Interest Payable (7,344,021) (2,141,367,132)
Net Position (Deficit) of Governmental Activities $ (334,478,985)
38
The notes to the financial statements are an integral part of this statement
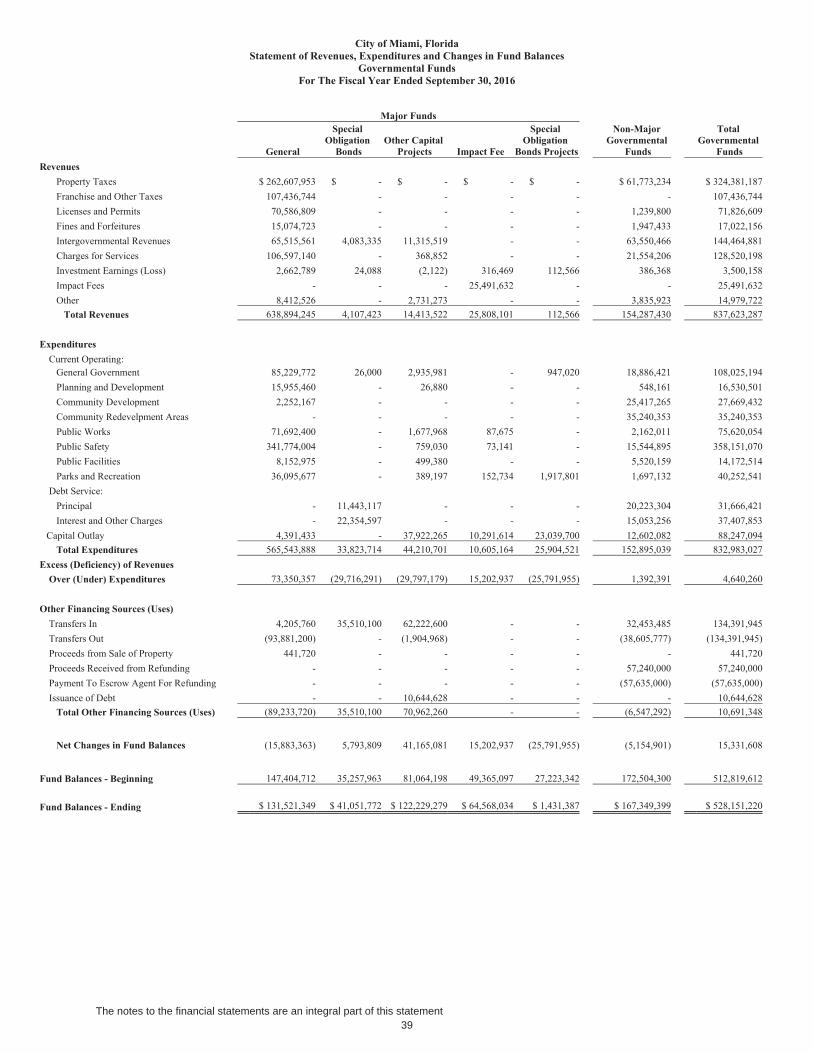
39
The notes to the financial statements are an integral part of this statement
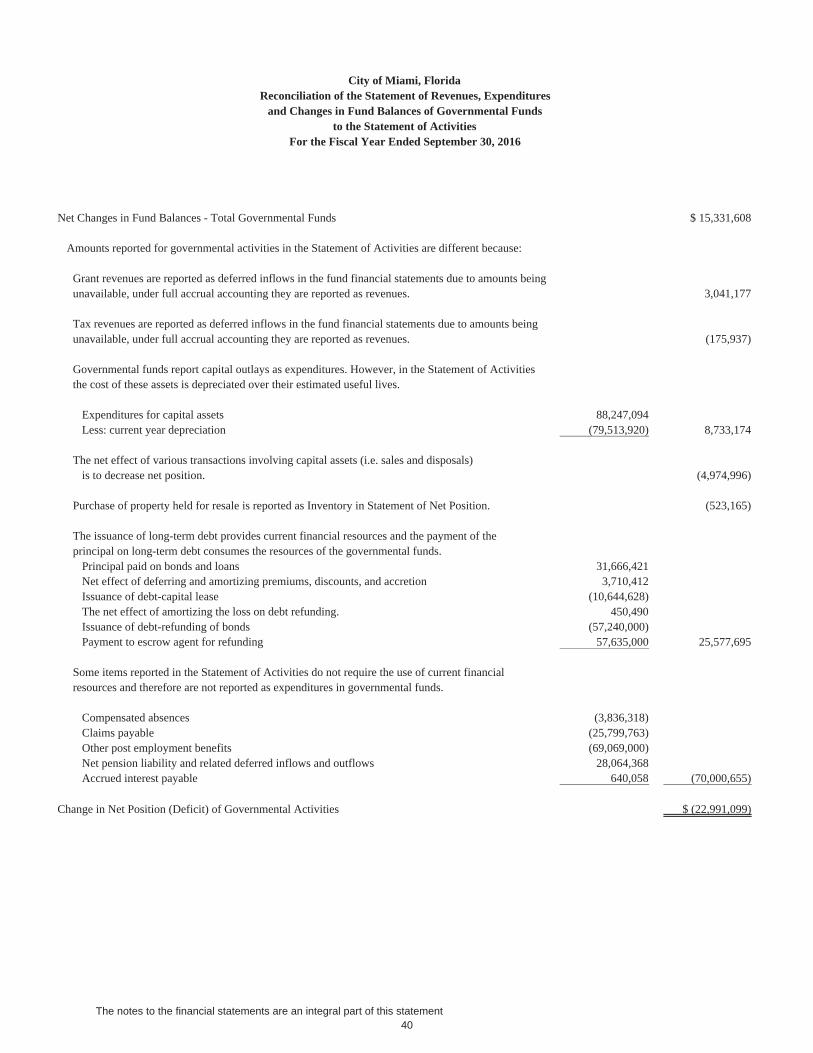
City of Miami, FloridaReconciliation of the Statement of Revenues, Expenditures
and Changes in Fund Balances of Governmental Fundsto the Statement of Activities
For the Fiscal Year Ended September 30, 2016
Net Changes in Fund Balances - Total Governmental Funds $ 15,331,608
Amounts reported for governmental activities in the Statement of Activities are different because:
Grant revenues are reported as deferred inflows in the fund financial statements due to amounts beingunavailable, under full accrual accounting they are reported as revenues. 3,041,177
Tax revenues are reported as deferred inflows in the fund financial statements due to amounts beingunavailable, under full accrual accounting they are reported as revenues. (175,937)
Governmental funds report capital outlays as expenditures. However, in the Statement of Activitiesthe cost of these assets is depreciated over their estimated useful lives.
Expenditures for capital assets 88,247,094Less: current year depreciation (79,513,920) 8,733,174
The net effect of various transactions involving capital assets (i.e. sales and disposals) is to decrease net position. (4,974,996)
Purchase of property held for resale is reported as Inventory in Statement of Net Position. (523,165)
The issuance of long-term debt provides current financial resources and the payment of theprincipal on long-term debt consumes the resources of the governmental funds.
Principal paid on bonds and loans 31,666,421Net effect of deferring and amortizing premiums, discounts, and accretion 3,710,412Issuance of debt-capital lease (10,644,628)The net effect of amortizing the loss on debt refunding. 450,490Issuance of debt-refunding of bonds (57,240,000)Payment to escrow agent for refunding 57,635,000 25,577,695
Some items reported in the Statement of Activities do not require the use of current financial resources and therefore are not reported as expenditures in governmental funds.
Compensated absences (3,836,318)Claims payable (25,799,763)Other post employment benefits (69,069,000)Net pension liability and related deferred inflows and outflows 28,064,368Accrued interest payable 640,058 (70,000,655)
Change in Net Position (Deficit) of Governmental Activities $ (22,991,099)
40
The notes to the financial statements are an integral part of this statement

41
The notes to the financial statements are an integral part of this statement

42
The notes to the financial statements are an integral part of this statement
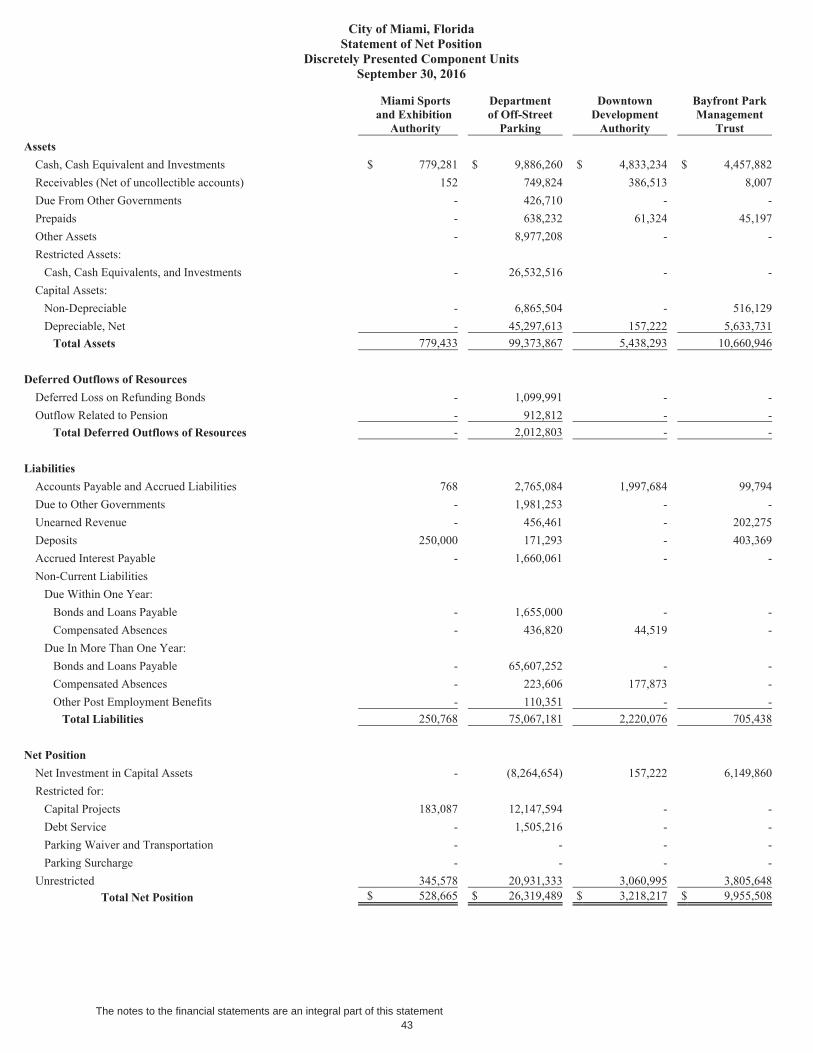
43
The notes to the financial statements are an integral part of this statement
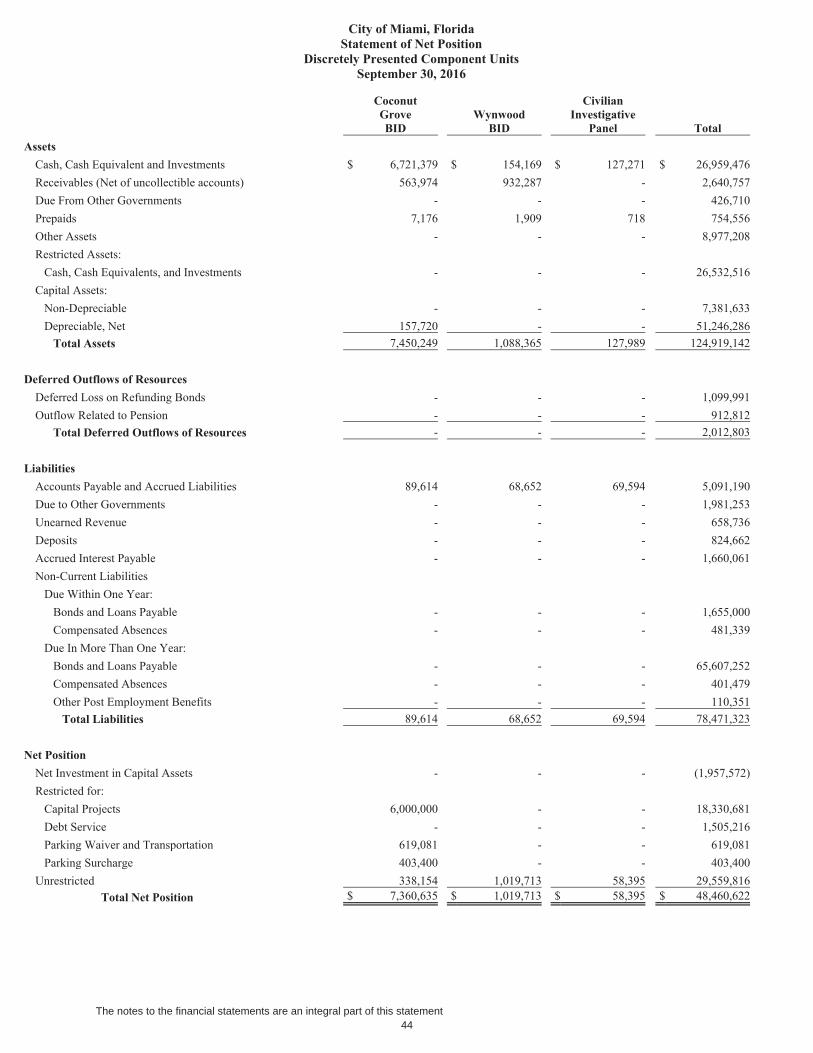
44
The notes to the financial statements are an integral part of this statement
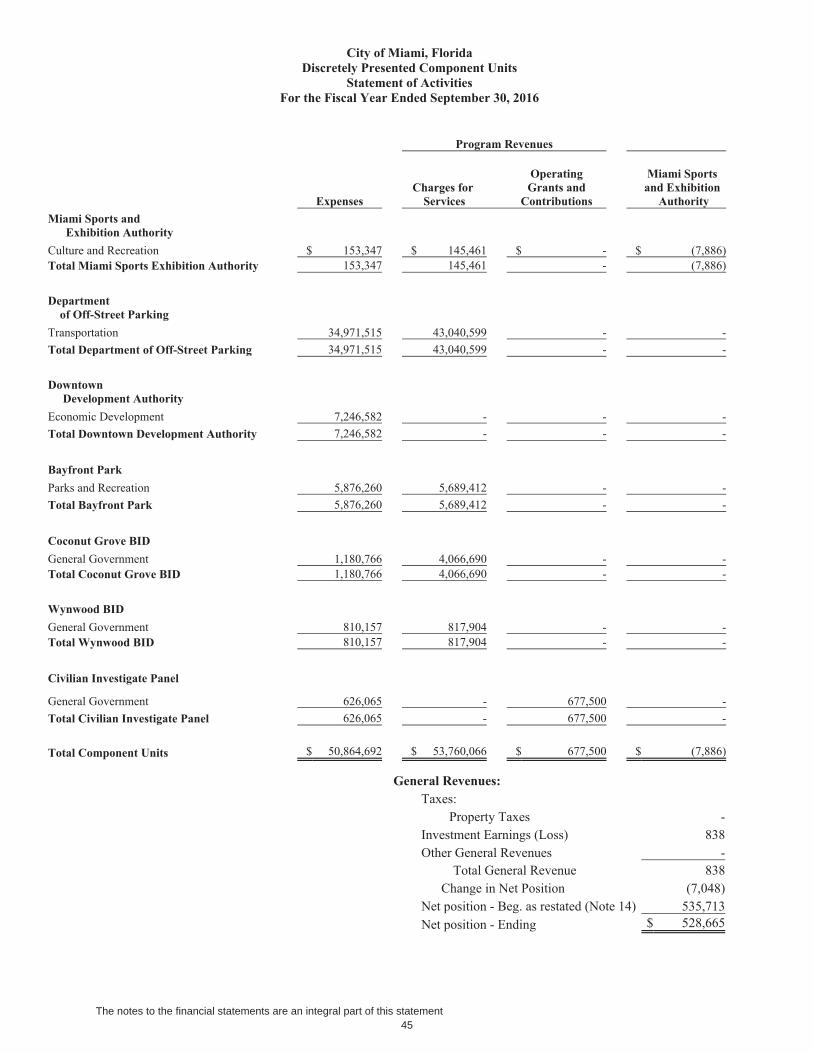
45
The notes to the financial statements are an integral part of this statement
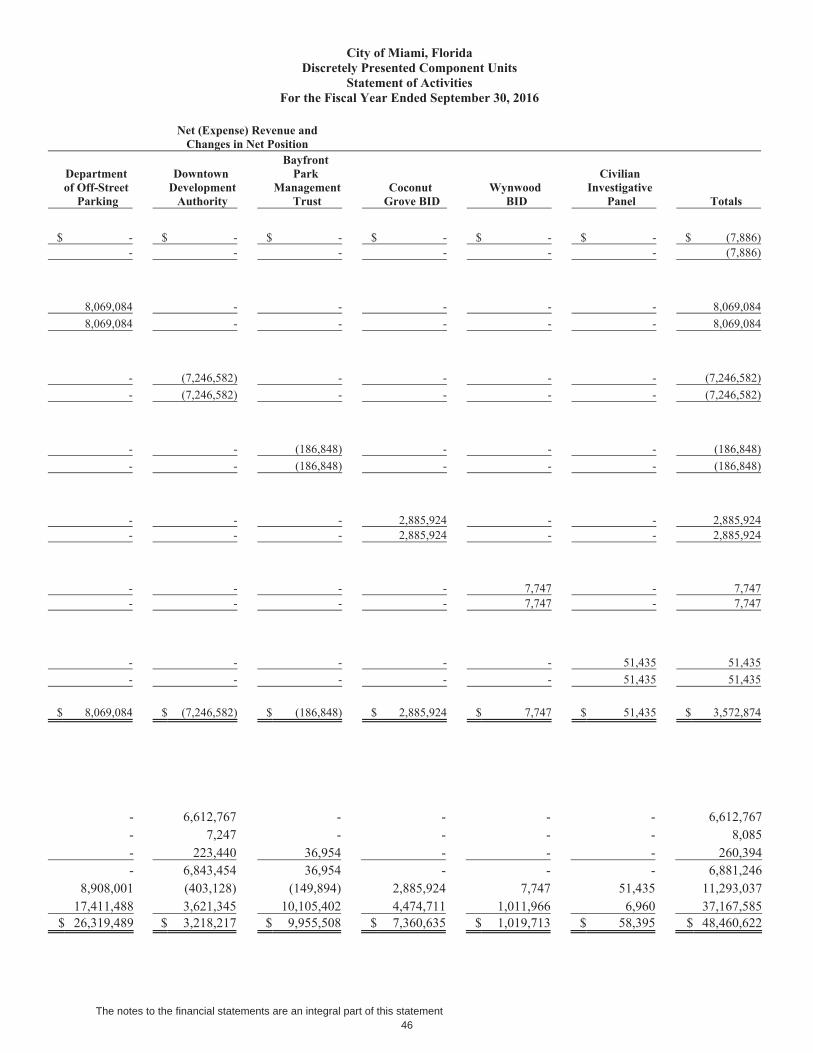
46
The notes to the financial statements are an integral part of this statement
CITY OF MIAMI, FLORIDANOTES TO FINANCIAL STATEMENTS
SEPTEMBER 30, 2016
NOTE 1. – SUMMARY OF SIGNIFICANT ACCOUNTING POLICIES
The accompanying financial statements of the City of Miami, Florida (the “City”) have been prepared in conformity with U.S. Generally Accepted Accounting Principles (GAAP). The Governmental Accounting Standards Board (“GASB”) is the standard-setting body for governmental accounting and financial reporting. The GASB periodically updates its codification of the existing Governmental Accounting and Financial Reporting Standards which, along with subsequent GASB pronouncements (Statements and Interpretations), constitutes GAAP for governmental units. The more significant of these accounting policies are described below.
A. Reporting Entity
The City, which is located in the county of Miami-Dade, was incorporated in 1896, and has a population of 456,089. The City is situated at the mouth of the Miami River on the western shores of Biscayne Bay and is a main port of entry into Florida and is the county seat of Miami-Dade County, Florida. The City comprises 35.87 square miles of land and 19.42 square miles of water.
The City’s Charter was adopted by the electors of the City of Miami at an election held on May 17, 1921 and was legalized and validated by Chapter 9024 of the laws of the State of Florida of 1921. During fiscal year 1997, the residents of the City voted on a referendum that created single-member districts and an Executive Mayor form of government. The City continues to operate under the Commission/City Manager form of government and provides the following services: police and fire protection, public works activities, solid waste collection, parks and recreational facilities, planning and development, community development, financial services, and general administrative services.
The Florida Legislature, in 1955, approved and submitted to a general election, a constitutional amendment designed to give a new form of government to Miami-Dade County, Florida (the “County”). The County is, in effect, a municipality with governmental powers affecting thirty five cities and unincorporated areas, including the City. The County has not displaced nor replaced the City’s powers, but supplements them. The County can take over particular activities of the City's operations if (1) the services fall below minimum standards set by the County Commission or (2) with the consent of the governing body of the City. Accordingly, the County’s financial statements are not included in this report.
The accompanying financial statements include those of the City (the primary government) and those of its component units. Component units are legally separate organizations for which the primary government is financially accountable or organizations which should be included in the City’s financial statements because of the nature and significance of their relationship with the primary government.
GASB Codification of Governmental Accounting and Financial Reporting Standards Section 2100 provides guidance for the inclusion of a legally separate entity as a component unit of an entity. The application of this guidance provides for identification of any entities for which the City is financially accountable or organizations that the nature and significance of their relationship with the City are such that exclusions would cause the City’s basic financial statements to be misleading or incomplete.
47

CITY OF MIAMI, FLORIDANOTES TO FINANCIAL STATEMENTSSeptember 30, 2016
Based upon the application of GASB Codification Section 2100, the financial statements of the component units listed on the following pages have been included in the City’s reporting entity as either blended or discretely presented component units.
Blended component units, although legally separate entities, are in substance part of the City's operations. Accordingly, data from these component units are included with data of the primary government. Each discretely presented component unit, on the other hand, is reported in a separate column in the financial statements to emphasize that they are legally separate from the City. The financial balances and activities for each blended and discretely presented component unit are as of and for the year ended September 30, 2016.
Blended Component Units
SOUTHEAST OVERTOWN PARK WEST COMMUNITY REDEVELOPMENT AGENCY (“SEOPW CRA”) – SEOPW CRA is an Agency established by the City in 1983 under the authority of Section 163.330, Florida Statutes and City Resolution No. 82-755. The purpose of the Agency is to eliminate blight and slum conditions within the redevelopment area of the agency pursuant to the redevelopment plans of the Agency for new residential and commercial activity of the Southeast Overtown Park West area. The City has entered into an interlocal agreement with Miami-Dade County approving the deposit of tax increments into the separate SEOPW CRA accounts. The members of the City Commission are also the Board of Directors of the SEOPW CRA. Additionally, under the interlocal agreement the City handles the disbursement, accountability, management, and proper application of all monies in the SEOPW accounts. The funds of the SEOPW CRA are included within the reporting entity as a special revenue fund (SEOPW CRA), a debt service fund (SEOPW CRA - Other Special Obligation Bonds), and a capital projects fund (SEOPW Community Redevelopment Agency).
OMNI COMMUNITY REDEVELOPMENT AGENCY (“OMNI CRA”) – OMNI CRA is an Agency established by the City in 1986 under the authority of Section 163.330, Florida Statutes and City Resolution No. 86-868. The purpose of the Agency is to eliminate blight and slum conditions within the redevelopment area of the agency pursuant to the redevelopment plans of the Agency for new residential and commercial activity of the Omni area. The City has entered into an interlocal agreement with Miami-Dade County approving the deposit of tax increments into the separate OMNI CRA accounts. The members of the City Commission are the Board of Directors of the OMNI CRA. Additionally, under the interlocal agreement the City handles the disbursement, accountability, management, and proper application of all monies in the OMNI CRA accounts. The OMNI CRA is included within the reporting entity as a special revenue fund (OMNI CRA).
MIDTOWN COMMUNITY REDEVELOPMENT AGENCY (“MIDTOWN CRA”) – MIDTOWN CRA is an Agency established by the City in 2005 under the provisions of Section 163.330, Florida Statutes and City Resolution No. 05-002. The purpose of the Agency is to eliminate blight and slum conditions within the redevelopment area of the agency pursuant to the redevelopment plans of the Agency for new residential and commercial activity of the Midtown area. The MIDTOWN CRA entered into an interlocal agreement with the City, Miami-Dade County, and the Midtown Community Development District whereby tax increments would be deposited into the separate MIDTOWN CRA accounts. The members of the City Commission are the Board of Directors of the MIDTOWN CRA. Additionally, under the interlocal agreement the City handles the disbursement, accountability, management, and proper application of all monies in the MIDTOWN CRA accounts. The MIDTOWN CRA is included within the reporting entity as a special revenue fund (MIDTOWN CRA).
48
CITY OF MIAMI, FLORIDANOTES TO FINANCIAL STATEMENTSSeptember 30, 2016
VIRGINIA KEY BEACH PARK TRUST (“VKBPT”) – On December 14, 2000 (and effective January 2001), via sections 38-230 through 38-242 of Chapter 38 of the Code of the City of Miami Ordinance 12003, the VKBPT was established and acts as a limited agency and instrumentality of the City of Miami. Its general purposes, in cooperation with City of Miami, are to preserve, restore, and maintain the Historic Virginia Key Beach Park in a manner consistent with environmental health, the historical importance of the Park and the aspirations of the African American Community, make it accessible to the general public, propose policy, planning, and design to ensure maximum community utilization and enjoyment. The City Commission must approve VKBPT’s board membership and operating budget. The City considers itself the exclusive recipient of the services provided by VKBPT and therefore its operations are blended in the reporting entity as a special revenue fund (Virginia Key Beach Park Trust).
LIBERTY CITY COMMUNITY REVITALIZATION TRUST (“Liberty City”) – On July 10, 2001, via section 2-892 of Chapter 2 of the Code of the City of Miami Ordinance 12082, Liberty City was established and acts as a limited agency and instrumentality of the City and provides services entirely or almost entirely to the primary government. Liberty City, in cooperation with the Department of Community Development and other City departments, is responsible for oversight of and facilitating the City’s revitalization efforts for the redevelopment of the Liberty City Community Revitalization District in a manner consistent with the strategy identified in the Five-Year Consolidated Plan, adopted by the City Commission in August, 1999. Liberty City’s specific purpose is to purchase land and renovate capital assets that belong to the City of Miami within the Liberty City area. The City Commission must approve Liberty City’s board membership and operating budget. The City considers itself the exclusive recipient of the services provided by Liberty City and therefore its operations are blended in the reporting entity as a special revenue fund (Liberty City Revitalization Trust).
Discretely Presented Component Units
MIAMI SPORTS AND EXHIBITION AUTHORITY (“MSEA”) – The MSEA was created by the City in 1983 pursuant to Chapter 212.0305, Florida Statutes and City Ordinance No. 9662 adopted by the City Commission (as amended by City Ordinance No. 11155) and Section 213.0305 of the Florida Statutes to promote the development of sports, convention and exhibition facilities within the City, and attracting professional sports franchises and exhibitions to utilize the City’s and/or Authorities’ facilities. The City Commission must approve MSEA’s board membership and operating budget. Therefore, the MSEA is fiscally dependent and the City is discretely presenting the MSEA in the accompanying financial statements.
DEPARTMENT OF OFF-STREET PARKING OF THE CITY OF MIAMI, FLORIDA, d/b/a MIAMI PARKING AUTHORITY (“DOSP”) – The DOSP was originally created in 1955 by a special act of the Florida State Legislature (Laws of Florida Chapter 30.997, as amended) and subsequently incorporated into the City's Charter in 1968. The DOSP is an agency and instrumentality of the City which owns and operates parking facilities within the City. The City Commission has reserved the right to confirm new members of the DOSP Board, to establish and fix rates and charges for parking services, to approve the DOSP’s operating budget and to authorize the issuance of revenue bonds. Therefore, the DOSP is fiscally dependent and the City is discretely presenting the DOSP in the accompanying financial statements.
49
CITY OF MIAMI, FLORIDANOTES TO FINANCIAL STATEMENTSSeptember 30, 2016
DOWNTOWN DEVELOPMENT AUTHORITY (“DDA”) – The DDA was created by the City in 1965 pursuant to Chapter 65-1090 of the General Laws of Florida and City Code Section 14-25. The DDA is governed by a board appointed by the City Commission and was established for the purpose of furthering the development of the Downtown Miami area by promoting economic growth in the region and strengthening downtown’s appeal as a livable city as well as a regional, national and international center for commerce and culture. The City Commission must approve the DDA's operating budget and the millage levied on the special taxing district established to fund the DDA. Therefore, the DDA is fiscally dependent and the City is discretely presenting the DDA in the accompanying financial statements.
BAYFRONT PARK MANAGEMENT TRUST (“BFP”) – The BFP was established by the City in 1987 under the authority of City of Miami Resolution No. 10348. The BFP was created for the purpose of managing and operating the events held at Bayfront and Bicentennial Park and the daily maintenance and upkeep of the grounds, its various amenities including the amphitheater and the Mildred and Claude Pepper Fountain. The governing body of the BFP consists of nine appointed members serving initial terms of one to three years. Upon expiration of an initial term, each successor member may be appointed by the City Commission for terms of one to three years. The BFP has appointed an executive director to act as the chief executive officer, subject to policy directives. The BFP prepares and submits an annual budget request and master plan to the City Commission for its approval for each fiscal year. Therefore, the BFP is fiscally dependent and the City is discretely presenting the BFP in the accompanying financial statements.
CIVILIAN INVESTIGATIVE PANEL (“CIP”) – The CIP was established by the City of Miami Commission Ordinance Number 12188 on February 14, 2002 for the purpose of creating an independent citizen’s oversight panel to conduct investigations related to allegations of police misconduct, review policies, practices and procedures of the police department and perform community outreach programs. The CIP consists of thirteen members who were originally appointed as follows: a) the Miami City Commission selects and appoints nine members, b) the Mayor selects three members whose names are ratified and appointed by the City Commission, and c) the Chief of Police of the City of Miami appoints one member, who serves at the will of the Chief of Police. The CIP prepares and submits an annual budget request to the City Commission for its approval for each fiscal year and is funded by the City of Miami. Therefore, the CIP is fiscally dependent and the City is discretely presenting the CIP in the accompanying financial statements.
COCONUT GROVE BUSINESS IMPROVEMENT DISTRICT (“CGBID”) – In July 2004, pursuant to Resolution No. 12564, the City of Miami approved the establishment of the Coconut Grove Business Improvement Committee (“BIC”). The BIC was formed as an advisory committee to the City. During November 2008, the City tabulated the results of a special election for the creation of the Coconut Grove Business Improvement District (“BID”), where the BID was deemed to be approved by a majority of the affected property owners. During March 2009, under City Ordinance No. 13059, the City approved to repeal the BIC and establish a new Coconut Grove Business Improvement District Board (“BID Board”) to stabilize and improve retail and other businesses in the BID area through promotion, management, marketing and other similar services, including, but not limited to, coordination, funding , implementation and maintenance of all infrastructure improvement, and other projects, utilizing BID assessment proceeds and other funds identified. The BID prepares and submits an annual budget request and master plan to the City Commission for its approval for each fiscal year. Therefore, the BID is fiscally dependent and the City is discretely presenting the BID in the accompanying financial statements.
50

CITY OF MIAMI, FLORIDANOTES TO FINANCIAL STATEMENTSSeptember 30, 2016
WYNWOOD BUSINESS IMPROVEMENT DISTRICT (“WBID”) – On June 4, 2013, the City through its Office of the City Clerk tabulated the results of a special election for the creation of the Wynwood Business Improvement District (“BID”), where the BID was deemed to be approved by a majority of the affected property owners. During July 2013, under City Ordinance No. 13-00831, the City approved to establish a new Wynwood Business Improvement District Board (“BID Board”) to manage the BID in stabilizing and improving retail and other businesses in the BID area through promotion, management, marketing and other similar services, including, but not limited to, coordination, funding, implementation and maintenance of all infrastructure improvement, and other projects, utilizing BID assessment proceeds and other funds identified. The BID prepares and submits an annual budget request to the City Commission for its approval for each fiscal year. Therefore, the BID is fiscally dependent and the City is discretely presenting the BID in the accompanying financial statements.
HEALTH FACILITY AUTHORITY (“HFA”) – The HFA is an agency established by the City in 1979 under the authority of Chapter 154, Florida Statutes and City Resolution No. 79-93 to serve as a conduit to issue revenue bonds. The City Commission must approve the HFA’s board membership and operating budget. Therefore the HFA is fiscally dependent and the City is discretely presenting the HFA in the accompanying financial statements.
Debt obligations issued under the purview of the HFA do not constitute an indebtedness, liability or pledge of the faith or credit of the HFA or the City. The City is not responsible for any of the HFA’s debt. The amount of conduit debt obligations totaled $17 million at September 30, 2016. The HFA does not issue stand-alone audited financial statements.
The City of Miami Health Facilities Authority conduit debt activity and outstanding balance as of September 30, 2016 is as follows:
The scheduled debt service payments were made by Miami Jewish Home and the payments are current.
Proceeds from these bond issues were used to finance construction of buildings and parking facilities; land acquisitions; equipment purchases including beds and other medical apparatus; renovation of existing facilities; and engineering costs.
51

CITY OF MIAMI, FLORIDANOTES TO FINANCIAL STATEMENTSSeptember 30, 2016
Complete financial information of the individual component units may be obtained at the entity's respective administrative offices as follows:
SEOPW CRA819 NW 2nd Ave.3rd FloorMiami, Florida 33136
Dept. Off Street Parking40 NW 3rd Street Suite 1103Miami, Florida 33128
Coconut Grove BID3390 Mary StreetSuite 130Miami, Florida 33133
OMNI/MIDTOWN CRA1401 North Miami Ave.2nd FloorMiami, Florida 33136
Downtown Develop. Authority200 S. Biscayne Blvd.Suite 2929Miami, Florida 33131
Wynwood BID310 NW 26th Street Suite 1Miami, Florida 33127
Virginia Key Beach Park Trust4020 Virginia Beach DriveMiami, Florida 33149
Civilian Investigative Panel970 SW 1st StreetSuite 305Miami, Florida 33130
Liberty City Community Revitalization Trust4800 NW 12th AvenueMiami, Florida 33127-2218
Miami Sports & Exhibition Authority3500 Pan American DriveMiami, Florida 33133
Bayfront Park Mgmt. Trust301 N. Biscayne Blvd.Miami, Florida 33132-2226
B. Government-Wide Financial Statements
The government-wide financial statements (i.e., the statement of net position and the statement of activities) report information on all of the non-fiduciary activities of the City and its component units. The primary government is reported separately from the legally separate discrete component units. The statement of net position presents the financial position of the City and its discretely presented component units at the end of its fiscal year. The statement of activities demonstrates the degree to which the direct expenses of a given function or segment are offset by program revenues. Direct expenses are those that are clearly identifiable with a specific function or segment and indirect expenses (claims payable, compensated absences, pension benefits, and other post-employment benefits) are allocated to activities based on each activities pro-rata share of the cost incurred. Program revenues include 1) charges to customers or applicants who purchase, use, or directly benefit from goods, services, or privileges provided by a given function or segment, and 2) grants and contributions that are restricted to meeting the operational or capital requirements of a particular function or segment. Taxes and other items that are not deemed to be program revenues are reported instead as general revenues.
C. Fund Financial Statements
The accounts of the City are organized and operated on the basis of funds. A fund is an independent fiscal and accounting entity with a self-balancing set of accounts which comprise its assets, liabilities, deferred outflows/inflows of resources, fund balances/net position, revenues, and expenditures. Fund accounting segregates funds according to their intended purpose and it is used to aid management in demonstrating compliance with finance-related legal and contractual provisions. The City maintains the minimum number of funds consistent with legal and managerial requirements. The focus of governmental fund financial statements is on major funds as that term is defined in professional
52

CITY OF MIAMI, FLORIDANOTES TO FINANCIAL STATEMENTSSeptember 30, 2016
pronouncements. Each major fund is to be presented in a separate column, and non-major funds are aggregated and presented in a single column. The City maintains fiduciary funds which are used to account for assets held by the City in a trustee capacity. Since the governmental fund statements are presented on a different measurement focus and basis of accounting than the government-wide statements’ governmental activities column, a reconciliation is presented which briefly explains the adjustments necessary to transform the fund-level financial statements into the governmental activities column of the government-wide presentation. The City reports the following major governmental funds:
General Fund – The General Fund is the general operating fund of the City. General tax revenues and other receipts that are not allocated by law or contractual agreement to some other fund are accounted for in this fund. General operating expenditures, fixed charges, and capital improvement costs not paid through other funds are paid from this fund.
Special Obligation Bonds – This debt service fund accounts for monies used for the payment of principal, interest, and other costs related to various special obligation and revenue bonds and loans. This fund did not meet the minimum criteria for major fund determination during fiscal year 2016. However, it will be presented as a major fund for public interest purposes.
Impact Fee – This capital fund is used to account for the collection of impact fees and the cost of capital improvement projects for the type of improvement for which the impact fee was imposed. This fund did not meet the minimum criteria for major fund determination during fiscal year 2016. However, it will be presented as a major fund for public interest purposes.
Other Capital Projects – This capital fund is used to account for and report on funds received from various resources (primarily from current revenues, Federal and State Grants) designated for construction projects.
Special Obligation Bond Projects – This capital fund is used to account for the receipt and disbursement of bond proceeds from special obligation debt and loan agreements to be used for constructions and/or acquisition activities for the City.
Additionally, the City reports the following fiduciary fund type:
Pension Trust Funds – The Pension Trust Funds account for the City of Miami Fire Fighters’ and Police Officers’ Retirement Trust (“FIPO”), the City of Miami General Employees’ and Sanitation Employees’ Retirement Trust (“GESE”) and Other Managed Trusts (Members, Excess Plan, Staff Plan, and Staff Excess Plan), and the Elected Officers’ Retirement Trust (“EORT”). The Pension Trust Funds accumulate resources for pension benefit payments to qualified employees.
D. Measurement Focus and the Financial Statement Presentation
The government-wide and fiduciary fund financial statements are reported using the economic resources measurement focus and the accrual basis of accounting. Revenues are recorded when earned and expenses are recorded when a liability is incurred, regardless of the timing of related cash flows. Property taxes are recognized as revenues in the year for which they are levied. Grants and similar items are recognized as revenue as soon as all eligibility requirements imposed by the provider have been met. As a general rule, the effect of inter-fund activity has been eliminated from the government-wide financial statements. Amounts reported as program revenues include 1) charges to customers or applicants for goods, services, or privileges provided, 2) operating grants and contributions, and 3)
53
CITY OF MIAMI, FLORIDANOTES TO FINANCIAL STATEMENTSSeptember 30, 2016
capital grants and contributions, including special assessments. Internally dedicated resources are reported as general revenues rather than program revenues. Likewise, general revenues include all taxes.
The governmental fund financial statements are reported using the current financial resources measurement focus and the modified accrual basis of accounting. Revenues are recognized as soon as they are both measurable and available. Revenues are considered to be available when they are collectible within the current period or soon enough thereafter to pay liabilities of the current period. For this purpose, the City considers revenues to be available if they are collected within 60 days of the end of the fiscal period, except for grant revenues which are considered to be available if collected within one year.
Expenditures generally are recorded when a liability is incurred, as under accrual accounting. However, debt service expenditures, as well as expenditures related to compensated absences, insurable claims, pollution remediation obligations, pension benefits and other post-employment benefits are recorded only when payment is due or when City has made a decision to fund these obligations with current available resources.
Certain revenues associated with the current fiscal period are considered measurable and are recognized as revenues of the current fiscal period when available. These include:
Property taxesIntergovernmental revenueSales tax, franchise and utility taxesCharges for services, and Interest
All other revenue items are considered to be measurable only when cash is received by the City.
E. Assets, Liabilities, Deferred Outflows/Inflows of Resources, and Net Position/Fund Balance
Deposits and Investments
The City has defined “cash, cash equivalents and investments” to include cash on hand, demand deposits, money market funds, debt securities, and cash with fiscal agents. Each fund’s equity in the City’s investment pool is considered to be a cash equivalent since funds can be deposited or effectively withdrawn at any time without prior notice or penalty. In addition, the City considers all highly liquid investments with a maturity of three months or less when purchased, to be a cash equivalent.
All investments, including those of the Pension Trust Funds, are recorded at fair value, which is the price that would be received to sell an asset or paid to transfer a liability in an orderly transaction between market participants at the measurement date. The City and the Pension Trust Funds categorizes its fair value measurements within the fair value hierarchy established by GASB 72. The hierarchy is based on the valuation inputs to measure the fair value of the asset. Level 1 inputs are quoted prices in active markets for identical assets; Level 2 inputs are significant other observable inputs; Level 3 inputs are significant unobservable inputs. In addition, certain investments of the Pension Trust Funds are measured at the net asset value (“NAV”) per share (or its equivalent). See Note 2 for more detail regarding methods used to measure the fair value of investments.
54
CITY OF MIAMI, FLORIDANOTES TO FINANCIAL STATEMENTSSeptember 30, 2016
Interfund Receivables and Payables
Activity between funds that is representative of lending/borrowing arrangements outstanding at the end of the fiscal year is referred to as “due to/from other funds”.
Receivables
Receivables include amounts due from other governments and others for services provided by the City and are recorded when the related revenue is earned. Allowances for uncollectible receivables are based upon historical trends and the periodic aging of receivables. The City fully reserves for all receivables greater than 60 days with the exception of grant receivables and other accounts that are in the collection process, which are based on historical collection experience and other factors.
Prepaids
Prepaid items of both government-wide and governmental fund statements are recorded under the consumption method. Prepaid expenses consist of certain costs which have been paid prior to the end of the fiscal year, but represent items which are applicable to future accounting periods. Reported amounts in governmental funds are equally offset by non-spendable fund balance in the fund financial statements, which indicates that these amounts do not constitute “available spendable resources” even though they are a component of current assets.
Long term service agreements, other than insurance policies, are expensed in the year of renewal. The City uses the “Alternate Expense Recognition” method for long term service agreements covering one or more fiscal period.
Inventory and Assets Held for Resale
There are no inventory values presented in the governmental funds. Purchases considered inventoriable items are recorded as expenditures/expenses at the time of purchase since the year-end balances are not material. The government-wide financial statements present inventory values of the City, which are properties held by the Community Development Department for resale. Such balances are recorded at lower of cost or net realizable value.
Restricted Assets
Certain proceeds from bonds, loans and deposits are classified as restricted assets because their use is limited by applicable bond indentures, contracts, agreements, and other externally imposed constraints.
Capital Assets
Capital assets, which include property, plant, equipment, and infrastructure (e.g. roads, sidewalks, drainage, and similar items), are reported in the governmental activities column in the government-wide financial statements and fiduciary fund and discrete component unit financial statements. Capital assets are defined by the City as assets with an initial cost of $1,000 or more and an estimated useful life in excess of one year. Such assets are recorded at historical cost if purchased or constructed. Donated capital assets are recorded at acquisition value on the date of the donation.
55
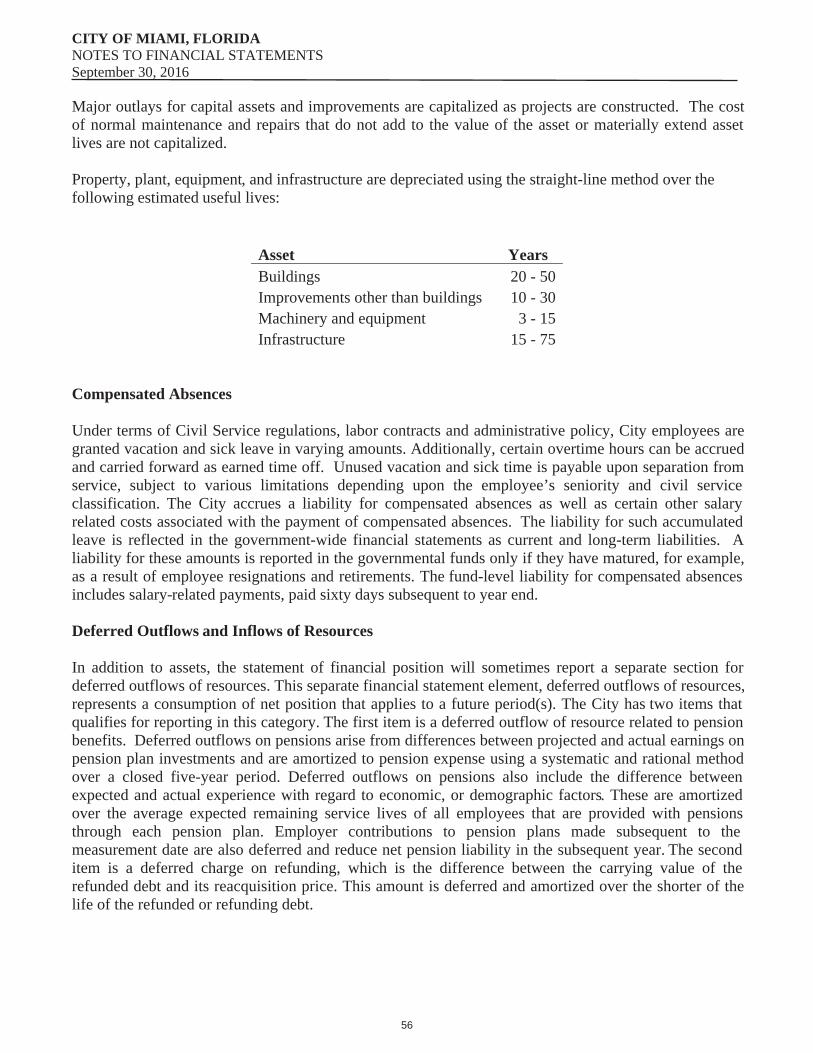
CITY OF MIAMI, FLORIDANOTES TO FINANCIAL STATEMENTSSeptember 30, 2016
Major outlays for capital assets and improvements are capitalized as projects are constructed. The cost of normal maintenance and repairs that do not add to the value of the asset or materially extend asset lives are not capitalized.
Property, plant, equipment, and infrastructure are depreciated using the straight-line method over the following estimated useful lives:
Asset YearsBuildings 20 - 50Improvements other than buildings 10 - 30Machinery and equipment 3 - 15Infrastructure 15 - 75
Compensated Absences
Under terms of Civil Service regulations, labor contracts and administrative policy, City employees are granted vacation and sick leave in varying amounts. Additionally, certain overtime hours can be accrued and carried forward as earned time off. Unused vacation and sick time is payable upon separation from service, subject to various limitations depending upon the employee’s seniority and civil service classification. The City accrues a liability for compensated absences as well as certain other salary related costs associated with the payment of compensated absences. The liability for such accumulated leave is reflected in the government-wide financial statements as current and long-term liabilities. A liability for these amounts is reported in the governmental funds only if they have matured, for example, as a result of employee resignations and retirements. The fund-level liability for compensated absences includes salary-related payments, paid sixty days subsequent to year end.
Deferred Outflows and Inflows of Resources
In addition to assets, the statement of financial position will sometimes report a separate section for deferred outflows of resources. This separate financial statement element, deferred outflows of resources, represents a consumption of net position that applies to a future period(s). The City has two items that qualifies for reporting in this category. The first item is a deferred outflow of resource related to pension benefits. Deferred outflows on pensions arise from differences between projected and actual earnings on pension plan investments and are amortized to pension expense using a systematic and rational method over a closed five-year period. Deferred outflows on pensions also include the difference between expected and actual experience with regard to economic, or demographic factors. These are amortized over the average expected remaining service lives of all employees that are provided with pensions through each pension plan. Employer contributions to pension plans made subsequent to the measurement date are also deferred and reduce net pension liability in the subsequent year. The second item is a deferred charge on refunding, which is the difference between the carrying value of the refunded debt and its reacquisition price. This amount is deferred and amortized over the shorter of the life of the refunded or refunding debt.
56
CITY OF MIAMI, FLORIDANOTES TO FINANCIAL STATEMENTSSeptember 30, 2016
In addition to liabilities, the statement of financial position will sometimes report a separate section for deferred inflows of resources. This separate financial statement element, deferred inflows of resources, represents an acquisition of net position that applies to a future period(s) and so will not be recognized as an inflow of resources (revenue) until that time.
Amounts related to governmental fund receivables that are measureable, but not available (not received within 60 days from fiscal year end), are recorded as unavailable (a deferred inflow of resources) in the governmental fund financial statements. In addition, amounts received in advance, for which time requirements are not met for revenue recognition are reported as a deferred inflow at both the fund level and the government-wide level.
Deferred inflows on pensions are recorded when investment return on pension plan assets exceeds actuarial assumptions and are amortized using a systematic and rational method over a closed five-year period. Deferred inflows on pensions also include the difference between expected and actual experience with regard to economic, or demographic factors; changes of assumptions about future economic, demographic, or other factors. These are amortized over the average expected remaining service lives of all employees that are provided with pensions through each pension plan.
Employee Benefit Plans and Net Pension Obligation - The City provides separate defined benefit pension plans for general employees, sanitation employees and for uniformed police and fire department personnel, as well as a defined contribution pension plan created in accordance with Internal Revenue Code Section 401(a) primarily for directors and other unclassified administrator employees. The City also offers an optional deferred compensation plan created in accordance with Internal Revenue Code Section 457.
For the purposes of measuring the net pension liability, deferred outflows of resources and deferred inflows of resources related to pensions, and pension expense, information about the fiduciary net position of the City’s defined benefit pension plans and additions to/deductions from the plans’ fiduciary net position have been determined on the same basis as they are reported by the plans. For this purpose, benefit payments (including refunds of employee contributions) are recognized when due and payable in accordance with the benefit terms.
Post-Employment Benefits Other Than Pensions (OPEB) - Pursuant to Section 112.0801, Florida Statutes, the City is required to permit participation in the health insurance program by retirees and their eligible dependents at a cost to the retiree that is no greater than the cost at which coverage is available for active employees. Retired police officers are offered coverage at a discounted premium under the FOP Health Trust that is administered separately from the City’s health care plan. For non-police retirees (fire fighters, general employees, sanitation employees and elected officials) and their dependents, the City subsidizes health care coverage and life insurance at a premium equal to the blended group rate.
The City is financing the post employee benefits on a pay-as-you go basis. As determined by an actuarial valuation, the City recorded a net OPEB obligation in its government-wide financial statements related to the implicit subsidy. The OPEB obligation represents the cumulative difference between the actuarial required contribution and amounts funded under the pay-as-you-go basis since the City’s adoption of GASB 45 in fiscal year 2008.
57
CITY OF MIAMI, FLORIDANOTES TO FINANCIAL STATEMENTSSeptember 30, 2016
Unearned Revenues
Resources that do not meet revenue recognition requirements (not earned) are recorded as unearned revenue in the government-wide and the governmental fund financial statements.
Unearned revenues in the government-wide and governmental funds financial statements at September 30, 2016 are as follows:
Long-Term Obligations
In the government-wide financial statements long-term debt and other long-term obligations are reported as liabilities on the statement of net position. Bonds payable are reported net of the applicable accretion, bond premiums or discounts. Bond premiums, discounts and prepaid insurance cost are amortized over the life of the bonds using the effective interest method.
In the fund financial statements, governmental fund types recognize bond premiums and discounts during the current period. The face amount of debt issued is reported as other financing sources. Premiums received on debt issuances are reported as other financing sources while discounts on debt issuances are reported as other financing uses. Issuance costs, whether or not withheld from the actual debt proceeds received and payment of debt principal, are reported as debt service expenditures.
Under GASB 49, Accounting and Financial Reporting for Pollution Remediation Obligations, a pollution remediation is an obligation to address the current or potential detrimental effects of existing pollution by participating in pollution remediation activities such as assessments and clean-ups.
Risk Management
Under the protection of the sovereign immunity limit, Florida Statutes 768.28 and Chapter 440, Florida Statutes covering Workers’ Compensation, the City has established a self-insured program to provide coverage for almost all areas of liability including Workers’ Compensation, General Liability, Automotive Liability, Police Professional Liability, Public Officials’ Liability, and Employment Practices Liability. Section 768.28, Florida Statutes, provides for waiver of sovereign immunity in tort actions or claims against the state and its agencies and subdivisions. The present limit of recovery in the absence of special relief granted by the Florida legislature is $200,000 per person per claim or judgment. The limit of recovery for all claims or judgments arising out of the same incident or occurrence is $300,000. The City also provides group health benefits for its active employees, retirees, and their dependents through a fully self-funded health insurance program and uses a commercial carrier as the administrator. The City records a liability for Workers’ Compensation, General Liability, Employee Health Programs, Automotive Liability, Police Professional Liability, Public Officials’ Liability, and Employment Practices Liability.
58
CITY OF MIAMI, FLORIDANOTES TO FINANCIAL STATEMENTSSeptember 30, 2016
Net Position
Equity in the government-wide statement of net position is displayed in three categories: 1) net investment in capital assets, 2) restricted, and 3) unrestricted. Net investments in capital assets consists of capital assets reduced by accumulated depreciation and by any outstanding debt incurred to acquire, construct, or improve those assets, excluding unexpended proceeds. Deferred outflow and inflow of resources that are attributable to acquisition of those assets or related debt are included in this component of net position. Net position is reported as restricted when there are legal limitations imposed on their use by State Statutes, City legislation or external restrictions by other governments, creditors, or grantors. Unrestricted net position consists of all items that do not meet the definition of either of the other two components. As of fiscal year end the City reported an unrestricted net deficit, which will require future funding to eliminate this deficit amount.
When restricted resources are available for use, it is the City’s policy to use restricted resources first as they are needed. Similarly, within fund balance categories committed amounts are reduced first, followed by assigned, and then by unassigned amounts when expenditures are incurred for purposes for which amounts in any of these fund balance classifications could be used.
Fund Balance
Governmental Accounting Standards Board Statement No. 54, Fund Balance Reporting and Governmental Fund Type Definitions, established the accounting and financial reporting standards for government entities to report fund balance in classifications that comprise a hierarchy based primarily on the extent to which the government is bound to honor constraints on the specific purposes for which amounts in those funds can be spent. The following is a description of the classifications used by the City.
Nonspendable Fund Balance – This amount includes amounts that cannot be spent because they are either (a) not in spendable form or (b) legally or contractually required to be maintained intact. Examples of this would be inventory, prepaid assets, and permanent endowments.
Restricted Fund Balance – This amount includes amounts that are restricted to specific purposes as stipulated by (a) external creditors, grantors, contributors, or laws or regulations of other governments or (b) imposed by law through constitutional provisions or enabling legislation.
Committed Fund Balance – This amount includes amounts that can only be used for specific purposes pursuant to constraints imposed by resolution of the City’s highest level of decision making authority which is the City Commission. Once adopted by resolution, the commitment can only be revised or removed by adoption of a new resolution.
Assigned Fund Balance – This amount includes amounts that are constrained by the City’s intent to be used for specific purposes, but are neither restricted nor committed. Assignments are made directly by formal action of the City Commission.
Unassigned Fund Balance – This amount is the residual classification for the general fund. This classification represents fund balance that has not been assigned to other funds and that has not been restricted, committed, or assigned to specific purposes within the general fund. In other funds, the unassigned classification should be used only to report a deficit balance resulting from overspending for specific purposes for which amounts had been restricted, committed or assigned.
59
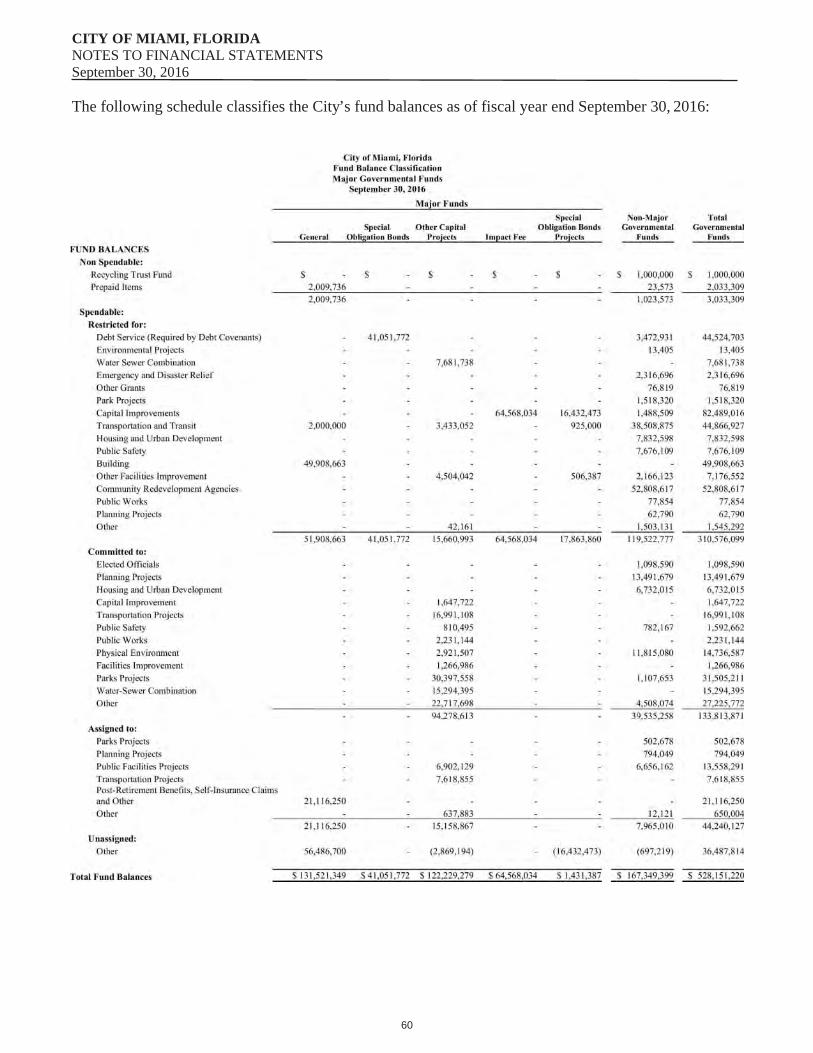
CITY OF MIAMI, FLORIDANOTES TO FINANCIAL STATEMENTSSeptember 30, 2016
The following schedule classifies the City’s fund balances as of fiscal year end September 30, 2016:
60
CITY OF MIAMI, FLORIDANOTES TO FINANCIAL STATEMENTSSeptember 30, 2016
The City’s Financial Integrity Principles require the City to maintain a minimum fund balance equal to twenty percent, (10% Assigned and 10% Unassigned) of the prior three years average of general revenues (excluding transfers). The average three years revenues for fiscal years 2013, 2014, and 2015 were approximately $564.9 million. Based on this, the City is required to individually retain assigned and unassigned fund balance of approximately $56.5 million each. As of September 30, 2016, the City has approximately $21.1 million as assigned, which includes the $5.0 million Required Contingency Reserve, and the City has unassigned the required $56.5 million in accordance with the City’s Financial Integrity Ordinance. Consequently, while the overall fund balance exceeded the 20% three-year revenue average, the 10% of the three-year revenue average required for the assigned fund balance was not met.
Use of Estimates
The preparation of the financial statements in conformity with accounting principles generally accepted in the United States requires management to make estimates and assumptions that affect the reported amounts of assets, liabilities, deferred inflow/outflow and disclosure of contingent assets and liabilities at the date of the financial statements. Estimates also affect the reported amounts of revenues and expenditures/expenses during the reporting period. Actual results could differ from estimates.
Excess of Expenditures over Appropriations
The following funds’ actual expenditures exceeded appropriations for the year ended September 30, 2016:
The excess of expenditures over appropriations can be attributed to expenditures related to the SEOPW CRA Special Obligation Series 2014 A-1 and Series 2014 A-2 which were not appropriated.
Budgets are monitored at varying levels of classification detail; however, budgetary control is legally maintained at the fund level except for the General Fund, which is maintained at the departmental level. City departments will work closely with the Budget Department to minimize these instances in the ensuing fiscal year.
61
CITY OF MIAMI, FLORIDANOTES TO FINANCIAL STATEMENTSSeptember 30, 2016
Fund Deficits
The following fund had fund balance deficits in the amounts indicated as of September 30, 2016:
The fund deficit reported as of September 30, 2016, for the Midtown CRA Special Revenue Fund is attributed to increased expenditures in the current fiscal year by the Midtown Community Redevelopment Agency (the Agency). The Agency expects to address this issue in the ensuing fiscal year.
New Accounting Pronouncements
The following new pronouncements effective for the year ending September 30, 2016 were adopted by the City:
GASB Statement No. 72, Fair Value Measurement and Application, establishes requirements of measurement of certain assets and liabilities at fair value using a consistent and more detailed definition of fair value and accepted valuation techniques. This Statement also will enhance fair value application guidance and related disclosures in order to provide information to financial statement users about the impact of fair value measurements on a government’s financial position. Management has implemented GASB Statement No.72 in the financial statements.
GASB Statement No. 73, Accounting and Financial Reporting for Pensions and Related Assets That Are Not within the Scope of GASB Statement 68, and Amendments to Certain Provisions of GASB Statements 67and 68, establishes requirements for defined benefit pensions that are not within the scope of Statement No. 68, Accounting and Financial Reporting for Pensions, as well as for the assets accumulated for purposes of providing those pensions. In addition, it establishes requirements for defined contribution pensions that are not within the scope of Statement 68. It also amends certain provisions of Statement No. 67, Financial Reporting for Pension Plans, and Statement 68 for pension plans and pensions that are within their respective scopes. Management has evaluated GASB Statement No.73 and determined it did not have an effect on the City’s financial reporting.
GASB Statement No. 76, The Hierarchy of Generally Accepted Accounting Principles for State and Local Governments, establishes the order of priority of pronouncements and other sources of accounting and financial reporting guidance that a government should apply. Management implemented this Statement in current fiscal year.
62
CITY OF MIAMI, FLORIDANOTES TO FINANCIAL STATEMENTSSeptember 30, 2016
GASB Statement No. 78, Pensions Provided through Certain Multiple-Employer Defined Benefit Pension Plans, addresses a practice issue regarding the scope and applicability of Statement No. 68, Accounting and Financial Reporting for Pensions. This issue is associated with pensions provided through certain multiple-employer defined benefit pension plans and to state or local governmental employers whose employees are provided with such pensions. The City does not participate in any pension plans that fall within the scope of this Statement, therefore the provisions of this statement did not apply to the City.
GASB Statement No. 79, Certain External Investment Pools and Pool Participants, establishescriteria for an external investment pool to qualify for making the election to measure all of its investments at amortized cost for financial reporting purposes. Management has evaluated GASB Statement No.79 and determined it did not have an effect on the City’s financial reporting.
63
CITY OF MIAMI, FLORIDANOTES TO FINANCIAL STATEMENTSSeptember 30, 2016
NOTE 2. – DEPOSITS AND INVESTMENTS
Pooled Cash
The City (excluding the Pension Trust Funds and restricted cash balances) maintains a cash management pool for its cash, cash equivalents, and investments in which each fund and/or account or sub-account of a fund participates on a dollar equivalent and daily transaction basis. Interest income (which includes unrealized gains and losses) is distributed monthly to all eligible funds, accounts and/or sub-account, based on the available cash balance at month end. The yield is determined for these eligible funds, based on the amount of time they are available for investing. A cash balance that is needed within a three month period will receive the yield on a 3 month treasury bill as determined by the current bond market.
Deposits
Custodial Credit Risk – This is the risk in the event of a financial institution failure, the City’s deposits may not be recoverable. In addition to insurance provided by the Federal Deposit Insurance Corporation, deposits are held in banking institutions approved by the State Treasurer of Florida to hold public funds. The City’s adopted policy is governed by Florida Statutes Chapter 280, Security for Public Deposits, which requires all Florida qualified public depositories to deposit with the Treasurer or other banking institution eligible collateral. In the event of failure of a qualified public depository, the remaining public depositories would be responsible for covering any resulting losses.
Investments
As required by Florida Statutes, the City has adopted a written investment policy, which may, from time to time, be amended by the City Commission.
The City Code authorizes the Director of Finance and/or a designee in his/her absence to purchase and invest idle funds prudently in US Treasuries and obligations of agencies of the United States – provided such are guaranteed by the United States or by the issuing agency; general obligations of states, municipalities, school districts, or other political subdivisions; revenue and excise tax bonds of the various municipalities of the State of Florida – provided none of such securities have been in default within five years prior to date of purchase; negotiable certificates of deposit, bankers acceptance drafts, money market investments, the State Board of Administration Investment Pool, and prime commercial paper.
The State Board of Administration administers the Local Government Surplus Funds Trust Fund which is governed by Ch. 19-7 of the Florida Administrative Code. These rules provide guidance and establish the general operating procedures for the administration of the Local Government Surplus Funds Trust Fund. Additionally, the State of Florida Office of the Auditor General performs the operational audit of the activities and investments of the State Board of Administration. The Local Government Surplus Funds Trust Fund is not a registrant with the Securities and Exchange Commission; however, the board has adopted operating procedures consistent with the requirements for a 2a-7 fund. These investments are valued using the pooled share price, which is based on amortized cost. The value of the position in the external investment pool is the same as the value of the pool shares.
64
CITY OF MIAMI, FLORIDANOTES TO FINANCIAL STATEMENTSSeptember 30, 2016
At September 30, 2016, pooled cash, cash equivalents and investments including restricted amounts of the primary government, exclusive of the Pension Trust Funds and discrete component units balances, consisted of the following:
Custodial Credit Risk – This is the risk in the event of the failure of the counterparty, the City will not be able to recover the value of its investments or collateral securities in the possession of an outside party. The City’s investment policy requires securities be registered in the name of the City. All safekeeping receipts for investment instruments are held in accounts in the City’s name.
As of September 30, 2016, $36.9 million of the total balance listed above relates to unspent bond proceeds restricted for capital projects. Unspent bond proceeds by debt issue consisted of the following:
The City also has an additional $19.6 million of cash, cash equivalents, and investments restricted for debt service payments.
Interest Rate Risk – Interest rate risk is the risk that changes in market rates will adversely affect the fair value of an investment. Generally, the longer the maturity of an investment, the greater the sensitivity of its fair value to changes in the market interest rates.
65
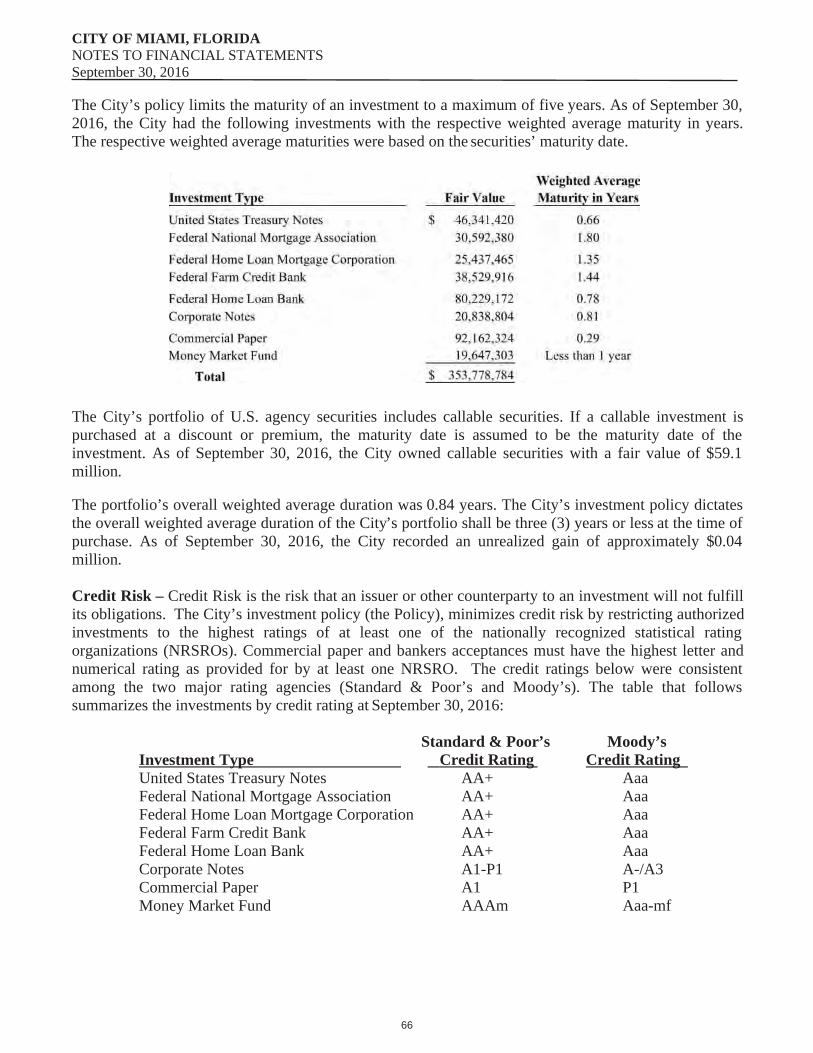
CITY OF MIAMI, FLORIDANOTES TO FINANCIAL STATEMENTSSeptember 30, 2016
The City’s policy limits the maturity of an investment to a maximum of five years. As of September 30, 2016, the City had the following investments with the respective weighted average maturity in years. The respective weighted average maturities were based on the securities’ maturity date.
The City’s portfolio of U.S. agency securities includes callable securities. If a callable investment is purchased at a discount or premium, the maturity date is assumed to be the maturity date of the investment. As of September 30, 2016, the City owned callable securities with a fair value of $59.1 million.
The portfolio’s overall weighted average duration was 0.84 years. The City’s investment policy dictates the overall weighted average duration of the City’s portfolio shall be three (3) years or less at the time of purchase. As of September 30, 2016, the City recorded an unrealized gain of approximately $0.04 million.
Credit Risk – Credit Risk is the risk that an issuer or other counterparty to an investment will not fulfill its obligations. The City’s investment policy (the Policy), minimizes credit risk by restricting authorized investments to the highest ratings of at least one of the nationally recognized statistical rating organizations (NRSROs). Commercial paper and bankers acceptances must have the highest letter and numerical rating as provided for by at least one NRSRO. The credit ratings below were consistent among the two major rating agencies (Standard & Poor’s and Moody’s). The table that follows summarizes the investments by credit rating at September 30, 2016:
Standard & Poor’s Moody’sInvestment Type Credit Rating Credit RatingUnited States Treasury Notes AA+ AaaFederal National Mortgage Association AA+ AaaFederal Home Loan Mortgage Corporation AA+ AaaFederal Farm Credit Bank AA+ AaaFederal Home Loan Bank AA+ AaaCorporate Notes A1-P1 A-/A3Commercial Paper A1 P1Money Market Fund AAAm Aaa-mf
66
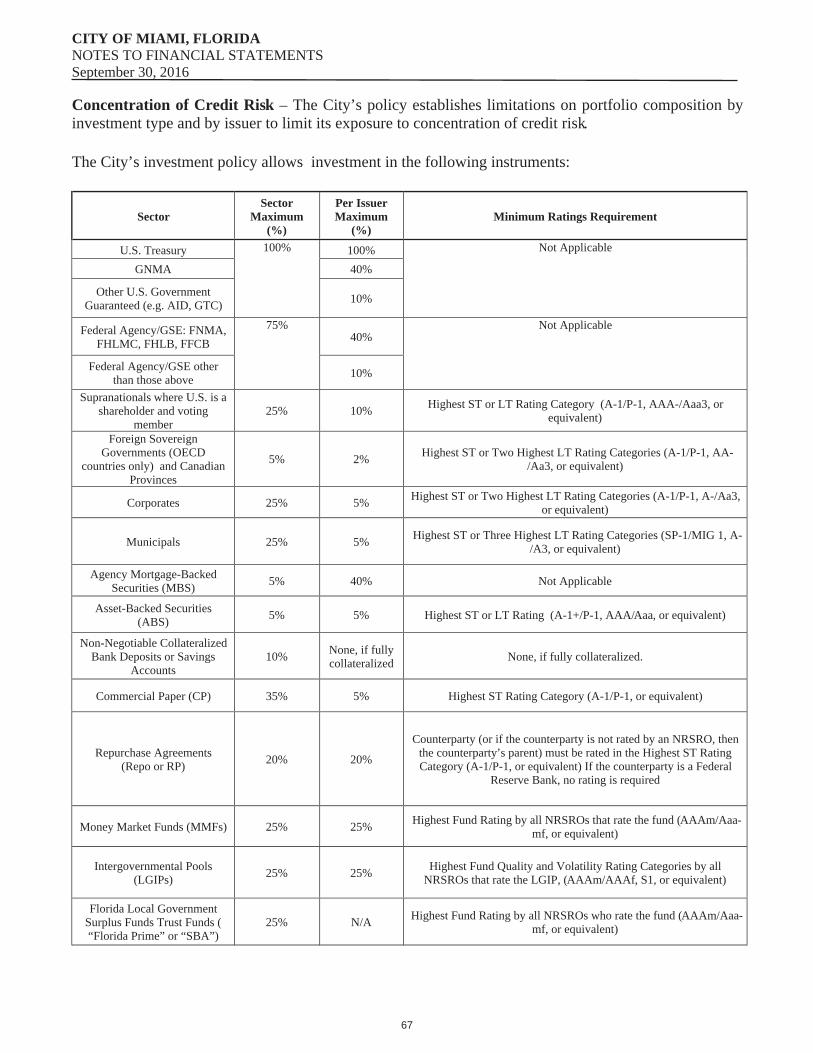
CITY OF MIAMI, FLORIDANOTES TO FINANCIAL STATEMENTSSeptember 30, 2016
Concentration of Credit Risk – The City’s policy establishes limitations on portfolio composition by investment type and by issuer to limit its exposure to concentration of credit risk.
The City’s investment policy allows investment in the following instruments:
SectorSector
Maximum (%)
Per Issuer Maximum
(%)Minimum Ratings Requirement
U.S. Treasury 100% 100% Not Applicable
GNMA 40%
Other U.S. Government Guaranteed (e.g. AID, GTC) 10%
Federal Agency/GSE: FNMA, FHLMC, FHLB, FFCB
75%40%
Not Applicable
Federal Agency/GSE other than those above 10%
Supranationals where U.S. is a shareholder and voting
member25% 10% Highest ST or LT Rating Category (A-1/P-1, AAA-/Aaa3, or
equivalent)
Foreign Sovereign Governments (OECD
countries only) and Canadian Provinces
5% 2% Highest ST or Two Highest LT Rating Categories (A-1/P-1, AA-/Aa3, or equivalent)
Corporates 25% 5% Highest ST or Two Highest LT Rating Categories (A-1/P-1, A-/Aa3, or equivalent)
Municipals 25% 5% Highest ST or Three Highest LT Rating Categories (SP-1/MIG 1, A-/A3, or equivalent)
Agency Mortgage-Backed Securities (MBS) 5% 40% Not Applicable
Asset-Backed Securities (ABS) 5% 5% Highest ST or LT Rating (A-1+/P-1, AAA/Aaa, or equivalent)
Non-Negotiable Collateralized Bank Deposits or Savings
Accounts10% None, if fully
collateralized None, if fully collateralized.
Commercial Paper (CP) 35% 5% Highest ST Rating Category (A-1/P-1, or equivalent)
Repurchase Agreements(Repo or RP) 20% 20%
Counterparty (or if the counterparty is not rated by an NRSRO, then the counterparty’s parent) must be rated in the Highest ST Rating Category (A-1/P-1, or equivalent) If the counterparty is a Federal
Reserve Bank, no rating is required
Money Market Funds (MMFs) 25% 25% Highest Fund Rating by all NRSROs that rate the fund (AAAm/Aaa-mf, or equivalent)
Intergovernmental Pools (LGIPs) 25% 25% Highest Fund Quality and Volatility Rating Categories by all
NRSROs that rate the LGIP, (AAAm/AAAf, S1, or equivalent)
Florida Local Government Surplus Funds Trust Funds (“Florida Prime” or “SBA”)
25% N/A Highest Fund Rating by all NRSROs who rate the fund (AAAm/Aaa-mf, or equivalent)
67
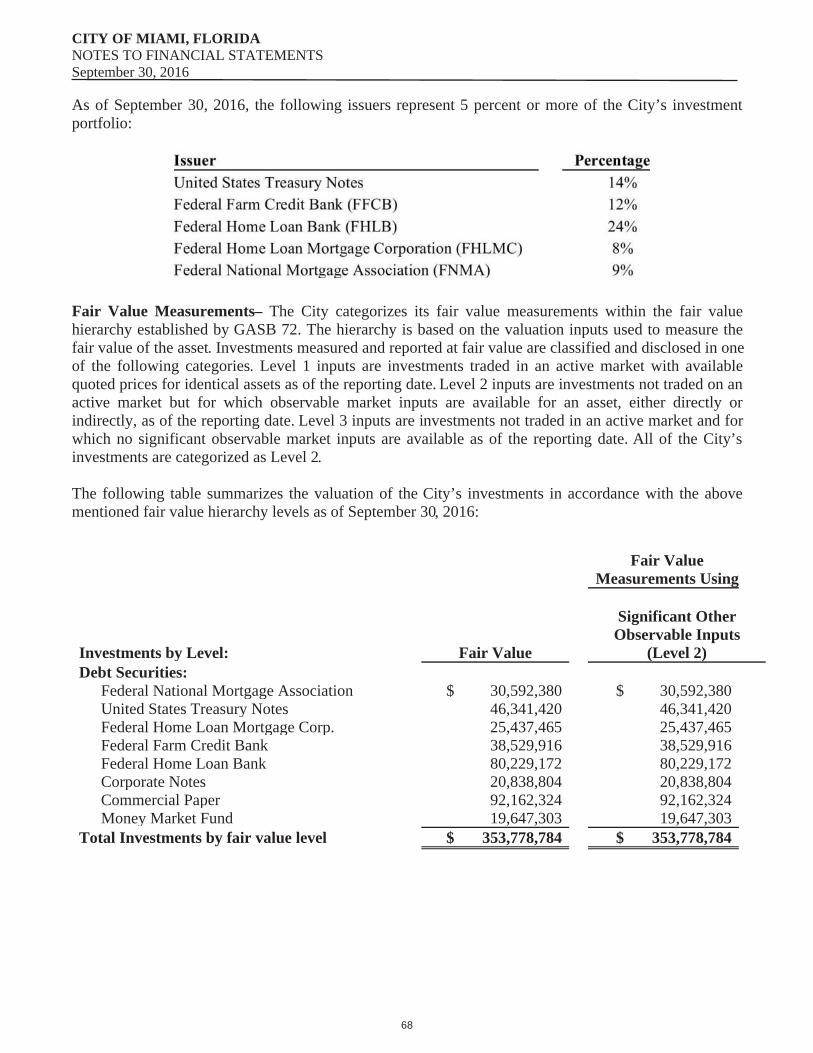
CITY OF MIAMI, FLORIDANOTES TO FINANCIAL STATEMENTSSeptember 30, 2016
As of September 30, 2016, the following issuers represent 5 percent or more of the City’s investment portfolio:
Fair Value Measurements– The City categorizes its fair value measurements within the fair value hierarchy established by GASB 72. The hierarchy is based on the valuation inputs used to measure the fair value of the asset. Investments measured and reported at fair value are classified and disclosed in one of the following categories. Level 1 inputs are investments traded in an active market with available quoted prices for identical assets as of the reporting date. Level 2 inputs are investments not traded on an active market but for which observable market inputs are available for an asset, either directly or indirectly, as of the reporting date. Level 3 inputs are investments not traded in an active market and for which no significant observable market inputs are available as of the reporting date. All of the City’s investments are categorized as Level 2.
The following table summarizes the valuation of the City’s investments in accordance with the above mentioned fair value hierarchy levels as of September 30, 2016:
Fair Value Measurements Using
Investments by Level: Fair Value
Significant Other Observable Inputs
(Level 2)Debt Securities:
Federal National Mortgage Association $ 30,592,380 $ 30,592,380 United States Treasury Notes 46,341,420 46,341,420 Federal Home Loan Mortgage Corp. 25,437,465 25,437,465 Federal Farm Credit Bank 38,529,916 38,529,916 Federal Home Loan Bank 80,229,172 80,229,172 Corporate Notes 20,838,804 20,838,804 Commercial Paper 92,162,324 92,162,324 Money Market Fund 19,647,303 19,647,303
Total Investments by fair value level $ 353,778,784 $ 353,778,784
68
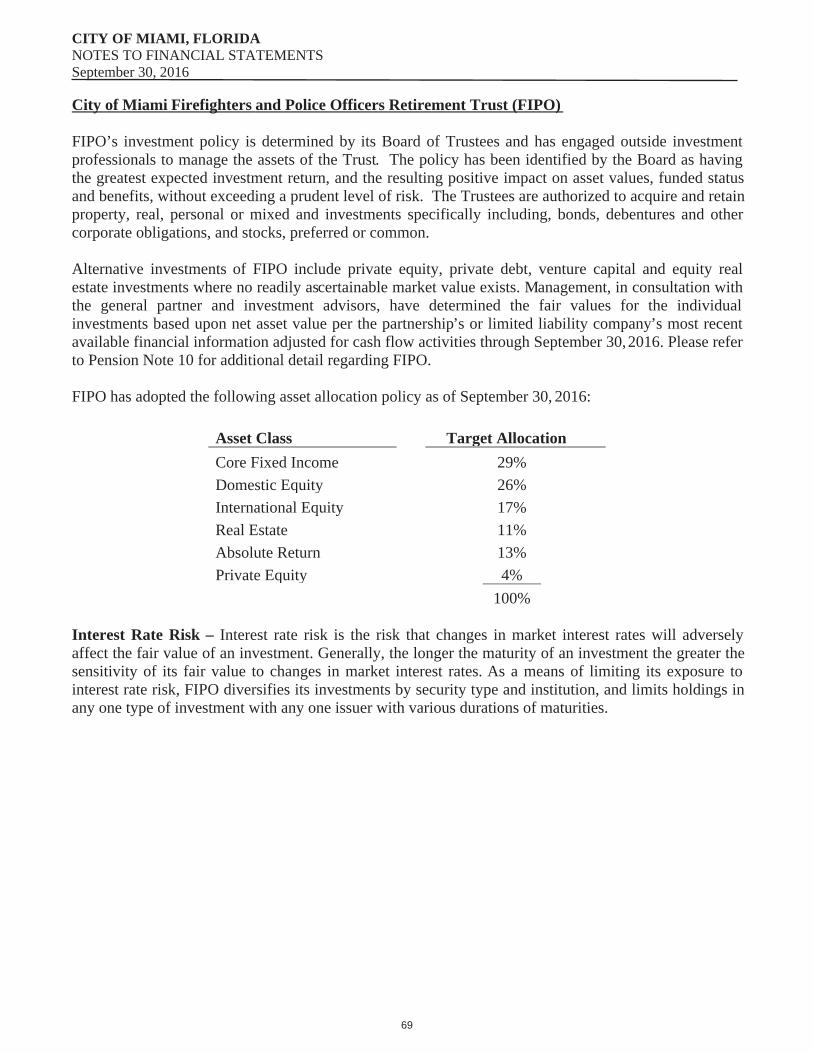
CITY OF MIAMI, FLORIDANOTES TO FINANCIAL STATEMENTSSeptember 30, 2016
City of Miami Firefighters and Police Officers Retirement Trust (FIPO)
FIPO’s investment policy is determined by its Board of Trustees and has engaged outside investment professionals to manage the assets of the Trust. The policy has been identified by the Board as having the greatest expected investment return, and the resulting positive impact on asset values, funded status and benefits, without exceeding a prudent level of risk. The Trustees are authorized to acquire and retain property, real, personal or mixed and investments specifically including, bonds, debentures and other corporate obligations, and stocks, preferred or common.
Alternative investments of FIPO include private equity, private debt, venture capital and equity real estate investments where no readily ascertainable market value exists. Management, in consultation with the general partner and investment advisors, have determined the fair values for the individual investments based upon net asset value per the partnership’s or limited liability company’s most recent available financial information adjusted for cash flow activities through September 30, 2016. Please refer to Pension Note 10 for additional detail regarding FIPO.
FIPO has adopted the following asset allocation policy as of September 30, 2016:
Asset Class Target AllocationCore Fixed Income 29%Domestic Equity 26%International Equity 17%Real Estate 11%Absolute Return 13%Private Equity 4%
100%
Interest Rate Risk – Interest rate risk is the risk that changes in market interest rates will adversely affect the fair value of an investment. Generally, the longer the maturity of an investment the greater the sensitivity of its fair value to changes in market interest rates. As a means of limiting its exposure to interest rate risk, FIPO diversifies its investments by security type and institution, and limits holdings in any one type of investment with any one issuer with various durations of maturities.
69
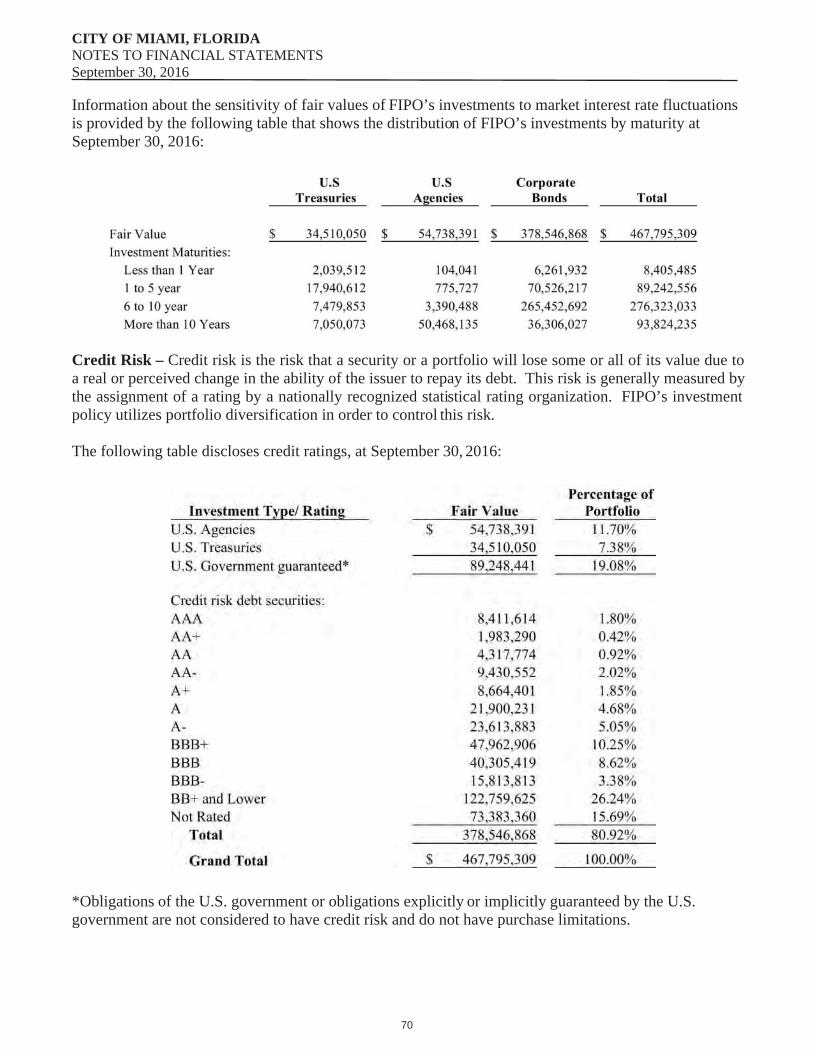
CITY OF MIAMI, FLORIDANOTES TO FINANCIAL STATEMENTSSeptember 30, 2016
Information about the sensitivity of fair values of FIPO’s investments to market interest rate fluctuations is provided by the following table that shows the distribution of FIPO’s investments by maturity at September 30, 2016:
Credit Risk – Credit risk is the risk that a security or a portfolio will lose some or all of its value due to a real or perceived change in the ability of the issuer to repay its debt. This risk is generally measured by the assignment of a rating by a nationally recognized statistical rating organization. FIPO’s investment policy utilizes portfolio diversification in order to control this risk.
The following table discloses credit ratings, at September 30, 2016:
*Obligations of the U.S. government or obligations explicitly or implicitly guaranteed by the U.S. government are not considered to have credit risk and do not have purchase limitations.
70
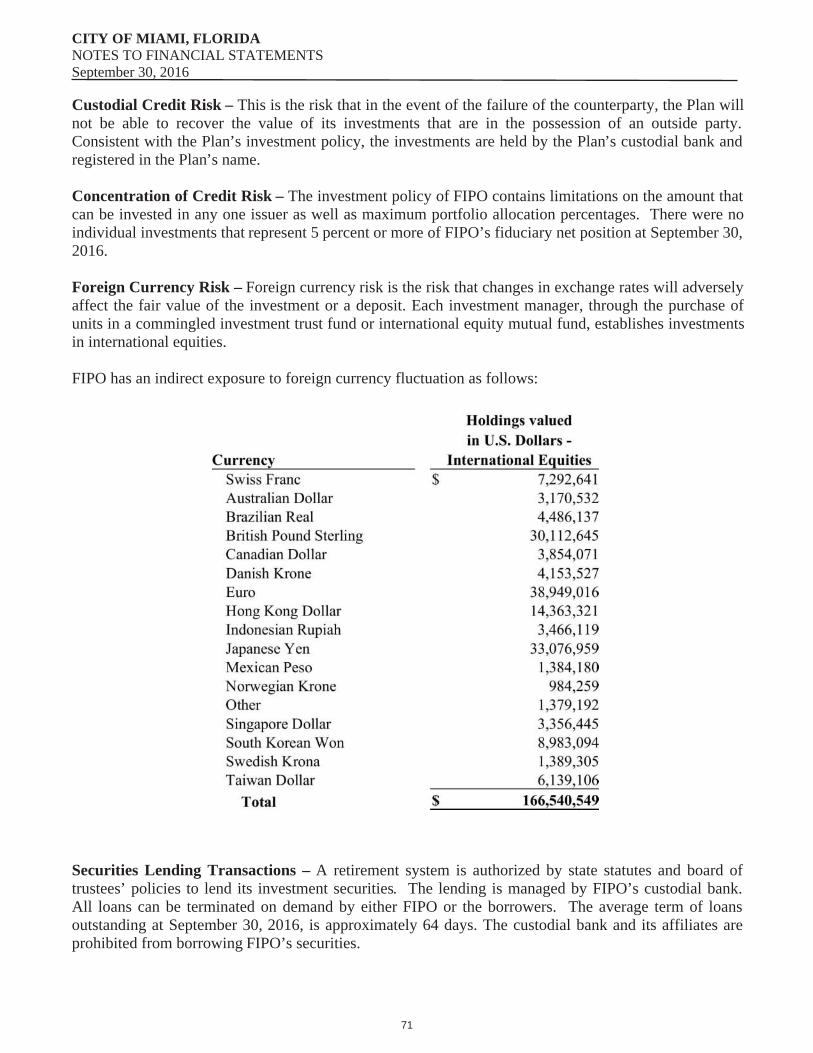
CITY OF MIAMI, FLORIDANOTES TO FINANCIAL STATEMENTSSeptember 30, 2016
Custodial Credit Risk – This is the risk that in the event of the failure of the counterparty, the Plan will not be able to recover the value of its investments that are in the possession of an outside party. Consistent with the Plan’s investment policy, the investments are held by the Plan’s custodial bank and registered in the Plan’s name.
Concentration of Credit Risk – The investment policy of FIPO contains limitations on the amount that can be invested in any one issuer as well as maximum portfolio allocation percentages. There were no individual investments that represent 5 percent or more of FIPO’s fiduciary net position at September 30, 2016.
Foreign Currency Risk – Foreign currency risk is the risk that changes in exchange rates will adversely affect the fair value of the investment or a deposit. Each investment manager, through the purchase of units in a commingled investment trust fund or international equity mutual fund, establishes investments in international equities.
FIPO has an indirect exposure to foreign currency fluctuation as follows:
Securities Lending Transactions – A retirement system is authorized by state statutes and board of trustees’ policies to lend its investment securities. The lending is managed by FIPO’s custodial bank. All loans can be terminated on demand by either FIPO or the borrowers. The average term of loans outstanding at September 30, 2016, is approximately 64 days. The custodial bank and its affiliates are prohibited from borrowing FIPO’s securities.
71
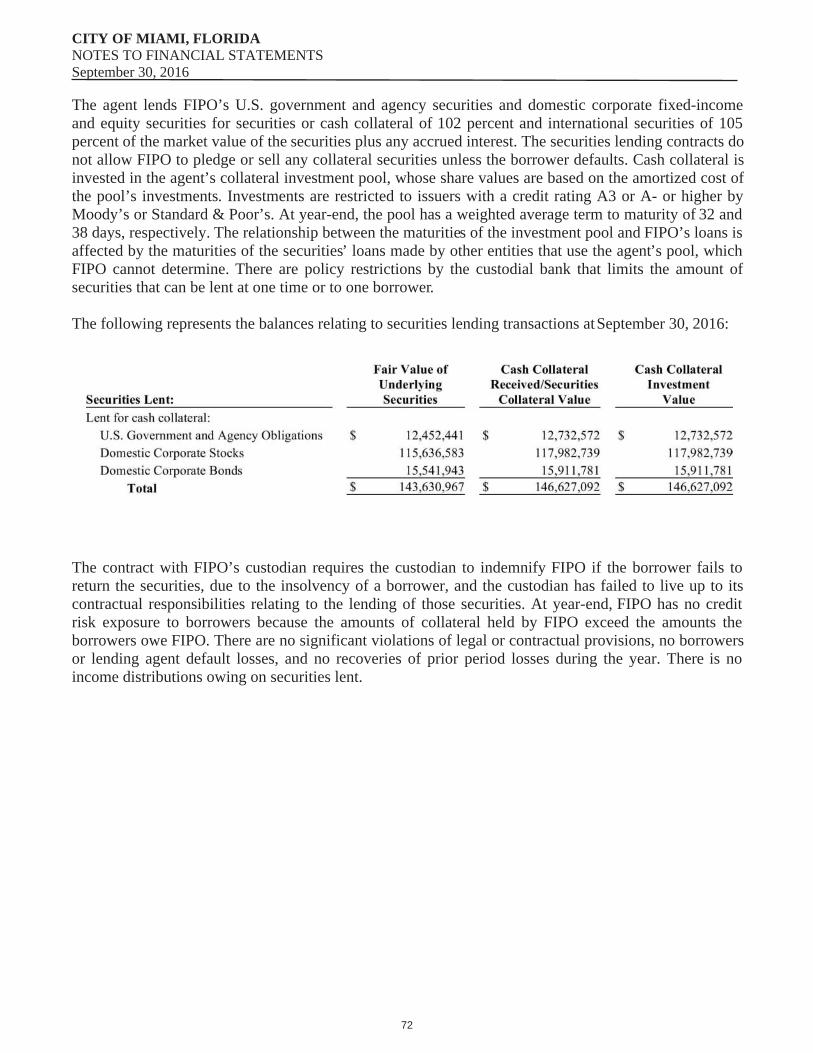
CITY OF MIAMI, FLORIDANOTES TO FINANCIAL STATEMENTSSeptember 30, 2016
The agent lends FIPO’s U.S. government and agency securities and domestic corporate fixed-income and equity securities for securities or cash collateral of 102 percent and international securities of 105 percent of the market value of the securities plus any accrued interest. The securities lending contracts do not allow FIPO to pledge or sell any collateral securities unless the borrower defaults. Cash collateral is invested in the agent’s collateral investment pool, whose share values are based on the amortized cost of the pool’s investments. Investments are restricted to issuers with a credit rating A3 or A- or higher by Moody’s or Standard & Poor’s. At year-end, the pool has a weighted average term to maturity of 32 and 38 days, respectively. The relationship between the maturities of the investment pool and FIPO’s loans is affected by the maturities of the securities’ loans made by other entities that use the agent’s pool, which FIPO cannot determine. There are policy restrictions by the custodial bank that limits the amount of securities that can be lent at one time or to one borrower.
The following represents the balances relating to securities lending transactions at September 30, 2016:
The contract with FIPO’s custodian requires the custodian to indemnify FIPO if the borrower fails to return the securities, due to the insolvency of a borrower, and the custodian has failed to live up to its contractual responsibilities relating to the lending of those securities. At year-end, FIPO has no credit risk exposure to borrowers because the amounts of collateral held by FIPO exceed the amounts the borrowers owe FIPO. There are no significant violations of legal or contractual provisions, no borrowers or lending agent default losses, and no recoveries of prior period losses during the year. There is no income distributions owing on securities lent.
72

CITY OF MIAMI, FLORIDANOTES TO FINANCIAL STATEMENTSSeptember 30, 2016
The following table details FIPO investments as of September 30, 2016:
Fair Value Measurements – The FIPO Trust categorizes its fair value measurements within the fair value hierarchy established by GASB 72. The hierarchy is based on the valuation inputs used to measure the fair value of the asset. Investments measured and reported at fair value are classified and disclosed in one of the following categories. Level 1 inputs are investments traded in an active market with available quoted prices for identical assets as of the reporting date. Level 2 inputs are investments not traded on an active market but for which observable market inputs are available for an asset, either directly or indirectly, as of the reporting date. Level 3 inputs are investments not traded in an active market and for which no significant observable market inputs are available as of the reporting date.
The Trust has established a framework to consistently measure the fair value of the Trust’s assets and liabilities in accordance with applicable accounting, legal, and regulatory guidance. This framework has been provided by establishing valuation policy and procedures that will provide reasonable assurance that assets and liabilities are carried at fair value. In certain cases, the inputs used to measure fair value may fall into different levels of the fair value hierarchy. In such cases, an investment’s level within the fair value hierarchy is based on the lowest level of input that is significant to the fair value measurement. The Trust’s assessment of the significance of a particular input to the fair value measurement requires judgment and considers factors specific to the investment.
73
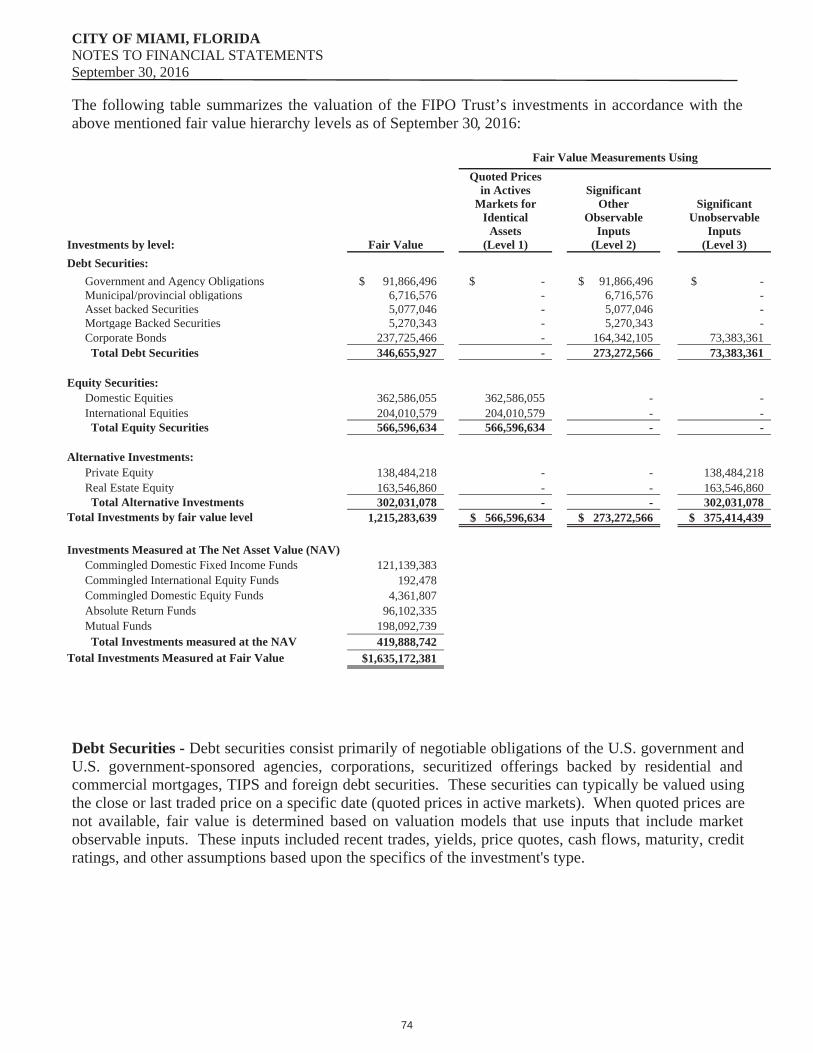
CITY OF MIAMI, FLORIDANOTES TO FINANCIAL STATEMENTSSeptember 30, 2016
The following table summarizes the valuation of the FIPO Trust’s investments in accordance with the above mentioned fair value hierarchy levels as of September 30, 2016:
Fair Value Measurements Using
Investments by level: Fair Value
Quoted Prices in Actives
Markets for Identical
Assets(Level 1)
SignificantOther
ObservableInputs
(Level 2)
SignificantUnobservable
Inputs(Level 3)
Debt Securities:Government and Agency Obligations $ 91,866,496 $ - $ 91,866,496 $ - Municipal/provincial obligations 6,716,576 - 6,716,576 - Asset backed Securities 5,077,046 - 5,077,046 - Mortgage Backed Securities 5,270,343 - 5,270,343 - Corporate Bonds 237,725,466 - 164,342,105 73,383,361 Total Debt Securities 346,655,927 - 273,272,566 73,383,361
Equity Securities:Domestic Equities 362,586,055 362,586,055 - - International Equities 204,010,579 204,010,579 - - Total Equity Securities 566,596,634 566,596,634 - -
Alternative Investments:Private Equity 138,484,218 - - 138,484,218 Real Estate Equity 163,546,860 - - 163,546,860 Total Alternative Investments 302,031,078 - - 302,031,078
Total Investments by fair value level 1,215,283,639 $ 566,596,634 $ 273,272,566 $ 375,414,439
Investments Measured at The Net Asset Value (NAV)Commingled Domestic Fixed Income Funds 121,139,383 Commingled International Equity Funds 192,478 Commingled Domestic Equity Funds 4,361,807 Absolute Return Funds 96,102,335 Mutual Funds 198,092,739 Total Investments measured at the NAV 419,888,742
Total Investments Measured at Fair Value $1,635,172,381
Debt Securities - Debt securities consist primarily of negotiable obligations of the U.S. government and U.S. government-sponsored agencies, corporations, securitized offerings backed by residential and commercial mortgages, TIPS and foreign debt securities. These securities can typically be valued using the close or last traded price on a specific date (quoted prices in active markets). When quoted prices are not available, fair value is determined based on valuation models that use inputs that include market observable inputs. These inputs included recent trades, yields, price quotes, cash flows, maturity, credit ratings, and other assumptions based upon the specifics of the investment's type.
74

CITY OF MIAMI, FLORIDANOTES TO FINANCIAL STATEMENTSSeptember 30, 2016
Equity Securities - These include domestic and international equities. Domestic securities traded on a national securities exchange are valued at the last reported sales price on the last business day of the fiscal year. Securities traded in the over-the counter market and listed securities for which no sale was reported on that date are valued at the last reported bid price. International equities are valued based upon quoted foreign market prices and translated into U.S. dollars at the exchange rate in effect at September 30, 2016. Securities which are not traded on a national security exchange are valued by the respective fund manager or other third parties based on yields currently available on comparable securities of issuers with similar credit ratings.
Alternative Investments - These investments include private equity and real estate equity investments where no readily ascertainable market value exists. To value these investments, management, in consultation with the general partner and investment advisors, determines the fair values for the individual investments based upon the partnership’s or limited liability company’s most recent available financial information adjusted for cash flow activities through September 30, 2016.
The following table displays information regarding The FIPO Trust’s investments that use net asset value (NAV) per share (or equivalent) to value investments.
Investment TypeFair Value 9/30/2016
RedemptionFrequency
RedemptionNotice Period
Commingled Domestic Fixed Income Funds $ 121,139,383 Daily Same dayAbsolute Return Funds 96,102,335 Quarterly 30 DaysCommingled International Equity Funds 192,478 Daily Same dayCommingled Domestic Equity Funds 4,361,807 Daily Same dayMutual Funds 198,092,739 Daily Same day
Total Investments Measured at the NAV $ 419,888,742
(1) Commingled domestic fixed income funds consist of one commingled investment vehicle which primarily invests in publicly traded domestic commercial mortgage backed securities. The investment is valued at the net asset value of units held at the end of the period based upon the fair value of the underlying investments.
(2) Absolute return funds aim to provide positive investment returns in all market conditions over the medium to long term. The funds are actively managed, with a wide investment remit to target a level of return over rolling three-year periods equivalent to cash plus five percent a year, gross of fees. They exploit market inefficiencies through active allocation to a diverse range of market positions. The funds use a combination of traditional assets (such as equities and bonds) and investment strategies based on advanced derivative techniques, resulting in a highly diversified portfolio. The funds can take long and short positions in markets, securities and groups of securities through derivative contracts.
(3) Commingled international equity funds consist of three commingled investment vehicles which invest primarily in publicly traded global equity securities. The funds are valued at the net asset value of units held at the end of the period based upon the fair value of the underlying investments.
(4) Commingled domestic equity funds consist of comingled investment vehicle which invests primarily in publicly traded equity securities. The funds are valued at the net asset value of units held at the end of the period based upon the fair value of the underlying investments.
75
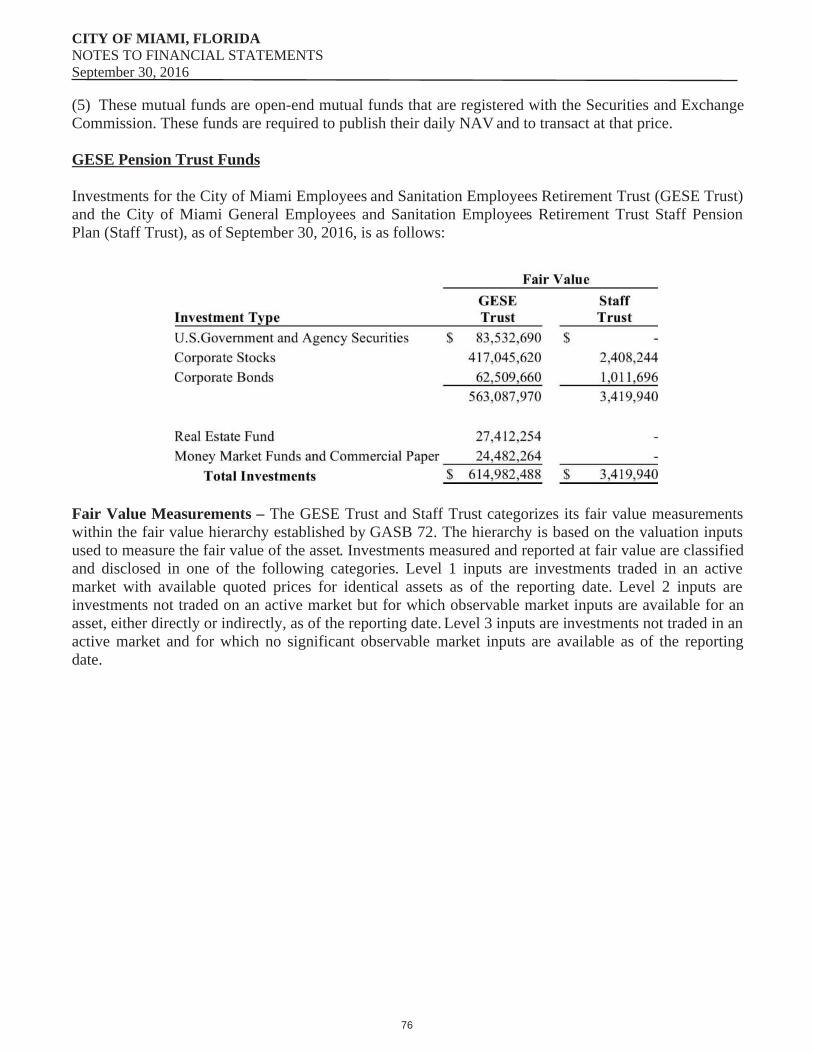
CITY OF MIAMI, FLORIDANOTES TO FINANCIAL STATEMENTSSeptember 30, 2016
(5) These mutual funds are open-end mutual funds that are registered with the Securities and Exchange Commission. These funds are required to publish their daily NAV and to transact at that price.
GESE Pension Trust Funds
Investments for the City of Miami Employees and Sanitation Employees Retirement Trust (GESE Trust) and the City of Miami General Employees and Sanitation Employees Retirement Trust Staff Pension Plan (Staff Trust), as of September 30, 2016, is as follows:
Fair Value Measurements – The GESE Trust and Staff Trust categorizes its fair value measurements within the fair value hierarchy established by GASB 72. The hierarchy is based on the valuation inputs used to measure the fair value of the asset. Investments measured and reported at fair value are classified and disclosed in one of the following categories. Level 1 inputs are investments traded in an active market with available quoted prices for identical assets as of the reporting date. Level 2 inputs are investments not traded on an active market but for which observable market inputs are available for an asset, either directly or indirectly, as of the reporting date. Level 3 inputs are investments not traded in an active market and for which no significant observable market inputs are available as of the reporting date.
76
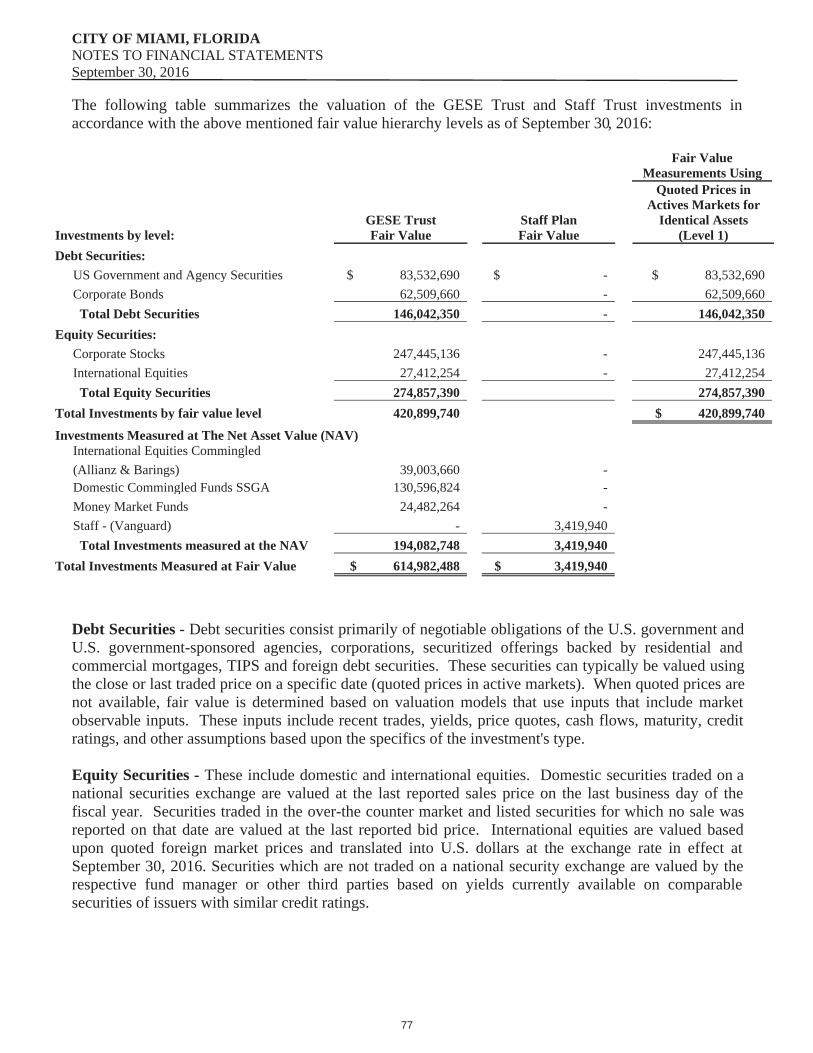
CITY OF MIAMI, FLORIDANOTES TO FINANCIAL STATEMENTSSeptember 30, 2016
The following table summarizes the valuation of the GESE Trust and Staff Trust investments in accordance with the above mentioned fair value hierarchy levels as of September 30, 2016:
Fair Value Measurements Using
Investments by level:GESE TrustFair Value
Staff PlanFair Value
Quoted Prices in Actives Markets for
Identical Assets(Level 1)
Debt Securities:US Government and Agency Securities $ 83,532,690 $ - $ 83,532,690 Corporate Bonds 62,509,660 - 62,509,660 Total Debt Securities 146,042,350 - 146,042,350
Equity Securities:Corporate Stocks 247,445,136 - 247,445,136 International Equities 27,412,254 - 27,412,254 Total Equity Securities 274,857,390 274,857,390
Total Investments by fair value level 420,899,740 $ 420,899,740
Investments Measured at The Net Asset Value (NAV)International Equities Commingled(Allianz & Barings) 39,003,660 - Domestic Commingled Funds SSGA 130,596,824 - Money Market Funds 24,482,264 - Staff - (Vanguard) - 3,419,940 Total Investments measured at the NAV 194,082,748 3,419,940
Total Investments Measured at Fair Value $ 614,982,488 $ 3,419,940
Debt Securities - Debt securities consist primarily of negotiable obligations of the U.S. government and U.S. government-sponsored agencies, corporations, securitized offerings backed by residential and commercial mortgages, TIPS and foreign debt securities. These securities can typically be valued using the close or last traded price on a specific date (quoted prices in active markets). When quoted prices are not available, fair value is determined based on valuation models that use inputs that include market observable inputs. These inputs include recent trades, yields, price quotes, cash flows, maturity, credit ratings, and other assumptions based upon the specifics of the investment's type.
Equity Securities - These include domestic and international equities. Domestic securities traded on a national securities exchange are valued at the last reported sales price on the last business day of the fiscal year. Securities traded in the over-the counter market and listed securities for which no sale was reported on that date are valued at the last reported bid price. International equities are valued based upon quoted foreign market prices and translated into U.S. dollars at the exchange rate in effect at September 30, 2016. Securities which are not traded on a national security exchange are valued by the respective fund manager or other third parties based on yields currently available on comparable securities of issuers with similar credit ratings.
77
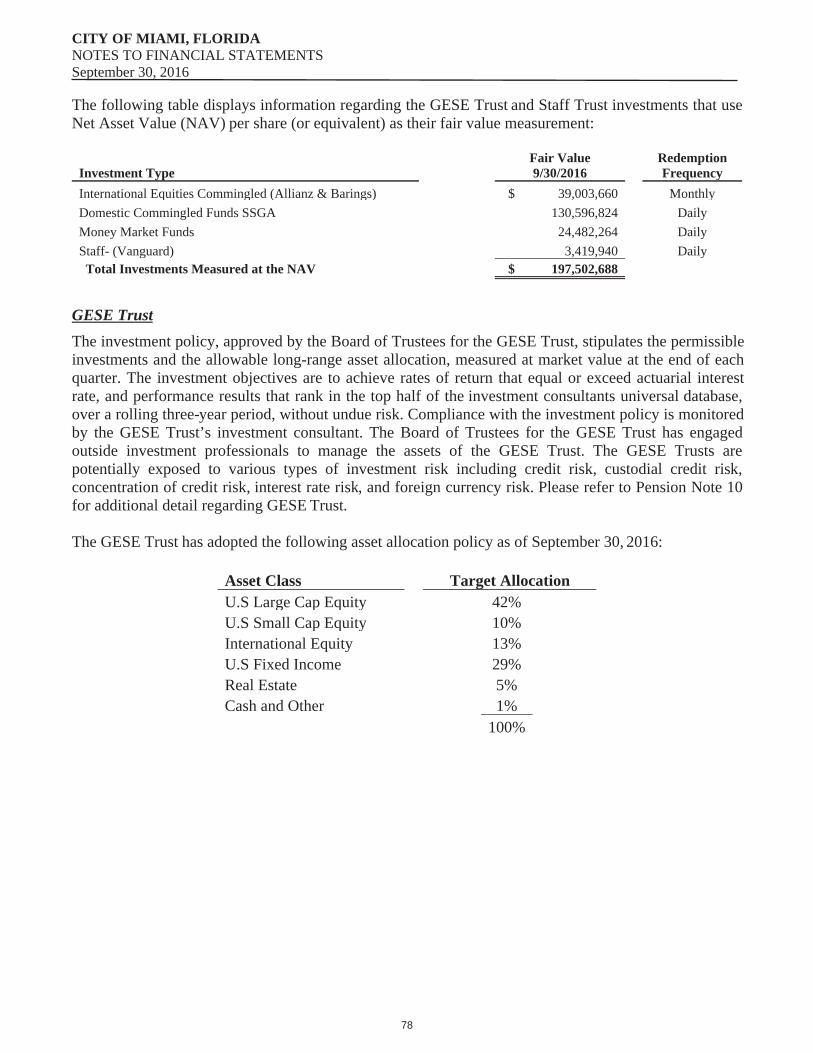
CITY OF MIAMI, FLORIDANOTES TO FINANCIAL STATEMENTSSeptember 30, 2016
The following table displays information regarding the GESE Trust and Staff Trust investments that use Net Asset Value (NAV) per share (or equivalent) as their fair value measurement:
Investment TypeFair Value 9/30/2016
RedemptionFrequency
International Equities Commingled (Allianz & Barings) $ 39,003,660 MonthlyDomestic Commingled Funds SSGA 130,596,824 DailyMoney Market Funds 24,482,264 DailyStaff- (Vanguard) 3,419,940 Daily Total Investments Measured at the NAV $ 197,502,688
GESE TrustThe investment policy, approved by the Board of Trustees for the GESE Trust, stipulates the permissible investments and the allowable long-range asset allocation, measured at market value at the end of each quarter. The investment objectives are to achieve rates of return that equal or exceed actuarial interest rate, and performance results that rank in the top half of the investment consultants universal database, over a rolling three-year period, without undue risk. Compliance with the investment policy is monitored by the GESE Trust’s investment consultant. The Board of Trustees for the GESE Trust has engaged outside investment professionals to manage the assets of the GESE Trust. The GESE Trusts are potentially exposed to various types of investment risk including credit risk, custodial credit risk, concentration of credit risk, interest rate risk, and foreign currency risk. Please refer to Pension Note 10 for additional detail regarding GESE Trust.
The GESE Trust has adopted the following asset allocation policy as of September 30, 2016:
Asset Class Target AllocationU.S Large Cap Equity 42%U.S Small Cap Equity 10%International Equity 13%U.S Fixed Income 29%Real Estate 5%Cash and Other 1%
100%
78
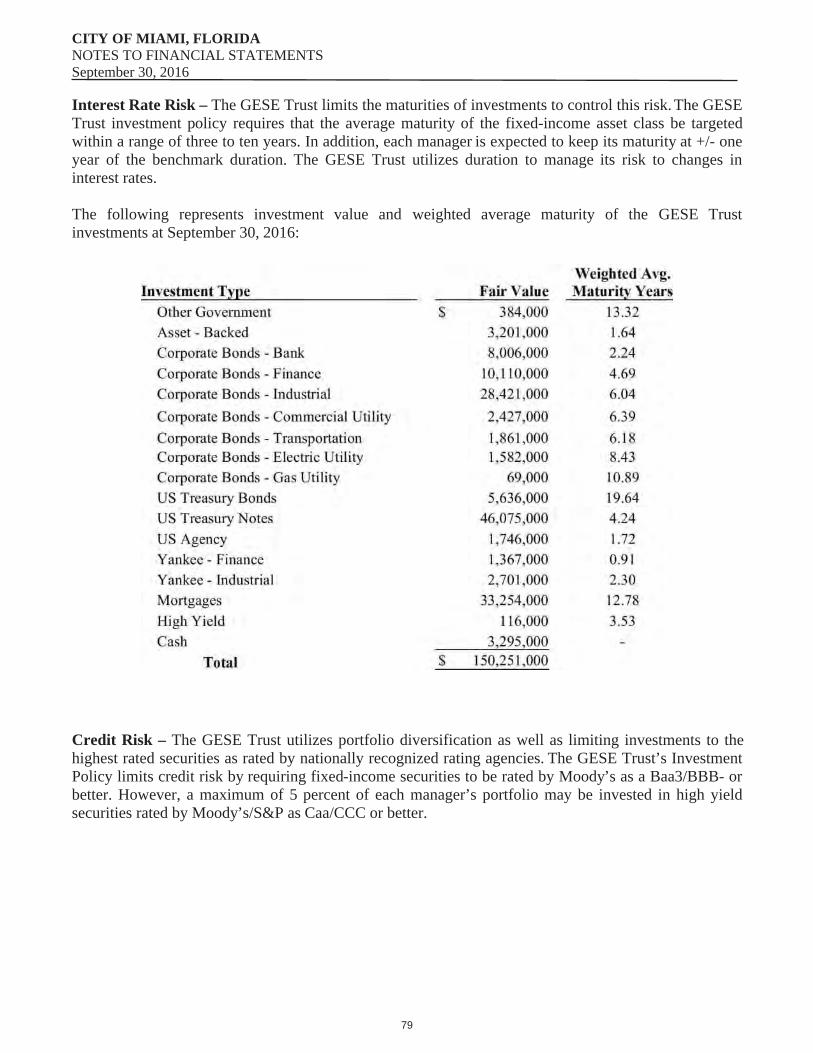
CITY OF MIAMI, FLORIDANOTES TO FINANCIAL STATEMENTSSeptember 30, 2016
Interest Rate Risk – The GESE Trust limits the maturities of investments to control this risk. The GESE Trust investment policy requires that the average maturity of the fixed-income asset class be targeted within a range of three to ten years. In addition, each manager is expected to keep its maturity at +/- one year of the benchmark duration. The GESE Trust utilizes duration to manage its risk to changes in interest rates.
The following represents investment value and weighted average maturity of the GESE Trust investments at September 30, 2016:
Credit Risk – The GESE Trust utilizes portfolio diversification as well as limiting investments to the highest rated securities as rated by nationally recognized rating agencies. The GESE Trust’s Investment Policy limits credit risk by requiring fixed-income securities to be rated by Moody’s as a Baa3/BBB- or better. However, a maximum of 5 percent of each manager’s portfolio may be invested in high yield securities rated by Moody’s/S&P as Caa/CCC or better.
79
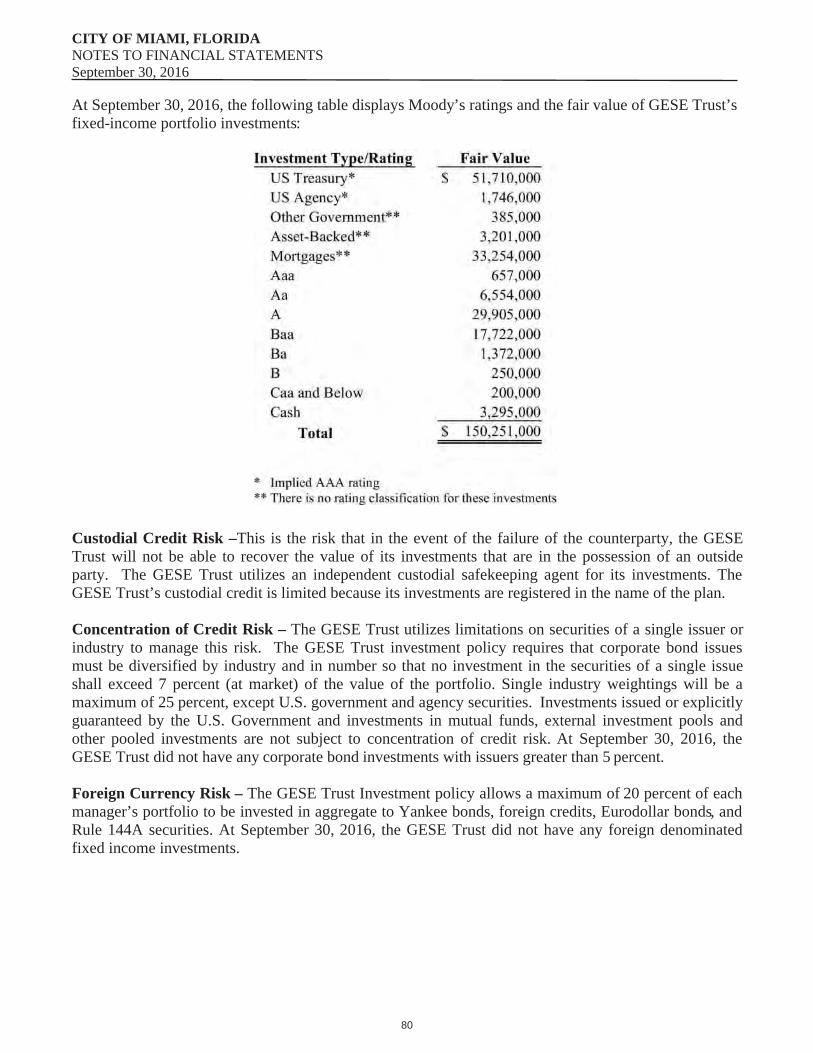
CITY OF MIAMI, FLORIDANOTES TO FINANCIAL STATEMENTSSeptember 30, 2016
At September 30, 2016, the following table displays Moody’s ratings and the fair value of GESE Trust’s fixed-income portfolio investments:
Custodial Credit Risk –This is the risk that in the event of the failure of the counterparty, the GESE Trust will not be able to recover the value of its investments that are in the possession of an outside party. The GESE Trust utilizes an independent custodial safekeeping agent for its investments. The GESE Trust’s custodial credit is limited because its investments are registered in the name of the plan.
Concentration of Credit Risk – The GESE Trust utilizes limitations on securities of a single issuer or industry to manage this risk. The GESE Trust investment policy requires that corporate bond issues must be diversified by industry and in number so that no investment in the securities of a single issue shall exceed 7 percent (at market) of the value of the portfolio. Single industry weightings will be a maximum of 25 percent, except U.S. government and agency securities. Investments issued or explicitly guaranteed by the U.S. Government and investments in mutual funds, external investment pools and other pooled investments are not subject to concentration of credit risk. At September 30, 2016, the GESE Trust did not have any corporate bond investments with issuers greater than 5 percent.
Foreign Currency Risk – The GESE Trust Investment policy allows a maximum of 20 percent of each manager’s portfolio to be invested in aggregate to Yankee bonds, foreign credits, Eurodollar bonds, and Rule 144A securities. At September 30, 2016, the GESE Trust did not have any foreign denominated fixed income investments.
80
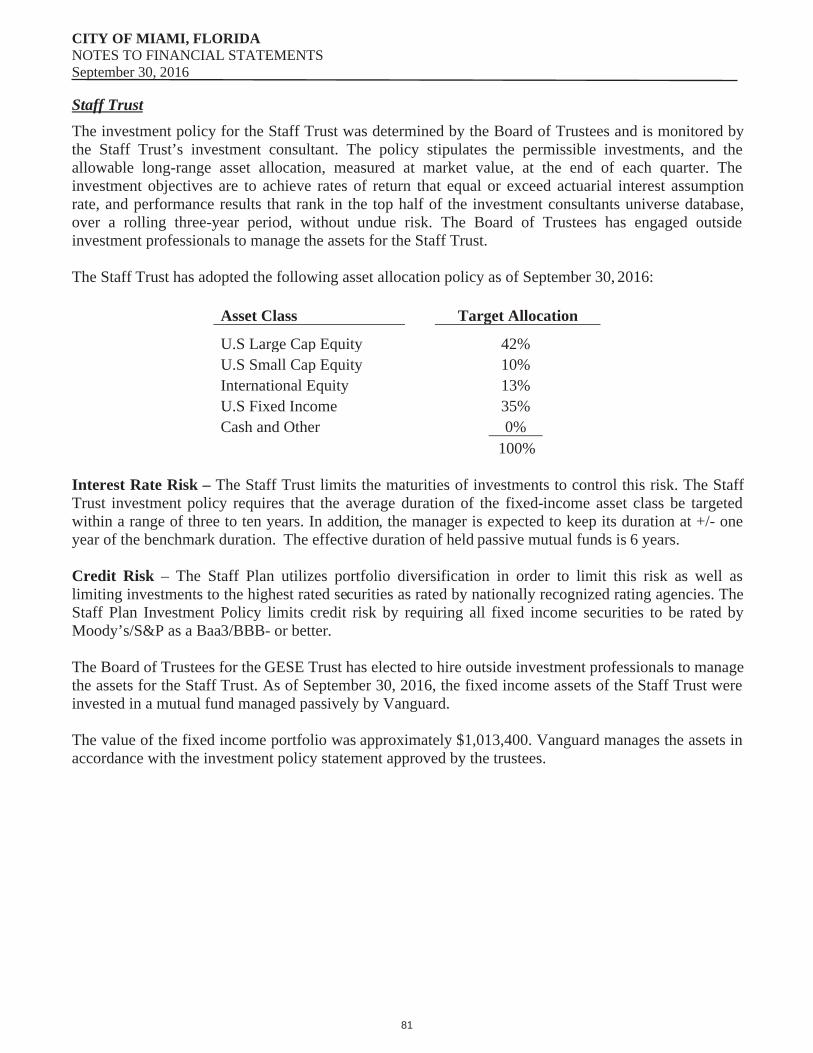
CITY OF MIAMI, FLORIDANOTES TO FINANCIAL STATEMENTSSeptember 30, 2016
Staff TrustThe investment policy for the Staff Trust was determined by the Board of Trustees and is monitored by the Staff Trust’s investment consultant. The policy stipulates the permissible investments, and the allowable long-range asset allocation, measured at market value, at the end of each quarter. The investment objectives are to achieve rates of return that equal or exceed actuarial interest assumption rate, and performance results that rank in the top half of the investment consultants universe database, over a rolling three-year period, without undue risk. The Board of Trustees has engaged outside investment professionals to manage the assets for the Staff Trust.
The Staff Trust has adopted the following asset allocation policy as of September 30, 2016:
Asset Class Target Allocation
U.S Large Cap Equity 42%U.S Small Cap Equity 10%International Equity 13%U.S Fixed Income 35%Cash and Other 0%
100%
Interest Rate Risk – The Staff Trust limits the maturities of investments to control this risk. The Staff Trust investment policy requires that the average duration of the fixed-income asset class be targeted within a range of three to ten years. In addition, the manager is expected to keep its duration at +/- one year of the benchmark duration. The effective duration of held passive mutual funds is 6 years.
Credit Risk – The Staff Plan utilizes portfolio diversification in order to limit this risk as well as limiting investments to the highest rated securities as rated by nationally recognized rating agencies. The Staff Plan Investment Policy limits credit risk by requiring all fixed income securities to be rated by Moody’s/S&P as a Baa3/BBB- or better.
The Board of Trustees for the GESE Trust has elected to hire outside investment professionals to manage the assets for the Staff Trust. As of September 30, 2016, the fixed income assets of the Staff Trust were invested in a mutual fund managed passively by Vanguard.
The value of the fixed income portfolio was approximately $1,013,400. Vanguard manages the assets in accordance with the investment policy statement approved by the trustees.
81
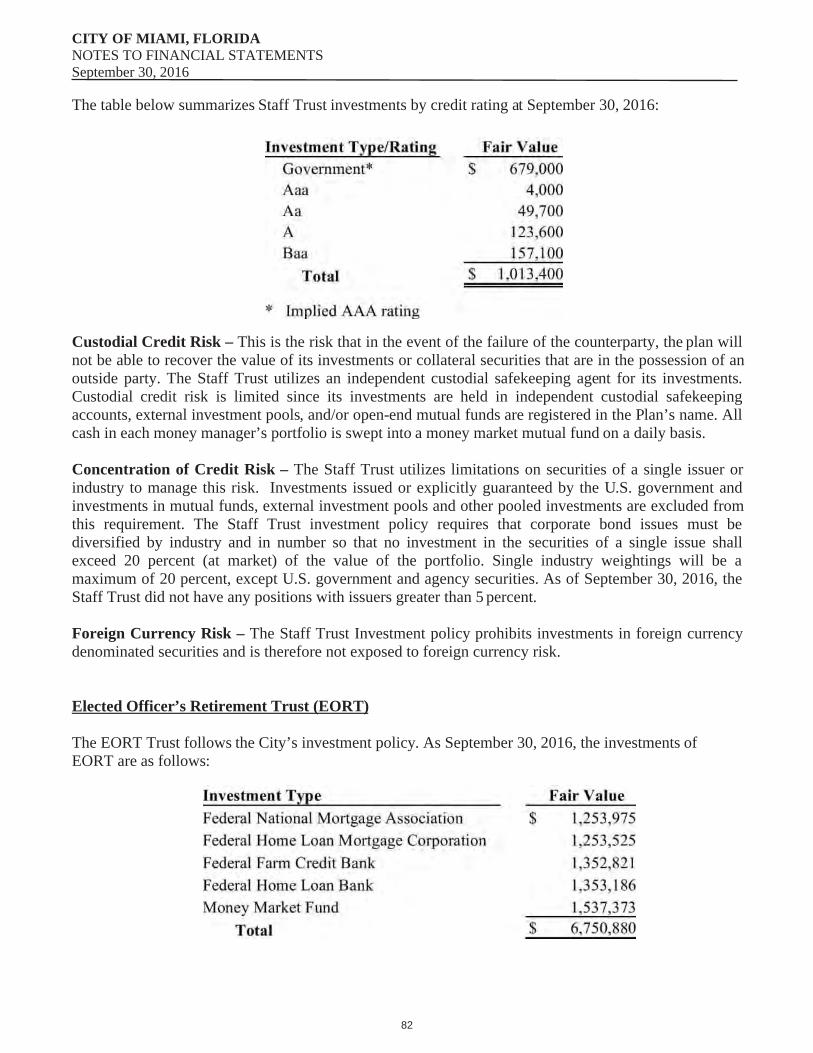
CITY OF MIAMI, FLORIDANOTES TO FINANCIAL STATEMENTSSeptember 30, 2016
The table below summarizes Staff Trust investments by credit rating at September 30, 2016:
Custodial Credit Risk – This is the risk that in the event of the failure of the counterparty, the plan will not be able to recover the value of its investments or collateral securities that are in the possession of an outside party. The Staff Trust utilizes an independent custodial safekeeping agent for its investments. Custodial credit risk is limited since its investments are held in independent custodial safekeeping accounts, external investment pools, and/or open-end mutual funds are registered in the Plan’s name. All cash in each money manager’s portfolio is swept into a money market mutual fund on a daily basis.
Concentration of Credit Risk – The Staff Trust utilizes limitations on securities of a single issuer or industry to manage this risk. Investments issued or explicitly guaranteed by the U.S. government and investments in mutual funds, external investment pools and other pooled investments are excluded from this requirement. The Staff Trust investment policy requires that corporate bond issues must be diversified by industry and in number so that no investment in the securities of a single issue shall exceed 20 percent (at market) of the value of the portfolio. Single industry weightings will be a maximum of 20 percent, except U.S. government and agency securities. As of September 30, 2016, the Staff Trust did not have any positions with issuers greater than 5 percent.
Foreign Currency Risk – The Staff Trust Investment policy prohibits investments in foreign currency denominated securities and is therefore not exposed to foreign currency risk.
Elected Officer’s Retirement Trust (EORT)
The EORT Trust follows the City’s investment policy. As September 30, 2016, the investments of EORT are as follows:
82
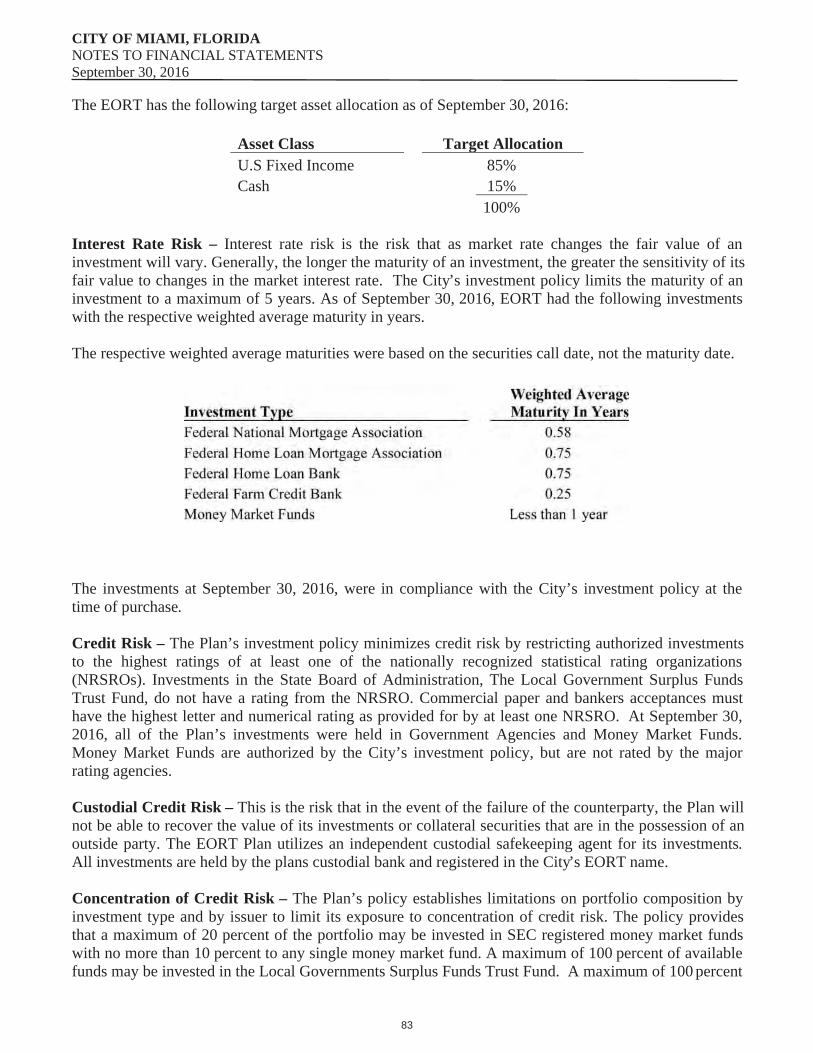
CITY OF MIAMI, FLORIDANOTES TO FINANCIAL STATEMENTSSeptember 30, 2016
The EORT has the following target asset allocation as of September 30, 2016:
Asset Class Target AllocationU.S Fixed Income 85%Cash 15%
100%
Interest Rate Risk – Interest rate risk is the risk that as market rate changes the fair value of an investment will vary. Generally, the longer the maturity of an investment, the greater the sensitivity of its fair value to changes in the market interest rate. The City’s investment policy limits the maturity of an investment to a maximum of 5 years. As of September 30, 2016, EORT had the following investments with the respective weighted average maturity in years.
The respective weighted average maturities were based on the securities call date, not the maturity date.
The investments at September 30, 2016, were in compliance with the City’s investment policy at the time of purchase.
Credit Risk – The Plan’s investment policy minimizes credit risk by restricting authorized investments to the highest ratings of at least one of the nationally recognized statistical rating organizations (NRSROs). Investments in the State Board of Administration, The Local Government Surplus Funds Trust Fund, do not have a rating from the NRSRO. Commercial paper and bankers acceptances must have the highest letter and numerical rating as provided for by at least one NRSRO. At September 30, 2016, all of the Plan’s investments were held in Government Agencies and Money Market Funds. Money Market Funds are authorized by the City’s investment policy, but are not rated by the major rating agencies.
Custodial Credit Risk – This is the risk that in the event of the failure of the counterparty, the Plan will not be able to recover the value of its investments or collateral securities that are in the possession of an outside party. The EORT Plan utilizes an independent custodial safekeeping agent for its investments. All investments are held by the plans custodial bank and registered in the City’s EORT name.
Concentration of Credit Risk – The Plan’s policy establishes limitations on portfolio composition by investment type and by issuer to limit its exposure to concentration of credit risk. The policy provides that a maximum of 20 percent of the portfolio may be invested in SEC registered money market funds with no more than 10 percent to any single money market fund. A maximum of 100 percent of available funds may be invested in the Local Governments Surplus Funds Trust Fund. A maximum of 100 percent
83
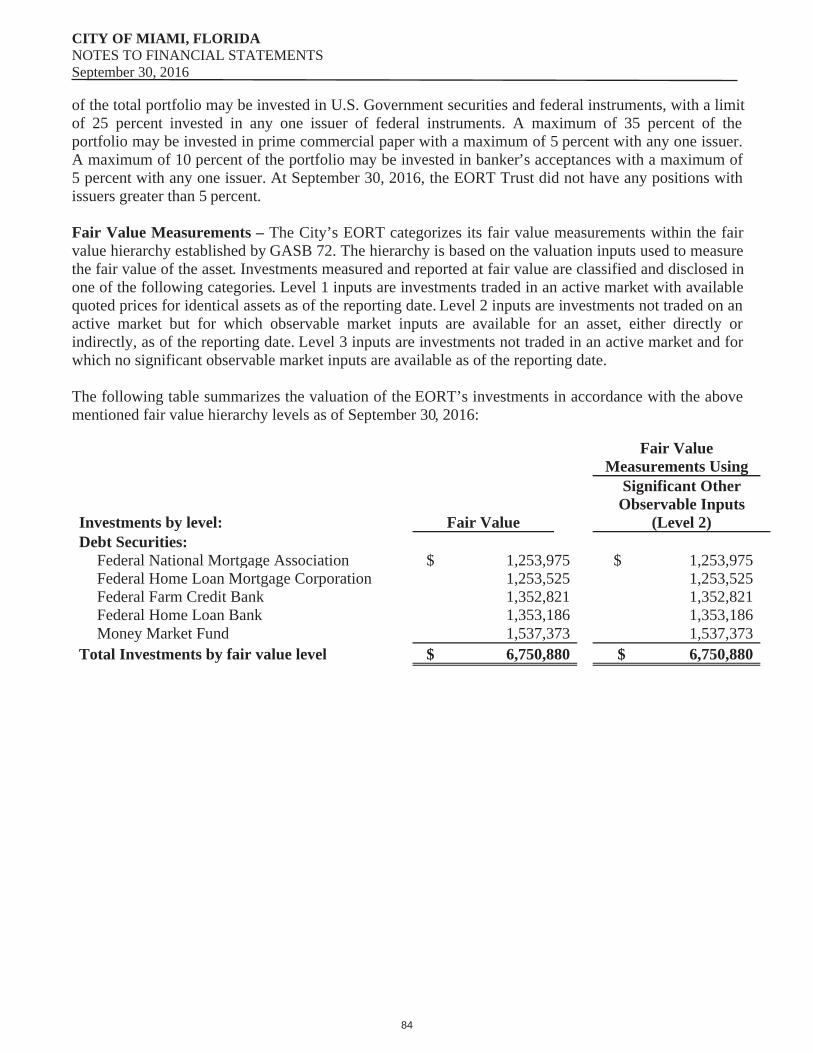
CITY OF MIAMI, FLORIDANOTES TO FINANCIAL STATEMENTSSeptember 30, 2016
of the total portfolio may be invested in U.S. Government securities and federal instruments, with a limit of 25 percent invested in any one issuer of federal instruments. A maximum of 35 percent of the portfolio may be invested in prime commercial paper with a maximum of 5 percent with any one issuer. A maximum of 10 percent of the portfolio may be invested in banker’s acceptances with a maximum of 5 percent with any one issuer. At September 30, 2016, the EORT Trust did not have any positions with issuers greater than 5 percent.
Fair Value Measurements – The City’s EORT categorizes its fair value measurements within the fair value hierarchy established by GASB 72. The hierarchy is based on the valuation inputs used to measure the fair value of the asset. Investments measured and reported at fair value are classified and disclosed in one of the following categories. Level 1 inputs are investments traded in an active market with available quoted prices for identical assets as of the reporting date. Level 2 inputs are investments not traded on an active market but for which observable market inputs are available for an asset, either directly or indirectly, as of the reporting date. Level 3 inputs are investments not traded in an active market and for which no significant observable market inputs are available as of the reporting date.
The following table summarizes the valuation of the EORT’s investments in accordance with the above mentioned fair value hierarchy levels as of September 30, 2016:
Fair Value Measurements Using
Investments by level: Fair Value
Significant Other Observable Inputs
(Level 2)Debt Securities:
Federal National Mortgage Association $ 1,253,975 $ 1,253,975 Federal Home Loan Mortgage Corporation 1,253,525 1,253,525 Federal Farm Credit Bank 1,352,821 1,352,821 Federal Home Loan Bank 1,353,186 1,353,186 Money Market Fund 1,537,373 1,537,373
Total Investments by fair value level $ 6,750,880 $ 6,750,880
84
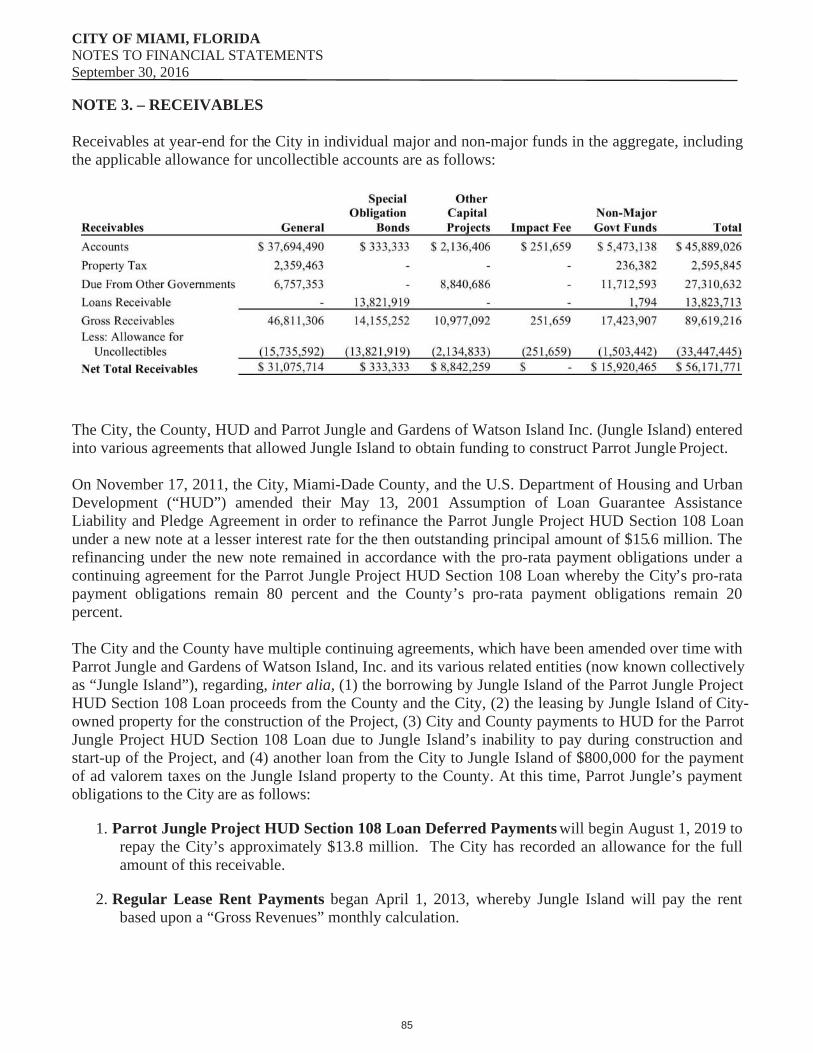
CITY OF MIAMI, FLORIDANOTES TO FINANCIAL STATEMENTSSeptember 30, 2016
NOTE 3. – RECEIVABLES
Receivables at year-end for the City in individual major and non-major funds in the aggregate, including the applicable allowance for uncollectible accounts are as follows:
The City, the County, HUD and Parrot Jungle and Gardens of Watson Island Inc. (Jungle Island) entered into various agreements that allowed Jungle Island to obtain funding to construct Parrot Jungle Project.
On November 17, 2011, the City, Miami-Dade County, and the U.S. Department of Housing and Urban Development (“HUD”) amended their May 13, 2001 Assumption of Loan Guarantee Assistance Liability and Pledge Agreement in order to refinance the Parrot Jungle Project HUD Section 108 Loan under a new note at a lesser interest rate for the then outstanding principal amount of $15.6 million. The refinancing under the new note remained in accordance with the pro-rata payment obligations under a continuing agreement for the Parrot Jungle Project HUD Section 108 Loan whereby the City’s pro-rata payment obligations remain 80 percent and the County’s pro-rata payment obligations remain 20 percent.
The City and the County have multiple continuing agreements, which have been amended over time with Parrot Jungle and Gardens of Watson Island, Inc. and its various related entities (now known collectively as “Jungle Island”), regarding, inter alia, (1) the borrowing by Jungle Island of the Parrot Jungle Project HUD Section 108 Loan proceeds from the County and the City, (2) the leasing by Jungle Island of City-owned property for the construction of the Project, (3) City and County payments to HUD for the Parrot Jungle Project HUD Section 108 Loan due to Jungle Island’s inability to pay during construction and start-up of the Project, and (4) another loan from the City to Jungle Island of $800,000 for the payment of ad valorem taxes on the Jungle Island property to the County. At this time, Parrot Jungle’s payment obligations to the City are as follows:
Parrot Jungle Project HUD Section 108 Loan Deferred Payments will begin August 1, 2019 to 1.repay the City’s approximately $13.8 million. The City has recorded an allowance for the full amount of this receivable.
Regular Lease Rent Payments began April 1, 2013, whereby Jungle Island will pay the rent 2.based upon a “Gross Revenues” monthly calculation.
85
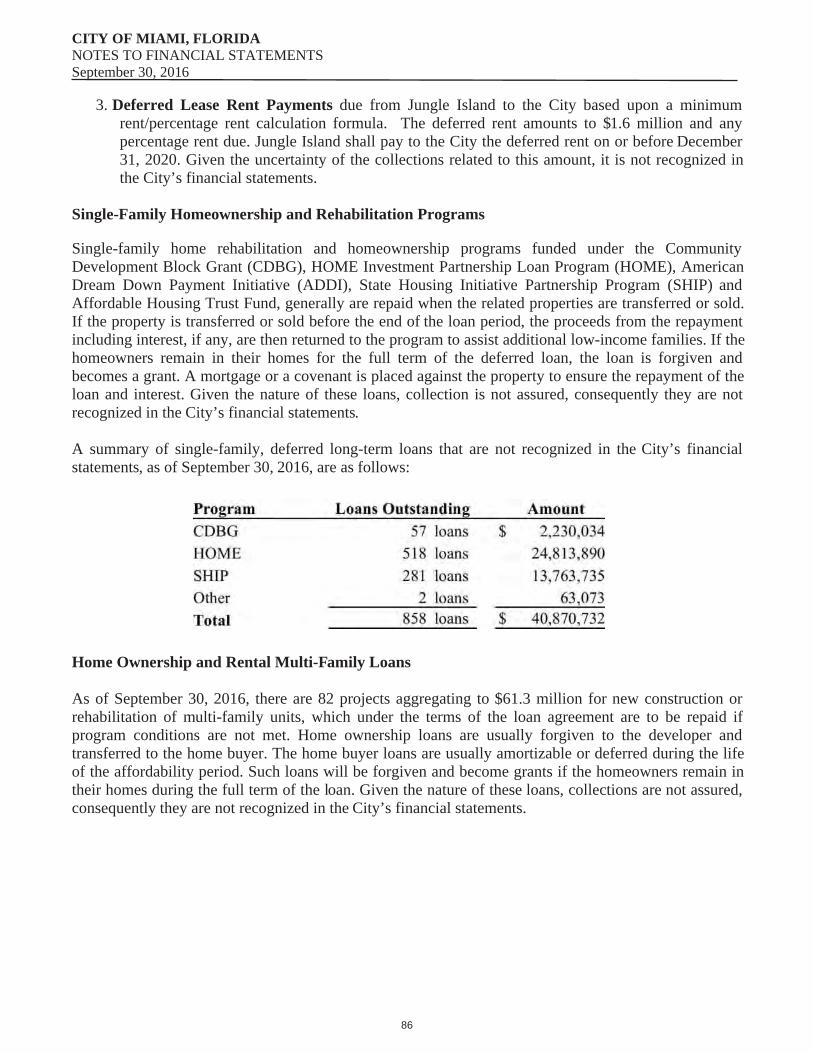
CITY OF MIAMI, FLORIDANOTES TO FINANCIAL STATEMENTSSeptember 30, 2016
Deferred Lease Rent Payments due from Jungle Island to the City based upon a minimum 3.rent/percentage rent calculation formula. The deferred rent amounts to $1.6 million and any percentage rent due. Jungle Island shall pay to the City the deferred rent on or before December 31, 2020. Given the uncertainty of the collections related to this amount, it is not recognized in the City’s financial statements.
Single-Family Homeownership and Rehabilitation Programs
Single-family home rehabilitation and homeownership programs funded under the Community Development Block Grant (CDBG), HOME Investment Partnership Loan Program (HOME), American Dream Down Payment Initiative (ADDI), State Housing Initiative Partnership Program (SHIP) and Affordable Housing Trust Fund, generally are repaid when the related properties are transferred or sold. If the property is transferred or sold before the end of the loan period, the proceeds from the repayment including interest, if any, are then returned to the program to assist additional low-income families. If the homeowners remain in their homes for the full term of the deferred loan, the loan is forgiven and becomes a grant. A mortgage or a covenant is placed against the property to ensure the repayment of the loan and interest. Given the nature of these loans, collection is not assured, consequently they are not recognized in the City’s financial statements.
A summary of single-family, deferred long-term loans that are not recognized in the City’s financial statements, as of September 30, 2016, are as follows:
Home Ownership and Rental Multi-Family Loans
As of September 30, 2016, there are 82 projects aggregating to $61.3 million for new construction or rehabilitation of multi-family units, which under the terms of the loan agreement are to be repaid if program conditions are not met. Home ownership loans are usually forgiven to the developer and transferred to the home buyer. The home buyer loans are usually amortizable or deferred during the life of the affordability period. Such loans will be forgiven and become grants if the homeowners remain in their homes during the full term of the loan. Given the nature of these loans, collections are not assured, consequently they are not recognized in the City’s financial statements.
86
CITY OF MIAMI, FLORIDANOTES TO FINANCIAL STATEMENTSSeptember 30, 2016
Economic Development Commercial Loans
As of September 30, 2016, there are 9 loans aggregating to $7.1 million for special economic development projects under the CDBG program. Those projects are collateralized by placing a mortgage against the property of the business or non-profit entity’s assets to ensure repayment of the loan and interest to the City. Some of these loans are written with no interest payment or deferred payments and are forgivable, if all program conditions are met. Given the nature of these loans, collection is not assured, consequently they are not recognized in the City’s financial statements.
NOTE 4. – PROPERTY TAXES
Property taxes are assessed according to the value determined by the Miami-Dade County Property Appraiser on January 1st of each year and are due, with discounts of one to four percent allowed if paid prior to March 1st of the following calendar year. In accordance with Florida Statute 197.122, taxes become an enforceable lien on the assessed property at this time. Taxes are levied after the millage rate is certified in September of each year. Taxpayers also have the option of paying their taxes in advance in equal quarterly payments based on the prior year's tax assessment with quarterly discounts varying between 2 percent and 4 percent. All unpaid taxes on real and personal property become delinquent on April 1st and bear interest at 18 percent until a tax sale certificate is sold at auction. The County bills and collects all property taxes for the City, and sells tax certificates for delinquent taxes.
The assessed value of property, as established by the Miami-Dade County Property Appraiser, at January 1, 2015, upon which the 2015-2016 levy was based, was $44.6 billion. The City is permitted by Article 7, Section 8 of the Florida Constitution to levy taxes up to ten dollars per $1,000 of assessed valuation for general governmental services other than the payment of principal and interest on general obligation long-term debt. In addition, unlimited amounts may be levied for the payment of principal and interest on general obligation long-term debt, subject to a limitation on the amount of debt outstanding. The tax rate to finance general governmental services (other than the payment of principal and interest on general obligation long-term debt) for the year ended September 30, 2016, was $7.6465 per $1,000. The debt service tax rate for the same period was $0.6886 per $1,000.
Property taxes receivable reported in the government-wide statement of net position and the governmental funds balance sheet represent amounts due for unpaid delinquent property taxes at September 30, 2016. Property taxes that are not considered “available” have been reported as deferred inflows in the governmental funds balance sheet.
87
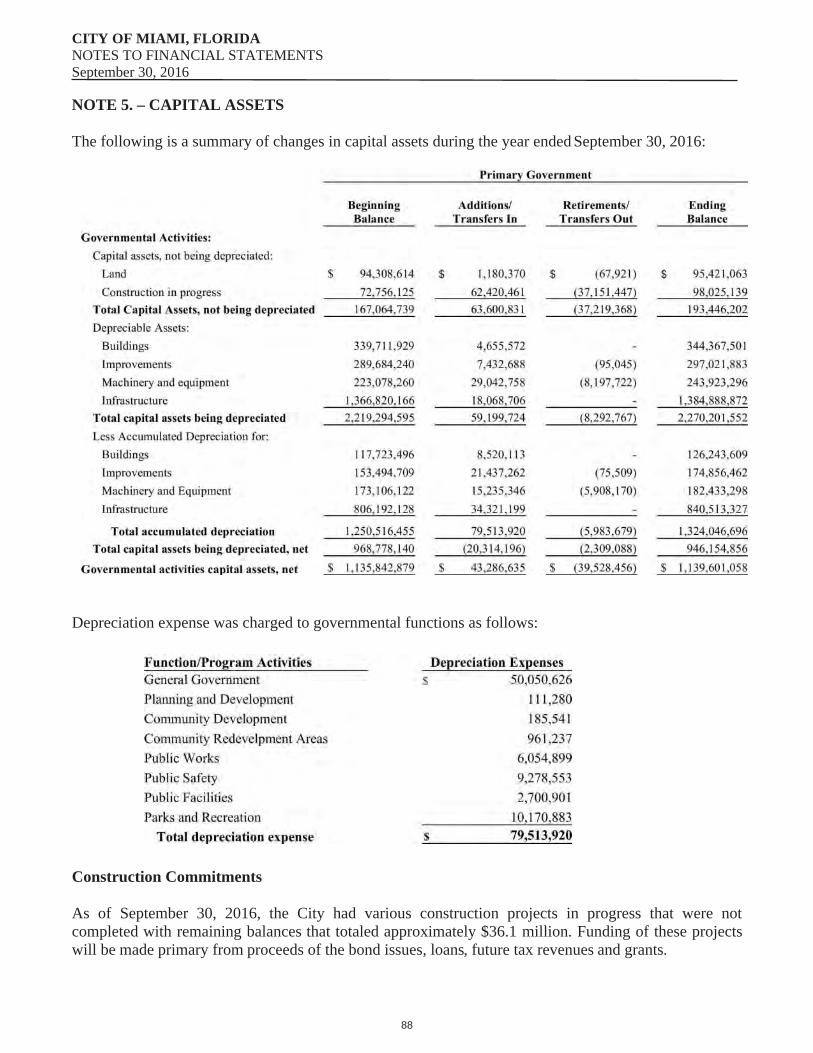
CITY OF MIAMI, FLORIDANOTES TO FINANCIAL STATEMENTSSeptember 30, 2016
NOTE 5. – CAPITAL ASSETS
The following is a summary of changes in capital assets during the year ended September 30, 2016:
Depreciation expense was charged to governmental functions as follows:
Construction Commitments
As of September 30, 2016, the City had various construction projects in progress that were not completed with remaining balances that totaled approximately $36.1 million. Funding of these projects will be made primary from proceeds of the bond issues, loans, future tax revenues and grants.
88
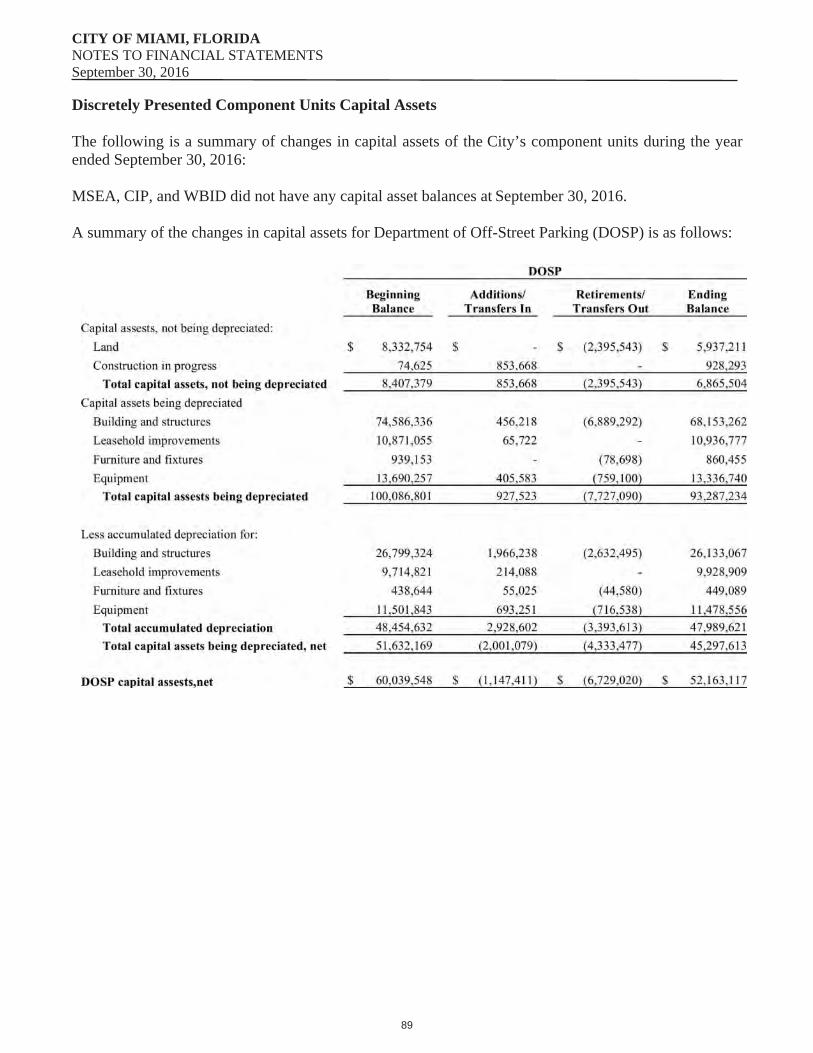
CITY OF MIAMI, FLORIDANOTES TO FINANCIAL STATEMENTSSeptember 30, 2016
Discretely Presented Component Units Capital Assets
The following is a summary of changes in capital assets of the City’s component units during the year ended September 30, 2016:
MSEA, CIP, and WBID did not have any capital asset balances at September 30, 2016.
A summary of the changes in capital assets for Department of Off-Street Parking (DOSP) is as follows:
89

CITY OF MIAMI, FLORIDANOTES TO FINANCIAL STATEMENTSSeptember 30, 2016
A summary of the changes in capital assets for Downtown Development Authority (DDA) is as follows:
A summary of changes in capital assets for Bayfront Park Management Trust (BFP) is as follows:
90
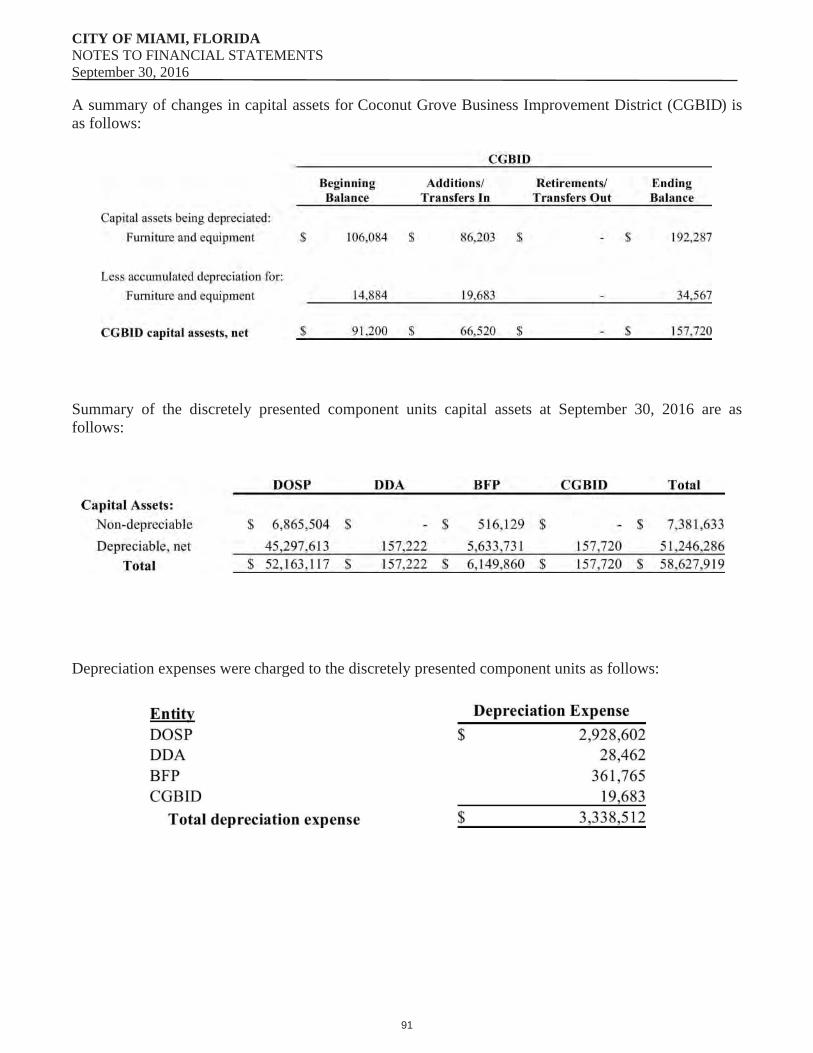
CITY OF MIAMI, FLORIDANOTES TO FINANCIAL STATEMENTSSeptember 30, 2016
A summary of changes in capital assets for Coconut Grove Business Improvement District (CGBID) is as follows:
Summary of the discretely presented component units capital assets at September 30, 2016 are as follows:
Depreciation expenses were charged to the discretely presented component units as follows:
91
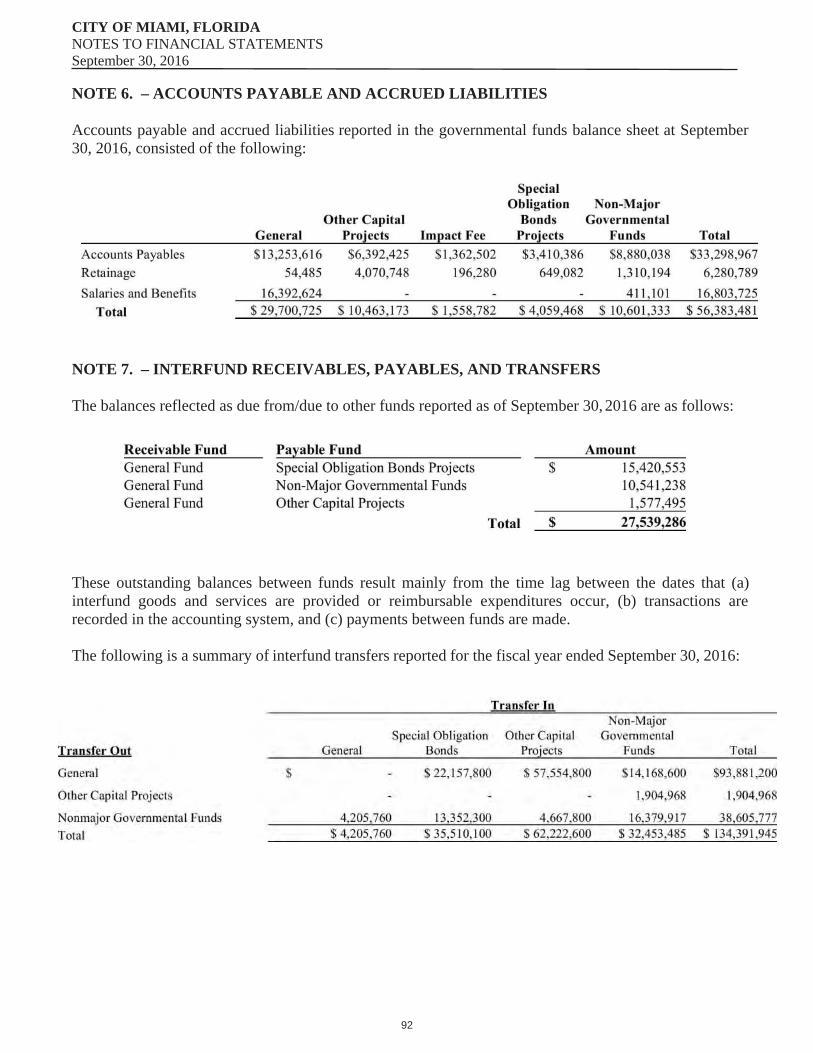
CITY OF MIAMI, FLORIDANOTES TO FINANCIAL STATEMENTSSeptember 30, 2016
NOTE 6. – ACCOUNTS PAYABLE AND ACCRUED LIABILITIES
Accounts payable and accrued liabilities reported in the governmental funds balance sheet at September 30, 2016, consisted of the following:
NOTE 7. – INTERFUND RECEIVABLES, PAYABLES, AND TRANSFERS
The balances reflected as due from/due to other funds reported as of September 30, 2016 are as follows:
These outstanding balances between funds result mainly from the time lag between the dates that (a) interfund goods and services are provided or reimbursable expenditures occur, (b) transactions are recorded in the accounting system, and (c) payments between funds are made.
The following is a summary of interfund transfers reported for the fiscal year ended September 30, 2016:
92
CITY OF MIAMI, FLORIDANOTES TO FINANCIAL STATEMENTSSeptember 30, 2016
Transfers are used to (a) move revenues from the fund that statute or budget requires to collect them to the fund that statute or budget requires to expend them, (b) move receipts restricted for debt service from the funds collecting the receipts to the debt service fund as debt service payments become due, and (c) move unrestricted revenues collected in the general and public services tax funds to finance various programs accounted for in other funds in accordance with budgetary authorizations.
During the fiscal year, transfers from the General fund to other funds totaled $93.8 million. This total was comprised of transfers of $22.1 million for Special Obligation Bonds (SOB) Debt Service payments, $57.5 million for Other Capital Projects fund and $14.1 million for other Non-Major Governmental Funds.
The $22.1 million transferred into the Special Obligations Fund for the payment of debt services includes funds from the Public Service Tax, Parking Surcharge, and Local Option Fuel Tax. Payments for debt service are an allowable use of such revenue. This amount also includes $2.3 million contribution from the General fund to pay for Vehicle Lease debt service.
The $57.5 million transferred for Other Capital Projects were from unrestricted sources for various capital improvement projects, including $20.3 million for Parks’ projects, $13.5 million for General Government, $7.5 million for capital improvements to public facilities, $7.3 million for Public Safety, $3.1 million for Storm Sewers, $2.7 million for the purchase Solid Waste trucks and $2.7 million for Streets and Sidewalks.
The $14.1 million transferred to other Non-Major funds were from unrestricted sources from the General Fund to other City funds for various departmental initiatives including $6.2 million for Departmental Improvement Initiatives, $3.6 million for Police E911 operations, $1.3 million for Public Facilities, $1.2 million for Fire, $0.8 million for Community and Economic Development and $0.6 million for Homeless programs.
Also included in this fiscal year’s transfers is $38.6 million from Non-Major Governmental Funds. This total was comprised of $4.2 million to the General Fund, $13.3 million to SOB Debt Service Funds, $4.6 million to Other Capital Projects and $16.3 million to Other Non-Major Governmental Funds.
The $4.2 million consists primarily of $1.9 million contribution from the J L Knight Center, $0.6 million transfer from CDBG Program Income resulting from a settlement agreement, $1.2 million from the OMNI and SEOPW Community Redevelopment Agencies for the enhancement of Police services and $0.4 million from CRA SEOPW to Gibson Park.
The $13.3 million transferred into SOB Debt Service includes $6.1 million contribution from Transportation and Transit to Streets Bonds payments, $4.2 million from OMNI Community Redevelopment Agency for the Port Tunnel, and $2.9 million for Marlins Garage contribution to SOB debt.
The $4.6 million to Other Capital Projects include $3.1 million contribution from Lane Closure Funds to Streets and Sidewalks Capital Projects.
The $16.3 million includes $7.7 transfer from the SEOPW CRA Special Revenue fund for the payment of CRA SEOPW Bonds Debt Service and $7.8 from the Transportation and Transit Special Revenue to the Transportation and Transit Capital Fund.
93
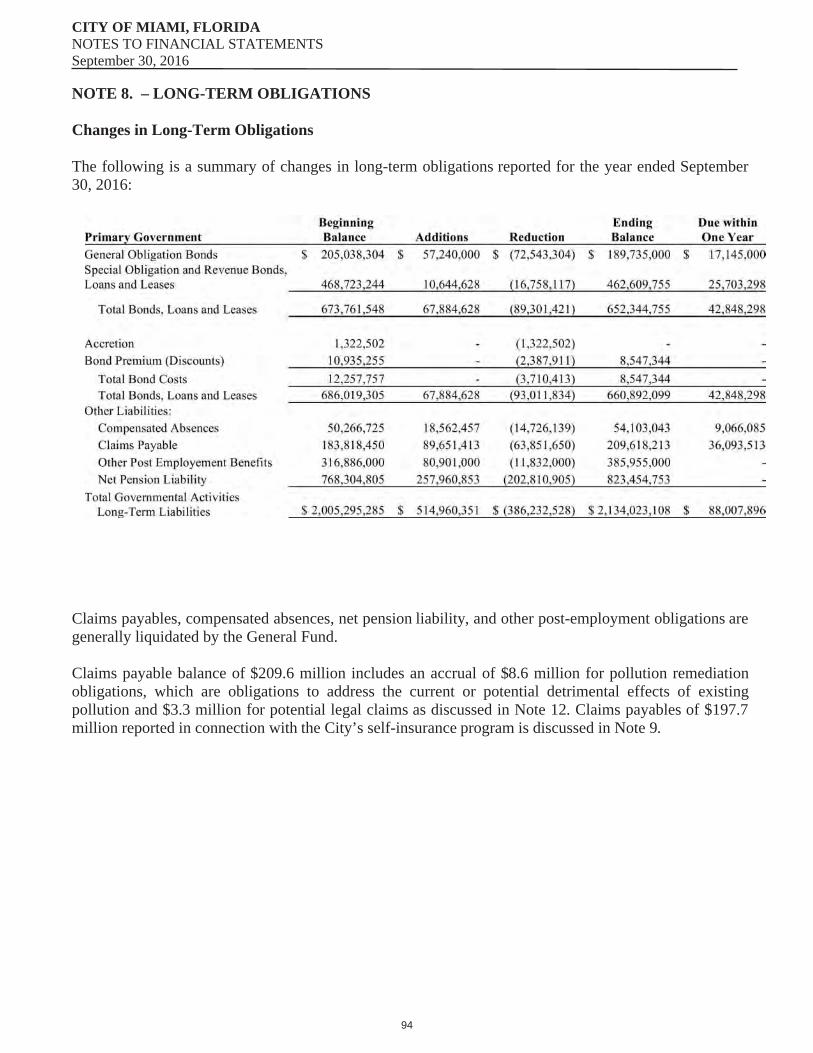
CITY OF MIAMI, FLORIDANOTES TO FINANCIAL STATEMENTSSeptember 30, 2016
NOTE 8. – LONG-TERM OBLIGATIONS
Changes in Long-Term Obligations
The following is a summary of changes in long-term obligations reported for the year ended September 30, 2016:
Claims payables, compensated absences, net pension liability, and other post-employment obligations are generally liquidated by the General Fund.
Claims payable balance of $209.6 million includes an accrual of $8.6 million for pollution remediation obligations, which are obligations to address the current or potential detrimental effects of existing pollution and $3.3 million for potential legal claims as discussed in Note 12. Claims payables of $197.7 million reported in connection with the City’s self-insurance program is discussed in Note 9.
94
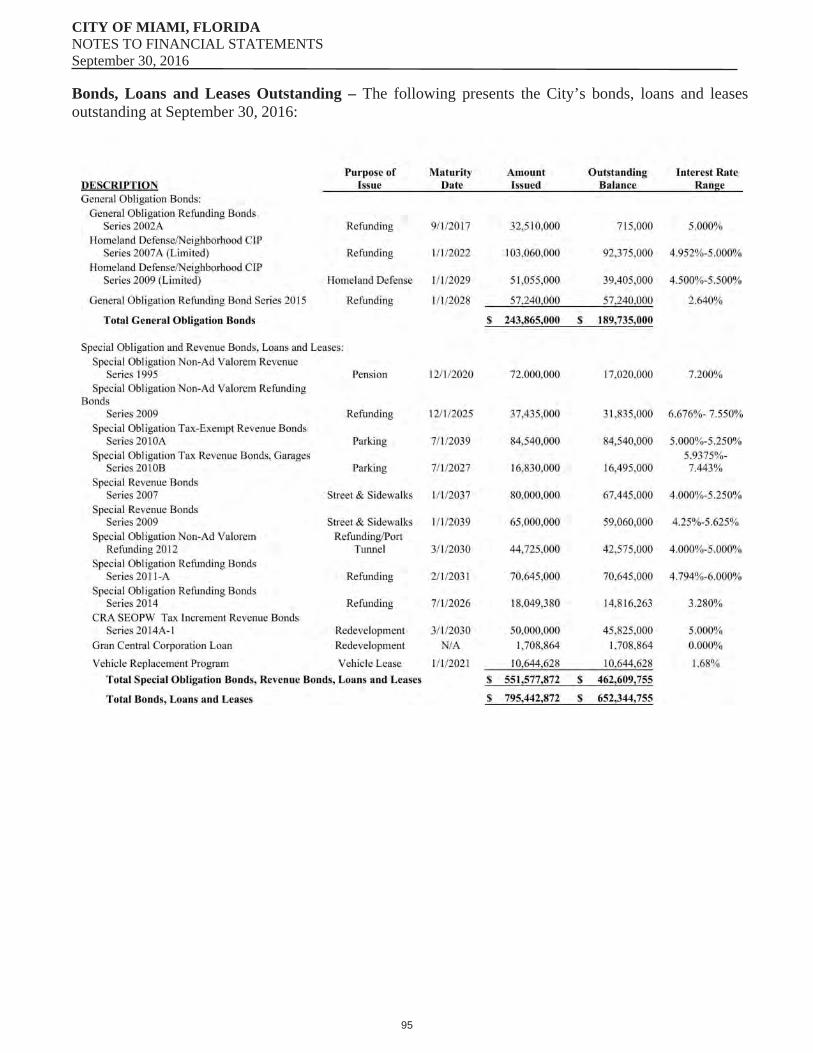
CITY OF MIAMI, FLORIDANOTES TO FINANCIAL STATEMENTSSeptember 30, 2016
Bonds, Loans and Leases Outstanding – The following presents the City’s bonds, loans and leases outstanding at September 30, 2016:
95
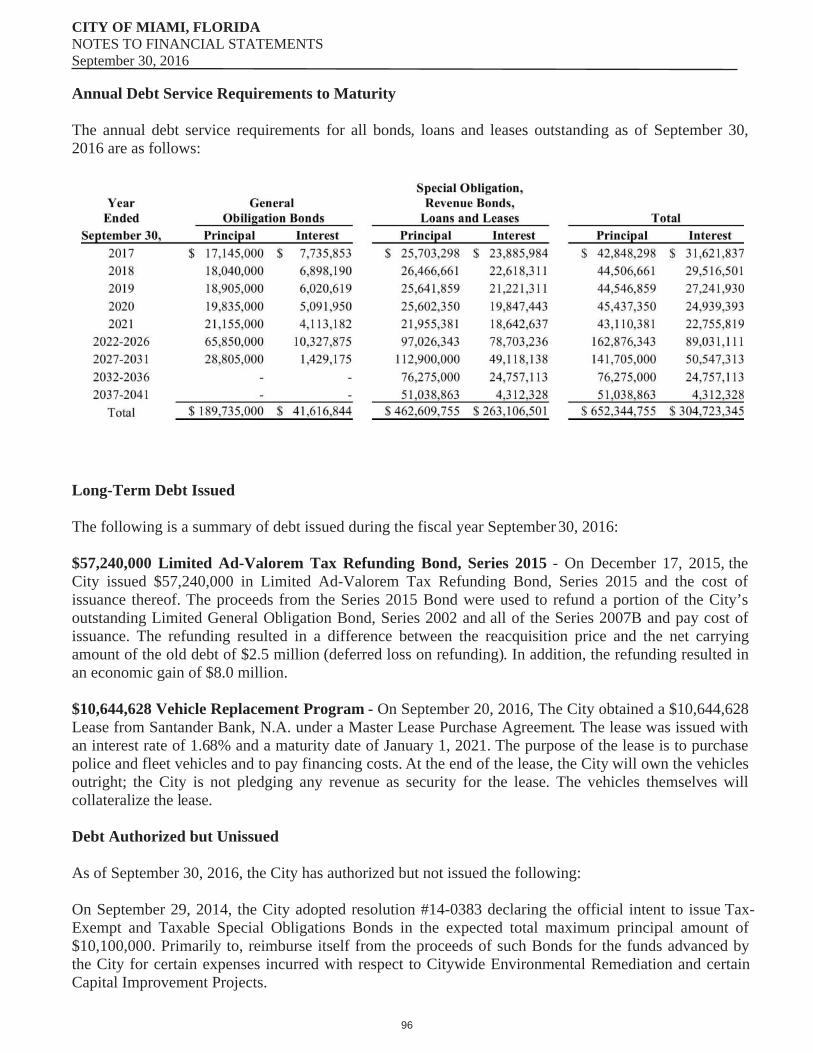
CITY OF MIAMI, FLORIDANOTES TO FINANCIAL STATEMENTSSeptember 30, 2016
Annual Debt Service Requirements to Maturity
The annual debt service requirements for all bonds, loans and leases outstanding as of September 30, 2016 are as follows:
Long-Term Debt Issued
The following is a summary of debt issued during the fiscal year September 30, 2016:
$57,240,000 Limited Ad-Valorem Tax Refunding Bond, Series 2015 - On December 17, 2015, the City issued $57,240,000 in Limited Ad-Valorem Tax Refunding Bond, Series 2015 and the cost of issuance thereof. The proceeds from the Series 2015 Bond were used to refund a portion of the City’s outstanding Limited General Obligation Bond, Series 2002 and all of the Series 2007B and pay cost of issuance. The refunding resulted in a difference between the reacquisition price and the net carrying amount of the old debt of $2.5 million (deferred loss on refunding). In addition, the refunding resulted in an economic gain of $8.0 million.
$10,644,628 Vehicle Replacement Program - On September 20, 2016, The City obtained a $10,644,628 Lease from Santander Bank, N.A. under a Master Lease Purchase Agreement. The lease was issued with an interest rate of 1.68% and a maturity date of January 1, 2021. The purpose of the lease is to purchase police and fleet vehicles and to pay financing costs. At the end of the lease, the City will own the vehicles outright; the City is not pledging any revenue as security for the lease. The vehicles themselves will collateralize the lease.
Debt Authorized but Unissued
As of September 30, 2016, the City has authorized but not issued the following:
On September 29, 2014, the City adopted resolution #14-0383 declaring the official intent to issue Tax-Exempt and Taxable Special Obligations Bonds in the expected total maximum principal amount of $10,100,000. Primarily to, reimburse itself from the proceeds of such Bonds for the funds advanced by the City for certain expenses incurred with respect to Citywide Environmental Remediation and certain Capital Improvement Projects.
96

CITY OF MIAMI, FLORIDANOTES TO FINANCIAL STATEMENTSSeptember 30, 2016
On January 8, 2015, the City adopted resolution #15-0008 declaring the official intent to issue Tax-Exempt and Taxable Special Obligations Bonds in the expected total maximum principal amount of $16,000,000. Primarily to, reimburse itself from the proceeds of such Bonds for the funds advanced by the City for certain expenses incurred with respect to Capital Improvement Projects for the areas surrounding the Miami Marine Stadium.
On July 9, 2015, the City adopted resolution #15-0304 approving a design and construction loan to the City of Miami for an amount not to exceed $22,413,800 from the State of Florida Department of Environmental Protection Clean Water State Revolving Fund Program for the Wagner Creek Seybold Canal Project.
Capital Lease Obligations
The City has entered into an agreement as lessee for financing the acquisition of police and fleet vehicles valued at $10,644,628. The lease agreement qualifies as a capital lease for accounting purposes and, therefore, have been recorded at the present value of their future minimum lease payments as of the inception date. At year end the cost and accumulated depreciation of assets under lease were $10,644,628 and $732,934 respectively.
The following is a schedule showing the future minimum lease payments under capital lease by years and the present value of the minimum lease payments as of September 30, 2016:
Year Ending September 30,2017 $ 2,242,274 2018 2,228,644 2019 2,210,865 2020 2,192,936 2021 2,174,856 Total minimum lease payments $ 11,049,575 Less: Amount representing interest (404,947)Present Value of minimum lease payments $ 10,644,628
97
CITY OF MIAMI, FLORIDANOTES TO FINANCIAL STATEMENTSSeptember 30, 2016
Synopsis of Bond Covenants
Debt service for general obligation bonds is provided for by a tax levy on non-exempt property value. The total general obligation debt outstanding is limited by the City Charter to 15 percent of the assessed non-exempt property value. At September 30, 2016, the statutory debt limitation of assessed non-exempt property value for the City amounted to $6.4 billion providing a debt margin of $6.2 billion after consideration of $189.7 million of general obligation bonds outstanding at September 30, 2016 and adjusted for the fund balance of $3.4 million in the related Debt Service Fund.
Special Obligation debt of the City for which no revenue is pledged is collateralized by covenants to budget and appropriate non-ad-valorem revenues, and tax increment revenue in accordance with their bond indentures. The bond indentures require that sufficient funds be available in the sinking fund to meet the annual debt service requirements. At September 30, 2016, the City had approximately $41.0 million available in the sinking fund to meet this requirement. Principal and interest to be paid in subsequent years totals $317.2 million on all other Special Obligation debt of the City.
Pledged Revenue
The City pledged future revenue proceeds of (i) 80 percent Transportation Taxes, (ii) 100 percent new Local Option Gas Taxes, and (iii) 20 percent of the City’s Parking Surcharge to repay $80 million in Special Obligation Revenue Bonds, Series 2007 and $65 million Special Obligation Revenue Bonds, Series 2009. The proceeds from the bonds were used for the improvement of streets, sidewalks and drainage within the City. Those bonds are payable solely from the pledged revenues listed above through January 1, 2039. Principal and interest paid for the current year were $2.9 million and $6.6 million respectively. The current year pledged revenues were (i) $12.6 million (ii) $7.1 million and (iii) $4.2 million respectively. Principal and interest to be paid in subsequent years totals $109.7 million on the Series 2007 bonds and $108.9 million on the Series 2009 bonds.
The City further pledged future revenue proceeds of (i) 100 percent Convention Development Taxes, (ii) Parking Revenues in connection with MLB Home Games at the Miami Marlins Baseball Stadium, and (iii) Parking Surcharge revenues on the Parking Revenues to repay $84.5 million Tax-Exempt Special Obligation Parking Revenue Bonds, Series 2010A and $16.8 million Taxable Special Obligation Parking Revenue Bonds, Series 2010B. The proceeds from the bonds were used for the construction of the parking facilities for the Miami Marlins Baseball Stadium. The bonds are payable solely from the pledged revenues listed above through July 1, 2039. Debt service payments began on January 1, 2012. Principal and interest to be paid in subsequent years totals $163.8 million on the Series 2010A bonds and $26.0 million on the Series 2010B bonds. Principal payments commenced in fiscal year 2016. The total pledge revenue collected during the year was approximately $9.2 million and total principal and interest payments during the year were 0.3 million and $5.6 million.
Escrow Agreement
On March 17, 1997, an agreement was entered into by and among an Escrow Agent, the Oversight Board, acting through its committee (Fiscal Sufficiency Advisory Board), and the City. The agreement directs the Escrow Agent to establish two escrow accounts, and maintain appropriate balances to ensure the timely payment of debt service on certain outstanding bonds issued prior to 1997 and other debt obligations with no third party trustee.
98
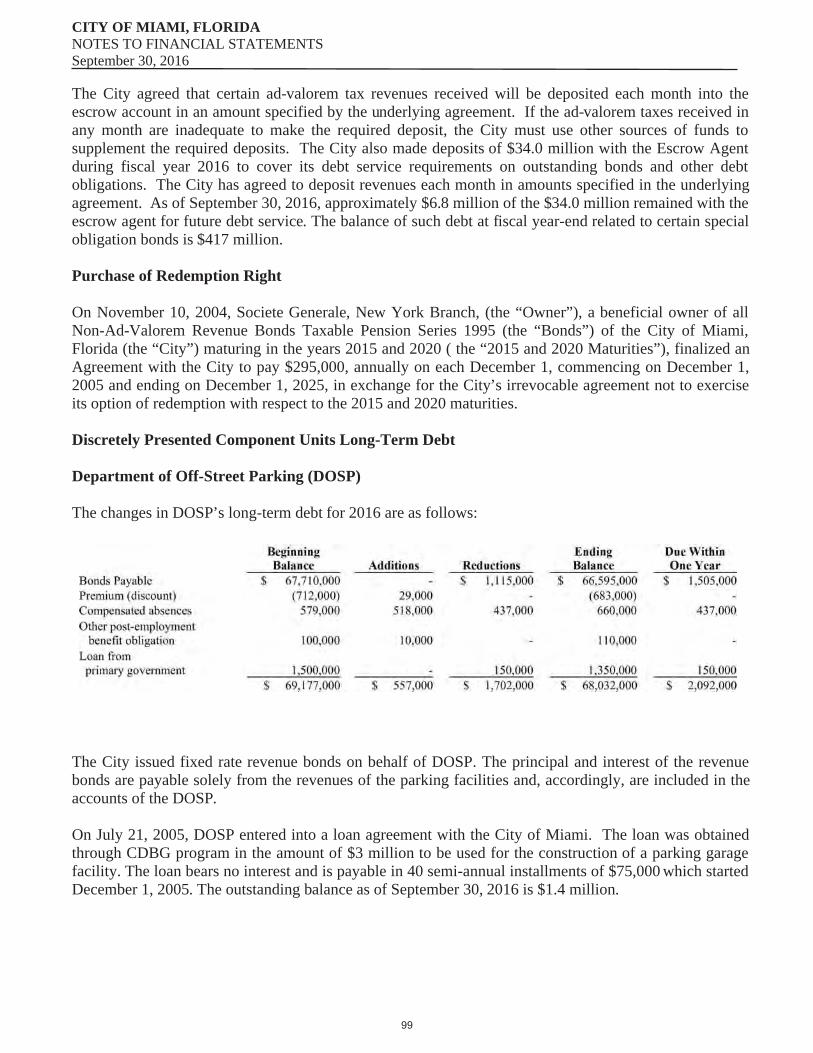
CITY OF MIAMI, FLORIDANOTES TO FINANCIAL STATEMENTSSeptember 30, 2016
The City agreed that certain ad-valorem tax revenues received will be deposited each month into the escrow account in an amount specified by the underlying agreement. If the ad-valorem taxes received in any month are inadequate to make the required deposit, the City must use other sources of funds to supplement the required deposits. The City also made deposits of $34.0 million with the Escrow Agent during fiscal year 2016 to cover its debt service requirements on outstanding bonds and other debt obligations. The City has agreed to deposit revenues each month in amounts specified in the underlying agreement. As of September 30, 2016, approximately $6.8 million of the $34.0 million remained with the escrow agent for future debt service. The balance of such debt at fiscal year-end related to certain special obligation bonds is $417 million.
Purchase of Redemption Right
On November 10, 2004, Societe Generale, New York Branch, (the “Owner”), a beneficial owner of all Non-Ad-Valorem Revenue Bonds Taxable Pension Series 1995 (the “Bonds”) of the City of Miami, Florida (the “City”) maturing in the years 2015 and 2020 ( the “2015 and 2020 Maturities”), finalized an Agreement with the City to pay $295,000, annually on each December 1, commencing on December 1, 2005 and ending on December 1, 2025, in exchange for the City’s irrevocable agreement not to exercise its option of redemption with respect to the 2015 and 2020 maturities.
Discretely Presented Component Units Long-Term Debt
Department of Off-Street Parking (DOSP)
The changes in DOSP’s long-term debt for 2016 are as follows:
The City issued fixed rate revenue bonds on behalf of DOSP. The principal and interest of the revenue bonds are payable solely from the revenues of the parking facilities and, accordingly, are included in the accounts of the DOSP.
On July 21, 2005, DOSP entered into a loan agreement with the City of Miami. The loan was obtained through CDBG program in the amount of $3 million to be used for the construction of a parking garage facility. The loan bears no interest and is payable in 40 semi-annual installments of $75,000 which started December 1, 2005. The outstanding balance as of September 30, 2016 is $1.4 million.
99
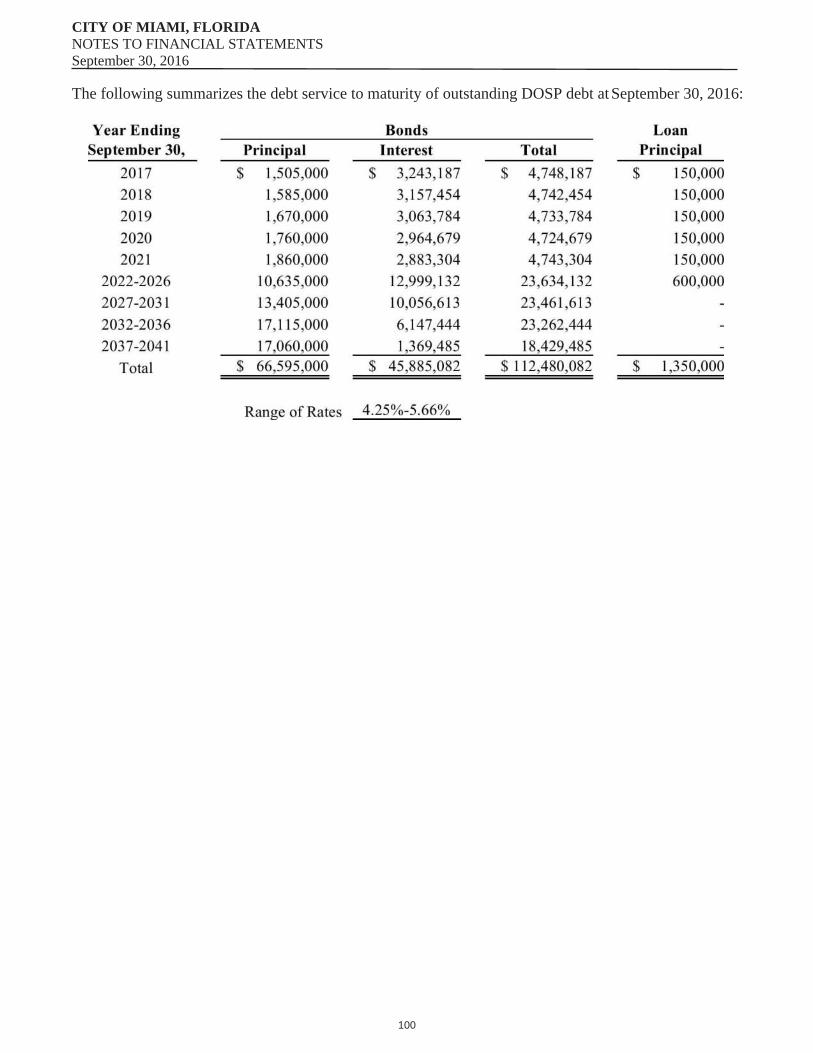
CITY OF MIAMI, FLORIDANOTES TO FINANCIAL STATEMENTSSeptember 30, 2016
The following summarizes the debt service to maturity of outstanding DOSP debt at September 30, 2016:
100
CITY OF MIAMI, FLORIDANOTES TO FINANCIAL STATEMENTSSeptember 30, 2016
NOTE 9. – RISK MANAGEMENT SELF-INSURANCE
Risk Management- Self Insurance A.
Section 768.28, Florida Statute, provides for waiver of sovereign immunity in tort actions or claims against the state and its agencies and subdivisions. The present statutory limit of recovery in the absence of special relief granted by the Florida legislature is $200,000 per person and $300,000 per incident. Under the protection of this sovereign immunity limit, Florida Statutes 768.28 and Chapter 440, Florida Statutes covering Workers’ Compensation, the City has established a self-insured program to provide coverage for almost all areas of liability including workers’ compensation, general liability, automotive liability, police professional liability, public officials’ liability, and employment practices liability. The City also purchases excess insurance coverage to limit catastrophic losses associated with its liability exposures. The excess liability insurance program provides for $20 million in total limits. The excess insurance program currently has a self-insured retention of $750,000 per occurrence for workers’ compensation, and $500,000 for all other liability coverage. The City also purchases dedicated commercial general liability policies for the Grapeland Waterpark, Bayfront Park, and the various marinas that it operates. These policies typically carry a $1 million limit per occurrence and on an aggregate basis.
The City’s master property insurance program provides for a total of $135 million in insurance limits. The City’s total insured value is $511 million. Included in this amount is $35 million for named windstorm and flood coverage. With the exception of earthquake, flood and named windstorm, the all-other-perils deductible is $50,000 per occurrence. In regard to the named windstorm, flood, and earthquake exposures, the deductible is 5 percent of the value of the affected location subject to a minimum of $250,000 for any one occurrence, and $7.5 million aggregate loss.
The City also maintains separate property insurance programs for the James L. Knight Center and the Marlins Stadium parking garages. The James L. Knight Center property program provides $46.4 million in limits for all perils including windstorm and flood. The James L. Knight Center property program has a $50,000 all other perils deductible, and a deductible of 5 percent of total insured values at time of loss, with a $1 million minimum for named windstorm and flood perils. The Marlins Stadium parking garage program provides for $25 million in total limits for windstorm and flood, and for $81.2 million for all other perils. The Marlins Stadium parking garage program has a $25,000 all other perils deductible, and a deductible of 5 percent of total insured values at time of loss, with a $100,000 minimum per location for named windstorm and flood perils.
The payment of losses within the self-insured retention level are made from the General Fund. Claims are being predominantly adjusted by a third party administrator. Claims expenditures and liabilities are reported when it is probable that a loss has occurred and the amount of that loss can be reasonably estimated. The budgeting process utilizes information developed in the previous year’s actuarial report in addition to historical information and specific knowledge on the status of claims and litigations.
The City provides group health benefits for its active employees, retirees, and their dependents through a fully self-funded health insurance program. The City is currently contributing approximately 87 percent, while the employees are contributing 13 percent of the insurance premium. The City is currently contributing approximately 8 percent of the premium cost for non-Medicare eligible retirees and approximately 38 percent for Medicare eligible retirees. To limit catastrophic losses, the City is currently purchasing specific stop loss coverage for claims in excess of $250,000. In Addition to specific excess coverage, the City carries annual aggregate excess coverage of approximately $51 million.
101
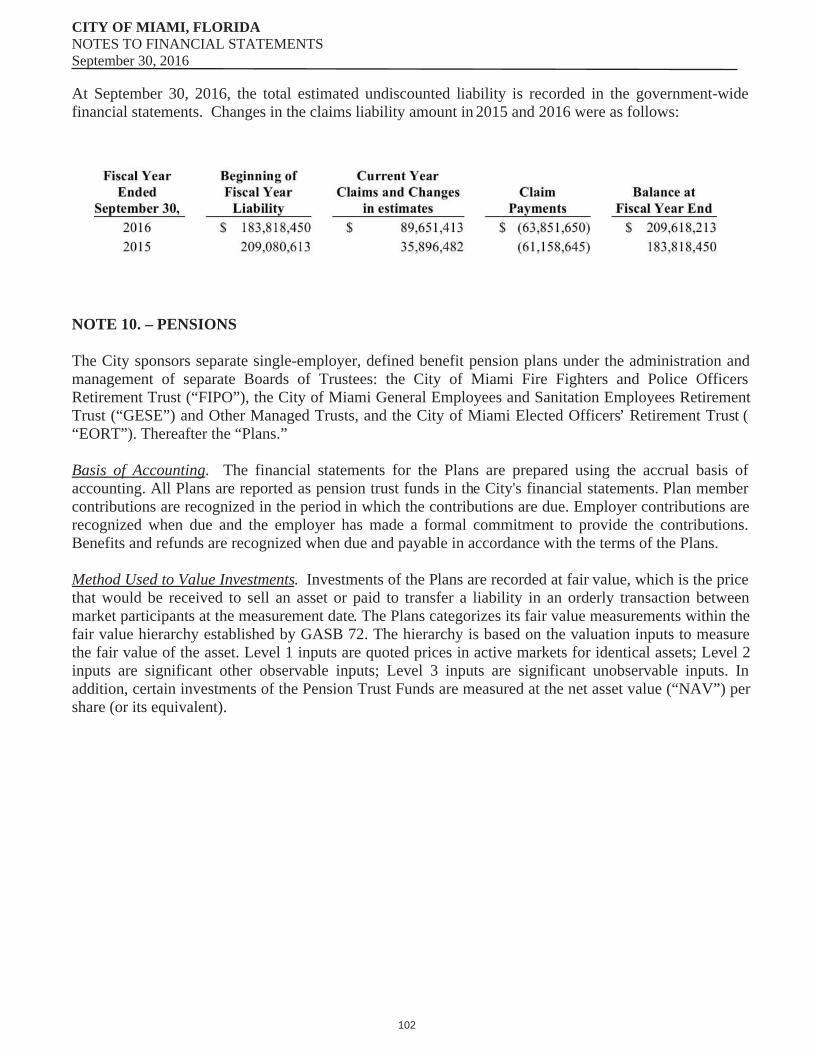
CITY OF MIAMI, FLORIDANOTES TO FINANCIAL STATEMENTSSeptember 30, 2016
At September 30, 2016, the total estimated undiscounted liability is recorded in the government-wide financial statements. Changes in the claims liability amount in 2015 and 2016 were as follows:
NOTE 10. – PENSIONS
The City sponsors separate single-employer, defined benefit pension plans under the administration and management of separate Boards of Trustees: the City of Miami Fire Fighters and Police Officers Retirement Trust (“FIPO”), the City of Miami General Employees and Sanitation Employees Retirement Trust (“GESE”) and Other Managed Trusts, and the City of Miami Elected Officers’ Retirement Trust (“EORT”). Thereafter the “Plans.”
Basis of Accounting. The financial statements for the Plans are prepared using the accrual basis of accounting. All Plans are reported as pension trust funds in the City's financial statements. Plan member contributions are recognized in the period in which the contributions are due. Employer contributions are recognized when due and the employer has made a formal commitment to provide the contributions. Benefits and refunds are recognized when due and payable in accordance with the terms of the Plans.
Method Used to Value Investments. Investments of the Plans are recorded at fair value, which is the price that would be received to sell an asset or paid to transfer a liability in an orderly transaction between market participants at the measurement date. The Plans categorizes its fair value measurements within the fair value hierarchy established by GASB 72. The hierarchy is based on the valuation inputs to measure the fair value of the asset. Level 1 inputs are quoted prices in active markets for identical assets; Level 2 inputs are significant other observable inputs; Level 3 inputs are significant unobservable inputs. In addition, certain investments of the Pension Trust Funds are measured at the net asset value (“NAV”) per share (or its equivalent).
102
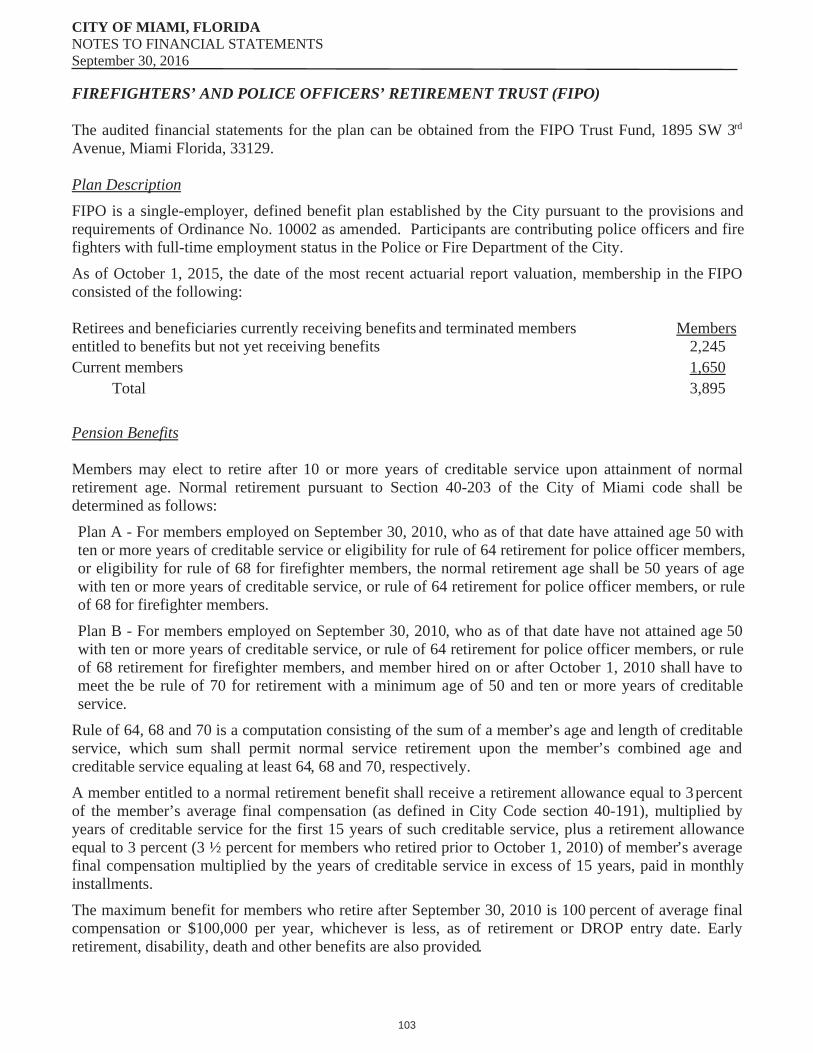
CITY OF MIAMI, FLORIDANOTES TO FINANCIAL STATEMENTSSeptember 30, 2016
FIREFIGHTERS’ AND POLICE OFFICERS’ RETIREMENT TRUST (FIPO)
The audited financial statements for the plan can be obtained from the FIPO Trust Fund, 1895 SW 3rd
Avenue, Miami Florida, 33129.
Plan DescriptionFIPO is a single-employer, defined benefit plan established by the City pursuant to the provisions and requirements of Ordinance No. 10002 as amended. Participants are contributing police officers and fire fighters with full-time employment status in the Police or Fire Department of the City.As of October 1, 2015, the date of the most recent actuarial report valuation, membership in the FIPO consisted of the following:
Retirees and beneficiaries currently receiving benefits and terminated members Membersentitled to benefits but not yet receiving benefits 2,245Current members 1,650
Total 3,895
Pension Benefits
Members may elect to retire after 10 or more years of creditable service upon attainment of normal retirement age. Normal retirement pursuant to Section 40-203 of the City of Miami code shall be determined as follows:Plan A - For members employed on September 30, 2010, who as of that date have attained age 50 with ten or more years of creditable service or eligibility for rule of 64 retirement for police officer members, or eligibility for rule of 68 for firefighter members, the normal retirement age shall be 50 years of age with ten or more years of creditable service, or rule of 64 retirement for police officer members, or rule of 68 for firefighter members.Plan B - For members employed on September 30, 2010, who as of that date have not attained age 50 with ten or more years of creditable service, or rule of 64 retirement for police officer members, or rule of 68 retirement for firefighter members, and member hired on or after October 1, 2010 shall have to meet the be rule of 70 for retirement with a minimum age of 50 and ten or more years of creditable service.
Rule of 64, 68 and 70 is a computation consisting of the sum of a member’s age and length of creditable service, which sum shall permit normal service retirement upon the member’s combined age and creditable service equaling at least 64, 68 and 70, respectively.A member entitled to a normal retirement benefit shall receive a retirement allowance equal to 3 percent of the member’s average final compensation (as defined in City Code section 40-191), multiplied by years of creditable service for the first 15 years of such creditable service, plus a retirement allowance equal to 3 percent (3 ½ percent for members who retired prior to October 1, 2010) of member’s average final compensation multiplied by the years of creditable service in excess of 15 years, paid in monthly installments.The maximum benefit for members who retire after September 30, 2010 is 100 percent of average final compensation or $100,000 per year, whichever is less, as of retirement or DROP entry date. Early retirement, disability, death and other benefits are also provided.
103

CITY OF MIAMI, FLORIDANOTES TO FINANCIAL STATEMENTSSeptember 30, 2016
Cost of Living AdjustmentEffective January 9, 1994, the FIPO Trust entered into an agreement with the City with regards to the funding methods, employee benefits, employee contributions and retiree cost of living adjustment (“COLA”). Pursuant to the agreement, members no longer contribute to the original COLA account (“COLA I”) and a new COLA account (“COLA II”) was established. The agreement included the following: (a) the funding method was changed to an aggregate cost method; (b) all accounts were combined for investment purposes (membership and benefits, COLA I, and COLA II); (c) retirees receive additional COLA benefits; and (d) active members no longer contribute 2 percent of pretax earnings to fund the original retiree COLA I account.The COLA II account is funded annually by a percentage of the excess investment return from the COLA I account assets. The excess earnings contributed to the COLA II account are used to fund a minimum annual payment of $2.5 million, increasing by 4 percent compounded annually. To the extent necessary, the City will fund the portion of the minimum annual payment not funded by the annual excess earnings no later than January 1 of the following year. For the year ended September 30, 2016, approximately $5.9 million was funded by the City. Benefits payable from the COLA accounts are computed in accordance with an actuarially based formula as defined in Section 40.204 of the City of Miami Code.
Deferred Retirement Option Plan (DROP)
Members who are eligible for service retirement or Rule of 64 Retirement after September 1998 may elect to enter the deferred retirement option plan (the “DROP”). Upon election of participation, a member's creditable service, accrued benefits, and compensation calculation are frozen and the DROP payment is based on the member's average final compensation. The member's contribution and the City contribution to the retirement plan for that member ceases as no further service credit is earned. The member does not acquire additional pension credit for the purposes of the pension plan, but may continue City employment for a maximum of 36 months prior to October 1, 2001. Effective October 1, 2001, maximum participation in the DROP for firefighters shall be 48 full months and for police officers who elect the DROP on October 1, 2003, or thereafter, maximum participation in the DROP shall be 48 full months.
Effective July 24, 2008, firefighter DROP participants may continue City employment for up to 54 full months (48 full months prior to July 24, 2008 and 36 full months prior to October 1, 2001). Police officers who elect the DROP on or after May 8, 2008, may continue City employment for up to 84 full months (48 full months prior to May 8, 2008 and 36 full months prior to October 1, 2003). Once the maximum participation has been achieved, the participant must terminate employment.
The DROP of the FIPO Trust also consists of a Benefit Actuarially Calculated DROP (“BACDROP”). The BACDROP is a DROP benefit actuarially calculated. A member may elect to BACDROP to a date, no further back than the date of the member's requirement eligibility date. The BACDROP period must be in 12 month increments, beginning at the start of a pay period, not to exceed 48 full months for firefighters (36 months prior to October 1, 2001) and for police officers who elected BACDROP on October 1, 2003 (36 months prior to October 1, 2003). The benefits of the BACDROP will then be actuarially calculated to be the equivalent to the benefit earned at the date of retirement.
An individual account is created for each participant. A series of investment vehicles, as established by FIPO's Board of Trustees, are made available to DROP participants to choose from. Any losses incurred on account of the option selected by the participant will not be made up by the City or the FIPO Trust, and will be borne by the participant only. All interest will be credited to the member's account. Upon
104
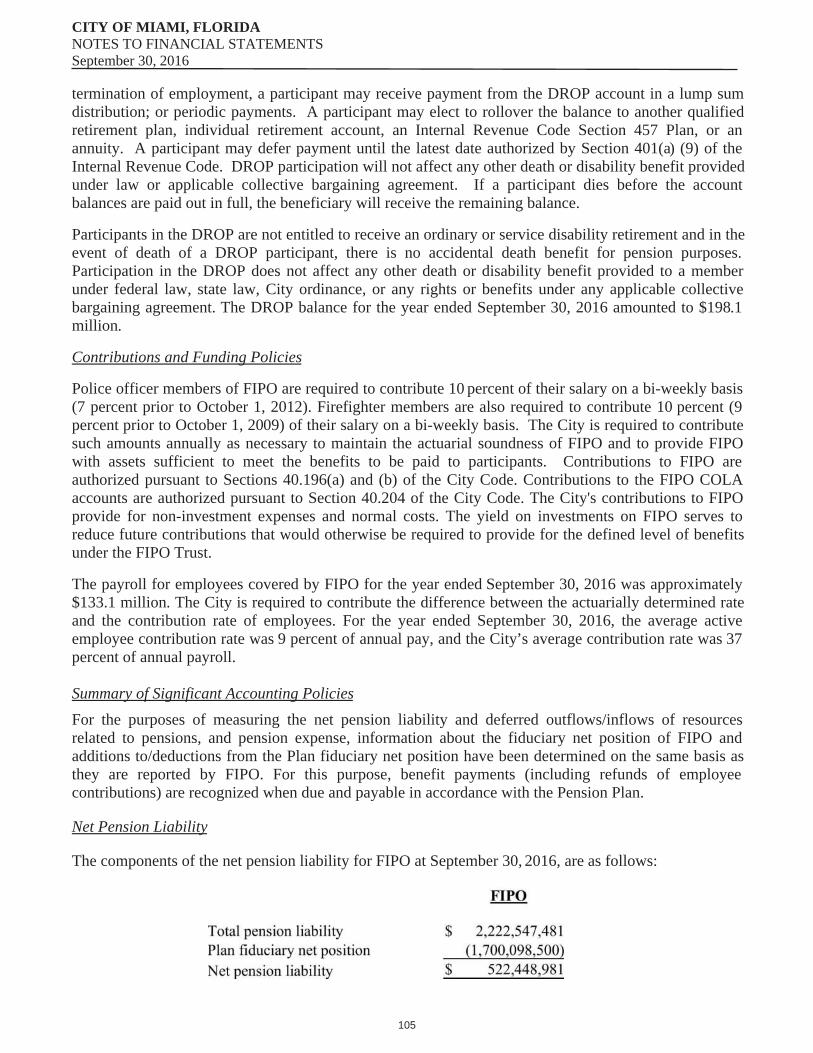
CITY OF MIAMI, FLORIDANOTES TO FINANCIAL STATEMENTSSeptember 30, 2016
termination of employment, a participant may receive payment from the DROP account in a lump sum distribution; or periodic payments. A participant may elect to rollover the balance to another qualified retirement plan, individual retirement account, an Internal Revenue Code Section 457 Plan, or an annuity. A participant may defer payment until the latest date authorized by Section 401(a) (9) of the Internal Revenue Code. DROP participation will not affect any other death or disability benefit provided under law or applicable collective bargaining agreement. If a participant dies before the account balances are paid out in full, the beneficiary will receive the remaining balance.
Participants in the DROP are not entitled to receive an ordinary or service disability retirement and in the event of death of a DROP participant, there is no accidental death benefit for pension purposes. Participation in the DROP does not affect any other death or disability benefit provided to a member under federal law, state law, City ordinance, or any rights or benefits under any applicable collective bargaining agreement. The DROP balance for the year ended September 30, 2016 amounted to $198.1 million.
Contributions and Funding Policies
Police officer members of FIPO are required to contribute 10 percent of their salary on a bi-weekly basis (7 percent prior to October 1, 2012). Firefighter members are also required to contribute 10 percent (9 percent prior to October 1, 2009) of their salary on a bi-weekly basis. The City is required to contribute such amounts annually as necessary to maintain the actuarial soundness of FIPO and to provide FIPO with assets sufficient to meet the benefits to be paid to participants. Contributions to FIPO are authorized pursuant to Sections 40.196(a) and (b) of the City Code. Contributions to the FIPO COLA accounts are authorized pursuant to Section 40.204 of the City Code. The City's contributions to FIPO provide for non-investment expenses and normal costs. The yield on investments on FIPO serves to reduce future contributions that would otherwise be required to provide for the defined level of benefits under the FIPO Trust.
The payroll for employees covered by FIPO for the year ended September 30, 2016 was approximately $133.1 million. The City is required to contribute the difference between the actuarially determined rate and the contribution rate of employees. For the year ended September 30, 2016, the average active employee contribution rate was 9 percent of annual pay, and the City’s average contribution rate was 37 percent of annual payroll.
Summary of Significant Accounting PoliciesFor the purposes of measuring the net pension liability and deferred outflows/inflows of resources related to pensions, and pension expense, information about the fiduciary net position of FIPO and additions to/deductions from the Plan fiduciary net position have been determined on the same basis as they are reported by FIPO. For this purpose, benefit payments (including refunds of employee contributions) are recognized when due and payable in accordance with the Pension Plan.
Net Pension Liability
The components of the net pension liability for FIPO at September 30, 2016, are as follows:
105
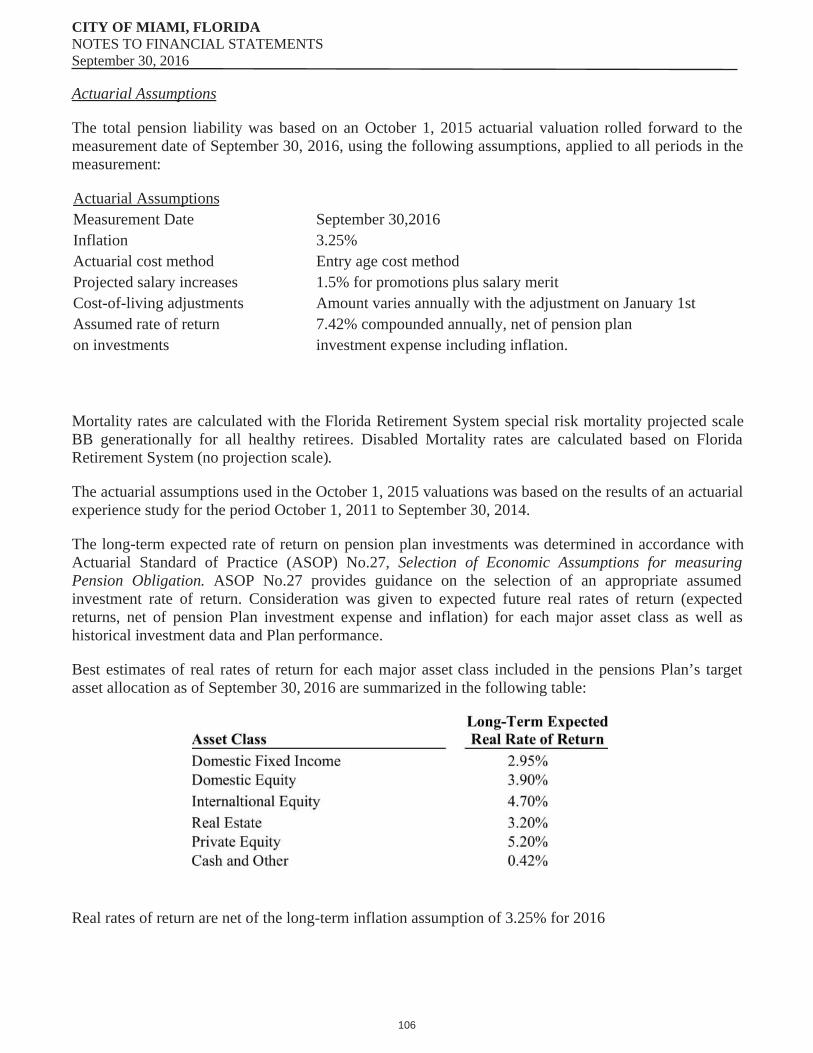
CITY OF MIAMI, FLORIDANOTES TO FINANCIAL STATEMENTSSeptember 30, 2016
Actuarial Assumptions
The total pension liability was based on an October 1, 2015 actuarial valuation rolled forward to the measurement date of September 30, 2016, using the following assumptions, applied to all periods in the measurement:
Actuarial AssumptionsMeasurement Date September 30,2016Inflation 3.25%Actuarial cost method Entry age cost methodProjected salary increases 1.5% for promotions plus salary meritCost-of-living adjustments Amount varies annually with the adjustment on January 1stAssumed rate of return on investments
7.42% compounded annually, net of pension plan investment expense including inflation.
Mortality rates are calculated with the Florida Retirement System special risk mortality projected scale BB generationally for all healthy retirees. Disabled Mortality rates are calculated based on Florida Retirement System (no projection scale).
The actuarial assumptions used in the October 1, 2015 valuations was based on the results of an actuarial experience study for the period October 1, 2011 to September 30, 2014.
The long-term expected rate of return on pension plan investments was determined in accordance with Actuarial Standard of Practice (ASOP) No.27, Selection of Economic Assumptions for measuring Pension Obligation. ASOP No.27 provides guidance on the selection of an appropriate assumed investment rate of return. Consideration was given to expected future real rates of return (expected returns, net of pension Plan investment expense and inflation) for each major asset class as well as historical investment data and Plan performance.
Best estimates of real rates of return for each major asset class included in the pensions Plan’s target asset allocation as of September 30, 2016 are summarized in the following table:
Real rates of return are net of the long-term inflation assumption of 3.25% for 2016
106
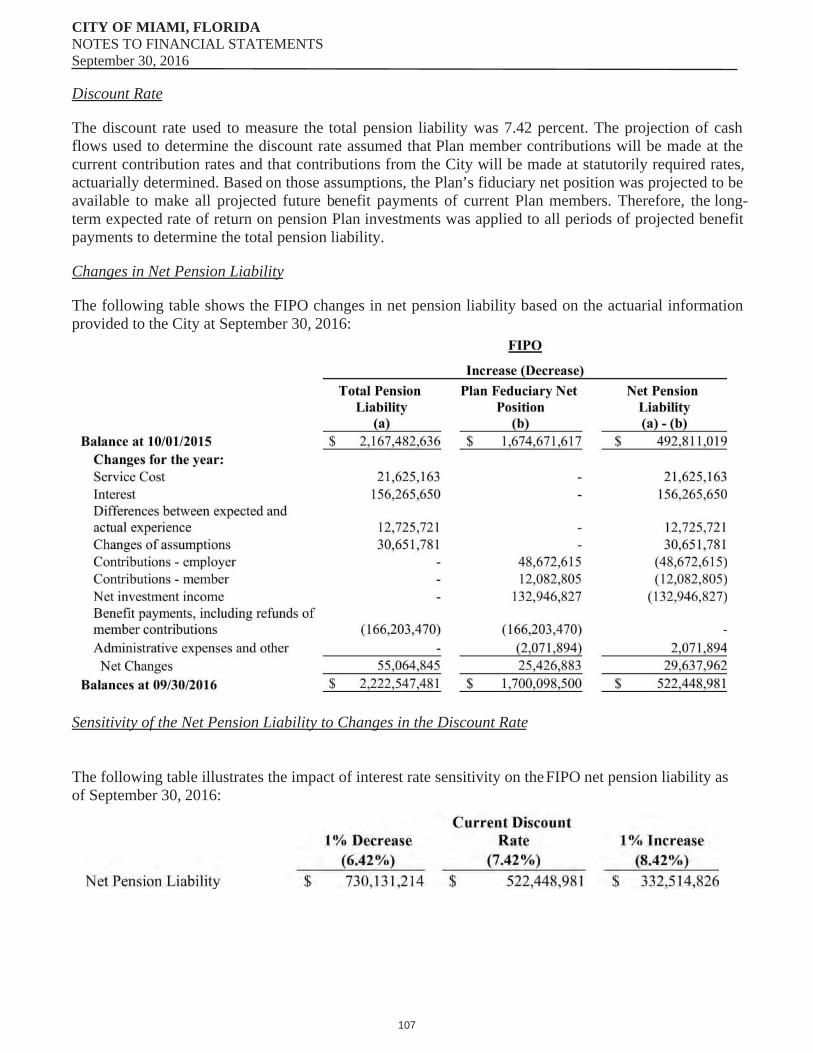
CITY OF MIAMI, FLORIDANOTES TO FINANCIAL STATEMENTSSeptember 30, 2016
Discount Rate
The discount rate used to measure the total pension liability was 7.42 percent. The projection of cash flows used to determine the discount rate assumed that Plan member contributions will be made at the current contribution rates and that contributions from the City will be made at statutorily required rates, actuarially determined. Based on those assumptions, the Plan’s fiduciary net position was projected to be available to make all projected future benefit payments of current Plan members. Therefore, the long-term expected rate of return on pension Plan investments was applied to all periods of projected benefit payments to determine the total pension liability.
Changes in Net Pension Liability
The following table shows the FIPO changes in net pension liability based on the actuarial information provided to the City at September 30, 2016:
Sensitivity of the Net Pension Liability to Changes in the Discount Rate
The following table illustrates the impact of interest rate sensitivity on the FIPO net pension liability as of September 30, 2016:
107

CITY OF MIAMI, FLORIDANOTES TO FINANCIAL STATEMENTSSeptember 30, 2016
Pension Expense and Deferred Outflows/Inflows of Resources Related to Pension
For the year ended September 30, 2016, the City recognized pension expense of $65.2 million. At September 30, 2016 the City reported deferred outflows of resources and deferred inflows of resources from the following sources:
Amounts reported as deferred outflows of resources and deferred inflows of resources related to pensions will be recognized in pension expense as follows:
GENERAL EMPLOYEES AND SANITATION EMPLOYEES RETIREMENT TRUST (GESE Trust)
The Board of Trustees of the GESE Trust administers four defined benefit pension plans: (a) GESE; (b) an Excess Benefit Plan for the City of Miami (the “EBP”); (c) General Employees and Sanitation Employees Retirement Trust Staff Pension Plan (the “Staff Trust”), and (d) General Employees and Sanitation Employees Retirement Trust Staff Excess Benefit Plan (the “Staff Excess Benefit Plan”). Each plan's assets may be used only for the payment of benefits to the members of that Plan, in accordance with the terms of the Plan.
The audited financial statements for the GESE Plans can be obtained from the pension board at: GESE Trust, 2901 Bridgeport Avenue, Coconut Grove, Florida 33133.
GESE Trust
Plan Description
The GESE Trust is a single-employer defined benefit plan. The GESE Trust was established pursuant to the City Ordinance No. 10002 and subsequently revised under City Ordinance No. 12111. The GESE Trust covers all City general and sanitation employees except certain employees eligible to decline
Year ended September 30:2017 $19,345,6382018 $19,345,6382019 $20,908,7482020 $3,655,3882021 $6,196,786
Thereafter $6,196,784
108
CITY OF MIAMI, FLORIDANOTES TO FINANCIAL STATEMENTSSeptember 30, 2016
membership. Participation in the GESE Trust is a mandatory condition of employment for all regular and permanent employees other than fire fighters, police officers and executive level employees hired after October 1, 2009.
As of October 1, 2014, the date of the most recent actuarial valuation report, membership in the GESE consisted of the following:
MembersRetirees and beneficiaries currently receiving benefits 2,031Terminated members entitled to benefits but not yet receiving benefits 170Current members 1,376
Total 3,577
Pension Benefits
The minimum normal retirement age is 55. Any member in service who has 10 or more years of continuous creditable service may elect to retire upon attainment of normal retirement age. A member who has completed a combination of at least 10 or more years of creditable service plus attained an age equaling 70 points may elect a Rule of 70 Retirement. Subsequent to September 30, 2010 for members not eligible to retire as of that date, the retirement age and service changed to age 55 and 30 years of creditable service or age 60 and 10 years of continuous creditable service or a combination of at least ten years of creditable service plus attained age equaling 80 points (Rule of 80).
Retirement benefits are generally based on 3 percent of the average final compensation multiplied by years of creditable service, which is paid annually in monthly installments. For service after September 30, 2010, for members not eligible to retire as of that date, benefits are based on 2.25 percent of average final compensation multiplied by creditable service up to 15 years, 2.5 percent of average final compensation for 15 to 20 years of service and 2.75 percent for service over 20 years. Effective September 30, 2012, for members not eligible to retire on that date, member retirement allowances shall not exceed $80,000. Any member who has accrued a benefit in excess of the maximum benefit as of September 30, 2012 will retain that benefit but will not accrue any additional benefit.
Members eligible to receive accumulated sick and vacation leave from the City are able to transfer the amount to an eligible retirement plan. The GESE Trust facilitates the transfer of accumulated sick and vacation leave to any eligible retirement plan and is pursuant to Section 40-266 of the City Code.
Cost of Living Adjustment (COLA)
Effective October 1, 1998, the GESE Trust was amended to provide for an increase in the COLA paid to retirees to 4 percent with a $400 annual maximum increase, provided the retiree's first anniversary of retirement has been reached. The amendment also provided for retirees electing the return of their contribution option to receive a minimum COLA benefit of $27 per year and a maximum COLA benefit of $200 added to the previous COLA benefit, provided the retiree's first anniversary of retirement has been reached.
Deferred Retirement Option Plan (DROP)
The DROP is available to GESE Trust members for normal retirement as of January 1, 2013 or vested as of October 1, 2010. The DROP is not available to any other GESE Trust member. The DROP is an
109
CITY OF MIAMI, FLORIDANOTES TO FINANCIAL STATEMENTSSeptember 30, 2016
enhancement to the GESE Trust that can provide a member with another way to save for retirement. It allows a participant to receive pension payments by depositing in the DROP program while continuing to work and receive pay and benefits as an active employee. At the end of the DROP period, when the participant is officially required to retire, the participant receives monthly pension payments based on the years of service and salary at the time that the participant enrolled in the DROP. The participant may elect to receive the accumulated DROP account balance or can be rolled over into a separate tax-qualified plan after withdrawing from the DROP. DROP pension payment for the year ended September 30, 2016 amounted to $973,975. The DROP balance for the year ended September 30, 2016 amounted to $39.1 million.
BACKDROP Option (BACKDROP)
The Backdrop is available to all GESE Trust members effective January 1, 2013. Under the BACKDROP option a member can receive a lump sum payment in addition to a monthly pension annuity. The employee chooses to take a BACKDROP at the end of his or her employment with the City as long as he or she BACKDROPs to any date after he or she reaches the Normal Retirement date. If the member elects the BACKDROP option, the monthly benefit payable on the member’s actual retirement date (when the member leaves City employment) is based on the benefit the member would have received had he or she left employment and retired on an earlier Normal Retirement date, referred to as the BACKDROP date. In addition, the member will receive a lump sum payment equal to the accumulation of annuity payments he or she would have received during the Backdrop period had he or she elected to receive immediate pension annuity payments equal to the accumulation of annuity payments he or she would have received during the BACKDROP period had he or she elected to receive immediate pension annuity payments starting as of the BACKDROP date. Annuity payments would be accumulated at the rate of 3 percent per year, compounded annually. The member’s BACKDROP date can be any date after his or her Normal Retirement Date and the BACKDROP period can be any date after his or her Normal Retirement Date and the BACKDROP period can be as little as one year and as long as seven years. If the member does not elect a BACKDROP benefit option, his or her monthly retirement benefit will be calculated using his or her final average final compensation and creditable service as of the member’s actual employment termination date. The participant may receive the accumulated BACKDROP account balance upon electing the BACKDROP and at the end of his or her employment. The BACKDROP monies can be rolled over into a separate tax-qualified plan after withdrawing from the DROP. BACKDROP pension payment for the year ended September 30, 2016 amounted to $40,948.
Contributions and Funding Policies
Members of the GESE are required to contribute 10 percent of their salary on a bi-weekly basis. The GESE's funding policies provide for periodic contributions at actuarially determined rates that, expressed as percentages of annual covered payroll, are sufficient to maintain the actuarial soundness of the GESE and to accumulate sufficient assets to pay benefits when due. The City is required to contribute an actuarially determined amount that, when combined with participants' contributions, will fully provide all benefits as they become payable. Contributions to the GESE are authorized pursuant to Sections 40-246(a) and (b) of the City Code. Contributions from the City are designed to fund the GESE's non-investment expenses and normal costs and to fund the unfunded actuarial accrued liability. The yield (interest, dividends and net realized and unrealized gains and losses) on investment of the GESE serves to reduce or increase future contributions that would otherwise be required to provide for the defined level of benefits under the GESE Plan.
110
CITY OF MIAMI, FLORIDANOTES TO FINANCIAL STATEMENTSSeptember 30, 2016
The payroll for employees covered by the GESE Trust for the year ended September 30, 2016 was approximately $71.9 million. The City is required to contribute the difference between the actuarially determined rate and the contribution rate of employees. For the year ended September 30, 2016, the average active employee contribution rate was 11 percent of annual pay, and the City’s average contribution rate was 46 percent of annual payroll.
Summary of Significant Accounting Policies
For the purposes of measuring the net pension liability and deferred outflows/inflows of resources related to pensions, and pension expense, information about the fiduciary net position of GESE Trust and additions to/deductions from the GESE Trust fiduciary net position have been determined on the same basis as they are reported by GESE Trust. For this purpose, benefit payments (including refunds of employee contributions) are recognized when due and payable in accordance with the Pension Plan.
Net Pension Liability
The components of the net pension liability of the GESE Trust at September 30, 2016, are as follows:
Actuarial AssumptionsThe total pension liability was based on an October 1, 2014 actuarial valuation rolled forward to the measurement date of September 30, 2015, using the following assumptions, applied to all periods in the measurement:
Actuarial AssumptionsMeasurement Date September 30, 2015Inflation 3.5%Projected salary increases 4% - 8.75%, including inflationAssumed rate of return on investments
7.6% for periods from October 1, 2015, net of pension plan investment expense and including inflation
Pre-Retirement Mortality rates are calculated with the UP-1994 Morality Table projected to 2018 (using scale AA) for male and female, set forward 1 year. Post-Retirement Healthy Mortality rates are calculated based on the UP-1994 Morality Table projected to 2018 (using scale AA) for male and female, set forward 2 years. Post-Retirement Disabled Morality rates are calculated on the UP-1994 Morality Table projected to 2018 (using scale AA) for male and female, set forward 8 years.
Long Term Rate of Return
The long term expected rate of return on pension plan investments was determined using a long-normal distribution analysis in which best-estimate ranges of expected future real rates of return (expected returns, net of retirement Plan investment expense and inflation) are developed for each major asset class. These ranges are combined to produce the long-term expected rate of return by weighting the expected future real rates of return by the target asset allocation percentage and by adding expected
111
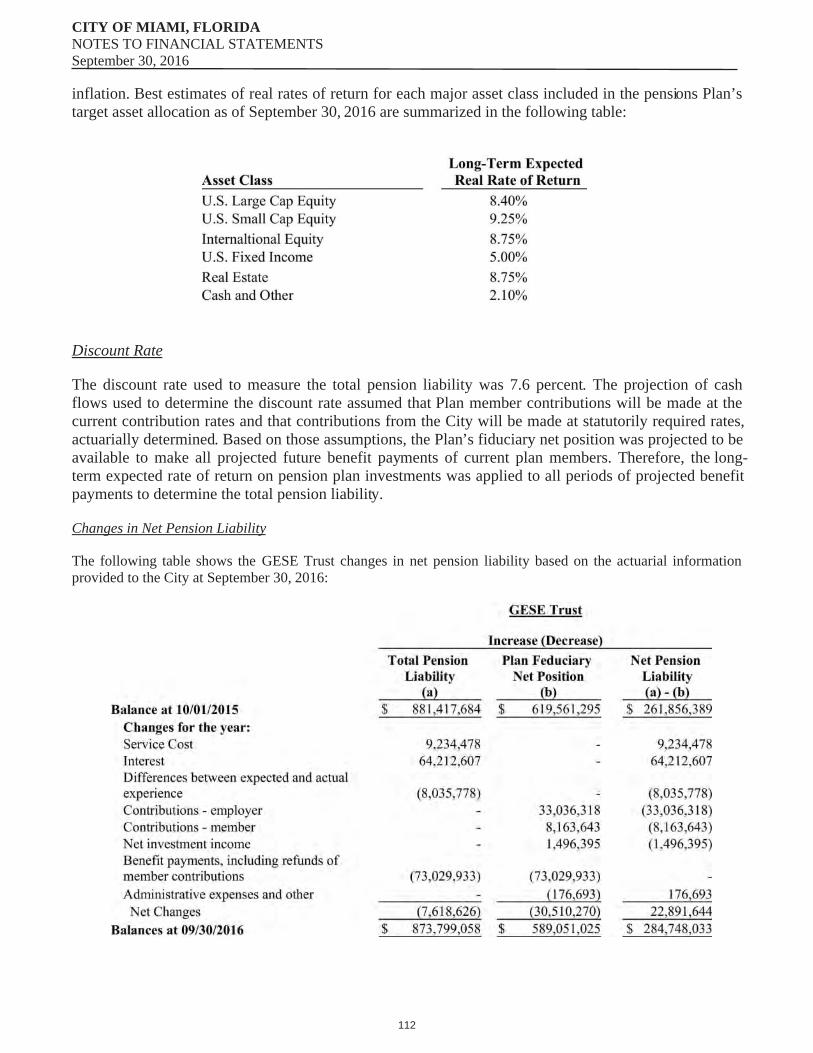
CITY OF MIAMI, FLORIDANOTES TO FINANCIAL STATEMENTSSeptember 30, 2016
inflation. Best estimates of real rates of return for each major asset class included in the pensions Plan’s target asset allocation as of September 30, 2016 are summarized in the following table:
Discount Rate
The discount rate used to measure the total pension liability was 7.6 percent. The projection of cash flows used to determine the discount rate assumed that Plan member contributions will be made at the current contribution rates and that contributions from the City will be made at statutorily required rates, actuarially determined. Based on those assumptions, the Plan’s fiduciary net position was projected to be available to make all projected future benefit payments of current plan members. Therefore, the long-term expected rate of return on pension plan investments was applied to all periods of projected benefit payments to determine the total pension liability.
Changes in Net Pension Liability
The following table shows the GESE Trust changes in net pension liability based on the actuarial information provided to the City at September 30, 2016:
112
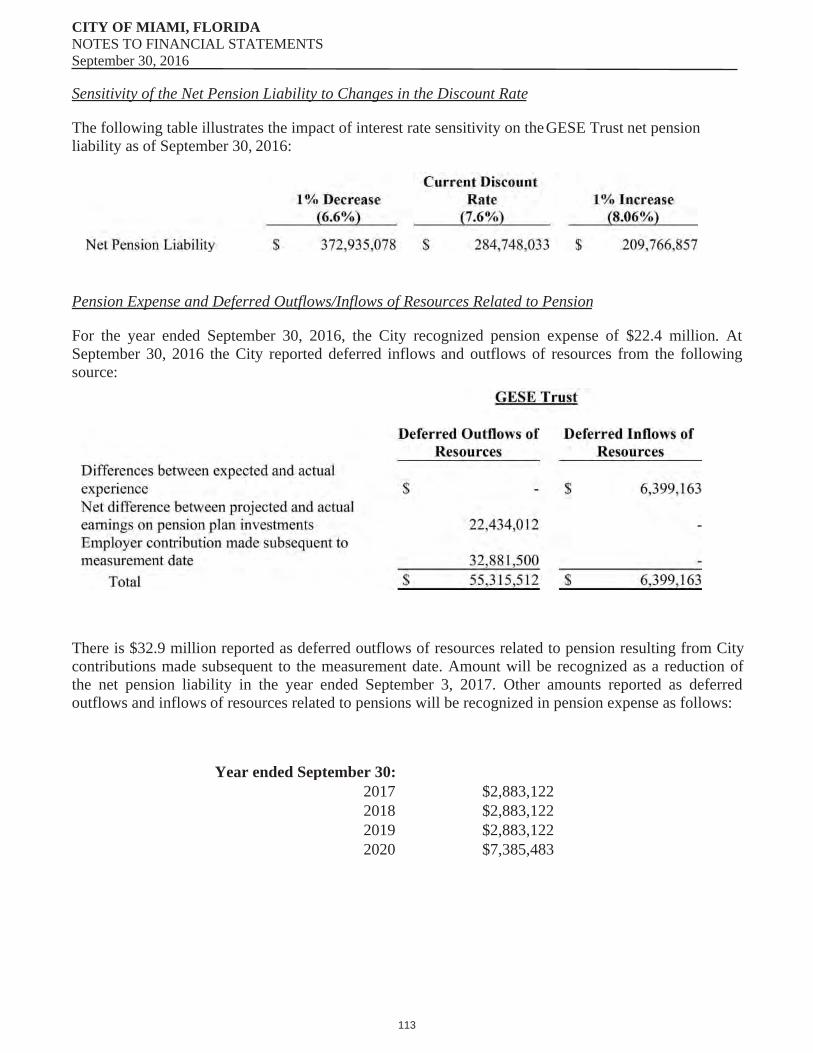
CITY OF MIAMI, FLORIDANOTES TO FINANCIAL STATEMENTSSeptember 30, 2016
Sensitivity of the Net Pension Liability to Changes in the Discount Rate
The following table illustrates the impact of interest rate sensitivity on the GESE Trust net pension liability as of September 30, 2016:
Pension Expense and Deferred Outflows/Inflows of Resources Related to Pension
For the year ended September 30, 2016, the City recognized pension expense of $22.4 million. At September 30, 2016 the City reported deferred inflows and outflows of resources from the following source:
There is $32.9 million reported as deferred outflows of resources related to pension resulting from City contributions made subsequent to the measurement date. Amount will be recognized as a reduction of the net pension liability in the year ended September 3, 2017. Other amounts reported as deferred outflows and inflows of resources related to pensions will be recognized in pension expense as follows:
Year ended September 30:2017 $2,883,1222018 $2,883,1222019 $2,883,1222020 $7,385,483
113
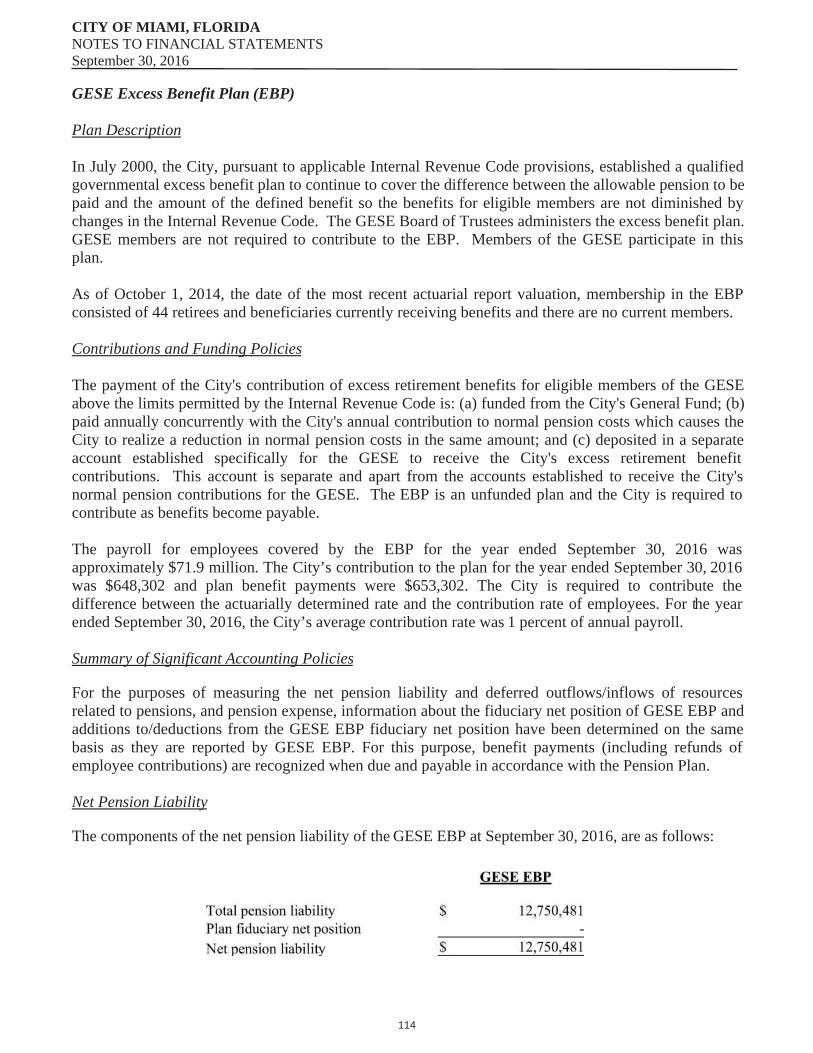
CITY OF MIAMI, FLORIDANOTES TO FINANCIAL STATEMENTSSeptember 30, 2016
GESE Excess Benefit Plan (EBP)
Plan Description
In July 2000, the City, pursuant to applicable Internal Revenue Code provisions, established a qualified governmental excess benefit plan to continue to cover the difference between the allowable pension to be paid and the amount of the defined benefit so the benefits for eligible members are not diminished by changes in the Internal Revenue Code. The GESE Board of Trustees administers the excess benefit plan. GESE members are not required to contribute to the EBP. Members of the GESE participate in this plan.
As of October 1, 2014, the date of the most recent actuarial report valuation, membership in the EBP consisted of 44 retirees and beneficiaries currently receiving benefits and there are no current members.
Contributions and Funding Policies
The payment of the City's contribution of excess retirement benefits for eligible members of the GESE above the limits permitted by the Internal Revenue Code is: (a) funded from the City's General Fund; (b) paid annually concurrently with the City's annual contribution to normal pension costs which causes the City to realize a reduction in normal pension costs in the same amount; and (c) deposited in a separate account established specifically for the GESE to receive the City's excess retirement benefit contributions. This account is separate and apart from the accounts established to receive the City's normal pension contributions for the GESE. The EBP is an unfunded plan and the City is required to contribute as benefits become payable.
The payroll for employees covered by the EBP for the year ended September 30, 2016 was approximately $71.9 million. The City’s contribution to the plan for the year ended September 30, 2016 was $648,302 and plan benefit payments were $653,302. The City is required to contribute the difference between the actuarially determined rate and the contribution rate of employees. For the year ended September 30, 2016, the City’s average contribution rate was 1 percent of annual payroll.
Summary of Significant Accounting Policies
For the purposes of measuring the net pension liability and deferred outflows/inflows of resources related to pensions, and pension expense, information about the fiduciary net position of GESE EBP and additions to/deductions from the GESE EBP fiduciary net position have been determined on the same basis as they are reported by GESE EBP. For this purpose, benefit payments (including refunds of employee contributions) are recognized when due and payable in accordance with the Pension Plan.
Net Pension Liability
The components of the net pension liability of the GESE EBP at September 30, 2016, are as follows:
114
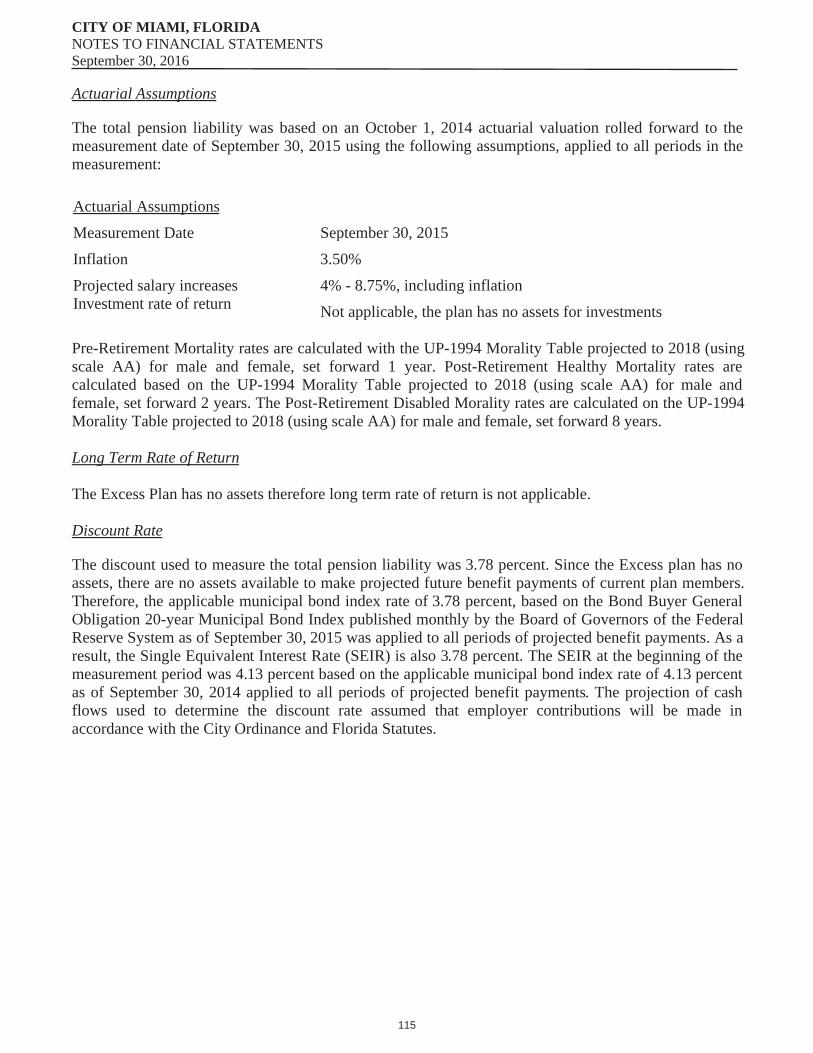
CITY OF MIAMI, FLORIDANOTES TO FINANCIAL STATEMENTSSeptember 30, 2016
Actuarial Assumptions
The total pension liability was based on an October 1, 2014 actuarial valuation rolled forward to the measurement date of September 30, 2015 using the following assumptions, applied to all periods in the measurement:
Actuarial Assumptions
Measurement Date September 30, 2015
Inflation 3.50%
Projected salary increases 4% - 8.75%, including inflationInvestment rate of return Not applicable, the plan has no assets for investments
Pre-Retirement Mortality rates are calculated with the UP-1994 Morality Table projected to 2018 (using scale AA) for male and female, set forward 1 year. Post-Retirement Healthy Mortality rates are calculated based on the UP-1994 Morality Table projected to 2018 (using scale AA) for male and female, set forward 2 years. The Post-Retirement Disabled Morality rates are calculated on the UP-1994 Morality Table projected to 2018 (using scale AA) for male and female, set forward 8 years.
Long Term Rate of Return
The Excess Plan has no assets therefore long term rate of return is not applicable.
Discount Rate
The discount used to measure the total pension liability was 3.78 percent. Since the Excess plan has no assets, there are no assets available to make projected future benefit payments of current plan members. Therefore, the applicable municipal bond index rate of 3.78 percent, based on the Bond Buyer General Obligation 20-year Municipal Bond Index published monthly by the Board of Governors of the Federal Reserve System as of September 30, 2015 was applied to all periods of projected benefit payments. As a result, the Single Equivalent Interest Rate (SEIR) is also 3.78 percent. The SEIR at the beginning of the measurement period was 4.13 percent based on the applicable municipal bond index rate of 4.13 percent as of September 30, 2014 applied to all periods of projected benefit payments. The projection of cash flows used to determine the discount rate assumed that employer contributions will be made in accordance with the City Ordinance and Florida Statutes.
115
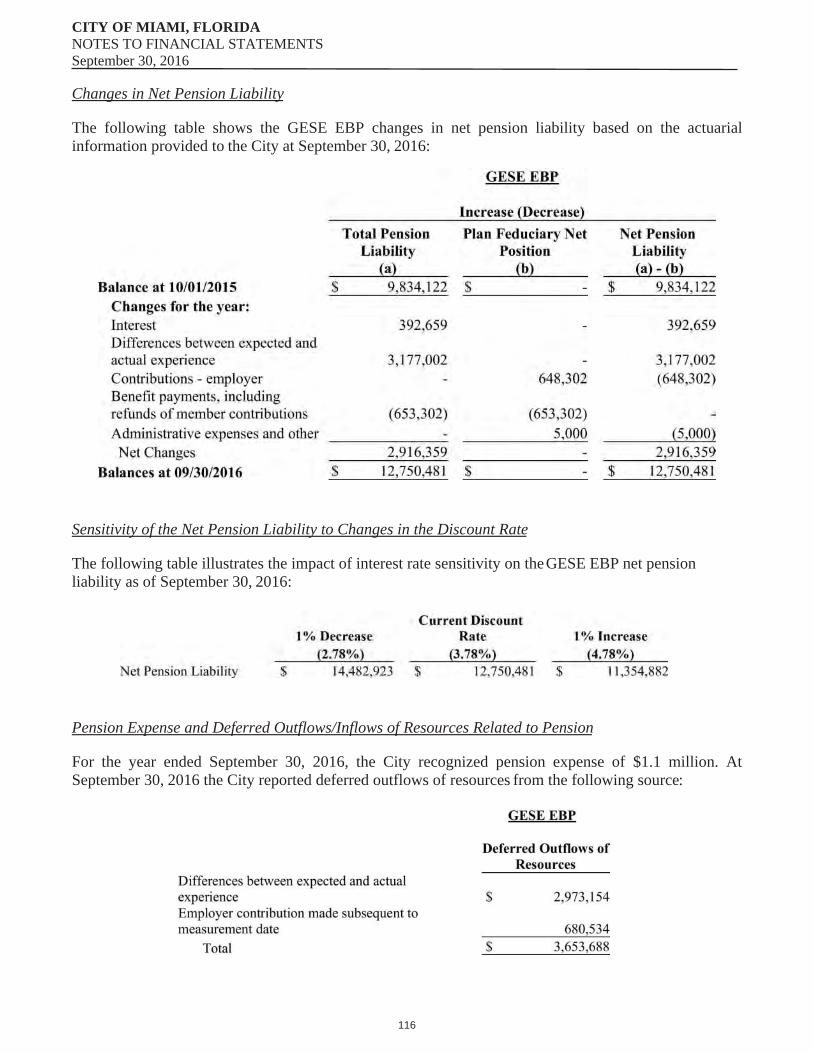
CITY OF MIAMI, FLORIDANOTES TO FINANCIAL STATEMENTSSeptember 30, 2016
Changes in Net Pension Liability
The following table shows the GESE EBP changes in net pension liability based on the actuarial information provided to the City at September 30, 2016:
Sensitivity of the Net Pension Liability to Changes in the Discount Rate
The following table illustrates the impact of interest rate sensitivity on the GESE EBP net pension liability as of September 30, 2016:
Pension Expense and Deferred Outflows/Inflows of Resources Related to Pension
For the year ended September 30, 2016, the City recognized pension expense of $1.1 million. At September 30, 2016 the City reported deferred outflows of resources from the following source:
116
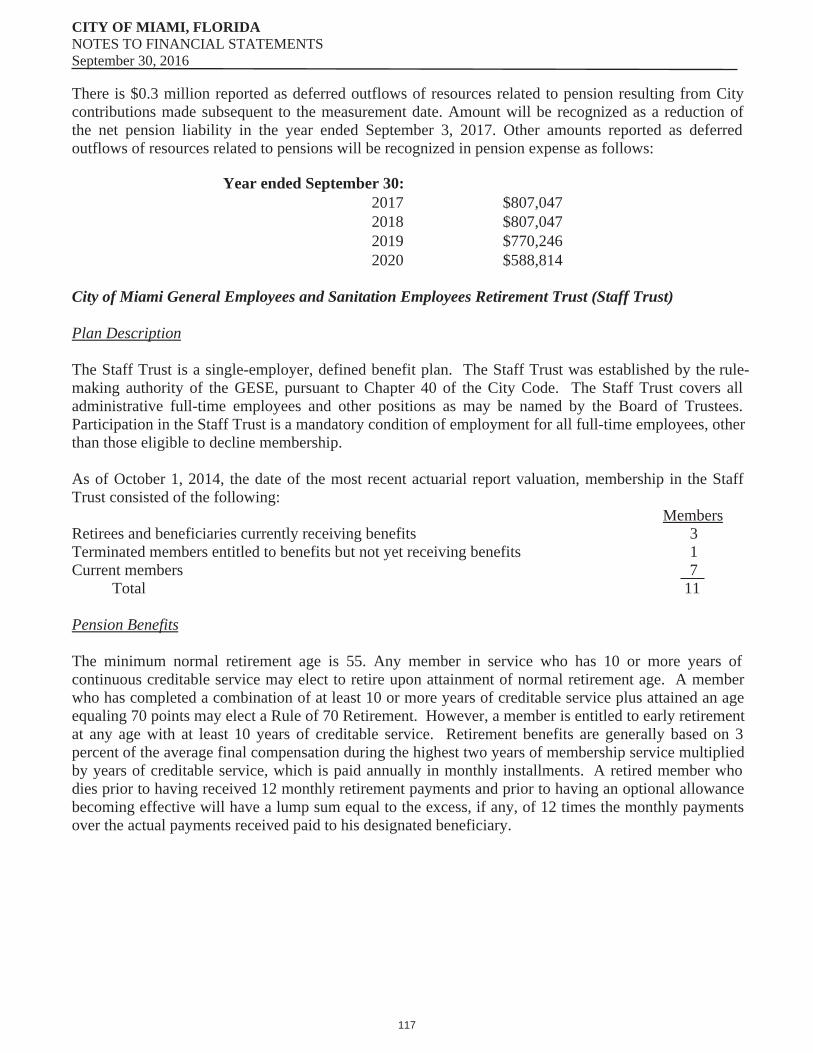
CITY OF MIAMI, FLORIDANOTES TO FINANCIAL STATEMENTSSeptember 30, 2016
There is $0.3 million reported as deferred outflows of resources related to pension resulting from City contributions made subsequent to the measurement date. Amount will be recognized as a reduction of the net pension liability in the year ended September 3, 2017. Other amounts reported as deferred outflows of resources related to pensions will be recognized in pension expense as follows:
Year ended September 30:2017 $807,0472018 $807,0472019 $770,2462020 $588,814
City of Miami General Employees and Sanitation Employees Retirement Trust (Staff Trust)
Plan Description
The Staff Trust is a single-employer, defined benefit plan. The Staff Trust was established by the rule-making authority of the GESE, pursuant to Chapter 40 of the City Code. The Staff Trust covers all administrative full-time employees and other positions as may be named by the Board of Trustees. Participation in the Staff Trust is a mandatory condition of employment for all full-time employees, other than those eligible to decline membership.
As of October 1, 2014, the date of the most recent actuarial report valuation, membership in the Staff Trust consisted of the following:
MembersRetirees and beneficiaries currently receiving benefits 3Terminated members entitled to benefits but not yet receiving benefits 1Current members 7
Total 11
Pension Benefits
The minimum normal retirement age is 55. Any member in service who has 10 or more years of continuous creditable service may elect to retire upon attainment of normal retirement age. A member who has completed a combination of at least 10 or more years of creditable service plus attained an age equaling 70 points may elect a Rule of 70 Retirement. However, a member is entitled to early retirement at any age with at least 10 years of creditable service. Retirement benefits are generally based on 3 percent of the average final compensation during the highest two years of membership service multiplied by years of creditable service, which is paid annually in monthly installments. A retired member who dies prior to having received 12 monthly retirement payments and prior to having an optional allowance becoming effective will have a lump sum equal to the excess, if any, of 12 times the monthly payments over the actual payments received paid to his designated beneficiary.
117
CITY OF MIAMI, FLORIDANOTES TO FINANCIAL STATEMENTSSeptember 30, 2016
Deferred Retirement Option Plan (DROP)
The Staff Trust implemented a DROP for employees eligible for Rule of 70 Retirement on March 26, 2010. Any employee who is eligible for a Rule of 70 Retirement is eligible to participate in the DROP.Upon election of participation, a member’s creditable service, accrued benefits, and compensation calculation are frozen and the DROP payment is based on the member’s average final compensation. The member’s contribution and the City contribution to the retirement plan for that member ceases as no further service credit is earned. The member does not acquire additional pension credit for the purposes of the pension plan, but may continue City employment for up to a maximum of 48 months. Once the maximum participation has been achieved, the participant must terminate employment.
Upon termination of employment, a participant may receive payment from the DROP account in a lump sum distribution; or periodic payments. A participant may elect to rollover the balance to another qualified retirement plan, individual retirement account, an Internal Revenue Code Section 457 Plan, or an annuity. A participant may defer payment until the latest date authorized by Section 401(a) (9) of the Internal Revenue Code. DROP participation will not affect any other death or disability benefit provided under law or applicable collective bargaining agreement. If a participant dies before the account balances are paid out in full, the beneficiary will receive the remaining balance. The DROP balance for the year ended September 30, 2016 amounted to $1.2 million.
Contributions and Funding Policy
Members of the Staff Trust are required to contribute 10 percent of their salary on a bi-weekly basis. The funding policies of the Staff Trust provide for periodic contributions at actuarially determined rates that, expressed as percentages of annual covered payroll, are sufficient to maintain the actuarial soundness of the Staff Trust and to accumulate sufficient assets to pay benefits when due. The City is required to contribute an actuarially determined amount that, when combined with member contributions, will fully provide all benefits as they become payable. The yield (interest, dividends and net realized and unrealized gains and losses) on investments of the Staff Trust serves to reduce or increase future contributions that would otherwise be required to provide for the defined level of benefits under the Staff Plan.
The payroll for employees covered by the Staff Trust for the year ended September 30, 2016 was approximately $0.2 million. The City is required to contribute the difference between the actuarially determined rate and the contribution rate of employees. For the year ended September 30, 2016, the average active employee contribution rate was 12 percent of annual pay, and the City’s average contribution rate was 177 percent of annual payroll.
Summary of Significant Accounting Policies
For the purposes of measuring the net pension liability and deferred outflows/inflows of resources related to pensions, and pension expense, information about the fiduciary net position of GESE Staff Trust and additions to/deductions from the GESE Staff Trust fiduciary net position have been determined on the same basis as they are reported by GESE Staff Trust. For this purpose, benefit payments (including refunds of employee contributions) are recognized when due and payable in accordance with the Pension Plan.
118

CITY OF MIAMI, FLORIDANOTES TO FINANCIAL STATEMENTSSeptember 30, 2016
Net Pension Liability
The components of the net pension liability of the GESE Staff Trust at September 30, 2016, are as follows:
Actuarial Assumptions
The total pension liability was based on an October 1, 2014 actuarial valuation rolled forward to the measurement date of September 30, 2015, using the following assumptions, applied to all periods in the measurement:
Pre-Retirement Morality rates are calculated with the 1983 Group Annuity Table for male and female, set back 2 years. Post-Retirement Healthy Mortality rates are calculated based on the 1983 Group Annuity Table for male and female. The Post-Retirement Disabled Morality rate are calculated on the 1983 Group Annuity Table for male and female, set back 9 years.
Long Term Rate of Return
The long term expected rate of return on pension plan investments was determined using a long-normal distribution analysis in which best-estimate ranges of expected future real rates of return (expected returns, net of retirement Plan investment expense and inflation) are developed for each major asset class. These ranges are combined to produce the long-term expected rate of return by weighting the expected future real rates of return by the target asset allocation percentage and by adding expected inflation. Best estimates of real rates of return for each major asset class included in the pension plan’s target asset allocation as of September 30, 2016 are summarized in the following table:
Actuarial AssumptionsMeasurement Date September 30, 2015Inflation 3.50%Projected salary increases 6%, including inflationInvestment rate of return 7.6% for periods from October 1, 2015, net of pension plan investment
expense, including inflation.
119

CITY OF MIAMI, FLORIDANOTES TO FINANCIAL STATEMENTSSeptember 30, 2016
Discount Rate
The discount rate used to measure the total pension liability was 7.6 percent. The projection of cash flows used to determine the discount rate assumed that Plan member contributions will be made at the current contribution rates and that contributions from the City will be made at statutorily required rates, actuarially determined. Based on those assumptions, the Plan’s fiduciary net position was projected to be available to make all projected future benefit payments of current plan members. Therefore, the long-term expected rate of return on pension plan investments was applied to all periods of projected benefit payments to determine the total pension liability.
Changes in Net Pension Liability
The following table shows the GESE Staff Trust changes in net pension liability based on the actuarial information provided to the City at September 30, 2016:
Sensitivity of the Net Pension Liability to Changes in the Discount Rate
The following table illustrates the impact of interest rate sensitivity on the GESE Staff Trust Plan net pension liability as of September 30, 2016:
120
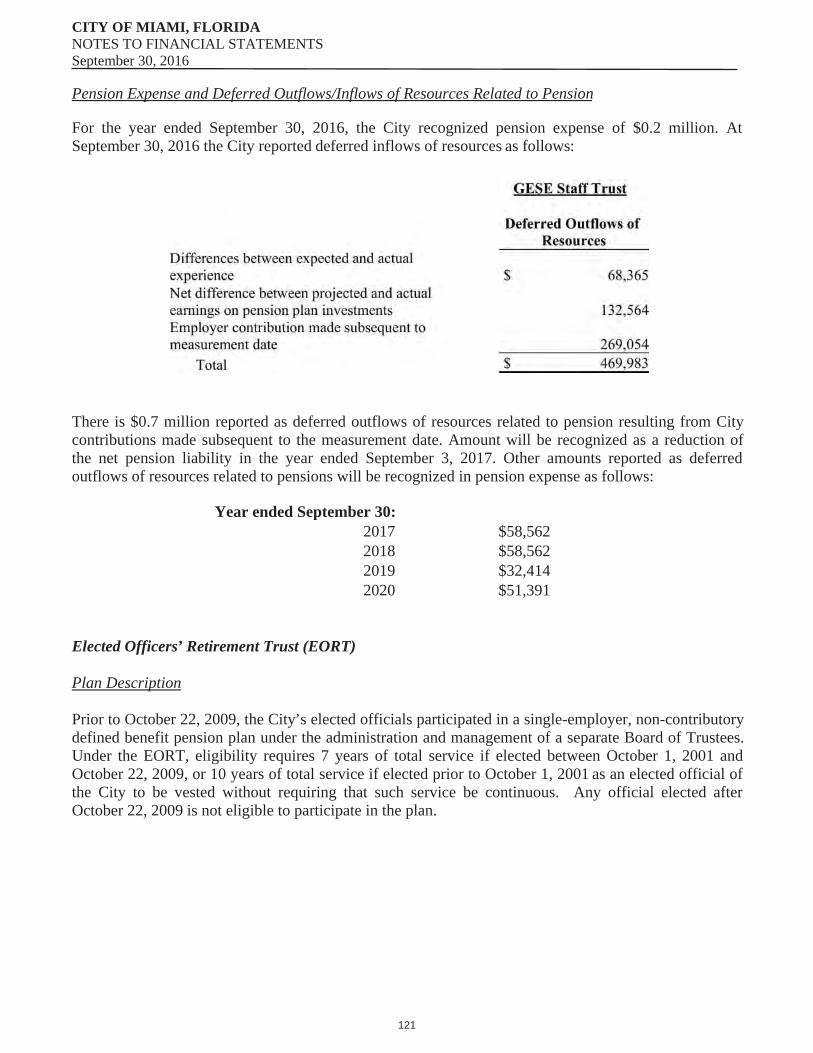
CITY OF MIAMI, FLORIDANOTES TO FINANCIAL STATEMENTSSeptember 30, 2016
Pension Expense and Deferred Outflows/Inflows of Resources Related to Pension
For the year ended September 30, 2016, the City recognized pension expense of $0.2 million. At September 30, 2016 the City reported deferred inflows of resources as follows:
There is $0.7 million reported as deferred outflows of resources related to pension resulting from City contributions made subsequent to the measurement date. Amount will be recognized as a reduction of the net pension liability in the year ended September 3, 2017. Other amounts reported as deferred outflows of resources related to pensions will be recognized in pension expense as follows:
Year ended September 30:2017 $58,5622018 $58,5622019 $32,4142020 $51,391
Elected Officers’ Retirement Trust (EORT)
Plan Description
Prior to October 22, 2009, the City’s elected officials participated in a single-employer, non-contributory defined benefit pension plan under the administration and management of a separate Board of Trustees. Under the EORT, eligibility requires 7 years of total service if elected between October 1, 2001 and October 22, 2009, or 10 years of total service if elected prior to October 1, 2001 as an elected official of the City to be vested without requiring that such service be continuous. Any official elected after October 22, 2009 is not eligible to participate in the plan.
121
CITY OF MIAMI, FLORIDANOTES TO FINANCIAL STATEMENTSSeptember 30, 2016
The City, pursuant to applicable Internal Revenue Code provisions, also established qualified governmental excess benefit plans to continue to cover the difference between the allowable pension to be paid, and the amount of the defined benefit, so that the benefits for eligible members are not diminished by changes in the Internal Revenue Code.
Separate stand-alone financial statements are not issued for EORT and are presented as part of the Combining Statement of Fiduciary Net Position and Combining Statement of Changes in Fiduciary Net Position located in the Fiduciary Funds section of the City’s CAFR.
As of January 1, 2016, the date of the most recent actuarial valuation, membership in the EORT consisted of the following:
MembersRetirees and beneficiaries currently receiving benefits 6Terminated members entitled to benefits but not yet receiving benefits 2Active officers with future range of service from 1 to 3 years 2
Total 10
Pension Benefits
Benefits accrue for elected officers at the rate of 50 percent of the highest annual W-2 wages in the last three years of employment after 7 years of service as an elected official of the City plus 5 percent for each additional year up to 100 percent at 7 or more years of service. The Plan benefit is payable beginning on the date the participant ceases to be an elected officer, but no earlier than the participant’s 55th birthday. The benefit is payable monthly, for the participant’s lifetime. An active participant will be fully vested upon death and a single sum death benefit is payable. The EORT was frozen to new entrants effective October 22, 2009. Only participants who were accruing benefits and had not yet become vested in their benefits as of that date continue to accrue benefits under the EORT. Benefit accruals for all other participants were frozen.
Contributions and Funding Policy
The annual contribution is determined using the Projected Unit Credit (PUC) Cost Method, which was adopted effective with the January 1, 2012 actuarial valuation report. The PUC Cost Method separates and develops funding components for annual contributions into 1) normal costs and 2) an amortization payment toward the unfunded accrued liability for past service benefits. Revising the actuarial funding method allows the City to fund the payment liability over a longer period of time. Contributions made to EORT are in accordance with actuarially determined contribution requirements, based on the actuarial valuation performed for each respective year.
EORT is a non-contributory defined benefit plan; therefore, all funding is provided by the City. The City is required to contribute the actuarially determined rate. For the year ended September 30, 2016, the City’s average contribution rate was 466 percent of annual payroll. The City’s contribution to the plan for the year ended September 30, 2016 was $860,089.
The payroll for employees covered by EORT for the year ended September 30, 2016 was approximately $0.10 million.
122
CITY OF MIAMI, FLORIDANOTES TO FINANCIAL STATEMENTSSeptember 30, 2016
Summary of Significant Accounting Policies
For the purposes of measuring the net pension liability and deferred outflows/inflows of resources related to pensions, and pension expense, information about the fiduciary net position of EORT and additions to/deductions from the EORT fiduciary net position have been determined on the same basis as they are reported by EORT. For this purpose, benefit payments (including refunds of employee contributions) are recognized when due and payable in accordance with the Pension Plan.
Net Pension Liability
The components of the net pension liability of EORT at September 30, 2016, were as follows:
Actuarial Assumptions
The total pension liability in the January 1, 2016 actuarial valuation was determined using the following assumptions, applied to all periods in the measurement (measurement date January 1, 2016):
Actuarial AssumptionsMeasurement Date January 1, 2016Projected salary increases 0.00%Assumed rate of return on investments
3.75% for the period Jan 1, 2016 and future periods, net of pension plan investment expense
Inflation Rate 2.5%
Mortality rates after commencement of monthly benefits are calculated with RP -2000 Mortality Table, sex-distinct, rates for annuitants, adjusted for white-collar employees, and with fully-generational mortality improvement projected under Scale BB2D. No mortality is assumed for years prior to the expected commencement date for monthly benefits.
Long Term Rate of Return
The long-term expected rate of return on pension plan investments was determined using a building-block method in which best-estimate ranges of expected future real rates of return (expected returns, net of pension plan investment expense and inflation) are developed for each major asset class. These ranges are combined to produce the long-term expected rate of return by weighting the expected future real rates of return by the target allocation percentage and by adding expected inflation. Best estimates of arithmetic real rates of return by asset class included in the pensions plan’s target asset allocation as of September 30, 2016, are as fallows:
EORT
Total pension liability $ 8,642,267Plan fiduciary net position (6,962,265)Net pension liability $ 1,680,002
123

CITY OF MIAMI, FLORIDANOTES TO FINANCIAL STATEMENTSSeptember 30, 2016
Discount Rate
The discount rate used to measure the total pension liability was 3.75 percent (includes inflation). The projection of cash flows used to determine the discount rate assumed that Plan member contributions will be made at the current contribution rates and that contributions from the City will be made at statutorily required rates, actuarially determined. Based on those assumptions, the Plan’s fiduciary net position was projected to be available to make all projected future benefit payments of current plan members. Therefore, the long-term expected rate of return on pension plan investments was applied to all periods of projected benefit payments to determine the total pension liability.
Changes in Net Pension Liability
The following table shows the EORT changes in net pension liability based on the actuarial information provided to the City at September 30, 2016:
EORTIncrease (Decrease)
Total Pension Plan Fiduciary Net Pension Liability Net Position Liability
(a) (b) (a) - (b)Balances at 10/01/2015 $ 8,502,039 $ 6,324,925 $ 2,177,114 Changes for the year:
Service Cost 88,956 - 88,956 Interest 316,813 - 316,813 Differences between expected and actual experience (2,221) - (2,221)Contributions - employer - 860,089 (860,089)Net investment income - 42,971 (42,971)Benefit payments, including refunds of member contributions (263,320) (263,320) - Administrative expenses and Other - (2,400) 2,400
Net Changes 140,228 637,340 (497,112)Balances at 9/30/2016 $ 8,642,267 $ 6,962,265 $ 1,680,002
Sensitivity of the Net Pension Liability to Changes in the Discount Rate
The following table illustrates the impact of interest rate sensitivity on the EORT net pension liability as of September 30, 2016:
124
CITY OF MIAMI, FLORIDANOTES TO FINANCIAL STATEMENTSSeptember 30, 2016
Pension Expense and Deferred Outflows/Inflows of Resources Related to Pension
For the year ended September 30, 2016, the City recognized pension expense of $0.2 million. At September 30, 2016 the City reported deferred outflows of resources from the following sources:
There is $0.5 million reported as deferred outflows of resources related to pensions resulting from City contributions made subsequent to the measurement date. Amounts will be recognized as a reduction of the net pension liability in the year ended September 30, 2017. Other amounts reported as deferred outflows of resources related to pensions will be recognized in pension expense at September 30, 2016, follows:
Year ended September 30:2017 $76,1432018 $76,1432019 $76,1432020 $40,619
The following summarizes net pension liability, deferred inflow and outflow of resources at September 30, 2016, for each Pension Plan as previously discussed in Note 10:
PlanNet Pension
LiabilityDeferred Inflow
of ResourcesDeferred Outflow
of ResourcesFIPO $ 522,448,981 $ 26,541,499 $ 102,190,481 GESE Trust 284,748,033 6,399,163 55,315,512 GESE Excess Benefit 12,750,481 - 3,242,208 GESE Staff Trust 1,827,256 - 881,463 EORT 1,680,002 - 738,498 Total $ 823,454,753 $ 32,940,662 $ 162,368,162
125
CITY OF MIAMI, FLORIDANOTES TO FINANCIAL STATEMENTSSeptember 30, 2016
The schedules of changes in the net pension liability and related ratios and the schedules of contributions, presented as Required Supplementary Information (RSI) following the notes to the financial statements, provides additional information about the net pension liability, plan assets and contributions for each of the City’s defined benefit pension plan.
Special Benefit Plans (SBP)
Certain executive employees of the City are allowed to join the ICMA Retirement Trust's 401(a) plan (the “SBP”). This defined contribution deferred compensation plan, which covers governmental employees throughout the country, is governed by a Board of Directors responsible for carrying out the overall management of the organization, including investment administration and regulatory compliance. Membership for the City employees is limited by the City Code to specific members of the City Clerk, City Manager, City Attorney's offices, Department Directors, Assistant Directors, and other executives. To participate in the plan a written trust agreement must be executed, which requires the City to contribute 8 percent of the individual's earnable compensation, and the employee to contribute 10 percent of their salary. Participants may withdraw funds at retirement or upon separation based on a variety of payout options. The City does not have any fiduciary responsibility relating to the plan, consequently the plan assets are not recorded in the fiduciary funds of the City.
As of September 30, 2016 the City’s participation in this plan was as follows:
In addition to coverage under the FIPO, the firefighters and police officers are members of two separate non-contributory money purchase benefit plans established under the provisions of Chapters 175 and 185, Florida Statutes, respectively. These two plans are funded solely from proceeds of certain excise taxes levied by the City and imposed upon property and casualty insurance coverage within the City limits. This tax, which is collected from insurers by the State of Florida, is remitted directly to the Plans' Boards of Trustees. The City is entitled to levy such excise taxes solely for the use of the money purchase benefit plans as long as the minimum benefit provisions of Chapter 175 and 185, Florida Statutes, are met by the FIPO. The City does not have any fiduciary responsibility relating to the SBP, consequently plan assets are not recorded in the fiduciary funds. The total of such excise taxes received from the State of Florida and remitted to the plans was $9.60 million for the year ended September 30, 2016. Accordingly, these monies are recorded as pass through funds in the City's financial statements. Benefits are allocated to the participants based upon their service during the year and the level of funding received during said year. Participants are fully vested after nine years of service. Upon termination of service, a participant may elect to receive one of the three options (1) a lump sum payment; (2) five substantially equal payments, or (3) 10 percent or more in the first year and the remainder in any way over the next four years. The total must be paid out within five years.
126
CITY OF MIAMI, FLORIDANOTES TO FINANCIAL STATEMENTSSeptember 30, 2016
NOTE 11. – POST-EMPLOYMENT HEALTH CARE BENEFITS
Pursuant to Section 112.0801, Florida Statutes, the City is required to permit participation to the health insurance program by retirees and their eligible dependents at a cost to the retiree that is no greater than the cost at which coverage is available for active employees. Retired police officers are offered coverage at a discounted premium under the Fraternal Order of Police (FOP) Health Insurance Trust (HIT) that is administered separately from the City’s health care plan. For non-police retirees (fire fighters, general employees, sanitation employees and elected officials) and their dependents, the City subsidizes health care coverage and life insurance at a discounted premium equal to the blended group rate. GASB Statement No. 45 allows flexibility to governmental employers in the use of various actuarial cost methods. Several such acceptable actuarial cost methods were evaluated, including the entry age normal cost method, the frozen entry age normal cost method, the aggregate cost method, and the projected unit credit normal cost method. The goal was for the City to adopt an actuarial cost method which is acceptable, appropriate, and commonly used. The City's annual Other Post Employment Benefit (OPEB) liability was calculated using the entry age normal cost method.
Plan Description
The City has two separate single-employer OPEB plans for its retirees. One plan is for retiring police officers and the other plan is for all other retiring employees (the “Non-Police Retirees”). The benefits afforded to all retirees include lifetime medical, prescription, vision, dental and certain life insurance coverage for retiree and dependents. Non-Police Retirees receive the same benefits as similarly situated active employees of the City, while retired police officers receive the same benefits as provided through the FOP Health Trust.
The City offers to its retiree’s comprehensive medical coverage and life insurance benefits through its self-insurance plan. This plan was established in accordance with Section 112.0801, Florida Statutes. Substantially all of the City's general employees, sanitation employees and firefighters may become eligible for these benefits when they reach normal retirement age while working for the City.
As of October 1, 2015, the most recent actuarial valuation date, there are approximately 5,389 covered participants of whom approximately 3,640 are active employees and 1,749 are retirees.
Contributions and Funding Policy
The City is authorized to establish benefit levels and approve the actuarial assumptions used in the determination of contributions levels. Retirees are contributing the majority of their premium costs each month. Spouses and other dependents are also eligible for coverage, although the retiree pays the premium cost.
The FOP sponsors a HIT that is partially self-insured, which provides life, heath, and accidental death and dismemberment insurance to substantially all full-time sworn members of the City's Police department, eligible retirees, their families and beneficiaries. The HIT receives a significant source of its funding from the City, pursuant to the terms of a collective bargaining agreement. The agreement requires the City to reimburse the HIT an amount that is required to bring the HIT's minimum fund balance to $2.35 million annually.
127
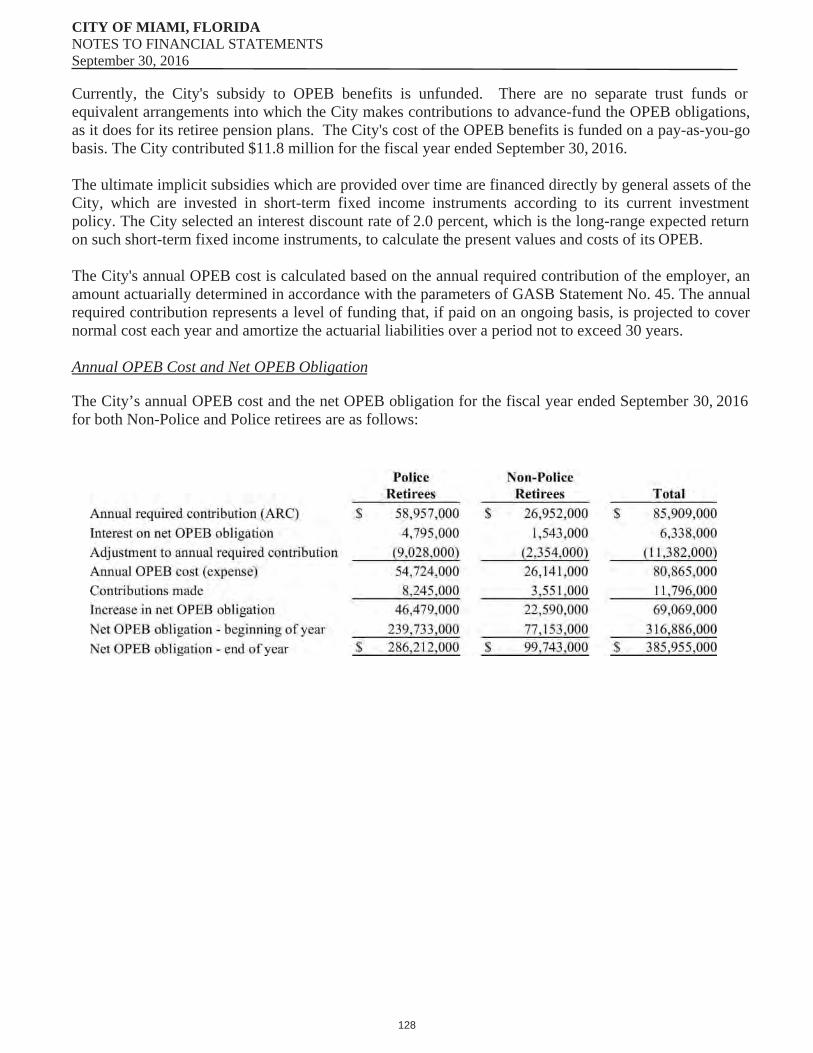
CITY OF MIAMI, FLORIDANOTES TO FINANCIAL STATEMENTSSeptember 30, 2016
Currently, the City's subsidy to OPEB benefits is unfunded. There are no separate trust funds or equivalent arrangements into which the City makes contributions to advance-fund the OPEB obligations, as it does for its retiree pension plans. The City's cost of the OPEB benefits is funded on a pay-as-you-go basis. The City contributed $11.8 million for the fiscal year ended September 30, 2016.
The ultimate implicit subsidies which are provided over time are financed directly by general assets of the City, which are invested in short-term fixed income instruments according to its current investment policy. The City selected an interest discount rate of 2.0 percent, which is the long-range expected return on such short-term fixed income instruments, to calculate the present values and costs of its OPEB.
The City's annual OPEB cost is calculated based on the annual required contribution of the employer, an amount actuarially determined in accordance with the parameters of GASB Statement No. 45. The annual required contribution represents a level of funding that, if paid on an ongoing basis, is projected to cover normal cost each year and amortize the actuarial liabilities over a period not to exceed 30 years.
Annual OPEB Cost and Net OPEB Obligation
The City’s annual OPEB cost and the net OPEB obligation for the fiscal year ended September 30, 2016 for both Non-Police and Police retirees are as follows:
128
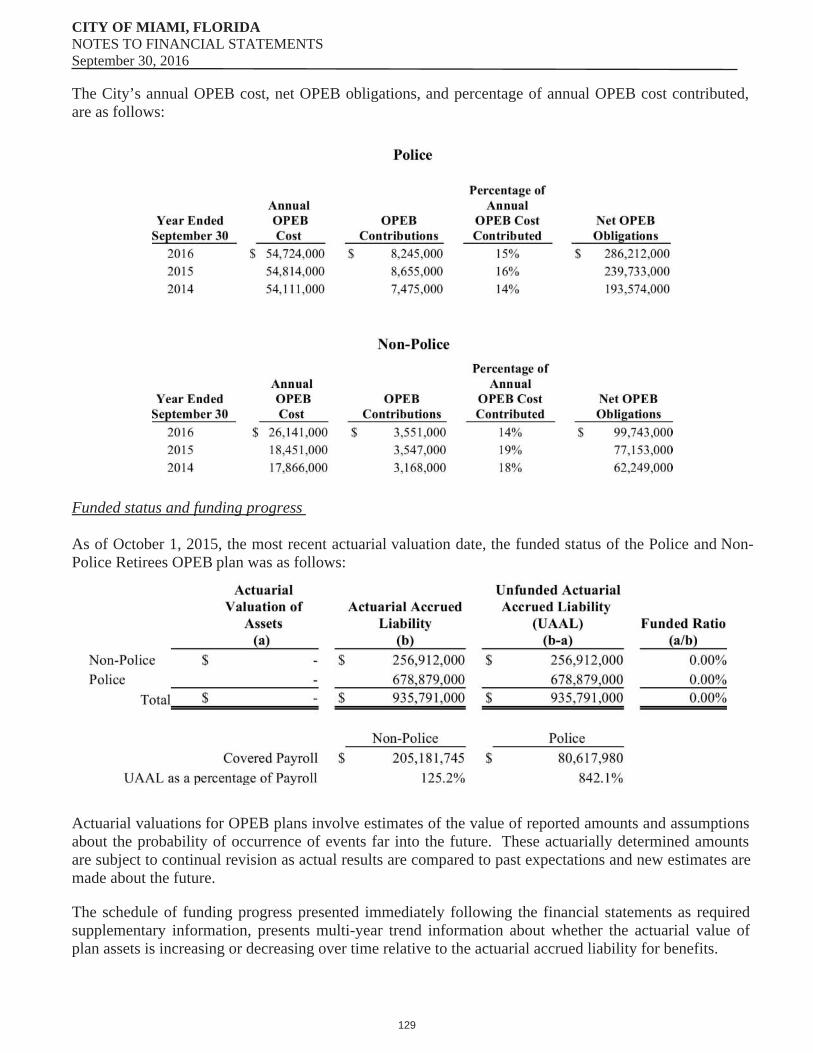
CITY OF MIAMI, FLORIDANOTES TO FINANCIAL STATEMENTSSeptember 30, 2016
The City’s annual OPEB cost, net OPEB obligations, and percentage of annual OPEB cost contributed, are as follows:
Funded status and funding progress
As of October 1, 2015, the most recent actuarial valuation date, the funded status of the Police and Non-Police Retirees OPEB plan was as follows:
Actuarial valuations for OPEB plans involve estimates of the value of reported amounts and assumptions about the probability of occurrence of events far into the future. These actuarially determined amounts are subject to continual revision as actual results are compared to past expectations and new estimates are made about the future.
The schedule of funding progress presented immediately following the financial statements as required supplementary information, presents multi-year trend information about whether the actuarial value of plan assets is increasing or decreasing over time relative to the actuarial accrued liability for benefits.
129
CITY OF MIAMI, FLORIDANOTES TO FINANCIAL STATEMENTSSeptember 30, 2016
Actuarial Methods and Assumptions
Projection of benefits for financial reporting purposes are based on the substantive OPEB plan (the OPEB plan as understood by the employer and the members) and include the types of benefits provided at the time of each valuation and the historical pattern of sharing of benefit costs between the employer and plan members. The actuarial methods and assumptions used include techniques that are designed to reduce the effects of short-term volatility in actuarial accrued liabilities and the actuarial value of assets, consistent with the long-term perspective of calculations.
The annual required contribution for the OPEB Other Than Police plan year was determined as part of the plan’s October 1, 2015 actuarial valuation using the following methods and assumptions:
Mortality rates are calculated with the RP 2014 Mortality Table with MP-2016 Projection Scale, applied on a gender specific basis.
The annual required contribution for the OPEB Police plan year was determined as part of the plan’s October 1, 2015 actuarial valuation using the following methods and assumptions:
Mortality rates are calculated with the RPH 2014 Total Dataset mortality table using the Society of Actuaries Mortality Projection Scale MP-2015.
Valuation date: October 1, 2015Actuarial cost method: Entry age normal Amortization method: Level percent of payrollAmortization period: The unfunded actuarial accrued liability is amortized over a
period of 22 years on a closed basis with a startingamortization period of 30 years which began in FY 2008
Actuarial Assumptions: Assumed rate of return on investments: 2.00% Projected salary increases: 3.5% Per annum Discount rate: 2.00% Assumed health care cost trend rates: 8.5% for pre-65 medical and 8.5% for post-65 medical, grading
down by .05% annually until an ultimate trend rate of 5.0% isreached.
Valuation date: October 1, 2015Actuarial cost method: Entry age normal Amortization method: Level percent of payrollActuarial Assumptions: Assumed rate of return on investments: 2.00% Projected salary increases: 3.5% Per annum Discount rate: 2.00%
130
CITY OF MIAMI, FLORIDANOTES TO FINANCIAL STATEMENTSSeptember 30, 2016
NOTE 12. – COMMITMENTS AND CONTINGENCIES
The City participates in a number of federal and state assisted programs. These programs are subject to audit under the requirements of the Florida Single Audit Act and Chapter 10.550, Rules of the Auditor General and OMB Uniform Guidance. The City received revenues and contributions related to grants from Federal agencies and the State of Florida. These grants are for specific purposes and are subject to review and audit by the grantor agencies. Such audits could result in requests for reimbursement for expenditures being disallowed under the grant terms. Based upon prior experience, the City’s management believes any requests for reimbursement, if any, will not be significant.
Global Agreement: In December 2007, the City, the County, the OMNI CRA, and the Southeast Overtown Park West CRA, entered into an inter-local agreement that establishes the funding framework for the several major facilities and infrastructure improvement projects. Those projects include the Arsht Performing Arts Center (“Arsht Center”), Miami Port Tunnel, Museum Park improvements, and the Miami Marlins Baseball Stadium and parking facilities.
The agreement specifically calls for the OMNI CRA to increase its contribution to the County to service debt and other loans on the Arsht Center. Further, the agreement established parameters by which the City, County, and CRAs would move forward with the legal process of extending the lives and expanding the geographic boundaries of both CRAs, and utilizing the additional tax increment revenues to finance affordable housing, infrastructure, and redevelopment projects consistent with the CRAs’ redevelopment plans. The additional OMNI CRA tax increment revenues were available to finance the City’s contributions to the Miami Port Tunnel project and the Museum Park improvements. Finally, the agreement addresses the City’s and County’s Miami Marlins Major League Baseball project stadium and related parking facilities built on the former Orange Bowl location site. To date, the total contributions required to be made by the City for the Museum Park Improvement projects has not been determined. The OMNI CRA has voted to provide an annual grant of tax increment revenues to the City in connection with repayment of the City’s Special Obligation Non-Ad Valorem Revenue Refunding Bonds, Series (Port of Miami Tunnel Project) issued December 13, 2012. The Special Obligation Non-Ad Valorem Revenue Refunding Bonds is City debt. As such the City is responsible for all debt service. However, the OMNI CRA has agreed to provide the City with the required annual debt service. In the event the CRA defaults on its commitment to the City, the City would be responsible to pay the debt service from legally available funds. As of September 30, 2016, the total outstanding related debt for the Non-Ad Valorem Revenue Refunding Bonds, Series (Port of Miami Tunnel Project) issued December 13, 2012 was approximately $42.6 million.
FOP, Miami Lodge No. 20 and Alfredo Vega v. City of Miami, et al. This is an action by the Fraternal Order of Police (“FOP”) and individual law enforcement officers challenging the 1994 police sergeant's examination seeking promotions retroactive to 1994, with back pay and emoluments. The testing company was joined as a party but severed from the present proceedings. The trial court bifurcated the action to address liability separate from damages. The liability portion of this case was tried in 2007, and the trial court ruled that the exam did not comply with the Civil Service Rules. The parties are now in the damages portion. The trial court has ruled that FOP did not have standing to recover any monetary relief, thereby leaving the seven individual Plaintiffs and an additional individual who was permitted to intervene. Additional union members have moved to intervene. The FOP has appealed. The City’s potential exposure may exceed $1,000,000.
131
CITY OF MIAMI, FLORIDANOTES TO FINANCIAL STATEMENTSSeptember 30, 2016
Fraternal Order of Police, Walter E. Headley, Jr., Miami Lodge No. 20 v. City of Miami, The FOP Miami Lodge 20 (hereinafter the "Union") alleges that it has a Collective Bargaining Agreement ("CBA") with the City, effective through September 30, 2010, that the parties exchanged initial proposals for a successor agreement, and that the parties have held several bargaining sessions. The Union further alleges that during the several bargaining sessions, the City never advised the Union that there was a need to reach settlement on economic items expeditiously, or that the City intended to declare a "financial urgency" and invoke the process set forth in Section 447.4095, F.S. The Union contends that Section 447.4095 may only be invoked to modify the terms of an existing agreement. The Union further alleges that although the parties continued to bargain for a successor collective bargaining agreement on August 9 and 12, 2010, the parties never discussed wages or pensions, but on August 16, 2010, the City advised the Public Employees Relations Commission ("PERC") that it had engaged in negotiations on the impact of the financial urgency, and any action necessitated by the financial urgency, and that a dispute existed. The Union then alleges that on August 31, 2010, the City unilaterally took action to alter the terms and conditions of employment before reaching impasse with the Union, in violation of Section 447.501(1)(a) and (1)(c). Further, the Union alleges that, although the changes were not discussed with them, they were discussed in a closed door unnoticed "shade" meeting conducted in violation of Section 447.605, F.S. (an exemption to the Sunshine Law). The Union contends that the failure of the City to have any discussions with the Union on these matters constitutes bad faith or surface bargaining in violation of Section 447.501(1) (a), F.S. It also asserts that by unilaterally altering terms and conditions of employment before completion of the impasse procedure set forth in Section 447.403, F.S., and by not responding to a request for records, the City violated Section 447.501(1)(a) and (1)(c), F.S. The City received a recommended order from the Hearing Officer in its favor, which was ultimately adopted by the Commission. The FOP has appealed to the Florida District Court of Appeals, First District. The First District affirmed. The FOP has sought review by the Florida Supreme Court. The First District affirmed and the Florida Supreme Court has accepted review. The Supreme Court heard oral argument. On Thursday, March 2, 2017, the Florida Supreme Court rendered its opinion in Headley, et al. v. City of Miami. The court rejected the first district opinion and remanded for further proceedings consistent with the opinion. As of date of the report the City cannot predict the outcome of this case or financial consequences, if any.
International Association of Firefighters, Local 587 v. City of Miami, The IAF Local 587 (hereinafter "Union") alleges that it has a Collective Bargaining Agreement ("CBA") with the City, effective through October 1, 2010, that, in exchange for concessions by the Union, the CBA was extended through September 30, 2011, and that the City expressly waived its right not to fund any year of the CBA except in the case of "true fiscal emergency", defined in the CBA as, "the City must demonstrate that there is no other reasonable alternative means of appropriating monies to fund the agreement for that year or years". The Union further alleges that less than six (6) months after agreeing to the extension, on April 30, 2010, the City invoked the process under Section 447.4095, F.S., claiming "financial urgency," and on August 31, 2010, unilaterally took action to modify wages, insurance and pension benefits. The Union asserts that the invocation of Section 447.4095, F.S. was improper and was waived by the City in the CBA. Further, the Union alleges that, prior to their enactment, the modifications to the CBA were discussed in a closed door, unnoticed shade meeting in violation of Section 447.605, F.S. (an exemption to the Sunshine Law). Finally, the Union asserts that the City failed to bargain collectively and in good faith by enacting the changes of August 31, 2010, by not providing the Union with notice in advance, and by failing to discuss, bargain over, impact bargain, or complete the process set forth in Section 447.403 and/or Section 447.4095, F.S. The City received a recommended order from the Hearing Officer in its favor, which was adopted by the Commission. The District Court of Appeal, Third District affirmed, and the Florida Supreme Court has stayed the case pending resolution of Headley v. City of Miami. On Thursday, March 2, 2017, the Florida Supreme Court rendered its opinion in Headley, et al. v. City of Miami. The court
132
CITY OF MIAMI, FLORIDANOTES TO FINANCIAL STATEMENTSSeptember 30, 2016
rejected the first district opinion and remanded for further proceedings consistent with the opinion. As of date of the report the City cannot predict the outcome of this case or financial consequences, if any.
Securities and Exchange Commission v. City of Miami and Former Budget Director, The plaintiff filed an action in the United States District Court in and for the Southern District of Florida against the City alleging that affirmative steps were taken to mislead the financial status of the City, thus allegedly misleading bond investors. In December 2013, the Court denied Motions to Dismiss filed by the City and by the City’s former budget director. In January 2014, the former budget director appealed to the United States Court of Appeals for the Eleventh Circuit, the lower Court’s denial of the former budget director’s Motion to Dismiss and filed a Motion for Stay of Proceedings Pending Appeal, which the lower Court granted on January 30, 2014. Subsequently, although the Eleventh Circuit denied the former budget director’s appeal in an unpublished opinion, on January 20, 2015 the Eleventh Circuit granted the former budget director’s motion for stay of issuance of mandate pending Petition for Writ of Certiorari to the United States Supreme Court. Former budget director filed his petition for Writ of Certiorari which was denied. After trial, the City and Boudreaux were found liable and a fine of $1,000,000 was imposed on the City and a fine of $15,000 was imposed on Boudreaux.
Internal Revenue Service Examination: $153,060,000 City of Miami, Florida Limited Ad Valorem Tax Refunding Bonds, Series 2007A (Homeland Defense/Neighborhood Capital Improvement Projects) & City of Miami, Florida Limited Ad Valorem Tax Bonds, Series 2007B (Homeland Defense/Neighborhood Capital Improvement Projects) dated July 10, 2007 (collectively, the “2007 Homeland Defense/Neighborhood Capital Improvement Bonds”). Since November 18, 2011, the City has been cooperating with the examination by the U.S. Department of Treasury, Internal Revenue Service (“IRS”) of the Series 2007A&B Bonds. On October 18, 2013, the IRS sent to the City a Notification of No Change Determination, which completes that examination, confirms the tax-exempt status of the Series 2007A&B Bonds, and requires the City to continue to yield restrict any unspent proceeds and to spend any remaining proceeds as soon as possible. Currently, the City continues its required spend-down progress and continues to yield restrict any remaining unspent proceeds and interest on the Series 2007 A Bonds. The series 2007 B bonds were refunded subsequent to year end on December 17, 2015. The City has completed its required spend-down progress on Series 2007 A & B proceeds and interest thereon, and that the City has filed its update Arbitrage Rebate Report with the IRS demonstrating that the City continued to yield restrict any remaining unspent proceeds and interest of the Series 2007 A & B Bonds and therefore, the City was not required to rebate any funds to the IRS.
Petroleum Products Corporation: An environmental claim is presently being asserted by the United States of America involving an alleged disposal by the City of Miami Fire Department’s service garage of 83,055 gallons of waste oil to Petroleum Products Corporation ("PPC") on November 25, 1972. PPC allegedly operated as a processor and broker of waste oil at a site located in Hollywood, Florida, and, during its period of operation, disposed of sludges generated from the oil refining process in unlined pits on the site. Contamination assessment and initial remedial activities undertaken by the United States Environmental Protection Agency ("EPA”) and the State Department of Environmental Protection ("DEP”) during the past ten (10) years indicate that the soils and groundwater at the site are significantly contaminated by waste oil and other hazardous wastes.
Based on an invoice, allegedly documenting the City’s involvement in this matter, the EPA has advised that it considers the City a generator of hazardous wastes at the site and, therefore, jointly and severally liable for the cleanup and recovery costs at the site. The EPA’s preliminary estimate for the collective costs of remedial activities at the site is approximately $26 million dollars. It should be noted that in April, 1999, the EPA offered the City a de minimis settlement offer of $344,109; however, the City
133
CITY OF MIAMI, FLORIDANOTES TO FINANCIAL STATEMENTSSeptember 30, 2016
rejected the offer. Outside counsel has re-evaluated this matter for the City and estimated the City's potential exposure for soil cleanup activities to be $154,960. This sum was calculated by multiplying the City's allocated share of liability within the Cooperating Parties Group ("CPG") - 0.596% - against what counsel for the CPG ("Common Counsel") has advised is one possible worst case cost scenario to the CPG - $20 million.
The City has joined the group of Potentially Responsible Parties ("PRP"s), and has entered into a Consent Decree with EPA on the first phase of a three-phased approach to the cleanup of the site, generally known as Operable Unit 1, 2 and 3. Following the execution of the Consent Decree by all settling PRPs, and completion of the remedial design at the site, and after further negotiations with EPA, the group of settling PRPs has taken a very aggressive technical posture at the site. The remedial design addresses not only free product recovery, but also aims to achieve significant flushing of impacted soils.
Design and Construction Loan: In July 9, 2015, the Miami City Commission passed Resolution 15-0304, accepting a design and construction loan of not to exceed $22,413,800 at 0% interest rate (collectively, "Loan") to the City of Miami ("City") from the State of Florida Department of Environmental Protection ("Department") Clean Water State Revolving Fund Program ("Program") for the Wagner Creek/Seybold Canal Project SW132000 (collectively, the"Project"). This includes 40 semi-annual loan payments beginning on or about October 15, 2017. Additionally, there is a loan service fee of $448,276 to be paid on or about October 15, 2017, by the City for the Loan through the Program. The City pledged Stormwater Utility Fees ("Stormwater Utility Fees") to secure the Loan, and covenants to budget and appropriate such Stormwater Utility Fees on an annual basis to pay debt service on the Loan. The Stormwater Utility Fees have not been previously pledged to any other debts of the City, and are legally available to be pledged to secure and repay the loan. As the City incurs expenditures for this Project, the City will seek reimbursements from the Department. The amount of the Loan will be known and the corresponding payments and fee will begin after the Project is completed. Consequently as of September 30, 2016, there is no liability for this transaction.
Post Issuance Ongoing Compliance: As of September 30, 2016, the City had approximately $19.7 million of unspent proceeds of the 2009 Streets and Sidewalks Series Bonds Streets and Sidewalks Improvement Program. To address this, the City created a working group consisting of the Office of Management and Budget, the Department of Finance, the Department of Capital Improvement, the City Attorney’s Office, and other user departments to evaluate projects and reprioritize funding of projects that will expedite the spending of the remaining proceeds, including interest thereon. Failure by the City to spend these proceeds may result in a future recapture of Transit System Sales Surtax Funds.
Litigation
The City is involved in various lawsuits arising in the ordinary course of operations. Although the outcome of these matters is not presently determinable, it is the opinion of management of the City based upon consultation with legal counsel, that the outcome of these matters will not have an adverse material effect on the financial position of the City beyond the amounts accrued for its self-insured liability and the amount accrued for estimated probable losses to date.
134

CITY OF MIAMI, FLORIDANOTES TO FINANCIAL STATEMENTSSeptember 30, 2016
Encumbrances
Encumbrance accounting, under which purchase orders, contracts and other commitments for expenditure of funds are recorded in order to reserve that portion of the applicable appropriation, is utilized in the governmental funds. Encumbrances do not constitute expenditures or liabilities and are recorded in the appropriate fund balance classifications of restricted, committed or assigned in accordance with the City’s fund balance policy.
The City has outstanding encumbrances in the governmental funds. The following is a summary of these commitments at September 30, 2016:
NOTE 13. – SUBSEQUENT EVENTS
On November 17, 2016, the Miami City Commission approved resolution #16-0563 for a declaration of intent to issue tax-exempt and/or taxable special obligation bonds in the expected total maximum principal amount of $45,000,000. This was done to reimburse the City for eligible expenses incurred with respect to certain capital improvement projects at the Miami Marine Stadium and the associated Welcome Center and Museum Complex.
On December 8, 2016, the Miami City Commission approved resolution # 16-0617 for the issuance of not to exceed $50,000,000 of City of Miami, Florida Health Facilities Authority Health Facilities Revenue and Revenue Refunding Bonds Series 2017 as conduit debt on behalf of Miami Jewish Health Systems Inc. The principal, premium, if any, and interest of the Series 2017 Bonds shall be payable solely from the sources specified from the indenture that belong to the Miami Jewish Health Systems Inc. The Series 2017 Bonds and the debt service shall not be deemed to constitute a debt, liability, obligation or a pledge of the faith and credit or taxing power of the City of Miami.
On January 2, 2017, the Miami City Commission approved resolution #17-0020 for a declaration of intent to issue tax-exempt and/or taxable special purpose improvement bonds in the expected total maximum principal amount of $18,000,000. This was done to reimburse the City from the proceeds of such special purpose improvement bonds for funds advanced by the City to pay eligible expenses incurred with respect to certain public governmental capital improvement portions of the Miami Central Station Project pursuant to the interlocal agency agreement among the City, the Southeast Overtown/Park West Community Redevelopment Agency, and South Florida Regional Transportation Authority.
135
CITY OF MIAMI, FLORIDANOTES TO FINANCIAL STATEMENTSSeptember 30, 2016
On February 9, 2017, the Miami City Commission approved a resolution #17-0071 to issue a City of Miami, Florida Special Obligation Refunding Bonds, Series 2017 (Street and Sidewalk Improvement Program) in an aggregate principal amount not exceeding $130,000,000, for the purposes of (i) refunding certain obligations of the City, (ii) funding a deposit to the reserve account for the Series 2017 Bonds, if required, and (iii) paying the costs of issuance of the Series 2017 Bonds. The bonds to be refunded are the City of Miami Series 2007 and Series 2009 Street and Sidewalk Bonds. This resolution rescinded resolution #16-0374 adopted by the City commission on July 29, 2016.
On March 22, 2017, the City received a letter of notice from the Internal Revenue Service (IRS) dated, March 15, 2017 informing the City that the Special Obligation Bonds 2007 Series Streets Improvement Program was selected for audit examination. The IRS routinely examines municipal debt issuance for compliance with federal tax requirements. The City will cooperate fully with the audit.
NOTE 14. – RESTATEMENT OF PRIOR PERIOD FINANANCIAL STATEMENTS
The City’s discretely presented component unit the Civilian Investigative Panel restated the October 1, 2015 net position of the governmental activities to report expenses incurred in connection with a settlement. Net position as of October 1, 2015 was restated as follows:
Net Position, October 1, 2015 $ 86,960 Restatement to report expenses incurred in fiscal 2015 (80,000)Net Position as restated, October 1, 2015 $ 6,960
NOTE 15. – PRONOUNCEMENTS ISSUED, BUT NOT YET ADOPTED
GASB Statement No. 75, Accounting and Financial Reporting for Postemployment Benefits Other Than Pension, the scope of this Statement addresses accounting and financial reporting for OPEB that is provided to the employees of state and local governmental employers. The provisions of this Statement are effective for fiscal years beginning after June 15, 2017. The adoption of this statement will require the City to record a material liability for the unfunded portion of its plans.
GASB Statement No. 77, Tax Abatement Disclosures, requires governments that enter into tax abatement agreements to disclose any tax being abated, the authority under which tax abatements are provided, eligibility criteria, the mechanism by which taxes are abated, provisions for recapturing abated taxes, and the types of commitments made by tax abatement recipients. The provisions of this Statement are effective for reporting periods beginning after December 15, 2015.
GASB Statement No. 80, Blending Requirements for Certain Components Units, this Statement is to improve financial reporting by clarifying the financial statement presentation requirements for certain component units. This Statement amends the blending requirements established in paragraph 53 of Statement No. 14, The Financial Reporting Entity, as amended. The requirements of this Statement are effective for reporting periods beginning after June 15, 2016.
GASB Statement No. 81, Irrevocable Split-Interest Agreements, the objective of this Statement is to improve accounting and financial reporting for irrevocable split-interest agreements by providing recognition and measurement guidance for situations in which a government is a beneficiary of the agreement. The requirements of this Statement are effective for financial statements for periods beginning after December 15, 2016, and should be applied retroactively.
136
CITY OF MIAMI, FLORIDANOTES TO FINANCIAL STATEMENTSSeptember 30, 2016
GASB Statement No. 82, Pension Issues an amendment of GASB Statements No. 67, No. 68, and No. 73, this Statement addresses issues regarding (1) the presentation of payroll-related measures in required supplementary information, (2) the selection of assumptions and the treatment of deviations from the guidance in an Actuarial Standard of Practice for financial reporting purposes, and (3) the classification of payments made by employers to satisfy employee (plan member) contribution requirements. The provisions of this Statement will be effective for the City beginning with its year ending September 30, 2017, except for the requirements of this Statement for the selection of assumptions in a circumstance in which an employer’s pension liability is measured as of a date other than the employer’s most recent fiscal year-end. In that circumstance, the requirements for the selection of assumptions are effective for the City beginning with its year ending September 30, 2018.
GASB Statement No. 83, Certain Asset Retirement Obligations, this Statement will enhance comparability of financial statements among governments by establishing uniform criteria for governments to recognize and measure certain AROs, including obligations that may not have been previously reported. This Statement also will enhance the decision-usefulness of the information provided to financial statement users by requiring disclosures related to those AROs.
The City’s management has not yet determined the effect these statements will have on the City’s financial statements.
137
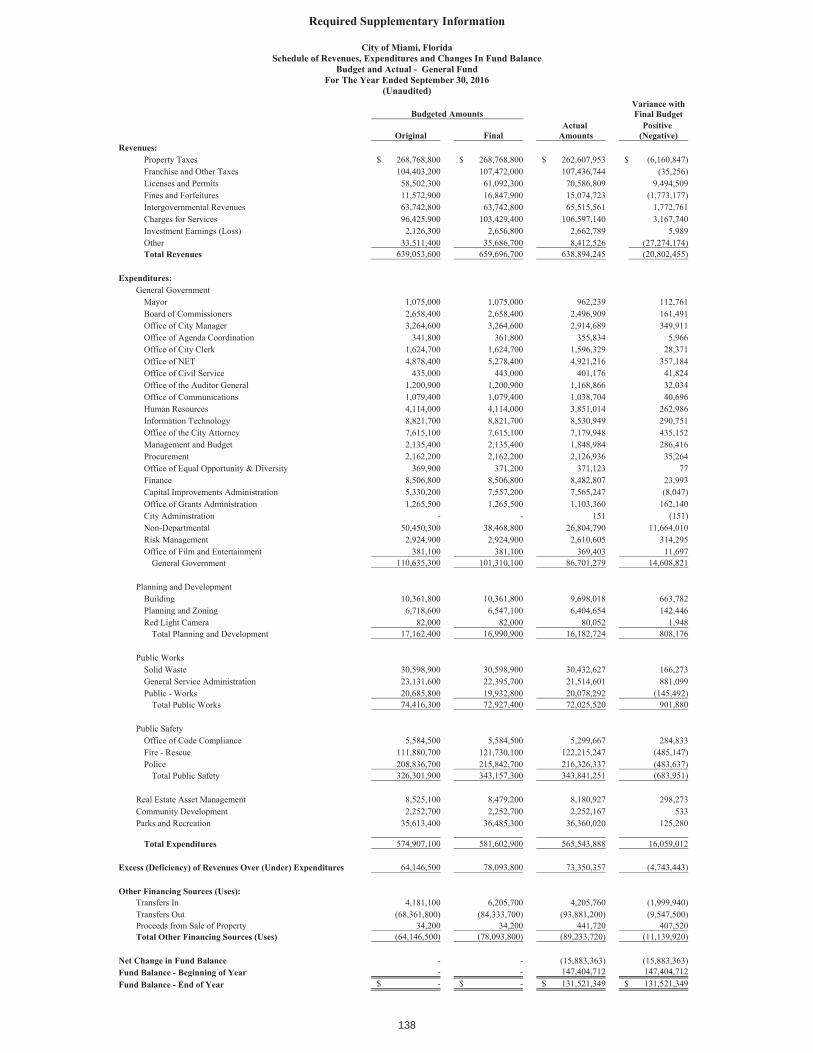
138
Notes to Required Supplementary Information
City of Miami, FloridaYear Ended September 30, 2016
(Unaudited)NOTE 1. - BUDGETARY POLICY
A. Budget Policy
The City Commission annually adopts an operating budget ordinance for all governmental funds of the City, except for the Capital Project Funds. The Capital Project Funds are budgeted on a total project basis for which annual budgets are not available. For governmental funds, budgets are prepared on a basis consistent with accounting principles generally accepted in the United States of America.
B. Budget-Legal Compliance
The City follows these procedures in establishing the budgetary data reflected in the accompanying financial statements:
Prior to August 31st, the City Manager submits to the City Commission a proposed operating budget by fund, except for the General Fund, which is at the departmental level, for the fiscal year commencing the upcoming October 1st. The operating budget includes proposed expenditures and the means of financing them.
The Mayor prepares and delivers a budgetary address annually to the people of the City between July 1 st and September 30th.
Such report is prepared after consultation with the City Manager.
Public hearings are conducted to obtain taxpayer comments.
Prior to October 1st, the budget is legally enacted through the passage of a resolution and adoption of the budget report.
Management may not make changes to the adopted budget without the approval of a majority vote of the Commission.
The Commission may transfer among departments any part of an unencumbered balance of an appropriation to a purpose for which an appropriation for the current year has proved insufficient. At the close of each fiscal year, the unencumbered balance of each appropriation reverts to the fund from which it was appropriated and is subject to future appropriations.
Budgets are monitored at varying levels of classification detail; however, budgetary control is legally maintained at the fund level except for the General Fund, which is maintained at the departmental level.
All budget amendments require City Commission approval. During fiscal year 201 6, supplemental appropriations totaling $20.19 million in the General Fund, comprised of increased allocations of $10.6 million to General Fund expenditures by departments and $9.56 million in Transfers-In. The Special Revenue Funds budget was also increased in fiscal year 2016 by approximately $6.87 million, of which $222,900 was allocated to Fire Rescue Services, $5.23 million to Urban Areas and Security Initiatives, $450,000 to Homeless Programs, $50,000 to Parks and Recreation Services, $245,900 to Police Services, $668,400 to Departmental Improvement Initiatives, and $40,750 to Transportation and Transit. During fiscal year 2016, the General fund had expenditures of approximately $4.4 million attributable to capital expenditures; these expenditures are budgeted at the department level and not reported separately on the General Fund Budget to Actual Schedule of Revenues, Expenditures and Changes in Fund Balance presented on page 138.
139
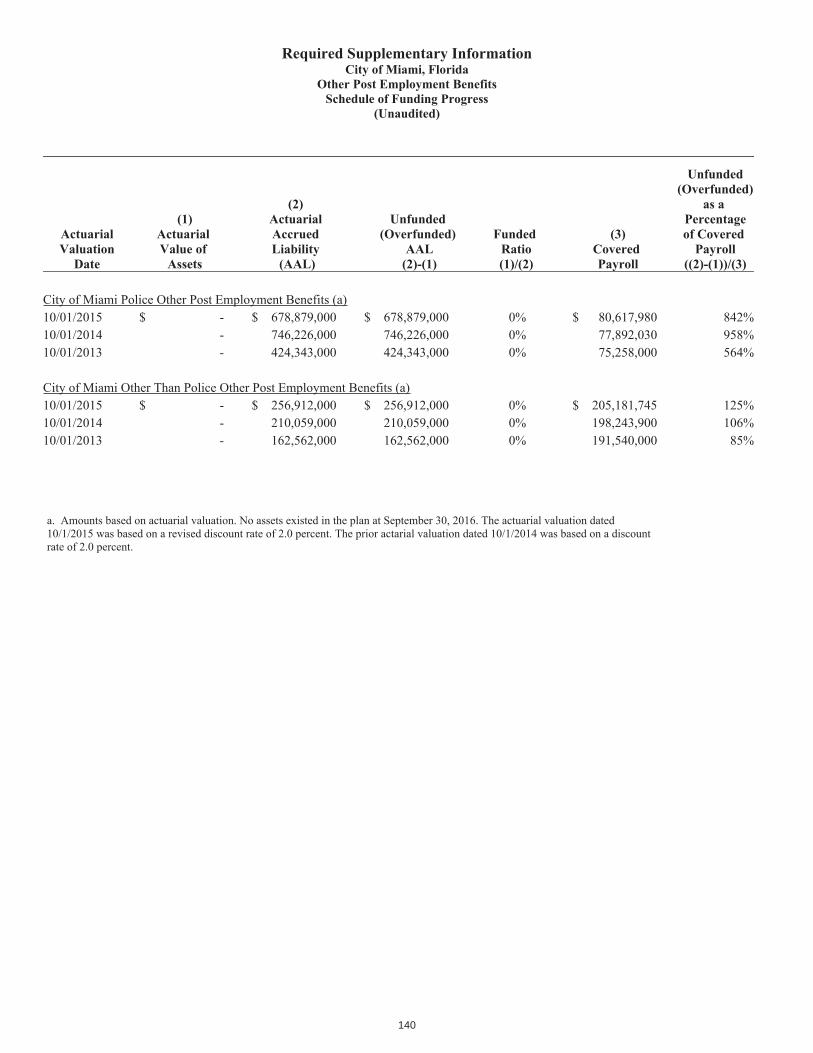
140
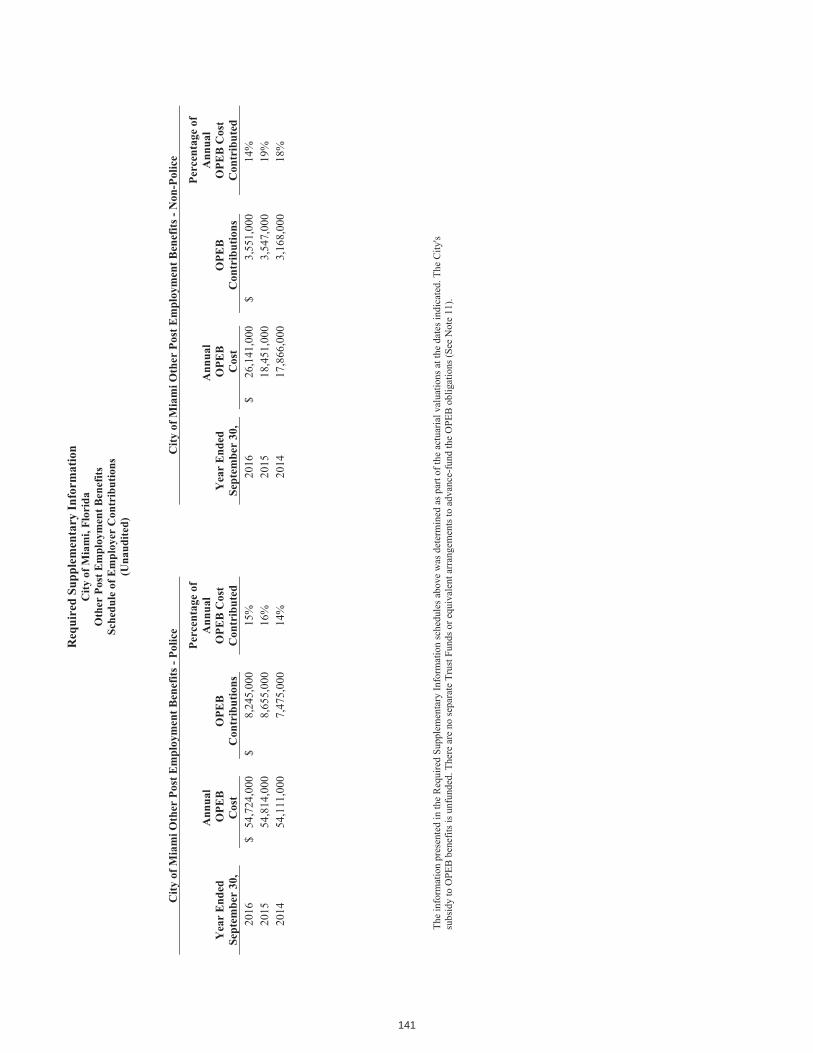
141

2016 2015 2014Total pension liability
Service cost 21,625,163$ 19,203,823$ 17,233,272$Interest 156,265,650 156,479,438 155,338,970
Changes of benefit terms - 9,453,429 -Differences between expected and actual experience 12,725,721 (16,970,540) (6,638,755)Changes of assumptions 30,651,781 14,895,466 -Benefit payments, including refunds of member contributions (166,203,470) (165,535,327) (139,860,276)
Net change in total pension liability 55,064,845 17,526,289 26,073,211
Total pension liability - beginning 2,167,482,636 2,149,956,347 2,123,883,136Total pension liability - ending 2,222,547,481 2,167,482,636 2,149,956,347
Plan fiduciary net positionContributions - employer 48,672,615 48,616,677 47,654,757Contributions - member 12,082,805 9,317,231 9,462,569Net investment income 132,946,827 35,529,492 133,609,444
(166,203,470) (165,535,327) (139,860,276)Administrative expenses (2,029,168) (2,222,561) (2,086,240)Other (42,726) 269,771 (42,726)Net change in plan fiduciary net position 25,426,883 (74,024,717) 48,737,528
Plan fiduciary net position - beginning 1,674,671,617 1,748,696,334 1,699,958,806Plan fiduciary net position - ending 1,700,098,500$ 1,674,671,617$ 1,748,696,334$
City's net position liability 522,448,981$ 492,811,019$ 401,260,013$
Covered-employee payroll 106,278,378$ 93,705,765$ 85,222,842$
491.59% 525.91% 470.84%
Note to Schedule:This Schedule is presented to illustrate the requirement of GASB 68. The City implemented GASB No.68 for the fiscal year ended September 30, 2015.This Schedule will present 10 years as information becomes available.
Benefit payments, including refunds of member contributions
Net pension liability as a percentage of covered-employee payroll
Required Supplementary Information
City of Miami, FloridaSchedule of Changes in the Net Pension Liability and Related Ratios
Firefighters and Police (FIPO)Last Three Fiscal Years
(Unaudited)
142
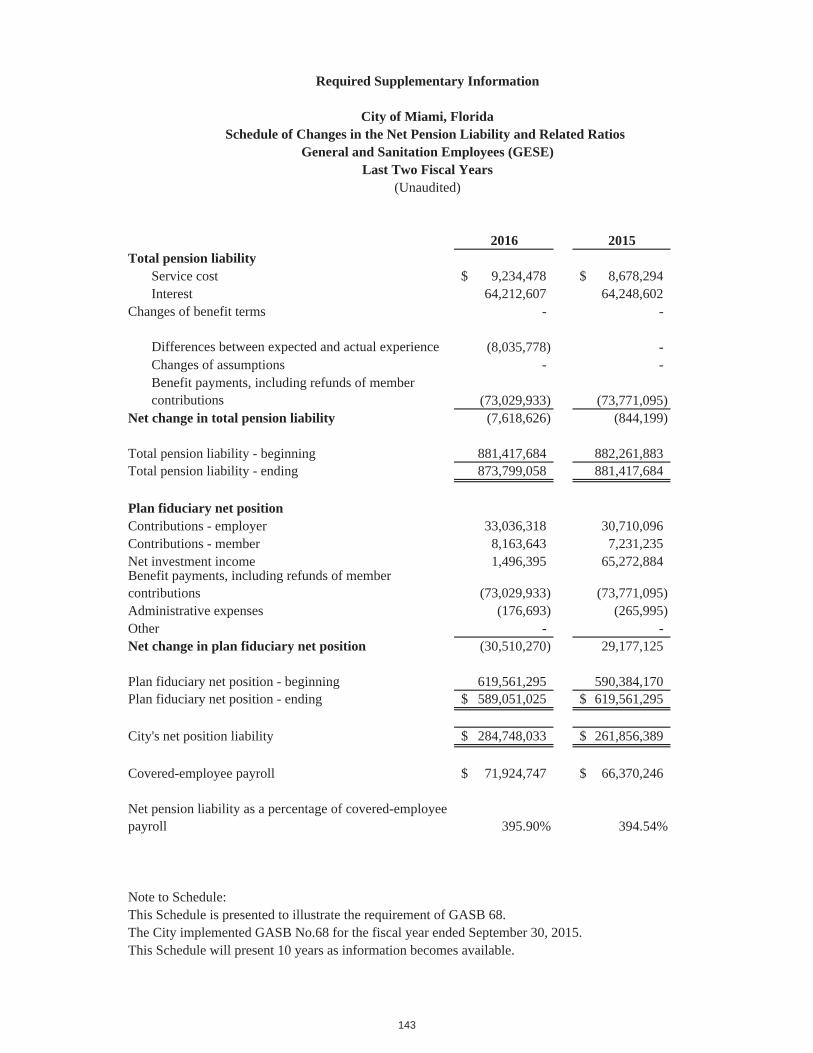
Required Supplementary Information
City of Miami, FloridaSchedule of Changes in the Net Pension Liability and Related Ratios
General and Sanitation Employees (GESE)Last Two Fiscal Years
(Unaudited)
2016 2015Total pension liability
Service cost 9,234,478$ 8,678,294$ Interest 64,212,607 64,248,602
Changes of benefit terms - -
Differences between expected and actual experience (8,035,778) - Changes of assumptions - - Benefit payments, including refunds of member contributions (73,029,933) (73,771,095)
Net change in total pension liability (7,618,626) (844,199)
Total pension liability - beginning 881,417,684 882,261,883 Total pension liability - ending 873,799,058 881,417,684
Plan fiduciary net positionContributions - employer 33,036,318 30,710,096 Contributions - member 8,163,643 7,231,235 Net investment income 1,496,395 65,272,884
(73,029,933) (73,771,095) Administrative expenses (176,693) (265,995) Other - - Net change in plan fiduciary net position (30,510,270) 29,177,125
Plan fiduciary net position - beginning 619,561,295 590,384,170 Plan fiduciary net position - ending 589,051,025$ 619,561,295$
City's net position liability 284,748,033$ 261,856,389$
Covered-employee payroll 71,924,747$ 66,370,246$
395.90% 394.54%
Note to Schedule:This Schedule is presented to illustrate the requirement of GASB 68. The City implemented GASB No.68 for the fiscal year ended September 30, 2015.This Schedule will present 10 years as information becomes available.
Benefit payments, including refunds of member contributions
Net pension liability as a percentage of covered-employee payroll
143

Required Supplementary Information
City of Miami, FloridaSchedule of Changes in the Net Pension Liability and Related Ratios
General and Sanitation Employees Excess Benefit Plan (GESE Excess)Last Two Fiscal Years
(Unaudited)
2016 2015Total pension liability
Service cost -$ -$ Interest 392,659 427,362
Changes of benefit terms - -
Differences between expected and actual experience 3,177,002 763,199 Changes of assumptions - - Benefit payments, including refunds of member contributions (653,302) (556,805)
Net change in total pension liability 2,916,359 633,756
Total pension liability - beginning 9,834,122 9,200,366 Total pension liability - ending 12,750,481 9,834,122
Plan fiduciary net positionContributions - employer 648,302 561,805 Contributions - member - - Net investment income - -
(653,302) (556,805) Administrative expenses 5,000 (5,000) Other - - Net change in plan fiduciary net position - -
Plan fiduciary net position - beginning - - Plan fiduciary net position - ending -$ -$
City's net position liability 12,750,481$ 9,834,122$
Covered-employee payroll 71,924,747$ 66,370,246$
17.73% 14.82%
Note to Schedule:This Schedule is presented to illustrate the requirement of GASB 68. The City implemented GASB No.68 for the fiscal year ended September 30, 2015.This Schedule will present 10 years as information becomes available.
Benefit payments, including refunds of member contributions
Net pension liability as a percentage of covered-employee payroll
144

Required Supplementary Information
City of Miami, FloridaSchedule of Changes in the Net Pension Liability and Related Ratios
General and Sanitation Employees Staff Trust Plan (GESE Staff)Last Two Fiscal Years
(Unaudited)
2016 2015Total pension liability
Service cost 43,416$ 77,022$Interest 353,121 345,755
Changes of benefit terms - -
Differences between expected and actual experience 99,869 -Changes of assumptions - -Benefit payments, including refunds of member contributions (340,299) (311,388)
Net change in total pension liability 156,107 111,389
Total pension liability - beginning 4,816,485 4,705,096Total pension liability - ending 4,972,592 4,816,485
Plan fiduciary net positionContributions - employer 291,087 291,968Contributions - member 19,838 23,377Net investment income (15,614) 338,281
(340,299) (311,388)Administrative expenses - -Other - -Net change in plan fiduciary net position (44,988) 342,238
Plan fiduciary net position - beginning 3,190,324 2,848,086Plan fiduciary net position - ending 3,145,336$ 3,190,324$
City's net position liability 1,827,256$ 1,626,161$
Covered-employee payroll 164,547$ 298,958$
1110.48% 543.94%
Note to Schedule:This Schedule is presented to illustrate the requirement of GASB 68. The City implemented GASB No.68 for the fiscal year ended September 30, 2015.This Schedule will present 10 years as information becomes available.
Benefit payments, including refunds of member contributions
Net pension liability as a percentage of covered-employee payroll
145
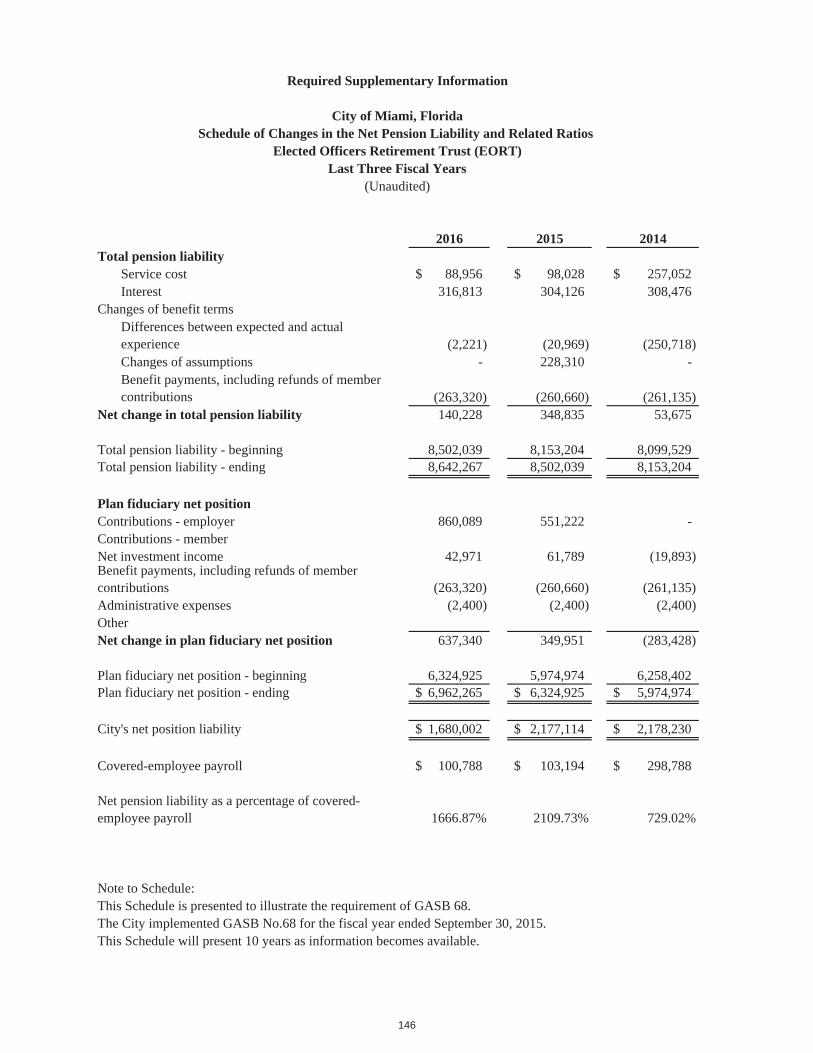
Required Supplementary Information
City of Miami, FloridaSchedule of Changes in the Net Pension Liability and Related Ratios
Elected Officers Retirement Trust (EORT)Last Three Fiscal Years
(Unaudited)
2016 2015 2014Total pension liability
Service cost 88,956$ 98,028$ 257,052$ Interest 316,813 304,126 308,476
Changes of benefit termsDifferences between expected and actual experience (2,221) (20,969) (250,718) Changes of assumptions - 228,310 - Benefit payments, including refunds of member contributions (263,320) (260,660) (261,135)
Net change in total pension liability 140,228 348,835 53,675
Total pension liability - beginning 8,502,039 8,153,204 8,099,529 Total pension liability - ending 8,642,267 8,502,039 8,153,204
Plan fiduciary net positionContributions - employer 860,089 551,222 - Contributions - memberNet investment income 42,971 61,789 (19,893)
(263,320) (260,660) (261,135) Administrative expenses (2,400) (2,400) (2,400) OtherNet change in plan fiduciary net position 637,340 349,951 (283,428)
Plan fiduciary net position - beginning 6,324,925 5,974,974 6,258,402 Plan fiduciary net position - ending 6,962,265$ 6,324,925$ 5,974,974$
City's net position liability 1,680,002$ 2,177,114$ 2,178,230$
Covered-employee payroll 100,788$ 103,194$ 298,788$
1666.87% 2109.73% 729.02%
Note to Schedule:This Schedule is presented to illustrate the requirement of GASB 68. The City implemented GASB No.68 for the fiscal year ended September 30, 2015.This Schedule will present 10 years as information becomes available.
Benefit payments, including refunds of member contributions
Net pension liability as a percentage of covered-employee payroll
146
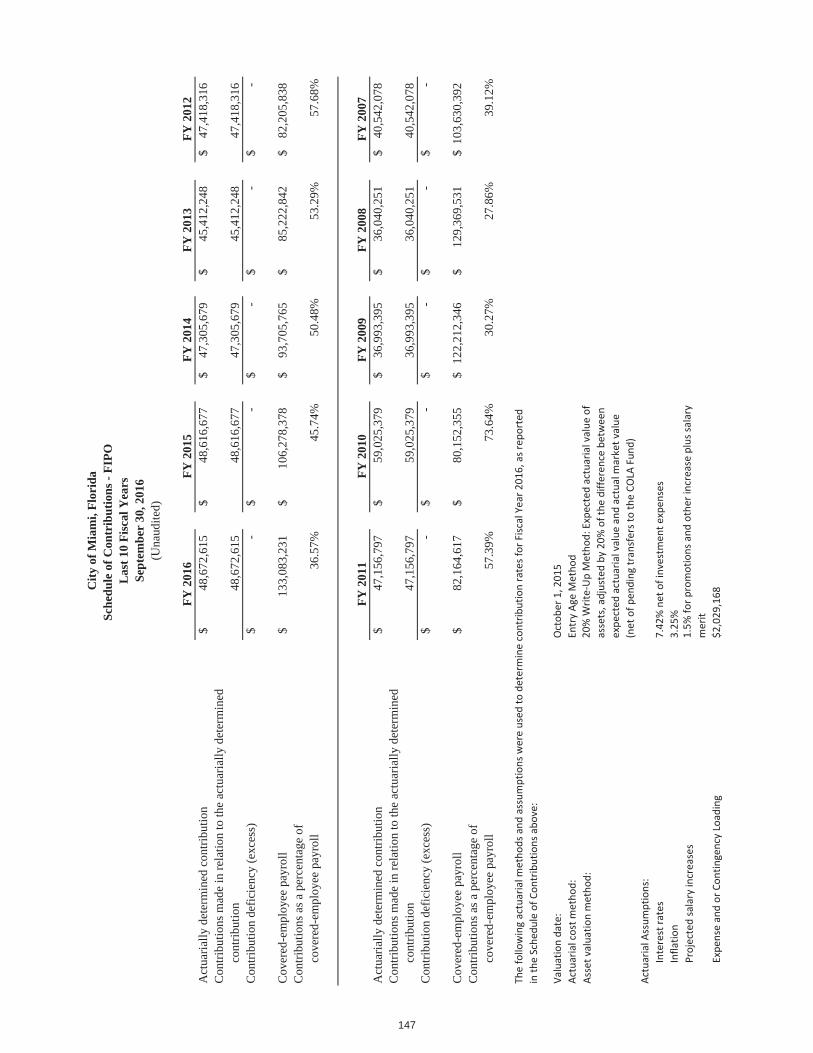
FY 2
016
FY 2
015
FY 2
014
FY 2
013
FY 2
012
Act
uaria
lly d
eter
min
ed c
ontri
butio
n48
,672
,615
$
48
,616
,677
$
47
,305
,679
$
45
,412
,248
$
47,4
18,3
16$
C
ontri
butio
ns m
ade
in re
latio
n to
the
actu
aria
lly d
eter
min
ed
cont
ribut
ion
48,6
72,6
15
48,6
16,6
77
47,3
05,6
79
45,4
12,2
48
47
,418
,316
Con
tribu
tion
defic
ienc
y (e
xces
s)-
$
-
$
-
$
-$
-
$
Cov
ered
-em
ploy
ee p
ayro
ll13
3,08
3,23
1$
106,
278,
378
$
93
,705
,765
$
85
,222
,842
$
82,2
05,8
38$
C
ontri
butio
ns a
s a p
erce
ntag
e of
co
vere
d-em
ploy
ee p
ayro
ll36
.57%
45.7
4%50
.48%
53.2
9%57
.68%
FY 2
011
FY 2
010
FY 2
009
FY 2
008
FY 2
007
Act
uaria
lly d
eter
min
ed c
ontri
butio
n47
,156
,797
$
59
,025
,379
$
36
,993
,395
$
36
,040
,251
$
40,5
42,0
78$
C
ontri
butio
ns m
ade
in re
latio
n to
the
actu
aria
lly d
eter
min
ed
cont
ribut
ion
47,1
56,7
97
59,0
25,3
79
36,9
93,3
95
36,0
40,2
51
40
,542
,078
Con
tribu
tion
defic
ienc
y (e
xces
s)-
$
-
$
-
$
-$
-
$
Cov
ered
-em
ploy
ee p
ayro
ll82
,164
,617
$
80
,152
,355
$
12
2,21
2,34
6$
12
9,36
9,53
1$
103,
630,
392
$C
ontri
butio
ns a
s a p
erce
ntag
e of
co
vere
d-em
ploy
ee p
ayro
ll57
.39%
73.6
4%30
.27%
27.8
6%39
.12%
Valuationdate:
Octob
er1,20
15Actuarialcostm
etho
d:EntryAg
eMetho
dAssetvaluatio
nmetho
d:
ActuarialA
ssum
ptions:
Interestrates
7.42
%ne
tofinvestm
ente
xpen
ses
Inflatio
n3.25
%Projectedsalary
increases
Expe
nseandor
ContingencyLoading
$2,029
,168
20%WriteUpMetho
d:Expe
cted
actuarialvalue
ofassets,adjustedby
20%of
thediffe
rencebe
tween
expe
cted
actuarialvalue
andactualmarketvalue
(net
ofpe
ndingtransferstotheCO
LAFund
)
1.5%
forp
romotions
andothe
rincreaseplus
salary
merit
City
of M
iam
i, Fl
orid
aSc
hedu
le o
f Con
trib
utio
ns -
FIPO
Sept
embe
r 30
, 201
6L
ast 1
0 Fi
scal
Yea
rs
(Una
udite
d)
Thefollowingactuarialm
etho
dsandassumptions
wereused
tode
term
inecontrib
utionratesfor
FiscalYear
2016
,asrep
orted
intheSche
duleof
Contrib
utions
above:
147

FY 2
016
FY 2
015
FY 2
014
FY 2
013
FY 2
012
Act
uaria
lly d
eter
min
ed c
ontri
butio
n33
,036
,318
$30
,710
,096
$25
,568
,193
$25
,784
,849
$20
,420
,995
$C
ontri
butio
ns m
ade
in re
latio
n to
the
actu
aria
lly d
eter
min
ed
cont
ribut
ion
33,0
36,3
1830
,710
,096
25,5
68,1
9325
,784
,849
20,4
20,9
95C
ontri
butio
n de
ficie
ncy
(exc
ess)
-$
-$
-$
-$
-$
Cov
ered
-em
ploy
ee p
ayro
ll71
,924
,747
$66
,370
,246
$64
,391
,195
$65
,509
,421
$70
,825
,712
$C
ontri
butio
ns a
s a p
erce
ntag
e of
co
vere
d-em
ploy
ee p
ayro
ll45
.93%
46.2
7%39
.71%
39.3
6%28
.83%
FY 2
011
FY 2
010
FY 2
009
FY 2
008
FY 2
007
Act
uaria
lly d
eter
min
ed c
ontri
butio
n24
,037
,093
$23
,191
,828
$22
,762
,902
$24
,229
,028
$22
,018
,443
$C
ontri
butio
ns m
ade
in re
latio
n to
the
actu
aria
lly d
eter
min
ed
cont
ribut
ion
24,0
37,0
93$
23,1
91,8
2822
,762
,902
24,2
29,0
2822
,018
,443
Con
tribu
tion
defic
ienc
y (e
xces
s)-
$-
$-
$-
$-
$
Cov
ered
-em
ploy
ee p
ayro
ll92
,746
,558
$93
,703
,886
$82
,052
,702
$75
,609
,062
$71
,845
,284
$C
ontri
butio
ns a
s a p
erce
ntag
e of
co
vere
d-em
ploy
ee p
ayro
ll25
.92%
24.7
5%27
.74%
32.0
5%30
.65%
Valuationdate:
Octob
er1,20
14Actuarialcostm
etho
d:EntryAg
eNormal
Amortizationmetho
d:Levelpercent,closed
Remaining
amortizationpe
riod:
8to
20years
Equivalent
singleam
ortizationpe
riod:
13years
Assetvaluatio
nmetho
d:5Year
Smoo
thed
Market
ActuarialA
ssum
ptions:
Investmen
trateof
return
7.7%
Projectedsalary
increases
4%to
8.75
%PayrollG
rowth
3.0%
Includ
esinflatio
nat
3.5%
Costof
livingadjustmen
ts4%
pery
ear,with
$54pe
ryearm
inim
umand$4
00pe
ryearm
axim
um
City
of M
iam
i, Fl
orid
aSc
hedu
le o
f Con
trib
utio
ns -
GE
SEL
ast 1
0 Fi
scal
Yea
rsSe
ptem
ber
30, 2
016
(Una
udite
d)
Thefollowingactuarialm
etho
dsandassumptions
wereused
tode
term
inecontrib
utionratesfor
FiscalYear
2016
,asrep
orted
intheSche
duleof
Contrib
utions
above:
148

FY 2
016
FY 2
015
FY 2
014
FY 2
013
FY 2
012
Act
uaria
lly d
eter
min
ed c
ontri
butio
n94
7,66
6$
722,
999
$
66
5,65
9$
60
6,58
9$
58
5,35
7$
C
ontri
butio
ns m
ade
in re
latio
n to
the
actu
aria
lly d
eter
min
ed
cont
ribut
ion
648,
302
56
1,80
5
523,
398
514,
908
406,
243
Con
tribu
tion
defic
ienc
y (e
xces
s)29
9,36
4$
161,
194
$
14
2,26
1$
91
,681
$
179,
114
$
Cov
ered
-em
ploy
ee p
ayro
ll71
,924
,747
$
66
,370
,246
$
64
,391
,195
$
65
,509
,421
$
70,8
25,7
12$
C
ontri
butio
ns a
s a p
erce
ntag
e of
co
vere
d-em
ploy
ee p
ayro
ll0.
90%
0.85
%0.
81%
0.79
%0.
57%
FY 2
011
FY 2
010
FY 2
009
FY 2
008
FY 2
007
Act
uaria
lly d
eter
min
ed c
ontri
butio
n62
5,53
9$
566,
046
$
89
8,14
9$
82
3,37
1$
82
4,76
6$
C
ontri
butio
ns m
ade
in re
latio
n to
the
actu
aria
lly d
eter
min
ed
cont
ribut
ion
339,
602
46
4,32
5
446,
916
476,
252
463,
126
Con
tribu
tion
defic
ienc
y (e
xces
s)28
5,93
7$
101,
721
$
45
1,23
3$
34
7,11
9$
36
1,64
0$
Cov
ered
-em
ploy
ee p
ayro
ll92
,746
,558
$
93
,703
,886
$
82
,052
,702
$
75
,609
,062
$
71,4
85,2
84$
C
ontri
butio
ns a
s a p
erce
ntag
e of
co
vere
d-em
ploy
ee p
ayro
ll0.
37%
0.50
%0.
54%
0.63
%0.
65%
Valuationdate:
Octob
er1,20
14Actuarialcostm
etho
d:EntryAg
eNormal
Amortizationmetho
d:Leveldollara
mou
nts,closed
Remaining
amortizationpe
riod:
16years
Assetvaluatio
nmetho
d:Not
Applicable,the
plan
hasn
oassetsforinvestm
ent
ActuarialA
ssum
ptions:
Projectedsalary
increases
4%to
8.75
%Includ
esinflatio
nat
3.5%
Costof
livingadjustmen
tsNon
e
City
of M
iam
i, Fl
orid
aSc
hedu
le o
f Con
trib
utio
ns -
GE
SE E
xces
sL
ast 1
0 Fi
scal
Yea
rsSe
ptem
ber
30, 2
016
(Una
udite
d)
Thefollowingactuarialm
etho
dsandassumptions
wereused
tode
term
inecontrib
utionratesfor
FiscalYear
2016
,as
repo
rted
intheSche
duleof
Contrib
utions
above:
149
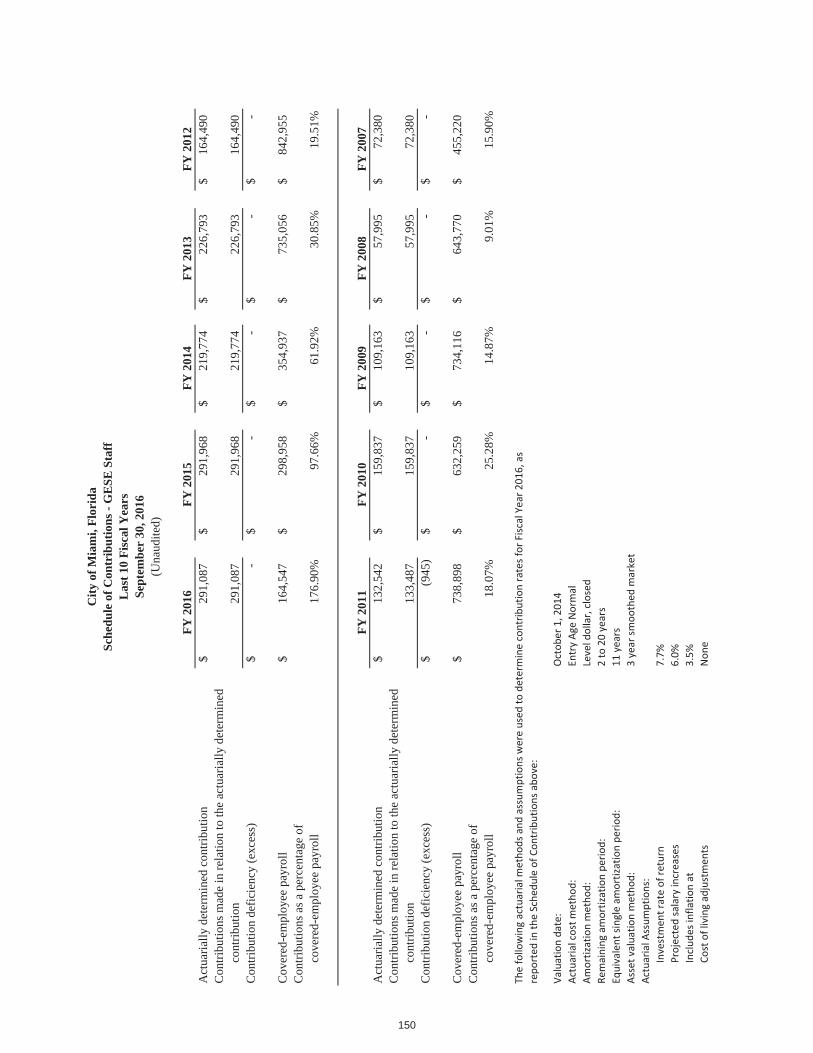
FY 2
016
FY 2
015
FY 2
014
FY 2
013
FY 2
012
Act
uaria
lly d
eter
min
ed c
ontri
butio
n29
1,08
7$
291,
968
$
21
9,77
4$
22
6,79
3$
16
4,49
0$
C
ontri
butio
ns m
ade
in re
latio
n to
the
actu
aria
lly d
eter
min
ed
cont
ribut
ion
291,
087
29
1,96
8
219,
774
226,
793
164,
490
Con
tribu
tion
defic
ienc
y (e
xces
s)-
$
-
$
-
$
-$
-
$
Cov
ered
-em
ploy
ee p
ayro
ll16
4,54
7$
298,
958
$
35
4,93
7$
73
5,05
6$
84
2,95
5$
C
ontri
butio
ns a
s a p
erce
ntag
e of
co
vere
d-em
ploy
ee p
ayro
ll17
6.90
%97
.66%
61.9
2%30
.85%
19.5
1%
FY 2
011
FY 2
010
FY 2
009
FY 2
008
FY 2
007
Act
uaria
lly d
eter
min
ed c
ontri
butio
n13
2,54
2$
159,
837
$
10
9,16
3$
57
,995
$
72,3
80$
C
ontri
butio
ns m
ade
in re
latio
n to
the
actu
aria
lly d
eter
min
ed
cont
ribut
ion
133,
487
15
9,83
7
109,
163
57,9
95
72
,380
Con
tribu
tion
defic
ienc
y (e
xces
s)(9
45)
$
-
$
-
$
-$
-
$
Cov
ered
-em
ploy
ee p
ayro
ll73
8,89
8$
632,
259
$
73
4,11
6$
64
3,77
0$
45
5,22
0$
C
ontri
butio
ns a
s a p
erce
ntag
e of
co
vere
d-em
ploy
ee p
ayro
ll18
.07%
25.2
8%14
.87%
9.01
%15
.90%
Valuationdate:
Octob
er1,20
14Actuarialcostm
etho
d:EntryAg
eNormal
Amortizationmetho
d:Leveldollar,closed
Remaining
amortizationpe
riod:
2to
20years
Equivalent
singleam
ortizationpe
riod:
11years
Assetvaluatio
nmetho
d:3year
smoo
thed
market
ActuarialA
ssum
ptions:
Investmen
trateof
return
7.7%
Projectedsalary
increases
6.0%
Includ
esinflatio
nat
3.5%
Costof
livingadjustmen
tsNon
e
City
of M
iam
i, Fl
orid
aSc
hedu
le o
f Con
trib
utio
ns -
GE
SE S
taff
Las
t 10
Fisc
al Y
ears
Sept
embe
r 30
, 201
6(U
naud
ited)
Thefollowingactuarialm
etho
dsandassumptions
wereused
tode
term
inecontrib
utionratesfor
FiscalYear
2016
,as
repo
rted
intheSche
duleof
Contrib
utions
above:
150
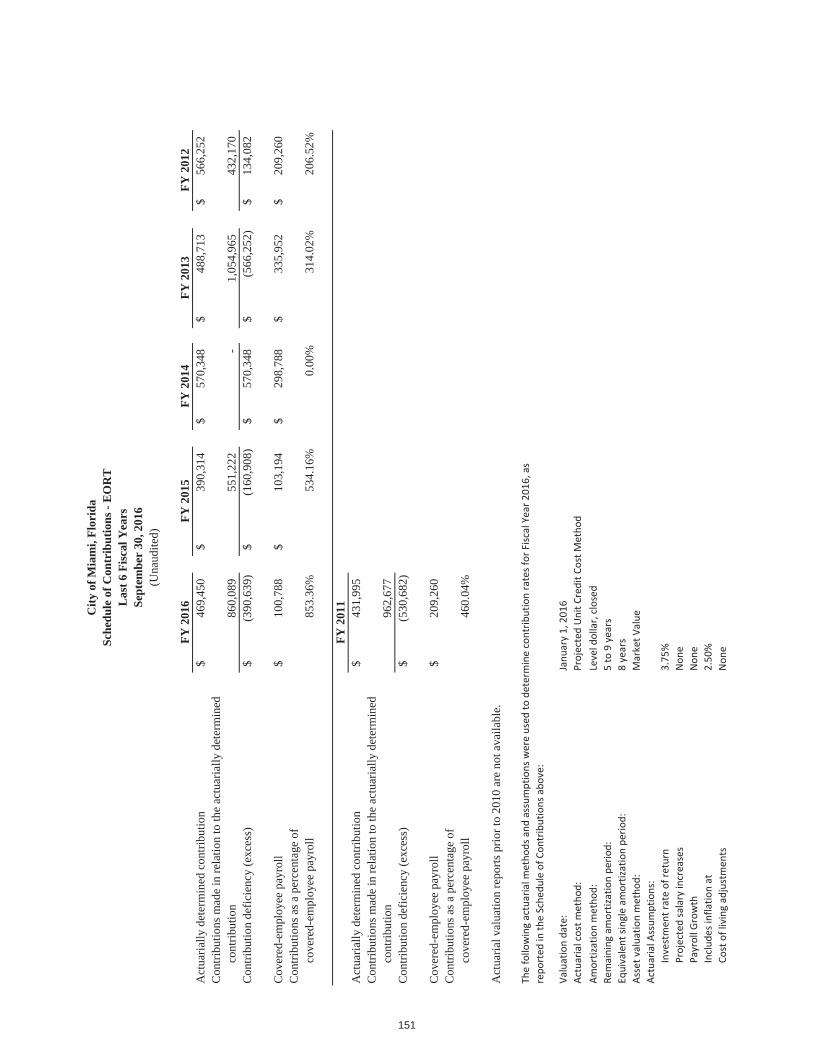
FY 2
016
FY 2
015
FY 2
014
FY 2
013
FY 2
012
Act
uaria
lly d
eter
min
ed c
ontri
butio
n46
9,45
0$
39
0,31
4$
570,
348
$
48
8,71
3$
56
6,25
2$
C
ontri
butio
ns m
ade
in re
latio
n to
the
actu
aria
lly d
eter
min
ed
cont
ribut
ion
860,
089
551,
222
-
1,05
4,96
5
432,
170
Con
tribu
tion
defic
ienc
y (e
xces
s)(3
90,6
39)
$
(1
60,9
08)
$
57
0,34
8$
(566
,252
)$
134,
082
$
Cov
ered
-em
ploy
ee p
ayro
ll10
0,78
8$
10
3,19
4$
298,
788
$
33
5,95
2$
20
9,26
0$
C
ontri
butio
ns a
s a p
erce
ntag
e of
co
vere
d-em
ploy
ee p
ayro
ll85
3.36
%53
4.16
%0.
00%
314.
02%
206.
52%
FY 2
011
Act
uaria
lly d
eter
min
ed c
ontri
butio
n43
1,99
5$
C
ontri
butio
ns m
ade
in re
latio
n to
the
actu
aria
lly d
eter
min
ed
cont
ribut
ion
962,
677
Con
tribu
tion
defic
ienc
y (e
xces
s)(5
30,6
82)
$
Cov
ered
-em
ploy
ee p
ayro
ll20
9,26
0$
C
ontri
butio
ns a
s a p
erce
ntag
e of
co
vere
d-em
ploy
ee p
ayro
ll46
0.04
%
Act
uaria
l val
uatio
n re
ports
prio
r to
2010
are
not
ava
ilabl
e.
Valuationdate:
Janu
ary1,20
16Actuarialcostm
etho
d:ProjectedUnitC
reditC
ostM
etho
dAm
ortizationmetho
d:Leveldollar,closed
Remaining
amortizationpe
riod:
5to
9years
Equivalent
singleam
ortizationpe
riod:
8years
Assetvaluatio
nmetho
d:MarketV
alue
ActuarialA
ssum
ptions:
Investmen
trateof
return
3.75
%Projectedsalary
increases
Non
ePayrollG
rowth
Non
eInclud
esinflatio
nat
2.50
%Co
stof
livingadjustmen
tsNon
e
City
of M
iam
i, Fl
orid
aSc
hedu
le o
f Con
trib
utio
ns -
EO
RT
Las
t 6 F
isca
l Yea
rsSe
ptem
ber
30, 2
016
(Una
udite
d)
Thefollowingactuarialm
etho
dsandassumptions
wereused
tode
term
inecontrib
utionratesfor
FiscalYear
2016
,as
repo
rted
intheSche
duleof
Contrib
utions
above:
151
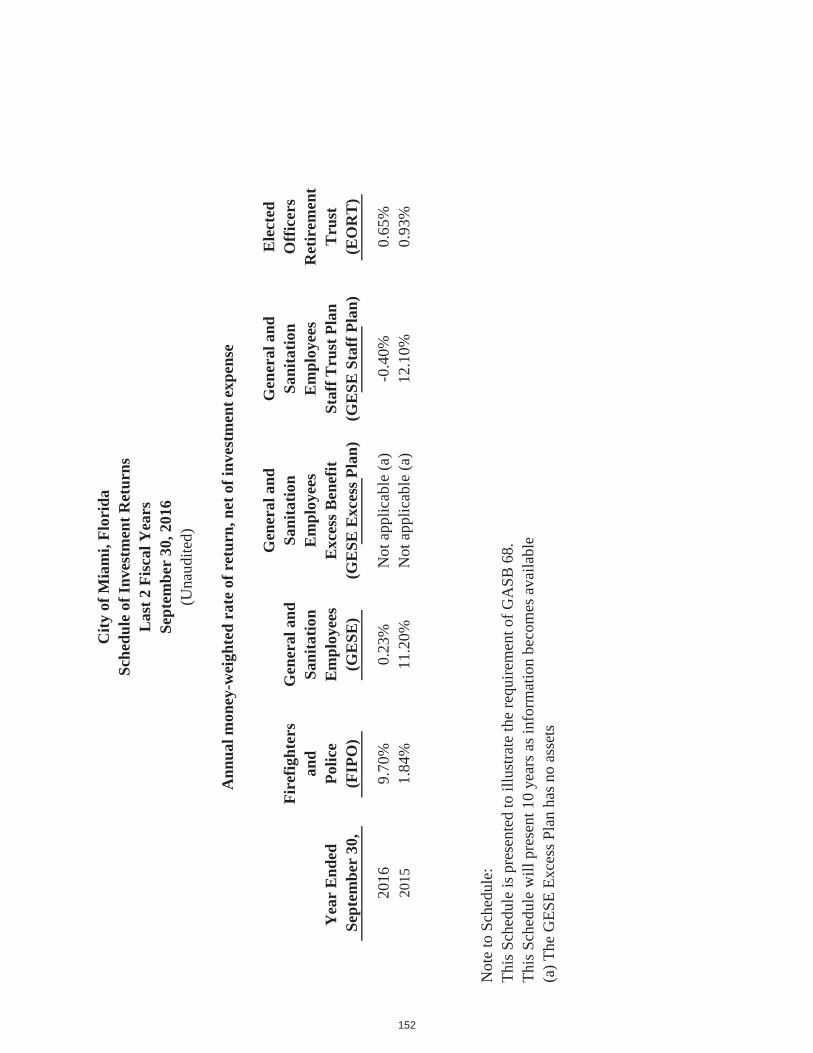
City
of M
iam
i, Fl
orid
aSc
hedu
le o
f Inv
estm
ent R
etur
nsL
ast 2
Fis
cal Y
ears
Sept
embe
r 30
, 201
6(U
naud
ited)
Ann
ual m
oney
-wei
ghte
d ra
te o
f ret
urn,
net
of i
nves
tmen
t exp
ense
Gen
eral
and
Gen
eral
and
Ele
cted
Fire
fight
ers
Gen
eral
and
Sani
tatio
nSa
nita
tion
Off
icer
san
dSa
nita
tion
Em
ploy
ees
Em
ploy
ees
Ret
irem
ent
Yea
r E
nded
Po
lice
Em
ploy
ees
Exc
ess B
enef
itSt
aff T
rust
Pla
nT
rust
Sept
embe
r 30
,(F
IPO
)(G
ESE
)(G
ESE
Exc
ess P
lan)
(GE
SE S
taff
Pla
n)(E
OR
T)
2016
9.70
%0.
23%
Not
app
licab
le (a
)-0
.40%
0.65
%20
151.
84%
11.2
0%N
ot a
pplic
able
(a)
12.1
0%0.
93%
Not
e to
Sch
edul
e:Th
is S
ched
ule
is p
rese
nted
to il
lust
rate
the
requ
irem
ent o
f GA
SB 6
8.Th
is S
ched
ule
will
pre
sent
10
year
s as i
nfor
mat
ion
beco
mes
ava
ilabl
e(a
) The
GES
E Ex
cess
Pla
n ha
s no
asse
ts
152
NON-MAJOR GOVERNMENTAL FUNDS
SPECIAL REVENUE FUNDSSpecial Revenue Funds are used to account for special revenues that are legally restricted to expenditures for specified purposes.
Community Redevelopment Agency (OMNI CRA) – To account for revenues and expenditures to be used for general operations in the defined OMNI Community Redevelopment Area.
Community Redevelopment Agency (Midtown CRA) – To account for revenues and expenditures to be used for special operations in the defined Midtown Community Redevelopment Area.
Community Redevelopment Agency (SEOPW) – To account for revenues and expenditures to be used for special operations in the defined Southeast Overtown Park West Community Redevelopment Area.
Homeless Program – To account for the activities of the City’s homeless program.
Community Development – To account for the proceeds from the Federal government under the U.S. Department of Housing and Urban Development.
Housing Choice Vouchers – To account for the monies received for administration and assistance to be provided in accordance with Section 8 of the U.S. Housing Act of 1937, as amended under the Choice Housing Voucher Program.
State Housing Initiatives Program (SHIP) – To account for the monies received from the State of Florida Housing Finance Corporation to used to provide home ownership and rental housing programs at the local level.
Convention Center – To account for the operations of the City of Miami/ University of Miami James L. Knight International Center and Parking Garage.
153

NON-MAJOR GOVERNMENTAL FUNDS
SPECIAL REVENUE FUNDSEconomic Development & Planning Services – To account for the operations of the Economic Development and Planning Services.
Net Offices – To account for the operations of the City’s Neighborhood Enhancement Teams (Net Offices).
Parks & Recreation Services – To account for the operations of the Parks and Recreation Services.
Police Services – To account for the proceeds of various grants from Local, State, and Federal Agencies that are expended for police activities.
Law Enforcement Trust – To account for confiscated monies awarded to the City for law enforcement related expenditures as stipulated by State Statutes.
Public Works Services – To account for the proceeds granted from Local and State Agencies to be used for maintenance of streets, highways, sidewalks and infrastructure.
City Clerk Services – To account for the operations of the Passport Facility, Municipal Archives and Records, and related programs.
Emergency Services Fund – This Special Revenue Fund accounts for grants and FEMA reimbursements related to disasters. Additionally, this fund accounts for non-disaster related reimbursable expenditures.
Fire Rescue Services – To account for the grants revenues and expenditures which supplement the City’s emergency Fire Rescue operations
154

NON-MAJOR GOVERNMENTAL FUNDS
SPECIAL REVENUE FUNDS
General Special Revenue– To account for activities that are designated as special revenue which do not fall into one of the previous special revenue categories.
Departmental Improvement Initiatives – To account for the funds designated for the City of Miami initiatives related to quality of life and technology.
Transportation and Transit – To account for the operations of the City’s transit and transportation projects.
Miami Ballpark Parking Facility - To account for the operations of the Miami Ballpark Parking Facility.
Liberty City Revitalization Trust – To account for the revitalization efforts for the redevelopment of the Liberty City Community Revitalization District.
Virginia Key Beach Park Trust – To account for the activities to preserve, restore, and maintain the Historic Virginia Key Beach Park.
Solid Waste Recycling Trust – To account for funds received through the recycling program that are utilized to pay for scholarships annually to educational institutions for Solid Waste employees and for the children or legal dependents of Solid Waste employees.
155
NON-MAJOR GOVERNMENTAL FUNDS
DEBT SERVICE FUNDS
Debt Service Funds are used to account for the accumulation of resources, payments of general obligation bond principal, interest from government resources, special obligation bond principal and interest from pledged revenues when the government is obligated in some manner for the payment.
General Obligation Bonds – To account for monies for payment of principal, interest, and other costs related to various issues of long-term general obligation bonds. Debt Service is financed primarily by an ad valorem tax.
SEOPW CRA Other Special Obligation Bonds – To account for monies for payment of principal, interest, and other costs related to various CRA special obligation bonds and loans.
156
NON-MAJOR GOVERNMENTAL FUNDS
CAPITAL PROJECTS FUNDS
Capital Projects Funds are used to account for the acquisition and construction of major capital facilities.
SEOPW Community Redevelopment Agency – To account for the acquisition or construction of major capital facilities for community redevelopment in the defined Community Redevelopment Area.
Transportation and Transit – To account for expenditures for the improvement to infrastructure that enhances transportation options, improves safety, and increases mobility within city limits.
General Obligation Bond Projects (G.O.B.) – To account for the receipt and disbursement of bond proceeds from general obligation debt to be used for constructions and/or acquisition activities for the City.
157
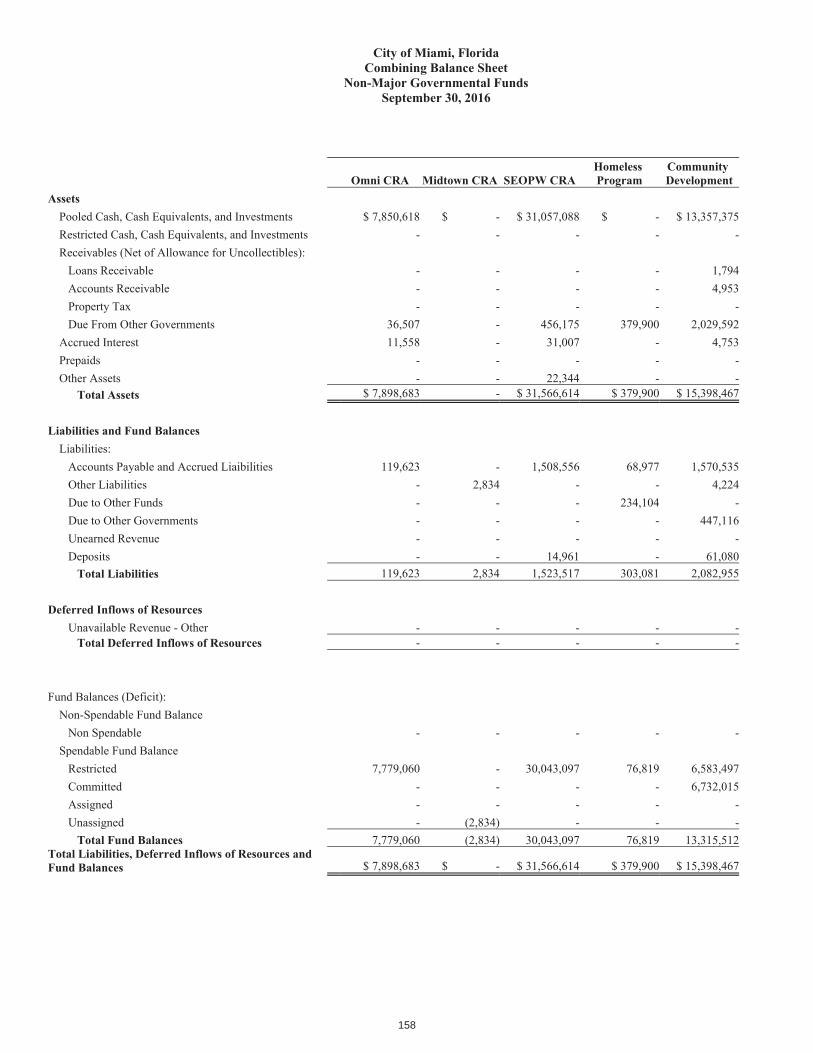
158
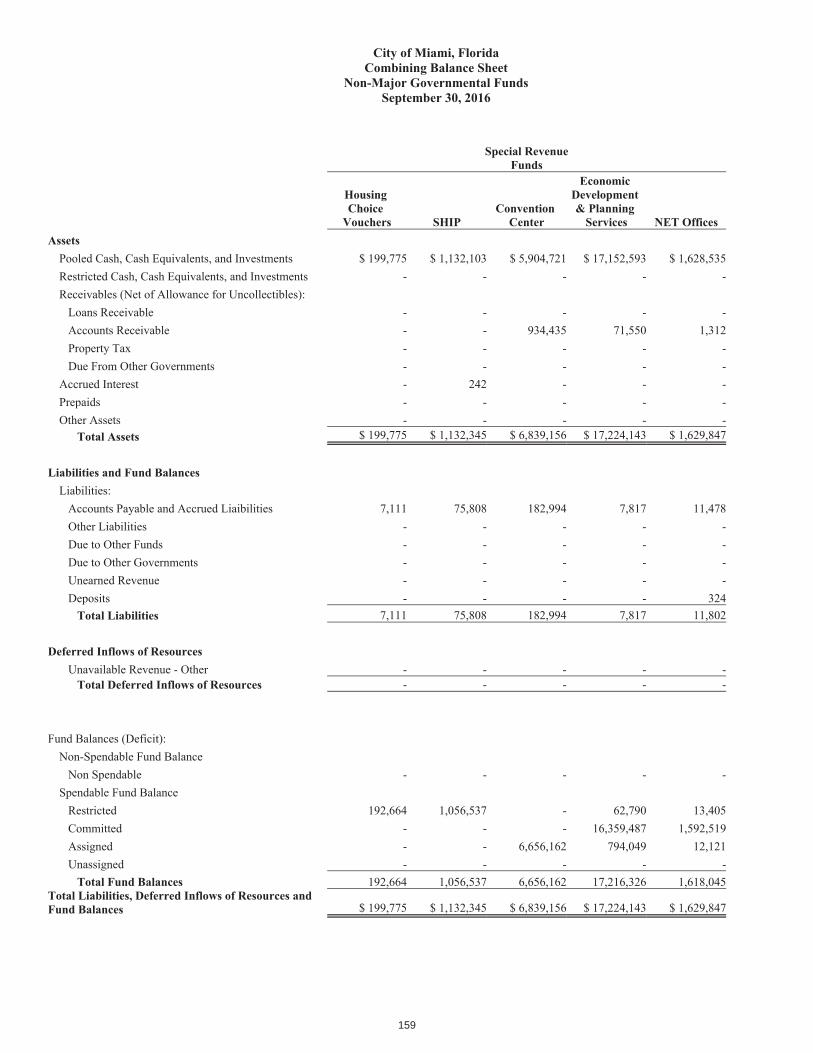
159
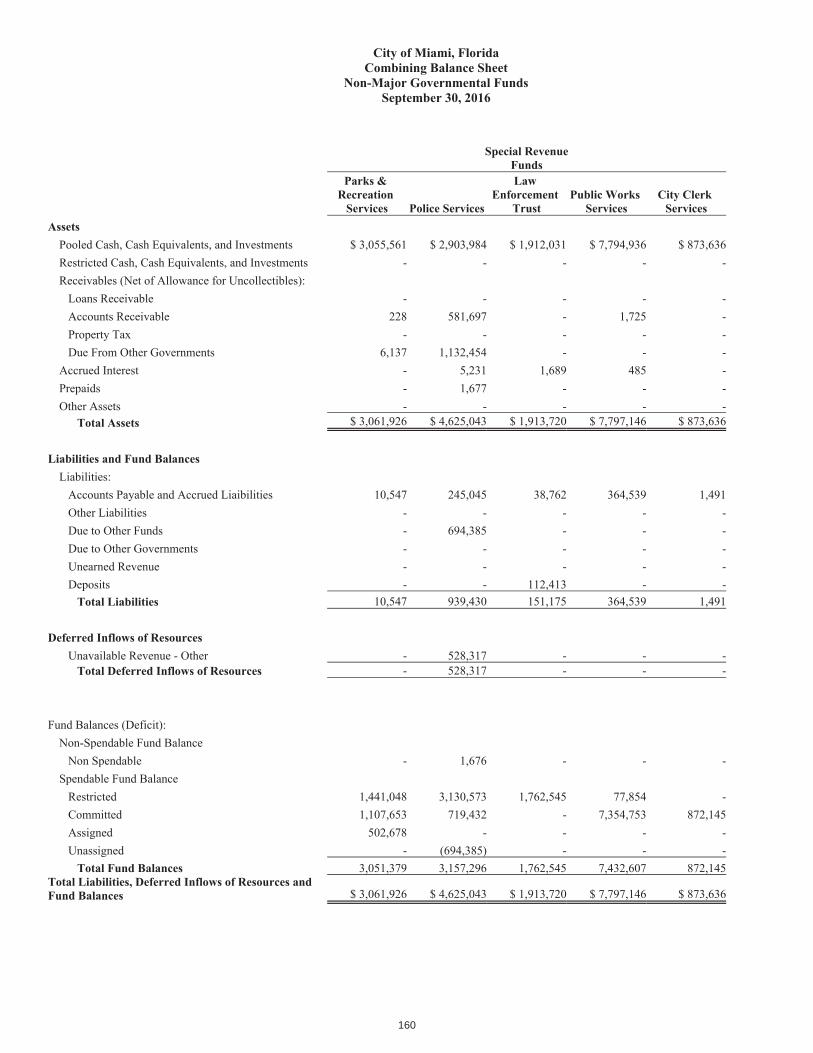
160

161
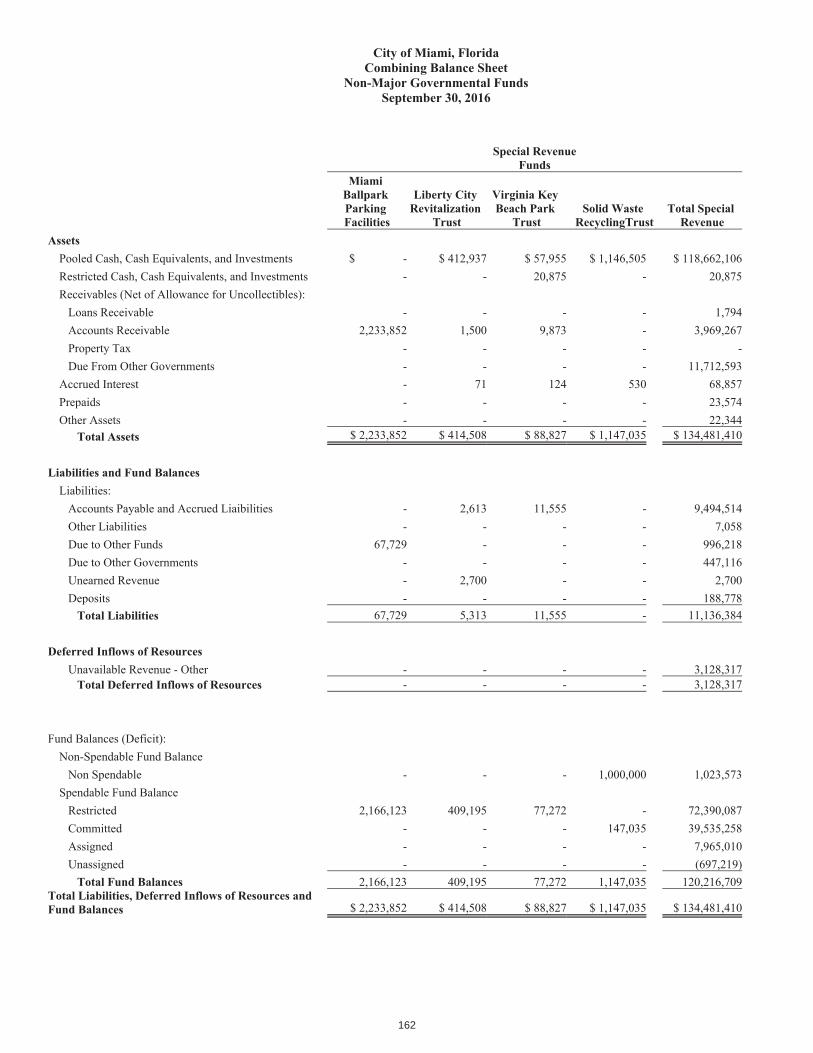
162
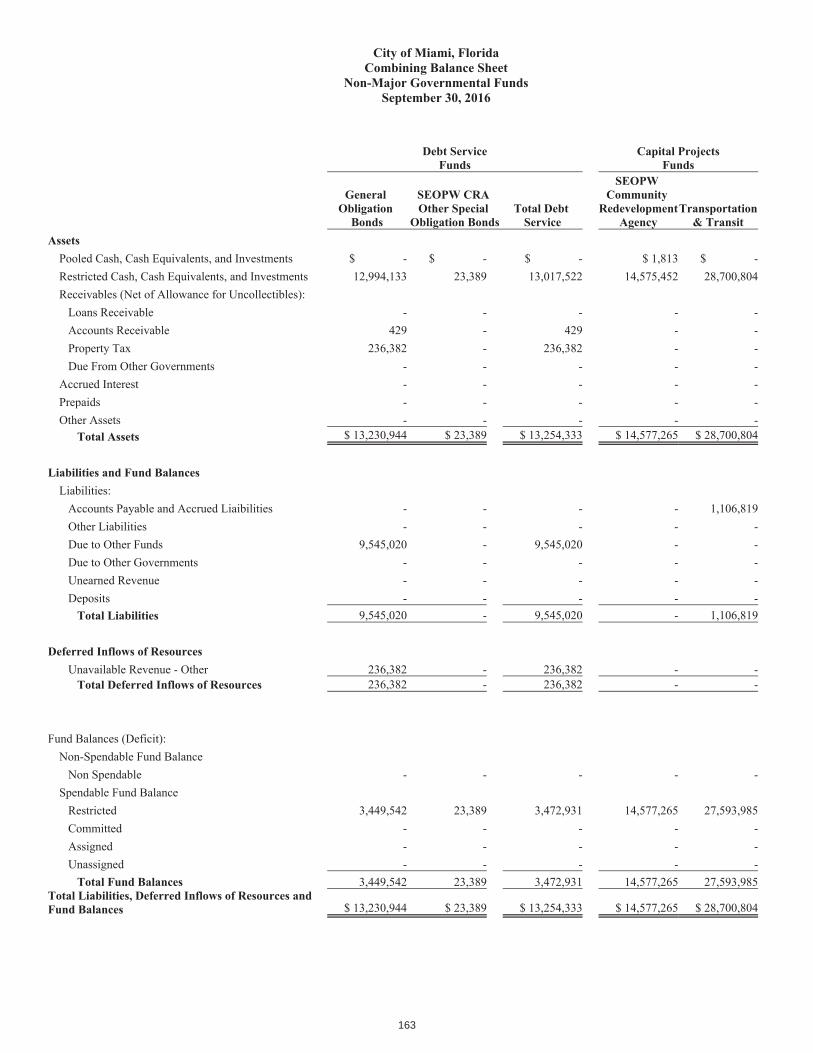
163
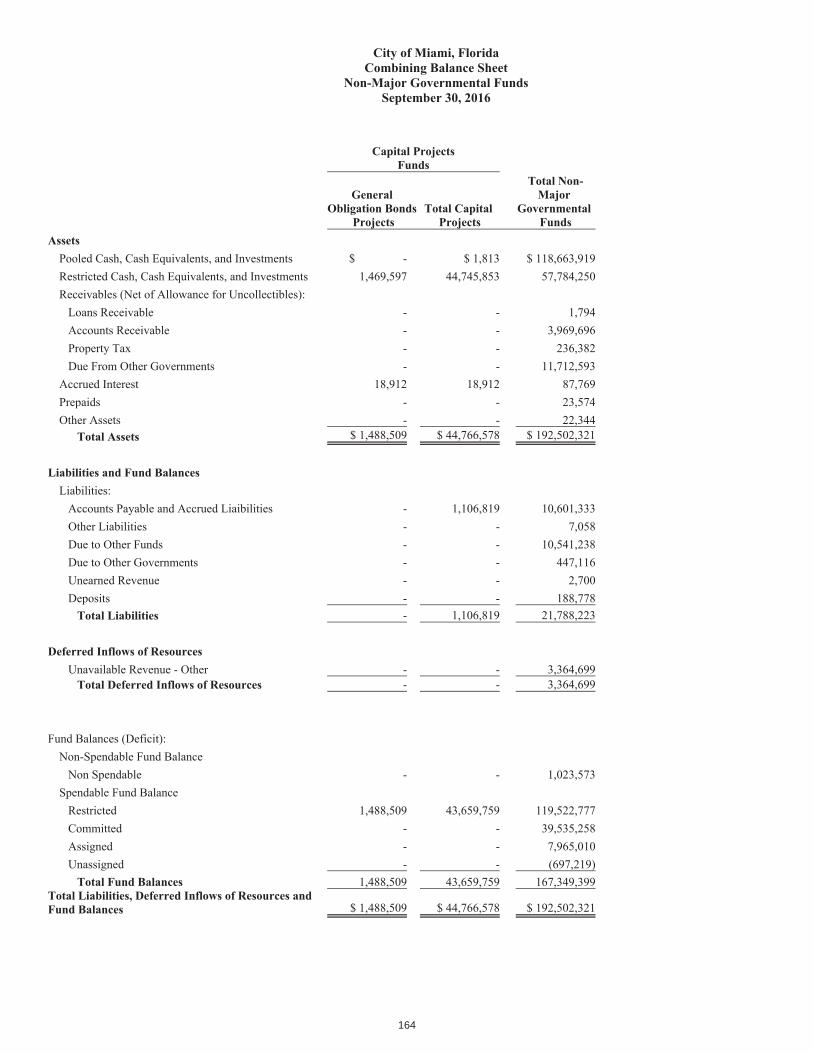
164
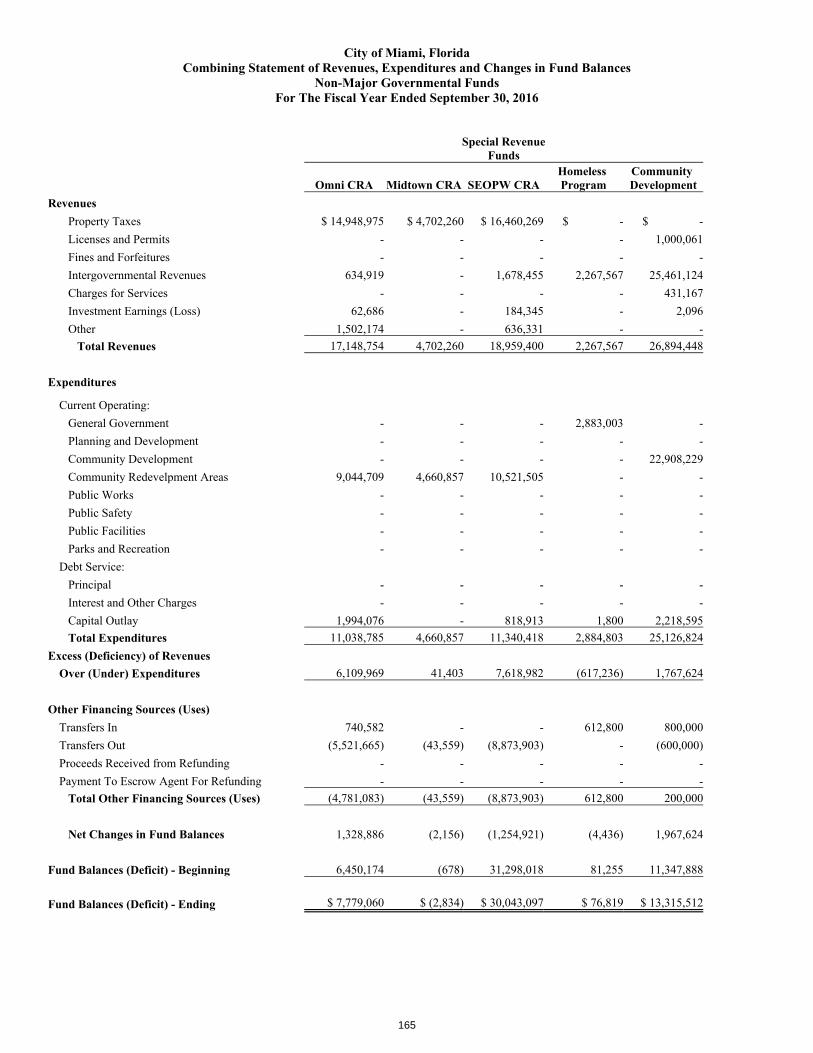
City of Miami, FloridaCombining Statement of Revenues, Expenditures and Changes in Fund Balances
Non-Major Governmental FundsFor The Fiscal Year Ended September 30, 2016
Special RevenueFunds
Omni CRA Midtown CRA SEOPW CRAHomeless Program
Community Development
RevenuesProperty Taxes $ 14,948,975 $ 4,702,260 $ 16,460,269 $ - $ -Licenses and Permits - - - - 1,000,061Fines and Forfeitures - - - - -Intergovernmental Revenues 634,919 - 1,678,455 2,267,567 25,461,124Charges for Services - - - - 431,167Investment Earnings (Loss) 62,686 - 184,345 - 2,096Other 1,502,174 - 636,331 - -
Total Revenues 17,148,754 4,702,260 18,959,400 2,267,567 26,894,448
Expenditures
Current Operating:General Government - - - 2,883,003 -Planning and Development - - - - -Community Development - - - - 22,908,229Community Redevelpment Areas 9,044,709 4,660,857 10,521,505 - -Public Works - - - - -Public Safety - - - - -Public Facilities - - - - -Parks and Recreation - - - - -
Debt Service:Principal - - - - -Interest and Other Charges - - - - -Capital Outlay 1,994,076 - 818,913 1,800 2,218,595Total Expenditures 11,038,785 4,660,857 11,340,418 2,884,803 25,126,824
Excess (Deficiency) of RevenuesOver (Under) Expenditures 6,109,969 41,403 7,618,982 (617,236) 1,767,624
Other Financing Sources (Uses)Transfers In 740,582 - - 612,800 800,000Transfers Out (5,521,665) (43,559) (8,873,903) - (600,000)Proceeds Received from Refunding - - - - -Payment To Escrow Agent For Refunding - - - - -
Total Other Financing Sources (Uses) (4,781,083) (43,559) (8,873,903) 612,800 200,000
Net Changes in Fund Balances 1,328,886 (2,156) (1,254,921) (4,436) 1,967,624
Fund Balances (Deficit) - Beginning 6,450,174 (678) 31,298,018 81,255 11,347,888
Fund Balances (Deficit) - Ending $ 7,779,060 $ (2,834) $ 30,043,097 $ 76,819 $ 13,315,512
165
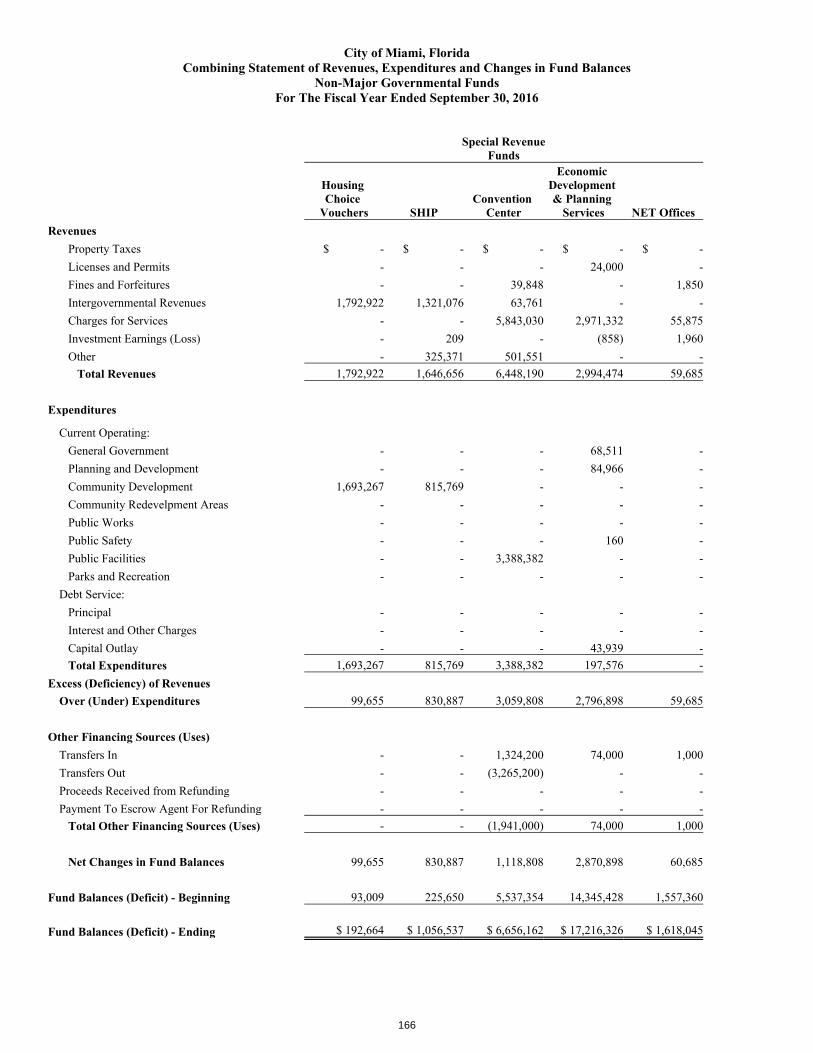
City of Miami, FloridaCombining Statement of Revenues, Expenditures and Changes in Fund Balances
Non-Major Governmental FundsFor The Fiscal Year Ended September 30, 2016
Special RevenueFunds
Housing Choice
Vouchers SHIPConvention
Center
Economic Development & Planning
Services NET OfficesRevenues
Property Taxes $ - $ - $ - $ - $ -Licenses and Permits - - - 24,000 -Fines and Forfeitures - - 39,848 - 1,850Intergovernmental Revenues 1,792,922 1,321,076 63,761 - -Charges for Services - - 5,843,030 2,971,332 55,875Investment Earnings (Loss) - 209 - (858) 1,960Other - 325,371 501,551 - -
Total Revenues 1,792,922 1,646,656 6,448,190 2,994,474 59,685
Expenditures
Current Operating:General Government - - - 68,511 -Planning and Development - - - 84,966 -Community Development 1,693,267 815,769 - - -Community Redevelpment Areas - - - - -Public Works - - - - -Public Safety - - - 160 -Public Facilities - - 3,388,382 - -Parks and Recreation - - - - -
Debt Service:Principal - - - - -Interest and Other Charges - - - - -Capital Outlay - - - 43,939 -Total Expenditures 1,693,267 815,769 3,388,382 197,576 -
Excess (Deficiency) of RevenuesOver (Under) Expenditures 99,655 830,887 3,059,808 2,796,898 59,685
Other Financing Sources (Uses)Transfers In - - 1,324,200 74,000 1,000Transfers Out - - (3,265,200) - -Proceeds Received from Refunding - - - - -Payment To Escrow Agent For Refunding - - - - -
Total Other Financing Sources (Uses) - - (1,941,000) 74,000 1,000
Net Changes in Fund Balances 99,655 830,887 1,118,808 2,870,898 60,685
Fund Balances (Deficit) - Beginning 93,009 225,650 5,537,354 14,345,428 1,557,360
Fund Balances (Deficit) - Ending $ 192,664 $ 1,056,537 $ 6,656,162 $ 17,216,326 $ 1,618,045
166
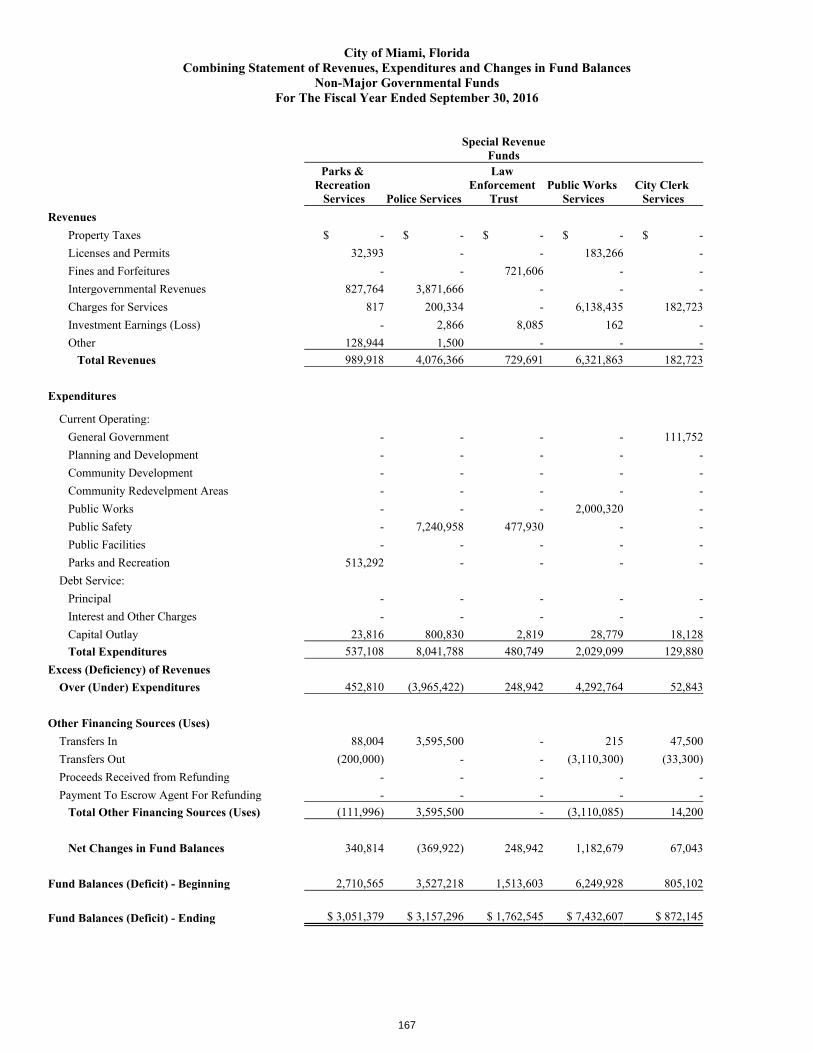
City of Miami, FloridaCombining Statement of Revenues, Expenditures and Changes in Fund Balances
Non-Major Governmental FundsFor The Fiscal Year Ended September 30, 2016
Special RevenueFunds
Parks & Recreation
Services Police Services
Law Enforcement
TrustPublic Works
ServicesCity Clerk
ServicesRevenues
Property Taxes $ - $ - $ - $ - $ -Licenses and Permits 32,393 - - 183,266 -Fines and Forfeitures - - 721,606 - -Intergovernmental Revenues 827,764 3,871,666 - - -Charges for Services 817 200,334 - 6,138,435 182,723Investment Earnings (Loss) - 2,866 8,085 162 -Other 128,944 1,500 - - -
Total Revenues 989,918 4,076,366 729,691 6,321,863 182,723
Expenditures
Current Operating:General Government - - - - 111,752Planning and Development - - - - -Community Development - - - - -Community Redevelpment Areas - - - - -Public Works - - - 2,000,320 -Public Safety - 7,240,958 477,930 - -Public Facilities - - - - -Parks and Recreation 513,292 - - - -
Debt Service:Principal - - - - -Interest and Other Charges - - - - -Capital Outlay 23,816 800,830 2,819 28,779 18,128Total Expenditures 537,108 8,041,788 480,749 2,029,099 129,880
Excess (Deficiency) of RevenuesOver (Under) Expenditures 452,810 (3,965,422) 248,942 4,292,764 52,843
Other Financing Sources (Uses)Transfers In 88,004 3,595,500 - 215 47,500Transfers Out (200,000) - - (3,110,300) (33,300)Proceeds Received from Refunding - - - - -Payment To Escrow Agent For Refunding - - - - -
Total Other Financing Sources (Uses) (111,996) 3,595,500 - (3,110,085) 14,200
Net Changes in Fund Balances 340,814 (369,922) 248,942 1,182,679 67,043
Fund Balances (Deficit) - Beginning 2,710,565 3,527,218 1,513,603 6,249,928 805,102
Fund Balances (Deficit) - Ending $ 3,051,379 $ 3,157,296 $ 1,762,545 $ 7,432,607 $ 872,145
167
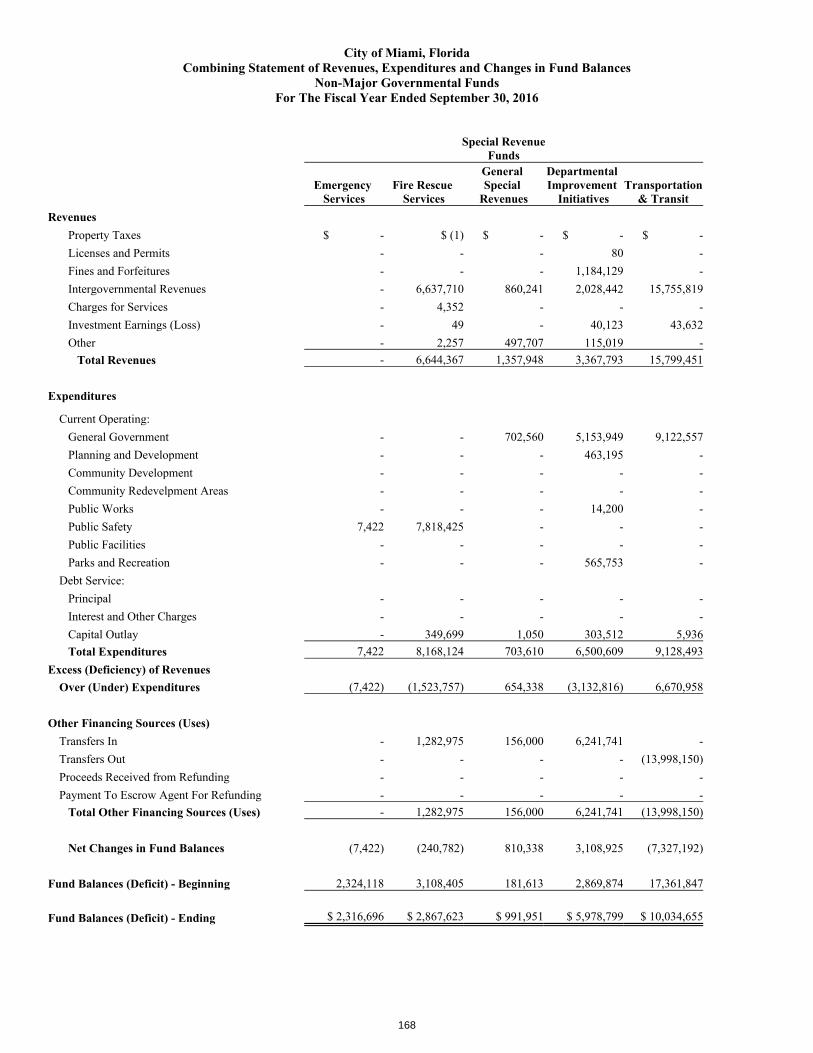
City of Miami, FloridaCombining Statement of Revenues, Expenditures and Changes in Fund Balances
Non-Major Governmental FundsFor The Fiscal Year Ended September 30, 2016
Special RevenueFunds
Emergency Services
Fire Rescue Services
General Special
Revenues
Departmental Improvement
InitiativesTransportation
& TransitRevenues
Property Taxes $ - $ (1) $ - $ - $ -Licenses and Permits - - - 80 -Fines and Forfeitures - - - 1,184,129 -Intergovernmental Revenues - 6,637,710 860,241 2,028,442 15,755,819Charges for Services - 4,352 - - -Investment Earnings (Loss) - 49 - 40,123 43,632Other - 2,257 497,707 115,019 -
Total Revenues - 6,644,367 1,357,948 3,367,793 15,799,451
Expenditures
Current Operating:General Government - - 702,560 5,153,949 9,122,557Planning and Development - - - 463,195 -Community Development - - - - -Community Redevelpment Areas - - - - -Public Works - - - 14,200 -Public Safety 7,422 7,818,425 - - -Public Facilities - - - - -Parks and Recreation - - - 565,753 -
Debt Service:Principal - - - - -Interest and Other Charges - - - - -Capital Outlay - 349,699 1,050 303,512 5,936Total Expenditures 7,422 8,168,124 703,610 6,500,609 9,128,493
Excess (Deficiency) of RevenuesOver (Under) Expenditures (7,422) (1,523,757) 654,338 (3,132,816) 6,670,958
Other Financing Sources (Uses)Transfers In - 1,282,975 156,000 6,241,741 -Transfers Out - - - - (13,998,150)Proceeds Received from Refunding - - - - -Payment To Escrow Agent For Refunding - - - - -
Total Other Financing Sources (Uses) - 1,282,975 156,000 6,241,741 (13,998,150)
Net Changes in Fund Balances (7,422) (240,782) 810,338 3,108,925 (7,327,192)
Fund Balances (Deficit) - Beginning 2,324,118 3,108,405 181,613 2,869,874 17,361,847
Fund Balances (Deficit) - Ending $ 2,316,696 $ 2,867,623 $ 991,951 $ 5,978,799 $ 10,034,655
168
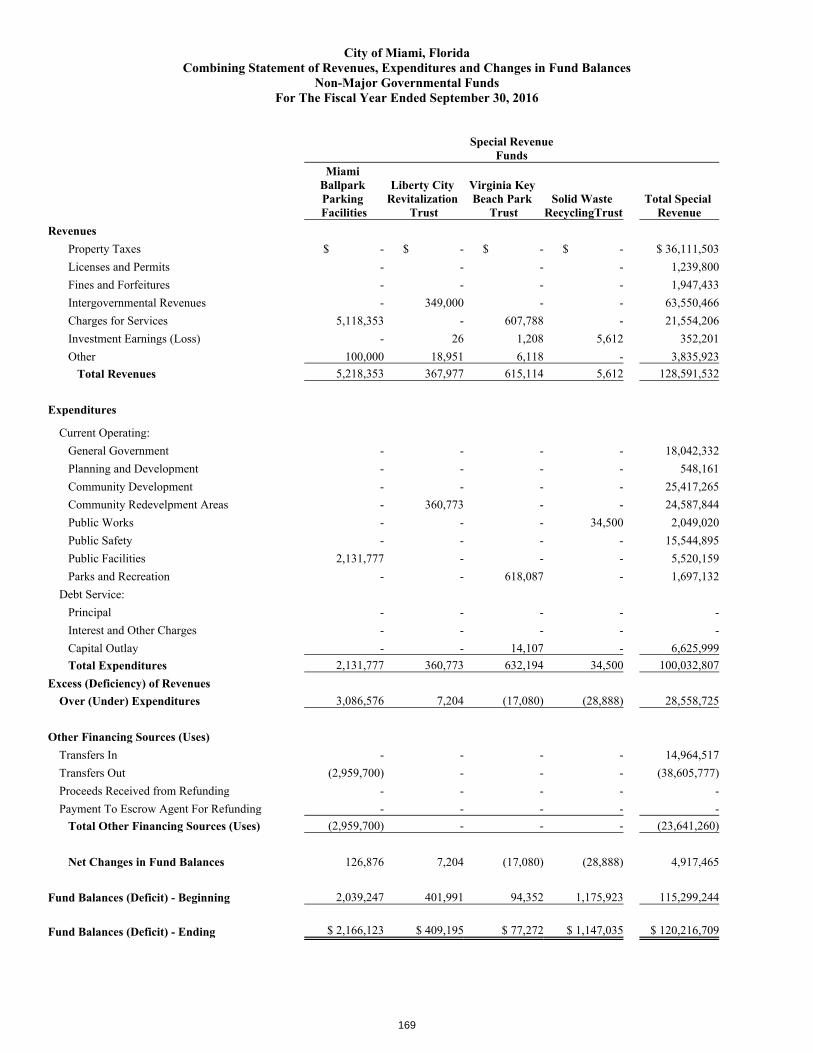
City of Miami, FloridaCombining Statement of Revenues, Expenditures and Changes in Fund Balances
Non-Major Governmental FundsFor The Fiscal Year Ended September 30, 2016
Special RevenueFunds
Miami Ballpark Parking Facilities
Liberty City Revitalization
Trust
Virginia Key Beach Park
TrustSolid Waste
RecyclingTrustTotal Special
RevenueRevenues
Property Taxes $ - $ - $ - $ - $ 36,111,503Licenses and Permits - - - - 1,239,800Fines and Forfeitures - - - - 1,947,433Intergovernmental Revenues - 349,000 - - 63,550,466Charges for Services 5,118,353 - 607,788 - 21,554,206Investment Earnings (Loss) - 26 1,208 5,612 352,201Other 100,000 18,951 6,118 - 3,835,923
Total Revenues 5,218,353 367,977 615,114 5,612 128,591,532
Expenditures
Current Operating:General Government - - - - 18,042,332Planning and Development - - - - 548,161Community Development - - - - 25,417,265Community Redevelpment Areas - 360,773 - - 24,587,844Public Works - - - 34,500 2,049,020Public Safety - - - - 15,544,895Public Facilities 2,131,777 - - - 5,520,159Parks and Recreation - - 618,087 - 1,697,132
Debt Service:Principal - - - - -Interest and Other Charges - - - - -Capital Outlay - - 14,107 - 6,625,999Total Expenditures 2,131,777 360,773 632,194 34,500 100,032,807
Excess (Deficiency) of RevenuesOver (Under) Expenditures 3,086,576 7,204 (17,080) (28,888) 28,558,725
Other Financing Sources (Uses)Transfers In - - - - 14,964,517Transfers Out (2,959,700) - - - (38,605,777)Proceeds Received from Refunding - - - - -Payment To Escrow Agent For Refunding - - - - -
Total Other Financing Sources (Uses) (2,959,700) - - - (23,641,260)
Net Changes in Fund Balances 126,876 7,204 (17,080) (28,888) 4,917,465
Fund Balances (Deficit) - Beginning 2,039,247 401,991 94,352 1,175,923 115,299,244
Fund Balances (Deficit) - Ending $ 2,166,123 $ 409,195 $ 77,272 $ 1,147,035 $ 120,216,709
169
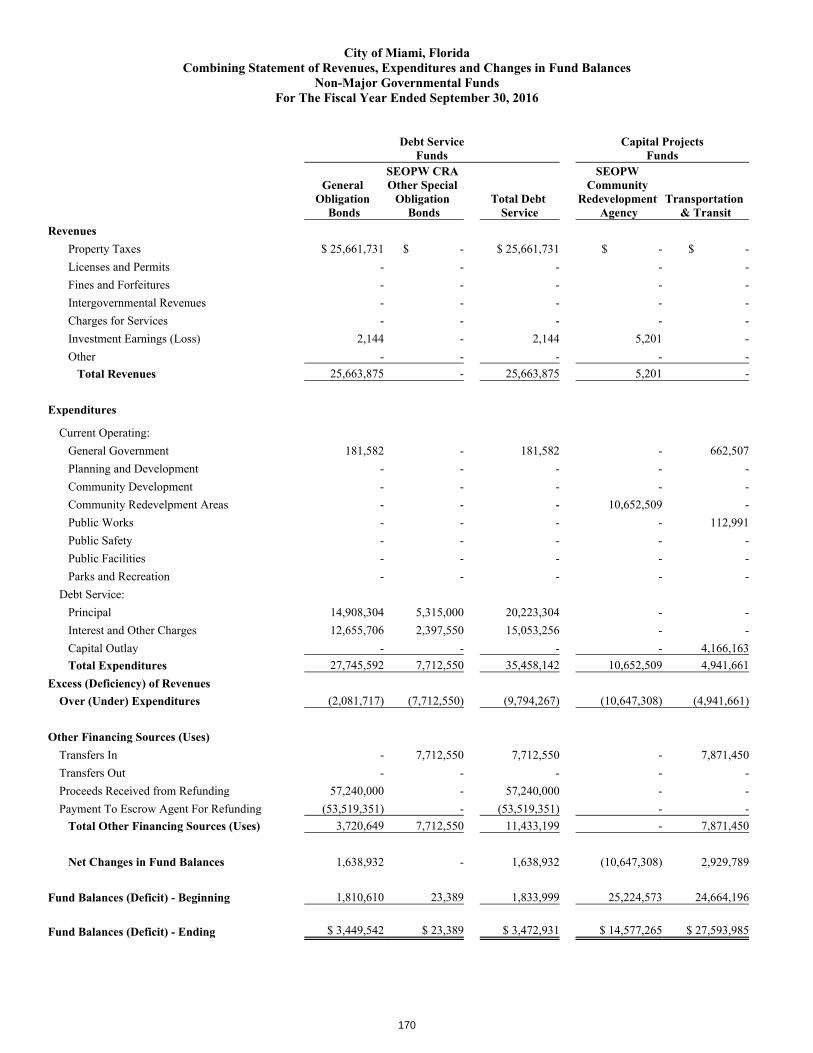
City of Miami, FloridaCombining Statement of Revenues, Expenditures and Changes in Fund Balances
Non-Major Governmental FundsFor The Fiscal Year Ended September 30, 2016
Debt ServiceFunds
Capital ProjectsFunds
General Obligation
Bonds
SEOPW CRA Other Special
Obligation Bonds
Total Debt Service
SEOPW Community
Redevelopment Agency
Transportation & Transit
RevenuesProperty Taxes $ 25,661,731 $ - $ 25,661,731 $ - $ -Licenses and Permits - - - - -Fines and Forfeitures - - - - -Intergovernmental Revenues - - - - -Charges for Services - - - - -Investment Earnings (Loss) 2,144 - 2,144 5,201 -Other - - - - -
Total Revenues 25,663,875 - 25,663,875 5,201 -
Expenditures
Current Operating:General Government 181,582 - 181,582 - 662,507Planning and Development - - - - -Community Development - - - - -Community Redevelpment Areas - - - 10,652,509 -Public Works - - - - 112,991Public Safety - - - - -Public Facilities - - - - -Parks and Recreation - - - - -
Debt Service:Principal 14,908,304 5,315,000 20,223,304 - -Interest and Other Charges 12,655,706 2,397,550 15,053,256 - -Capital Outlay - - - - 4,166,163Total Expenditures 27,745,592 7,712,550 35,458,142 10,652,509 4,941,661
Excess (Deficiency) of RevenuesOver (Under) Expenditures (2,081,717) (7,712,550) (9,794,267) (10,647,308) (4,941,661)
Other Financing Sources (Uses)Transfers In - 7,712,550 7,712,550 - 7,871,450Transfers Out - - - - -Proceeds Received from Refunding 57,240,000 - 57,240,000 - -Payment To Escrow Agent For Refunding (53,519,351) - (53,519,351) - -
Total Other Financing Sources (Uses) 3,720,649 7,712,550 11,433,199 - 7,871,450
Net Changes in Fund Balances 1,638,932 - 1,638,932 (10,647,308) 2,929,789
Fund Balances (Deficit) - Beginning 1,810,610 23,389 1,833,999 25,224,573 24,664,196
Fund Balances (Deficit) - Ending $ 3,449,542 $ 23,389 $ 3,472,931 $ 14,577,265 $ 27,593,985
170
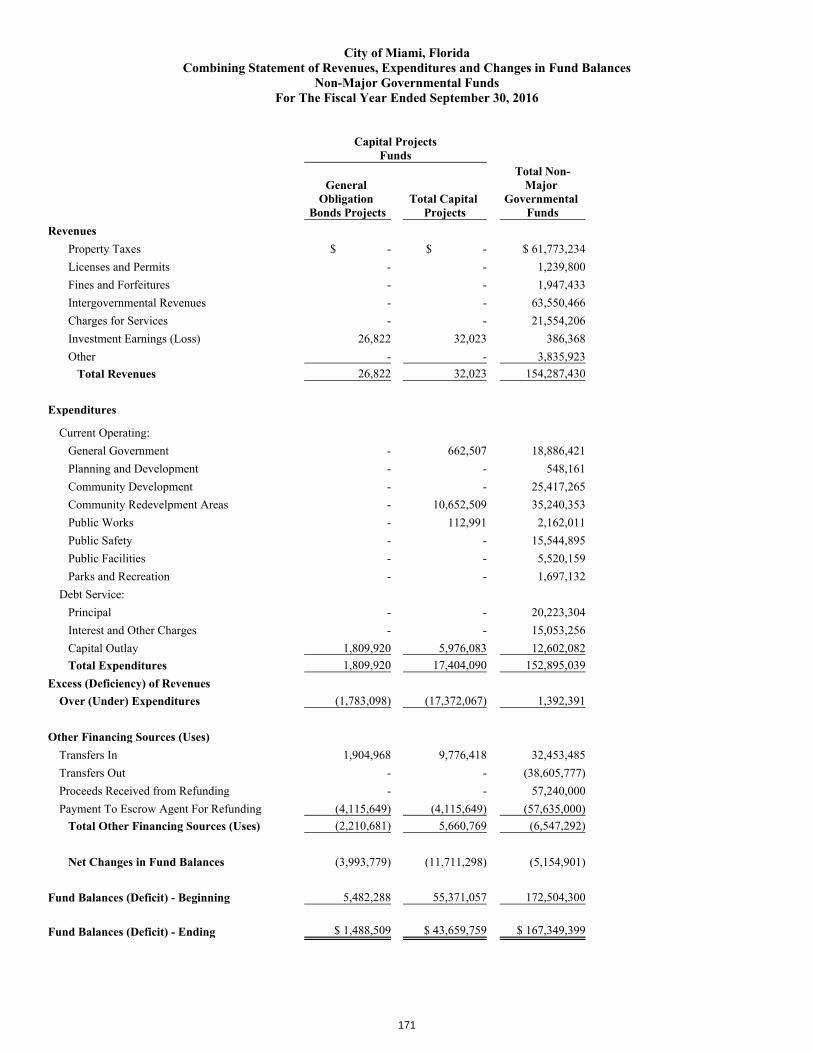
City of Miami, FloridaCombining Statement of Revenues, Expenditures and Changes in Fund Balances
Non-Major Governmental FundsFor The Fiscal Year Ended September 30, 2016
Capital ProjectsFunds
General Obligation
Bonds ProjectsTotal Capital
Projects
Total Non-Major
Governmental Funds
RevenuesProperty Taxes $ - $ - $ 61,773,234Licenses and Permits - - 1,239,800Fines and Forfeitures - - 1,947,433Intergovernmental Revenues - - 63,550,466Charges for Services - - 21,554,206Investment Earnings (Loss) 26,822 32,023 386,368Other - - 3,835,923
Total Revenues 26,822 32,023 154,287,430
Expenditures
Current Operating:General Government - 662,507 18,886,421Planning and Development - - 548,161Community Development - - 25,417,265Community Redevelpment Areas - 10,652,509 35,240,353Public Works - 112,991 2,162,011Public Safety - - 15,544,895Public Facilities - - 5,520,159Parks and Recreation - - 1,697,132
Debt Service:Principal - - 20,223,304Interest and Other Charges - - 15,053,256Capital Outlay 1,809,920 5,976,083 12,602,082Total Expenditures 1,809,920 17,404,090 152,895,039
Excess (Deficiency) of RevenuesOver (Under) Expenditures (1,783,098) (17,372,067) 1,392,391
Other Financing Sources (Uses)Transfers In 1,904,968 9,776,418 32,453,485Transfers Out - - (38,605,777)Proceeds Received from Refunding - - 57,240,000Payment To Escrow Agent For Refunding (4,115,649) (4,115,649) (57,635,000)
Total Other Financing Sources (Uses) (2,210,681) 5,660,769 (6,547,292)
Net Changes in Fund Balances (3,993,779) (11,711,298) (5,154,901)
Fund Balances (Deficit) - Beginning 5,482,288 55,371,057 172,504,300
Fund Balances (Deficit) - Ending $ 1,488,509 $ 43,659,759 $ 167,349,399
171
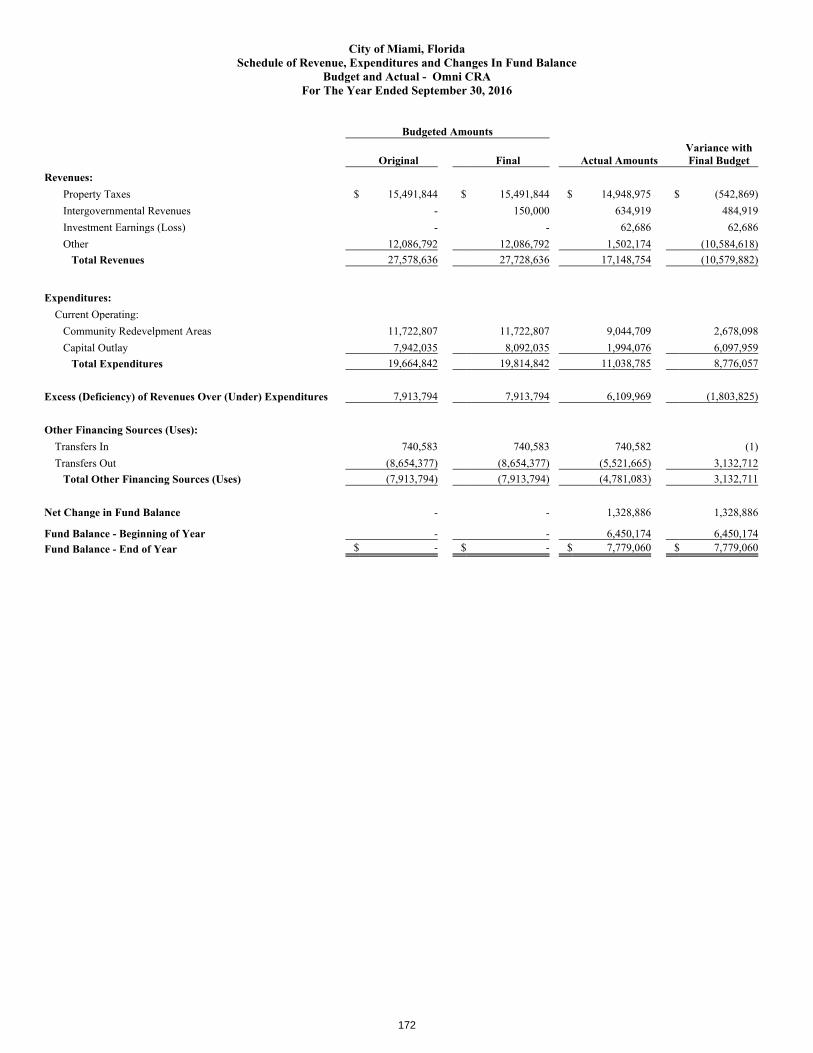
City of Miami, FloridaSchedule of Revenue, Expenditures and Changes In Fund Balance
Budget and Actual - Omni CRAFor The Year Ended September 30, 2016
Budgeted Amounts
Original Final Actual AmountsVariance withFinal Budget
Revenues:Property Taxes $ 15,491,844 $ 15,491,844 $ 14,948,975 $ (542,869)Intergovernmental Revenues $ - $ 150,000 $ 634,919 $ 484,919Investment Earnings (Loss) - - 62,686 62,686Other 12,086,792 12,086,792 1,502,174 (10,584,618)
Total Revenues 27,578,636 27,728,636 17,148,754 (10,579,882)
Expenditures:Current Operating:
Community Redevelpment Areas 11,722,807 11,722,807 9,044,709 2,678,098Capital Outlay 7,942,035 8,092,035 1,994,076 6,097,959
Total Expenditures 19,664,842 19,814,842 11,038,785 8,776,057
Excess (Deficiency) of Revenues Over (Under) Expenditures 7,913,794 7,913,794 6,109,969 (1,803,825)
Other Financing Sources (Uses):Transfers In 740,583 740,583 740,582 (1)Transfers Out (8,654,377) (8,654,377) (5,521,665) 3,132,712
Total Other Financing Sources (Uses) (7,913,794) (7,913,794) (4,781,083) 3,132,711
Net Change in Fund Balance - - 1,328,886 1,328,886
Fund Balance - Beginning of Year - - 6,450,174 6,450,174Fund Balance - End of Year $ - $ - $ 7,779,060 $ 7,779,060
172

City of Miami, FloridaSchedule of Revenue, Expenditures and Changes In Fund Balance
Budget and Actual - Midtown CRAFor The Year Ended September 30, 2016
Budgeted Amounts
Original Final Actual AmountsVariance withFinal Budget
Revenues:Property Taxes $ 4,855,880 $ 4,855,880 $ 4,702,260 $ (153,620)
Total Revenues 4,855,880 4,855,880 4,702,260 (153,620)
Expenditures:Current Operating:
Community Redevelpment Areas 4,812,321 4,812,321 4,660,857 151,464Total Expenditures 4,812,321 4,812,321 4,660,857 151,464
Excess (Deficiency) of Revenues Over (Under) Expenditures 43,559 43,559 41,403 (2,156)
Other Financing Sources (Uses):Transfers Out (43,559) (43,559) (43,559) -
Total Other Financing Sources (Uses) (43,559) (43,559) (43,559) -
Net Change in Fund Balance - - (2,156) (2,156)
Fund Balance - Beginning of Year - - (678) (678)Fund Balance - End of Year $ - $ - $ (2,834) $ (2,834)
173

City of Miami, FloridaSchedule of Revenue, Expenditures and Changes In Fund Balance
Budget and Actual - SEOPW CRAFor The Year Ended September 30, 2016
Budgeted Amounts
Original Final Actual AmountsVariance withFinal Budget
Revenues:Property Taxes $ 16,217,649 $ 16,217,649 $ 16,460,269 $ 242,620Intergovernmental Revenues $ - $ - $ 1,678,455 $ 1,678,455Investment Earnings (Loss) - - 184,345 184,345Other 34,858,127 34,858,127 636,331 (34,221,796)
Total Revenues 51,075,776 51,075,776 18,959,400 (32,116,376)
Expenditures:Current Operating:
Community Redevelpment Areas 32,721,467 32,721,467 10,521,505 22,199,962Capital Outlay 8,025,129 8,025,129 818,913 7,206,216
Total Expenditures 40,746,596 40,746,596 11,340,418 29,406,178
Excess (Deficiency) of Revenues Over (Under) Expenditures 10,329,180 10,329,180 7,618,982 (2,710,198)
Other Financing Sources (Uses):Transfers Out (10,329,180) (10,329,180) (8,873,903) 1,455,277
Total Other Financing Sources (Uses) (10,329,180) (10,329,180) (8,873,903) 1,455,277
Net Change in Fund Balance - - (1,254,921) (1,254,921)
Fund Balance - Beginning of Year - - 31,298,018 31,298,018Fund Balance - End of Year $ - $ - $ 30,043,097 $ 30,043,097
174
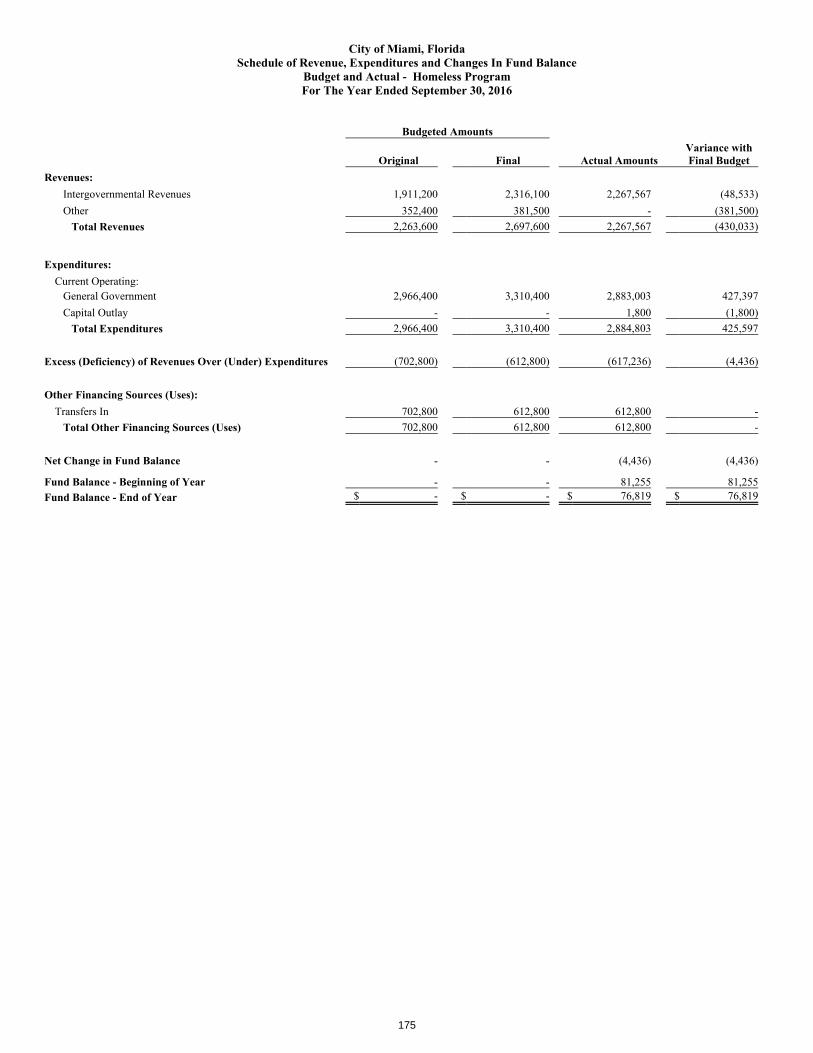
City of Miami, FloridaSchedule of Revenue, Expenditures and Changes In Fund Balance
Budget and Actual - Homeless ProgramFor The Year Ended September 30, 2016
Budgeted Amounts
Original Final Actual AmountsVariance withFinal Budget
Revenues:Intergovernmental Revenues $ 1,911,200 $ 2,316,100 $ 2,267,567 $ (48,533)Other 352,400 381,500 - (381,500)
Total Revenues 2,263,600 2,697,600 2,267,567 (430,033)
Expenditures:Current Operating:
General Government 2,966,400 3,310,400 2,883,003 427,397Capital Outlay - - 1,800 (1,800)
Total Expenditures 2,966,400 3,310,400 2,884,803 425,597
Excess (Deficiency) of Revenues Over (Under) Expenditures (702,800) (612,800) (617,236) (4,436)
Other Financing Sources (Uses):Transfers In 702,800 612,800 612,800 -
Total Other Financing Sources (Uses) 702,800 612,800 612,800 -
Net Change in Fund Balance - - (4,436) (4,436)
Fund Balance - Beginning of Year - - 81,255 81,255Fund Balance - End of Year $ - $ - $ 76,819 $ 76,819
175
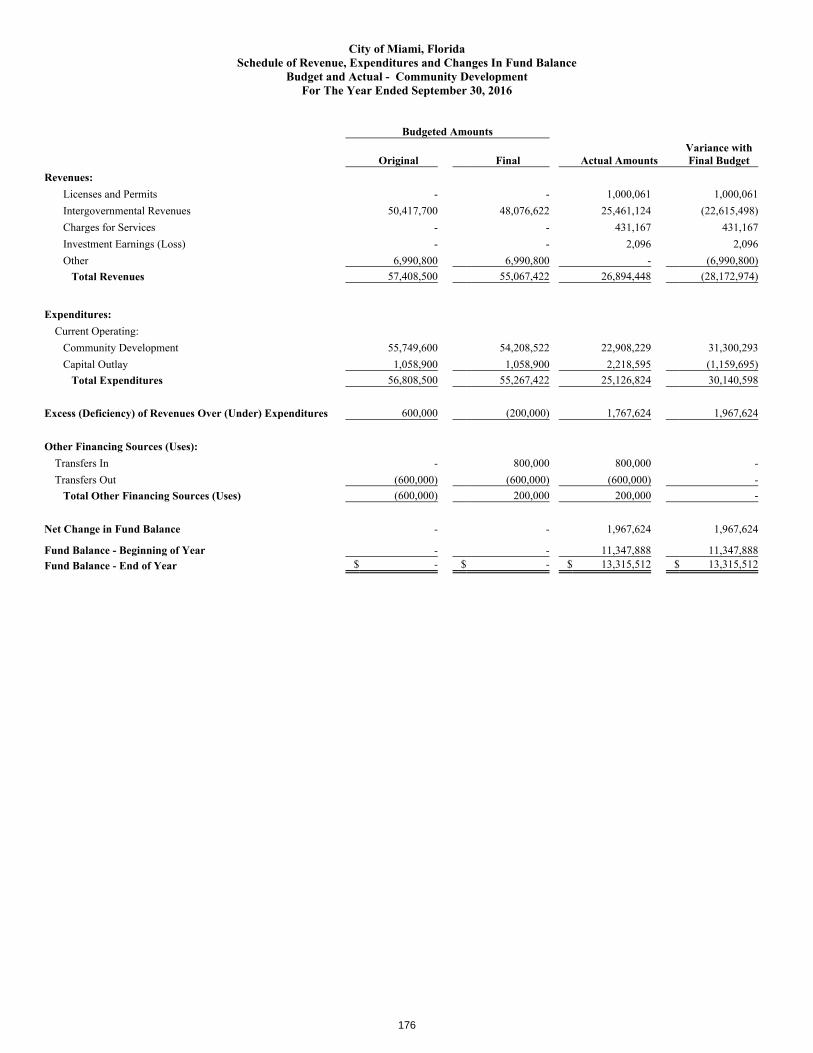
City of Miami, FloridaSchedule of Revenue, Expenditures and Changes In Fund Balance
Budget and Actual - Community DevelopmentFor The Year Ended September 30, 2016
Budgeted Amounts
Original Final Actual AmountsVariance withFinal Budget
Revenues:Licenses and Permits - - 1,000,061 1,000,061Intergovernmental Revenues $ 50,417,700 $ 48,076,622 $ 25,461,124 $ (22,615,498)Charges for Services $ - $ - $ 431,167 $ 431,167Investment Earnings (Loss) - - 2,096 2,096Other 6,990,800 6,990,800 - (6,990,800)
Total Revenues 57,408,500 55,067,422 26,894,448 (28,172,974)
Expenditures:Current Operating:
Community Development 55,749,600 54,208,522 22,908,229 31,300,293Capital Outlay 1,058,900 1,058,900 2,218,595 (1,159,695)
Total Expenditures 56,808,500 55,267,422 25,126,824 30,140,598
Excess (Deficiency) of Revenues Over (Under) Expenditures 600,000 (200,000) 1,767,624 1,967,624
Other Financing Sources (Uses):Transfers In - 800,000 800,000 -Transfers Out (600,000) (600,000) (600,000) -
Total Other Financing Sources (Uses) (600,000) 200,000 200,000 -
Net Change in Fund Balance - - 1,967,624 1,967,624
Fund Balance - Beginning of Year - - 11,347,888 11,347,888Fund Balance - End of Year $ - $ - $ 13,315,512 $ 13,315,512
176
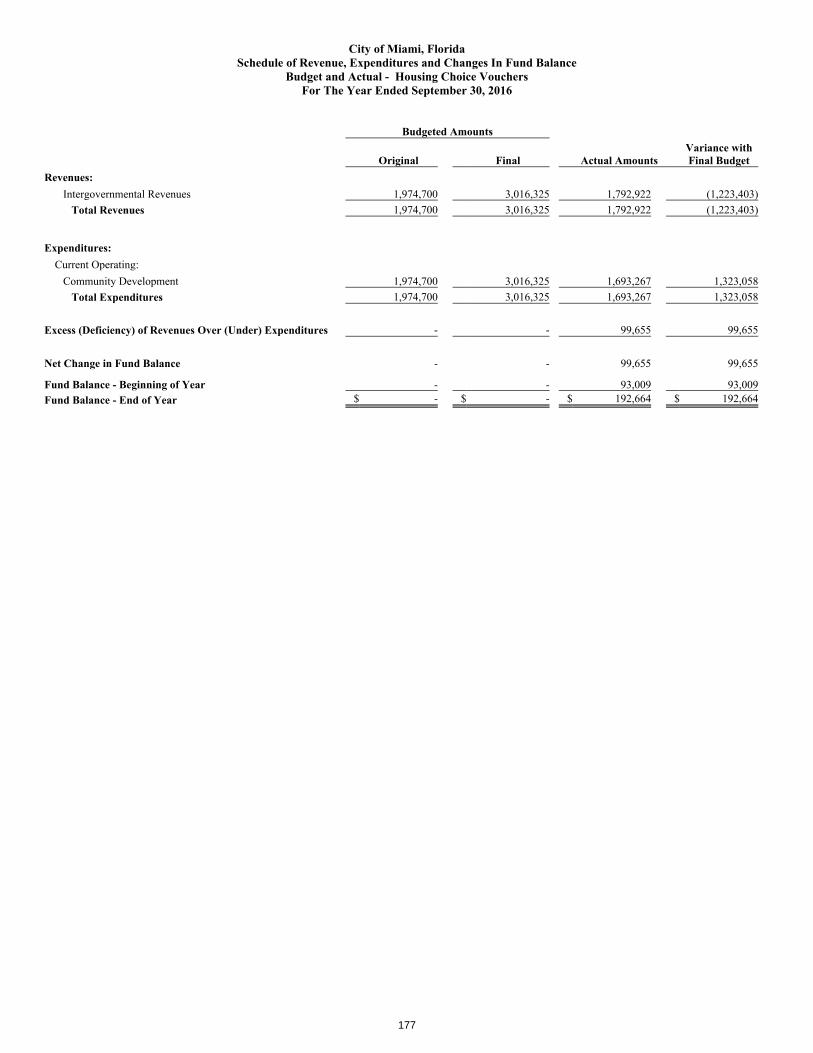
City of Miami, FloridaSchedule of Revenue, Expenditures and Changes In Fund Balance
Budget and Actual - Housing Choice VouchersFor The Year Ended September 30, 2016
Budgeted Amounts
Original Final Actual AmountsVariance withFinal Budget
Revenues:Intergovernmental Revenues $ 1,974,700 $ 3,016,325 $ 1,792,922 $ (1,223,403)
Total Revenues 1,974,700 3,016,325 1,792,922 (1,223,403)
Expenditures:Current Operating:
Community Development 1,974,700 3,016,325 1,693,267 1,323,058Total Expenditures 1,974,700 3,016,325 1,693,267 1,323,058
Excess (Deficiency) of Revenues Over (Under) Expenditures - - 99,655 99,655
Net Change in Fund Balance - - 99,655 99,655
Fund Balance - Beginning of Year - - 93,009 93,009Fund Balance - End of Year $ - $ - $ 192,664 $ 192,664
177
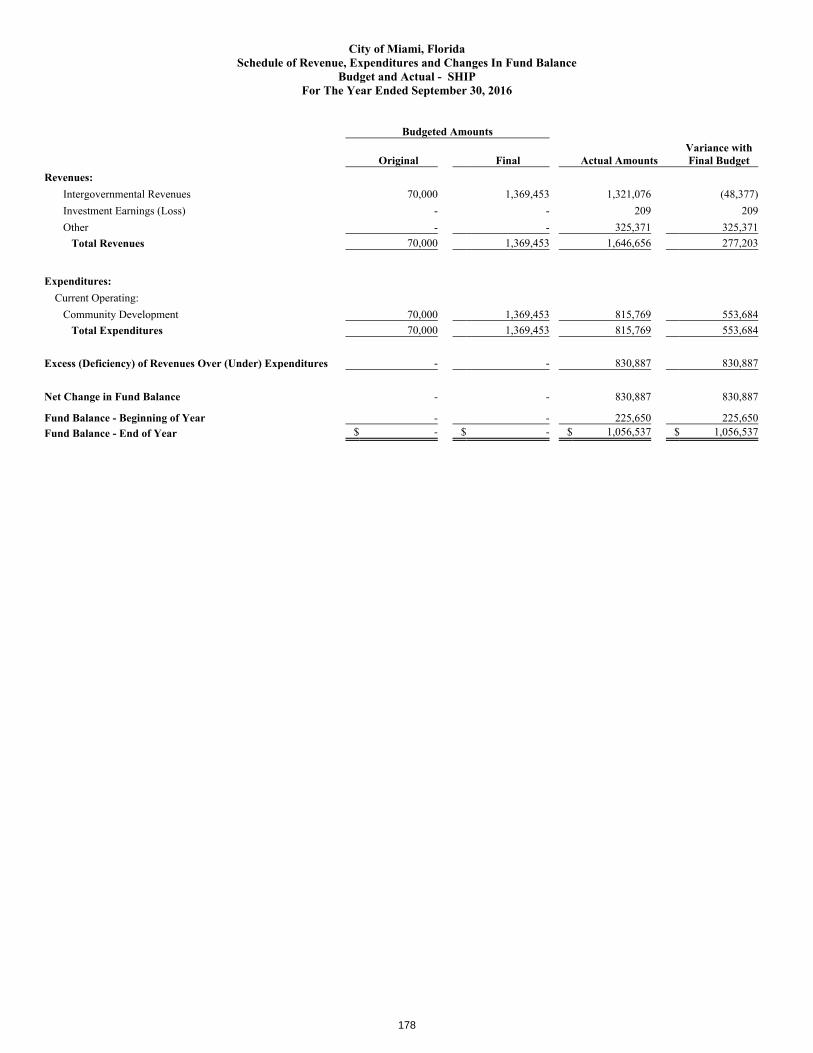
City of Miami, FloridaSchedule of Revenue, Expenditures and Changes In Fund Balance
Budget and Actual - SHIPFor The Year Ended September 30, 2016
Budgeted Amounts
Original Final Actual AmountsVariance withFinal Budget
Revenues:Intergovernmental Revenues $ 70,000 $ 1,369,453 $ 1,321,076 $ (48,377)Investment Earnings (Loss) - - 209 209Other - - 325,371 325,371
Total Revenues 70,000 1,369,453 1,646,656 277,203
Expenditures:Current Operating:
Community Development 70,000 1,369,453 815,769 553,684Total Expenditures 70,000 1,369,453 815,769 553,684
Excess (Deficiency) of Revenues Over (Under) Expenditures - - 830,887 830,887
Net Change in Fund Balance - - 830,887 830,887
Fund Balance - Beginning of Year - - 225,650 225,650Fund Balance - End of Year $ - $ - $ 1,056,537 $ 1,056,537
178
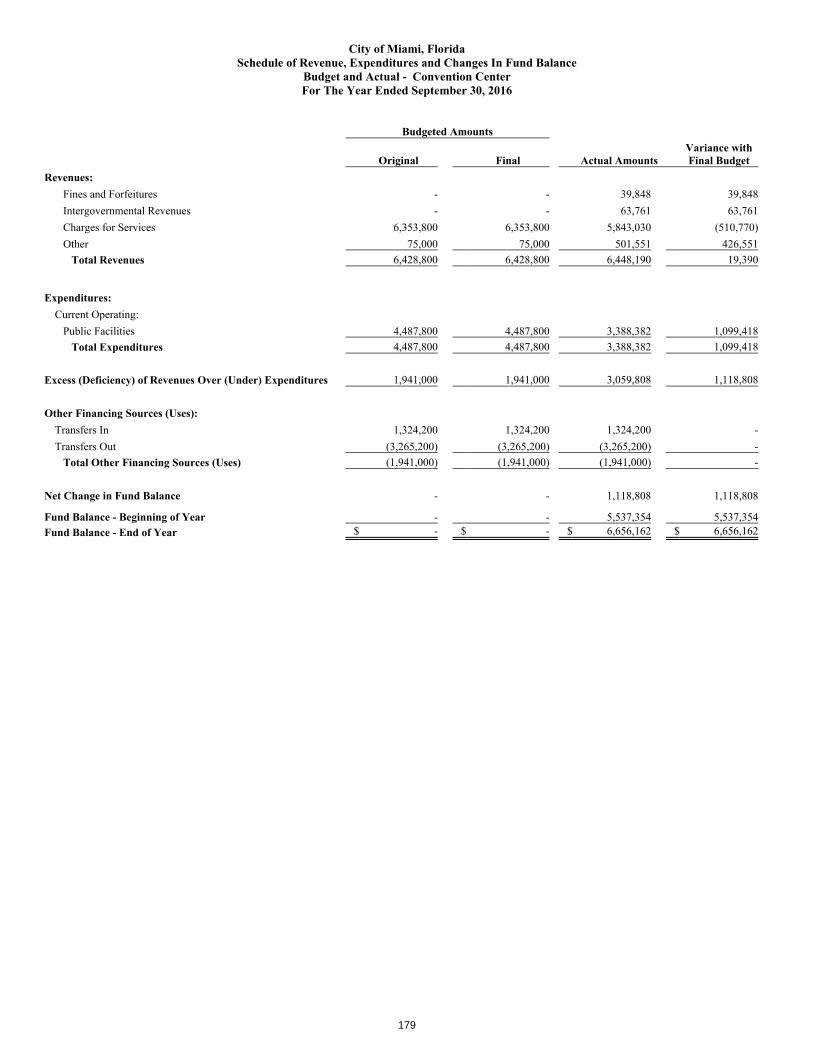
City of Miami, FloridaSchedule of Revenue, Expenditures and Changes In Fund Balance
Budget and Actual - Convention CenterFor The Year Ended September 30, 2016
Budgeted Amounts
Original Final Actual AmountsVariance withFinal Budget
Revenues:Fines and Forfeitures - - 39,848 39,848Intergovernmental Revenues $ - $ - $ 63,761 $ 63,761Charges for Services $ 6,353,800 $ 6,353,800 $ 5,843,030 $ (510,770)Other 75,000 75,000 501,551 426,551
Total Revenues 6,428,800 6,428,800 6,448,190 19,390
Expenditures:Current Operating:
Public Facilities 4,487,800 4,487,800 3,388,382 1,099,418Total Expenditures 4,487,800 4,487,800 3,388,382 1,099,418
Excess (Deficiency) of Revenues Over (Under) Expenditures 1,941,000 1,941,000 3,059,808 1,118,808
Other Financing Sources (Uses):Transfers In 1,324,200 1,324,200 1,324,200 -Transfers Out (3,265,200) (3,265,200) (3,265,200) -
Total Other Financing Sources (Uses) (1,941,000) (1,941,000) (1,941,000) -
Net Change in Fund Balance - - 1,118,808 1,118,808
Fund Balance - Beginning of Year - - 5,537,354 5,537,354Fund Balance - End of Year $ - $ - $ 6,656,162 $ 6,656,162
179
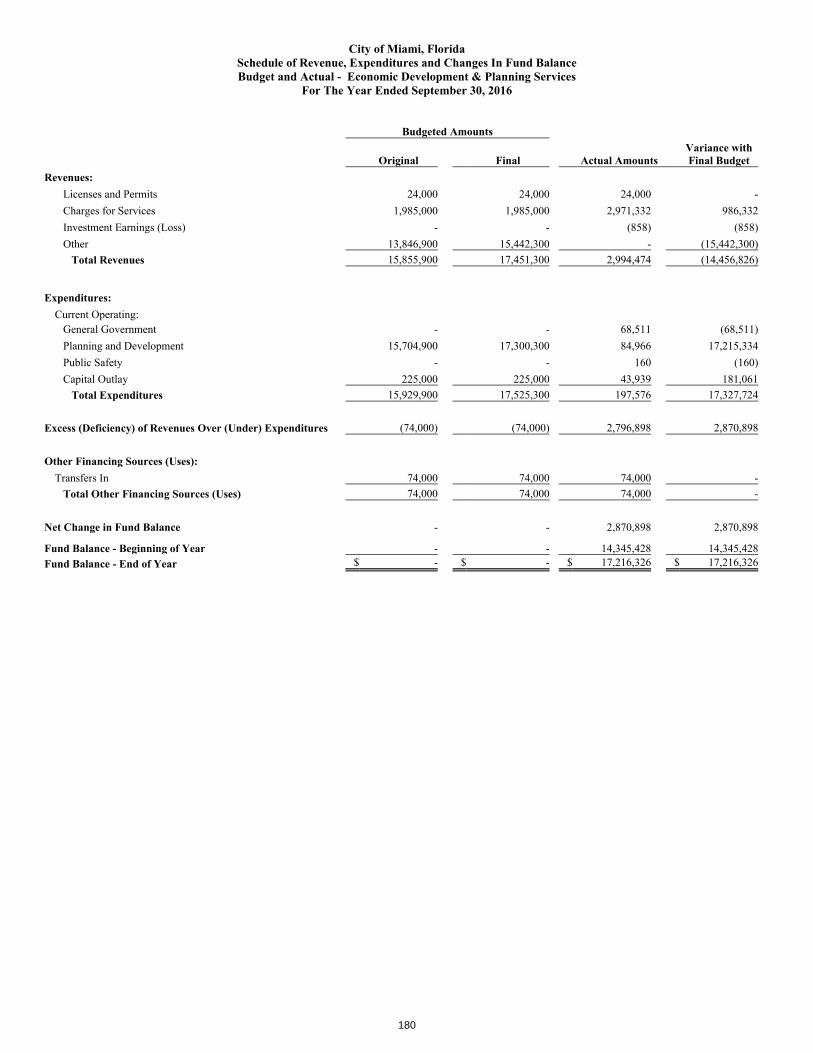
City of Miami, FloridaSchedule of Revenue, Expenditures and Changes In Fund BalanceBudget and Actual - Economic Development & Planning Services
For The Year Ended September 30, 2016
Budgeted Amounts
Original Final Actual AmountsVariance withFinal Budget
Revenues:Licenses and Permits 24,000 24,000 24,000 -Charges for Services $ 1,985,000 $ 1,985,000 $ 2,971,332 $ 986,332Investment Earnings (Loss) - - (858) (858)Other 13,846,900 15,442,300 - (15,442,300)
Total Revenues 15,855,900 17,451,300 2,994,474 (14,456,826)
Expenditures:Current Operating:
General Government - - 68,511 (68,511)Planning and Development 15,704,900 17,300,300 84,966 17,215,334Public Safety - - 160 (160)Capital Outlay 225,000 225,000 43,939 181,061
Total Expenditures 15,929,900 17,525,300 197,576 17,327,724
Excess (Deficiency) of Revenues Over (Under) Expenditures (74,000) (74,000) 2,796,898 2,870,898
Other Financing Sources (Uses):Transfers In 74,000 74,000 74,000 -
Total Other Financing Sources (Uses) 74,000 74,000 74,000 -
Net Change in Fund Balance - - 2,870,898 2,870,898
Fund Balance - Beginning of Year - - 14,345,428 14,345,428Fund Balance - End of Year $ - $ - $ 17,216,326 $ 17,216,326
180
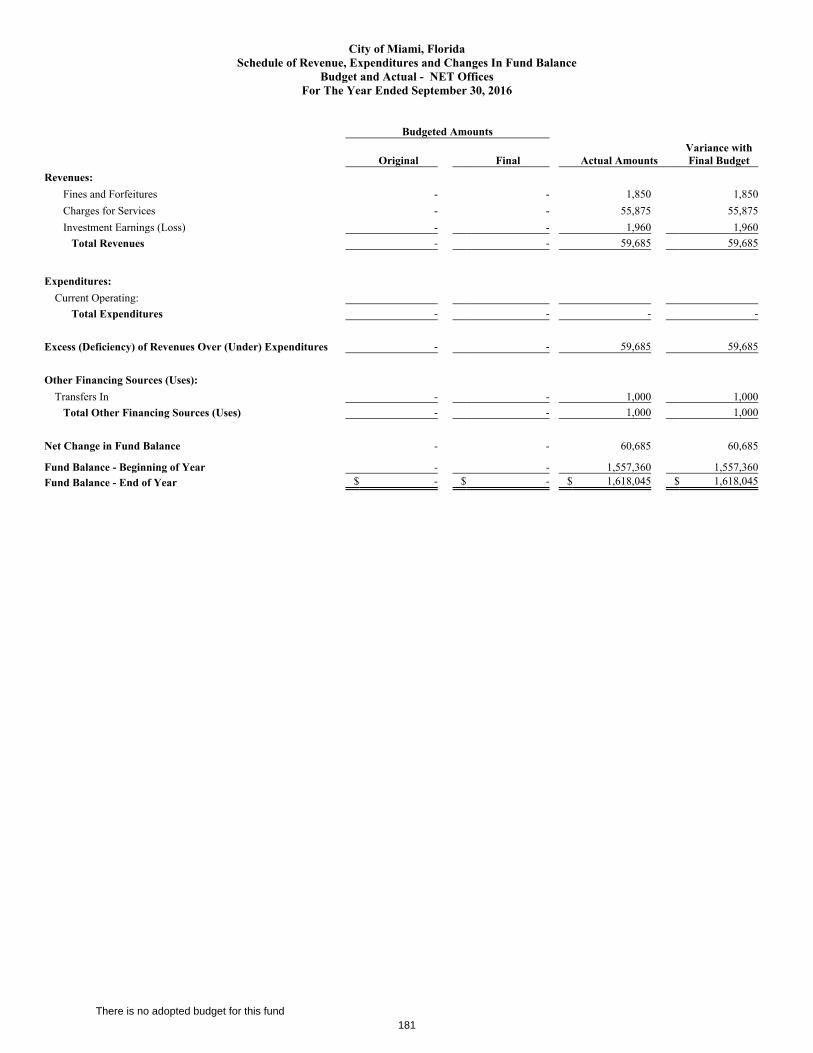
City of Miami, FloridaSchedule of Revenue, Expenditures and Changes In Fund Balance
Budget and Actual - NET OfficesFor The Year Ended September 30, 2016
Budgeted Amounts
Original Final Actual AmountsVariance withFinal Budget
Revenues:Fines and Forfeitures - - 1,850 1,850Charges for Services $ - $ - $ 55,875 $ 55,875Investment Earnings (Loss) - - 1,960 1,960
Total Revenues - - 59,685 59,685
Expenditures:Current Operating:
Total Expenditures - - - -
Excess (Deficiency) of Revenues Over (Under) Expenditures - - 59,685 59,685
Other Financing Sources (Uses):Transfers In - - 1,000 1,000
Total Other Financing Sources (Uses) - - 1,000 1,000
Net Change in Fund Balance - - 60,685 60,685
Fund Balance - Beginning of Year - - 1,557,360 1,557,360Fund Balance - End of Year $ - $ - $ 1,618,045 $ 1,618,045
181
There is no adopted budget for this fund

City of Miami, FloridaSchedule of Revenue, Expenditures and Changes In Fund Balance
Budget and Actual - Parks & Recreation ServicesFor The Year Ended September 30, 2016
Budgeted Amounts
Original Final Actual AmountsVariance withFinal Budget
Revenues:Licenses and Permits - - 32,393 32,393Intergovernmental Revenues $ 474,100 $ 505,000 $ 827,764 $ 322,764Charges for Services $ 70,000 $ 70,000 $ 817 $ (69,183)Other 961,700 1,768,491 128,944 (1,639,547)
Total Revenues 1,505,800 2,343,491 989,918 (1,353,573)
Expenditures:Current Operating:
Parks and Recreation 1,109,100 1,850,000 513,292 1,336,708Capital Outlay 462,000 381,000 23,816 357,184
Total Expenditures 1,571,100 2,231,000 537,108 1,693,892
Excess (Deficiency) of Revenues Over (Under) Expenditures (65,300) 112,491 452,810 340,319
Other Financing Sources (Uses):Transfers In 65,300 87,509 88,004 495Transfers Out - (200,000) (200,000) -
Total Other Financing Sources (Uses) 65,300 (112,491) (111,996) 495
Net Change in Fund Balance - - 340,814 340,814
Fund Balance - Beginning of Year - - 2,710,565 2,710,565Fund Balance - End of Year $ - $ - $ 3,051,379 $ 3,051,379
182

City of Miami, FloridaSchedule of Revenue, Expenditures and Changes In Fund Balance
Budget and Actual - Police ServicesFor The Year Ended September 30, 2016
Budgeted Amounts
Original Final Actual AmountsVariance withFinal Budget
Revenues:Fines and Forfeitures 5,000 5,000 - (5,000)Intergovernmental Revenues $ 5,705,300 $ 6,100,800 $ 3,871,666 $ (2,229,134)Charges for Services $ 886,000 $ 940,900 $ 200,334 $ (740,566)Investment Earnings (Loss) - - 2,866 2,866Other 3,485,100 3,485,100 1,500 (3,483,600)
Total Revenues 10,081,400 10,531,800 4,076,366 (6,455,434)
Expenditures:Current Operating:
Public Safety 13,066,600 13,517,000 7,240,958 6,276,042Capital Outlay 1,050,900 1,050,900 800,830 250,070
Total Expenditures 14,117,500 14,567,900 8,041,788 6,526,112
Excess (Deficiency) of Revenues Over (Under) Expenditures (4,036,100) (4,036,100) (3,965,422) 70,678
Other Financing Sources (Uses):Transfers In 4,036,100 4,036,100 3,595,500 (440,600)
Total Other Financing Sources (Uses) 4,036,100 4,036,100 3,595,500 (440,600)
Net Change in Fund Balance - - (369,922) (369,922)
Fund Balance - Beginning of Year - - 3,527,218 3,527,218Fund Balance - End of Year $ - $ - $ 3,157,296 $ 3,157,296
183
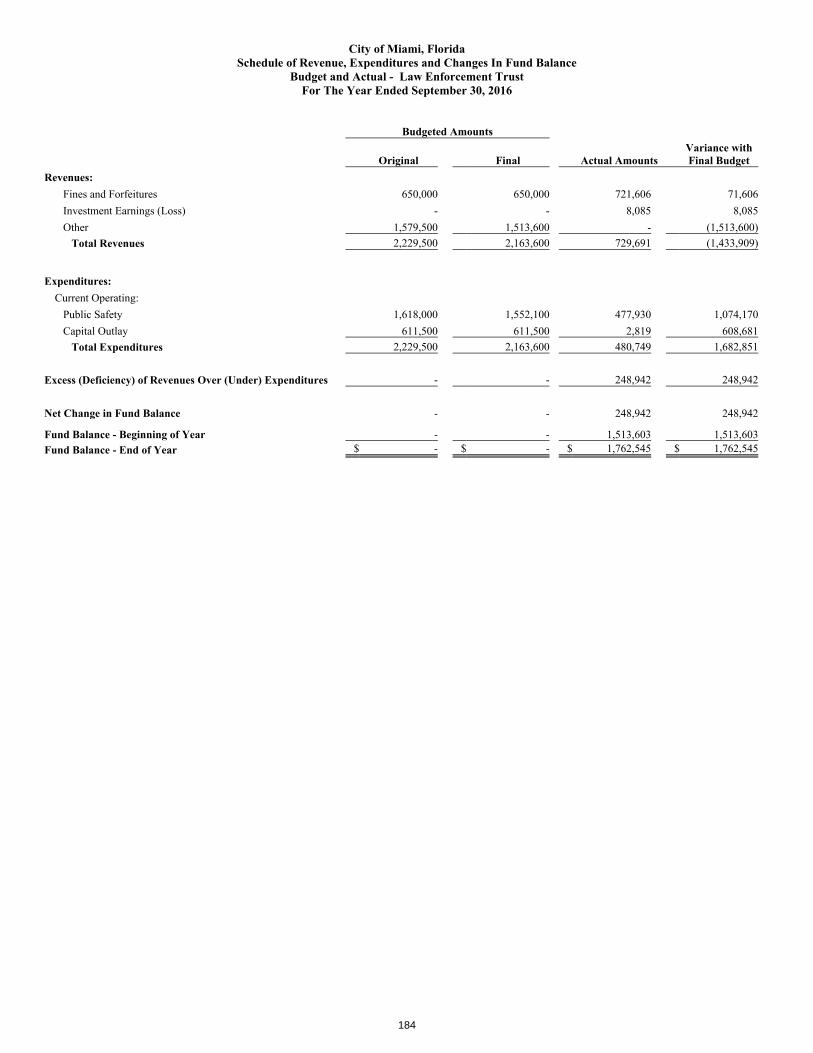
City of Miami, FloridaSchedule of Revenue, Expenditures and Changes In Fund Balance
Budget and Actual - Law Enforcement TrustFor The Year Ended September 30, 2016
Budgeted Amounts
Original Final Actual AmountsVariance withFinal Budget
Revenues:Fines and Forfeitures 650,000 650,000 721,606 71,606Investment Earnings (Loss) - - 8,085 8,085Other 1,579,500 1,513,600 - (1,513,600)
Total Revenues 2,229,500 2,163,600 729,691 (1,433,909)
Expenditures:Current Operating:
Public Safety 1,618,000 1,552,100 477,930 1,074,170Capital Outlay 611,500 611,500 2,819 608,681
Total Expenditures 2,229,500 2,163,600 480,749 1,682,851
Excess (Deficiency) of Revenues Over (Under) Expenditures - - 248,942 248,942
Net Change in Fund Balance - - 248,942 248,942
Fund Balance - Beginning of Year - - 1,513,603 1,513,603Fund Balance - End of Year $ - $ - $ 1,762,545 $ 1,762,545
184
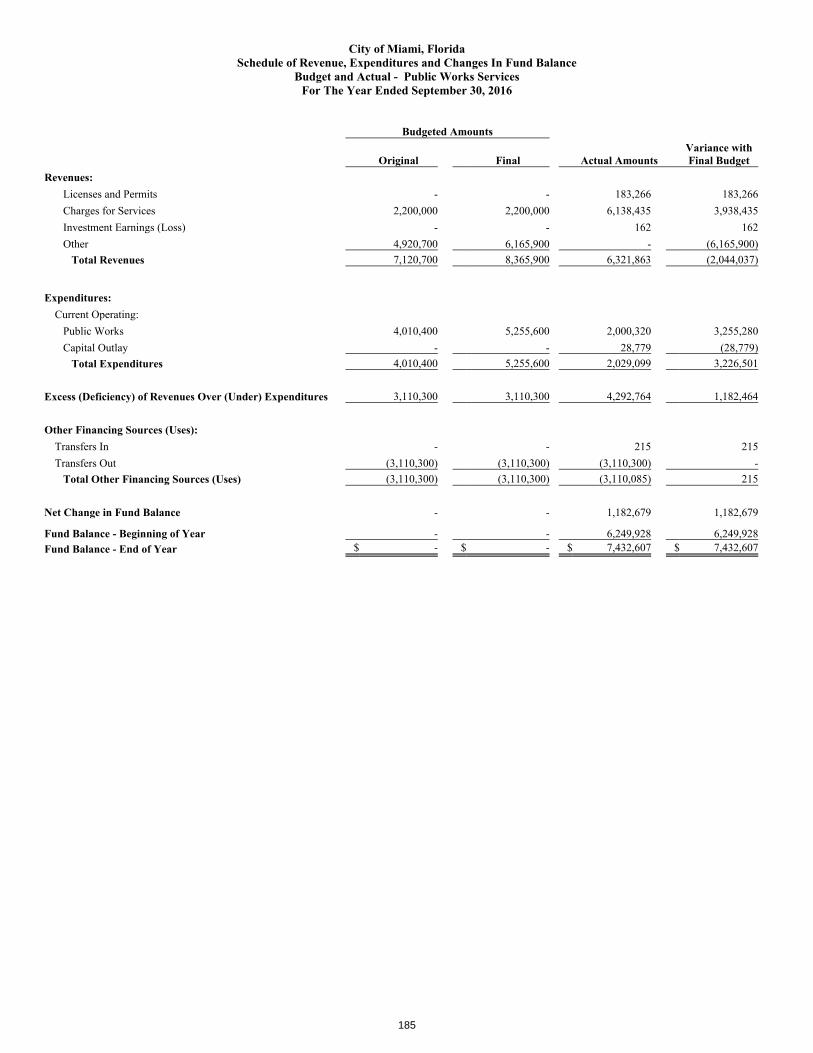
City of Miami, FloridaSchedule of Revenue, Expenditures and Changes In Fund Balance
Budget and Actual - Public Works ServicesFor The Year Ended September 30, 2016
Budgeted Amounts
Original Final Actual AmountsVariance withFinal Budget
Revenues:Licenses and Permits - - 183,266 183,266Charges for Services $ 2,200,000 $ 2,200,000 $ 6,138,435 $ 3,938,435Investment Earnings (Loss) - - 162 162Other 4,920,700 6,165,900 - (6,165,900)
Total Revenues 7,120,700 8,365,900 6,321,863 (2,044,037)
Expenditures:Current Operating:
Public Works 4,010,400 5,255,600 2,000,320 3,255,280Capital Outlay - - 28,779 (28,779)
Total Expenditures 4,010,400 5,255,600 2,029,099 3,226,501
Excess (Deficiency) of Revenues Over (Under) Expenditures 3,110,300 3,110,300 4,292,764 1,182,464
Other Financing Sources (Uses):Transfers In - - 215 215Transfers Out (3,110,300) (3,110,300) (3,110,300) -
Total Other Financing Sources (Uses) (3,110,300) (3,110,300) (3,110,085) 215
Net Change in Fund Balance - - 1,182,679 1,182,679
Fund Balance - Beginning of Year - - 6,249,928 6,249,928Fund Balance - End of Year $ - $ - $ 7,432,607 $ 7,432,607
185
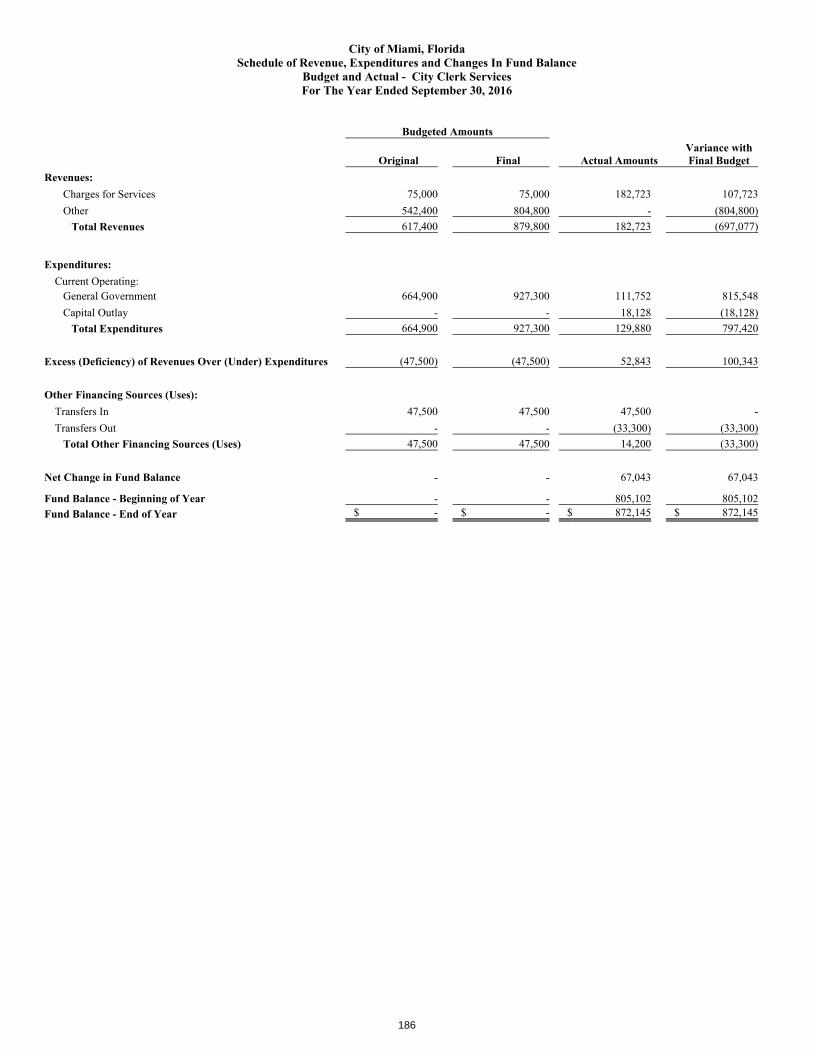
City of Miami, FloridaSchedule of Revenue, Expenditures and Changes In Fund Balance
Budget and Actual - City Clerk ServicesFor The Year Ended September 30, 2016
Budgeted Amounts
Original Final Actual AmountsVariance withFinal Budget
Revenues:Charges for Services $ 75,000 $ 75,000 $ 182,723 $ 107,723Other 542,400 804,800 - (804,800)
Total Revenues 617,400 879,800 182,723 (697,077)
Expenditures:Current Operating:
General Government 664,900 927,300 111,752 815,548Capital Outlay - - 18,128 (18,128)
Total Expenditures 664,900 927,300 129,880 797,420
Excess (Deficiency) of Revenues Over (Under) Expenditures (47,500) (47,500) 52,843 100,343
Other Financing Sources (Uses):Transfers In 47,500 47,500 47,500 -Transfers Out - - (33,300) (33,300)
Total Other Financing Sources (Uses) 47,500 47,500 14,200 (33,300)
Net Change in Fund Balance - - 67,043 67,043
Fund Balance - Beginning of Year - - 805,102 805,102Fund Balance - End of Year $ - $ - $ 872,145 $ 872,145
186
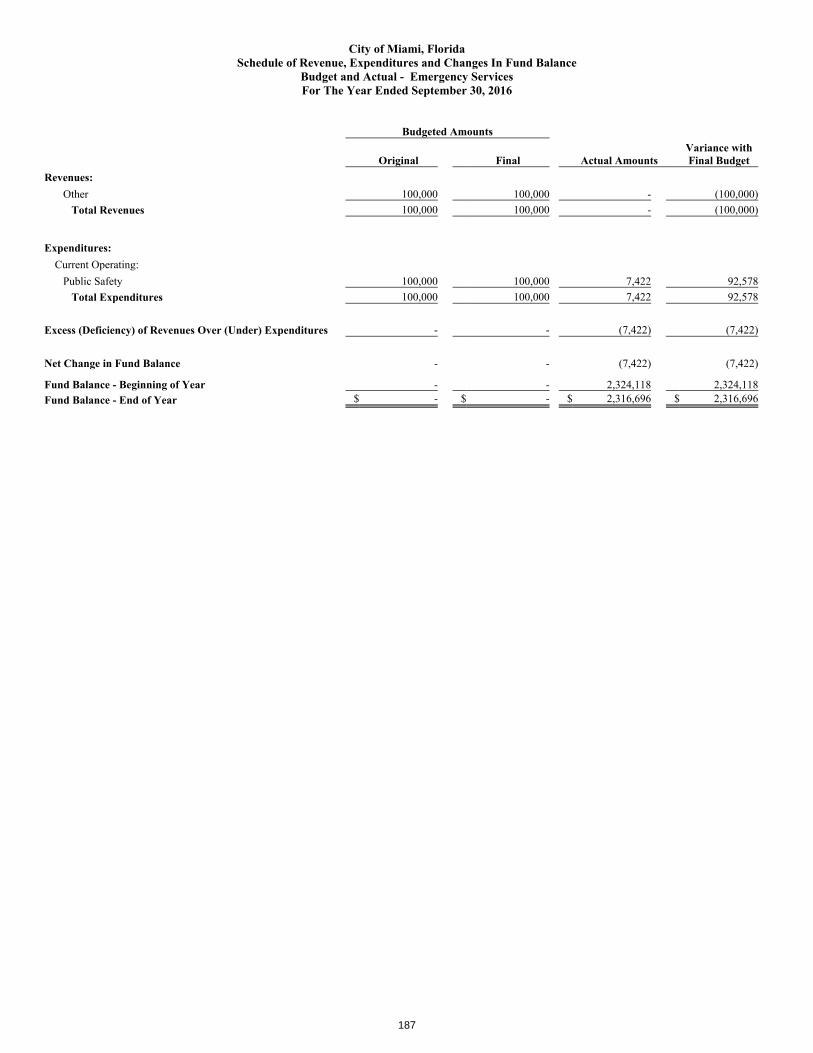
City of Miami, FloridaSchedule of Revenue, Expenditures and Changes In Fund Balance
Budget and Actual - Emergency ServicesFor The Year Ended September 30, 2016
Budgeted Amounts
Original Final Actual AmountsVariance withFinal Budget
Revenues:Other 100,000 100,000 - (100,000)
Total Revenues 100,000 100,000 - (100,000)
Expenditures:Current Operating:
Public Safety 100,000 100,000 7,422 92,578Total Expenditures 100,000 100,000 7,422 92,578
Excess (Deficiency) of Revenues Over (Under) Expenditures - - (7,422) (7,422)
Net Change in Fund Balance - - (7,422) (7,422)
Fund Balance - Beginning of Year - - 2,324,118 2,324,118Fund Balance - End of Year $ - $ - $ 2,316,696 $ 2,316,696
187
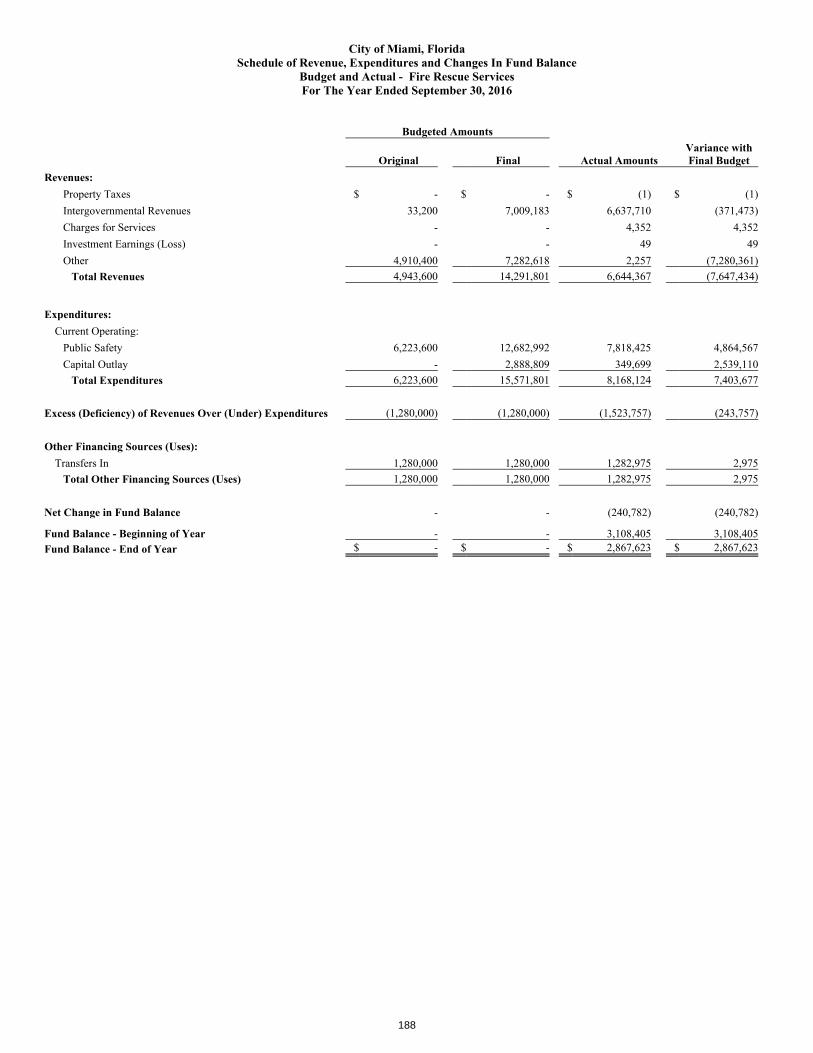
City of Miami, FloridaSchedule of Revenue, Expenditures and Changes In Fund Balance
Budget and Actual - Fire Rescue ServicesFor The Year Ended September 30, 2016
Budgeted Amounts
Original Final Actual AmountsVariance withFinal Budget
Revenues:Property Taxes $ - $ - $ (1) $ (1)Intergovernmental Revenues $ 33,200 $ 7,009,183 $ 6,637,710 $ (371,473)Charges for Services $ - $ - $ 4,352 $ 4,352Investment Earnings (Loss) - - 49 49Other 4,910,400 7,282,618 2,257 (7,280,361)
Total Revenues 4,943,600 14,291,801 6,644,367 (7,647,434)
Expenditures:Current Operating:
Public Safety 6,223,600 12,682,992 7,818,425 4,864,567Capital Outlay - 2,888,809 349,699 2,539,110
Total Expenditures 6,223,600 15,571,801 8,168,124 7,403,677
Excess (Deficiency) of Revenues Over (Under) Expenditures (1,280,000) (1,280,000) (1,523,757) (243,757)
Other Financing Sources (Uses):Transfers In 1,280,000 1,280,000 1,282,975 2,975
Total Other Financing Sources (Uses) 1,280,000 1,280,000 1,282,975 2,975
Net Change in Fund Balance - - (240,782) (240,782)
Fund Balance - Beginning of Year - - 3,108,405 3,108,405Fund Balance - End of Year $ - $ - $ 2,867,623 $ 2,867,623
188

City of Miami, FloridaSchedule of Revenue, Expenditures and Changes In Fund Balance
Budget and Actual - General Special RevenuesFor The Year Ended September 30, 2016
Budgeted Amounts
Original Final Actual AmountsVariance withFinal Budget
Revenues:Intergovernmental Revenues $ 918,300 $ 925,400 $ 860,241 $ (65,159)Other 25,700 376,800 497,707 120,907
Total Revenues 944,000 1,302,200 1,357,948 55,748
Expenditures:Current Operating:
General Government 918,300 1,432,900 702,560 730,340Public Works 25,700 25,300 - 25,300Capital Outlay - - 1,050 (1,050)
Total Expenditures 944,000 1,458,200 703,610 754,590
Excess (Deficiency) of Revenues Over (Under) Expenditures - (156,000) 654,338 810,338
Other Financing Sources (Uses):Transfers In - 156,000 156,000 -
Total Other Financing Sources (Uses) - 156,000 156,000 -
Net Change in Fund Balance - - 810,338 810,338
Fund Balance - Beginning of Year - - 181,613 181,613Fund Balance - End of Year $ - $ - $ 991,951 $ 991,951
189
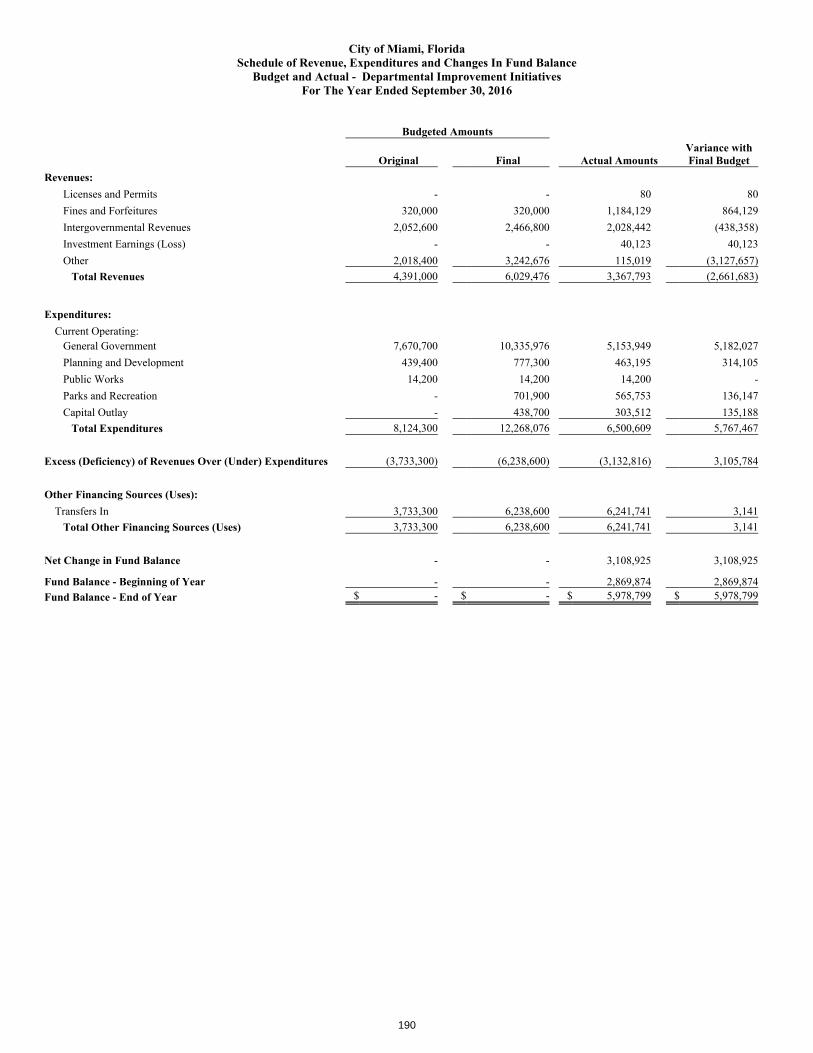
City of Miami, FloridaSchedule of Revenue, Expenditures and Changes In Fund Balance
Budget and Actual - Departmental Improvement InitiativesFor The Year Ended September 30, 2016
Budgeted Amounts
Original Final Actual AmountsVariance withFinal Budget
Revenues:Licenses and Permits - - 80 80Fines and Forfeitures 320,000 320,000 1,184,129 864,129Intergovernmental Revenues $ 2,052,600 $ 2,466,800 $ 2,028,442 $ (438,358)Investment Earnings (Loss) - - 40,123 40,123Other 2,018,400 3,242,676 115,019 (3,127,657)
Total Revenues 4,391,000 6,029,476 3,367,793 (2,661,683)
Expenditures:Current Operating:
General Government 7,670,700 10,335,976 5,153,949 5,182,027Planning and Development 439,400 777,300 463,195 314,105Public Works 14,200 14,200 14,200 -Parks and Recreation - 701,900 565,753 136,147Capital Outlay - 438,700 303,512 135,188
Total Expenditures 8,124,300 12,268,076 6,500,609 5,767,467
Excess (Deficiency) of Revenues Over (Under) Expenditures (3,733,300) (6,238,600) (3,132,816) 3,105,784
Other Financing Sources (Uses):Transfers In 3,733,300 6,238,600 6,241,741 3,141
Total Other Financing Sources (Uses) 3,733,300 6,238,600 6,241,741 3,141
Net Change in Fund Balance - - 3,108,925 3,108,925
Fund Balance - Beginning of Year - - 2,869,874 2,869,874Fund Balance - End of Year $ - $ - $ 5,978,799 $ 5,978,799
190
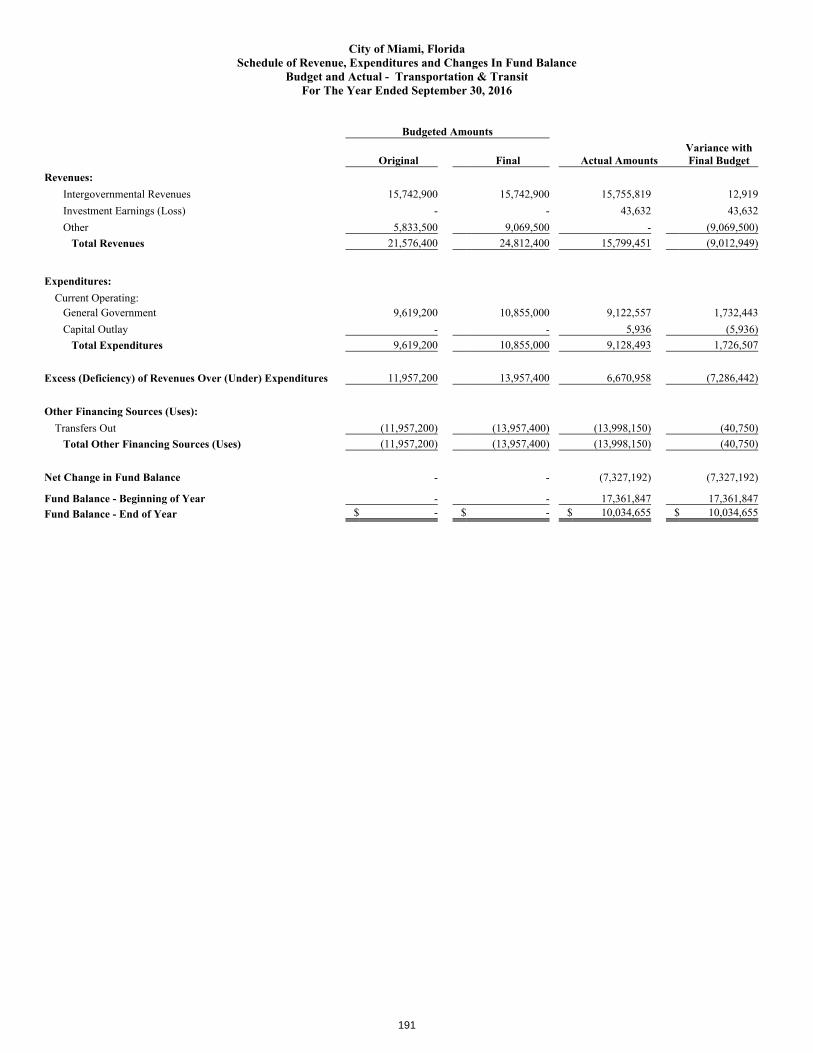
City of Miami, FloridaSchedule of Revenue, Expenditures and Changes In Fund Balance
Budget and Actual - Transportation & TransitFor The Year Ended September 30, 2016
Budgeted Amounts
Original Final Actual AmountsVariance withFinal Budget
Revenues:Intergovernmental Revenues $ 15,742,900 $ 15,742,900 $ 15,755,819 $ 12,919Investment Earnings (Loss) - - 43,632 43,632Other 5,833,500 9,069,500 - (9,069,500)
Total Revenues 21,576,400 24,812,400 15,799,451 (9,012,949)
Expenditures:Current Operating:
General Government 9,619,200 10,855,000 9,122,557 1,732,443Capital Outlay - - 5,936 (5,936)
Total Expenditures 9,619,200 10,855,000 9,128,493 1,726,507
Excess (Deficiency) of Revenues Over (Under) Expenditures 11,957,200 13,957,400 6,670,958 (7,286,442)
Other Financing Sources (Uses):Transfers Out (11,957,200) (13,957,400) (13,998,150) (40,750)
Total Other Financing Sources (Uses) (11,957,200) (13,957,400) (13,998,150) (40,750)
Net Change in Fund Balance - - (7,327,192) (7,327,192)
Fund Balance - Beginning of Year - - 17,361,847 17,361,847Fund Balance - End of Year $ - $ - $ 10,034,655 $ 10,034,655
191
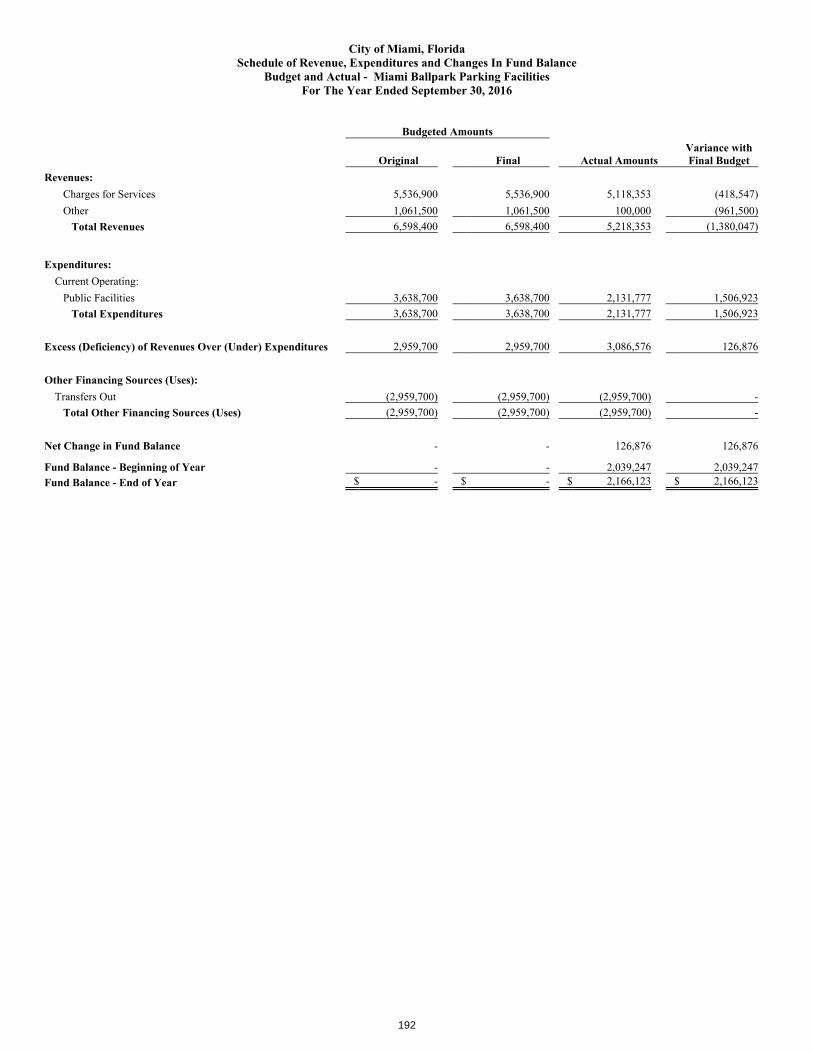
City of Miami, FloridaSchedule of Revenue, Expenditures and Changes In Fund Balance
Budget and Actual - Miami Ballpark Parking FacilitiesFor The Year Ended September 30, 2016
Budgeted Amounts
Original Final Actual AmountsVariance withFinal Budget
Revenues:Charges for Services $ 5,536,900 $ 5,536,900 $ 5,118,353 $ (418,547)Other 1,061,500 1,061,500 100,000 (961,500)
Total Revenues 6,598,400 6,598,400 5,218,353 (1,380,047)
Expenditures:Current Operating:
Public Facilities 3,638,700 3,638,700 2,131,777 1,506,923Total Expenditures 3,638,700 3,638,700 2,131,777 1,506,923
Excess (Deficiency) of Revenues Over (Under) Expenditures 2,959,700 2,959,700 3,086,576 126,876
Other Financing Sources (Uses):Transfers Out (2,959,700) (2,959,700) (2,959,700) -
Total Other Financing Sources (Uses) (2,959,700) (2,959,700) (2,959,700) -
Net Change in Fund Balance - - 126,876 126,876
Fund Balance - Beginning of Year - - 2,039,247 2,039,247Fund Balance - End of Year $ - $ - $ 2,166,123 $ 2,166,123
192
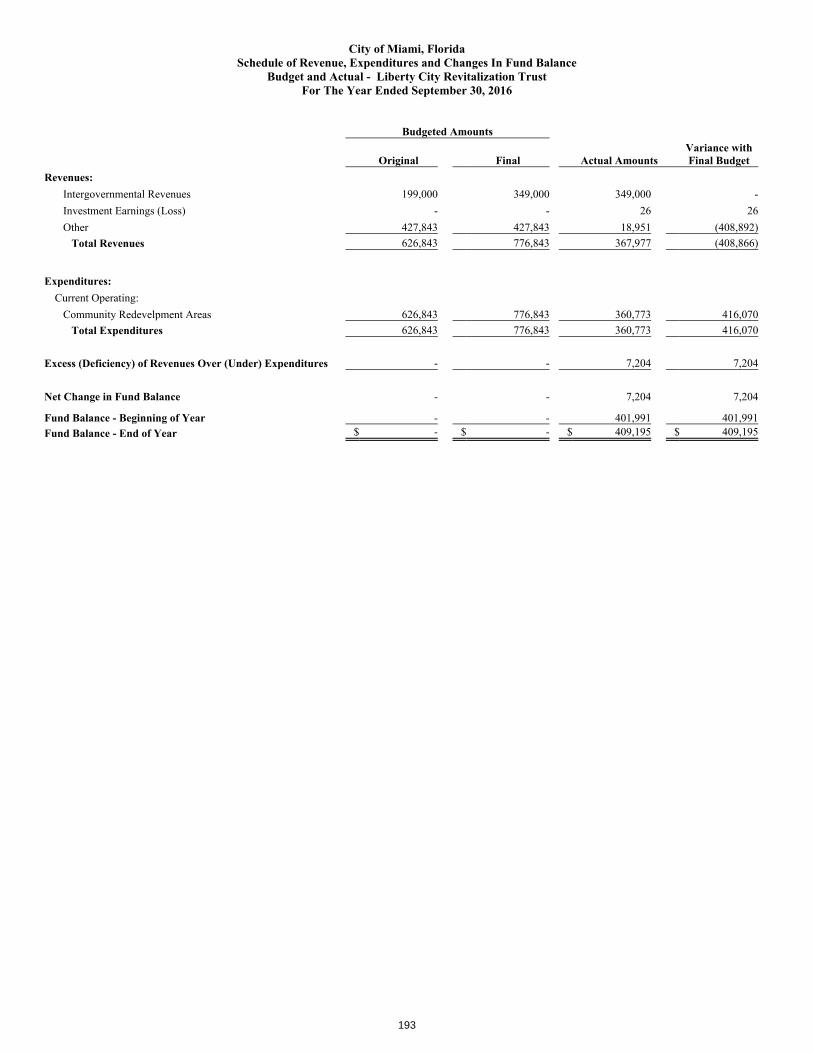
City of Miami, FloridaSchedule of Revenue, Expenditures and Changes In Fund Balance
Budget and Actual - Liberty City Revitalization TrustFor The Year Ended September 30, 2016
Budgeted Amounts
Original Final Actual AmountsVariance withFinal Budget
Revenues:Intergovernmental Revenues $ 199,000 $ 349,000 $ 349,000 $ -Investment Earnings (Loss) - - 26 26Other 427,843 427,843 18,951 (408,892)
Total Revenues 626,843 776,843 367,977 (408,866)
Expenditures:Current Operating:
Community Redevelpment Areas 626,843 776,843 360,773 416,070Total Expenditures 626,843 776,843 360,773 416,070
Excess (Deficiency) of Revenues Over (Under) Expenditures - - 7,204 7,204
Net Change in Fund Balance - - 7,204 7,204
Fund Balance - Beginning of Year - - 401,991 401,991Fund Balance - End of Year $ - $ - $ 409,195 $ 409,195
193
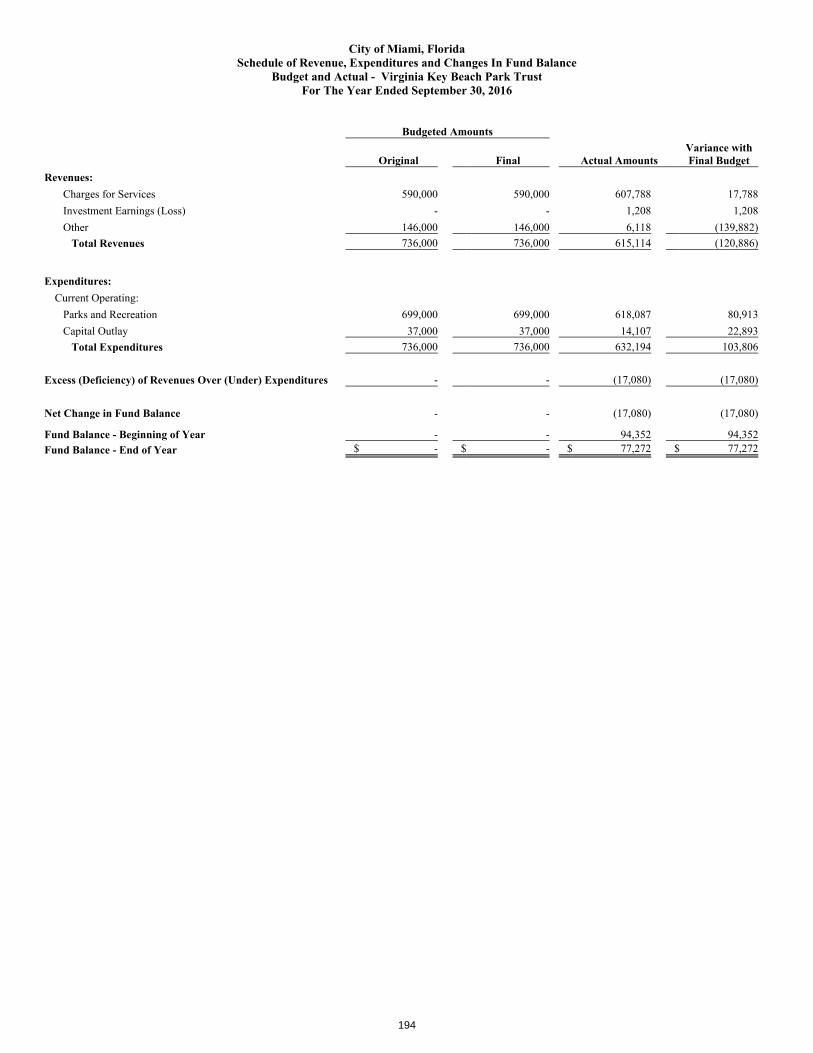
City of Miami, FloridaSchedule of Revenue, Expenditures and Changes In Fund Balance
Budget and Actual - Virginia Key Beach Park TrustFor The Year Ended September 30, 2016
Budgeted Amounts
Original Final Actual AmountsVariance withFinal Budget
Revenues:Charges for Services $ 590,000 $ 590,000 $ 607,788 $ 17,788Investment Earnings (Loss) - - 1,208 1,208Other 146,000 146,000 6,118 (139,882)
Total Revenues 736,000 736,000 615,114 (120,886)
Expenditures:Current Operating:
Parks and Recreation 699,000 699,000 618,087 80,913Capital Outlay 37,000 37,000 14,107 22,893
Total Expenditures 736,000 736,000 632,194 103,806
Excess (Deficiency) of Revenues Over (Under) Expenditures - - (17,080) (17,080)
Net Change in Fund Balance - - (17,080) (17,080)
Fund Balance - Beginning of Year - - 94,352 94,352Fund Balance - End of Year $ - $ - $ 77,272 $ 77,272
194
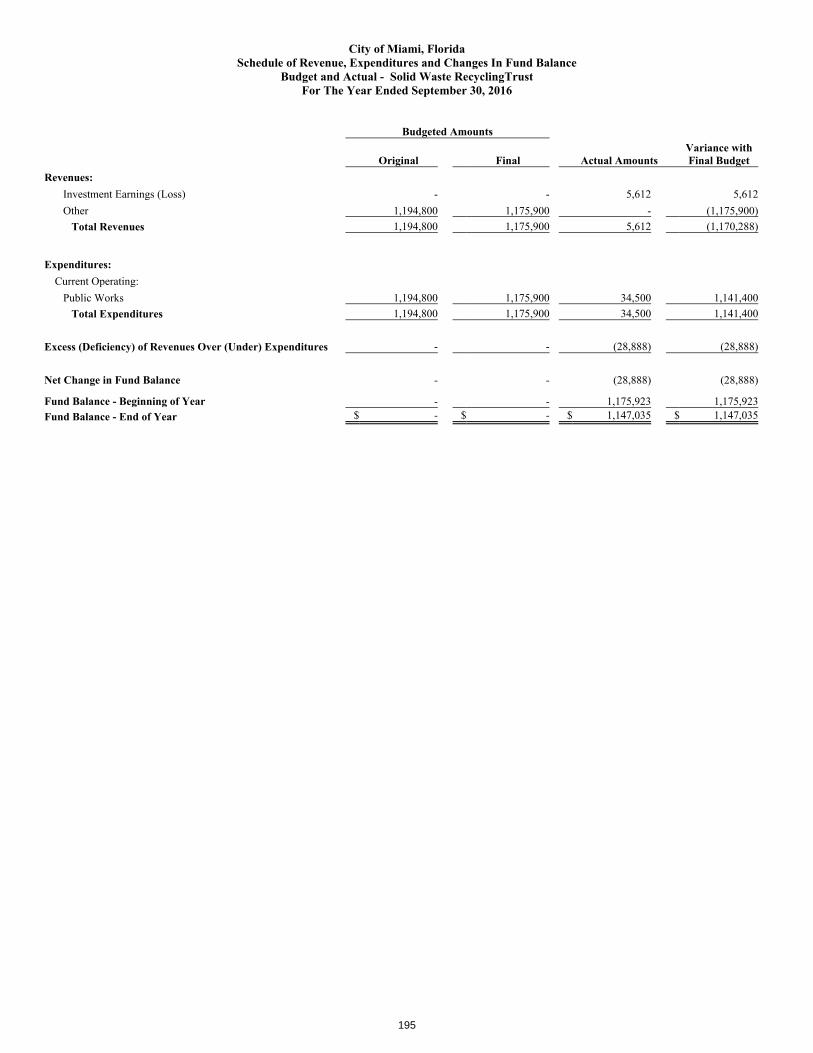
City of Miami, FloridaSchedule of Revenue, Expenditures and Changes In Fund Balance
Budget and Actual - Solid Waste RecyclingTrustFor The Year Ended September 30, 2016
Budgeted Amounts
Original Final Actual AmountsVariance withFinal Budget
Revenues:Investment Earnings (Loss) - - 5,612 5,612Other 1,194,800 1,175,900 - (1,175,900)
Total Revenues 1,194,800 1,175,900 5,612 (1,170,288)
Expenditures:Current Operating:
Public Works 1,194,800 1,175,900 34,500 1,141,400Total Expenditures 1,194,800 1,175,900 34,500 1,141,400
Excess (Deficiency) of Revenues Over (Under) Expenditures - - (28,888) (28,888)
Net Change in Fund Balance - - (28,888) (28,888)
Fund Balance - Beginning of Year - - 1,175,923 1,175,923Fund Balance - End of Year $ - $ - $ 1,147,035 $ 1,147,035
195

City of Miami, FloridaSchedule of Revenue, Expenditures and Changes In Fund Balance
Budget and Actual - General Obligation BondsFor The Year Ended September 30, 2016
Budgeted Amounts
Original Final Actual AmountsVariance withFinal Budget
Revenues:Property Taxes $ 26,103,500 $ 26,103,500 $ 25,661,731 $ (441,769)Investment Earnings (Loss) - - 2,144 2,144
Total Revenues 26,103,500 26,103,500 25,663,875 (439,625)
Expenditures:Current Operating:
General Government 29,200 29,200 181,582 (152,382)Debt Service:
Principal 14,908,400 14,908,400 14,908,304 96Interest and Other Charges 11,165,900 11,165,900 12,655,706 (1,489,806)
Total Expenditures 26,103,500 26,103,500 27,745,592 (1,642,092)
Excess (Deficiency) of Revenues Over (Under) Expenditures - - (2,081,717) (2,081,717)
Other Financing Sources (Uses):Proceeds Received from Refunding - - 57,240,000 57,240,000Payment To Escrow Agent For Refunding - - (53,519,351) (53,519,351)
Total Other Financing Sources (Uses) - - 3,720,649 3,720,649
Net Change in Fund Balance - - 1,638,932 1,638,932
Fund Balance - Beginning of Year - - 1,810,610 1,810,610Fund Balance - End of Year $ - $ - $ 3,449,542 $ 3,449,542
196

City of Miami, FloridaSchedule of Revenue, Expenditures and Changes In Fund Balance
Budget and Actual - Special Obligation BondsFor The Year Ended September 30, 2016
Budgeted Amounts
Original Final Actual AmountsVariance withFinal Budget
Revenues:Intergovernmental Revenues $ 3,000,000 $ 3,000,000 $ 4,083,335 $ 1,083,335Investment Earnings (Loss) - - 24,088 24,088
Total Revenues 3,000,000 3,000,000 4,107,423 1,107,423
Expenditures:Current Operating:
General Government 6,500 6,500 26,000 (19,500)Debt Service:
Principal 13,800,200 13,800,200 11,443,117 2,357,083Interest and Other Charges 22,355,000 22,355,000 22,354,597 403
Total Expenditures 36,161,700 36,161,700 33,823,714 2,337,986
Excess (Deficiency) of Revenues Over (Under) Expenditures (33,161,700) (33,161,700) (29,716,291) 3,445,409
Other Financing Sources (Uses):Transfers In 33,161,700 35,510,100 35,510,100 -Transfers Out - (2,348,400) - 2,348,400
Total Other Financing Sources (Uses) 33,161,700 33,161,700 35,510,100 2,348,400
Net Change in Fund Balance - - 5,793,809 5,793,809
Fund Balance - Beginning of Year - - 35,257,963 35,257,963Fund Balance - End of Year $ - $ - $ 41,051,772 $ 41,051,772
197
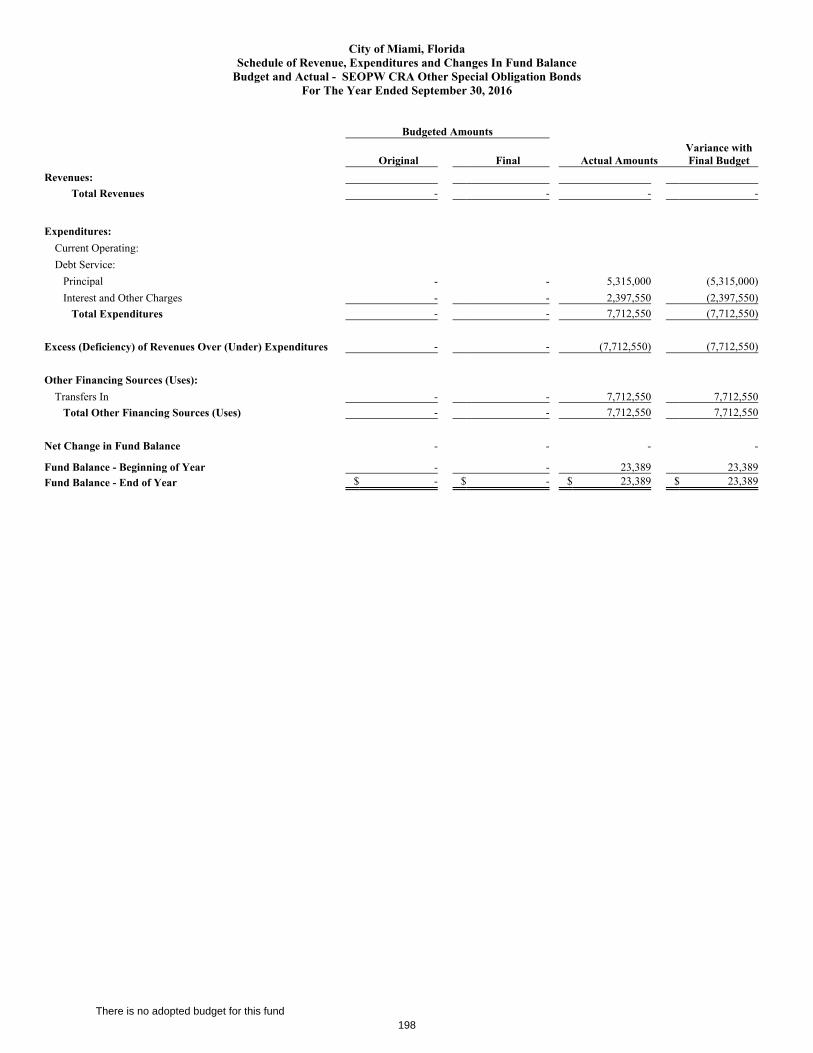
City of Miami, FloridaSchedule of Revenue, Expenditures and Changes In Fund Balance
Budget and Actual - SEOPW CRA Other Special Obligation BondsFor The Year Ended September 30, 2016
Budgeted Amounts
Original Final Actual AmountsVariance withFinal Budget
Revenues:Total Revenues - - - -
Expenditures:Current Operating:Debt Service:
Principal - - 5,315,000 (5,315,000)Interest and Other Charges - - 2,397,550 (2,397,550)
Total Expenditures - - 7,712,550 (7,712,550)
Excess (Deficiency) of Revenues Over (Under) Expenditures - - (7,712,550) (7,712,550)
Other Financing Sources (Uses):Transfers In - - 7,712,550 7,712,550
Total Other Financing Sources (Uses) - - 7,712,550 7,712,550
Net Change in Fund Balance - - - -
Fund Balance - Beginning of Year - - 23,389 23,389Fund Balance - End of Year $ - $ - $ 23,389 $ 23,389
198
There is no adopted budget for this fund

FIDUCIARYFUNDS
Fiduciary Funds are used to account for assets held by the City in a trustee capacity.
FIREFIGHTERS AND POLICE OFFICERS (FIPO)
This Pension Trust Fund is used to account for the accumulation of resources to be used for the payment of retirement benefits to Police and Firefighters. Resources are contributed by employees at rates fixed by law and by the City at amounts determined by annual actuarial valuations.
GENERAL EMPLOYEES AND SANITATION EMPLOYEES (GESE)
These Pension Trust Funds are used to account for the three separate GESE Plans (GESE Members, Excess Plan and Staff Plan). The funds are used to account for the accumulation of resources to be used for the payment of retirement benefits to City employees, other than police and firefighters. Resources are contributed by employees at rates fixed by law and by the City at amounts determined by annual actuarial valuations.
CITY OF MIAMI ELECTED OFFICERS’ RETIREMENT TRUST (EORT)
This Fund is used to account for the accumulation of resources to be used for the payment of retirement benefits to elected officials. Resources are contributed by the City in amounts determined by annual actuarial valuations.
199
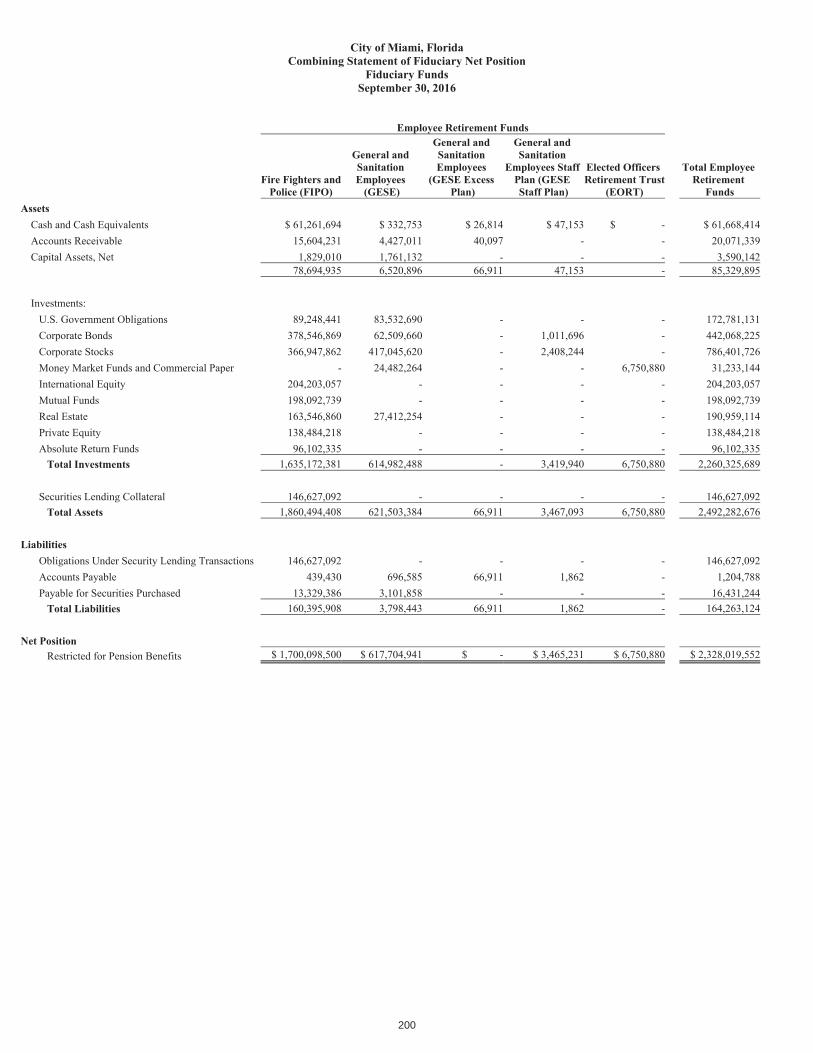
200
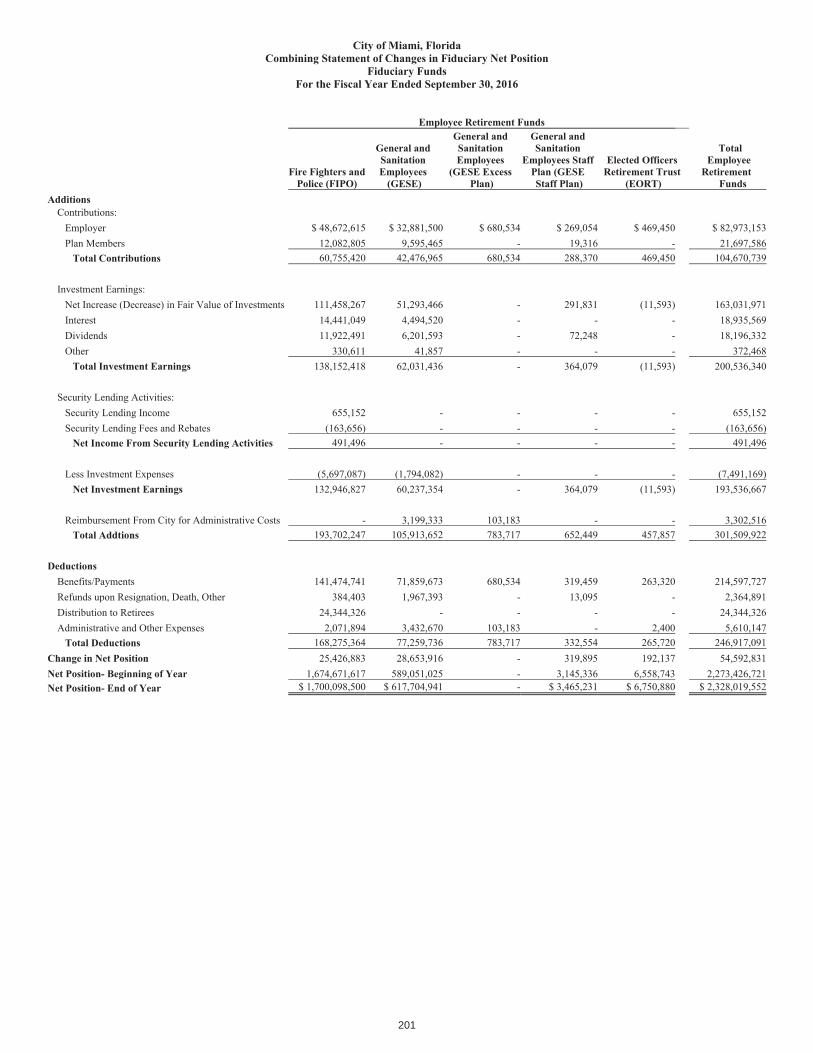
201
STATISTICAL SECTION
This part of the City’s comprehensive annual financial report presents detailed information as a context for understanding what the information contained in the financial statements, note disclosures, and required supplementary information says about the City’s overall financial health.
FINANCIAL TRENDS
These schedules contain trend information to help the reader understand how the City’s financial performance and well-being have changed over time.
REVENUE CAPACITY
These schedules contain information to help the reader assess the City’s most significant local revenue source, the property tax.
DEBT CAPACITY
These schedules present information to help the reader assess the affordability of the City’s current levels of outstanding debt and the City’s ability to issue additional debt in the future.
DEMOGRAPHIC AND ECONOMIC INFORMATION
These schedules offer demographic and economic indicators to help the reader understand the environment within which the City’s financial activities take place.
OPERATING INFORMATION
These schedules contain service and infrastructure data to help the reader understand how the information in the City’s financial report relates to the services the City provides and the activities it performs.elected officials.
202

203
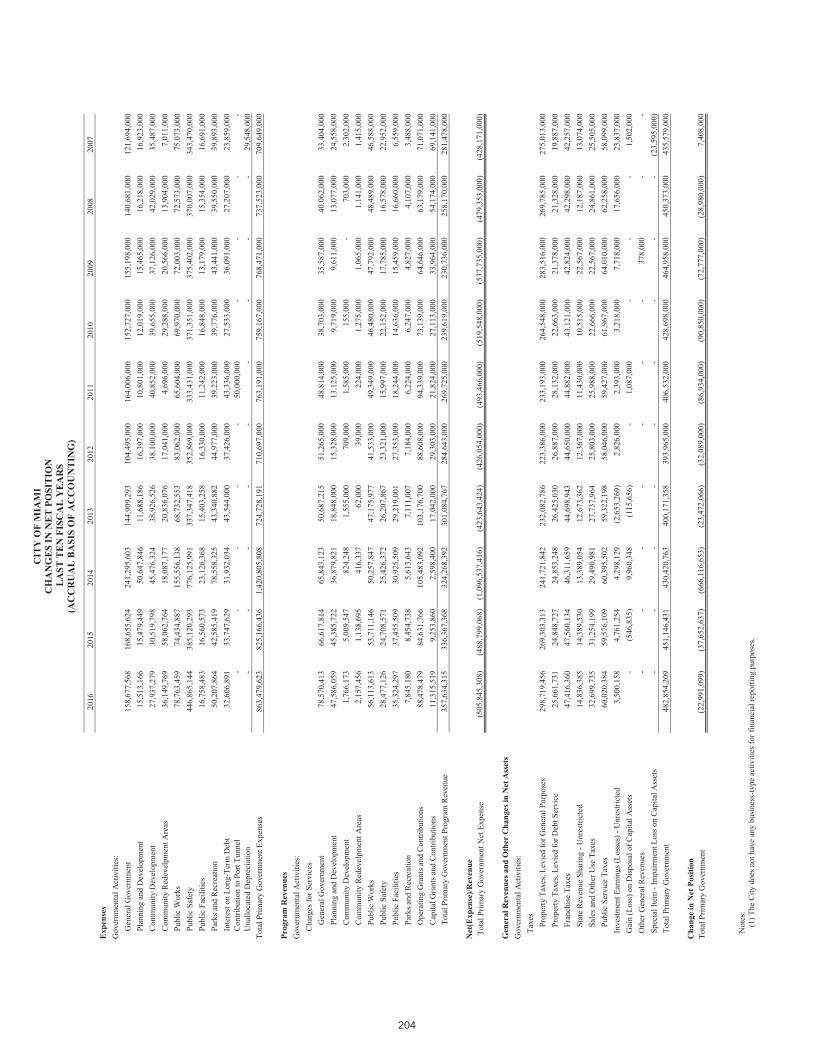
204
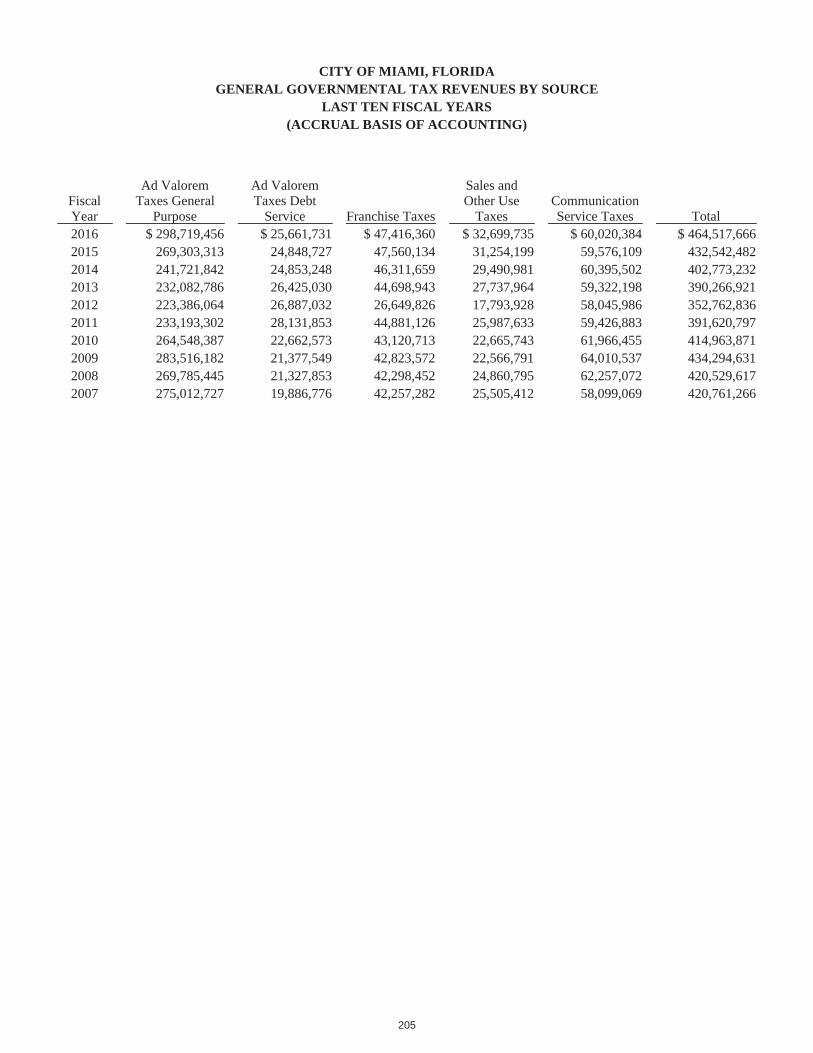
CITY OF MIAMI, FLORIDAGENERAL GOVERNMENTAL TAX REVENUES BY SOURCE
LAST TEN FISCAL YEARS(ACCRUAL BASIS OF ACCOUNTING)
FiscalYear
Ad Valorem Taxes General
Purpose
Ad Valorem Taxes Debt
Service Franchise Taxes
Sales and Other Use
TaxesCommunicationService Taxes Total
2016 $ 298,719,456 $ 25,661,731 $ 47,416,360 $ 32,699,735 $ 60,020,384 $ 464,517,6662015 269,303,313 24,848,727 47,560,134 31,254,199 59,576,109 432,542,4822014 241,721,842 24,853,248 46,311,659 29,490,981 60,395,502 402,773,2322013 232,082,786 26,425,030 44,698,943 27,737,964 59,322,198 390,266,9212012 223,386,064 26,887,032 26,649,826 17,793,928 58,045,986 352,762,8362011 233,193,302 28,131,853 44,881,126 25,987,633 59,426,883 391,620,7972010 264,548,387 22,662,573 43,120,713 22,665,743 61,966,455 414,963,8712009 283,516,182 21,377,549 42,823,572 22,566,791 64,010,537 434,294,6312008 269,785,445 21,327,853 42,298,452 24,860,795 62,257,072 420,529,6172007 275,012,727 19,886,776 42,257,282 25,505,412 58,099,069 420,761,266
205
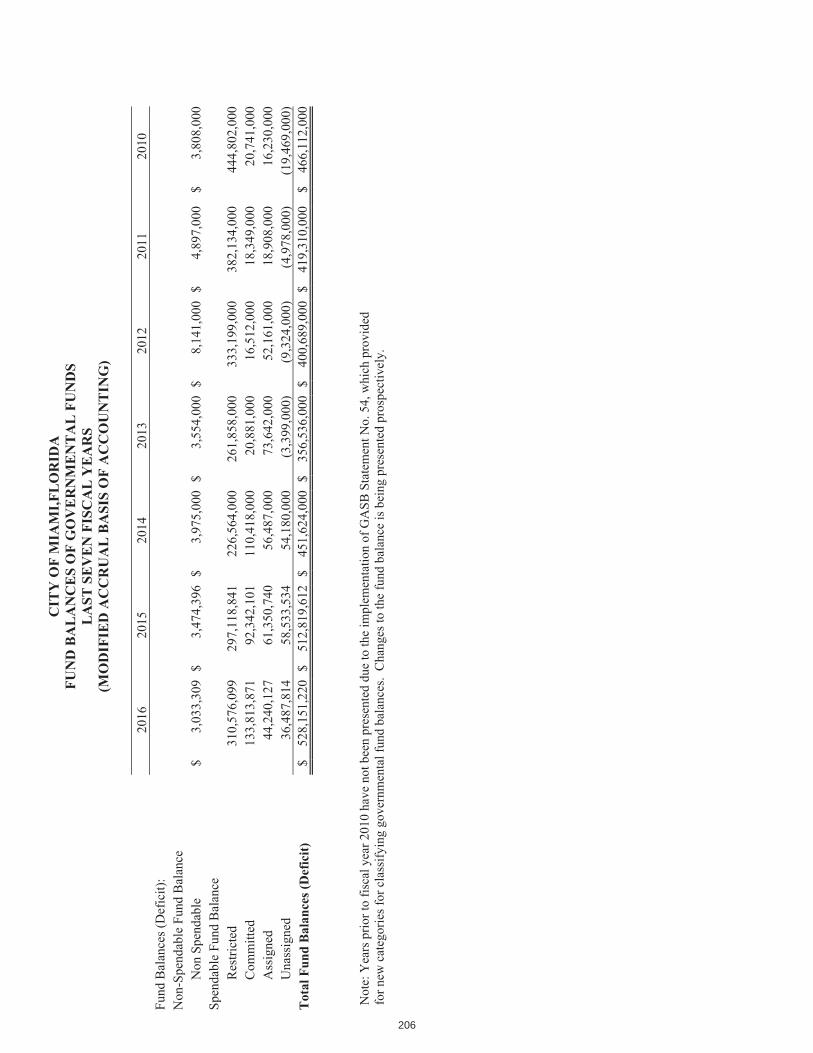
206
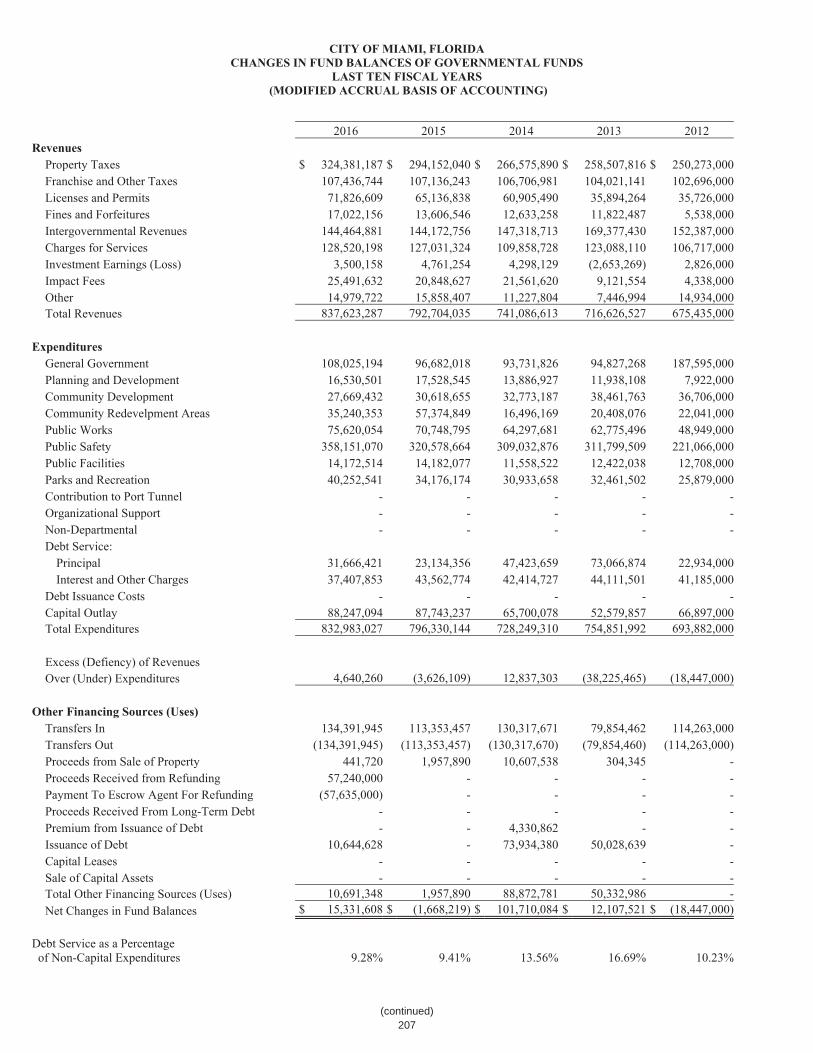
207
(continued)

208

CITY OF MIAMI, FLORIDAGENERAL GOVERNMENTAL TAX REVENUES BY SOURCE
LAST TEN FISCAL YEARS(MODIFIED ACCRUAL BASIS OF ACCOUNTING)
FiscalYear
Ad Valorem Taxes General
Purpose
Ad Valorem Taxes Debt
ServiceFranchise
Taxes
Sales and Other Use
TaxesCommunicationService Taxes Total
2016 $ 298,719,456 $ 25,661,731 $ 47,416,360 $ 32,699,735 $ 60,020,384 $ 464,517,6662015 269,303,313 24,848,727 47,560,134 31,254,199 59,576,109 432,542,4822014 241,722,642 24,853,248 46,311,659 29,490,981 60,395,322 402,773,8522013 232,082,786 26,425,030 44,698,943 27,737,964 59,322,198 390,266,9212012 223,386,063 26,887,032 44,649,826 25,803,387 58,045,986 378,772,2942011 233,193,302 28,131,853 44,881,126 25,987,633 59,426,883 391,620,7972010 264,548,387 22,662,573 43,120,713 22,665,743 61,966,455 414,963,8712009 283,516,182 21,377,549 42,823,572 22,566,791 64,010,537 434,294,6312008 269,785,445 21,327,853 42,298,452 24,860,795 62,257,072 420,529,6172007 275,012,727 19,886,776 42,257,282 25,505,412 58,099,069 420,761,266
209
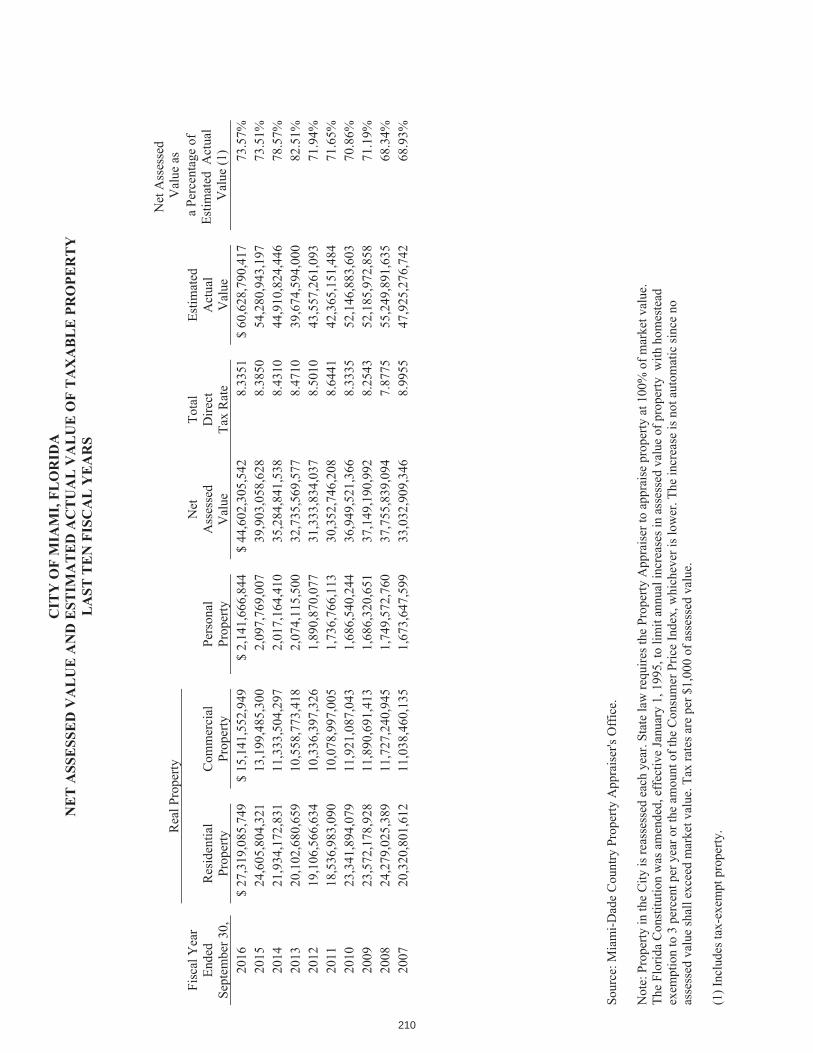
210

211
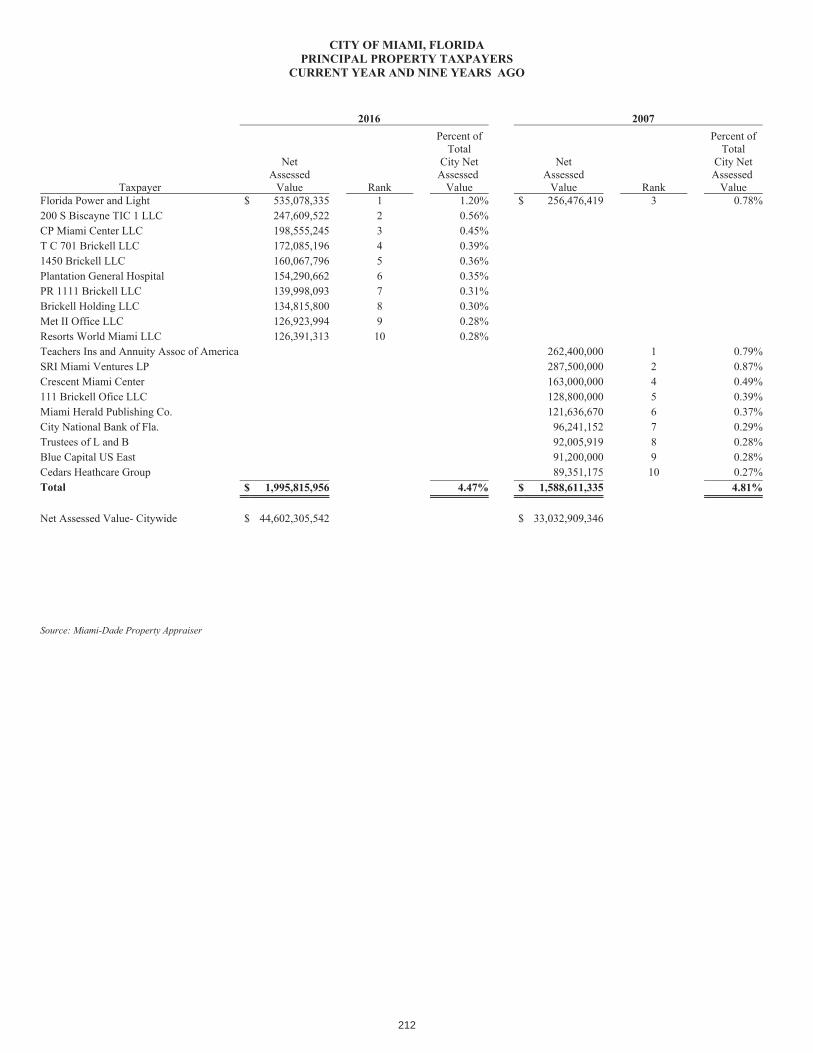
212

213
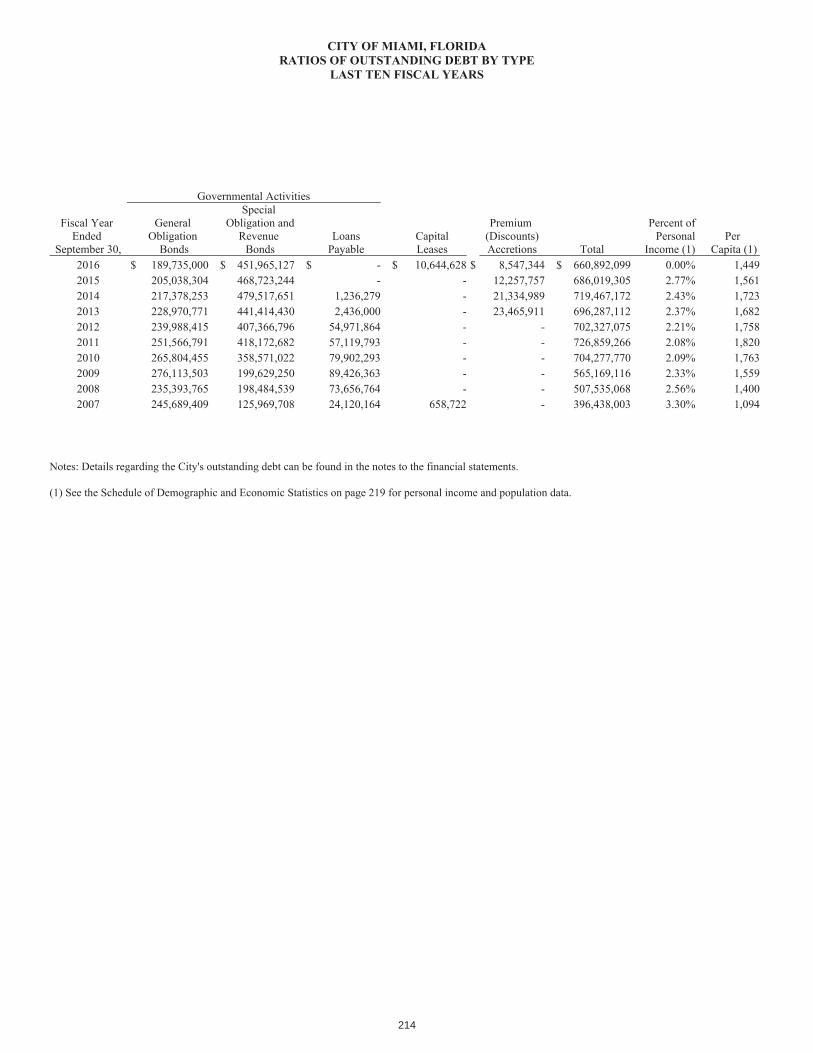
214
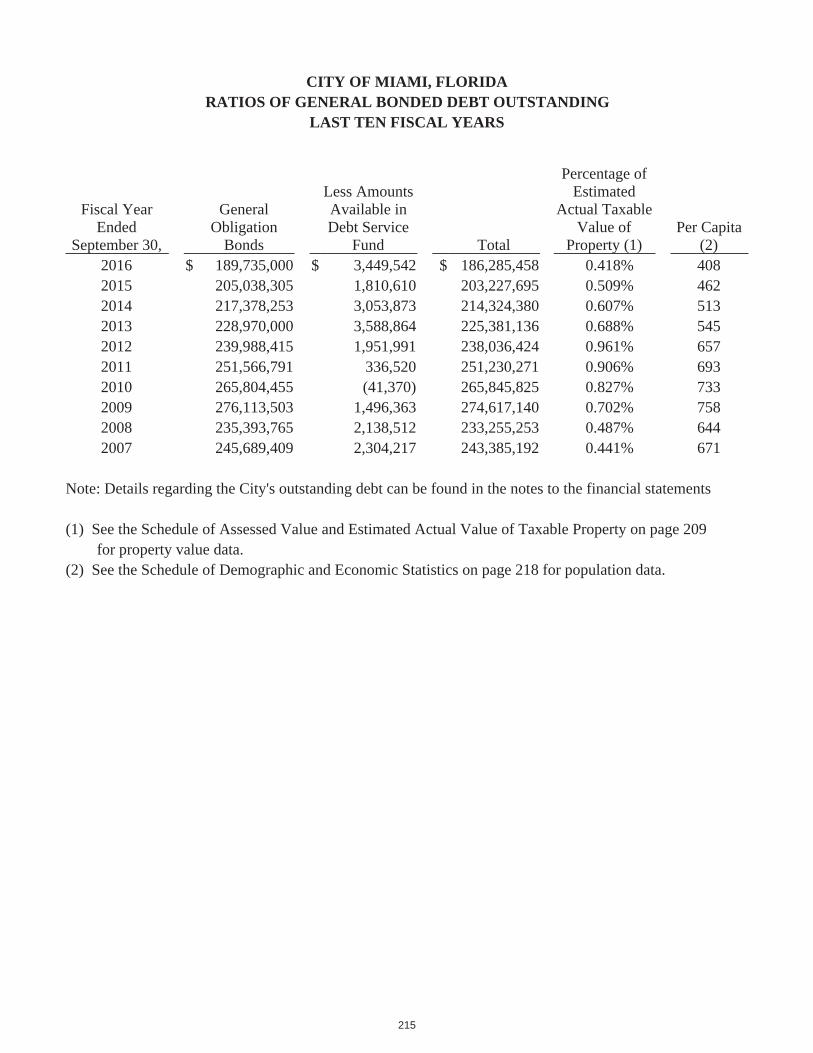
CITY OF MIAMI, FLORIDARATIOS OF GENERAL BONDED DEBT OUTSTANDING
LAST TEN FISCAL YEARS
Fiscal Year Ended
September 30,
GeneralObligation
Bonds
Less Amounts Available in Debt Service
Fund Total
Percentage of Estimated
Actual Taxable Value of
Property (1)Per Capita
(2)2016 $ 189,735,000 $ 3,449,542 $ 186,285,458 0.418% 4082015 205,038,305 1,810,610 203,227,695 0.509% 4622014 217,378,253 3,053,873 214,324,380 0.607% 5132013 228,970,000 3,588,864 225,381,136 0.688% 5452012 239,988,415 1,951,991 238,036,424 0.961% 6572011 251,566,791 336,520 251,230,271 0.906% 6932010 265,804,455 (41,370) 265,845,825 0.827% 7332009 276,113,503 1,496,363 274,617,140 0.702% 7582008 235,393,765 2,138,512 233,255,253 0.487% 6442007 245,689,409 2,304,217 243,385,192 0.441% 671
Note: Details regarding the City's outstanding debt can be found in the notes to the financial statements (1) See the Schedule of Assessed Value and Estimated Actual Value of Taxable Property on page 209 for property value data.(2) See the Schedule of Demographic and Economic Statistics on page 218 for population data.
215

216
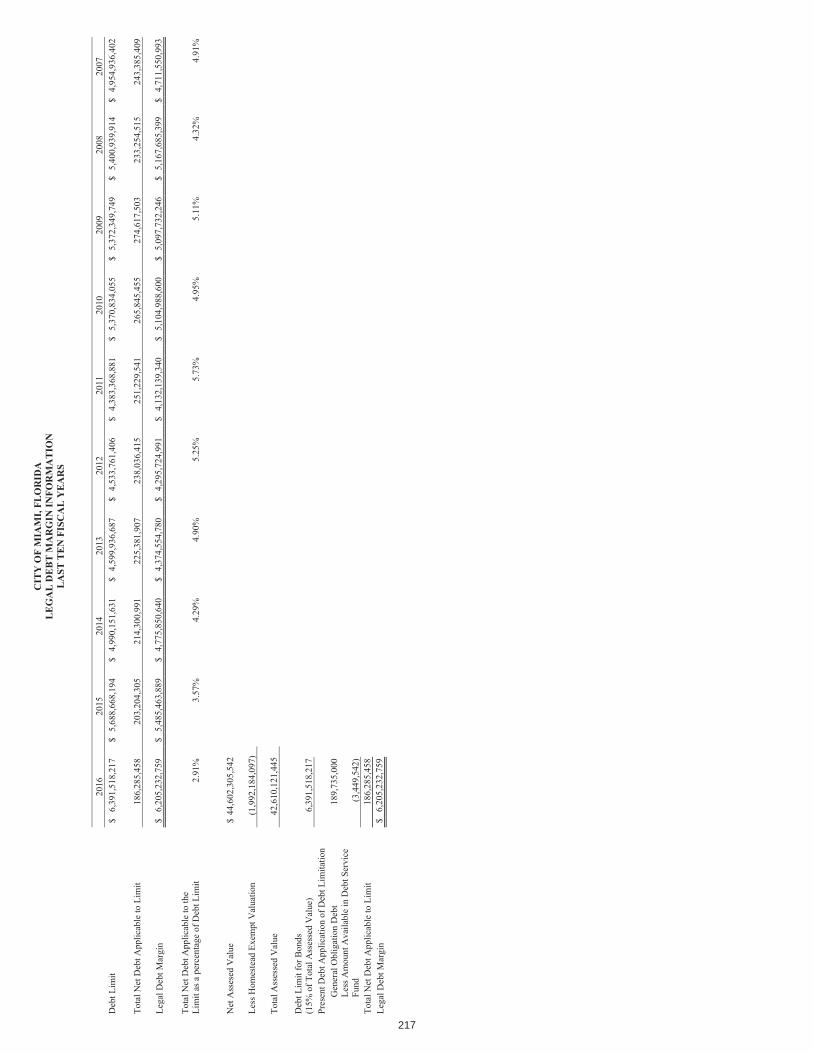
217
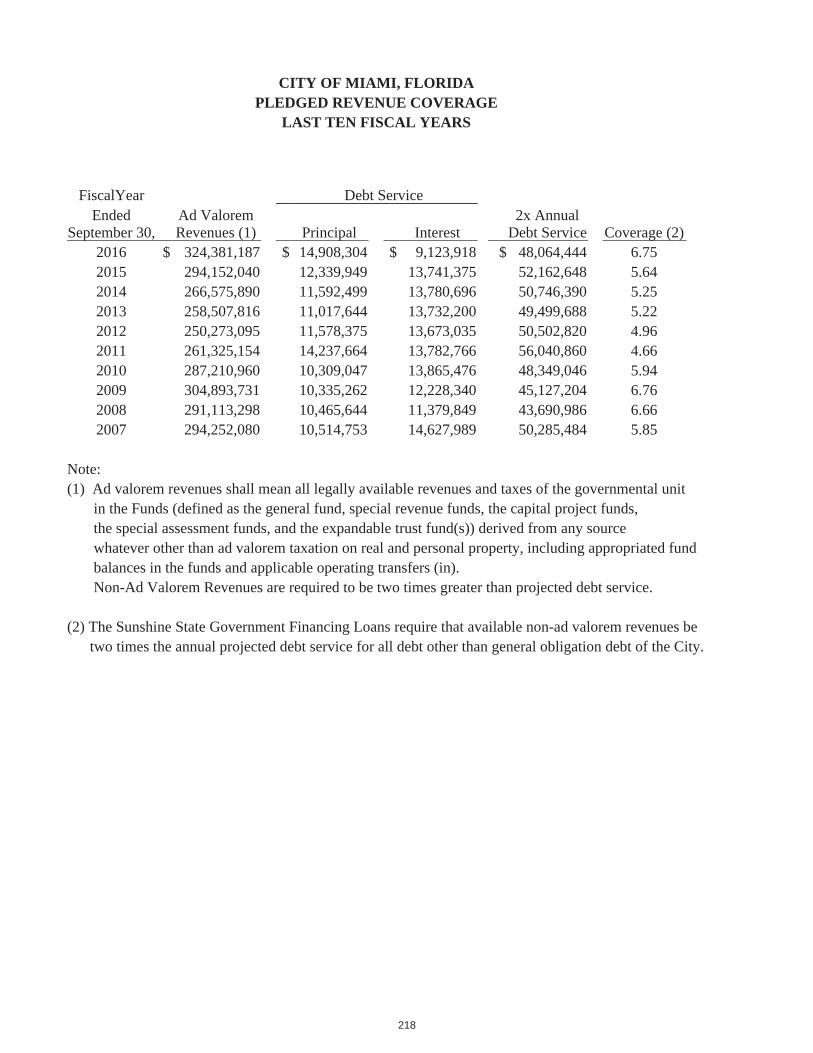
CITY OF MIAMI, FLORIDAPLEDGED REVENUE COVERAGE
LAST TEN FISCAL YEARS
FiscalYear Debt ServiceEnded
September 30,Ad Valorem Revenues (1) Principal Interest
2x Annual Debt Service Coverage (2)
2016 $ 324,381,187 $ 14,908,304 $ 9,123,918 $ 48,064,444 6.752015 294,152,040 12,339,949 13,741,375 52,162,648 5.642014 266,575,890 11,592,499 13,780,696 50,746,390 5.252013 258,507,816 11,017,644 13,732,200 49,499,688 5.222012 250,273,095 11,578,375 13,673,035 50,502,820 4.962011 261,325,154 14,237,664 13,782,766 56,040,860 4.662010 287,210,960 10,309,047 13,865,476 48,349,046 5.942009 304,893,731 10,335,262 12,228,340 45,127,204 6.762008 291,113,298 10,465,644 11,379,849 43,690,986 6.662007 294,252,080 10,514,753 14,627,989 50,285,484 5.85
Note:(1) Ad valorem revenues shall mean all legally available revenues and taxes of the governmental unit in the Funds (defined as the general fund, special revenue funds, the capital project funds, the special assessment funds, and the expandable trust fund(s)) derived from any source whatever other than ad valorem taxation on real and personal property, including appropriated fund balances in the funds and applicable operating transfers (in). Non-Ad Valorem Revenues are required to be two times greater than projected debt service. (2) The Sunshine State Government Financing Loans require that available non-ad valorem revenues be two times the annual projected debt service for all debt other than general obligation debt of the City.
218
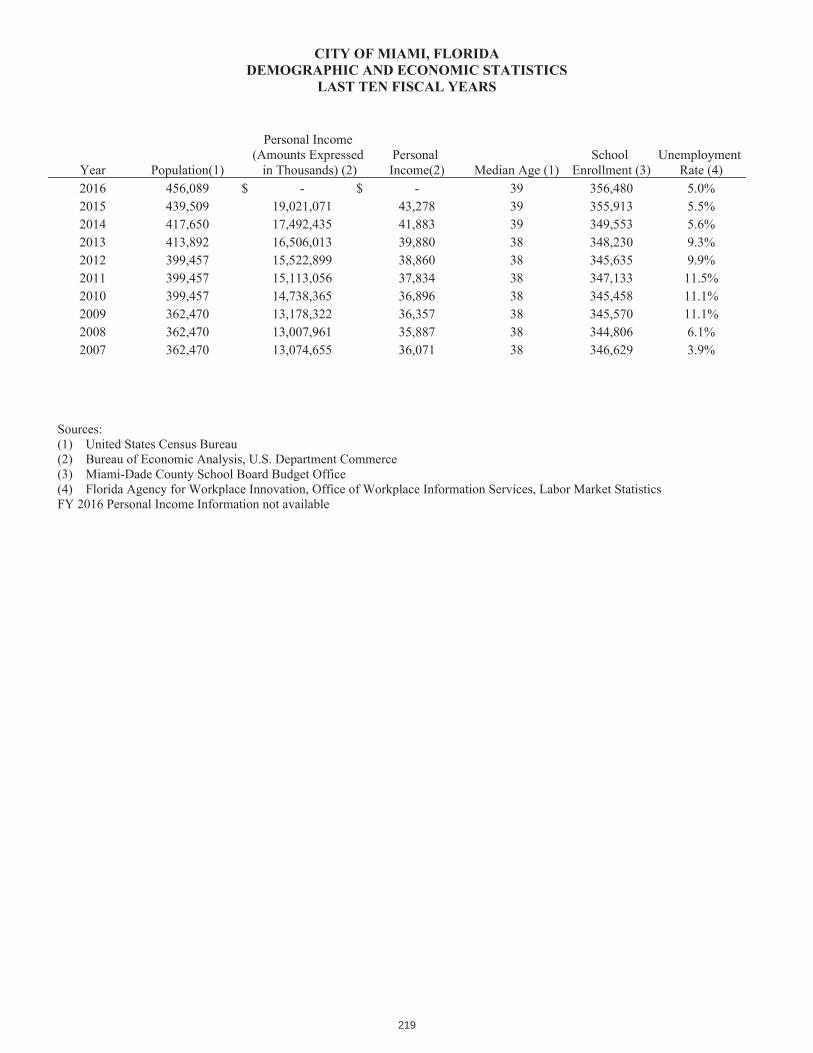
219
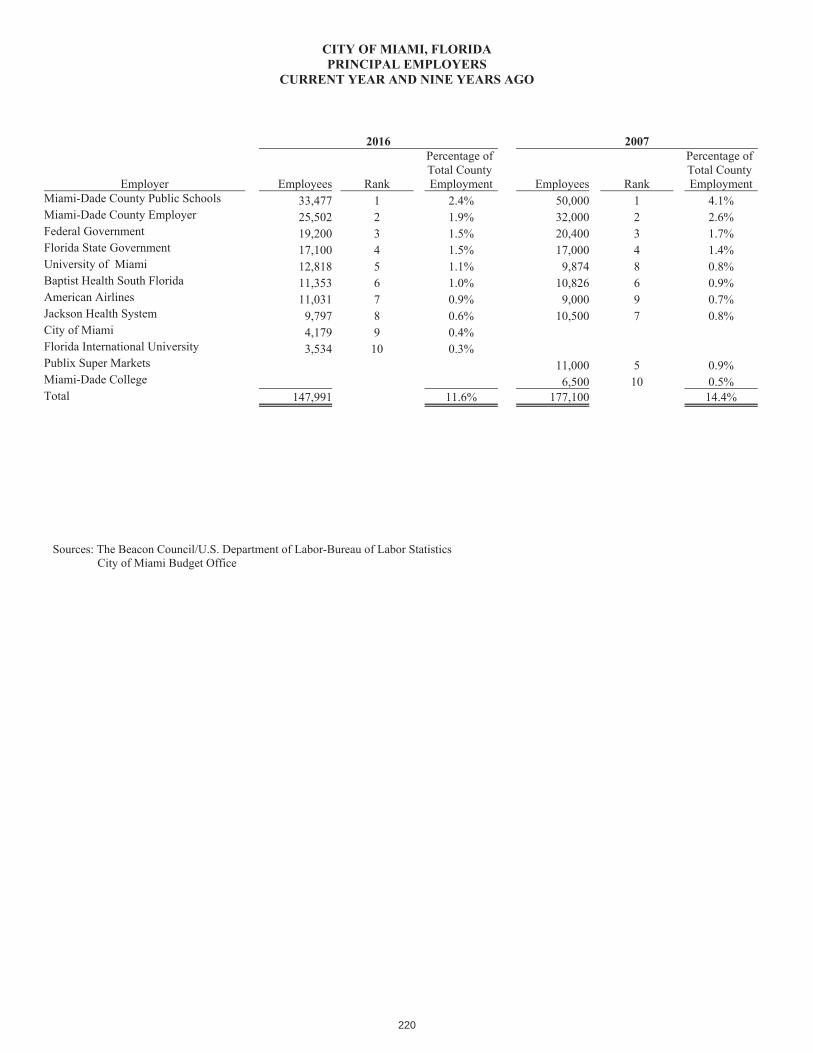
220
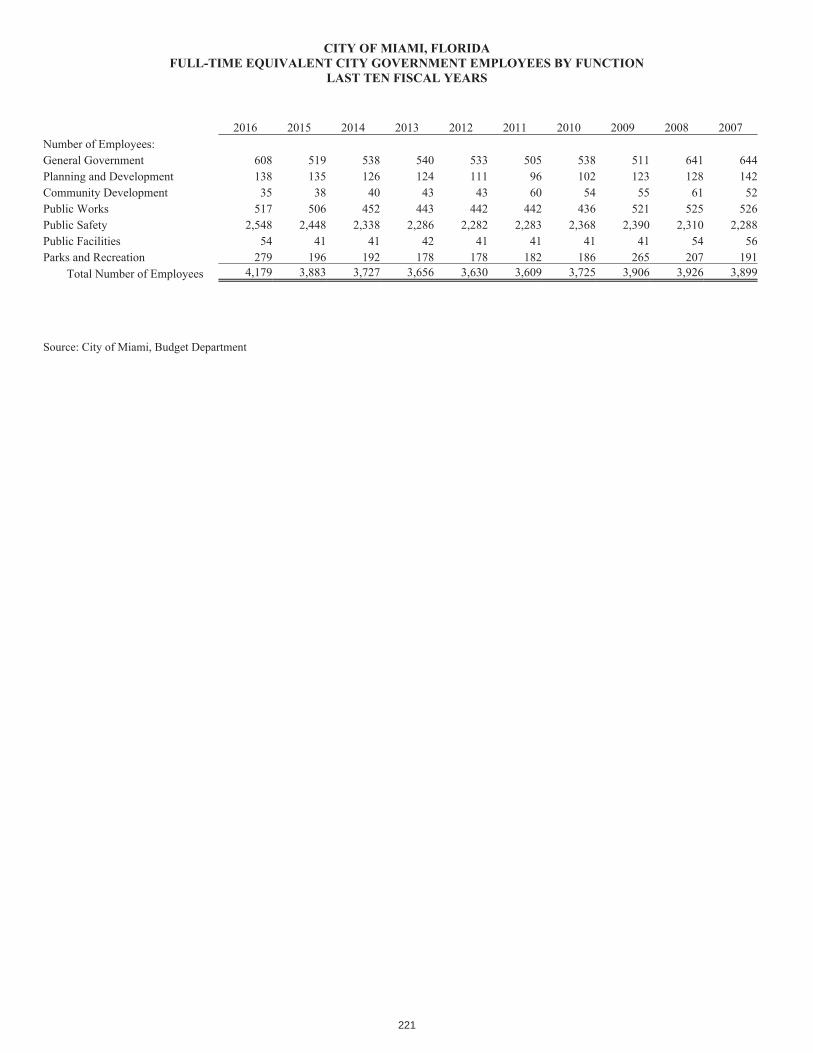
221

222
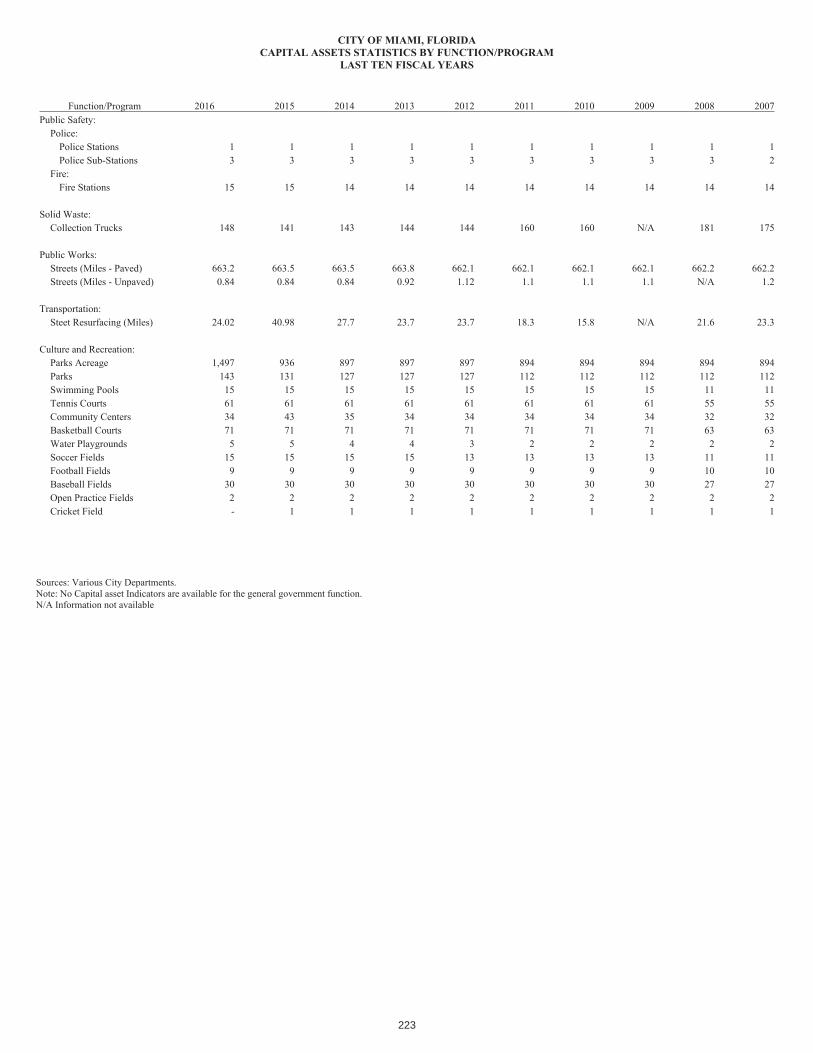
223

Page left intentionally blank
224
About the Cover
Bronze Statue of Founder
Julia Tuttle
Located at Bayfront Park
Downtown Miami
City of Miami, Florida
Finance Department
444 SW 2 Avenue, 6th Floor
Miami, Florida 33130
225

8
2015 FISCAL YEAR ENDED September 30, 2016POPULAR ANNUAL FINANCIAL REPORT
www.miamigov.com twitter.com/miamifinance3052016 FISCAL YEAR ENDED September 30, 2016
COMPREHENSIVE ANNUAL FINANCIAL REPORT
www.miamigov.com twitter.com/miamifinance305
City of Miami, Florida Single Audit Reports in Accordance with Uniform Guidance and Chapter 10.550, Rules of the Florida Auditor General Fiscal Year Ended September 30, 2016
Table of Contents Independent Auditor’s Report on Internal Control Over Financial Reporting and on
Compliance and Other Matters Based on an Audit of Financial Statements Performed in Accordance With Government Auditing Standards 1 – 2
Independent Auditor’s Report on Compliance for Each Major Federal Program and State Project; Report on Internal Control Over Compliance; and Report on the Schedule of Expenditures of Federal Awards and State Financial Assistance Required by the Uniform Guidance and Chapter 10.550, Rules of the Florida Auditor General 3 – 5
Schedule of Expenditures of Federal Awards and State Financial Assistance 6 – 10 Notes to Schedule of Expenditures of Federal Awards and State Financial Assistance 11
Schedule of Findings and Questioned Costs 12 – 18
Summary Schedule of Prior Years’ Audit Findings 19

1
Report on Internal Control Over Financial Reporting and on Compliance and Other Matters Based on an Audit of Financial
Statements Performed in Accordance With Government Auditing Standards
Independent Auditor’s Report To the Honorable Mayor and Members of the City Commission City of Miami, Florida We have audited, in accordance with the auditing standards generally accepted in the United States of America and the standards applicable to financial audits contained in Government Auditing Standards issued by the Comptroller General of the United States, the financial statements of the governmental activities, the aggregate discretely presented component units, each major fund, and the aggregate remaining fund information of the City of Miami, Florida (the City), as of and for the year ended September 30, 2016, and the related notes to the financial statements, which collectively comprise the City’s basic financial statements, and have issued our report thereon dated March 30, 2017. Our report includes a reference to other auditors who audited the following component units and funds, as described in our report on the City’s financial statements: Component Units / Funds Classification
• Southeast Overtown Park West Redevelopment Agency nonmajor special revenue fund• Omni Community Redevelopment Agency nonmajor special revenue fund• Midtown Community Redevelopment Agency nonmajor special revenue fund• Virginia Key Beach Park Trust nonmajor special revenue fund• Liberty City Community Revitalization District Trusts nonmajor special revenue fund
• Firefighters’ and Police Officers’ Retirement Trust aggregate remaining fund information• General Employees’ and Sanitation Employees’ aggregate remaining fund information
Retirement Trust and Other Managed Trusts
• Miami Sports and Exhibition Authority discretely presented component unit• Downtown Development Authority discretely presented component unit• Bayfront Park Management Trust discretely presented component unit• Coconut Grove Business Improvement District discretely presented component unit• Wynwood Business Improvement District discretely presented component unit
This report does not include the results of the other auditors’ testing of internal control over financial reporting or compliance and other matters that are reported on separately by those auditors.
2
Internal Control over Financial Reporting In planning and performing our audit of the financial statements, we considered the City’s internal control over financial reporting (internal control) to determine the audit procedures that are appropriate in the circumstances for the purpose of expressing our opinions on the financial statements, but not for the purpose of expressing an opinion on the effectiveness of the City’s internal control. Accordingly, we do not express an opinion on the effectiveness of the City’s internal control. A deficiency in internal control exists when the design or operation of a control does not allow management or employees, in the normal course of performing their assigned functions, to prevent, or detect and correct, misstatements on a timely basis. A material weakness is a deficiency, or a combination of deficiencies, in internal control, such that there is a reasonable possibility that a material misstatement of the entity’s financial statements will not be prevented, or detected and corrected on a timely basis. A significant deficiency is a deficiency, or a combination of deficiencies, in internal control that is less severe than a material weakness, yet important enough to merit attention by those charged with governance. Our consideration of internal control was for the limited purpose described in the first paragraph of this section and was not designed to identify all deficiencies in internal control that might be material weaknesses or significant deficiencies and therefore, material weaknesses or significant deficiencies may exist that were not identified. Given these limitations, during our audit we did not identify any deficiencies in internal control that we consider to be material weaknesses. We did identify a deficiency in internal control, described in the accompanying schedule of findings and questioned costs as item IC 2016-01 that we consider to be a significant deficiency. Compliance and Other Matters As part of obtaining reasonable assurance about whether the City’s financial statements are free from material misstatement, we performed tests of its compliance with certain provisions of laws, regulations, contracts and grant agreements, noncompliance with which could have a direct and material effect on the determination of financial statement amounts. However, providing an opinion on compliance with those provisions was not an objective of our audit, and accordingly, we do not express such an opinion. The results of our tests disclosed no instances of noncompliance or other matters that are required to be reported under Government Auditing Standards. City’s Response to Finding The City’s response to the finding identified in our audit is described in the accompanying schedule of findings and questioned costs. The City’s response was not subjected to the auditing procedures applied in the audit of the financial statements and, accordingly, we express no opinion on it. Purpose of this Report The purpose of this report is solely to describe the scope of our testing of internal control and compliance and the results of that testing, and not to provide an opinion on the effectiveness of the entity’s internal control or on compliance. This report is an integral part of an audit performed in accordance with Government Auditing Standards in considering the entity’s internal control and compliance. Accordingly, this communication is not suitable for any other purpose.
Miami, Florida March 30, 2017
3
Report on Compliance for Each Major Federal Program and State Project;
Report on Internal Control Over Compliance; and Report on Schedule of Expenditures of
Federal Awards and State Financial Assistance Required by the Uniform Guidance and
Chapter 10.550, Rules of the Florida Auditor General
Independent Auditor’s Report To the Honorable Mayor and Members of the City Commission City of Miami, Florida Report on Compliance for Each Major Federal Program and State Project We have audited the City of Miami, Florida’s (the City) compliance with the types of compliance requirements described in the OMB Compliance Supplement and the requirements described in the Florida Department of Financial Services State Projects Compliance Supplement, that could have a direct and material effect on each of the City’s major federal programs and state projects for the year ended September 30, 2016. The City’s major federal programs and state projects are identified in the summary of auditor’s results section of the accompanying schedule of findings and questioned costs. Management’s Responsibility Management is responsible for compliance with federal and state statutes, regulations and the terms and conditions applicable to its federal programs and state projects. Auditor’s Responsibility Our responsibility is to express an opinion on compliance for each of the City’s major federal programs and state projects based on our audit of the types of compliance requirements referred to above. We conducted our audit of compliance in accordance with auditing standards generally accepted in the United States of America; the standards applicable to financial audits contained in Government Auditing Standards, issued by the Comptroller General of the United States; and the audit requirements of Title 2 U.S. Code of Federal Regulations Part 200, Uniform Administrative Requirements, Cost Principles, and Audit Requirements for Federal Awards (Uniform Guidance) and Chapter 10.550, Rules of the Florida Auditor General (Chapter 10.550). Those standards, the Uniform Guidance and Chapter 10.550, Rules of the Florida Auditor General, require that we plan and perform the audit to obtain reasonable assurance about whether noncompliance with the types of compliance requirements referred to above that could have a direct and material effect on a major federal program or state project occurred. An audit includes examining, on a test basis, evidence about the City’s compliance with those requirements and performing such other procedures as we considered necessary in the circumstances. We believe that our audit provides a reasonable basis for our opinion on compliance for each major federal program and state project. However, our audit does not provide a legal determination of the City’s compliance.
4
Opinion on Each Major Federal Program and State Project In our opinion, the City complied, in all material respects, with the types of compliance requirements referred to above that could have a direct and material effect on each of its major federal programs and state projects for the year ended September 30, 2016. Other Matters The results of our auditing procedures disclosed instances of noncompliance, which are required to be reported in accordance with the Uniform Guidance and which are described in the accompanying schedule of findings and questioned costs as items CF 2016-01, CF 2016-02 and CF 2016-03. Our opinion on each major federal program is not modified with respect to these matters The City’s response to the noncompliance findings identified in our audit is described in the accompanying schedule of findings and questioned costs. The City’s response was not subjected to the auditing procedures applied in the audit of compliance and, accordingly, we express no opinion on the response. Report on Internal Control Over Compliance Management of the City is responsible for establishing and maintaining effective internal control over compliance with the types of compliance requirements referred to above. In planning and performing our audit of compliance, we considered the City’s internal control over compliance with the types of requirements that could have a direct and material effect on each major federal program and state project to determine the auditing procedures that are appropriate in the circumstances for the purpose of expressing an opinion on compliance for each major federal program and state project, and to test and report on internal control over compliance in accordance with Uniform Guidance and Chapter 10.550, Rules of the Florida Auditor General, but not for the purpose of expressing an opinion on the effectiveness of internal control over compliance. Accordingly, we do not express an opinion on the effectiveness of the City’s internal control over compliance. A deficiency in internal control over compliance exists when the design or operation of a control over compliance does not allow management or employees, in the normal course of performing their assigned functions, to prevent, or detect and correct, noncompliance with a type of compliance requirement of a federal program or state project on a timely basis. A material weakness in internal control over compliance is a deficiency, or combination of deficiencies, in internal control over compliance, such that there is a reasonable possibility that material noncompliance with a type of compliance requirement of a federal program or state project will not be prevented, or detected and corrected, on a timely basis. A significant deficiency in internal control over compliance is a deficiency, or a combination of deficiencies, in internal control over compliance with a type of compliance requirement of a federal program or state project that is less severe than a material weakness in internal control over compliance, yet important enough to merit attention by those charged with governance. Our consideration of internal control over compliance was for the limited purpose described in the first paragraph of this section and was not designed to identify all deficiencies in internal control over compliance that might be material weaknesses or significant deficiencies and therefore, material weaknesses or significant deficiencies may exist that were not identified. We did not identify any deficiencies in internal control over compliance that we consider to be material weaknesses. However, we identified certain deficiencies in internal control over compliance, as described in the accompanying schedule of findings and questioned costs as items IC 2016-02, IC 2016-03 and IC 2016-04 that we consider to be significant deficiencies. The City’s response to the internal control over compliance findings identified in our audit is described in the accompanying schedule of findings and questioned costs. The City’s response was not subjected to the auditing procedures applied in the audit of compliance and, accordingly, we express no opinion on the response.
5
The purpose of this report on internal control over compliance is solely to describe the scope of our testing of internal control over compliance and the results of that testing based on the requirements of Uniform Guidance and Chapter 10.550. Accordingly, this report is not suitable for any other purpose. Report on Schedule of Expenditures of Federal Awards and State Financial Assistance Required by the Uniform Guidance and Chapter 10.550, Rules of the Florida Auditor General We have audited the financial statements of the City as of and for the year ended September 30, 2016, and have issued our report thereon dated March 30, 2017, which contained unmodified opinions on those financial statements, and included a reference to other auditors. Our audit was conducted for the purpose of forming opinions on the financial statements that collectively comprise the basic financial statements. The accompanying schedule of expenditures of federal awards and state financial assistance is presented for purposes of additional analysis as required by Uniform Guidance and Chapter 10.550, Rules of the Florida Auditor General, and is not a required part of the financial statements. Such information is the responsibility of management and was derived from and relates directly to the underlying accounting and other records used to prepare the financial statements. The information has been subjected to the auditing procedures applied in the audit of the financial statements and certain additional procedures, including comparing and reconciling such information directly to the underlying accounting and other records used to prepare the financial statements or to the financial statements themselves, and other additional procedures in accordance with auditing standards generally accepted in the United States of America. In our opinion, the schedule of expenditure of federal awards and state financial assistance is fairly stated in all material respects in relation to the basic financial statements as a whole.
Miami, Florida April 28, 2017, except for the Schedule of Expenditures of Federal Awards and State Financial Assistance for which the date is March 30, 2017
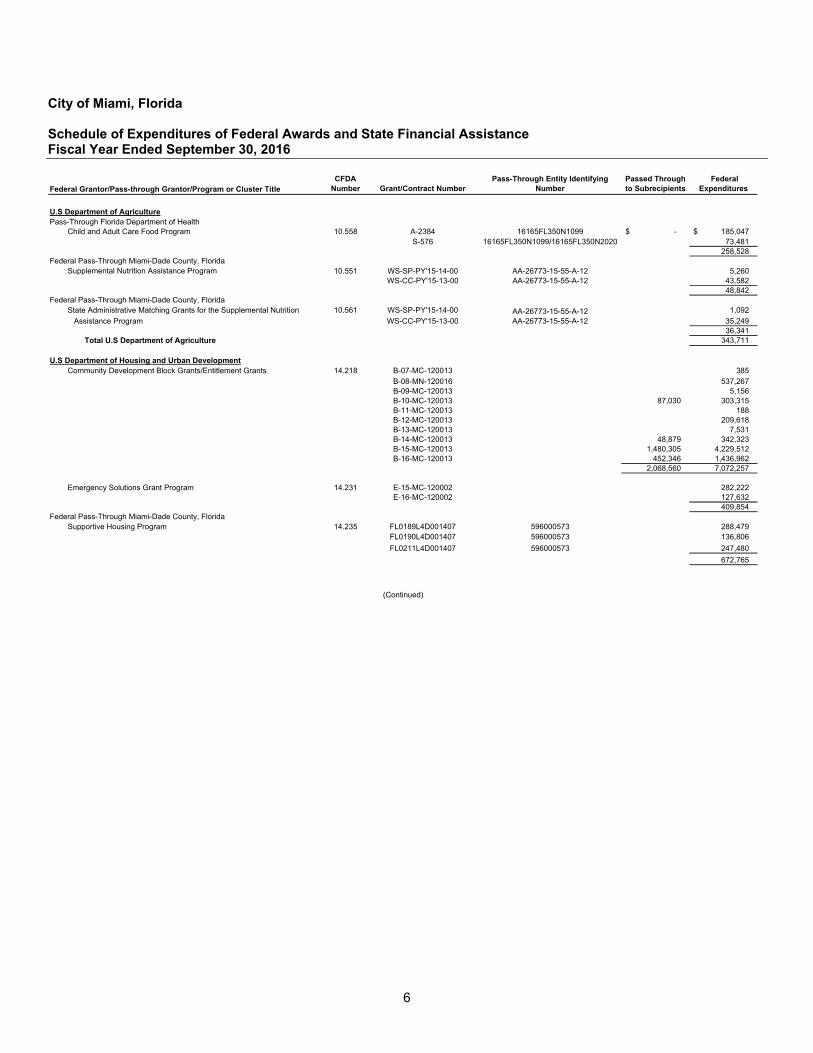
City of Miami, Florida Schedule of Expenditures of Federal Awards and State Financial Assistance Fiscal Year Ended September 30, 2016
6
CFDA Number Grant/Contract Number
Pass-Through Entity Identifying Number
Passed Through to Subrecipients
Federal Expenditures
U.S Department of AgriculturePass-Through Florida Department of Health
Child and Adult Care Food Program 10.558 A-2384 16165FL350N1099 -$ 185,047 $ S-576 16165FL350N1099/16165FL350N2020 73,481
258,528 Federal Pass-Through Miami-Dade County, Florida
Supplemental Nutrition Assistance Program 10.551 WS-SP-PY'15-14-00 AA-26773-15-55-A-12 5,260 WS-CC-PY'15-13-00 AA-26773-15-55-A-12 43,582
48,842 Federal Pass-Through Miami-Dade County, Florida
State Administrative Matching Grants for the Supplemental Nutrition 10.561 WS-SP-PY'15-14-00 AA-26773-15-55-A-12 1,092 Assistance Program WS-CC-PY'15-13-00 AA-26773-15-55-A-12 35,249
36,341 Total U.S Department of Agriculture 343,711
U.S Department of Housing and Urban DevelopmentCommunity Development Block Grants/Entitlement Grants 14.218 B-07-MC-120013 385
B-08-MN-120016 537,267 B-09-MC-120013 5,156 B-10-MC-120013 87,030 303,315 B-11-MC-120013 188 B-12-MC-120013 209,618 B-13-MC-120013 7,531 B-14-MC-120013 48,879 342,323 B-15-MC-120013 1,480,305 4,229,512 B-16-MC-120013 452,346 1,436,962
2,068,560 7,072,257
Emergency Solutions Grant Program 14.231 E-15-MC-120002 282,222 E-16-MC-120002 127,632
409,854 Federal Pass-Through Miami-Dade County, Florida
Supportive Housing Program 14.235 FL0189L4D001407 596000573 288,479 FL0190L4D001407 596000573 136,806 FL0211L4D001407 596000573 247,480
672,765
Federal Grantor/Pass-through Grantor/Program or Cluster Title
(Continued)
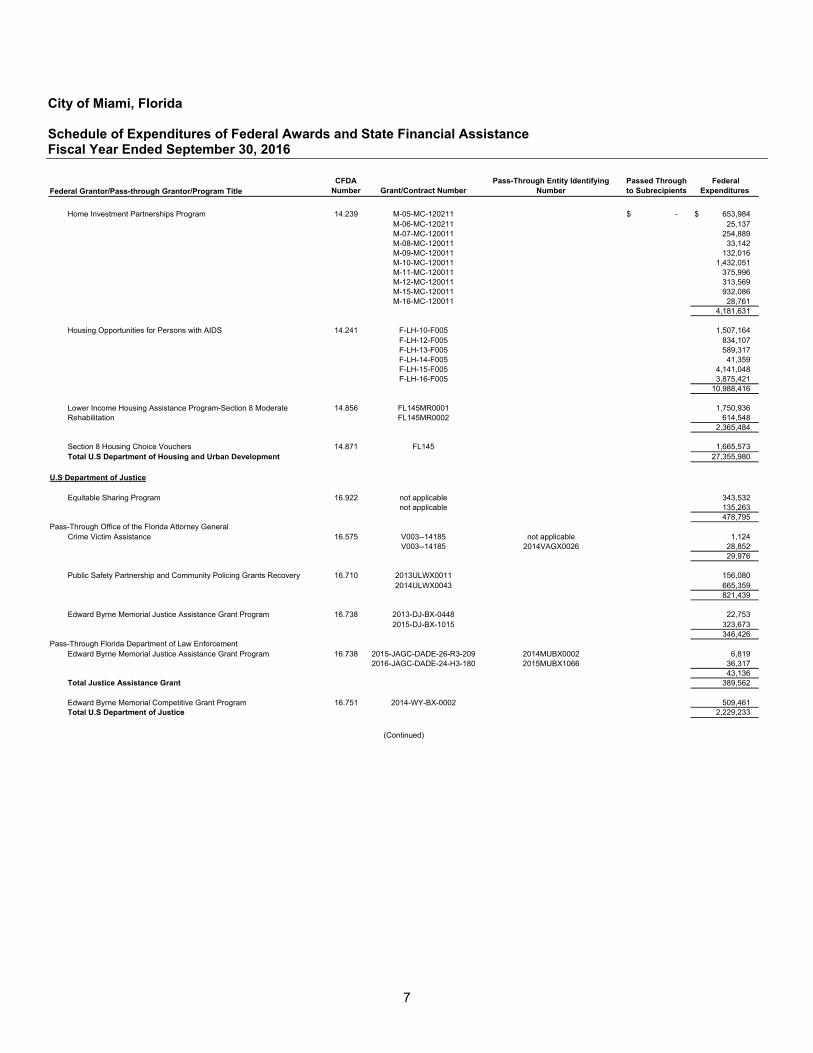
City of Miami, Florida Schedule of Expenditures of Federal Awards and State Financial Assistance Fiscal Year Ended September 30, 2016
7
CFDA Number Grant/Contract Number
Pass-Through Entity Identifying Number
Passed Through to Subrecipients
Federal Expenditures
Home Investment Partnerships Program 14.239 M-05-MC-120211 -$ 653,984 $ M-06-MC-120211 25,137 M-07-MC-120011 254,889 M-08-MC-120011 33,142 M-09-MC-120011 132,016 M-10-MC-120011 1,432,051 M-11-MC-120011 375,996 M-12-MC-120011 313,569 M-15-MC-120011 932,086 M-16-MC-120011 28,761
4,181,631
Housing Opportunities for Persons with AIDS 14.241 F-LH-10-F005 1,507,164 F-LH-12-F005 834,107 F-LH-13-F005 589,317 F-LH-14-F005 41,359 F-LH-15-F005 4,141,048 F-LH-16-F005 3,875,421
10,988,416
Lower Income Housing Assistance Program-Section 8 Moderate 14.856 FL145MR0001 1,750,936 Rehabilitation FL145MR0002 614,548
2,365,484
Section 8 Housing Choice Vouchers 14.871 FL145 1,665,573 Total U.S Department of Housing and Urban Development 27,355,980
U.S Department of Justice
Equitable Sharing Program 16.922 not applicable 343,532 not applicable 135,263
478,795 Pass-Through Office of the Florida Attorney General
Crime Victim Assistance 16.575 V003--14185 not applicable 1,124 V003--14185 2014VAGX0026 28,852
29,976
Public Safety Partnership and Community Policing Grants Recovery 16.710 2013ULWX0011 156,080 2014ULWX0043 665,359
821,439
Edward Byrne Memorial Justice Assistance Grant Program 16.738 2013-DJ-BX-0448 22,753 2015-DJ-BX-1015 323,673
346,426 Pass-Through Florida Department of Law Enforcement
Edward Byrne Memorial Justice Assistance Grant Program 16.738 2015-JAGC-DADE-26-R3-209 2014MUBX0002 6,819 2016-JAGC-DADE-24-H3-180 2015MUBX1066 36,317
43,136 Total Justice Assistance Grant 389,562
Edward Byrne Memorial Competitive Grant Program 16.751 2014-WY-BX-0002 509,461 Total U.S Department of Justice 2,229,233
Federal Grantor/Pass-through Grantor/Program Title
(Continued)
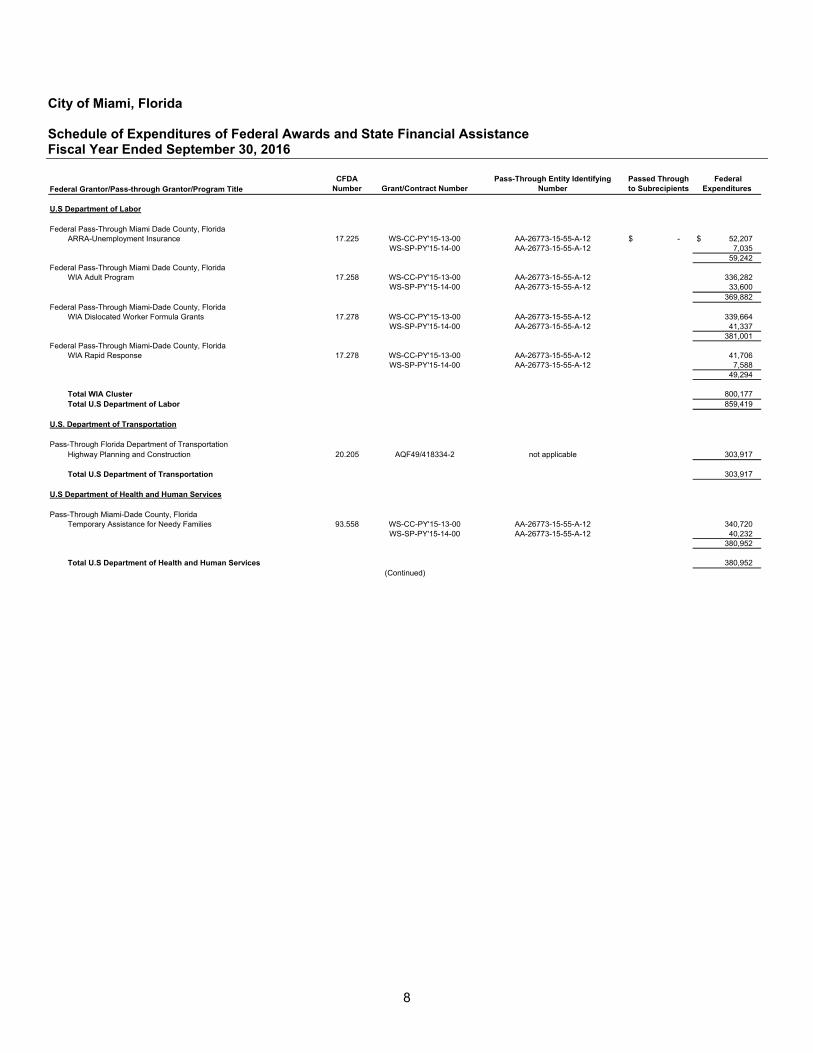
City of Miami, Florida Schedule of Expenditures of Federal Awards and State Financial Assistance Fiscal Year Ended September 30, 2016
8
CFDA Number Grant/Contract Number
Pass-Through Entity Identifying Number
Passed Through to Subrecipients
Federal Expenditures
U.S Department of Labor
Federal Pass-Through Miami Dade County, FloridaARRA-Unemployment Insurance 17.225 WS-CC-PY'15-13-00 AA-26773-15-55-A-12 -$ 52,207 $
WS-SP-PY'15-14-00 AA-26773-15-55-A-12 7,035 59,242
Federal Pass-Through Miami Dade County, FloridaWIA Adult Program 17.258 WS-CC-PY'15-13-00 AA-26773-15-55-A-12 336,282
WS-SP-PY'15-14-00 AA-26773-15-55-A-12 33,600 369,882
Federal Pass-Through Miami-Dade County, FloridaWIA Dislocated Worker Formula Grants 17.278 WS-CC-PY'15-13-00 AA-26773-15-55-A-12 339,664
WS-SP-PY'15-14-00 AA-26773-15-55-A-12 41,337 381,001
Federal Pass-Through Miami-Dade County, FloridaWIA Rapid Response 17.278 WS-CC-PY'15-13-00 AA-26773-15-55-A-12 41,706
WS-SP-PY'15-14-00 AA-26773-15-55-A-12 7,588 49,294
Total WIA Cluster 800,177 Total U.S Department of Labor 859,419
U.S. Department of Transportation
Pass-Through Florida Department of Transportation Highway Planning and Construction 20.205 AQF49/418334-2 not applicable 303,917
Total U.S Department of Transportation 303,917
U.S Department of Health and Human Services
Pass-Through Miami-Dade County, Florida Temporary Assistance for Needy Families 93.558 WS-CC-PY'15-13-00 AA-26773-15-55-A-12 340,720
WS-SP-PY'15-14-00 AA-26773-15-55-A-12 40,232 380,952
Total U.S Department of Health and Human Services 380,952
Federal Grantor/Pass-through Grantor/Program Title
(Continued)
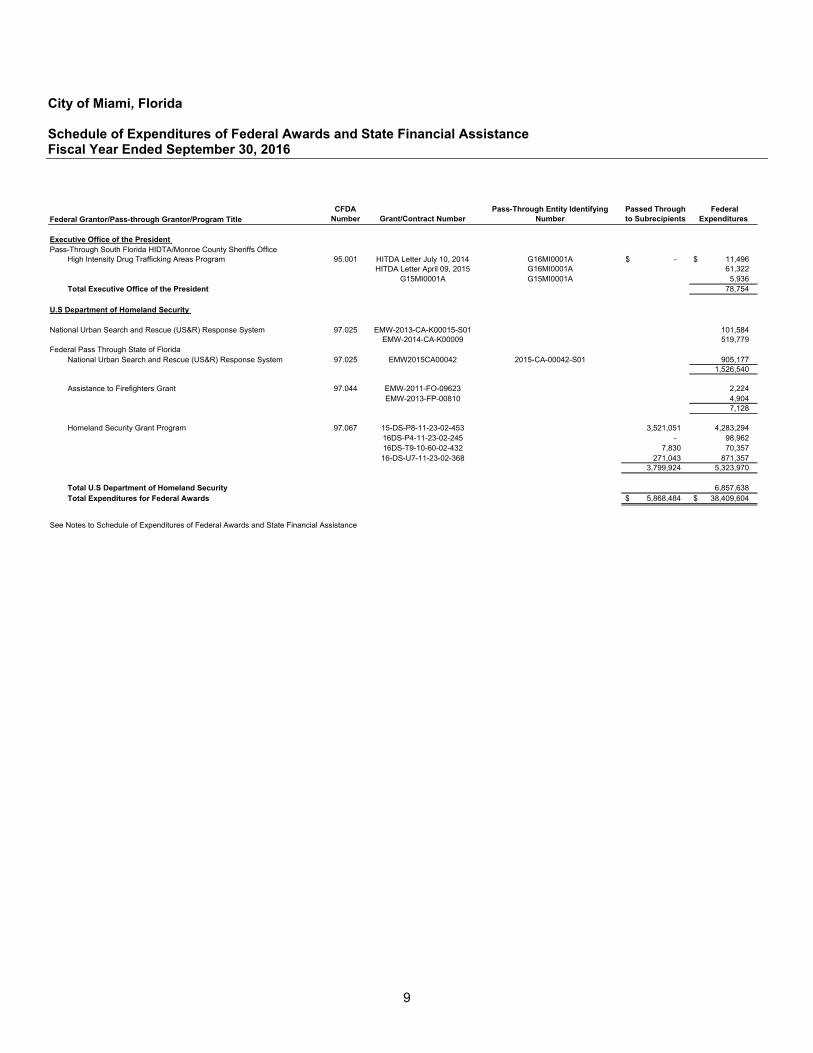
City of Miami, Florida Schedule of Expenditures of Federal Awards and State Financial Assistance Fiscal Year Ended September 30, 2016
9
CFDA
Number Grant/Contract Number Pass-Through Entity Identifying
NumberPassed Through to Subrecipients
Federal Expenditures
Executive Office of the President Pass-Through South Florida HIDTA/Monroe County Sheriffs Office
High Intensity Drug Trafficking Areas Program 95.001 HITDA Letter July 10, 2014 G16MI0001A -$ 11,496 $ HITDA Letter April 09, 2015 G16MI0001A 61,322
G15MI0001A G15MI0001A 5,936 Total Executive Office of the President 78,754
U.S Department of Homeland Security
National Urban Search and Rescue (US&R) Response System 97.025 EMW-2013-CA-K00015-S01 101,584 EMW-2014-CA-K00009 519,779
Federal Pass Through State of Florida National Urban Search and Rescue (US&R) Response System 97.025 EMW2015CA00042 2015-CA-00042-S01 905,177
1,526,540
Assistance to Firefighters Grant 97.044 EMW-2011-FO-09623 2,224 EMW-2013-FP-00810 4,904
7,128
Homeland Security Grant Program 97.067 15-DS-P8-11-23-02-453 3,521,051 4,283,294 16DS-P4-11-23-02-245 - 98,962 16DS-T9-10-60-02-432 7,830 70,357 16-DS-U7-11-23-02-368 271,043 871,357
3,799,924 5,323,970
Total U.S Department of Homeland Security 6,857,638 Total Expenditures for Federal Awards 5,868,484 $ 38,409,604 $
See Notes to Schedule of Expenditures of Federal Awards and State Financial Assistance
Federal Grantor/Pass-through Grantor/Program Title
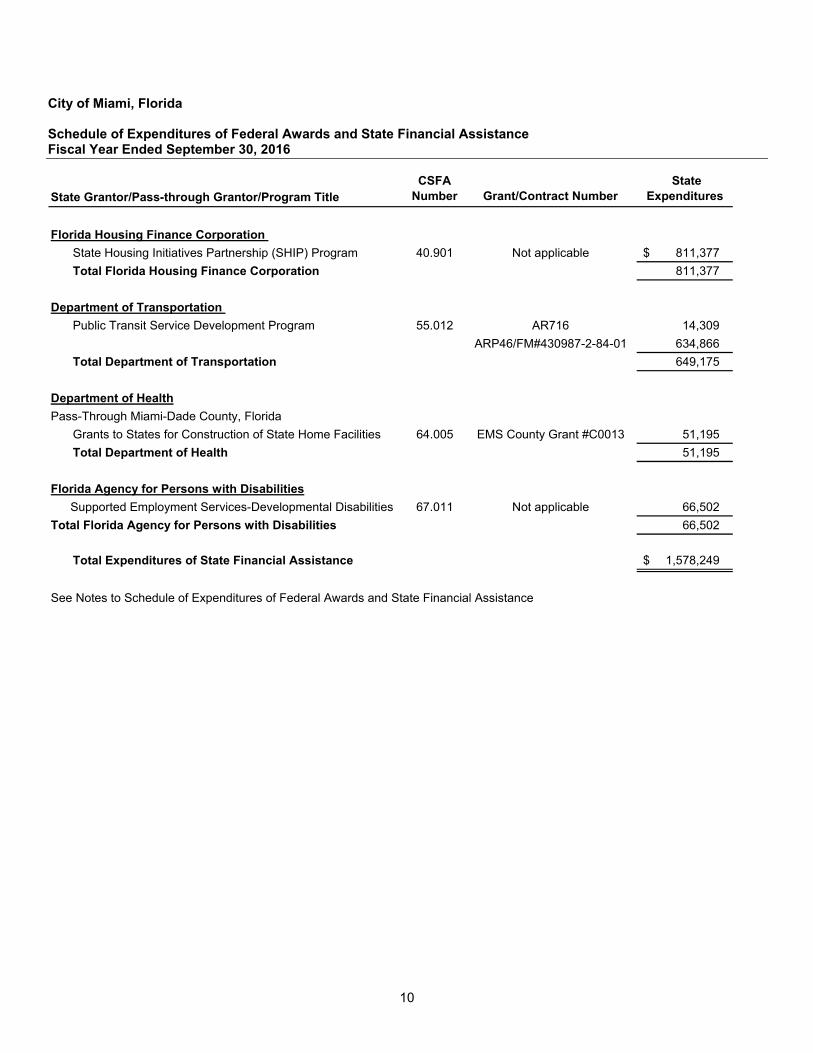
City of Miami, Florida Schedule of Expenditures of Federal Awards and State Financial Assistance Fiscal Year Ended September 30, 2016
10
CSFA Number Grant/Contract Number
State Expenditures
Florida Housing Finance Corporation State Housing Initiatives Partnership (SHIP) Program 40.901 Not applicable 811,377 $ Total Florida Housing Finance Corporation 811,377
Department of Transportation Public Transit Service Development Program 55.012 AR716 14,309
ARP46/FM#430987-2-84-01 634,866 Total Department of Transportation 649,175
Department of HealthPass-Through Miami-Dade County, Florida
Grants to States for Construction of State Home Facilities 64.005 EMS County Grant #C0013 51,195 Total Department of Health 51,195
Florida Agency for Persons with DisabilitiesSupported Employment Services-Developmental Disabilities 67.011 Not applicable 66,502
Total Florida Agency for Persons with Disabilities 66,502
Total Expenditures of State Financial Assistance 1,578,249 $
See Notes to Schedule of Expenditures of Federal Awards and State Financial Assistance
State Grantor/Pass-through Grantor/Program Title
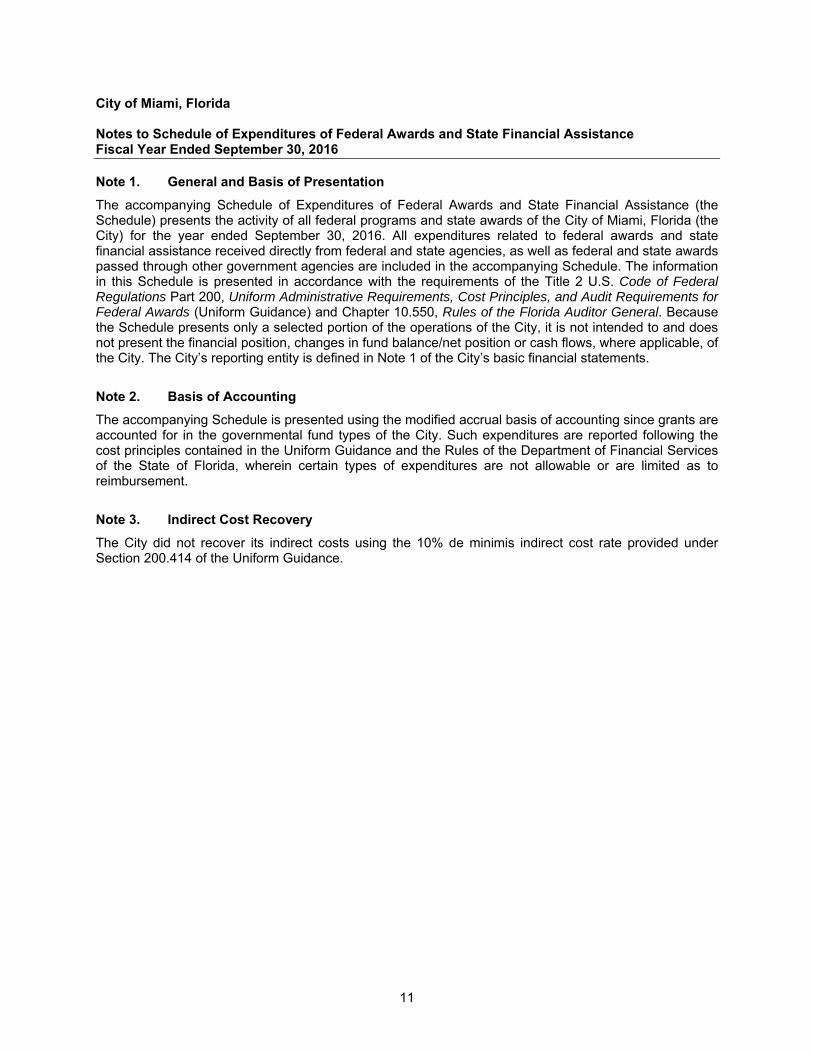
City of Miami, Florida Notes to Schedule of Expenditures of Federal Awards and State Financial Assistance Fiscal Year Ended September 30, 2016
11
Note 1. General and Basis of Presentation The accompanying Schedule of Expenditures of Federal Awards and State Financial Assistance (the Schedule) presents the activity of all federal programs and state awards of the City of Miami, Florida (the City) for the year ended September 30, 2016. All expenditures related to federal awards and state financial assistance received directly from federal and state agencies, as well as federal and state awards passed through other government agencies are included in the accompanying Schedule. The information in this Schedule is presented in accordance with the requirements of the Title 2 U.S. Code of Federal Regulations Part 200, Uniform Administrative Requirements, Cost Principles, and Audit Requirements for Federal Awards (Uniform Guidance) and Chapter 10.550, Rules of the Florida Auditor General. Because the Schedule presents only a selected portion of the operations of the City, it is not intended to and does not present the financial position, changes in fund balance/net position or cash flows, where applicable, of the City. The City’s reporting entity is defined in Note 1 of the City’s basic financial statements.
Note 2. Basis of Accounting The accompanying Schedule is presented using the modified accrual basis of accounting since grants are accounted for in the governmental fund types of the City. Such expenditures are reported following the cost principles contained in the Uniform Guidance and the Rules of the Department of Financial Services of the State of Florida, wherein certain types of expenditures are not allowable or are limited as to reimbursement.
Note 3. Indirect Cost Recovery The City did not recover its indirect costs using the 10% de minimis indirect cost rate provided under Section 200.414 of the Uniform Guidance.
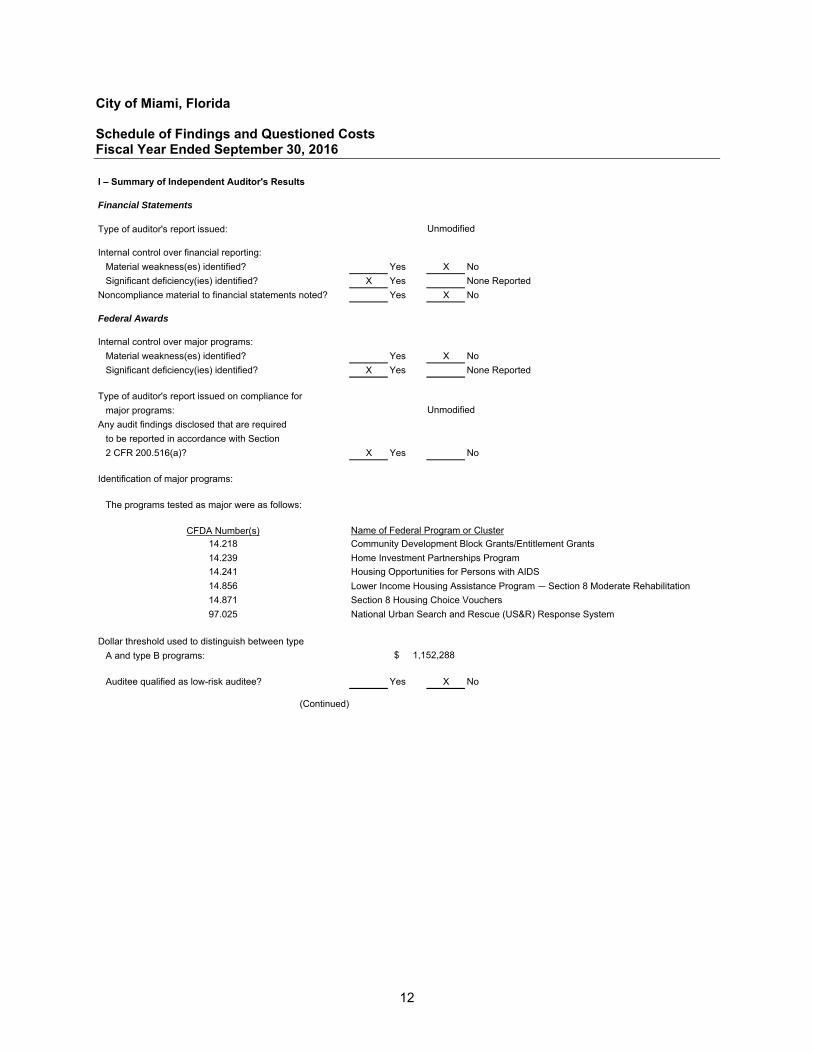
City of Miami, Florida Schedule of Findings and Questioned Costs Fiscal Year Ended September 30, 2016
12
I – Summary of Independent Auditor's Results
Financial Statements
Type of auditor's report issued:
Internal control over financial reporting:Material weakness(es) identified? Yes X NoSignificant deficiency(ies) identified? X Yes None Reported
Noncompliance material to financial statements noted? Yes X No
Federal Awards
Internal control over major programs:Material weakness(es) identified? Yes X NoSignificant deficiency(ies) identified? X Yes None Reported
Type of auditor's report issued on compliance formajor programs:
Any audit findings disclosed that are requiredto be reported in accordance with Section2 CFR 200.516(a)? X Yes No
Identification of major programs:
The programs tested as major were as follows:
CFDA Number(s)14.218 Community Development Block Grants/Entitlement Grants14.239 Home Investment Partnerships Program14.241 Housing Opportunities for Persons with AIDS14.856 Lower Income Housing Assistance Program — Section 8 Moderate Rehabilitation14.871 Section 8 Housing Choice Vouchers97.025 National Urban Search and Rescue (US&R) Response System
Dollar threshold used to distinguish between type A and type B programs:
Auditee qualified as low-risk auditee? Yes X No
Unmodified
Unmodified
Name of Federal Program or Cluster
1,152,288 $
(Continued)
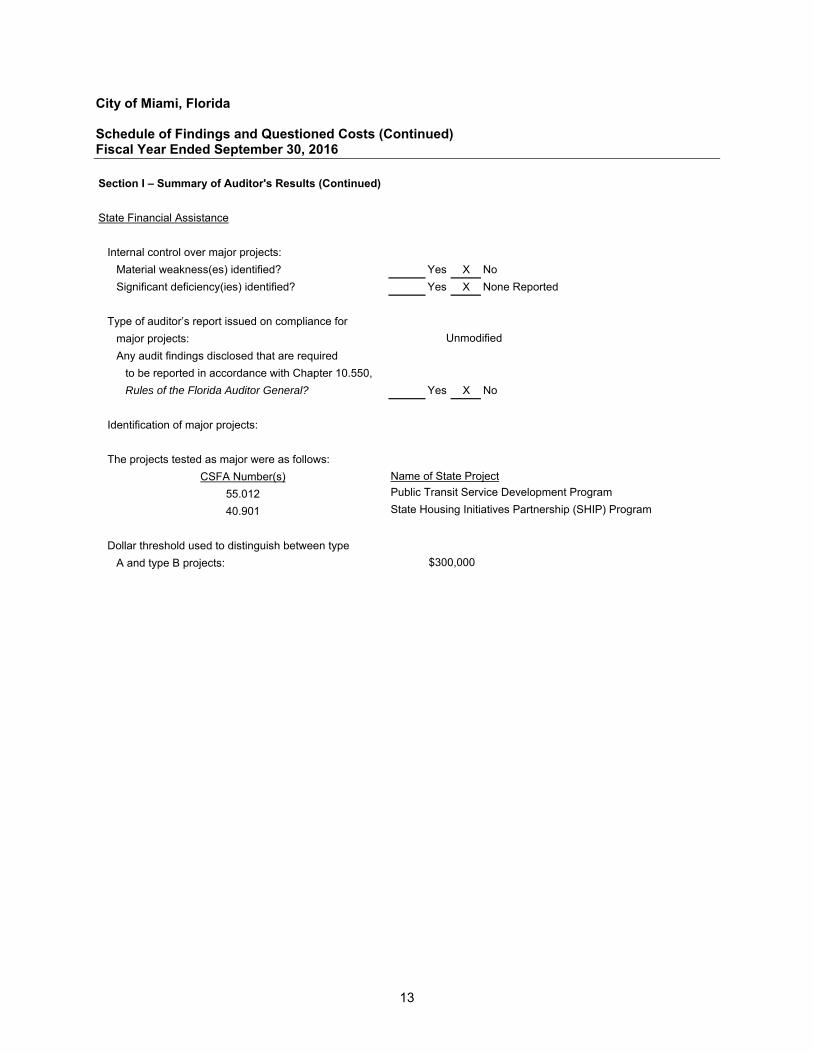
City of Miami, Florida Schedule of Findings and Questioned Costs (Continued) Fiscal Year Ended September 30, 2016
13
Section I – Summary of Auditor's Results (Continued)
State Financial Assistance
Internal control over major projects:Material weakness(es) identified? Yes X NoSignificant deficiency(ies) identified? Yes X None Reported
Type of auditor’s report issued on compliance formajor projects:Any audit findings disclosed that are required
to be reported in accordance with Chapter 10.550,Rules of the Florida Auditor General? Yes X No
Identification of major projects:
The projects tested as major were as follows:CSFA Number(s)
55.012 Public Transit Service Development Program
40.901 State Housing Initiatives Partnership (SHIP) Program
Dollar threshold used to distinguish between type A and type B projects: $300,000
Unmodified
Name of State Project

City of Miami, Florida Schedule of Findings and Questioned Costs (Continued) Fiscal Year Ended September 30, 2016
14
Section II – Financial Statements Findings A. Internal Control
IC 2016-01 – Self Insurance Actuarial Valuation Criteria: An actuarial analysis should include claim experience for all years with open case reserves that are expected to be paid by an organization in future periods when developing an estimate of the year-end self-insurance liability. Condition: We noted that the City’s self-insurance liability actuarial valuation report did not consider claim experience data for policy years from 1985 and prior when developing an estimate of the City’s year end self-insurance liability. Our review of the actual loss runs for this period indicated that significant case reserves were still open for the time period that would be relevant to the actuarial analysis performed for the fiscal year-ended September 30, 2016. Context: The City’s self-insurance liability balance was adjusted to increase the balance by approximately $11.4 million for the fiscal year-ended September 30, 2016, which is approximately 6% of the total liability. Cause: Lack of effective management oversight of the actuary services provided and review of the self-insurance liability actuarial valuation report resulted in the condition noted above. The City’s actuary determined that claim experience data for policy years from 1985 and prior were not relevant to their analysis, even though significant case reserves were still open for such related claims. Effect: The development of the City’s loss experience could result in the miscalculation of the estimated liability. Recommendation: We recommend that management personnel with requisite knowledge oversee the actuarial services being provided and perform an in-depth review of the self-insurance liability actuarial valuation report. We further believe that it is prudent that the actuary incorporates all relevant claims and loss experience, which should encompass the historical period that represent the life cycle of the initiation of the claims and their corresponding settlements. Views of Responsible Official and Planned Corrective Actions: The City concurs with the auditor recommendation. The administration will insist that on all future actuarial services that all data available be used in preparation of future actuarial reports. B. Compliance
None reported.
City of Miami, Florida Schedule of Findings and Questioned Costs (Continued) Fiscal Year Ended September 30, 2016
15
Section III – Federal Awards Findings and Questioned Costs
A. Internal Control over Compliance IC 2016 – 02 Reporting U.S. Department of Housing and Urban Development
Section 8 Moderate Rehabilitation CFDA No. 14.856
Section 8 Housing Choice Vouchers CFDA No. 14.871
Criteria: The Uniform Financial Reporting Standards (24 CFR section 5.801) require that grantees submit Generally Accepted Accounting Principle based (GAAP-based) unaudited and audited financial information electronically to HUD on the Financial Assessment Sub-system, FASS-PH. Condition: We noted that GAAP-based audited financial information was not electronically submitted to HUD on the Financial Assessment Sub-system (FASS-PH), as required by program guidelines. Context: See “Condition” above. Questioned Costs: Not applicable. Cause: Lack of effective administrative oversight of the program. The City’s September 30, 2016 audited financial statements could not be submitted to the grantor to meet the reporting requirements of the program, since program guidelines require GAAP-based audited reports be completed on a March 31st period end basis. Management has determined that it is not cost effective for the City to obtain audited financial statements for the period ended March 31, 2016, in order to comply with the program’s reporting requirements. Effect: Failure to comply with program reporting requirements may result in a disallowance of program expenditures and/or loss of future grant funding. Recommendation: We recommend that management communicate the reporting limitations of the City to the grantor, as it relates to the City’s fiscal year, and further discuss alternative reporting options that may be available, to comply with the program’s reporting guidelines going forward. Views of Responsible Official and Planned Corrective Actions: The City’s September 30, 2016 audited financial statements could not be submitted to the grantor to meet the reporting requirements of the program, since program guidelines require GAAP-based audited reports be completed on a March 31st period end basis. Management determined that it is not cost effective for the City to obtain audited financial statements for the period ended March 31, 2016, in order to comply with the program’s reporting requirements. To comply with the audited financial statement requirements, the City will align the fiscal year of the program with that of the September 30, 20xx fiscal year of the City, in order to comply with 24 CFR section 5.801. Compliance is anticipated for the fiscal year ending September 30, 2017.
City of Miami, Florida Schedule of Findings and Questioned Costs (Continued) Fiscal Year Ended September 30, 2016
16
IC 2016 – 03 Equipment and Real Property Management U.S. Department of Homeland Security Urban Search and Rescue (US&R) CFDA No. 97.025 Criteria: The program Cooperative Agreement requires that equipment inventory records include the FEMA cache number for each item, as it is specifically identified on the current FEMA approved equipment cache list. Condition: We noted that the equipment inventory records maintained by management did not include the FEMA cache number for each item as required by program guidelines. Context: See “Condition’ above. Questioned Costs: Undeterminable. Cause: Lack of effective administrative oversight of the program. The inventory database system was not properly designed to allow for the tracking of all pertinent inventory information as required by program guidelines. Effect: Failure to comply with program equipment and real property management requirements may result in a disallowance of program expenditures and/or loss of future grant funding. Recommendation: We recommend that the City update their equipment inventory database to include the FEMA cache number for each item, as required by program guidelines. Views of Responsible Official: We have contracted a vendor to update and perform the necessary maintenance to our current database that will allow us to perform the necessary steps in-order to assure the equipment cache number, respective PO numbers, and other vital information is loaded onto the item description for each purchase made. This maintenance is scheduled to occur in April 2017.
City of Miami, Florida Schedule of Findings and Questioned Costs (Continued) Fiscal Year Ended September 30, 2016
17
IC 2016 – 04 Procurement and Suspension and Debarment U.S. Department of Homeland Security Urban Search and Rescue (US&R) CFDA No. 97.025 Criteria: Non-federal entities are precluded from contracting with or making sub-awards for covered transactions to parties that are suspended or debarred or whose principals are suspended or debarred. When a non-federal entity enters in a covered transaction with an entity at a lower tier, the non-federal entity must verify that the entity is not suspended or debarred or otherwise excluded. This verification may be accomplished by searching the excluded parties list maintained at sam.gov, collecting a certification from the entity, or adding a clause or condition to the contract for the covered transaction with that entity. Condition: We noted no documentation evidencing that the City complied with the federal requirements for verifying the suspension and debarment of vendors used in the program. The City’s policy requires that vendors be verified on the federal registry, or that management collect a certification from the vendor regarding suspension and debarment, and/or a clause be included in the vendor contract. Context: There was no documentation evidencing that the City complied with the federal requirements for verifying suspension and debarment for three of the four vendors selected for testing. Questioned Costs: Not applicable. Cause: The City’s vendor contract and procurement review controls does not incorporate an assessment of the vendor’s suspension or debarment. Effect: Failure to comply with program procurement and suspension and debarment requirements may result in a disallowance of program expenditures and/or loss of future grant funding. Recommendation: As described in the condition above. A review control should be established whereby a debarment check is completed prior to the execution of a vendor contract and subsequently verified at a minimum on an annual basis. Additionally, documentation evidencing the verification of the suspension and debarment of vendors used in the program should be kept on file to demonstrate compliance. Views of Responsible Official: The City created a Program Directive that assures the purchasing team will check the sam.gov website for each purchase we make with a supplier. The debarment record check will be kept with our justification documents for each purchase.

City of Miami, Florida Schedule of Findings and Questioned Costs (Continued) Fiscal Year Ended September 30, 2016
18
A. Compliance
1. CF 2016 – 01 Reporting U.S. Department of Housing and Urban Development
Section 8 Moderate Rehabilitation CFDA No. 14.856 Section 8 Housing Choice Vouchers CFDA No. 14.871
See Section III – Federal Awards Findings and Questioned Costs IC 2016-02 – Reporting
2. CF 2016 – 02 Equipment and Real Property Management
U.S. Department of Homeland Security Urban Search and Rescue (US&R) CFDA No. 97.025
See Section III – Federal Awards Findings and Questioned Costs IC 2016 – 03 Equipment and Real Property Management
3. CF 2016 – 03 Procurement and Suspension and Debarment
U.S. Department of Homeland Security Urban Search and Rescue (US&R) CFDA No. 97.025
See Section III – Federal Awards Findings and Questioned Costs IC 2016 – 04 Procurement and Suspension and Debarment
Section IV – State Financial Assistance Findings and Questioned Costs
A. Internal Control over Compliance
None reported.
B. Compliance
None reported.
City of Miami, Florida Summary Schedule of Prior Years’ Audit Findings Fiscal Year Ended September 30, 2016
19
Finding No. Finding Title Current Year Status
Federal Awards Findings and Questioned Costs
Internal Control over Compliance Findings
IC 2015-01 Allowable Costs/Cost Principles – CFDA #97.083 Corrected
IC 2015-02 Reporting – CFDA #97.083 Corrected
IC 2015-03 Allowable Costs/Cost Principles – CFDA #14.856 and 14.871 Corrected
IC 2015-04 Special Tests and Provisions – CFDA #14.871 Corrected
IC 2015-05 Reporting – CFDA #14.871 Repeated; See IC 2016-02
IC 2015-06 Reporting – CFDA #14.856 Corrected
IC 2015-07 Eligibility – CFDA #14.241 Corrected
IC 2015-08 Reporting – CFDA #97.044 Corrected
Compliance Findings
CF 2015-01 Allowable Costs/Cost Principles – CFDA #97.083 Corrected
CF 2015-02 Reporting – CFDA #97.083 Corrected
CF 2015-03 Allowable Costs/Cost Principles – CFDA #14.856 and 14.871 Corrected
CF 2015-04 Special Tests and Provisions – CFDA #14.871 Corrected
CF 2015-05 Reporting – CFDA #14.871 Repeated; See IC 2016-02
CF 2015-06 Reporting – CFDA #14.856 Corrected
CF 2015-07 Eligibility – CFDA #14.241 Corrected
CF 2015-08 Reporting – CFDA #97.044 Corrected
City of Miami, Florida Management Letter in Accordance With Chapter 10.550, Rules of the Florida Auditor General and Independent Accountant’s Report on the Examination of the City’s Compliance with Section 218.415, Florida Statutes Fiscal Year Ended September 30, 2016
Contents Management Letter in Accordance with Chapter 10.550 of the Rules of the Florida Auditor General
1-3 Appendix A – Current Year Findings and Recommendations to Improve Financial Management Appendix B – Status of Prior Years’ Findings and Recommendations to Improve Financial Management
4
5-11
Independent Accountant’s Report on the Examination of the City’s Compliance with Section 218.415, Florida Statutes
12
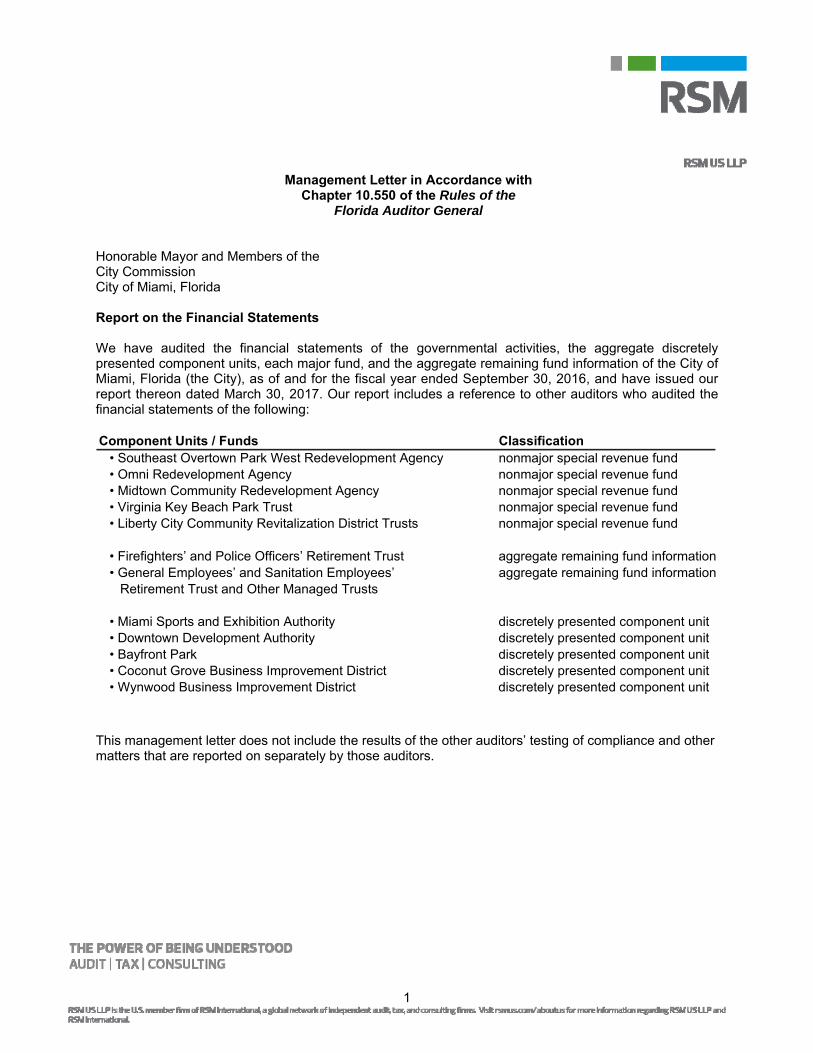
1
Management Letter in Accordance with Chapter 10.550 of the Rules of the
Florida Auditor General Honorable Mayor and Members of the City Commission City of Miami, Florida Report on the Financial Statements We have audited the financial statements of the governmental activities, the aggregate discretely presented component units, each major fund, and the aggregate remaining fund information of the City of Miami, Florida (the City), as of and for the fiscal year ended September 30, 2016, and have issued our report thereon dated March 30, 2017. Our report includes a reference to other auditors who audited the financial statements of the following: Component Units / Funds Classification
• Southeast Overtown Park West Redevelopment Agency nonmajor special revenue fund• Omni Redevelopment Agency nonmajor special revenue fund• Midtown Community Redevelopment Agency nonmajor special revenue fund• Virginia Key Beach Park Trust nonmajor special revenue fund• Liberty City Community Revitalization District Trusts nonmajor special revenue fund
• Firefighters’ and Police Officers’ Retirement Trust aggregate remaining fund information• General Employees’ and Sanitation Employees’ aggregate remaining fund information
Retirement Trust and Other Managed Trusts
• Miami Sports and Exhibition Authority discretely presented component unit• Downtown Development Authority discretely presented component unit• Bayfront Park discretely presented component unit• Coconut Grove Business Improvement District discretely presented component unit• Wynwood Business Improvement District discretely presented component unit
This management letter does not include the results of the other auditors’ testing of compliance and other matters that are reported on separately by those auditors.
2
Auditor’s Responsibility We conducted our audit in accordance with auditing standards generally accepted in the United States of America and the standards applicable to financial audits contained in Government Auditing Standards, issued by the Comptroller General of the United States. Other Reports and Schedule We have issued our Independent Auditor’s Report on Internal Control Over Financial Reporting and Compliance and Other Matters Based on an Audit of Financial Statements Performed in Accordance with Government Auditing Standards; Independent Auditor’s Report on Compliance for Each Major Federal Program and State Project, Report on Internal Control Over Compliance, Report on the Schedule of Expenditures of Federal Awards and State Financial Assistance Required By OMB Uniform Guidance and Chapter 10.550, Rules of the Florida Auditor General; Schedule of Findings and Questioned Costs; and Independent Accountant’s Report on an examination conducted in accordance with attestation standards established by the American Institute of Certified Public Accountants Professional Standards, Section 601, regarding compliance requirements in accordance with Chapter 10.550, Rules of the Auditor General. Disclosures in those reports and schedule should be considered in conjunction with this management letter. Prior Audit Findings Section 10.554(1)(i)1., Rules of the Auditor General, requires that we determine whether or not corrective actions have been taken to address findings and recommendations made in the preceding annual financial audit report. Corrective actions taken to address the findings and recommendations made in the preceding annual financial audit report are disclosed in Appendix B – Status of Prior Years’ Findings and Recommendations to Improve Financial Management. Official Title and Legal Authority Section 10.554(1)(i)4., Rules of the Auditor General, requires that the name or official title and legal authority for the primary government and each component unit of the reporting entity be disclosed in this management letter, unless disclosed in the notes to the financial statements. The information is disclosed in Note 1 to the financial statements. Financial Condition Sections 10.554(1)(i)5.a. and 10.556(7), Rules of the Auditor General, require that we apply appropriate procedures and report the results of our determination as to whether or not the City has met one or more of the conditions described in Section 218.503(1), Florida Statutes, and identification of the specific condition(s) met. In connection with our audit, we determined that the City did not meet any of the conditions described in Section 218.503(1), Florida Statutes. Pursuant to Sections 10.554(1)(i)5.c. and 10.556(8), Rules of the Auditor General, we applied financial condition assessment procedures. It is management's responsibility to monitor the City’s financial condition, and our financial condition assessment was based in part on representations made by management and the review of financial information provided by same.
3
Annual Financial Report Sections 10.554(1)(i)5.b. and 10.556(7), Rules of the Auditor General, require that we apply appropriate procedures and report the results of our determination as to whether the annual financial report for the City for the fiscal year ended September 30, 2016, filed with the Florida Department of Financial Services pursuant to Section 218.32(1)(a), Florida Statutes, is in agreement with the annual financial audit report for the fiscal year ended September 30, 2016. As of the date of this letter the 2016 annual financial report for the City was not filed. Other Matters Section 10.554(1)(i)2., Rules of the Auditor General, requires that we address in the management letter any recommendations to improve financial management. Such recommendations are included in Appendix A – Current Year Findings and Recommendations to Improve Financial Management. Section 10.554(1)(i)3., Rules of the Auditor General, requires that we address noncompliance with provisions of contracts or grant agreements, or abuse, that have occurred, or are likely to have occurred, that have an effect on the financial statements that is less than material but which warrants the attention of those charged with governance. In connection with our audit, we did not have any such findings. Purpose of this Letter Our management letter is intended solely for the information and use of the Legislative Auditing Committee, members of the Florida Senate and the Florida House of Representatives, the Florida Auditor General, Federal and other granting agencies, the Mayor and City Commission, and applicable management, and is not intended to be and should not be used by anyone other than these specified parties.
Miami, Florida March 30, 2017, except for the examination report on the City’s compliance with Section 218.415, Florida Statutes, Local Government Investment Policies, the report on compliance for each major federal program and state project and report on internal control over compliance, for which the date of each report is April 28, 2017
City of Miami, Florida Appendix A – Current Year Findings and Recommendations to Improve Financial Management
4
ML 2016-01 – Financial Integrity Ordinance Criteria: City Ordinance No. 11890 – Financial Integrity Ordinance (the Ordinance) requires that the City individually retain assigned and unassigned fund balance reserves equal to at least ten percent of the average General Fund revenues (excluding transfers) for the prior three fiscal years. Condition: As of September 30, 2016, the current measurement date, the City failed to retain assigned fund balance reserves equal to at least ten percent of the average General Fund revenues for the prior three fiscal years (fiscal years 2013, 2014 and 2015) of $56.5 million, as required by the Ordinance. General Fund assigned and unassigned fund balance reserves as of September 30, 2016 was $21.1 million and $56.5 million, respectively. Cause: Lack of effective planning and budgeting resulted in noncompliance with the Ordinance. Effect: Noncompliance with City Ordinance. Recommendation: September 30th is the measurement date, as per the Ordinance, that is used to assess compliance. Consequently, the City failed the financial test of the Ordinance and management is not able to cure the noncompliance as of fiscal year-end September 30, 2016. Therefore, we recommend that management incorporate the financial requirements of the Ordinance in its budgeting process and monitor actual operating results during each period. Views of Responsible Officials and Planned Corrective Actions: The administration is aggressively exploring ways to improve revenues and reduce expenditures and is working towards a recovery plan to replenish the general fund reserves. The City administration has made significant efforts during FY 2016-17 to project year-end results in order to mitigate the findings in future periods. Additionally, the City administration will work to revise related ordinances to ensure they are in accordance with government financial reporting standards.
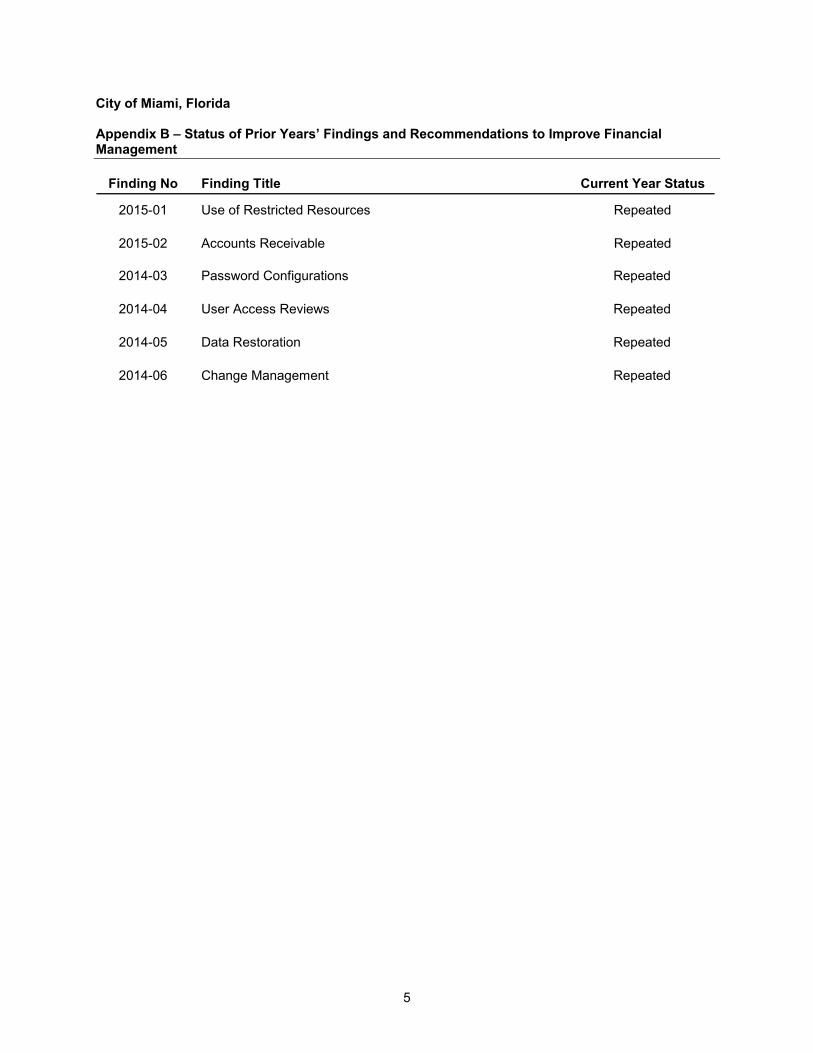
City of Miami, Florida Appendix B – Status of Prior Years’ Findings and Recommendations to Improve Financial Management
5
Finding No Finding Title Current Year Status
2015-01 Use of Restricted Resources Repeated
2015-02 Accounts Receivable Repeated
2014-03 Password Configurations Repeated
2014-04 User Access Reviews Repeated
2014-05 Data Restoration Repeated
2014-06 Change Management Repeated
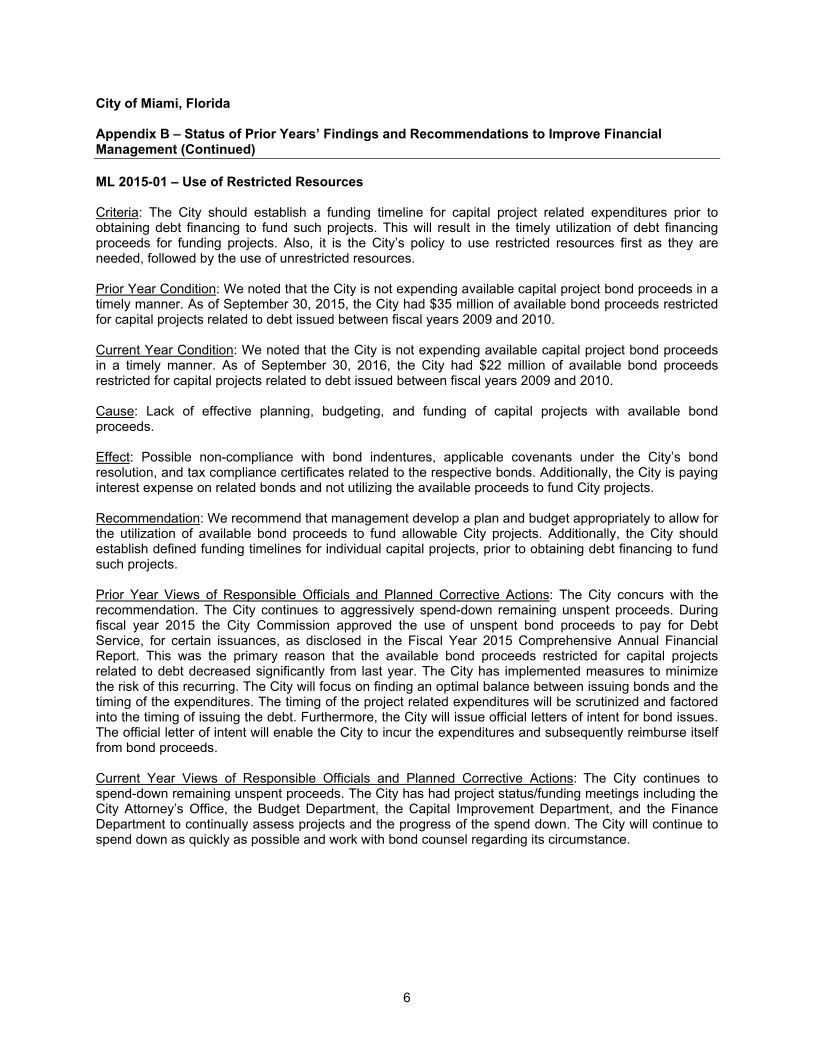
City of Miami, Florida Appendix B – Status of Prior Years’ Findings and Recommendations to Improve Financial Management (Continued)
6
ML 2015-01 – Use of Restricted Resources Criteria: The City should establish a funding timeline for capital project related expenditures prior to obtaining debt financing to fund such projects. This will result in the timely utilization of debt financing proceeds for funding projects. Also, it is the City’s policy to use restricted resources first as they are needed, followed by the use of unrestricted resources. Prior Year Condition: We noted that the City is not expending available capital project bond proceeds in a timely manner. As of September 30, 2015, the City had $35 million of available bond proceeds restricted for capital projects related to debt issued between fiscal years 2009 and 2010. Current Year Condition: We noted that the City is not expending available capital project bond proceeds in a timely manner. As of September 30, 2016, the City had $22 million of available bond proceeds restricted for capital projects related to debt issued between fiscal years 2009 and 2010. Cause: Lack of effective planning, budgeting, and funding of capital projects with available bond proceeds. Effect: Possible non-compliance with bond indentures, applicable covenants under the City’s bond resolution, and tax compliance certificates related to the respective bonds. Additionally, the City is paying interest expense on related bonds and not utilizing the available proceeds to fund City projects. Recommendation: We recommend that management develop a plan and budget appropriately to allow for the utilization of available bond proceeds to fund allowable City projects. Additionally, the City should establish defined funding timelines for individual capital projects, prior to obtaining debt financing to fund such projects. Prior Year Views of Responsible Officials and Planned Corrective Actions: The City concurs with the recommendation. The City continues to aggressively spend-down remaining unspent proceeds. During fiscal year 2015 the City Commission approved the use of unspent bond proceeds to pay for Debt Service, for certain issuances, as disclosed in the Fiscal Year 2015 Comprehensive Annual Financial Report. This was the primary reason that the available bond proceeds restricted for capital projects related to debt decreased significantly from last year. The City has implemented measures to minimize the risk of this recurring. The City will focus on finding an optimal balance between issuing bonds and the timing of the expenditures. The timing of the project related expenditures will be scrutinized and factored into the timing of issuing the debt. Furthermore, the City will issue official letters of intent for bond issues. The official letter of intent will enable the City to incur the expenditures and subsequently reimburse itself from bond proceeds. Current Year Views of Responsible Officials and Planned Corrective Actions: The City continues to spend-down remaining unspent proceeds. The City has had project status/funding meetings including the City Attorney’s Office, the Budget Department, the Capital Improvement Department, and the Finance Department to continually assess projects and the progress of the spend down. The City will continue to spend down as quickly as possible and work with bond counsel regarding its circumstance.

City of Miami, Florida Appendix B – Status of Prior Years’ Findings and Recommendations to Improve Financial Management (Continued)
7
ML 2015-02 – Accounts Receivable Criteria: Allowances for uncollectible receivables should be based upon historical trends and the periodic aging of receivables. Additionally, management should assess the collectability of receivables on a periodic basis and write-off balances not deemed to be collectible at a future date. Prior Year Condition: The City’s allowance for uncollectible receivables was $32.5 million as of September 30, 2015. Management should assess the collectability of the allowed receivable balances and write-off amounts not deemed to be collectible at a future date, after all reasonable collection efforts have been exhausted. Current Year Condition: The City’s allowance for uncollectible receivables was $33.4 million as of September 30, 2016. Management should assess the collectability of the allowed receivable balances and write-off amounts not deemed to be collectible at a future date, after all reasonable collection efforts have been exhausted. Effect: Gross receivable balances reported in the financial statements may not be collectible at a future date. Cause: Management has been assessing the collectability of the outstanding receivable balances over time however, formal action has not been taken to write-off amounts not deemed to be collectible at a future date. Recommendation: We recommend that management assess the collectability of outstanding receivables and take formal action to write-off balances for financial statement reporting purposes, which are not deemed to be collectible at a future date. Prior Year Views of Responsible Officials and Planned Corrective Actions: The City concurs with the recommendation. The City consistently works on collecting outstanding receivables by mailing out letters and sending delinquent accounts to a collection agency. The City also assesses these outstanding receivables periodically. As disclosed in the Fiscal Year 2015 Comprehensive Annual Financial Report, $13.8 million of the $32.5 million of the allowance for uncollectible receivables is related to Parrot Jungle and Gardens of Watson Island Inc. These payments are to begin in 2019. However, the City will establish formal written policies on how and when to write-off balances not deemed to be collectible at a future date. Current Year Views of Responsible Officials and Planned Corrective Actions: The City is drafting legislation to provide for write-offs of accounts that are deemed uncollectible. The City anticipates having the item before the City Commission prior to the 2017 fiscal year end.

City of Miami, Florida Appendix B – Status of Prior Years’ Findings and Recommendations to Improve Financial Management (Continued)
8
ML 2014-03 – Password Configurations Criteria: General Information Technology (IT) controls require that passwords settings be sufficient to prevent the unauthorized access to systems and data. Condition: We noted that password configuration settings for complexity and length do not meet the minimum requirements as stated in the City’s Acceptable Technology Use Policy. Cause: Password configurations have not been setup to meet minimum requirements as stated in the City’s Acceptable Technology Use Policy. Effect: Risks include unauthorized use of systems and disclosure, modification, damage, and/or loss of proprietary information. Recommendation: We recommend that management adjust password length and complexity configuration settings to meet the minimum requirements as stated in the City’s Acceptable Technology Use Policy. Prior Year Views of Responsible Officials and Planned Corrective Actions: A password complexity policy has been submitted and is in the review process. Current Year Views of Responsible Officials and Planned Corrective Actions: Discussions to review the impact of changes in password length and complexity were held as a result of the audit recommendation. Adjustments to password length and complexity were made effective on March 27, 2017.
City of Miami, Florida Appendix B – Status of Prior Years’ Findings and Recommendations to Improve Financial Management (Continued)
9
ML 2014-04 – User Access Reviews Criteria: User access rights to an organization’s relevant financial reporting applications or data should be reviewed periodically by management. Condition: We noted periodic user access reviews are not being performed for the network and Oracle to validate that employee system access rights are appropriate based on the employee’s roles and responsibilities. Cause: The City does not have established policies and procedures in place requiring the review of user access rights on a periodic basis. Effect: Risks include unauthorized use, disclosure of proprietary information, modification, damage, or loss of data. Recommendation: We recommend that management establish formal policies and procedures to allow for the proper administration of user access rights on an ongoing basis. Such policies and procedures should address the proper provisioning, modifying, removing, and periodic review of access rights assigned to employees. Management should determine as part of the user access review that configured access rights are appropriate based on the employee’s roles and responsibilities. This review should indicate who performed the review, when the review was performed, and if any access changes are required. Prior Year Views of Responsible Officials and Planned Corrective Actions: The Oracle enhancement to facilitate the periodic review of Oracle access has been developed. We are working to send the first communication to the stakeholders by the end of June 2016. The Network group is currently evaluating software which will allow for periodic review and reporting of user rights to each department. Current Year Views of Responsible Officials and Planned Corrective Actions: A report to validate user access in the Financial System will be sent to Department Directors by June 30th every year starting in 2017.
City of Miami, Florida Appendix B – Status of Prior Years’ Findings and Recommendations to Improve Financial Management (Continued)
10
ML 2014-05 – Data Restoration Criteria: General information technology (IT) controls require that procedures be in place to allow for the backup and recovery of financial data on an ongoing basis. Condition: We noted that stored data (backup) is not being tested on a periodic basis for Oracle and the network to validate the effectiveness and content of the data backups being performed. Cause: There is no formal policy in place requiring the periodic backup and restoration of data. Effect: Risks include modification, damage, and/or loss of data. The lack of a strategy for cyclical testing of the stored (backup) data exposes the City to operational disruption. Recommendation: We recommend that management establish formal policies and procedures requiring the periodic storage (backup) and restoration of data. Such policy should include the requirement that stored data be tested at least on an annual basis, to validate the effectiveness and content of the data storage (backup) being performed. Prior Year Views of Responsible Officials and Planned Corrective Actions: The Network group is in the process of developing an internal procedure to randomly test restoration of departmental data on a semiannual basis. Current Year Views of Responsible Officials and Planned Corrective Actions: We are creating a daily backup of all financial data and performing a restoration and validation process every quarter. Going forward we will also create backups of the network and perform scheduled restorations and validations as deemed applicable.
City of Miami, Florida Appendix B – Status of Prior Years’ Findings and Recommendations to Improve Financial Management (Continued)
11
ML 2014-06 – Change Management Criteria: General Information Technology (IT) controls should provide reasonable assurance that program changes, application configuration changes, system changes and maintenance (including changes to system software and data structures), production processing changes (including new jobs, schedule changes), and emergency changes are standardized, documented, approved, and subject to formal change management procedures. Condition: We noted that network changes are not being formally documented on a consistent basis as required by the City’s established policies and procedures. Cause: Change management documentation requirements are not consistently being performed by City personnel when changes are being made to the City’s IT systems. Effect: Unauthorized changes may be moved to the production environment without management’s knowledge. Recommendation: We recommend that management adhere to its change management program and policies which requires proper documentation for all changes to the City’s IT systems. Prior Year Views of Responsible Officials and Planned Corrective Actions: There is a Change Advisory Board (CAB) that meets on a weekly basis to approve planned hardware and software major changes to the Network and Enterprise applications. The IT department is in the process of implementing a tool that will allow us to document incidents occurring from unplanned changes. Current Year Views of Responsible Officials and Planned Corrective Actions: As a result of the audit recommendation all changes to production systems are now being submitted to the Change Advisory Board (CAB) for approval. This new policy was implemented at the beginning of fiscal year 2017.
12
Independent Accountant’s Report The Honorable Mayor, Members of the City Commission, and City Manager City of Miami, Florida We have examined the City of Miami, Florida’s (the City) compliance with Section 218.415, Florida Statutes, Local Government Investment Policies during the year ended September 30, 2016. Management is responsible for the City’s compliance with those requirements. Our responsibility is to express an opinion on the City’s compliance based on our examination. Our examination was conducted in accordance with attestation standards established by the American Institute of Certified Public Accountants and, accordingly, included examining, on a test basis, evidence about the City’s compliance with those requirements and performing such other procedures as we considered necessary in the circumstances. We believe that our examination provides a reasonable basis for our opinion. Our examination does not provide a legal determination on the City’s compliance with specified requirements. In our opinion, the City complied, in all material respects, with the aforementioned requirements for the year ended September 30, 2016. This report is intended solely for the information and use of the Florida Auditor General, the Honorable Mayor, Members of the City Commission, the City Manager, and applicable management, and is not intended to be and should not be used by anyone other than these specified parties.
Miami, Florida April 28, 2017