Embed Size (px)
Citation preview
Audiovisual fiction production in the European Union
2019 Edition
Gilles FontaineFebruary 2020
A publication of the European Audiovisual Observatory
• Introduction and methodology• Key findings• Production volume and formats of European audiovisual fiction• Origin of European audiovisual fiction• Coproductions• Commissioners of European fiction• Producers of European fiction• Screenwriters and directors of European audiovisual fiction• Screenwriting and direction of European TV fiction• Annexes
• Sample of fiction screenwriters and directors• List of tables and graphs
Table of Contents
Introduction and methodology
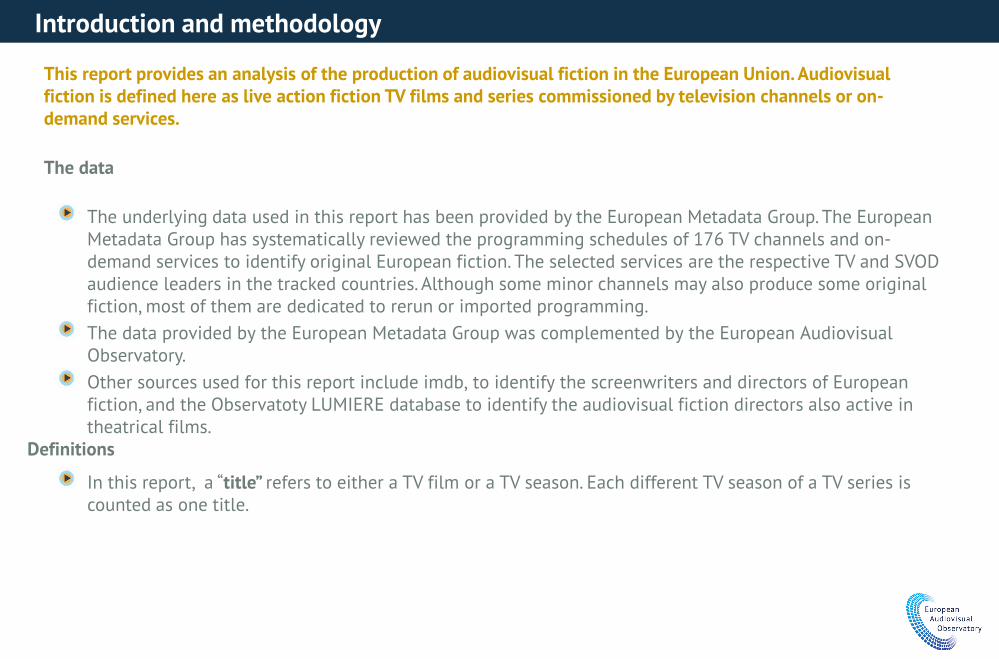
This report provides an analysis of the production of audiovisual fiction in the European Union. Audiovisual fiction is defined here as live action fiction TV films and series commissioned by television channels or on-demand services.
The data
The underlying data used in this report has been provided by the European Metadata Group. The European Metadata Group has systematically reviewed the programming schedules of 176 TV channels and on-demand services to identify original European fiction. The selected services are the respective TV and SVOD audience leaders in the tracked countries. Although some minor channels may also produce some original fiction, most of them are dedicated to rerun or imported programming. The data provided by the European Metadata Group was complemented by the European Audiovisual Observatory.Other sources used for this report include imdb, to identify the screenwriters and directors of European fiction, and the Observatoty LUMIERE database to identify the audiovisual fiction directors also active in theatrical films.
Definitions
In this report, a “title” refers to either a TV film or a TV season. Each different TV season of a TV series is counted as one title.
Introduction and methodology
Titles have been broken down by formats: TV films, 2 to 13 episode series, 14 to 52 episode series and more than 52 episode series. A limited number of TV films have 2 episodes; they are nevertheless considered as TV films. Some TV films belong to collections (e.g. Germany’s “Tatort” or France’s “Meutres à…”) with several episodes produced each year. They are nevertheless counted as TV films, as the plots, casts and production companies change.The year of production of a whole series is the year of release of the first episode of the series.The country of origin of an audiovisual fiction is the country of the main commissioner of the programme. In case of programmes commissioned by a pan-European SVOD service, the country of origin is determined by the production company. International co-productions are analysed following a broad definition (any programme with at least two producing countries) or a stricter definition, excluding “linguistic coproductions” between neighboring countries (DE-AT, FR-BE, FR-CH, GR-CY, BE-NL, DE-CH, CZ-SK, GB-IE, IE-GB).In this report, “independent production” is defined as an AV fiction produced by a production company not under the control of the broadcaster commissioning the programme. This definition does not imply that, the producing company retains any rights. Please note that productions from a broadcaster production unit or subsidiary can therefore be either dependent (when produced for the broadcaster) or independent (when produced for a broadcaster from a different broadcasting group). In this report, “European Union” or “EU28” refers to the 28 member states of the European Union before the withdrawal of the United Kingdom from the EU. The United Kingdom data is included in the report as the reference period is prior to the withdrawal.
Introduction and methodology
Please quote this report as “Audiovisual fiction production in the European Union – Key figures 2018”, European Audiovisual Observatory If you wish to reproduce tables or graphs contained in this publication please contact the European Audiovisual Observatory for prior approval.Opinions expressed in this publication are personal and do not necessarily represent the view of the European Audiovisual Observatory, its members, the Council of Europe or the European Commission.
Key findings
1 000 titles produced each year, 2-13 episode series growingAbout 1 000 titles, 20 000 episodes and 13 500 hours are produced each year in the European Union.Long running daily soaps account for only 9% of titles, but for 61% of hours produced. Conversely, TV films represent 36% of titles, but only 4% of hours. More than half of the titles produced in 2018 were 2-13 episodes per season series.The average duration of an episode of the vast majority of titles produced is higher than 36’. Very short formats (15’ or less) only account for 4% of all titles produced.About 50% of series seasons are returning series.The volume of fiction production has increased since 2016, driven by 2-13 episodes per season series. Conversely, the number of TV films is significantly decreasing.
Germany leads all formats considered, the UK is the first producer of 2-13 episodes seriesThe structure of fiction production varies between the leading countries: long-running soaps are dominant in Spain, Portugal, Poland, Greece and Hungary; Germany and France put a higher than average emphasis on TV films; the United-Kingdom, France, the Netherlands and Italy have a specific interest in 2 to 13 episodes series.Germany is the leading fiction production country in Europe in terms of the number of titles and hours produced. However, the number of titles produced in Germany has decreased, with a switch from TV films to 2-13 episodes.Countries with a strong activity in the production of soaps are among the top 10 producing countries: Portugal, Greece and Hungary.UK is the leading producer of 2-13 episode series, and production is increasing. As it is also in Spain, Poland and Finland.
Key findings
A relatively low but growing number of co-productionsIn 2018, co-productions account for 13% of all fiction production, or for 8% when excluding co-productions between neighboring countries sharing the same language.When excluding co-productions between neighboring countries sharing the same language, the leading co-producing countries are the United Kingdom, Sweden and Germany.The main non-EU minority co-producing countries are the United States, Norway and Canada.
Private services commission 32% of titles and 60% of hoursPrivate services invest comparatively more in long-running soaps.The number of titles commissioned by Public Service Broadcasters has decreased since 2015 but the number of hours commissioned has increased, which could indicate a reallocation of resources from TV films to series.Public Service Broadcasters lead the commissioning of 2-13 episode series.“Pure players” VOD services accounted for about 5% of 2-13 episode series in 2018, up from 1% in 2015
The top 20 producers account for 40% of all titles and 60% of all hours produced in 2018Close to 1000 production companies/groups produced at least 1 fiction title between 2015 and 2018.The top 20 combines broadcasters and their subsidiaries on the one hand, and production groups with no (significant) activity in the broadcasting segment on the other.Independent productions account for the vast majority of titles and hours produced (please refer to the definition of “independent production” in the methodology section).
Key findings
About 8 600 screenwriters and 3 900 directors involved in the production of AV fiction between 2015 and 2018
About half of screenwriters and directors were active only 1 year between 2015 and 2018.Screenwriters and directors tend to be specialized by formats.On average, a screenwriter (co)wrote 7 episodes per year between 2015 and 2018 (but only 2.4 excluding more than 52 episode series).On average, a director (co)directed 7 episodes per year between 2015 and 2018 (but only 1.8 episodes excluding more than 52 episode series).44% of TV films and fiction series directors have also directed a theatrical film.
69% of all episodes released between 2015 and 2018 have been co-writtenThe average number of screenwriters per episode is 4.4, 2.5 when excluding more than 52 episode series, where all screenwriters are often credited for all episodes.Directors are also credited as screenwriters (or one of the screenwriters) for 27% of TV films and 18% of episodes of 2 to 13 episode series.
Key findings
Production volume and formats of European audiovisual fiction
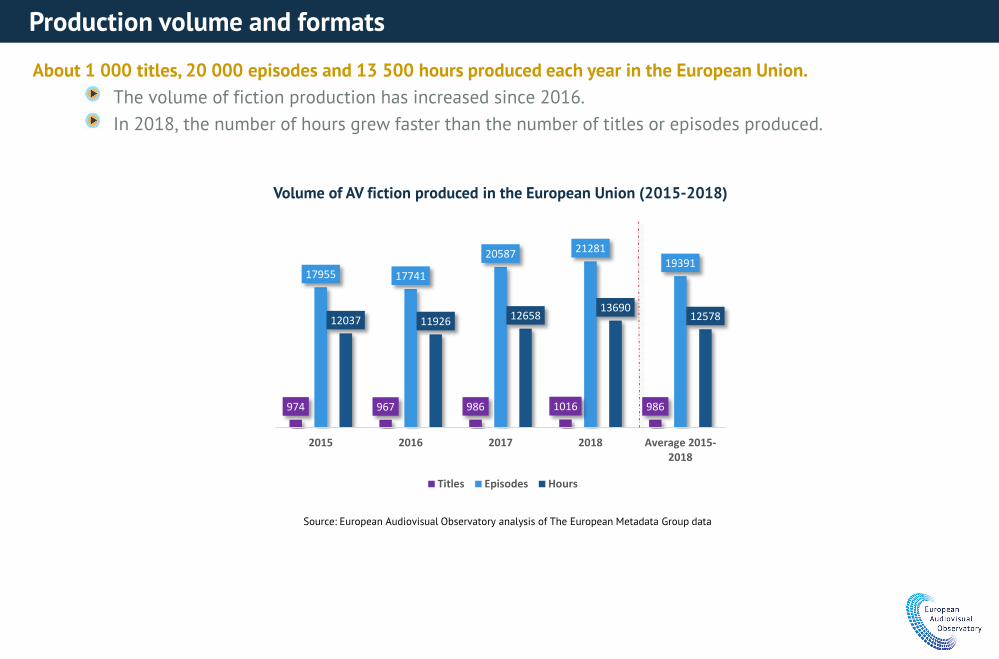
About 1 000 titles, 20 000 episodes and 13 500 hours produced each year in the European Union.The volume of fiction production has increased since 2016.In 2018, the number of hours grew faster than the number of titles or episodes produced.
Production volume and formats
Volume of AV fiction produced in the European Union (2015-2018)
Source: European Audiovisual Observatory analysis of The European Metadata Group data
974 967 986 1016 986
17955 17741
20587 2128119391
12037 11926 1265813690
12578
2015 2016 2017 2018 Average 2015-2018
Titles Episodes Hours
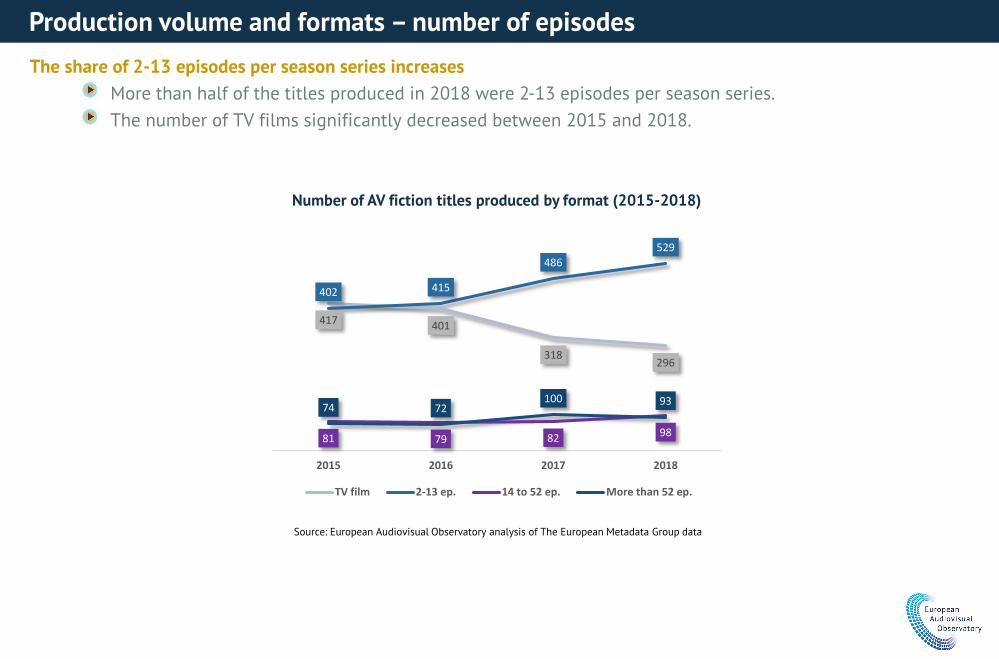
The share of 2-13 episodes per season series increasesMore than half of the titles produced in 2018 were 2-13 episodes per season series.The number of TV films significantly decreased between 2015 and 2018.
Production volume and formats – number of episodes
Number of AV fiction titles produced by format (2015-2018)
Source: European Audiovisual Observatory analysis of The European Metadata Group data
417 401
318296
402 415
486529
81 79 82 98
74 72100 93
2015 2016 2017 2018
TV film 2-13 ep. 14 to 52 ep. More than 52 ep.
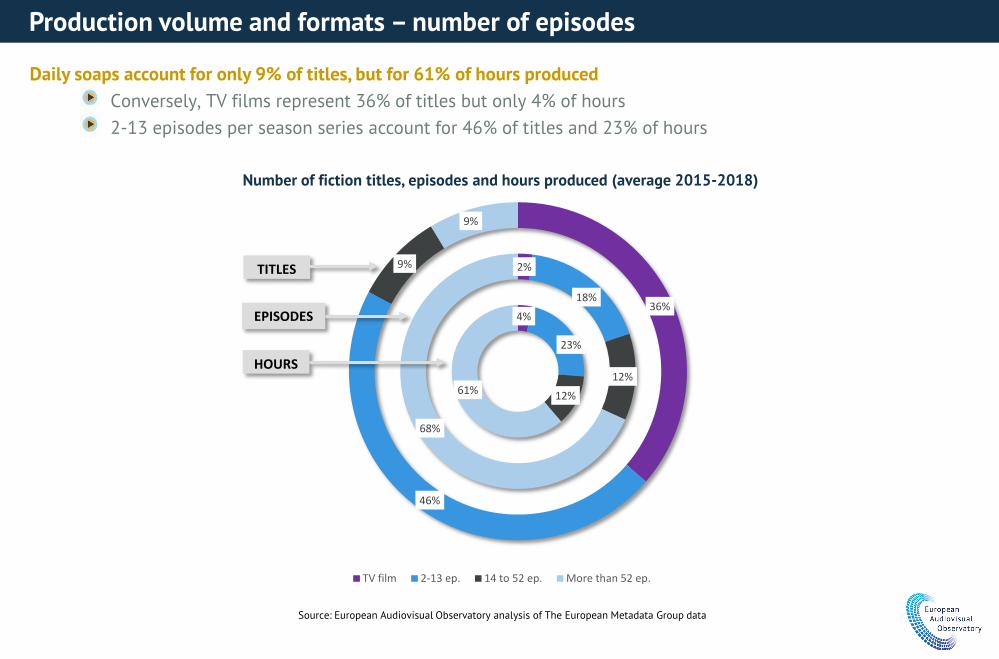
Daily soaps account for only 9% of titles, but for 61% of hours producedConversely, TV films represent 36% of titles but only 4% of hours2-13 episodes per season series account for 46% of titles and 23% of hours
Production volume and formats – number of episodes
Number of fiction titles, episodes and hours produced (average 2015-2018)
Source: European Audiovisual Observatory analysis of The European Metadata Group data
4%
23%
12%61%
2%
18%
12%
68%
36%
46%
9%
9%
TV film 2-13 ep. 14 to 52 ep. More than 52 ep.
TITLES
EPISODES
HOURS
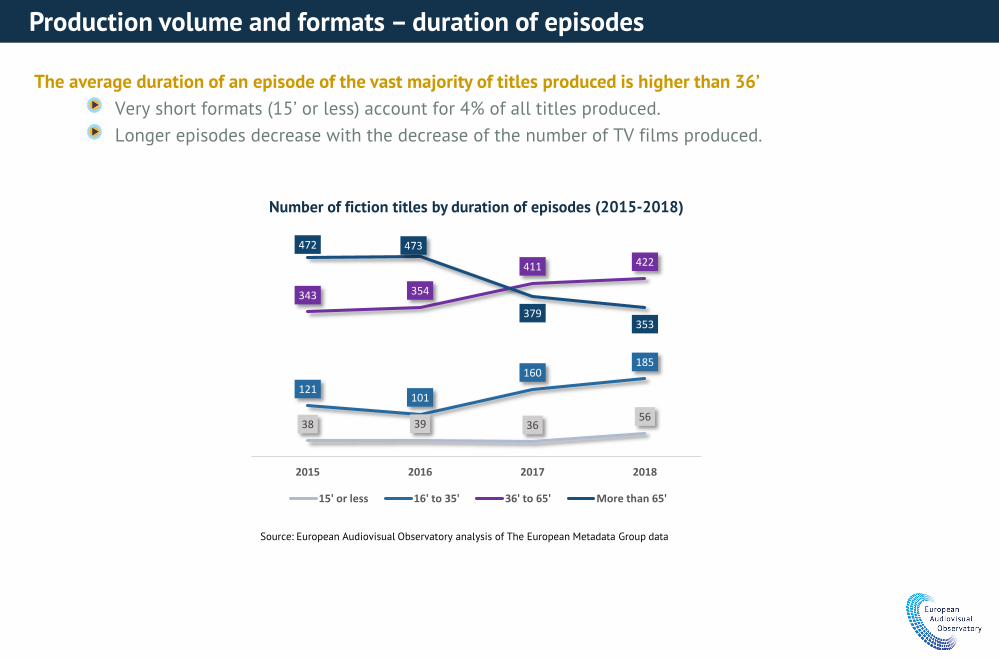
The average duration of an episode of the vast majority of titles produced is higher than 36’Very short formats (15’ or less) account for 4% of all titles produced.Longer episodes decrease with the decrease of the number of TV films produced.
Production volume and formats – duration of episodes
Number of fiction titles by duration of episodes (2015-2018)
Source: European Audiovisual Observatory analysis of The European Metadata Group data
38 39 3656
121101
160185
343 354
411 422472 473
379353
2015 2016 2017 2018
15' or less 16' to 35' 36' to 65' More than 65'
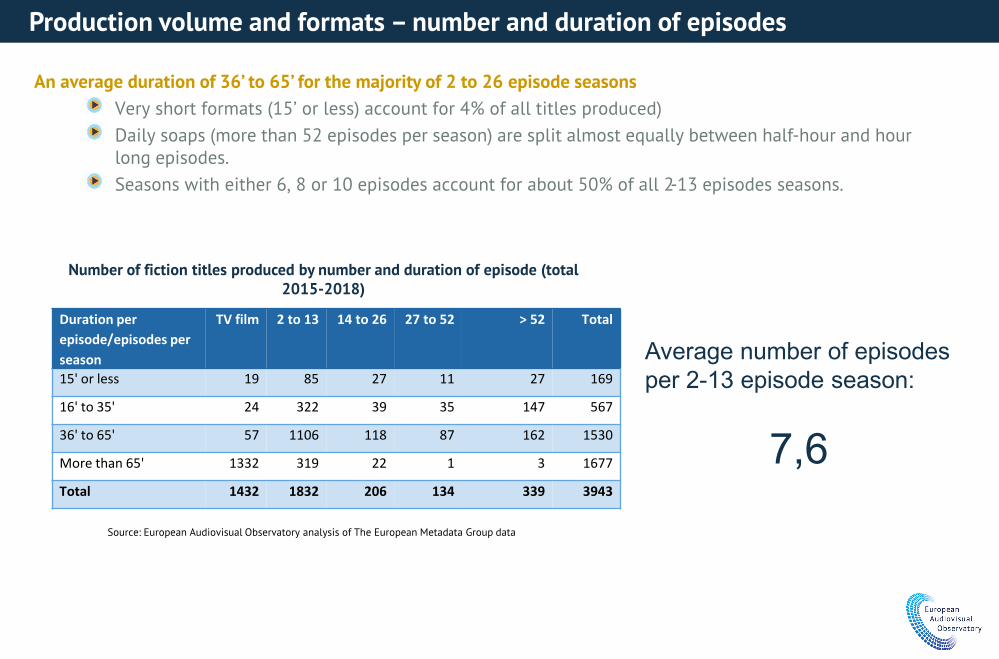
An average duration of 36’ to 65’ for the majority of 2 to 26 episode seasons Very short formats (15’ or less) account for 4% of all titles produced)Daily soaps (more than 52 episodes per season) are split almost equally between half-hour and hour long episodes.Seasons with either 6, 8 or 10 episodes account for about 50% of all 2-13 episodes seasons.
Production volume and formats – number and duration of episodes
Number of fiction titles produced by number and duration of episode (total 2015-2018)
Source: European Audiovisual Observatory analysis of The European Metadata Group data
Average number of episodes per 2-13 episode season:
7,6
Duration per episode/episodes per season
TV film 2 to 13 14 to 26 27 to 52 > 52 Total
15' or less 19 85 27 11 27 169
16' to 35' 24 322 39 35 147 567
36' to 65' 57 1106 118 87 162 1530
More than 65' 1332 319 22 1 3 1677
Total 1432 1832 206 134 339 3943
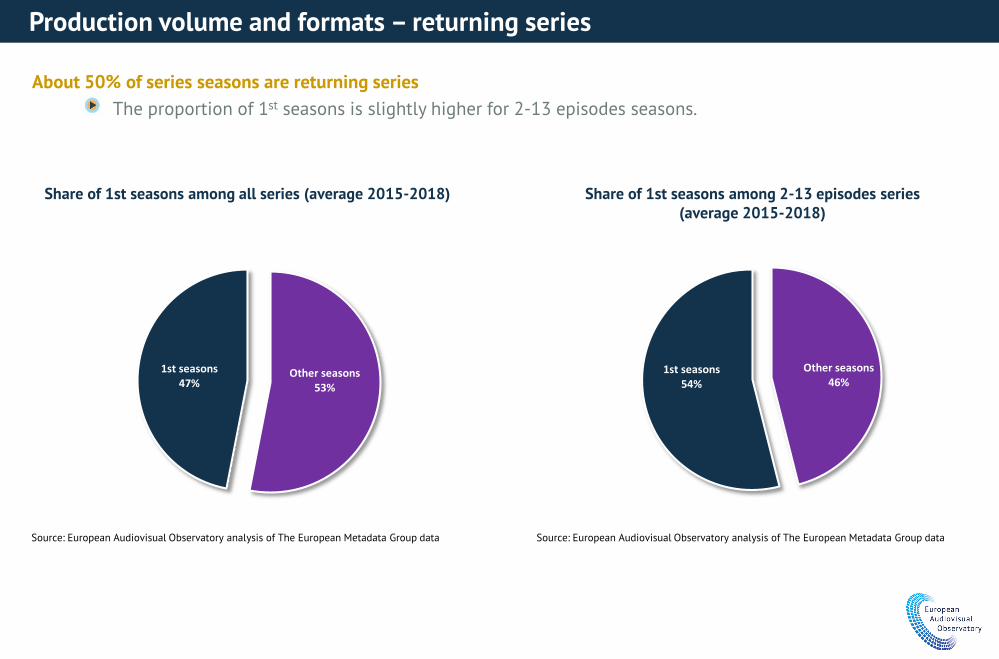
About 50% of series seasons are returning seriesThe proportion of 1st seasons is slightly higher for 2-13 episodes seasons.
Production volume and formats – returning series
Share of 1st seasons among all series (average 2015-2018)
Source: European Audiovisual Observatory analysis of The European Metadata Group data
Other seasons53%
1st seasons47%
Other seasons46%
1st seasons54%
Share of 1st seasons among 2-13 episodes series (average 2015-2018)
Source: European Audiovisual Observatory analysis of The European Metadata Group data
Origin of European audiovisual fiction
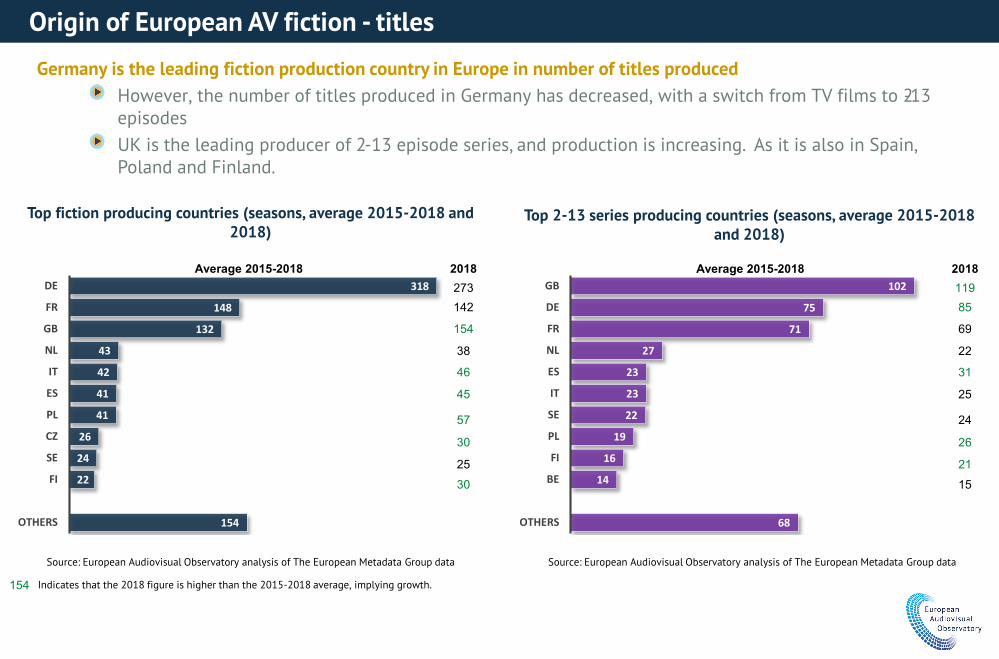
Germany is the leading fiction production country in Europe in number of titles producedHowever, the number of titles produced in Germany has decreased, with a switch from TV films to 2-13 episodesUK is the leading producer of 2-13 episode series, and production is increasing. As it is also in Spain, Poland and Finland.
Origin of European AV fiction - titles
154
22
24
26
41
41
42
43
132
148
318
OTHERS
FI
SE
CZ
PL
ES
IT
NL
GB
FR
DE
Source: European Audiovisual Observatory analysis of The European Metadata Group data
2732018
142
154
38
46
45
57
30
2530
Average 2015-2018
154 Indicates that the 2018 figure is higher than the 2015-2018 average, implying growth.
Top fiction producing countries (seasons, average 2015-2018 and 2018)
Top 2-13 series producing countries (seasons, average 2015-2018 and 2018)
Source: European Audiovisual Observatory analysis of The European Metadata Group data
68
14
16
19
22
23
23
27
71
75
102
OTHERS
BE
FI
PL
SE
IT
ES
NL
FR
DE
GB 1192018
85
69
22
31
25
24
26
2115
Average 2015-2018
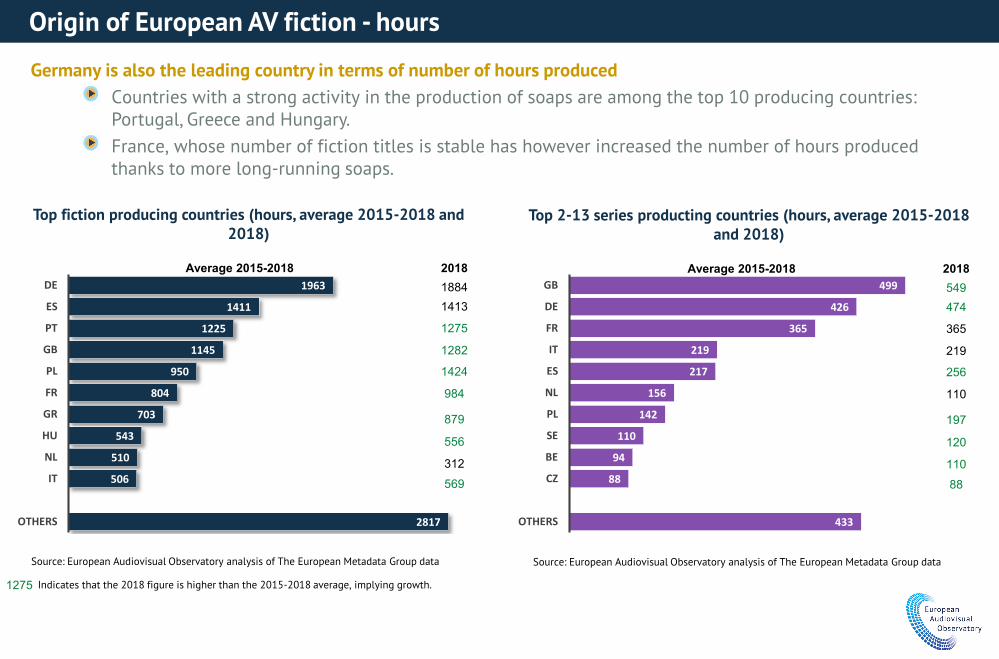
Germany is also the leading country in terms of number of hours producedCountries with a strong activity in the production of soaps are among the top 10 producing countries: Portugal, Greece and Hungary. France, whose number of fiction titles is stable has however increased the number of hours produced thanks to more long-running soaps.
Origin of European AV fiction - hours
Source: European Audiovisual Observatory analysis of The European Metadata Group data
433
88
94
110
142
156
217
219
365
426
499
OTHERS
CZ
BE
SE
PL
NL
ES
IT
FR
DE
GB2018Average 2015-2018549474
365
219
256
110
197
120
11088
Top 2-13 series producting countries (hours, average 2015-2018 and 2018)
2817
506
510
543
703
804
950
1145
1225
1411
1963
OTHERS
IT
NL
HU
GR
FR
PL
GB
PT
ES
DE
Source: European Audiovisual Observatory analysis of The European Metadata Group data
18842018
1413
1275
1282
1424
984
879
556
312569
Average 2015-2018
Top fiction producing countries (hours, average 2015-2018 and 2018)
1275 Indicates that the 2018 figure is higher than the 2015-2018 average, implying growth.
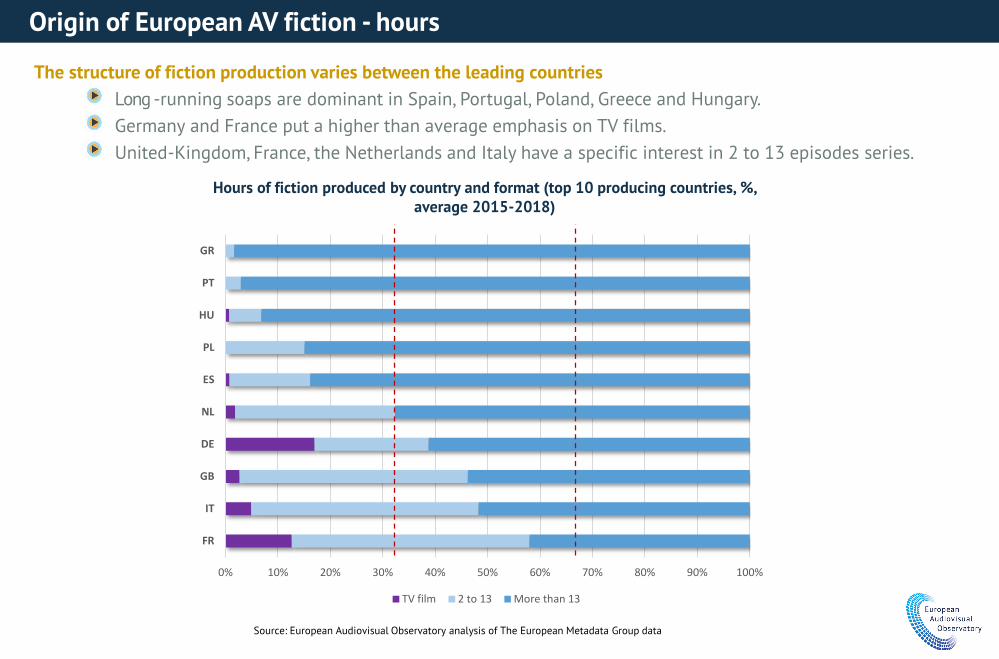
The structure of fiction production varies between the leading countriesLong-running soaps are dominant in Spain, Portugal, Poland, Greece and Hungary.Germany and France put a higher than average emphasis on TV films.United-Kingdom, France, the Netherlands and Italy have a specific interest in 2 to 13 episodes series.
Origin of European AV fiction - hours
Source: European Audiovisual Observatory analysis of The European Metadata Group data
Hours of fiction produced by country and format (top 10 producing countries, %, average 2015-2018)
0% 10% 20% 30% 40% 50% 60% 70% 80% 90% 100%
FR
IT
GB
DE
NL
ES
PL
HU
PT
GR
TV film 2 to 13 More than 13
Co-productions
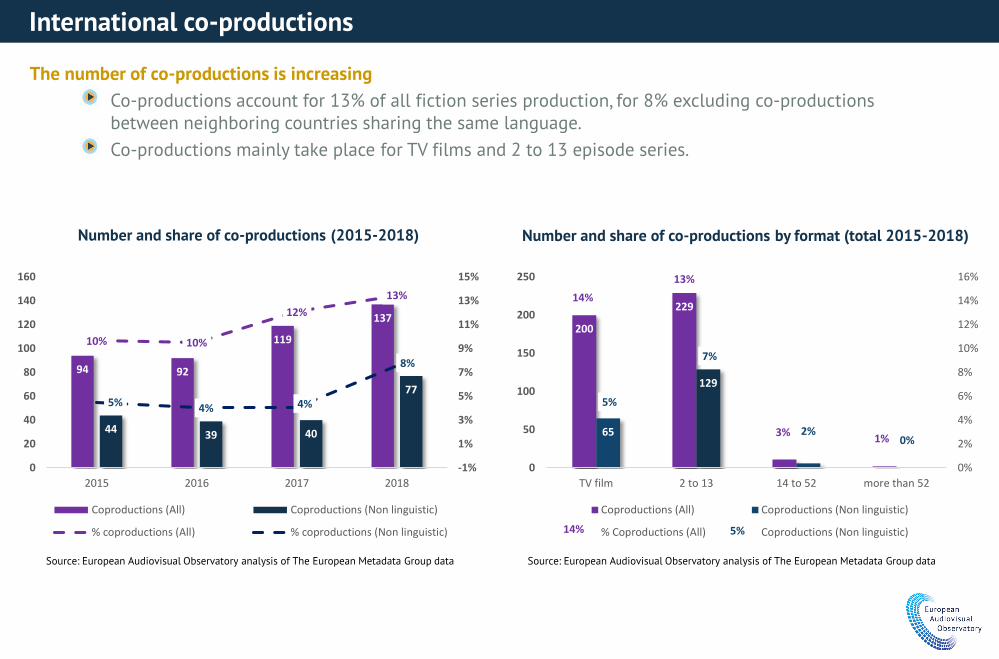
The number of co-productions is increasingCo-productions account for 13% of all fiction series production, for 8% excluding co-productions between neighboring countries sharing the same language.Co-productions mainly take place for TV films and 2 to 13 episode series.
International co-productions
Source: European Audiovisual Observatory analysis of The European Metadata Group data
Number and share of co-productions (2015-2018)
94 92
119
137
44 39 40
77
10% 10%
12%13%
5% 4% 4%
8%
-1%
1%
3%
5%
7%
9%
11%
13%
15%
0
20
40
60
80
100
120
140
160
2015 2016 2017 2018
Coproductions (All) Coproductions (Non linguistic)
% coproductions (All) % coproductions (Non linguistic)
200
229
11 2
65
129
6
14%13%
3% 1%
5%
7%
2%0%
0%
2%
4%
6%
8%
10%
12%
14%
16%
0
50
100
150
200
250
TV film 2 to 13 14 to 52 more than 52
Coproductions (All) Coproductions (Non linguistic)
% Coproductions (All) Coproductions (Non linguistic)14% 5%
Number and share of co-productions by format (total 2015-2018)
Source: European Audiovisual Observatory analysis of The European Metadata Group data
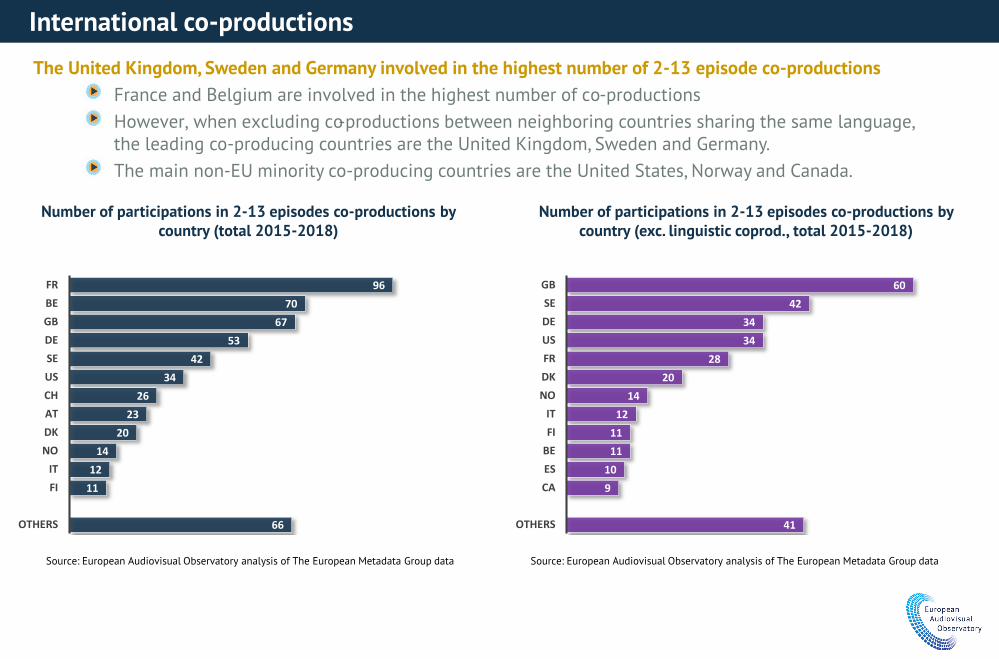
The United Kingdom, Sweden and Germany involved in the highest number of 2-13 episode co-productionsFrance and Belgium are involved in the highest number of co-productionsHowever, when excluding co-productions between neighboring countries sharing the same language, the leading co-producing countries are the United Kingdom, Sweden and Germany.The main non-EU minority co-producing countries are the United States, Norway and Canada.
International co-productions
Number of participations in 2-13 episodes co-productions by country (total 2015-2018)
66
1112
1420
2326
3442
5367
7096
OTHERS
FIIT
NODKATCHUSSEDEGBBEFR
41
910
1111
1214
2028
3434
4260
OTHERS
CAESBEFIIT
NODKFRUSDESE
GB
Number of participations in 2-13 episodes co-productions by country (exc. linguistic coprod., total 2015-2018)
Source: European Audiovisual Observatory analysis of The European Metadata Group data Source: European Audiovisual Observatory analysis of The European Metadata Group data
Commissioners of European fiction
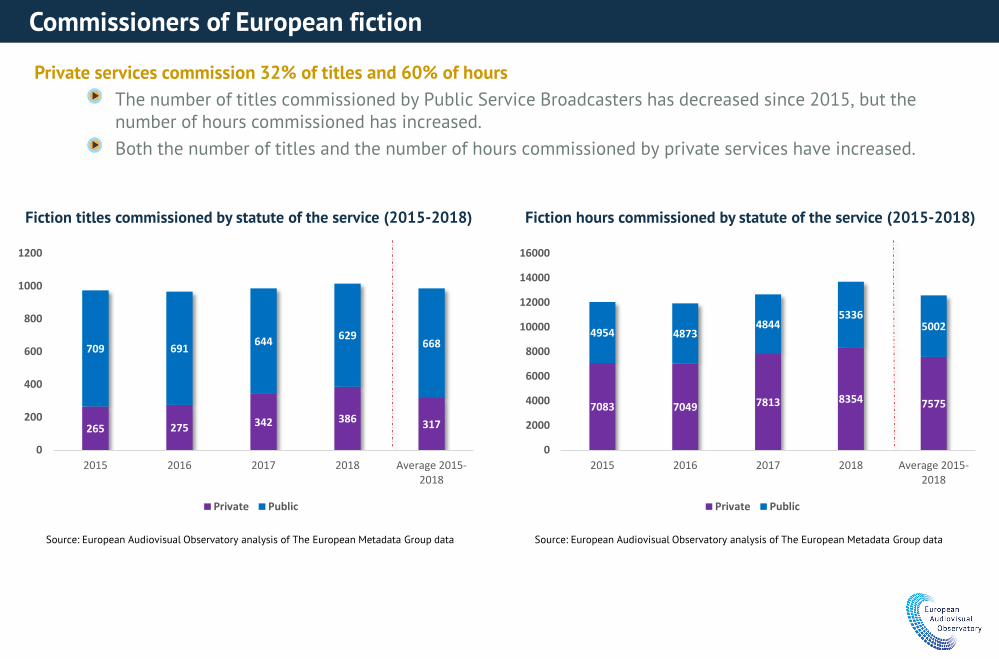
Private services commission 32% of titles and 60% of hoursThe number of titles commissioned by Public Service Broadcasters has decreased since 2015, but the number of hours commissioned has increased.Both the number of titles and the number of hours commissioned by private services have increased.
Commissioners of European fiction
Fiction titles commissioned by statute of the service (2015-2018)
265 275 342 386 317
709 691 644 629668
0
200
400
600
800
1000
1200
2015 2016 2017 2018 Average 2015-2018
Private Public
7083 7049 7813 8354 7575
4954 48734844
53365002
0
2000
4000
6000
8000
10000
12000
14000
16000
2015 2016 2017 2018 Average 2015-2018
Private Public
Fiction hours commissioned by statute of the service (2015-2018)
Source: European Audiovisual Observatory analysis of The European Metadata Group data Source: European Audiovisual Observatory analysis of The European Metadata Group data
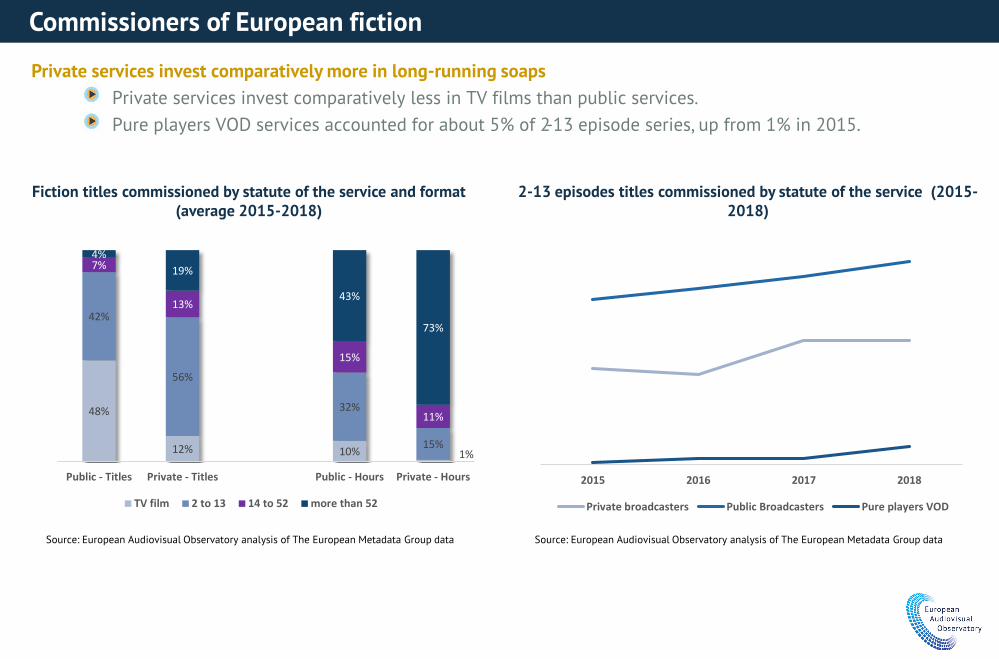
Private services invest comparatively more in long-running soapsPrivate services invest comparatively less in TV films than public services.Pure players VOD services accounted for about 5% of 2-13 episode series, up from 1% in 2015.
Commissioners of European fiction
Fiction titles commissioned by statute of the service and format (average 2015-2018)
2-13 episodes titles commissioned by statute of the service (2015-2018)
Source: European Audiovisual Observatory analysis of The European Metadata Group data Source: European Audiovisual Observatory analysis of The European Metadata Group data
48%
12% 10% 1%
42%
56%
32%
15%
7%
13%
15%
11%
4%19%
43%
73%
Public - Titles Private - Titles Public - Hours Private - Hours
TV film 2 to 13 14 to 52 more than 52
2015 2016 2017 2018
Private broadcasters Public Broadcasters Pure players VOD
Producers of European fiction
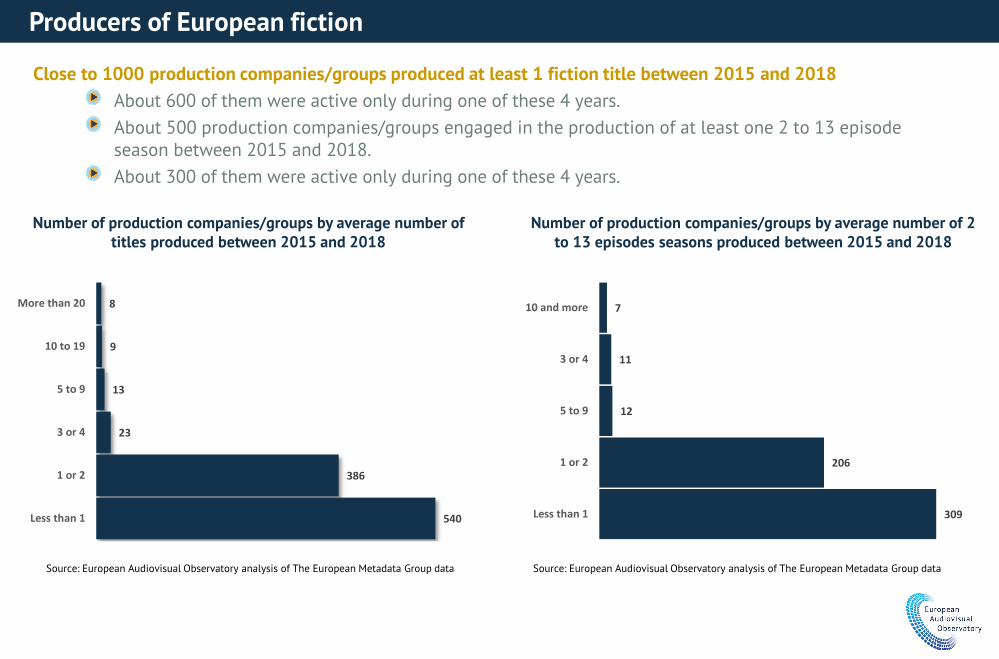
Close to 1000 production companies/groups produced at least 1 fiction title between 2015 and 2018About 600 of them were active only during one of these 4 years.About 500 production companies/groups engaged in the production of at least one 2 to 13 episode season between 2015 and 2018.About 300 of them were active only during one of these 4 years.
Producers of European fiction
Source: European Audiovisual Observatory analysis of The European Metadata Group data
Number of production companies/groups by average number of titles produced between 2015 and 2018
540
386
23
13
9
8
Less than 1
1 or 2
3 or 4
5 to 9
10 to 19
More than 20
309
206
12
11
7
Less than 1
1 or 2
5 to 9
3 or 4
10 and more
Number of production companies/groups by average number of 2 to 13 episodes seasons produced between 2015 and 2018
Source: European Audiovisual Observatory analysis of The European Metadata Group data
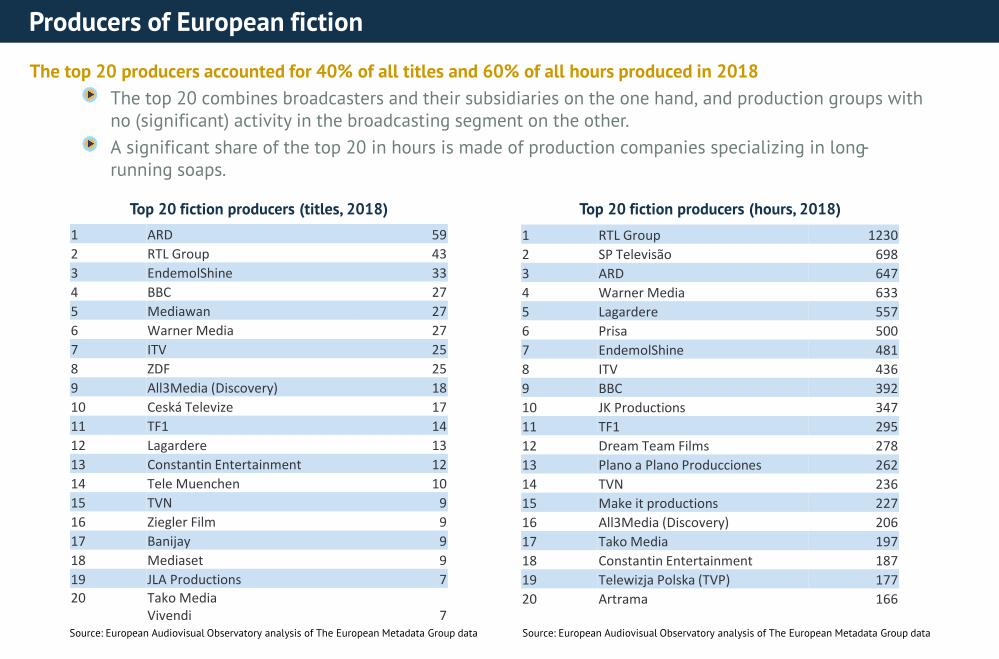
The top 20 producers accounted for 40% of all titles and 60% of all hours produced in 2018The top 20 combines broadcasters and their subsidiaries on the one hand, and production groups with no (significant) activity in the broadcasting segment on the other. A significant share of the top 20 in hours is made of production companies specializing in long-running soaps.
Producers of European fiction
Source: European Audiovisual Observatory analysis of The European Metadata Group data
1 ARD 592 RTL Group 433 EndemolShine 334 BBC 275 Mediawan 276 Warner Media 277 ITV 258 ZDF 259 All3Media (Discovery) 1810 Ceská Televize 1711 TF1 1412 Lagardere 1313 Constantin Entertainment 1214 Tele Muenchen 1015 TVN 916 Ziegler Film 917 Banijay 918 Mediaset 919 JLA Productions 720 Tako Media
Vivendi 7
Top 20 fiction producers (titles, 2018) Top 20 fiction producers (hours, 2018)
Source: European Audiovisual Observatory analysis of The European Metadata Group data
1 RTL Group 12302 SP Televisão 6983 ARD 6474 Warner Media 6335 Lagardere 5576 Prisa 5007 EndemolShine 4818 ITV 4369 BBC 39210 JK Productions 34711 TF1 29512 Dream Team Films 27813 Plano a Plano Producciones 26214 TVN 23615 Make it productions 22716 All3Media (Discovery) 20617 Tako Media 19718 Constantin Entertainment 18719 Telewizja Polska (TVP) 17720 Artrama 166
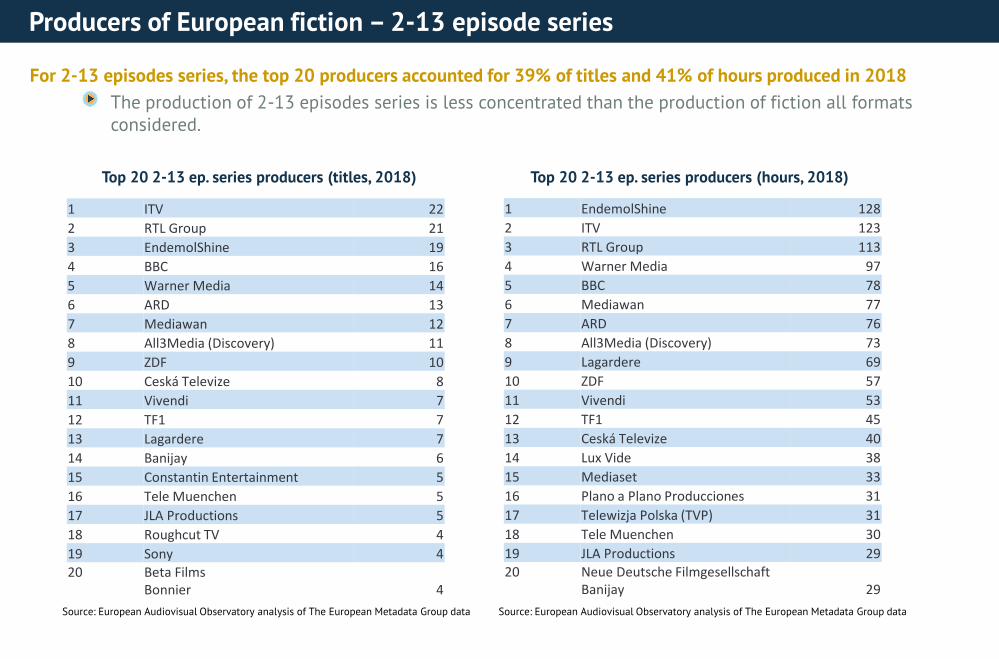
For 2-13 episodes series, the top 20 producers accounted for 39% of titles and 41% of hours produced in 2018The production of 2-13 episodes series is less concentrated than the production of fiction all formats considered.
Producers of European fiction – 2-13 episode series
Top 20 2-13 ep. series producers (titles, 2018)
Source: European Audiovisual Observatory analysis of The European Metadata Group data
Top 20 2-13 ep. series producers (hours, 2018)
Source: European Audiovisual Observatory analysis of The European Metadata Group data
1 ITV 222 RTL Group 213 EndemolShine 194 BBC 165 Warner Media 146 ARD 137 Mediawan 128 All3Media (Discovery) 119 ZDF 1010 Ceská Televize 811 Vivendi 712 TF1 713 Lagardere 714 Banijay 615 Constantin Entertainment 516 Tele Muenchen 517 JLA Productions 518 Roughcut TV 419 Sony 420 Beta Films
Bonnier 4
1 EndemolShine 1282 ITV 1233 RTL Group 1134 Warner Media 975 BBC 786 Mediawan 777 ARD 768 All3Media (Discovery) 739 Lagardere 6910 ZDF 5711 Vivendi 5312 TF1 4513 Ceská Televize 4014 Lux Vide 3815 Mediaset 3316 Plano a Plano Producciones 3117 Telewizja Polska (TVP) 3118 Tele Muenchen 3019 JLA Productions 2920 Neue Deutsche Filmgesellschaft
Banijay 29
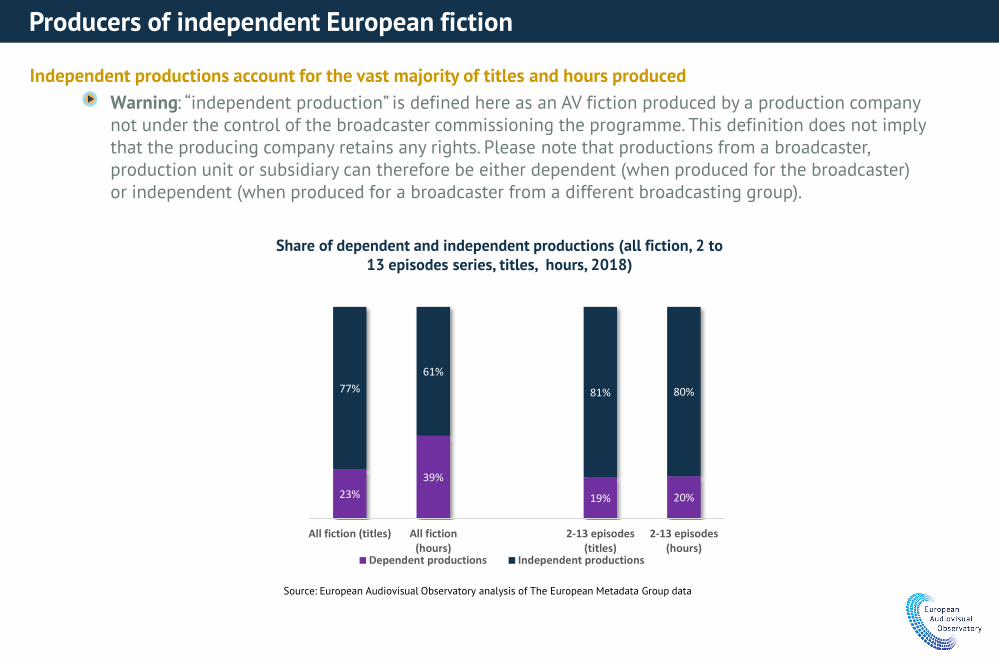
Independent productions account for the vast majority of titles and hours producedWarning: “independent production” is defined here as an AV fiction produced by a production company not under the control of the broadcaster commissioning the programme. This definition does not imply that the producing company retains any rights. Please note that productions from a broadcaster, production unit or subsidiary can therefore be either dependent (when produced for the broadcaster) or independent (when produced for a broadcaster from a different broadcasting group).
Producers of independent European fiction
Source: European Audiovisual Observatory analysis of The European Metadata Group data
23%39%
19% 20%
77%61%
81% 80%
All fiction (titles) All fiction(hours)
2-13 episodes(titles)
2-13 episodes(hours)
Dependent productions Independent productions
Share of dependent and independent productions (all fiction, 2 to 13 episodes series, titles, hours, 2018)
Screenwriters and directors of European audiovisual fiction
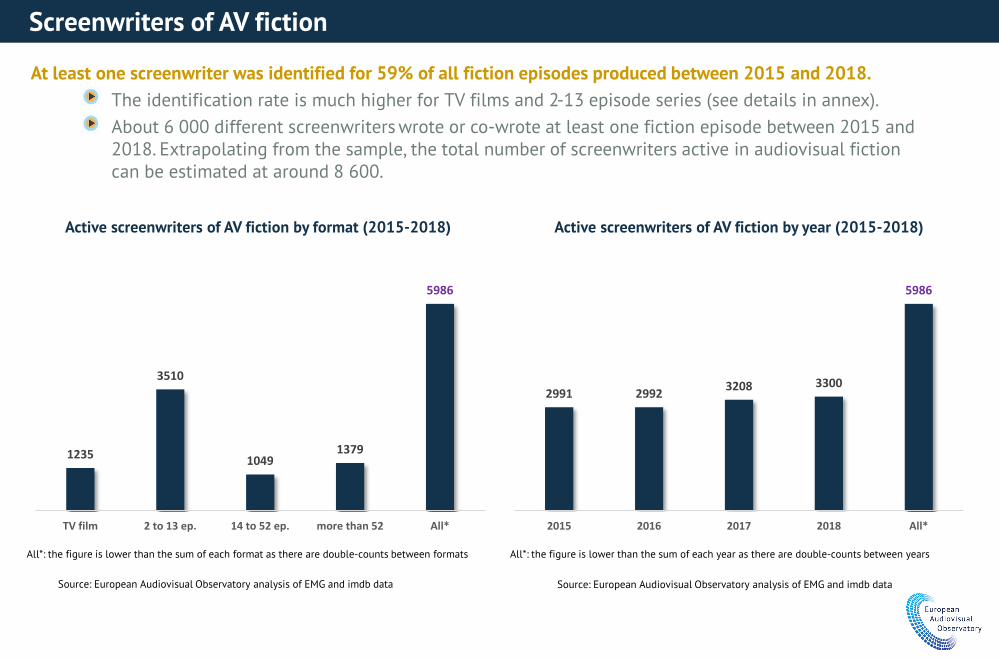
At least one screenwriter was identified for 59% of all fiction episodes produced between 2015 and 2018. The identification rate is much higher for TV films and 2-13 episode series (see details in annex).About 6 000 different screenwriters wrote or co-wrote at least one fiction episode between 2015 and 2018. Extrapolating from the sample, the total number of screenwriters active in audiovisual fiction can be estimated at around 8 600.
Screenwriters of AV fiction
Source: European Audiovisual Observatory analysis of EMG and imdb data
Active screenwriters of AV fiction by format (2015-2018)
All*: the figure is lower than the sum of each format as there are double-counts between formats
1235
3510
10491379
5986
TV film 2 to 13 ep. 14 to 52 ep. more than 52 All*
2991 2992 3208 3300
5986
2015 2016 2017 2018 All*
Source: European Audiovisual Observatory analysis of EMG and imdb data
Active screenwriters of AV fiction by year (2015-2018)
All*: the figure is lower than the sum of each year as there are double-counts between years
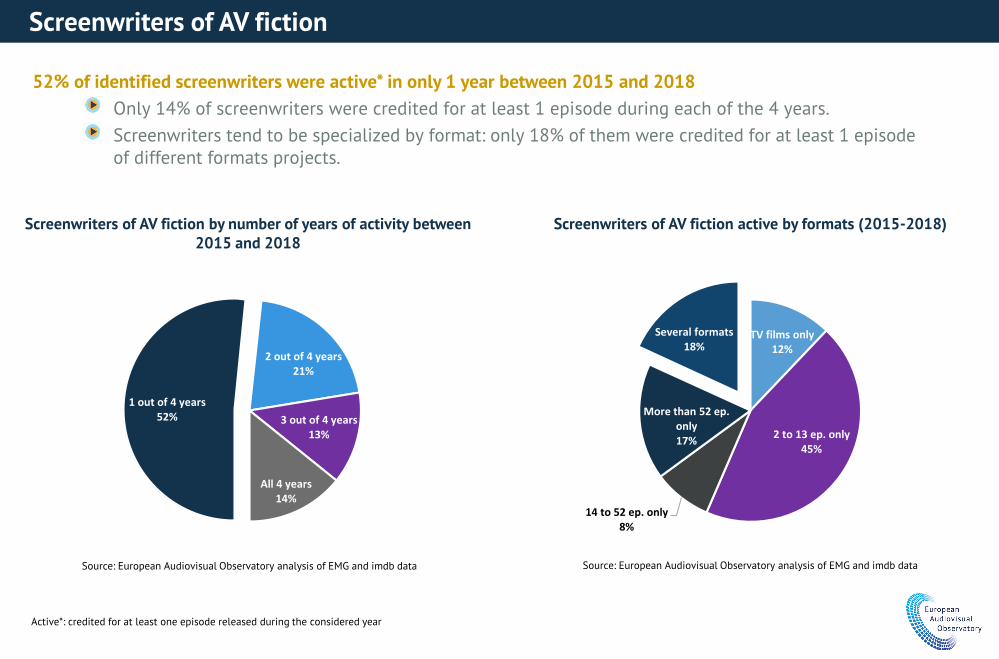
52% of identified screenwriters were active* in only 1 year between 2015 and 2018Only 14% of screenwriters were credited for at least 1 episode during each of the 4 years.Screenwriters tend to be specialized by format: only 18% of them were credited for at least 1 episode of different formats projects.
Screenwriters of AV fiction
Source: European Audiovisual Observatory analysis of EMG and imdb data
Screenwriters of AV fiction by number of years of activity between 2015 and 2018
Source: European Audiovisual Observatory analysis of EMG and imdb data
Screenwriters of AV fiction active by formats (2015-2018)
1 out of 4 years52%
2 out of 4 years21%
3 out of 4 years13%
All 4 years14%
TV films only12%
2 to 13 ep. only45%
14 to 52 ep. only8%
More than 52 ep. only17%
Several formats18%
Active*: credited for at least one episode released during the considered year
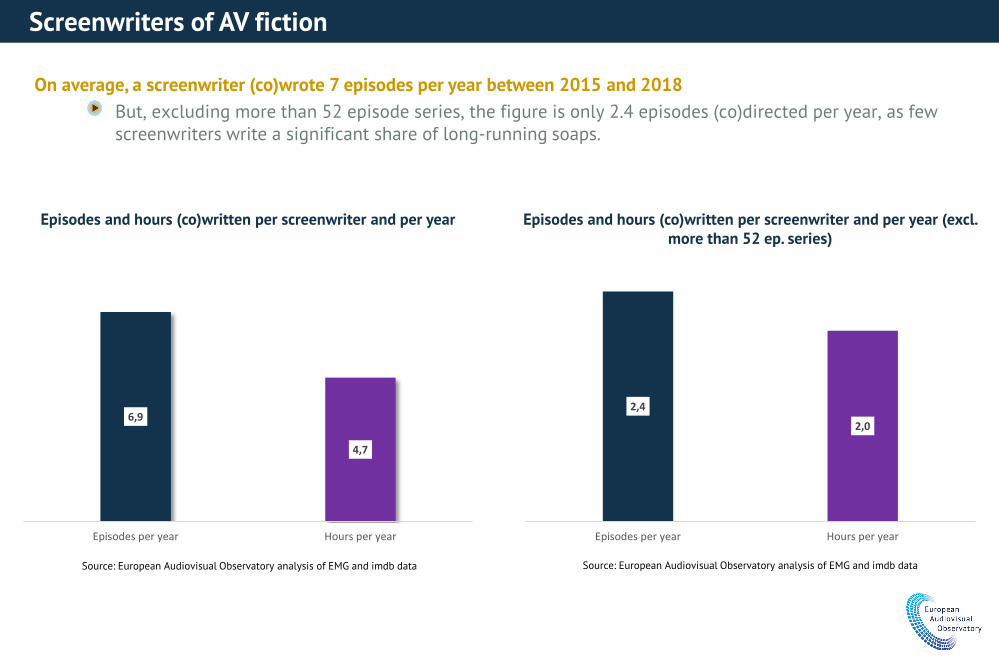
On average, a screenwriter (co)wrote 7 episodes per year between 2015 and 2018But, excluding more than 52 episode series, the figure is only 2.4 episodes (co)directed per year, as few screenwriters write a significant share of long-running soaps.
Screenwriters of AV fiction
Source: European Audiovisual Observatory analysis of EMG and imdb data
Episodes and hours (co)written per screenwriter and per year
Source: European Audiovisual Observatory analysis of EMG and imdb data
Episodes and hours (co)written per screenwriter and per year (excl. more than 52 ep. series)
6,9
4,7
Episodes per year Hours per year
2,4
2,0
Episodes per year Hours per year
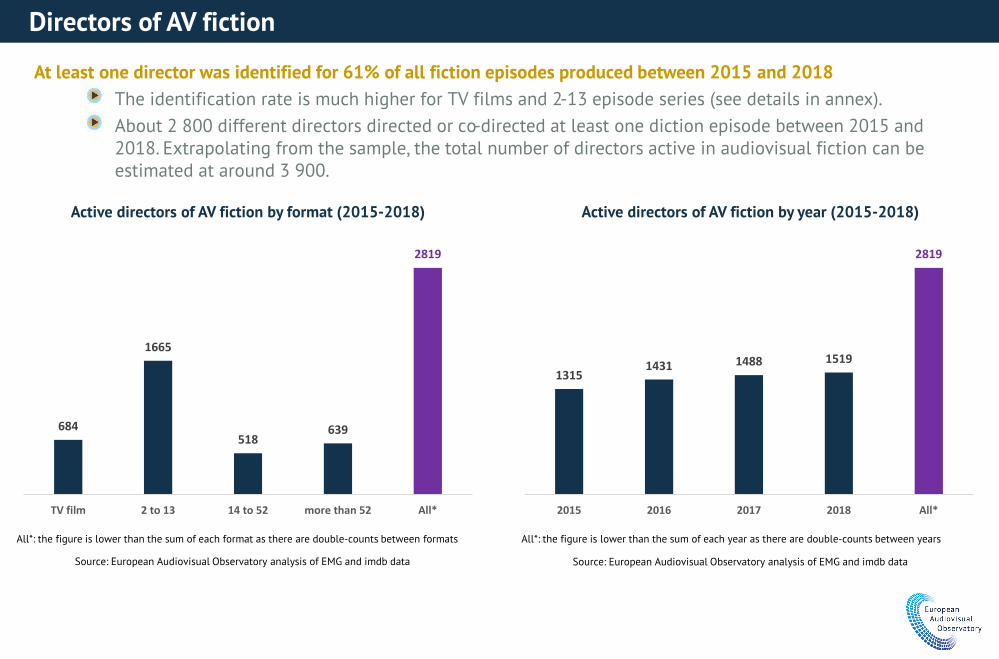
At least one director was identified for 61% of all fiction episodes produced between 2015 and 2018The identification rate is much higher for TV films and 2-13 episode series (see details in annex).About 2 800 different directors directed or co-directed at least one diction episode between 2015 and 2018. Extrapolating from the sample, the total number of directors active in audiovisual fiction can be estimated at around 3 900.
Directors of AV fiction
Active directors of AV fiction by format (2015-2018) Active directors of AV fiction by year (2015-2018)
684
1665
518639
2819
TV film 2 to 13 14 to 52 more than 52 All*
13151431 1488 1519
2819
2015 2016 2017 2018 All*
Source: European Audiovisual Observatory analysis of EMG and imdb data
All*: the figure is lower than the sum of each format as there are double-counts between formats
Source: European Audiovisual Observatory analysis of EMG and imdb data
All*: the figure is lower than the sum of each year as there are double-counts between years
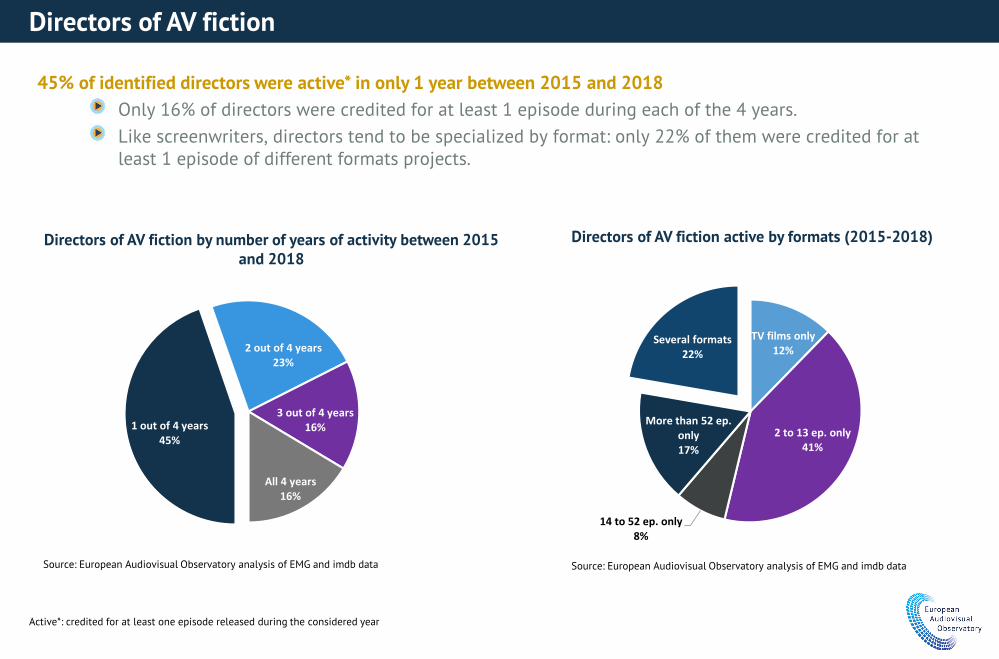
45% of identified directors were active* in only 1 year between 2015 and 2018Only 16% of directors were credited for at least 1 episode during each of the 4 years.Like screenwriters, directors tend to be specialized by format: only 22% of them were credited for at least 1 episode of different formats projects.
Directors of AV fiction
Source: European Audiovisual Observatory analysis of EMG and imdb data
Directors of AV fiction by number of years of activity between 2015 and 2018
Source: European Audiovisual Observatory analysis of EMG and imdb data
Directors of AV fiction active by formats (2015-2018)
Active*: credited for at least one episode released during the considered year
1 out of 4 years45%
2 out of 4 years23%
3 out of 4 years16%
All 4 years16%
TV films only12%
2 to 13 ep. only41%
14 to 52 ep. only8%
More than 52 ep. only17%
Several formats22%
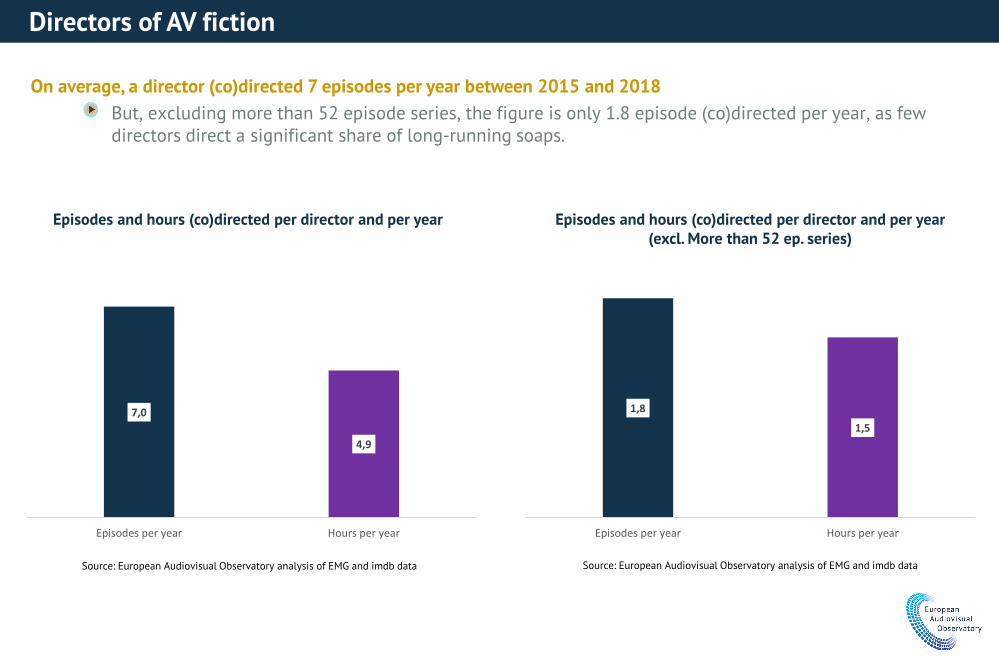
On average, a director (co)directed 7 episodes per year between 2015 and 2018But, excluding more than 52 episode series, the figure is only 1.8 episode (co)directed per year, as few directors direct a significant share of long-running soaps.
Directors of AV fiction
Source: European Audiovisual Observatory analysis of EMG and imdb data
Episodes and hours (co)directed per director and per year
Source: European Audiovisual Observatory analysis of EMG and imdb data
Episodes and hours (co)directed per director and per year(excl. More than 52 ep. series)
7,0
4,9
Episodes per year Hours per year
1,8
1,5
Episodes per year Hours per year
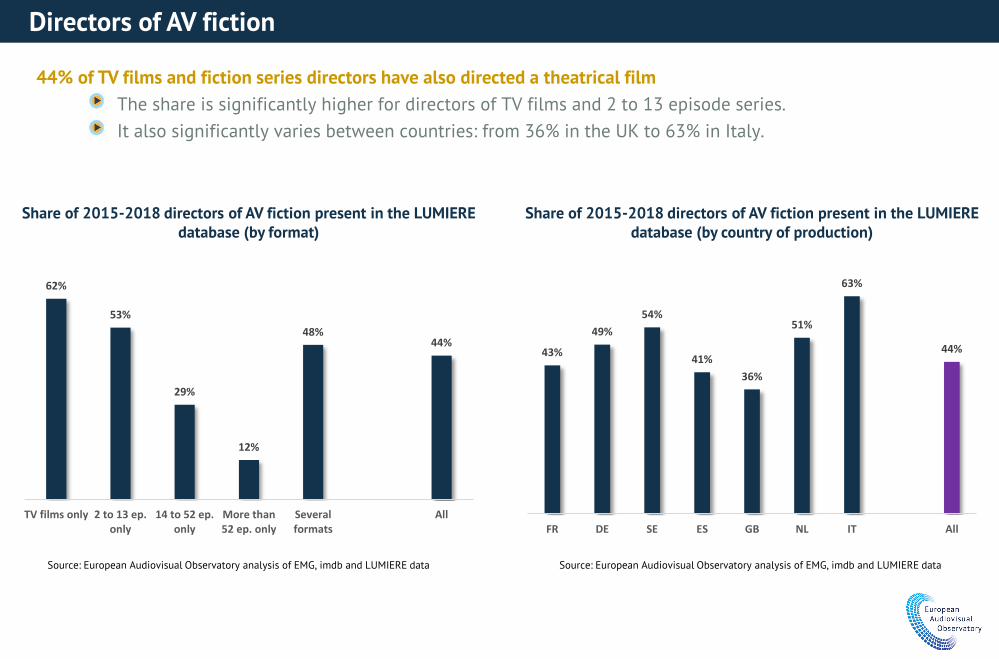
44% of TV films and fiction series directors have also directed a theatrical filmThe share is significantly higher for directors of TV films and 2 to 13 episode series.It also significantly varies between countries: from 36% in the UK to 63% in Italy.
Directors of AV fiction
Source: European Audiovisual Observatory analysis of EMG, imdb and LUMIERE data
Share of 2015-2018 directors of AV fiction present in the LUMIERE database (by format)
62%
53%
29%
12%
48%44%
TV films only 2 to 13 ep.only
14 to 52 ep.only
More than52 ep. only
Severalformats
All
43%
49%54%
41%36%
51%
63%
44%
FR DE SE ES GB NL IT All
Source: European Audiovisual Observatory analysis of EMG, imdb and LUMIERE data
Share of 2015-2018 directors of AV fiction present in the LUMIERE database (by country of production)
Screenwriting and direction of European TV fiction
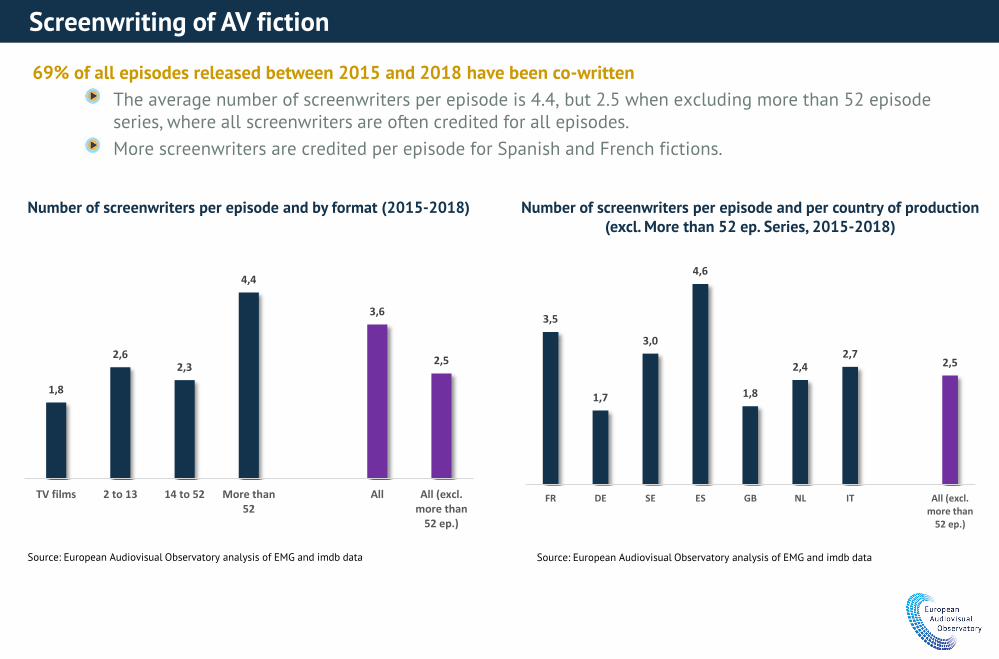
69% of all episodes released between 2015 and 2018 have been co-writtenThe average number of screenwriters per episode is 4.4, but 2.5 when excluding more than 52 episode series, where all screenwriters are often credited for all episodes.More screenwriters are credited per episode for Spanish and French fictions.
Screenwriting of AV fiction
Source: European Audiovisual Observatory analysis of EMG and imdb data
Number of screenwriters per episode and by format (2015-2018)
1,8
2,62,3
4,4
3,6
2,5
TV films 2 to 13 14 to 52 More than52
All All (excl.more than
52 ep.)
3,5
1,7
3,0
4,6
1,8
2,42,7
2,5
FR DE SE ES GB NL IT All (excl.more than
52 ep.)
Number of screenwriters per episode and per country of production (excl. More than 52 ep. Series, 2015-2018)
Source: European Audiovisual Observatory analysis of EMG and imdb data
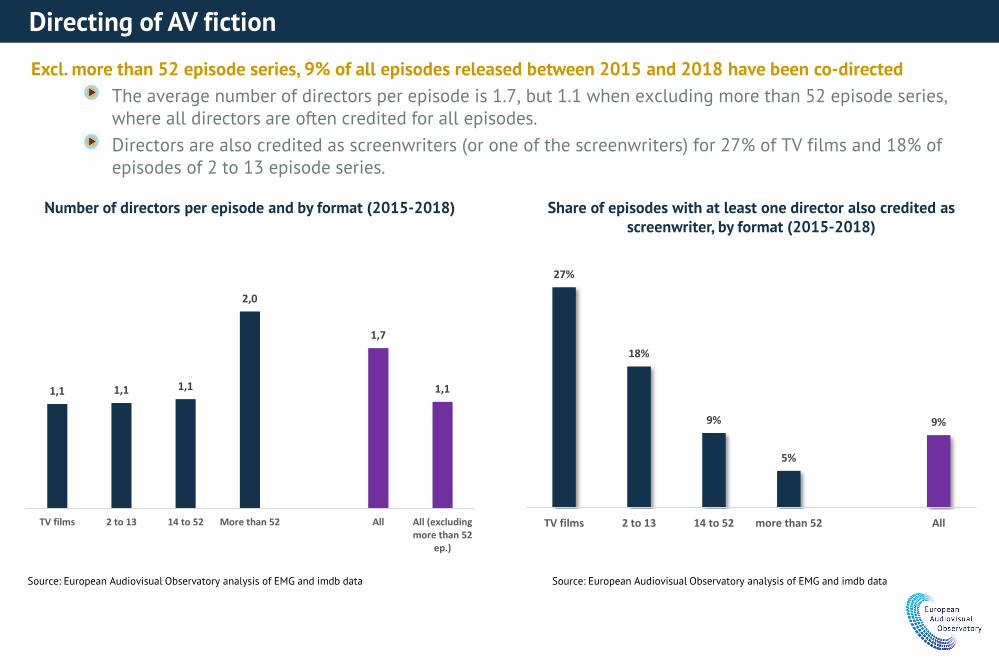
Excl. more than 52 episode series, 9% of all episodes released between 2015 and 2018 have been co-directedThe average number of directors per episode is 1.7, but 1.1 when excluding more than 52 episode series, where all directors are often credited for all episodes.Directors are also credited as screenwriters (or one of the screenwriters) for 27% of TV films and 18% of episodes of 2 to 13 episode series.
Directing of AV fiction
Source: European Audiovisual Observatory analysis of EMG and imdb data
Number of directors per episode and by format (2015-2018) Share of episodes with at least one director also credited as screenwriter, by format (2015-2018)
Source: European Audiovisual Observatory analysis of EMG and imdb data
1,1 1,1 1,1
2,0
1,7
1,1
TV films 2 to 13 14 to 52 More than 52 All All (excludingmore than 52
ep.)
27%
18%
9%
5%
9%
TV films 2 to 13 14 to 52 more than 52 All
Annexes
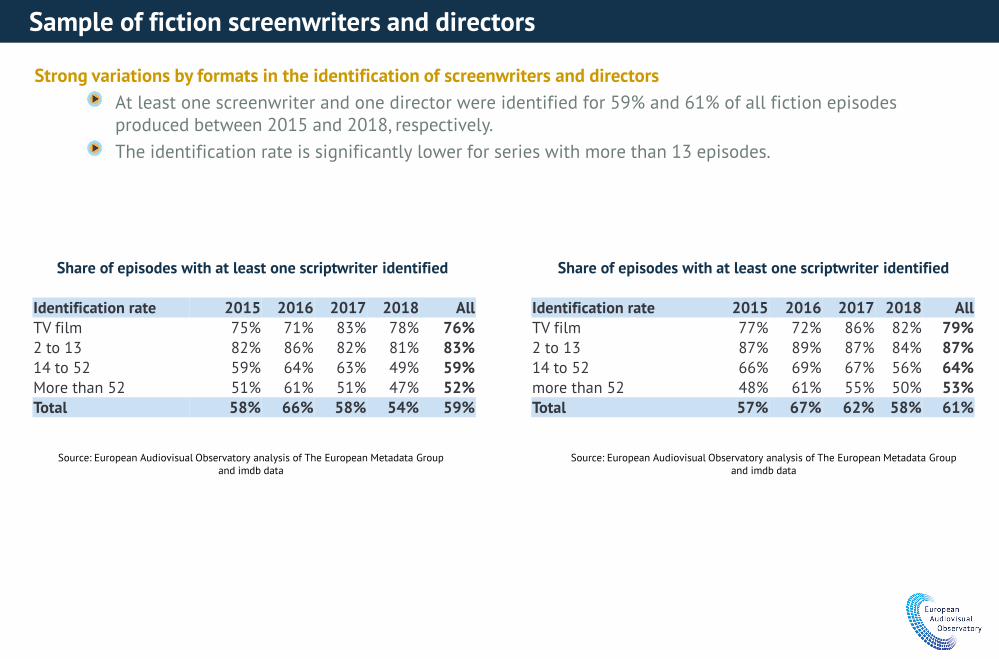
Strong variations by formats in the identification of screenwriters and directorsAt least one screenwriter and one director were identified for 59% and 61% of all fiction episodes produced between 2015 and 2018, respectively.The identification rate is significantly lower for series with more than 13 episodes.
Sample of fiction screenwriters and directors
Source: European Audiovisual Observatory analysis of The European Metadata Group and imdb data
Share of episodes with at least one scriptwriter identified
Identification rate 2015 2016 2017 2018 AllTV film 75% 71% 83% 78% 76%2 to 13 82% 86% 82% 81% 83%14 to 52 59% 64% 63% 49% 59%More than 52 51% 61% 51% 47% 52%Total 58% 66% 58% 54% 59%
Identification rate 2015 2016 2017 2018 AllTV film 77% 72% 86% 82% 79%2 to 13 87% 89% 87% 84% 87%14 to 52 66% 69% 67% 56% 64%more than 52 48% 61% 55% 50% 53%Total 57% 67% 62% 58% 61%
Share of episodes with at least one scriptwriter identified
Source: European Audiovisual Observatory analysis of The European Metadata Group and imdb data
List of tables and graphs (1)Production volume and formats of European audiovisual fictionVolume of AV fiction produced in the European Union (2015-2018Number of AV fiction titles produced by format (2015-2018)Number of fiction titles, episodes and hours produced (average 2015-2018)Number of fiction titles by duration of episode (2015-2018)Number of fiction titles produced by number and duration of episode (total 2015-2018)Share of 1st seasons among all series (average 2015-2018)Share of 1st seasons among 2-13 episode series (average 2015-2018)
Origin of European audiovisual fictionTop fiction producing countries (seasons, average 2015-2018 and 2018)Top 2-13 series producing countries (seasons, average 2015-2018 and 2018)Top fiction producing countries (hours, average 2015-2018 and 2018)Top 2-13 series producing countries (hours, average 2015-2018 and 2018)Hours of fiction produced by country and format (top 10 producing countries, %, average 2015-2018)
Co-productionsNumber and share of co-productions (2015-2018)Number and share of co-productions by format (total 2015-2018)Number of participations in 2-13 episodes co-productions by country (total 2015-2018) Number of participations in 2-13 episodes co-productions by country (exc. linguistic co-prod., total 2015-2018)
List of tables and graphs (2)Commissioners of European fictionFiction titles commissioned by statute of the service (2015-2018) Fiction hours commissioned by statute of the service (2015-2018) Fiction titles commissioned by statute of the service and format (average 2015-2018) 2-13 episode titles commissioned by statute and format of the service (2015-2018)Fiction titles commissioned by VOD services (2015-2018)
Producers of European fictionNumber of production companies/groups by average number of titles produced between 2015 and 2018Number of production companies/groups by average number of 2 to 13 episode seasons produced between 2015 and 2018Top 20 fiction producers (titles, 2018)Top 20 fiction producers (hours, 2018)Top 20 2-13 ep. series producers (titles, 2018)Top 20 2-13 ep. series producers (hours, 2018)Share of dependent and independent productions (all fiction, 2 to 13 episode series, titles, hours, 2018)
Screenwriters and directors of European audiovisual fictionActive screenwriters of AV fiction by format (2015-2018)Active screenwriters of AV fiction by year (2015-2018)Screenwriters of AV fiction by number of years of activity between 2015 and 2018Screenwriters of AV fiction active by formats (2015-2018)
List of tables and graphs (3)
Screenwriters and directors of European audiovisual fiction (cont’d)Active screenwriters of AV fiction by format (2015-2018)Active screenwriters of AV fiction by year (2015-2018)Screenwriters of AV fiction by number of years of activity between 2015 and 2018Screenwriters of AV fiction active by formats (2015-2018)Episodes and hours (co)written per screenwriter and per yearEpisodes and hours (co)written per screenwriter and per year (excl. more than 52 ep. series)Active directors of AV fiction by format (2015-2018)Active directors of AV fiction by year (2015-2018)DIrectors of AV fiction by number of years of activity between 2015 and 2018Directors of AV fiction active by formats (2015-2018)Episodes and hours (co)directed per director and per yearEpisodes and hours (co)directed per director and per year (excl. More than 52 ep. series)Share of 2015-2018 directors of AV fiction present in the LUMIERE database (by format)Share of 2015-2018 directors of AV fiction present in the LUMIERE database (by country of production)
Screenwriting and direction of European TV fictionNumber of screenwriters per episode and by format (2015-2018)Number of screenwriters per episode and per country of production (excl. More than 52 ep. Series, 2015-2018)Number of directors per episode and by format (2015-2018)Share of episodes with at least one director also credited as screenwriter, by format (2015-2018)