Embed Size (px)
Citation preview

1PROMOTING CHOICE • SECURING STANDARDS • PREVENTING HARM
Audience attitudes to online and on-demand content: Levels of offence and regulatory awarenessCross Platform Media Tracker 2020
Produced by: BVA BDRC
Fieldwork: January-March & October-December 2020

2PROMOTING CHOICE • SECURING STANDARDS • PREVENTING HARM
Concern regarding online TV or video content is highest among younger adults and teens with around with around one in five claiming to have seen something concerning in the last year.• Around one in seven (14%) adults claim to have seen TV or video content online or on-demand that has caused them some concern in the last
year. This compares to 18% of adults who have seen something offensive on broadcast television. • Levels of concern regarding online TV or video content are higher among younger adults (measuring 20% among 16-34 year olds compared to
8% among 55-64 year olds).• Levels of concern are higher among teens, with over one in five (22%) claiming to have seen concerning on-line or on-demand TV or video in
the last year.• Higher levels of concern among teens and younger adults regarding on-line or on-demand TV or video content is different to the trend seen
with broadcast content, where older adults are more likely to say they are offended by television content than younger adults.• There are a wide range of issues that cause concern regarding on-line or on-demand TV or video content among adults and teens with bad
language gaining the top mention and bullying coming second.• The majority of adults and teens say they take action when they see something concerning. Adults are most likely to stop viewing whilst teens
are most likely to tell their parents or stop viewing.
Whilst regulatory awareness is high for broadcast content, there is more uncertainty regarding on-demand and online services• Around two in five adults think that all type of on-line/on-demand content should be regulated. However around half (49%) hold no strong
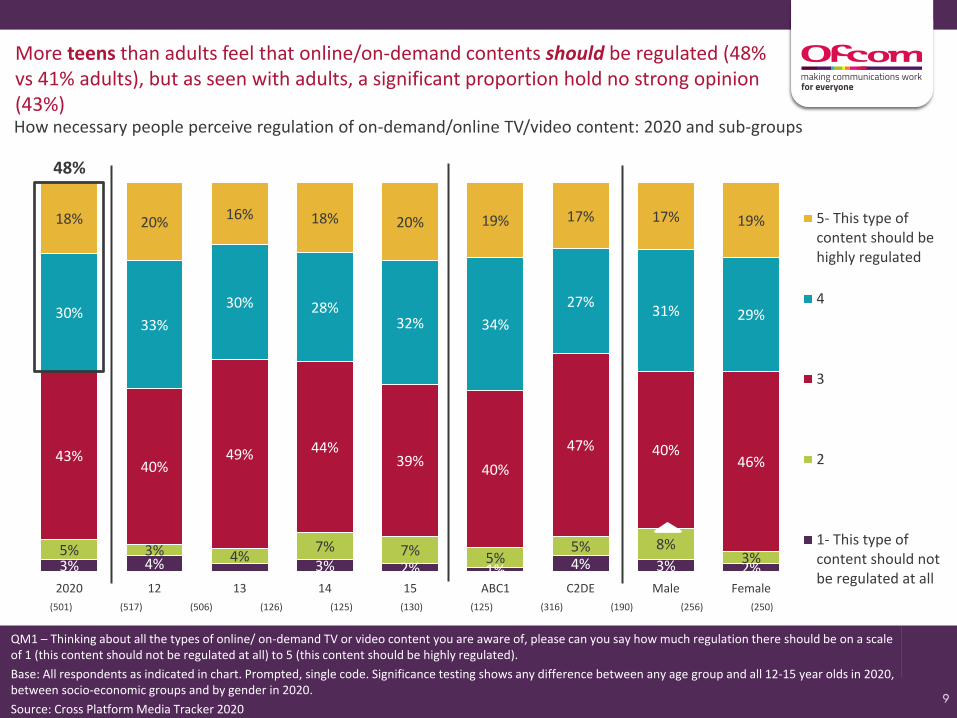
opinion.• More teens than adults feel that online/on-demand contents should be regulated (48% vs 41% adults), but as seen with adults, a significant
proportion hold no strong opinion (43%).• Just under four in five adults think broadcast TV and catch up services are regulated. • Similar perceptions around which services are regulated exist among teens and adults with around four in five teens assuming broadcast TV
services are regulated. As seen with adults, perceptions of regulation falls the further you move away from broadcast towards video content on websites, such as YouTube.
• Ofcom achieves the most mentions among adults when respondents are asked who they think is responsible for regulating online and on demand content – although a third of adults say they don’t know, or do not offer a guess. In contrast, the majority of teens believe that the broadcasters/content providers are responsible for regulating online and on demand content.
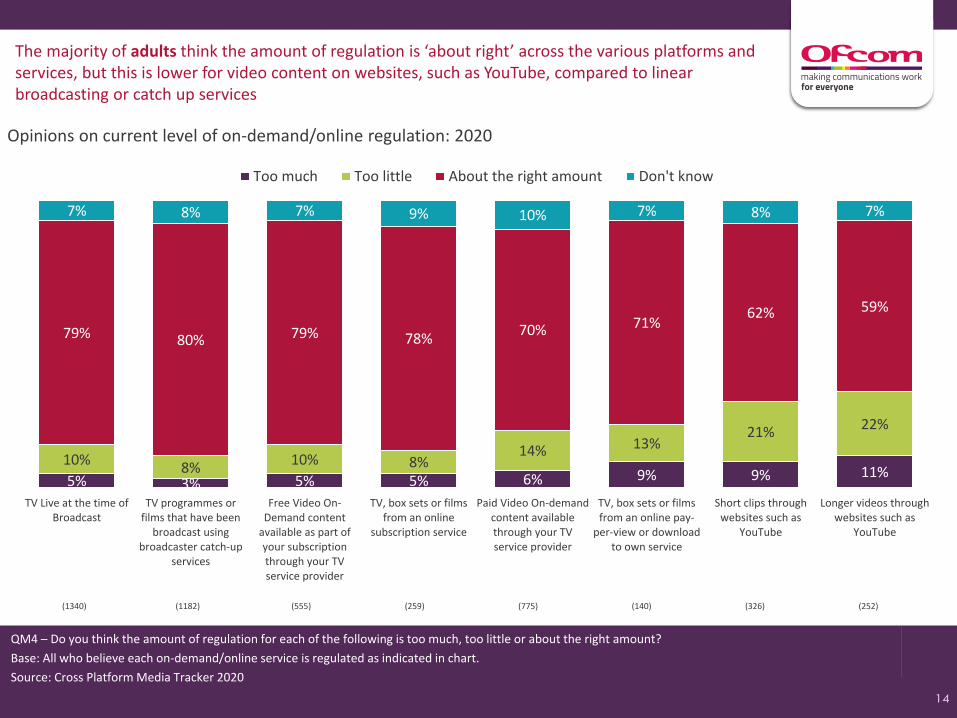
• The majority of adults and teens think the amount of regulation is ‘about right’ across the various platforms and services tested, but this is lower for video content on websites, such as YouTube, compared to linear broadcasting or catch up services
Summary of key findings
3
3
Around one in seven (14%) adults claim to have seen TV or video content online or on-demand that has caused them concern in the last year
Overall % who watch on-demand/online who have been concerned by something: In 2020 and sub-groups
14%
20%
12%
8%
11%
15%14%
17%
12%
15%14%
2020 16-34 35-54 55-64 65+ ABC1 C2DE Male Female Parents Non-parents
QL1 – Thinking about all the on-line or on-demand TV or video content you watch nowadays, has anything that you have seen caused you any concern?
Base: All who have watched anything on-line or on-demand in the last 12 months (as indicated on chart)
Source: Cross Platform Media Tracker 2020
(2051) (618) (754) (311) (368) (1202) (849) (938) (1113) (591) (1460)
Levels of offence regarding online TV or video content are higher among younger adults. This is in contrast to broadcast – where the reverse is seen i.e. older adults are more offended by TV
content than younger people
This compares to 18% of adults who have seen something offensive on
television

4
4
Levels of concern are higher among teens with over a fifth (22%) claiming to have seen concerning on-line or on-demand TV or video in the last
% who watch on-demand/online content who have been concerned by something: 2020 sub-groups
14%
22%
18%
21%
24%25%
21%
23%
21%
23%
Aduts 2020 12 13 14 15 ABC1 C2DE Male Female
(501) (125) (124) (129) (123) (313) (188) (256) (245)
QL1 – Thinking about all the on-line or on-demand TV or video content you watch nowadays, has anything that you have seen caused you any concern?
Base: All who have watched anything on-line or on-demand in the last 12 months(as indicated on chart). Prompted, single code. Significance testing shows any difference between 2018 and 2020, between any age group and all 12-15 year olds in 2020, between socio-economic groups and by gender in 2020.
Source: Cross Platform Media Tracker 2020
5
5
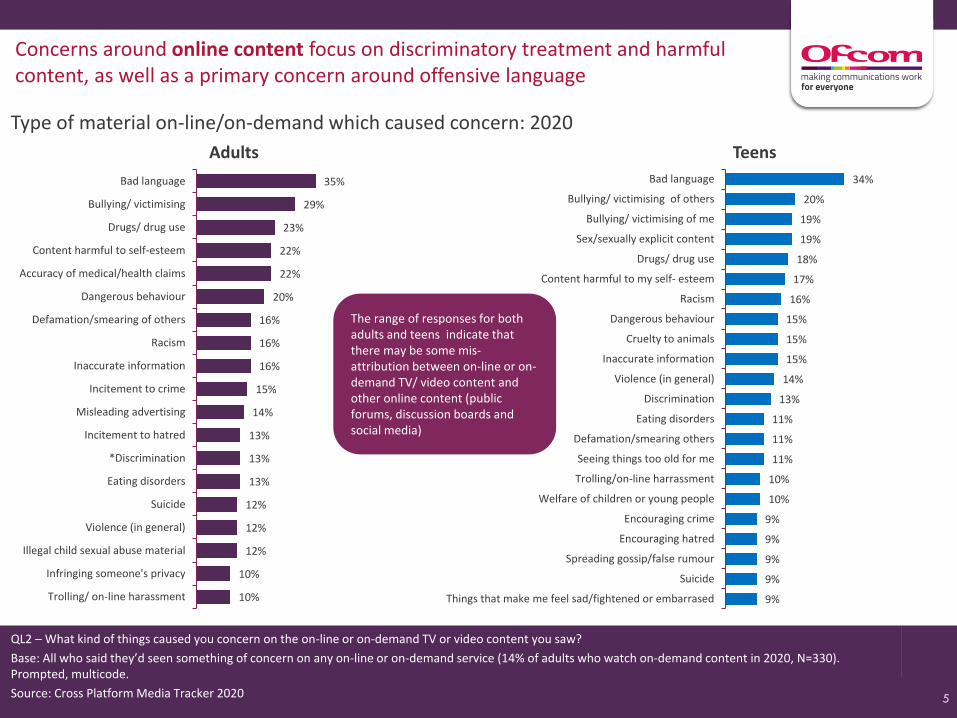
Concerns around online content focus on discriminatory treatment and harmful content, as well as a primary concern around offensive language
Type of material on-line/on-demand which caused concern: 2020
Adults
35%
29%
23%
22%
22%
20%
16%
16%
16%
15%
14%
13%
13%
13%
12%
12%
12%
10%
10%
Bad language
Bullying/ victimising
Drugs/ drug use
Content harmful to self-esteem
Accuracy of medical/health claims
Dangerous behaviour
Defamation/smearing of others
Racism
Inaccurate information
Incitement to crime
Misleading advertising
Incitement to hatred
*Discrimination
Eating disorders
Suicide
Violence (in general)
Illegal child sexual abuse material
Infringing someone's privacy
Trolling/ on-line harassment
The range of responses for both adults and teens indicate that there may be some mis-attribution between on-line or on-demand TV/ video content and other online content (public forums, discussion boards and social media)
Teens
34%
20%
19%
19%
18%
17%
16%
15%
15%
15%
14%
13%
11%
11%
11%
10%
10%
9%
9%
9%
9%
9%
Bad language
Bullying/ victimising of others
Bullying/ victimising of me
Sex/sexually explicit content
Drugs/ drug use
Content harmful to my self- esteem
Racism
Dangerous behaviour
Cruelty to animals
Inaccurate information
Violence (in general)
Discrimination
Eating disorders
Defamation/smearing others
Seeing things too old for me
Trolling/on-line harrassment
Welfare of children or young people
Encouraging crime
Encouraging hatred
Spreading gossip/false rumour
Suicide
Things that make me feel sad/fightened or embarrased
QL2 – What kind of things caused you concern on the on-line or on-demand TV or video content you saw?
Base: All who said they’d seen something of concern on any on-line or on-demand service (14% of adults who watch on-demand content in 2020, N=330). Prompted, multicode.
Source: Cross Platform Media Tracker 2020

6
6
Stopping viewing is the most common reaction among adults to seeing something that caused concern on-demand/online
Reaction following seeing something which caused concern on-demand/online: 2020
44%
17% 17%13% 11% 9%
1%
74%
Stopped viewing Told anotherfamily member
Told your friends Told someoneelse
Told your parents Complained/reported to a
third party body
Other Net: Any Action
All adults 16+
QL7 – And how have you generally reacted when you have seen something that caused you concern? In other words, what have you done?
Base: All who said they’d seen something of concern on any on-line or on-demand service (14% of adults who watch on-demand content) (331) . Prompted, multicode. Significance testing shows any difference between parents and non-parents in 2020.
Source: Cross Platform Media Tracker 2020
By comparison, adults who found something offensive on broadcast television were most likely to switch channel (47%), followed by
switch off/stop viewing (28%)
Of the 9% (n=33) who complained to a third party 9 people (34%) mentioned
Ofcom
7
7
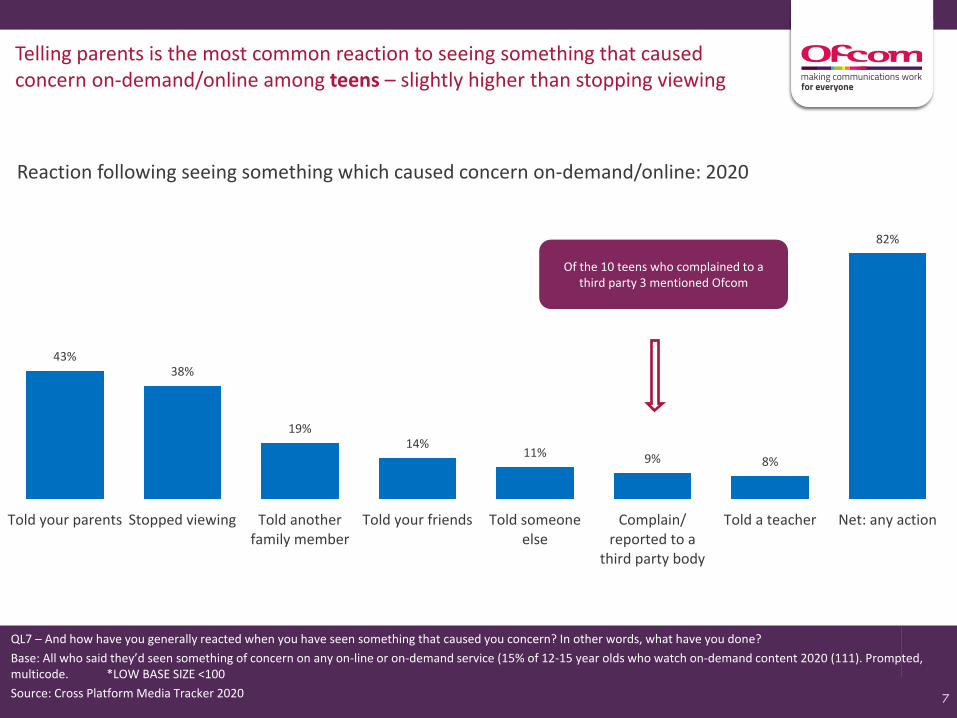
Telling parents is the most common reaction to seeing something that caused concern on-demand/online among teens – slightly higher than stopping viewing
Reaction following seeing something which caused concern on-demand/online: 2020
43%38%
19%14%
11% 9% 8%
82%
Told your parents Stopped viewing Told anotherfamily member
Told your friends Told someoneelse
Complain/reported to a
third party body
Told a teacher Net: any action
Of the 10 teens who complained to a third party 3 mentioned Ofcom
QL7 – And how have you generally reacted when you have seen something that caused you concern? In other words, what have you done?
Base: All who said they’d seen something of concern on any on-line or on-demand service (15% of 12-15 year olds who watch on-demand content 2020 (111). Prompted, multicode. *LOW BASE SIZE <100
Source: Cross Platform Media Tracker 2020

8
8
Around two in five adults think that all type of on-line/on-demand content should be regulated, however around half (49%) hold no strong opinion
How necessary people perceive regulation of on-demand/online TV/video content: 2020 and sub-groups
3% 3% 2% 2% 3% 2% 3% 3% 2% 2% 3%7% 9% 8% 5% 2% 7% 6% 9%
5% 8% 6%
49%52%
47% 51%48%
49% 49%50%
48%48% 50%
25%
26%
27% 24%
21%
27%23%
24%
27%28% 24%
16%10%
16% 18%26%
14%19%
14% 18% 14% 17%
2020 16-34 35-54 55-64 65+ ABC1 C2DE Male Female Parents Non-parents
5- This type ofcontent shouldbe highlyregulated
4
3
2
1- This type ofcontent shouldnot beregulated at all
41%
(2386) (2384) (2474) (661) (796) (375) (642) (1329) (1145) (1143) (1331) (618) (1856)
QM1 – Thinking about all the types of online/ on-demand TV or video content you are aware of, please can you say how much regulation there should be on a scale of 1 to 5.
Base: All respondents as indicated in chart. Prompted, single code. Significance testing shows any difference between 2018 and 2020, between any age group and all adults in 2020, between socio-economic groups, by gender and between parents and non-parents in 2020. Dashed line shows where survey method changed.
Source: Cross Platform Media Tracker 2020
9
9
More teens than adults feel that online/on-demand contents should be regulated (48% vs 41% adults), but as seen with adults, a significant proportion hold no strong opinion (43%)How necessary people perceive regulation of on-demand/online TV/video content: 2020 and sub-groups
3% 4% 3% 2% 1% 4% 3% 2%5% 3% 4%
7% 7% 5%5% 8%
3%
43%40%
49% 44%39%
40%
47% 40%46%
30%33%
30% 28%32% 34%
27%31% 29%
18% 20%16% 18% 20% 19% 17% 17% 19%
2020 12 13 14 15 ABC1 C2DE Male Female
5- This type ofcontent should behighly regulated
4
3
2
1- This type ofcontent should notbe regulated at all
(501) (517) (506) (126) (125) (130) (125) (316) (190) (256) (250)
48%
QM1 – Thinking about all the types of online/ on-demand TV or video content you are aware of, please can you say how much regulation there should be on a scale of 1 (this content should not be regulated at all) to 5 (this content should be highly regulated).
Base: All respondents as indicated in chart. Prompted, single code. Significance testing shows any difference between any age group and all 12-15 year olds in 2020, between socio-economic groups and by gender in 2020.
Source: Cross Platform Media Tracker 2020

10
10
Just under eight in ten adults think broadcast TV and catch up services are regulated Perceptions of regulation fall as you move away from broadcast towards video content on websites, such as YouTube
Awareness of regulation of on-demand/online content: 2020
78%
77%
69%
63%
62%
50%
30%
28%
TV programmes or films that have been broadcast using broadcastercatch-up services
TV live at the time of broadcast
Free Video On-Demand content available as part of your subscriptionthrough your TV service provider
TV, box sets or films from an online subscription service
Paid Video On-demand content available through your TV serviceprovider
TV, box sets or films from an online pay-per-view or download to ownservice
Longer videos through websites such as YouTube
Short clips through websites such as YouTube
QM2 – As far as you know, are each of the following online services regulated?
Base: All carrying out each viewing activity in the last 12 months (base on chart). Prompted, multicode.
Source: Cross Platform Media Tracker 2020

11
11
Similar perceptions around which services are regulated exist among teens and adults with around eight in ten teens believing broadcast TV services are regulated As seen with adults, perceptions of regulation falls the further you move away from broadcast towards video content on websites, such as YouTube
Awareness of regulation of on-demand/online content: 2020
82%
76%
74%
70%
66%
63%
23%
21%
TV live at the time of broadcasting
Paid video On demand content
TV programmes using catch up services
Free video On demand content
TV, box sets or films from an online subscription service
TV, box sets or films from an online pay-per-view subscription service
Longer videos through websites such as YouTube or Facebook
Short clips through websites such as YouTube or Facebook
QM2 – As far as you know, are each of the following online services regulated?
Base: All carrying out each viewing activity in the last 12 months (base on chart). Prompted, multicode.
*LOW BASE SIZE <100
Source: Cross Platform Media Tracker 2020

12
12
Ofcom achieves the most mentions among adults when respondents are asked who they think is responsible for regulating online and on demand content
Awareness of who is responsible for regulating on-demand/online content: 2020
33%28%
14%
8%4%
1%
34%
Ofcom/ Office ofCommunications
Broadcaster/channel/ station
The Government The internet serviceprovider (ISP)
The police Other Don't Know
Mentions of Ofcom are higher among the older age groups and higher social
grades. Whilst mentions of broadcasters are higher among younger adults (38%
mention broadcasters)
QM3 – Who do you think is responsible for regulating on-line and on-demand TV or video content we have been talking about? Unprompted.
Base: All respondents (2474)
Source: Cross Platform Media Tracker 2020

13
13
The majority of teens believe that the broadcasters/content providers are responsible for regulating online and on demand content
Awareness of who is responsible for regulating on-demand/online content: 2020
63%
38%33%
19%
8%
1%
12%
Broadcaster/channel/ station
Ofcom The Government The internet serviceprovider (ISP)
The police Other Don't Know
All adults 28%
All adults 33%
QM3 – Who do you think is responsible for regulating on-line and on-demand TV or video content we have been talking about? Unprompted.
Base: All respondents (506)
Source: Cross Platform Media Tracker 2020
14
14
The majority of adults think the amount of regulation is ‘about right’ across the various platforms and services, but this is lower for video content on websites, such as YouTube, compared to linear broadcasting or catch up services
Opinions on current level of on-demand/online regulation: 2020
5% 3% 5% 5% 6% 9% 9% 11%10%
8%10% 8%
14% 13%21% 22%
79% 80% 79% 78%70% 71%
62% 59%
7% 8% 7% 9% 10% 7% 8% 7%
TV Live at the time ofBroadcast
TV programmes orfilms that have been
broadcast usingbroadcaster catch-up
services
Free Video On-Demand content
available as part ofyour subscriptionthrough your TVservice provider
TV, box sets or filmsfrom an online
subscription service
Paid Video On-demandcontent availablethrough your TVservice provider
TV, box sets or filmsfrom an online pay-
per-view or downloadto own service
Short clips throughwebsites such as
YouTube
Longer videos throughwebsites such as
YouTube
Too much Too little About the right amount Don't know
(1340) (1182) (555) (259) (775) (140) (326) (252)
QM4 – Do you think the amount of regulation for each of the following is too much, too little or about the right amount?
Base: All who believe each on-demand/online service is regulated as indicated in chart.
Source: Cross Platform Media Tracker 2020
15
15
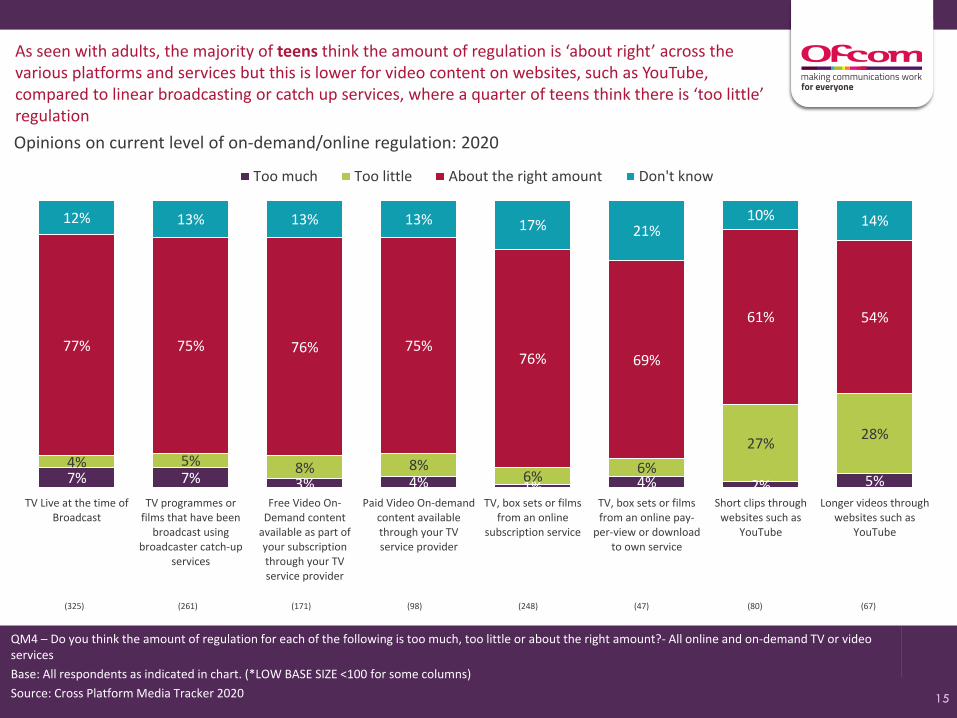
As seen with adults, the majority of teens think the amount of regulation is ‘about right’ across the various platforms and services but this is lower for video content on websites, such as YouTube, compared to linear broadcasting or catch up services, where a quarter of teens think there is ‘too little’ regulation
Opinions on current level of on-demand/online regulation: 2020
7% 7% 3% 4% 1% 4% 2% 5%4% 5% 8% 8%
6%6%
27%28%
77% 75% 76% 75%76% 69%
61% 54%
12% 13% 13% 13% 17% 21%10% 14%
TV Live at the time ofBroadcast
TV programmes orfilms that have been
broadcast usingbroadcaster catch-up
services
Free Video On-Demand content
available as part ofyour subscriptionthrough your TVservice provider
Paid Video On-demandcontent availablethrough your TVservice provider
TV, box sets or filmsfrom an online
subscription service
TV, box sets or filmsfrom an online pay-
per-view or downloadto own service
Short clips throughwebsites such as
YouTube
Longer videos throughwebsites such as
YouTube
Too much Too little About the right amount Don't know
QM4 – Do you think the amount of regulation for each of the following is too much, too little or about the right amount?- All online and on-demand TV or video services
Base: All respondents as indicated in chart. (*LOW BASE SIZE <100 for some columns)
Source: Cross Platform Media Tracker 2020
(325) (261) (171) (98) (248) (47) (80) (67)

16
16
Half of teens recall being asked their age to access on-demand/ online content
Recall of ‘being asked for age’ before accessing ODO content: 2020 sub-groups
53% 51%55% 54%
50%57%
49% 52% 53%
37% 39% 33%40%
36%
35%
38%39% 35%
11% 11% 12%5%
15%8%
13% 9% 12%
2020 12 13 14 15 ABC1 C2DE Male Female
Don't know
No
Yes
QM7 – When accessing online and on-demand TV or video content have you ever noticed being asked for your age before accessing content (e.g. by ticking a box to indicate you are over 16 or 18)?
Base: All respondents who have watched anything on-demand/online in the last 12 months as shown on chart. Prompted, single code. Significance testing shows any difference between any age group and all 12-15 year olds in 2020, between socio-economic groups and by gender in 2020.
Source: Cross Platform Media Tracker 2020
(501) (125) (124) (129) (123) (313) (188) (256) (245)
17
17
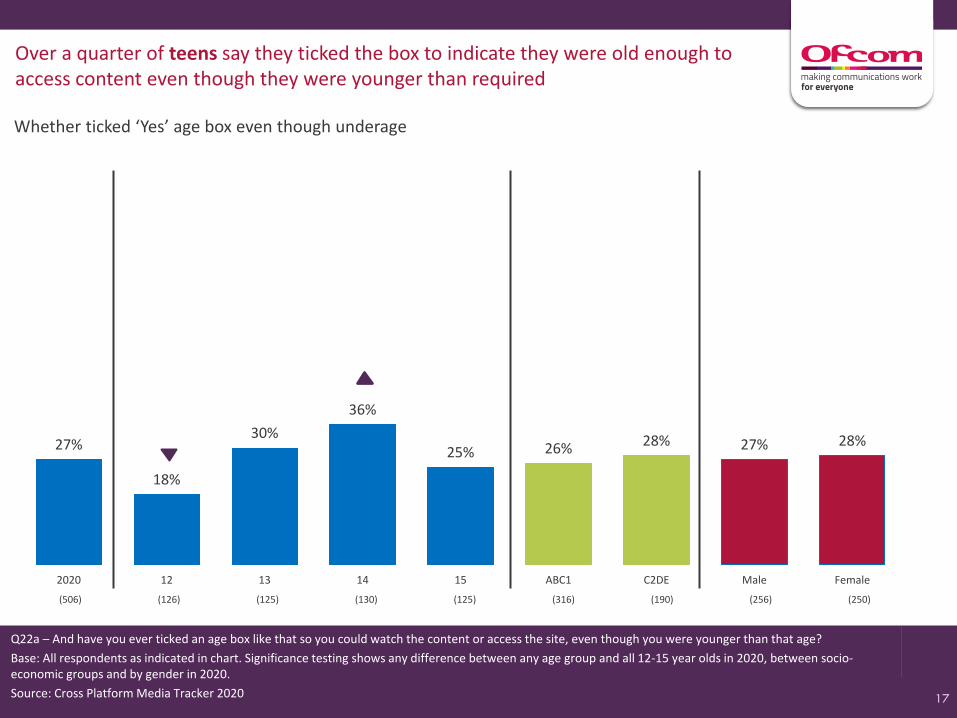
Over a quarter of teens say they ticked the box to indicate they were old enough to access content even though they were younger than required
Whether ticked ‘Yes’ age box even though underage
27%
18%
30%
36%
25% 26% 28% 27% 28%
2020 12 13 14 15 ABC1 C2DE Male Female
(506) (126) (125) (130) (125) (316) (190) (256) (250)
Q22a – And have you ever ticked an age box like that so you could watch the content or access the site, even though you were younger than that age?
Base: All respondents as indicated in chart. Significance testing shows any difference between any age group and all 12-15 year olds in 2020, between socio-economic groups and by gender in 2020.
Source: Cross Platform Media Tracker 2020

18PROMOTING CHOICE • SECURING STANDARDS • PREVENTING HARM
Cross Platform Media Tracker 2020Audience Attitudes to Programme StandardsProduced by: BVA BDRC
Fieldwork: January-March & October-December 2020

19PROMOTING CHOICE • SECURING STANDARDS • PREVENTING HARM
Methodology: adults
Sample• 2,474 adults aged 16+ in the UK• Quotas set on gender, age, and socio-economic group using Census data for each Primary Sampling Unit
(PSU) covered for CAPI interviewing; as well as on working status, household size, children in household, ethnicity, disability and urbanity for online. The telephone interviews specifically targeted the 13% of UK adults who are not online and aimed for a profile broadly representative of this group.
Data Collection• Mixed method: 83% online / 11% CATI respondents / 6% CAPI face-to-face interviews• Conducted by BVA BDRC• Fieldwork conducted in Q1 and Q4 2020. Fieldwork paused from end of March through September due to
the Covid-19 pandemic • Changes in the interview method in 2008, 2014, 2017 and 2020 are shown with a dashed line
Data Reporting• Weighted to be nationally representative of the UK, and an overall weight applied to re-balance the
contribution of each methodology (further detail on following slide)• Total 2020 data tested against 2018 data for any statistically significant differences • Sub-group data is from 2020 only – with measures for individual age groups tested against the total adults
measure• Testing also conducted between socio-economic groups (ABC1/C2DE), by gender and between parents
and non-parents
20PROMOTING CHOICE • SECURING STANDARDS • PREVENTING HARM
As a result of the change in approach in 2020 involving different proportions of the existing methodologies and the introduction of a new methodology, analysis was conducted to assess how best to combine and weight the data from the three methods to best provide consistency with the normal approach and thus allow trends to be tracked. A re-balancing of the contribution by method of 67% for online, 10% for CATI respondents and 23% CAPI face-to-face.
These proportions were determined on the principle of adjusting the contributions to be as close to the 50:50 online versus non-online methodology as collected historically as possible, while maintaining an acceptable weighting efficiency, on the basis that this best approximates the historic and anticipated future approach, thus retaining as much ability to track year-to-year while limiting the impact on the robustness of the data.
2020 adults weighting
21PROMOTING CHOICE • SECURING STANDARDS • PREVENTING HARM
Methodology: children aged 12-15
Sample• 506 children aged 12-15 in the UK• Quotas set on gender, age and SEG
Data Collection• Online interviews• Conducted by BVA BDRC• Fieldwork conducted in Q1 and Q4 2020. Fieldwork paused from end of March through September due to
the Covid-19 pandemic
Data Reporting• Weighted to be nationally representative of 12-15 year olds in the UK• 2020 data tested against 2018 data where available for any statistically significant differences • Sub-group data is from 2020 only – with measures for individual age groups tested against the total 12-15
year olds measure• Testing also conducted between socio-economic groups and gender• Significance testing applied at the 95% confidence level