Embed Size (px)
Citation preview
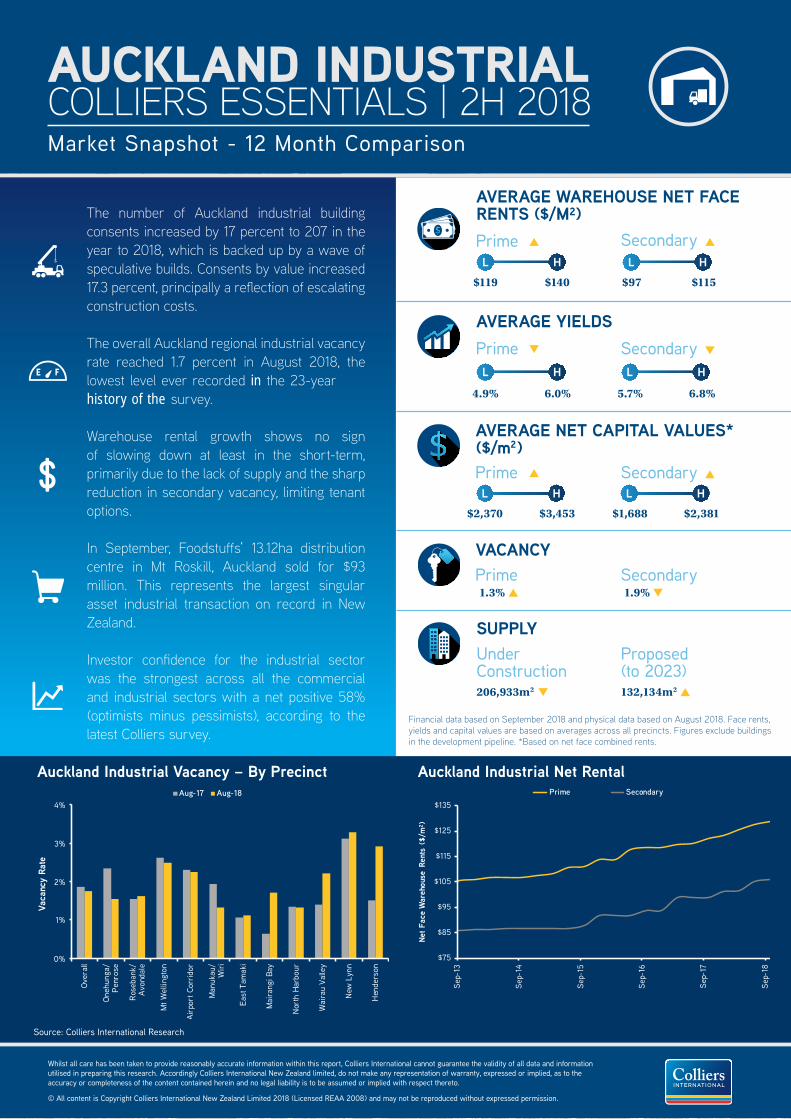
AUCKLAND INDUSTRIALCOLLIERS ESSENTIALS | 2H 2018Market Snapshot - 12 Month Comparison
Source: Colliers International Research
Auckland Industrial Net Rental
Whilst all care has been taken to provide reasonably accurate information within this report, Colliers International cannot guarantee the validity of all data and information utilised in preparing this research. Accordingly Colliers International New Zealand limited, do not make any representation of warranty, expressed or implied, as to the accuracy or completeness of the content contained herein and no legal liability is to be assumed or implied with respect thereto.
© All content is Copyright Colliers International New Zealand Limited 2018 (Licensed REAA 2008) and may not be reproduced without expressed permission.
The number of Auckland industrial building consents increased by 17 percent to 207 in the year to 2018, which is backed up by a wave of speculative builds. Consents by value increased 17.3 percent, principally a reflection of escalating construction costs.
Warehouse rental growth shows no sign of slowing down at least in the short-term, primarily due to the lack of supply and the sharp reduction in secondary vacancy, limiting tenant options.
In September, Foodstuffs’ 13.12ha distribution centre in Mt Roskill, Auckland sold for $93 million. This represents the largest singular asset industrial transaction on record in New Zealand.
Investor confidence for the industrial sector was the strongest across all the commercial and industrial sectors with a net positive 58% (optimists minus pessimists), according to the latest Colliers survey.
SUPPLYUnder Construction206,933m2
Proposed (to 2023)132,134m2
VACANCYPrime1.3%
Secondary1.9%
AVERAGE WAREHOUSE NET FACE RENTS ($/M²)
$119 $97$140 $115
Prime
Prime
Prime
Secondary
Secondary
Secondary
AVERAGE YIELDS
4.9% 5.7%6.0% 6.8%
AVERAGE NET CAPITAL VALUES* ($/m2)
$2,370 $1,688$3,453 $2,381
Auckland Industrial Vacancy – By Precinct
Financial data based on September 2018 and physical data based on August 2018. Face rents, yields and capital values are based on averages across all precincts. Figures exclude buildings in the development pipeline. *Based on net face combined rents.
L H
L H
L H
L H
L H
L H
$75
$85
$95
$105
$115
$125
$135
Sep-
13
Sep-
14
Sep-
15
Sep-
16
Sep-
17
Sep-
18
Net F
ace
War
ehou
se R
ents
($/
m²)
Prime Secondary
0%
1%
2%
3%
4%
Over
all
Oneh
unga
/Pe
nros
e
Rose
bank
/A
vond
ale
Mt W
ellin
gton
Airp
ort C
orrid
or
Man
ukau
/W
iri
East
Tam
aki
Mai
rang
i Bay
Nor
th H
arbo
ur
Wai
rau
Valle
y
New
Lyn
n
Hen
ders
on
Vaca
ncy
Rate
Aug-17 Aug-18
The overall Auckland regional industrial vacancy rate reached 1.7 percent in August 2018, the lowest level ever recorded in the 23-year history of the survey.
16
18
20
NO
RTHERN MW
Y
UPPER HARBOUR M
WY
SOUTH WESTERN MWY
NO
RTH WESTERN MWY
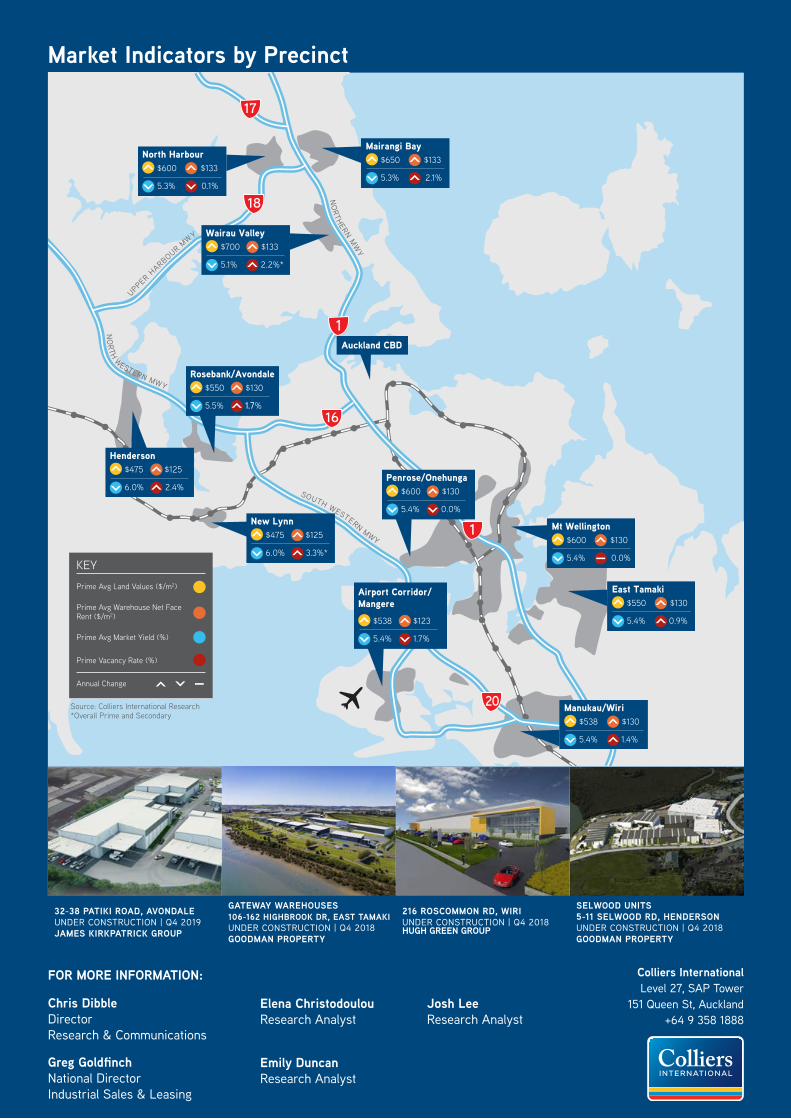
Mairangi Bay$650 $133
5.3% 2.1%
East Tamaki$550 $130
5.4% 0.9%
Manukau/Wiri$538 $130
5.4% 1.4%
Mt Wellington$600 $130
5.4% 0.0%
North Harbour$600 $133
5.3% 0.1%
Wairau Valley$700 $133
5.1% 2.2%*
Henderson$475 $125
6.0% 2.4%
New Lynn$475 $125
6.0% 3.3%*
Rosebank/Avondale
Penrose/Onehunga$600 $130
5.4% 0.0%
Airport Corridor/ Mangere
$538 $123
5.4% 1.7%
Auckland CBD
17
Source: Colliers International Research*Overall Prime and Secondary
KEY
Prime Avg Land Values ($/m2)
Prime Avg Warehouse Net Face Rent ($/m2)
Prime Avg Market Yield (%)
Prime Vacancy Rate (%)
Annual Change
32-38 PATIKI ROAD, AVONDALE UNDER CONSTRUCTION | Q4 2019 JAMES KIRKPATRICK GROUP
GATEWAY WAREHOUSES 106-162 HIGHBROOK DR, EAST TAMAKI UNDER CONSTRUCTION | Q4 2018 GOODMAN PROPERTY
SELWOOD UNITS 5-11 SELWOOD RD, HENDERSON UNDER CONSTRUCTION | Q4 2018 GOODMAN PROPERTY
FOR MORE INFORMATION:
Chris DibbleDirector Research & Communications
Greg Goldfinch National DirectorIndustrial Sales & Leasing
Elena Christodoulou Research Analyst
Emily Duncan Research Analyst
Josh LeeResearch Analyst
Colliers InternationalLevel 27, SAP Tower
151 Queen St, Auckland +64 9 358 1888
Market Indicators by Precinct
216 ROSCOMMON RD, WIRI UNDER CONSTRUCTION | Q4 2018 HUGH GREEN GROUP
$550 $130
5.5% 1.7%