Embed Size (px)
Citation preview

Auckland Regional Land Transport Plan 2015 - 2025

2 Auckland Regional Land Transport Plan 2015-2025
INTRODUCTION FROM THE CHAIRMAN
The compelling narrative for the next 10 years in Auckland is one of growth and how we appropriately respond to that growth. Auckland is already New Zealand’s largest city by far, and the powerhouse of its economy. With Auckland set to grow by around 270,000 people over the next 10 years, the transport needs of its commuters, businesses, students and visitors will grow in parallel.
The key organisations responsible for delivering transport infrastructure and services in Auckland – Auckland Transport, KiwiRail, and the NZ Transport Agency need to respond to this challenge:
• We need to be bold – as an exemplar, introduction of the electric trains has vastly improved the customer experience for public transport at the same time as helping keep cars off the road. As with the introduction of electric trains, the City Rail Link will address many issues at once, further helping to unlock the potential of Auckland.
• We need to be innovative – yesterday's thinking will not solve tomorrow's problems.
• We need to ruthlessly drive efficiencies to get the most from every dollar.
• We need to work even more closely and collaboratively together, pooling our talents and resources.
• We need to put Aucklanders, our customers, at the heart of every decision.
The overwhelming public response to consultation on Auckland Council’s draft Long-term Plan and the draft Regional Land Transport Plan show that Aucklanders agree that transport infrastructure is crucial for meeting the growth challenges Auckland is facing. In response, Auckland Council has introduced an Interim Transport Levy to provide increased funding for transport projects over the next three years. The NZ Transport Agency will co-invest in many of these projects. Walking and cycling projects will be supported by the Ministry of Transport’s $90m Urban Cycleways Fund, and the council has announced further funding for transport projects in Special Housing Areas, which can be funded using development contributions.
This final RLTP sets out a programme of transport improvements for Auckland that will make real progress towards reducing congestion, improving freight reliability and increasing the attractiveness of public transport travel, including:
• Completion of the Waterview connection
• Starting the City Rail Link
• Supporting the successful roll out of the new public transport network by building transport inter-changes in Manukau, Pukekohe, Otahuhu, Silverdale and Te Atatu
• Planning and land purchase for key arterial routes including the East-West Connections and the North-western Busway
• Significant investment in improving road safety and efficient movement of people, services and goods
• A significant increase in walking and cycling investment
• Additional sealing of rural roads
• Investigation of light rail transit.
I’m excited about the challenges ahead, and the real difference that we can make to the lives of people living, working and studying in Auckland.
Dr Lester Levy, CNZM Chairman, Regional Transport Committee

3Auckland Regional Land Transport Plan 2015-2025

4 Auckland Regional Land Transport Plan 2015-2025

5Auckland Regional Land Transport Plan 2015-2025
TABLE OF CONTENTS
Introduction from the Chairman .............................................................................2
1. Executive Summary .............................................................................................6
2. Feedback from Consultation ............................................................................10
3. Context ...............................................................................................................16
4. Process Used to Develop this RLTP..................................................................21
5. Overview .............................................................................................................38
6. State highways ...................................................................................................40
7. Arterial and local roads .....................................................................................47
8. Public Transport .................................................................................................61
9. Supporting Auckland's Growth and Intensification ........................................79
10. Walking, Cycling and Travel Demand Management ....................................84
11. Safety ................................................................................................................95
12. Parking and enforcement ..............................................................................100
13. Transport Planning .........................................................................................103
14. Monitoring and Review .................................................................................106
15. Looking Forward ............................................................................................111
16. Prioritised list of projects ..............................................................................112
Appendix 1: Legislative Requirements ..............................................................117
Appendix 2: Prioritisation Methodology ...........................................................121
Appendix 3: Significance Policy .........................................................................130
Glossary ................................................................................................................133
Bibliography .........................................................................................................135
End notes .............................................................................................................137

6 Auckland Regional Land Transport Plan 2015-2025
1. EXECUTIVE SUMMARY
One thing is certain about Auckland's future – Auckland is going to grow. Its population will increase, along with its economy and the expectations of its many people and businesses. Auckland's population grew by the equivalent of Tauranga between 2006 and 2013 and this rate of growth will increase. Auckland's economy will grow faster than the rest of New Zealand and the performance of key infrastructure, such as its airport and port, will be a key determinant of New Zealand's growth potential. Visitor numbers will rise significantly and almost half of all tertiary students in New Zealand will study in Auckland.
The Regional Land Transport Plan (RLTP) forms part of the National Land Transport Programme and represents the combined intentions of the NZ Transport Agency (the Transport Agency), Auckland Transport (AT), and KiwiRail to respond to growth and other challenges facing Auckland in the next 10 years.
The plan builds on a strong base:
• Recent and on-going service improvements such as the Western Ring Route, new electric trains and the progressive roll out of the Auckland-Manukau Eastern Transport Initiative (AMETI) programme will improve Auckland's liveability for commuters and aid the movement of freight.
• There is a high degree of certainty on which to base planning. The Government Policy Statement for Land Transport has been confirmed. The Transport Agency has now completed the National Land Transport Programme. There is an Auckland Plan with considerable discussion of transport and growth matters and the Board of Auckland Transport has recently set its strategic priorities.
• The Transport Agency’s and Auckland Transport’s infrastructure is already in place and being maintained to an adequate standard with relatively small backlogs of deferred maintenance in the next three years of the plan.
• Aucklanders are shifting to public transport in record numbers, relieving road congestion and allowing population growth to be accommodated without a proportional need to increase the road network.
• Auckland's walking and cycling network is undergoing rapid development with a commitment to continue to extend this in the future.
This RLTP highlights the many things the three agencies need to deliver in order to achieve Auckland's potential. With constrained funding, the way in which initiatives are prioritised and the integration of the whole plan are vital to success.
The currently funded 10-year plan will deliver:
• An additional 45km of bus lanes (including the airport route, Ellerslie-Panmure Highway, Pakuranga Road, Ti Rakau Drive, parts of Great South Road and Great North Road, Greenlane West, Mt Eden Road, Manukau Road and Remuera Road)
• Double decker buses enabled on 42km of the frequent bus network
• Essential New Network infrastructure completed – interchanges at Otahuhu, Manukau, Te Atatu, Pukekohe and Silverdale
• Park-and-ride extensions at Silverdale and Papakura, replacement facilities at Glen Eden and Hobsonville
• 600 bus stops
• 52.4km of the Auckland Cycle Network
• A $4 million contribution towards local board walking and cycling initiatives (including greenways)
• $4.5 million for new footpaths around the region
• The completion of already committed projects, e.g. the Albany Highway Upgrade
• Local road initiatives that integrate and optimise state highway and other recent investments (e.g. Te Atatu Corridor delivered by 2017 to support the Western Ring Route), and improvements to intersections on Kirkbride Road to complement work under way to improve the motorway connection to the airport.

7Auckland Regional Land Transport Plan 2015-2025
•
8 Auckland Regional Land Transport Plan 2015-2025
• Route optimisation/network operating plan initiatives including 30 minor network efficiency improvements by 2018 and implementation of other efficiency interventions such as dynamic traffic lanes
• $5.7 million invested in public transport safety and security improvements (fencing, gating, CCTV etc)
• $69 million of investment in the AMETI and East West Connections projects.
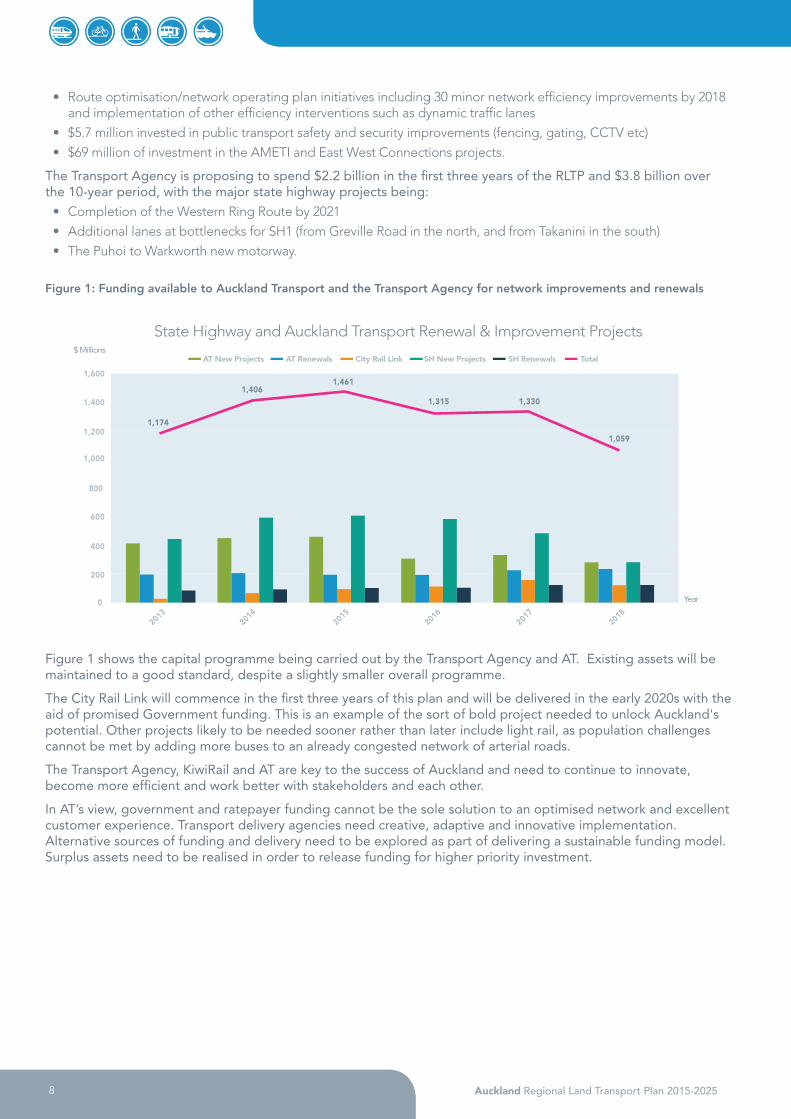
The Transport Agency is proposing to spend $2.2 billion in the first three years of the RLTP and $3.8 billion over the 10-year period, with the major state highway projects being:
• Completion of the Western Ring Route by 2021
• Additional lanes at bottlenecks for SH1 (from Greville Road in the north, and from Takanini in the south)
• The Puhoi to Warkworth new motorway.
Figure 1: Funding available to Auckland Transport and the Transport Agency for network improvements and renewals
Figure 1 shows the capital programme being carried out by the Transport Agency and AT. Existing assets will be maintained to a good standard, despite a slightly smaller overall programme.
The City Rail Link will commence in the first three years of this plan and will be delivered in the early 2020s with the aid of promised Government funding. This is an example of the sort of bold project needed to unlock Auckland's potential. Other projects likely to be needed sooner rather than later include light rail, as population challenges cannot be met by adding more buses to an already congested network of arterial roads.
The Transport Agency, KiwiRail and AT are key to the success of Auckland and need to continue to innovate, become more efficient and work better with stakeholders and each other.
In AT’s view, government and ratepayer funding cannot be the sole solution to an optimised network and excellent customer experience. Transport delivery agencies need creative, adaptive and innovative implementation. Alternative sources of funding and delivery need to be explored as part of delivering a sustainable funding model. Surplus assets need to be realised in order to release funding for higher priority investment.
AT New Projects AT Renewals City Rail Link SH New Projects SH Renewals Total$ Millions
Year
State Highway and Auckland Transport Renewal & Improvement Projects
1,200
1,400
1,174
1,4061,461
1,059
1,600
1,000
800
600
400
200
0
2013
2014
2015
2016
2017
2018
1,315 1,330
9Auckland Regional Land Transport Plan 2015-2025
1.1 Prioritisation to optimise the funding available
1.1.1 Prioritisation methodology There are always more transport projects needed than there is money to fund them, so a critical part of preparing the RLTP is prioritising all projects proposed by the Transport Agency's Highway and Network Operations division and AT.
A prioritisation process was developed collaboratively by AT and the Transport Agency to enable a fair assessment of the priority of projects. Around 1,000 projects were assessed.
The prioritisation process works like a sieve, grading each project according to strategic fit, effectiveness and efficiency, with only the very best schemes passing through all the prioritisation sieving layers to be entered into the programme. Those projects not being proceeded with are not discarded. They are placed in a holding pen for subsequent consideration in the light of changed circumstances.
The prioritisation process considers the merits of projects according to three criteria: strategic fit, effectiveness and efficiency. These are discussed further in Section 4.6 – Prioritisation and ranking. The prioritised list is then used to develop a strategically aligned, optimised programme that is deliverable and represents value for money.
Non-discretionary activities are included in the programme without being prioritised:
• Contractual commitments such as the purchase of electric trains, or the completion of projects already under construction.
• Maintaining the existing level of public transport service (but note that significant changes to existing services are proposed in the public transport New Network).
• Maintenance and renewals of local roads and state highways.
• Minor safety projects, local board improvements and replacement of essential assets.
Non-discretionary projects are not exempt from scrutiny: preparation of this RLTP has included work to confirm that these non-discretionary activities are being delivered efficiently and effectively, and represent value for money.
There will be another round of prioritisation and ranking of projects for the next RLTP in 2018, consequently this plan considers the first three years of the programme in greatest detail.
The results of prioritisation can be found in Chapter 16 in the ranked list of projects.

10 Auckland Regional Land Transport Plan 2015-2025
2. FEEDBACK FROM CONSULTATION
Over 27,000 written submissions were received on the draft Long-term Plan (LTP) and draft RLTP. Over 1,000 Aucklanders attended public meetings to share their views in person and 1,354 submissions were received through social media. In addition to the use of social media, Have Your Say and community engagement events were held, there was an online interactive forum, and public awareness events (such as the Transport Lanes outside Britomart).
A significant number of comments in submissions related to transport issues. The size of the transport programme and how it is funded were key issues highlighted in Auckland Council’s consultation on the LTP, and this is reflected in the more than 91,000 comments coming through on transport issues.
Changes to the Land Transport Management Act (LTMA) mean that formal hearings on the RLTP are no longer required. However, the Regional Transport Committee (RTC) decided to hold a two-day Transport Event in March, at which 30 key stakeholders and local board chairs presented. Iwi were invited to attend hui on 27 February and 12 March 2015.
The high-level key themes coming through in consultation were:
• Aucklanders want public transport, but it has to be convenient, reliable and quicker
• Aucklanders want to walk and cycle but it has to be safe
• Aucklanders want better transport but have mixed views on how to raise the additional investment required
• Aucklanders want current funding to be reallocated more favourably towards public transport, walking and cycling.
In response to consultation feedback, Auckland Council has agreed to establish a three-year Interim Transport Levy, which provides the funding necessary for AT to deliver the proposed transport programme. Auckland Council has also agreed to establish a Local Residential Growth Fund, and to provide a ring-fenced budget (funded via development contributions) for arterial roads in the Drury South growth area.
The following table summarises how the transport programme aligns with the key issues raised during public consultation.
11Auckland Regional Land Transport Plan 2015-2025
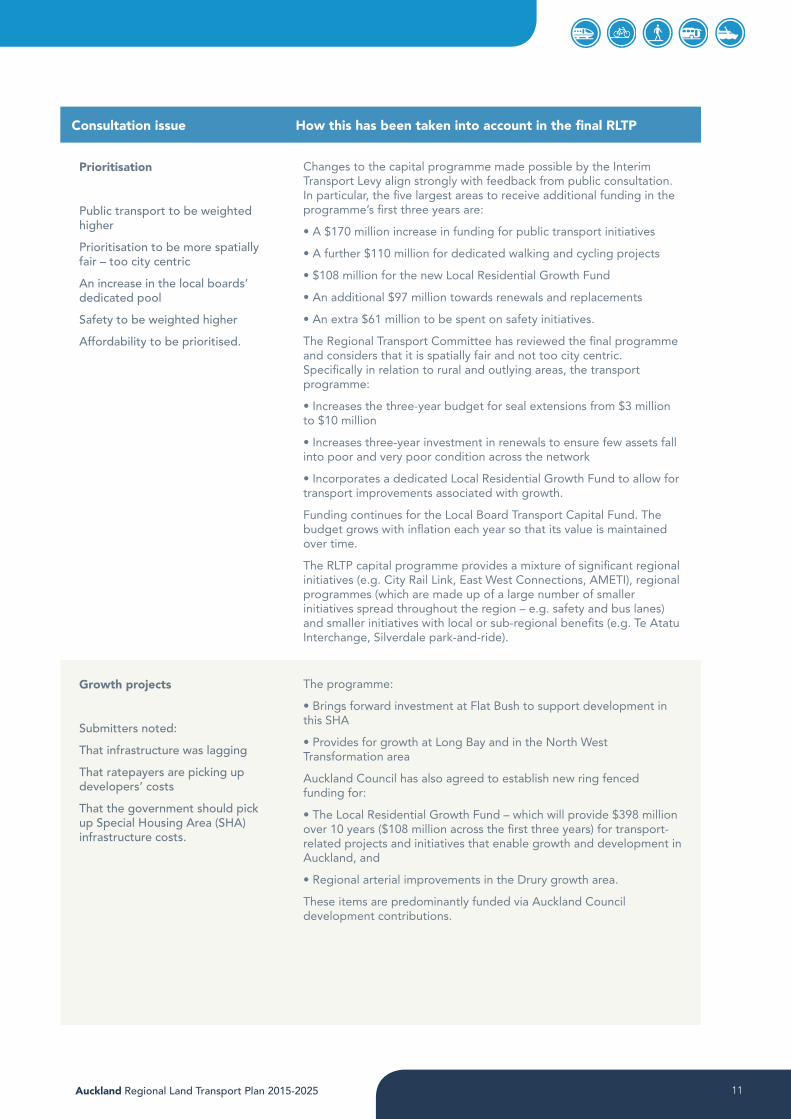
Consultation issue How this has been taken into account in the final RLTP
Prioritisation
Public transport to be weighted higher
Prioritisation to be more spatially fair – too city centric
An increase in the local boards’ dedicated pool
Safety to be weighted higher
Affordability to be prioritised.
Changes to the capital programme made possible by the Interim Transport Levy align strongly with feedback from public consultation. In particular, the five largest areas to receive additional funding in the programme’s first three years are:
• A $170 million increase in funding for public transport initiatives
• A further $110 million for dedicated walking and cycling projects
• $108 million for the new Local Residential Growth Fund
• An additional $97 million towards renewals and replacements
• An extra $61 million to be spent on safety initiatives.
The Regional Transport Committee has reviewed the final programme and considers that it is spatially fair and not too city centric. Specifically in relation to rural and outlying areas, the transport programme:
• Increases the three-year budget for seal extensions from $3 million to $10 million
• Increases three-year investment in renewals to ensure few assets fall into poor and very poor condition across the network
• Incorporates a dedicated Local Residential Growth Fund to allow for transport improvements associated with growth.
Funding continues for the Local Board Transport Capital Fund. The budget grows with inflation each year so that its value is maintained over time.
The RLTP capital programme provides a mixture of significant regional initiatives (e.g. City Rail Link, East West Connections, AMETI), regional programmes (which are made up of a large number of smaller initiatives spread throughout the region – e.g. safety and bus lanes) and smaller initiatives with local or sub-regional benefits (e.g. Te Atatu Interchange, Silverdale park-and-ride).
Growth projects
Submitters noted:
That infrastructure was lagging
That ratepayers are picking up developers’ costs
That the government should pick up Special Housing Area (SHA) infrastructure costs.
The programme:
• Brings forward investment at Flat Bush to support development in this SHA
• Provides for growth at Long Bay and in the North West Transformation area
Auckland Council has also agreed to establish new ring fenced funding for:
• The Local Residential Growth Fund – which will provide $398 million over 10 years ($108 million across the first three years) for transport-related projects and initiatives that enable growth and development in Auckland, and
• Regional arterial improvements in the Drury growth area.
These items are predominantly funded via Auckland Council development contributions.

12 Auckland Regional Land Transport Plan 2015-2025
Consultation issue How this has been taken into account in the final RLTP
Achieving Ma ori outcomes
Mana Whenua want to achieve:
A good relationship with AT
AT to recognise Te Ao Ma ori (the Ma ori world view)
A set of overarching principles for Te Ao Ma ori
The Mauri Model method (Ma ori values) reflected in prioritisation.
Improved criteria relating to the achievement of Ma ori outcomes have been incorporated into the prioritisation system.
Public transport
Consultation feedback requested:
More frequent, reliable, cheaper services
More bus lanes
Bus and rail interchanges
More public transport routes – bus, train, ferry
Safer rail level crossings.
Feedback on the City Rail Link was mixed – with some support and some opposition.
Significant support for light rail or tram investigation.
The programme:
Brings forward the essential public transport interchanges required for the New Network. This will allow services to be restructured to reduce duplication, increase frequency and improve overall network efficiency
Improves public transport reliability by:
• bringing forward investment in bus lanes
• eliminating the Newmarket Level Crossing (Sarawia Street)
Provides for safer level crossings by:
• eliminating the Newmarket Level Crossing by 2017
• providing dedicated funding in all years for public transport safety and security improvements, which amongst other things will be used for rail safety improvements
• providing dedicated but limited funding from 2020 towards the removal and improvement of rail level crossings.
The City Rail Link is included within the programme.
Funding to continue investigating light rail is provided for within the operating costs outlined in this RLTP.
Park-and-ride facilities
Strong support for more
Minority thought unnecessary if better bus feeder services available
Important on edge of built up areas.
The programme provides park-and-ride:
• Extensions at Silverdale and Papakura
• Replacement facilities at Glen Eden and Hobsonville
• A new facility at Westgate
• A new facility at Pukekohe (constructed as part of the new Pukekohe Interchange).

13Auckland Regional Land Transport Plan 2015-2025
Consultation issue How this has been taken into account in the final RLTP
Walking and cycling
Key messages included:
Footpaths – access to local facilities, connected and safe
New cycling infrastructure – connected, safer, off-road or separated
Cycle facilities at park-and-rides
Cycle and walkways – shorter journey options
Cycling and walking access across the Harbour Bridge
Additional funding – maximise Urban Cycleways Fund
The programme provides over $100 million for dedicated AT walking and cycling initiatives over the 2015/16 to 2017/18 period. This will provide:
• 52.4km of the Auckland Cycle Network
• $4.5 million for new footpaths across the region
• $3 million towards local walking and cycling initiatives
• Significantly improved walking and cycling access to public transport.
The programme provides over $50 million for dedicated Transport Agency walking and cycling initiatives over the 2015/16 to 2017/18 period.
Roading projects
Submitters:
Supported their local major road improvement
Were concerned about predictions showing slowing average speeds
Were concerned about major projects being delayed.
The first three years of the programme focuses on:
• Completing committed projects – e.g. Albany Highway
• Bringing forward initiatives that integrate and optimise state highway and other recent investments – e.g. Te Atatu Corridor
• Investing in network efficiency and route optimisation improvements across the region – e.g. minor improvements and dynamic traffic lanes.
2.1 Feedback from local boardsSome local boards reflected a view that local board aspirations, as shown in their Local Board Plans, were not adequately reflected in the project lists included with the RLTP. However, there are structural barriers to a direct connection between Local Board Plans and the RLTP. First, AT’s primary reporting relationship is to the Governing Body, through the Letter of Expectation and the Statement of Intent (SOI), and accordingly it is the Governing Body’s priorities that are most strongly reflected in the RLTP. Second, the prioritisation tool used to analyse projects for inclusion in the RLTP does not give specific weight to local aspirations, but is primarily based on technical criteria, considering ‘transport need’ on a regional basis.
Notwithstanding, Local Board Plans are strongly supportive of many of the strategic initiatives that AT is undertaking, including the extensive improvements being undertaken in both the rail and bus networks, and the emphasis being placed on walking and cycling. The main area of difference here is that local boards generally are seeking more to happen, and more quickly, than AT is able to deliver. In addition, there are a number of locally cherished roading initiatives which have not attracted sufficient priority under the prioritisation process.
The Local Board Transport Capital Fund (LBTCF) gives local boards the ability to fund minor works directly, in response to public concern or local aspirations. Some local boards have been slow to realise the potential of this fund, and may have difficulty spending their allocation during their current term in office. However, local boards that have actively sought to progress programmes funded by the LBTCF have been able to deliver many dozens of minor projects and infrastructure consistent with their Local Board Plans.

14 Auckland Regional Land Transport Plan 2015-2025
AUCKLAND'S TRANSPORTPOLICY IN DETAIL

15Auckland Regional Land Transport Plan 2015-2025

16 Auckland Regional Land Transport Plan 2015-2025
3. CONTEXT
3.1 The purpose of the RLTP This RLTP sets out an investment programme for Auckland which maintains the momentum of transport improvements seen in the last four years, to the extent possible within current funding constraints.
All publicly funded land transport activities in Auckland are included in this RLTP, including:
• The road network, including state highways
• Footpaths and cycleways, which are usually but not always beside roads
• Road safety activities delivered in partnership by AT, the Transport Agency and the NZ Police
• Public transport (bus, rail and ferry) services
• Improvements to bus stops, rail stations and ferry wharves, and the creation of transport interchanges and park-and-ride facilities
• Management and improvement of rail track infrastructure by KiwiRail
• Parking provision and enforcement activities
• Transport planning.
Information about these activities is provided in detail for the three years 2015/16 to 2017/18, and in outline for the seven years 2018/19 to 2024/25.
The Regional Transport Committee (RTC) will review this RLTP in 2018 and will consult again on a revised 10-year programme.
3.2 Transport strategy in AucklandTransport strategy in Auckland is potentially complex. The three delivery agencies each have their own priorities which, while consistent, create the potential for misalignment. At the highest level, the Auckland Plan drives the allocation of council funding while the GPS sets the investment platform for government investment. A number of sub-strategies also exist, including Auckland’s Parking Strategy and the Upper North Island Freight Strategy.
However, all funding decisions and delivery agencies are aligned toward the need to address:
• Growth: infrastructure is required to support Auckland’s increase in new housing, jobs, student numbers and tourists.
• Congestion: long-standing issues with traffic flows will only get worse as Auckland grows. Public transport is one dimension but investment to support freight movement and improve key road corridors is needed.
• Business as usual: a large stock of existing infrastructure investments needs to be maintained, and safety and environmental factors kept to the fore.
These outcomes are all measured as part of this RLTP. The following section outlines the priorities contained in the suite of existing policy. It also lays out how a prioritisation matrix and investment logic map have been used to inform the allocation of resources and choice of projects over the 10-year life of the plan.
3.3 The Auckland Plan The Auckland Plan outlines how Auckland will grow and change to accommodate an estimated one million more people over the next 30 years. It sets out a vision of Auckland as the world's most liveable city, and describes the outcomes needed to achieve this vision by 2040, highlighting six transformational shifts where a step-change is needed, as shown in Figure 2.

17Auckland Regional Land Transport Plan 2015-2025
Figure 2: Auckland Plan vision, outcomes and transformational shifts
Transformational Shifts: to Achieve the Vision
Move to outstanding
public transport within
on network
Radically improve the quality
of urban living
Substantially raise living
standards for all Aucklanders and focus on those most
in need
Significantly lift Maori social and economic
well-being
Outcomes: What the Vision Means in 2040
A fair, safe and healthy Auckland
A green Auckland
An Auckland of prosperityand opportunity
A well connected and accesible Auckland
A beautiful Auckland that is loved by its people
A culturally rich and creative Auckland
A Maori identity that is Auckland’s point of difference in the world
Dramatically accelerate the prospects of Auckland’s
children and young people
Strongly commit to environmental action and green
growth
THE WORLD’S MOST LIVEABLE CITY
AUCKLAND’S VISION
Two of the six transformational shifts, the move to outstanding public transport and radically improving the quality of urban living, relate most closely to transport and can be seen as enablers of the other transformations.
To deliver a well-connected and accessible Auckland, the Auckland Plan sets out four transport priorities:
• Manage Auckland's transport as a single system
• Integrate transport planning and investment with land use development
• Prioritise and optimise investment across transport modes
• Implement new transport funding mechanisms.
This RLTP supports the Auckland Plan by setting out the transport investment programme and supporting strategies for delivering the Auckland Plan's strategic direction over the next 10 years. A key task for the RLTP is the prioritisation of transport expenditure, particularly where insufficient funding is available. Alignment with the Auckland Plan's strategic direction is a central part of how transport projects have been prioritised for inclusion in this RLTP, as discussed in Section 4.6.
3.4 Government Policy Statement on Land Transport The investment programme set out in this RLTP is designed to give effect to the transport components of the Auckland Plan, and is consistent with the GPS. The GPS sets out the government's priorities, objectives and funding levels for land transport, establishes funding ranges for land transport activity classes, and identifies the results expected from this investment.
The GPS 2015 was issued by the Minister of Transport on 18 December 2014. It proposes to continue the three key priorities from GPS 2012:
• A strong and continuing focus on economic growth and productivity: the government proposes to continue sup-porting improvements which are expected to bring benefits for national economic growth and productivity. (1)
• Road safety: the GPS 2015 continues to support the delivery of the Safer Journeys vision of a safe road system

18 Auckland Regional Land Transport Plan 2015-2025
increasingly free of death and serious injury.
• Value-for-money: a land transport system that is effective in enabling the movement of people and freight in a timely manner, and efficient in delivering the right infrastructure and services to the right level, at the best cost.
The GPS proposes six national land transport objectives, requiring a land transport system that:
• Addresses current and future demand for access to economic and social opportunities
• Provides appropriate transport choices
• Is resilient
• Is a safe system, increasingly free of death and serious injury
• Mitigates the effects of land transport on the environment
• Delivers the right infrastructure and services to the right level at the best cost.
The GPS recognises that an Auckland transport system that is working well is crucial to improving the contribution the city can make to New Zealand's economic growth and productivity. (1)
3.5 Auckland Transport strategic themes Auckland Transport has developed five strategic themes to drive the delivery of the transport components of the Auckland Plan.
The themes are:
Prioritise rapid, high frequency public transport to achieve the Auckland Plan outcome of moving to outstanding public transport.
Transform and elevate customer focus and experience by delivering road, public transport, cycling and walking services which are user friendly, customer oriented, and meet the needs of the people of Auckland.
Build network optimisation and resilience to get better value out of our existing services and assets and be resilient against future shocks (e.g. oil price changes), changing travel patterns and demands and natural events (e.g. flooding).
Ensure a sustainable funding model to create certainty for maintaining and renewing our assets, improving service levels incrementally and adding additional capacity to the transport system to meet the needs of future growth.
Develop creative, adaptive, innovative implementation of Auckland Transport's services, programmes and new projects.

19Auckland Regional Land Transport Plan 2015-2025
Figure 3: Auckland Transport's strategic themes to implement the Auckland Plan
• One network/system• Commercial Productivity• Route optimisation• Network options• Transport development• Real time information• Congestion management• Network resilience/reliability• Integrate active transport
Strategic Themes
Build network optimisation and resilience
Develop creative, adaptive, innovative implementation
Prioritise rapid, high frequency public transport
Transform and elevate customer focus and experience
Ensuring a sustainable funding model
• Commercial partnering• Business improvements• Diversified revenue sources• Asset optimisation/AMP• Disposal/usage/development of surplus assets• Internal costing• Procurement models• Legislative issues
Strategic Themes
Ensure a sustainable funding model
Prioritise rapid, high frequency public transport
Transform and elevate customer focus and experience
Build network optimisation and resilence
Develop creative, adaptive, innovative implementation
Thought Leadership Ag
ility Integrity Loyalty Courage
Col
lab
orat
ion
Urg
ency Safety priorities Environm
ental awareness Risk minizatio
n
C
ultu
ral i
mpe
rativ
es
Strategic Integrated Themes
Strategic Themes
Develop creative, adaptive, innovative implementation
• Technology partnerships• Digital data experience• Shared facility plan• Innovation HUB• Academic partners• Innovative cities mix
Prioritise rapid, high frequency public transport
Transform and elevate customer focus and experience
Build network optimisation and resilence
Ensure a sustainable funding model
Leadership Ag
ility Integrity
rities Environmental awa
• Branded services• Customer centric culture• Digital information• Way-finding• Facilities and placemaking• Modal choices• Integration of transport for customer experience• HOP enhancement• Loyalty recognition
Strategic Themes
Transform and elevate customer experience
Strategic Integrated Themes
Develop creative, adaptive, innovative implementation
Prioritise rapid, high frequency public transport
Build network optimisation and resilence
Ensuring a sustainable funding model
Thought Leadership Ag
ility Integrity Loyalty Courage
Col
laon
Urg
ency Safety priorities Environm
ental awareness Risk minizatio
n
C
ultu
ral i
mpe
rativ
es
Prioritise rapid, high frequency public transport
Strategic Themes
Transform and elevate customer focus and experience
Build network optimisation and resilence
Develop creative, adaptive, innovative implementation
• RTN and FTN routes/innovation• LRT Programme• Road hierarchy programme• Integrate active modes
Ensuring a sustainable funding model
ship Ag
ility Inte
Prioritise rapid, high frequency public transport
Transform and elevate customer focus and experience
Ensure a sustainable funding model
Develop creative, adaptive, innovative implementation
StrategicThemes
Build network optimisation and resilience

20 Auckland Regional Land Transport Plan 2015-2025
Auckland Transport’s strategic themes align with Auckland Plan transport outcomes as shown in Figure 4 below.
Figure 4: Auckland Transport's strategic themes and the Auckland Plan strategic directions
AUCKLAND PLAN STRATEGIC DIRECTIONS
Increased access to a wider range of quality, affordable transport choices
Auckland’s transport system
moves people and goods efficiently
Auckland's transport
system enables growth in a way
that supports communities and a high-
quality urban form
Reduce adverse
effects from Auckland's transport system
Better use of transport investment
AT
STR
ATE
GIC
TH
EM
ES
Prioritise rapid, high frequency public transport
Strong Moderate Moderate Minor Strong
Transform and elevate customer
focus and experience
Strong Minor Moerate Strong
Build network optimisation and
resilienceModerate Strong Minor Minor
Ensure a sustainable funding
model Strong
Implement accelerated,
adaptive, innovative solutions
Strong Moderate Moderate Strong Moderate

21Auckland Regional Land Transport Plan 2015-2025
4. PROCESS USED TO DEVELOP THIS RLTP
The process by which this RLTP was developed was based on the business case approach that identifies the key problems to be addressed, the benefits that are expected to be delivered, and the strategic responses that are required. The key outcomes of this process are set out in this section, and inform the prioritisation and timing of activities in this RLTP.
Figure 5: Summary of steps in the business case approach
DEFINE the problem
DEFINE the outcomes sought
DEVELOP overall strategic response
STRATEGIC RESPONSE
for each transport mode
PRIORITISE
activities
4.1 Problem definition According to the Organisation of Economic Cooperation and Development’s Economic Survey of New Zealand in June 2015, Auckland is considered to be the second most congested city in Australasia, just behind Sydney. In surveys of Aucklanders, transport consistently rates as something that people are not happy about. (2)
As Auckland's population and economy continue to grow, existing transport challenges will get worse unless changes are made. The capacity of Auckland's transport system needs to expand to support and enable this growth, which is essential to New Zealand's economic development.
It is important to agree the component parts of the problem and their relative value, before designing solutions. With this in mind, AT, Auckland Council and the Transport Agency identified four key problems that need to be addressed, as discussed below.
1. Limited quality transport options and network inefficiencies undermine resilience, liveability and economic prosperity Under-developed public transport, walking and cycling networks mean that Auckland continues to have high reliance on private vehicle travel and low levels of public transport use, walking and cycling. Private vehicles account for 78 per cent of trips in urban Auckland. (3) Many people have no choice other than to travel by car and this high dependency on private vehicles means not only long traffic delays but that cars take up space when parked that could otherwise be used to address Auckland's housing shortage. Their use reduces environmental outcomes and worsens health and safety. It also increases the risk to the economy from future oil price shocks. Some level of congestion is a by-product of a successful city. However, overly long travel times can reduce accessibility, subsequently impacting on economic productivity and quality of life. Poor travel time reliability negatively impacts on the efficiency of business and time sensitive freight travel. Future projections suggest worsening congestion as Auckland grows, especially for trips to and from the Auckland city centre, which is New Zealand's largest and most productive employment area. Constraining the growth of the city centre undermines the performance of Auckland and New Zealand's economy. Investments in the rail network and the Northern Busway are already making a difference, and Aucklanders have been taking up these new choices in numbers that exceed all forecasts. Annual surveys of travel to Auckland's city centre confirm that the growth in public transport travel is already making more capacity available on key links for freight and business trips. (4)

22 Auckland Regional Land Transport Plan 2015-2025
2. The existing transport network won't adequately support growth in a way that achieves a quality compact city Auckland is New Zealand's largest and fastest growing region and is predicted to grow by up to one million people by 2040, with 300,000 new jobs created in that time (5). Auckland is New Zealand's only international city, and does not compete with other NZ cities for investment and development; rather it competes with Melbourne, Sydney, Singapore, Vancouver and Portland. Increasingly, the competition for talent and investment is being won by cities that offer an attractive lifestyle, a safe and vibrant community and a quality environment.
Figure 6: Population growth 1996–2043, Auckland and territorial local authorities
Auckland region
Waikato region
Wellington region
Cantebury region
Otago region
Population, Millions
Year0
0.5
1
1.5
2
2.5
1993
1998
2003
2008
2013
2018
2023
2028
2033
2038
2043
Source: Statistics NZ medium growth projections, 2013 base
Auckland's growing population and economy will result in a corresponding increase in the demand for travel, not only during peak commuter periods, but throughout the day. The existing transport system, which is already under pressure, will not be able to support Auckland's growth without significant changes.
In some of the newly designated Special Housing Areas, there is only very basic transport infrastructure. A completely new transport network will be required to support growth. Within the existing urban area, upgrades to roads, public transport, walking and cycling networks will be required to improve efficiency, make better use of existing transport assets and provide the additional capacity and enhanced connectivity that is required to encourage and support growth and intensification.
3. The transport system creates adverse health, safety, cultural and environmental effects
The social cost of road crashes in Auckland in 2013 was $847 million. (6) Although there has been a declining trend in deaths and serious injuries on Auckland's road network over the past decade, the 2013 calendar year saw an increase in road trauma, and in 2014, despite a slight improvement, Auckland did not meet its road safety targets. Using international comparisons, New Zealand has a high road fatality rate on both a population and a per-km basis. (7) Transport accounts for around 20 per cent of New Zealand's greenhouse gas (GHG) emissions, with the great majority of transport emissions coming from private vehicles. (8) The Auckland Plan outlines a target of reducing GHG emissions by 40 per cent by 2040 (based on 1990 levels). While some recent improvements have been achieved, especially with the rollout of electric trains, a transformational reduction will be required for transport to

23Auckland Regional Land Transport Plan 2015-2025
‘do its share’ in achieving this target.
Transport construction, maintenance and operations can have adverse effects on the natural and physical environment, including damage or destruction of flora and fauna, adverse amenity effects, and the emission of harmful pollutants and the contamination of stormwater runoff from the street network. Transport projects can also adversely affect sites and areas of significance to Ma ori but equally the transport system can play a role in bringing Auckland's Ma ori identity to the forefront as a point of difference in the world.
4. Meeting all transport expectations is increasingly unaffordable and will deliver poor value for money
Providing new or expanded transport infrastructure to respond to growth is becoming increasingly expensive and inefficient. Land corridors designated in the past for transport purposes have now been used, and constructing transport infrastructure on land already used for housing or as open space is expensive and unpopular. The Victoria Park Tunnel and the Waterview Tunnel are two examples of roading projects that have been constructed underground to minimise adverse environmental and community impacts, at significant additional cost. The amount of funding available for transport investment and operations is constrained. Limited growth in traffic and fuel consumption in recent years has had an impact on the amount of funding available for transport investment from the National Land Transport Fund, and the potential future funding from this source will be constrained if this trend continues. Council funding for transport is also constrained through signalled lower rates increases and controls on debt levels. Transport investment must compete with investment in water supply, wastewater and stormwater infrastructure, which are also crucial to support Auckland's growth. Once new infrastructure is built, it needs to be operated and maintained. Taking a whole-of-life approach, the costs of expanding and enhancing the transport system can be many times the initial capital investment. There is little benefit in investing in new assets if this means there is insufficient funding to operate, maintain and renew existing assets. It is clear that expecting a high level of performance from the transport system for all modes in all locations at all times and for all types of trips is increasingly unaffordable and will not provide value for money. The level of service can appropriately be expected to vary according to location, time of day, type of trip and mode of travel.
4.2 Benefits In addressing these problems, AT, Auckland Council and the Transport Agency have identified the following benefits:
• Increased access to a wider range of quality, affordable transport choices
• Auckland's transport system moves people and goods efficiently
• Better use of transport investment
• Auckland's transport system enables growth in a way that supports communities and a high quality urban form
• Reduce adverse effects from Auckland's transport system – including safety, environmental, health and cultural considerations.
Consistent with the business case approach, these have been aligned to a number of strategic responses.
4.3 Strategic responsesThe strategic responses are statements of a strategic approach to deliver upon the problems and benefits identified. They do not prescribe a particular solution. Instead, strategic responses guide delivery of an integrated, One System approach. Collectively, this process of problem, benefit and strategic response underpins the investment programme and is represented in the following investment logic map.
24 Auckland Regional Land Transport Plan 2015-2025
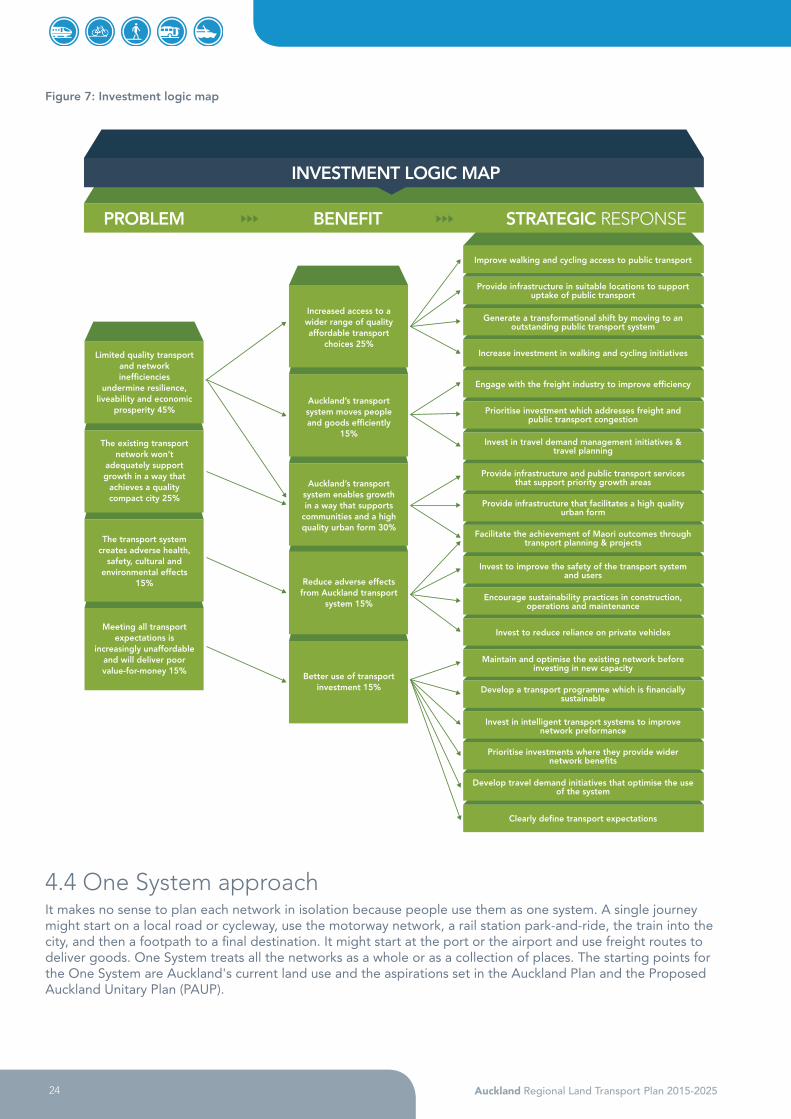
Figure 7: Investment logic map
Clearly define transport expectations
PROBLEM BENEFIT STRATEGIC RESPONSE
Limited quality transport and network inefficiencies
undermine resilience, liveability and economic
prosperity 45%
Increased access to a wider range of quality affordable transport
choices 25%
Improve walking and cycling access to public transport
Provide infrastructure in suitable locations to support uptake of public transport
Prioritise investment which addresses freight and public transport congestion
Invest in travel demand management initiatives & travel planning
Provide infrastructure and public transport services that support priority growth areas
Provide infrastructure that facilitates a high quality urban form
Encourage sustainability practices in construction, operations and maintenance
Invest to reduce reliance on private vehicles
Maintain and optimise the existing network before investing in new capacity
Develop a transport programme which is financially sustainable
Invest in intelligent transport systems to improve network preformance
Prioritise investments where they provide wider network benefits
Develop travel demand initiatives that optimise the use of the system
Increase investment in walking and cycling initiatives
Generate a transformational shift by moving to an outstanding public transport system
Engage with the freight industry to improve efficiency
Invest to improve the safety of the transport system and users
Auckland’s transport system moves people and goods efficiently
15%
Auckland’s transport system enables growth in a way that supports
communities and a high quality urban form 30%
Reduce adverse effects from Auckland transport
system 15%
Better use of transport investment 15%
The existing transport network won’t
adequately support growth in a way that
achieves a quality compact city 25%
The transport system creates adverse health,
safety, cultural and environmental effects
15%
Meeting all transport expectations is
increasingly unaffordable and will deliver poor value-for-money 15%
INVESTMENT LOGIC MAP
Facilitate the achievement of Maori outcomes through transport planning & projects
4.4 One System approachIt makes no sense to plan each network in isolation because people use them as one system. A single journey might start on a local road or cycleway, use the motorway network, a rail station park-and-ride, the train into the city, and then a footpath to a final destination. It might start at the port or the airport and use freight routes to deliver goods. One System treats all the networks as a whole or as a collection of places. The starting points for the One System are Auckland's current land use and the aspirations set in the Auckland Plan and the Proposed Auckland Unitary Plan (PAUP).

25Auckland Regional Land Transport Plan 2015-2025
Figure 8: The One System approach
Looking at transport networks as layers of connections enables AT to identify opportunities to improve travel choices, make better use of existing transport networks, align transport provision with changing patterns of land use and demand, and improve resilience to unexpected events and future changes.
The One System approach is also about AT, the Transport Agency, KiwiRail and other transport providers working together to plan and manage the whole transport system, paying special attention to the old spatial and administrative boundaries where things might have fallen through the gaps in the past.
More detail on each of the layers of the One System approach is set out in the following chapters, along with details of how each component of the transport system can be improved to better contribute to the above outcomes.
4.5 Ma ori outcomesMa ori outcomes in the RLTP are guided by the key directions and transformational shifts identified in the Auckland Plan:
• The aspirational outcome ‘A Ma ori Identity is Auckland’s point of difference in the world’.
• The transformational shift of significantly lifting Ma ori social and economic wellbeing.
To meet these outcomes, Auckland Council and the Independent Ma ori Statutory Board have identified: post-treaty settlement opportunities with Mana Whenua, marae and papakainga development, and Ma ori urban design (including te reo Ma ori) as priorities for AT.
Part 2 of the Resource Management Act 1991 is of particular relevance for AT and its relationship with Ma ori in the building of infrastructure. The Act provides for the relationship of Ma ori with their ancestral lands, water, wāhi tapu sites and other taonga, the expression of kaitiakitanga and the Treaty of Waitangi relationship. The PAUP includes provisions relating to Ma ori cultural heritage and Ma ori values. These are also important considerations in decision-making.
Early engagement on the RLTP occurred in May 2014 with 14 iwi authorities represented. In February and March 2015, nine iwi authority representatives attended a hui on the draft RLTP. One of the key themes emerging from the engagement was the need to reflect Ma ori outcomes and Te Ao Ma ori/Ma ori values in the prioritisation process for the RLTP, through an overarching set of principles. These apply in particular to the environmental and cultural aspects of the RLTP’s prioritisation process.
Amendments to the prioritisation system have been made following engagement with Mana Whenua. This has involved incorporating better criteria to assess whether projects have adverse impacts on the achievement of Maori values. Due to time frames, the criteria have not been used to rescore projects for the purpose of setting this RLTP. The criteria will however be used over the next three years to assess projects as they progress through their various stages. As this process involves identifying red flags, the criteria will be used as a ‘checkpoint’ rather

26 Auckland Regional Land Transport Plan 2015-2025
than as scoring criteria for project prioritisation. Additional work with Mana Whenua over the 2015-18 period will seek to further embed the achievement of Ma ori values into the prioritisation system.
Another issue for engagement in the 2015-18 period is Ma ori roadways. Section 22 of the Land Transport Management Act provides for the funding of Ma ori roadways. AT is undertaking preparatory work to determine the extent of such roadways in the Tāmaki Makaurau region, and will work proactively with Mana Whenua on this issue.
4.6 Prioritisation and ranking To deliver upon the strategic responses, a prioritisation process, led by AT, with input from Auckland Council and the Transport Agency, seeks to ensure the best value projects are the ones that are funded. The prioritisation process works like a sieve through which activities are reviewed and considered in increasing detail as they move down through the various ‘filters’. This section outlines the prioritisation process (see figure 9 below) and sequencing steps that have occurred subsequent to the consultation process.
Figure 9: Auckland prioritisation process – overview
DELIVERY
OPERATION
800 Projects One Project List
Rationalised List
Non Committed Project List
Preliminary Project List
Prioritised Project List
Funded Programme
Strategic Themes Programmes(Timing and Dependencies)
600 Projects
500 Projects
400 Projects
20-30 Programmes
FILTER 2
FILTER 1
FILTER 3
FILTER 4
FILTER 5
FILTER 6
FILTER 7
HOLDING PEN
NEW PROJECTS LEGACY PROJECTSSanity check
Duplicatedcompleted
1000 Projects
4.6.1. Prioritisation process At filter 1 stage all activities, including legacy and proposed, were included. This was further refined by a process to ensure no activities were duplicated, and that the project still made sense during filter 2. The following non-discretionary activities were included as part of filter 3:
• Contractual commitments such as the purchase of electric trains, or the completion of projects already under construction.
• Maintaining the existing level of public transport service (but note that significant changes to existing services are proposed in the public transport New Network).
• Maintenance and renewals of local roads and state highways.

27Auckland Regional Land Transport Plan 2015-2025
• Mandatory items including local board initiatives and replacing essential assets.
These activities are treated as essential, but were not exempt from scrutiny. Work was undertaken to confirm these non-discretionary activities were both efficient and effective and represented value for money.
At the filter 5 stage, projects were evaluated against defined assessment criteria with a three-profile approach used by the Transport Agency for formal inclusion into the RLTP. The profile components are:
• Strategic fit
• Effectiveness
• Efficiency.
Strategic fit focuses on selecting the right investment priorities; effectiveness on the likelihood of the solution succeeding in achieving objectives; and efficiency on ensuring activities provide the greatest benefit for the least cost.
Components of ranking
Strategic fit Effectiveness Efficiency
Each project is scored against:
• 28 of the ITP desired outcomes, which provides the information necessary to assess how strongly each project delivers against Auckland’s strategic priorities
• From 1 to 5 for its contribution to each benefit.
These scores are then combined to form an overall strategic fit score. The detailed criteria used to assess each project are outlined in Appendix 2.
A project is assessed as having high, medium or low effectiveness.
The criteria for this assessment are based on the Transport Agency’s criteria, also outlined in Appendix 2. Activities are most effective if they provide long-term, integrated and enduring solutions.
Efficiency is calculated based on a project’s benefit cost ratio (BCR).
The BCR is converted to a profile as follows:
>5 High
3.0-4.9 Medium
1.0-2.9 Low
Where projects are in a very early stage of development, calculated BCRs are indicative and their use is more for information than as a core part of the ranking process. As a result, the Ranked Capital Projects outlined in Section 16.2 are ordered based on strategic fit and effectiveness; with BCR being used as a ‘checkpoint’. All projects with a BCR of less than one require comprehensive analysis and justification as to their inclusion within the programme.
Where projects have the same strategic fit and effectiveness scores, they are ordered from lowest to highest cost.
As part of the final ranking, AT and the Transport Agency have ensured that profiles are agreed between the two organisations wherever possible. There should be relatively few differences, because a similar evaluation methodology is being used and because the strategic transport priorities of Auckland and of Central Government are closely aligned.
4.7 Timing and sequencingFollowing on from the draft RLTP consultation, a further filter was applied to ensure that, at any given level of funding, the projects with the highest level of benefits were included and that the timing and sequencing of projects was optimal in a context of funding shortage.
While generally higher priority projects would be expected to be implemented before lower priority projects, a number of critical dependencies between projects, as well as appropriately balancing investment between programmes and individual projects, require a transparent system to determine optimal timing and sequencing.

28 Auckland Regional Land Transport Plan 2015-2025
The following criteria are used to ensure the timing of projects is optimised:
Figure 10: Timing and sequencing of projects
Priority 1 PROJECT WITH COMMITMENTEvidence available which confirms project as a pre-existing commitment
Priority 2MINIMUM ANNUAL SPEND ON A KEY REGIONAL PROGRAMME (e.g. safety)
Investment establishes a minimum annual spend on a programme of work which has as direct link to a key strategic priority (e.g. safety)
Priority 3
CRITICAL DEPENDENCY – public transport New Network
Project identified as an essential requirement for a key aspect of the public transport New Network
CRITICAL DEPENDENCY – Special Housing Area
Project identified as an essential requirement for a Special Housing Area to develop
CRITICAL DEPENDENCY – larger regional initiative
Project proven to be essential for unlocking the benefits of a larger initiative (e.g. Western Ring Route or City Rail Link) included within the RLTP
Priority 4
SIGNIFICANT IMPACT ON A KEY PERFORMANCE INDICATOR (KPI)
Evidence provided that the project/initiative has a significant, measurable impact on one of the following KPIs:
– Public transport boardings
– Asset condition
– Fatal/serious injuries
– Travel times along strategic freight routes (as defined in the Auckland Transport Statement of Intent)
SIGNIFICANT RISK OF PROJECT COST ESCALATION
Deferring the project incurs significant risk of cost escalation over $10 million (excluding inflation) – e.g. the land required will almost certainly be developed in the interim or delay will result in significant duplication of current activity.
Note – only funding required to reduce the risk of cost escalation should be brought forward (e.g. route protection).
Priority 5
SPECIAL FUNDINGProject attracts additional targeted funding that amounts to at least 50 per cent of total capital
TRANSPORT AGENCY CO-INVESTMENT CONFIRMED
Project has current approved NLTF funding (for design and/or construction)
Priority 6
VERY HIGH ECONOMIC EFFICIENCY
Project has very high economic benefits evidenced by a pre-existing BCR >=7.0
REDUCES OPERATING COSTSCapital investment in the project has been shown to reduce operating costs in the future (e.g. LED street lighting)
Priority 7 OTHER REASON Reason to be clearly specified in accompanying notes

29Auckland Regional Land Transport Plan 2015-2025
The prioritised list is then used to develop a strategically aligned, optimised programme that is funded, deliverable and represents value for money. This forms the basis for Auckland Council and the Transport Agency to make funding decisions and for AT to prepare its final programme.
4.8 Other significant influences
4.8.1 Sustainability and transport in AucklandChallenges
Land transport emissions make up just over 35 per cent of Auckland’s greenhouse emissions and have been relatively stable since 2006. Commuting by private vehicle accounts for 40 per cent of an Auckland resident’s daily greenhouse gas emissions. It is vital for Auckland’s sustainability and health that we reduce transport emissions. The most viable methods to do so are to increase walking, cycling and public transport and also to encourage the use of low-emission vehicles for journeys that need to be made by private vehicle.
The Auckland Plan targets a reduction of greenhouse gas emissions by 10-20 per cent by 2020 and by 40 per cent by 2040.
What we are doing
The Transport Agency and AT’s main ability to respond to the adverse effects of transport on the environment is to promote transport options that produce fewer emissions. Both organisations have plans to rapidly expand the cycling network in the next three years. The Transport Agency is allowing the construction of Skypath on the Auckland Harbour Bridge and will be constructing Seapath during this plan period. For the first time, pedestrians and cyclists will have direct access to the city centre from the North Shore.
Auckland Transport will also be expanding cycleways and walkways significantly, including the Glen Innes to Tamaki Drive cycleway, which will provide separated cycle access to the city centre from south-eastern suburbs. Eventually, this will join the cycling infrastructure included in the AMETI project to enable safe continuous walking and cycling lanes from Panmure all the way into the city centre.
Auckland Transport and the Transport Agency are investing in electric trains which are far more fuel efficient and less polluting than the diesel trains they are replacing. Approximately 80 per cent of New Zealand’s electricity is generated using renewable resources, for example hydro-electricity. This is expected to increase to 90 per cent by 2025. Replacing diesels with electric trains on the core network will save 15 million litres of fuel per year and is targeted to reduce emissions from the rail network by 70 per cent.
The public transport New Network will change bus routes in the next few years so that trips become on average quicker, and more frequent, but will require more legs to a journey. Public transport patronage has doubled in the past 20 years and is expected to continue growing as the New Network and integrated fares are introduced.
These gains in public transport patronage have made a real difference to the amount of traffic on our region’s roads at a time when population growth has been very high. For example, in the morning peak period in 2014 roughly similar numbers of vehicles crossed the Auckland Harbour Bridge as did in 2001, despite a 31 per cent increase in population during this period. The major change is a reduction in the number of cars and a large increase in buses, enabled by the Northern Busway which gave North Shore residents a viable travel alternative. The projects proposed as part of the AMETI scheme will achieve similar results for residents living on the Botany peninsula.
All vehicles create emissions, and AT is working with the council, the Transport Agency and the Ministry of Transport on source control of contaminants. These include zinc and copper from tyres and brake linings as well as fuel. Once contaminants reach the environment, they are being better contained by stormwater management devices such as Tetra Trap and balancing ponds, which reduce the amount of contaminants entering watercourses and the ocean.
Auckland Transport is actively seeking a private partner to create a membership-based car sharing scheme, which will offer plug-in electric vehicles (PEVs). The scheme will incentivise households to shed ownership of a second car, or any vehicle at all. The initial fleet is envisaged to be 200-300 electric vehicles supported by around 350 mostly on-street, plug-in charging stations across the city. By providing infrastructure and eliminating the barrier of high purchase price, many more Aucklanders would get used to driving an electric vehicle, normalising their use.

30 Auckland Regional Land Transport Plan 2015-2025
A condition for any operator of the scheme in Auckland is that it be commercially viable and at no net cost to Auckland ratepayers.
Auckland Transport is also retrofitting 40,000 of its more than 100,000 street lights with new technology LED bulbs. LED bulbs use about 65 per cent less power than the bulbs that they are replacing. When all 40,000 bulbs are replaced as part of a five-year programme, AT will save 9.9 GWh/year on a current energy bill of 54 GWh/year.
Looking ahead
In the short term the Transport Agency, Auckland Council and AT will be improving the environment by encouraging Aucklanders to travel less through:
• Reducing the need for travel by supporting good land use planning and offering travel planning programmes
• Increasing the quality and use of public transport, walking and cycling facilities
• Improving transport efficiency to reduce the consumption of fuel
• Moving away from fossil fuels and encouraging the use of low-emission fuelled vehicles for journeys which have to be made by private vehicle.
In the medium term, during the 2020s, there will be:
• Increased adoption rates of low-emission hybrid, electric and fuel cell vehicles followed by widespread rollout of electric vehicles
• Continued improvement to public and active transport infrastructure
• Smarter freight management, e.g. reducing, re-moding, re-routing and re-timing freight movements.
In the long term we envisage an Auckland where public transport, walking and cycling are the preferred means of travel and Auckland’s transport fleet, both public and private vehicles, is powered by sustainable, low-emission sources.
31Auckland Regional Land Transport Plan 2015-2025
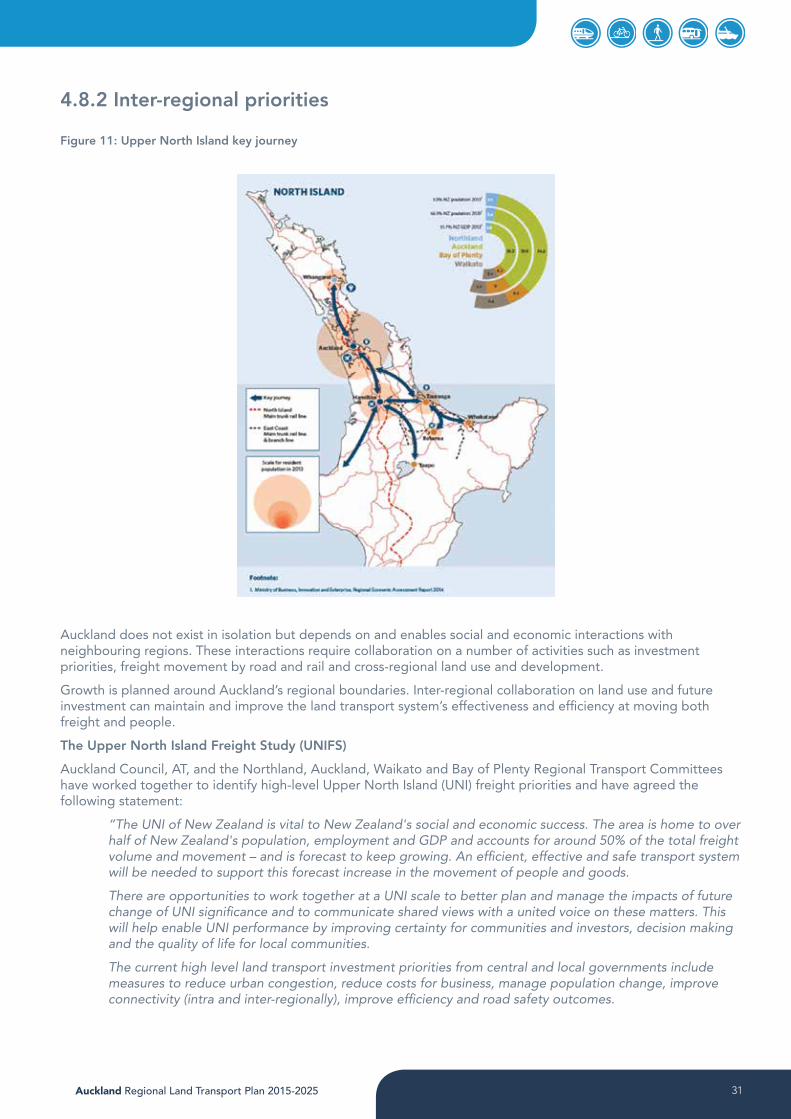
4.8.2 Inter-regional priorities
Figure 11: Upper North Island key journey
Auckland does not exist in isolation but depends on and enables social and economic interactions with neighbouring regions. These interactions require collaboration on a number of activities such as investment priorities, freight movement by road and rail and cross-regional land use and development.
Growth is planned around Auckland’s regional boundaries. Inter-regional collaboration on land use and future investment can maintain and improve the land transport system’s effectiveness and efficiency at moving both freight and people.
The Upper North Island Freight Study (UNIFS)
Auckland Council, AT, and the Northland, Auckland, Waikato and Bay of Plenty Regional Transport Committees have worked together to identify high-level Upper North Island (UNI) freight priorities and have agreed the following statement:
“The UNI of New Zealand is vital to New Zealand's social and economic success. The area is home to over half of New Zealand's population, employment and GDP and accounts for around 50% of the total freight volume and movement – and is forecast to keep growing. An efficient, effective and safe transport system will be needed to support this forecast increase in the movement of people and goods.
There are opportunities to work together at a UNI scale to better plan and manage the impacts of future change of UNI significance and to communicate shared views with a united voice on these matters. This will help enable UNI performance by improving certainty for communities and investors, decision making and the quality of life for local communities.
The current high level land transport investment priorities from central and local governments include measures to reduce urban congestion, reduce costs for business, manage population change, improve connectivity (intra and inter-regionally), improve efficiency and road safety outcomes.

32 Auckland Regional Land Transport Plan 2015-2025
The UNI is currently benefiting from significant transport system investment to achieve these central and local government priorities. Examples of this include the investment in improving the UNI inter-regional corridors and on reducing congestion in the main urban centres, particularly Auckland. This investment will have benefits at a local, regional and national level as often transport system improvements deliver benefits to people beyond the location of a project or local government boundary. Going forward, an improved understanding of those UNI scale issues and responses to deliver desired transport and wider economic and social outcomes is necessary.
At this stage, at an UNI scale, inter-regional road and rail strategic corridor network improvements are critical to enabling improved productivity outcomes through improving connectivity and the efficient and safe movement of people and goods. System improvements to how UNI urban centres function, particularly in Auckland, are also critical. A resilient transport network that maintains links between communities remains important.
It is essential to continue to develop and commit to collaborative stakeholder approaches at an UNI level to enable issues and opportunities to be identified and solutions agreed to resolve multi-faceted problems. The collaborative work undertaken to date has delivered significant benefits and as it develops further can continue to enable a broader understanding of the UNI inter-relationships and priorities.”
Freight priorities
The responsibility for providing infrastructure for road and rail freight lies with AT, the Transport Agency and KiwiRail. Major inter-regional road links are provided by State Highway Network Operations while the local roads are provided by AT. It is not possible to distinguish the impacts on the road network caused by inter-regional freight movements from local traffic as the biggest impacts occur in the first-mile or last-mile of the journey. Road freight priorities are therefore discussed in terms of their impacts on local roads in later sections of this document.
Investment in rail track infrastructure is the responsibility of KiwiRail while investment in rail stations and above-track infrastructure is that of AT, with the latter also paying for the use of rail tracks. Rail transport is used to provide two services, i.e. public transport and rail freight, of which AT is responsible for the former and KiwiRail for the latter. However, because there is more demand for the use of the rail track than available timeslots for freight and public transport uses, the two uses are not necessarily compatible. Managing the use of available capacity (including investment) is an on-going task involving all key rail stakeholders concerned.
Cross-border land development
Current and future land use in areas that allow for cross-regional development, such as Pokeno and Pukekohe, impacts on the investment needed to facilitate the expected changes in the demand for transport services. This requires close cooperation between the regional councils and/or local authorities concerned to ensure the best outcomes are achieved for both regions. AT is working closely with Auckland Council and Waikato District Council to ensure that cross-border development priorities are aligned to ensure optimal transport investment.
The following activities included in this RLTP are considered to be of inter-regional significance:
Transport planning
• Integrated freight transport requirements
• Responding to Auckland growth areas - city centre and fringe, North Auckland, North West, South and Warkworth
• SH1 Wellsford to Warkworth.
Improvement projects
• East-West Connnections
• Hobsonville deviation
• Manukau Harbour Crossing
• Mill Road Corridor
• Northern Corridor improvements
• PC 12 Drury South transport implementation
• Pukekohe bus/rail upgrade and Customs Street Intersection improvement
• SH1 Waitemata Harbour Crossing
• SH1 Puhoi to Warkworth and Warkworth to Wellsford Roads of National Significance (RoNS)
• SH20A to Auckland Airport

33Auckland Regional Land Transport Plan 2015-2025
• SMART (rail to the airport)
• Southern Corridor improvements
• Western Ring Route – RoNS
• Auckland Train Control Centre
• Ports of Auckland Limited – access improvements
• Pukekohe rail electrification
• Third main trunk rail line Otahuhu/Wiri.
Although outside the Auckland region, the continued development of the Waikato Expressway is also an important project that will have a significant impact on the economic performance of Auckland and the UNI.
4.9 Policies
4.9.1 Regional transport planning This One System approach necessitates a new way of planning and managing Auckland’s transport networks. The three agencies of AT, Auckland Council and the Transport Agency have agreed to a more co-ordinated and integrated response to strategic transport planning and investment to respond to growth and demand. An example of this is the consolidation of previously separate regional land use and traffic modelling teams into the Joint Modelling Application Centre.
Broadly speaking, AT is responsible for developing:
• This RLTP, the 30-year Integrated Transport Programme, the Regional Public Transport Plan and input into the strategies and plans of its partner agencies
• Strategic plans for arterial roads, public transport, freight networks, cycling, walking and parking. These plans define the demands, priorities and future development for each mode and assets
• Integrated planning for major infrastructure projects, described in Chapters 7 and 8, city centre initiatives and growth-related projects, as discussed in Chapter 9
• Asset management planning for AT’s road network of 7,560km of local and arterial roads as well as the state highway network in Auckland of 352km, including rural state highways.
Using the business case approach, the intent is to ensure transport planning investment is problem driven and that benefits and outcomes are identified. This approach seeks to deliver better value for money and explores opportunities for making better use of existing capacity before turning to supply measures. Transport planning must also consider the impacts of potential interventions on all road users. Thus the process of transport planning is one of engagement and agreement, using a framework that provides consistency, clarity and informed decision making.
4.9.2 Arterial and local roads Auckland Transport's objectives for roads focus on the arterial network. They are set out in the Arterial Roads Deficiency Analysis (9) and are summarised below:
• Support and implement the Auckland Plan and enhance important place values
• Support and accommodate the use of road capacity by freight, public transport, walking, cycling, and general traffic.
• Improve road safety for all road users.
• The core policies to achieve these objectives are:
o improve transport choices, trusting that people will use the network more efficiently if they have a wider range of affordable transport options
o develop a network operating framework to support multi-modal transport and optimise the network o actively manage the arterial network to improve the flows of people and freight, through signal
optimisation, incident response and real-time monitoring o maintain arterial roads to higher standards than the rest of the network, because of their essential
network function

34 Auckland Regional Land Transport Plan 2015-2025
o remove kerbside parking from arterials where necessary to enable safe and efficient operation o develop plans for priority arterial roads which guide investment and the allocation of scarce road
space, balancing land use, transport and aspirations for how each unique corridor should develop over time
o focus AT's road improvement projects on the arterial network, and progressively upgrade the arterial network to better cater for priority users. Priority users are public transport, freight, pedestrians, cyclists and general traffic, and the order of priority varies depending on the road.
4.9.3 Public transport Auckland Transport's policies and objectives for public transport are set out in the Regional Public Transport Plan (10) and are summarised below:
• Network structure: a permanent network of connected frequent services that supports Auckland's future growth.
• Integrated service network: simple integrated services that connect people with where they want to go.
• Infrastructure: a high standard of public transport infrastructure that supports service provision and enhances customer experience.
• Service quality: a convenient and reliable public transport system using modern vehicles.
• Fares and ticketing: a fares and ticketing system that attracts and retains customers, while balancing user contributions against public funding.
• Customer interface: simple, visible and intuitive customer information and service.
• Assist the transport disadvantaged: improved access for communities and groups whose needs are not met by the regular public transport system.
• Procurement and exempt services: a procurement system that supports the efficient delivery of public transport services.
• Funding and prioritisation: effective and efficient allocation of public transport funding.
4.9.4 Walking, cycling and travel demand management A city where more people walk and cycle more often is a better place to live in so many ways; people are healthier, neighbourhoods are safer and with fewer short car trips the whole transport system works better.
Auckland Transport's objectives for walking, cycling and travel demand management are to:
• Support and enable long-term strategic land use outcomes
• Make walking and cycling safer
• Increase the proportion of trips made by walking, especially in the city centre, metropolitan centres and town centres and for short local trips especially trips to school
• Provide an integrated, connected cycle network linking key population centres, education centres and transportation facilities
• Unlock the suppressed demand for cycling
• Model a customer-centric approach by finding out the reasons behind people’s current transport choices, and what it would take to help them to make a change.
The core policies to achieve this are to:
• Maintain footpaths in a safe condition, with higher standards in places where people walk most
• Support schools to develop and implement Safe School Travel Plans
• Complete 70 per cent of the Auckland Cycle Network (metros and connectors) by 2022
• Ensure cycle facilities are safe enough to attract new riders of all ages and abilities
• Ensure all transport projects consider cyclists and pedestrians as priority road users
• Support local boards to develop local transport projects which meet community needs
• Support Auckland businesses, business areas and tertiary institutes to encourage travel by walking, cycling and public transport through the Commute programme.

35Auckland Regional Land Transport Plan 2015-2025
4.9.5 Safety Auckland Transport, the Transport Agency, the NZ Police and community groups work together through RoadSafe Auckland to implement the Safer Journeys vision of a safe road system increasingly free from deaths and serious injuries.
The objectives of RoadSafe Auckland are (11): • Reduce deaths and serious injuries on Auckland roads from 506 in 2010 to fewer than 410 in 2020, a reduction of
almost 20 per cent over 10 years (target to be revised in 2015) • Reduce crash-risk exposure across the transport network and in particular at high-risk roads and intersections, and
for high-risk road users and communities • Provide safer walking and cycling environments that encourage more people to choose active transport • Maximise the road safety benefits of new legislation on alcohol and driving • Prioritise parts of the network where better speed management will contribute most to reducing deaths and
serious injuries, while supporting overall economic productivity. • Prepare for the increasing challenges of public transport safety.
RoadSafe Auckland's policies for road safety are: • Work together to deliver road environments, speeds, vehicles and road users that reduce the risk of death or
serious injury when crashes occur • Develop Road Safety Action Plans which target interventions to high-risk roads and road users. These vary in
different road environments and include:
o high-risk intersections, urban arterials and rural state highways o vulnerable road users: pedestrians, cyclists, motorcyclists o alcohol: capitalising on the introduction of new legislation in December 2014 to lower the tolerance
limit for alcohol-impaired driving o speed management: through regulation, enforcement, education and engineering o at-risk communities: urban south, urban central, rural north, Ma ori and Pasifikao public transport safety preparation, including rail level crossings.
4.9.6 Parking and enforcement The Parking Strategy was adopted by the Auckland Transport Board in March 2015 after an extensive consultation process that began in June 2014. Over 5,500 submissions were received on the draft Parking Discussion Document (12), which was considered in the development of the final adopted Parking Strategy. The strategy provides the guiding principles and policies for the management and supply of on-street and AT-controlled off-street parking in Auckland, including park-and-ride facilities. It enables a consistent approach to be applied across the city and contributes to achieving AT and Auckland Plan outcomes. The objectives for the management and supply of parking in Auckland are to:
• Facilitate a transformational shift to public transport• Prioritise the safe and efficient movement of people, services and goods on the road network• Provide an outstanding customer experience at AT-operated on- and off-street facilities• Support the economic development of Auckland’s city centre, metropolitan and town centres• Support place-making, amenity and good urban design outcomes• Ensure a fiscally responsible approach to providing, managing and pricing parking facilities and that benefits cover
costs.
The adopted Parking Strategy sets out 13 policies for parking. The policies provide the overarching framework to guide customised responses to parking supply and management that will reflect local characteristics. They cover:
• The management of on-street and off-street parking • Parking on residential streets including a continuum of parking management interventions• Parking on arterial roads including consideration for town centres• Parking permits and coupons including technology improvements• Comprehensive Parking Management Plans that set out criteria for consideration• Parking policies for non-centre locations including the application of travel demand management plans• Motorcycle, electric vehicle and car share parking policies• Event management • Technology for parking management• Park-and-ride provision and pricing.
Details of the policies are available in Auckland Transport’s Parking Strategy (13).

36 Auckland Regional Land Transport Plan 2015-2025

37Auckland Regional Land Transport Plan 2015-2025
DETAILS OF PROJECTS AND BUDGETS

38 Auckland Regional Land Transport Plan 2015-2025
5. OVERVIEW
5.1 Transport funding Transport programmes are funded from a mix of:
• NZ Transport Agency co-investment from the National Land Transport Fund (NLTF). Roughly a quarter of AT's fund-ing comes from the NLTF. The NLTF is predominantly sourced from fuel excise duties, road user charges, registra-tion and licensing fees. The government has committed to increasing fuel excise duties in the short term, to enable an increase in fund size to pay for essential improvements to the national transport system. NZ Transport Agency co-investment contributes to investment in local roads, public transport and other transport activities delivered by AT, as well as fully funding their own activities, which include the state highway network and traffic policing.
• Central Government also invests directly in transport activities in Auckland. An example of this is the electrification project delivered by KiwiRail.
• Auckland Council owns AT and contributes over half of its total funding. The council’s revenue is from rates and debt. Rates generally fund on-going activities such as bus services, while debt funds new infrastructure such as railway stations. Details of funding sources for Auckland Council are set out in the Long-term Plan
• AT revenue including fares on many (but not all) public transport services, advertising, and income from land held for future transport needs, parking revenue and enforcement. There are limits to the extent to which revenue from these sources can be increased while maintaining the focus on providing better transport choices for Aucklanders.
5.2 Transport investment programmeThe transport investment programme set out in this RLTP is constrained by the above funding allocations.
The RLTP provides the basis of a request for funding from the NLTF, which will be assessed by the Transport Agency using its Investment Assessment Framework. The agency's decisions on which transport projects to invest in is documented in the Auckland section of the 2015-18 National Land Transport Programme (NLTP).
The Transport Agency’s programme of improvements is well funded and will deliver added capacity to the state highway network through a series of improvements. In addition, the agency will deliver several important links to the region’s cycleways in the next three-year period, and continue to work with AT to extend the Northern Busway and help plan the North-western Busway.
The amount of funding for AT’s services and improvements is significantly more than was proposed in the draft RLTP and Long-term Plan.
5.3 Outcomes By 2025 there will be over 110 million annual public transport trips in the region. To support and encourage this growth in patronage there will be an increase in the number of park-and-rides and new infrastructure such as interchanges, train stations and new bus shelters.
These changes will impact on previously projected public transport boardings, as illustrated in Figure 12.

39Auckland Regional Land Transport Plan 2015-2025
Figure 12: Annual public transport boardings
Actual LTP 2012-2022 LTP 2015-2025 Million boardings
Financial Year
Public Transport Boardings
120
100
80
60
40
20
0
FY12
FY13
FY14
FY15
FY16
FY17
FY18
FY19
FY20
FY21
FY22
FY23
FY24
FY25
Note: Does not include the significant public transport increase that will be generated by the opening of the CRL.
Auckland Transport will manage and maintain roads and footpaths to current levels of service for the coming three years. However, from 2018/19 renewals funding does not keep pace with need.
Figure 13 shows the impact on asset condition based on the proposed renewals budgets.
Figure 13: Impact of renewals programme
Ann
ual r
enew
als
exp
end
iture
, $ m
illio
ns
Perc
enta
ge
of a
sset
Measured Condition Forecast Condition - Approved ATP Renewal Funding600
500
400
300
200
100
0
100%
80%
60%
40%
20%
0%
2013
2014
2015
2016
2017
2018
2019
2020
2021
2022
2023
2024
2025
2013
-25
Tota
l
Very good conditionGood conditionModerate conditionPoor conditionVery poor conditionRenewals $m recommendedRenewals $m approved
57.5%27.5%11.4%2.2%1.4%199199
62.5%25.8%9.0%1.6%1.0%200200
62.5%25.8%9.0%1.6%1.0%193193
61.0%23.0%12.0%3.6%0.4%205198
60.9%20.1%12.8%5.8%0.3%232228
62.2%18.2%12.7%6.6%0.2%236240
62.3%16.9%12.4%7.0%1.4%284206
62.1%15.9%11.9%7.2%2.9%329238
61.8%15.1%11.4%7.2%4.4%374254
61.6%14.4%11.0%7.2%5.9%408264
61.4%13.9%10.6%7.0%7.1%436287
61.1%13.5%10.2%6.9%8.3%459299
60.8%13.1%9.9%6.8%9.4%479300
3,4422,511
Approved renewals funding, inflated
Renewals funding requirement for stable asset condition

40 Auckland Regional Land Transport Plan 2015-2025
6. STATE HIGHWAYS
KEY OUTCOMES
• Completing the Western Ring Route and Waterview Connection by 2017.• Progressing Auckland’s Accelerated State Highway Programme. • Early work on East West Connections.
The Transport Agency is responsible for maintaining, operating and improving Auckland’s 352km of state highway network (both motorways and rural state highways). The state highway network is a key facilitator of journeys. It enables people and freight to make national and regional road journeys effectively, efficiently and safely which, in turn, helps support a thriving New Zealand and growing Auckland. At the national level, state highways support New Zealand’s global competitiveness, connecting cities, producers and markets, and air and sea ports. At a regional level, they connect businesses, communities, families and friends with customers, services, work, play and each other.
Auckland's motorways and rural state highways (14) make up less than one per cent of the road network by length, but carry over a third of the traffic (35% of vehicle km travelled) in Auckland. Motorways and state highways function best when they are mostly used for long trips and are especially important for freight.
In its regional function role, the state highway network in Auckland plays a key role in connecting the Upper North Island particularly between Northland and south towards the Waikato and Bay of Plenty regions. This is reflected in the programme which supports a nationally strategic freight function as well as an important local function.
Similarly to AT, the Transport Agency ranks its projects according to a national prioritisation process, which generally produces a similar ranking to the regional prioritisation process that builds on the shared One System approach. The programme also adds much-needed capacity to the roading network whilst continuing to develop smarter journey choices for customers. In addition, a number of cycleway projects are proposed along the Transport Agency network. These cycleways support the future growth of the Auckland Cycle Network by adding key regional links, listed in Chapter 10. Further details of the State Highway Programme can be found in the State Highway Activity Management Plan.
6.1 State Highway ProgrammeAs well as general improvements and enhancements to the state highway network, a series of major packages of work are at the heart of the State Highway Programme.
6.1.1 Roads of National Significance Over the period of 2015-18, work will continue on the Roads of National Significance programme with the aim of delivering the programme in the Auckland region. This includes progressing planning and delivery of the Waterview Connection and North-western Motorway, and Puhoi to Wellsford projects.
The Waterview Connection and North-western Motorway improvements will allow an alternative north south route to the city centre and Harbour Bridge, providing route security to the state highway network at its busiest point. The Waterview Connection project is one of biggest infrastructure developments ever to be undertaken in New Zealand. It will complete the motorway ring route around the city by tunnelling for 2.4km at Waterview to join the existing state highways at Maioro Street (SH20) and Great North Road (SH16) interchanges. Public transport will also be improved by bus shoulder lanes between Great North Road interchange and Westgate. The package comprises a number of projects along SH20 including additional capacity between St. Lukes Interchange and Westgate via SH16 Causeway, improvements at St Lukes, Te Atatu, Lincoln and Royal Road interchanges and extension of the North Western Cycleway to Westgate.

41Auckland Regional Land Transport Plan 2015-2025
The Puhoi to Wellsford project will extend the SH1 motorway from its current end point at the Johnstone’s Hill tunnels. Building a safer, more reliable state highway connection for motorists, freight and tourism will better connect Northland to Auckland and the Upper North Island. Improving this connection will boost economic growth and support expected population growth in the area.
6.1.2 Auckland Accelerated Programme In June 2013, the Government announced an accelerated package of transport infrastructure improvements for Auckland (15). The Transport Agency decided to accelerate improvements to the state highway network where congestion and bottlenecks were greatest. Forecast increases in freight demand around New Zealand, particularly in Auckland, combined with a growing population, have also necessitated the acceleration of these projects.
The following state highway packages were included in the speech, as shown below:
1. Northern Corridor (SH18/1 Constellation Road to Albany)2. Southern Corridor (SH20/1 to Papakura)3. SH20A to airport improvements4. East West Connections.
The outcome sought from these projects is to support the role of the state highway network as a facilitator of travel, particularly with regards freight, within the Auckland region and between regions in the Upper North Island. These projects also support travel choices – cycling and public transport – as part of a more efficient transport system.
The works to the Northern and Southern corridors provide additional capacity at key points in the network, which will support growth and economic productivity.
Figure 14: Auckland’s Accelerated State Highway Programme

42 Auckland Regional Land Transport Plan 2015-2025
1. Northern Corridor
The Northern Corridor improvements cover the area of SH18 between Albany Highway and Constellation Interchange, and SH1 between Upper Harbour Highway and Greville Road. Projects consist of widening SH1 between the Upper Harbour Highway to Greville Road intersections together with junction improvements at both intersections, which currently experience high levels of congestion. This is expected to be further exacerbated with the completion of the Western Ring Route, and future land use growth in the town centres of Albany, Massey North, Westgate and Hobsonville. The route also forms the northernmost part of the Western Ring Route and supports inter-regional travel between Northland, Auckland and the Greater Upper North Island region.
For the SH18 section between Albany Highway and Constellation Drive, the current expressway will be upgraded to motorway standard and crossing points for walking and cycling will be improved and enhanced. The route experiences an inherent conflict between through-traffic and local access traffic in the area, increased by the growth in the North Harbour Industrial Area located adjacent to SH18. This has created community severance with the residential areas to the immediate south and east of the corridor. The local walking and cycling network is not adequately developed either, further reducing accessibility.
Although unfunded at present, the Transport Agency has plans for a busway component of the Northern Corridor improvements. The separated portion of the Northern Busway from SH1 currently ends at Constellation Station. As a result of the congestion along SH1 between Upper Harbour Highway and Greville Road, along with congestion on Constellation Drive and a lack of sufficient bus priority measures, northbound and southbound buses currently suffer from journey time unreliability between Constellation and Albany stations. The planned busway extension will extend the existing successful busway further north on SH1, to Albany. A business case for the extension will be submitted for approval in 2015.
2. Southern Corridor
The Southern Corridor improvements cover the stretch of Southern Motorway (SH1) from the SH20/SH1 connection at Manukau down to Papakura in the south. Additional lanes will be created in both directions and the Takanini Interchange will be redesigned to improve safety and access onto the motorway for this important industrial hub. This will support both local traffic to and around South Auckland as well as inter-regional travel between Auckland and the Waikato Region.
3. SH20A to airport improvements
AT and the Transport Agency have been jointly progressing an integrated transport scheme for SH20A. The work forms part of the multi-modal strategy to help future proof for airport growth of 14 million to 40 million passengers over the next 30 years.
The scheme includes upgrading the existing SH20A to motorway standard by constructing a trench to separate motorway and local traffic at the SH20A/Kirkbride Road intersection. It will future proof a rail connection (either light rail or commuter rail) and also coordinate the works with the Watercare Hunua 4 project in 2015.
The decision to future proof for either light rail or commuter rail is to retain the flexibility to implement either mode should technological advancements in light rail enable potential significant cost savings, without compromising significantly on the overall travel time between the airport and the city centre. While these are being investigated it makes sense that the design of the new Kirkbride Interchange does not preclude either option. Auckland Transport's focus now is about ensuring the rail mode is protected, irrespective of the final choice of rail type and yet-to-be-determined funding.
The first step – upgrade of SH20A – will cost $157 million with future proofing estimated at an additional $30 million. Construction began in early 2015 and is scheduled for completion in 2017. The upgrade will provide a number of benefits once completed. It enables better journey reliability for traffic (and buses) to and from the airport in addition to improved safety for all users through the separation of motorway traffic and local traffic at the Kirkbride intersection. The upgrade will also support the benefits of the Western Ring Route by taking people to and from the airport through SH20A, SH20 and the Waterview connection, due to be completed in early 2017.
The multi-modal upgrades to this corridor (including the new Kirkbride Road interchange) will support future population and business growth in the area, cater for increasing numbers of travellers, and improve freight efficiency in South Auckland. Other benefits are environmental through improvements to stormwater drainage and treatment, and the reconnection of the community, along with other travel mode choices of walking and cycling.
East West Connections is a joint Transport Agency and AT programme to improve freight efficiency, commuter travel, public transport and walking and cycling options over the next 30 years. This area is the engine room of New Zealand’s industrial and manufacturing economy and home to a number of our most vibrant communities.

43Auckland Regional Land Transport Plan 2015-2025
Increasing freight volumes and the anticipated economic and population growth in the area will place increasing pressure on both the nation’s supply chains and the local transport network. To ensure that the transport system can continue to support this growing movement of people and goods, the programme will identify current and future issues and look at how these can be addressed.
The East West Connections project is about improving connections into and out of Onehunga-Penrose and public transport between Māngere, ŌOtāhuhu and Sylvia Park as part of Auckland’s manufacturing and distribution hub. This area is currently known for unreliable journey times and the proposed improvements will enable businesses to reduce their transport costs and move goods more efficiently.
This area is the main industrial, transport and distribution hub of Auckland and of the Upper North Island. Here, inland ports served by rail links from the ports of Tauranga and Auckland enable national and international freight to be trucked to its final destination. Most major freight and logistics businesses in Auckland have depots here, and the area is also a major manufacturing hub and the location for almost 40 per cent of Auckland's manufacturing jobs.
The inland port developments in particular make a real contribution to reducing congestion and road maintenance costs. MetroPort, an enterprise of the Port of Tauranga, handles around 200,000 container movements per year, and much of the bulk movement of freight to and from the Ports of Auckland is also done by rail, reducing the need for heavy trucks to travel all the way to the city centre. However, the road network in this area was not designed with this level of freight traffic in mind, and some changes are essential.
Part of the attraction of this area is the convergence of road and rail links, including SH20 in the west and SH1 in the east. The approaches to both motorways, and the Church Street/Nielson Street link, are congested throughout much of the day and links to SH1 are indirect and inefficient. Travel times in this area also tend to be unreliable, with the worst 15 per cent of travel times taking almost twice as long as a normal trip on the same run. This directly impacts on the profitability of businesses for which time is money.
Planning for improved East West Connections has been accelerated, with the active involvement of businesses and the local community. So far, the option of a motorway connection from SH20 to SH1 south of the Manukau Harbour has been ruled out, and options for improved links between Onehunga and Sylvia Park are being worked through in more detail. AT and the Transport Agency are managing this project jointly in order to achieve the best possible integration between the local road and state highway networks.
The table below shows the outcomes that investment will bring.
Outcomes from investment
• Programme which supports the role of the state highway network as a facilitator of travel within the Auckland region and between regions as part of the Upper North Island.
• Continued construction of Western Ring Route schemes with Waterview Ring Route scheduled for completion in 2017.
• Progression of Auckland Accelerated Programme to facilitate increase in freight demand and population growth within the Auckland region.
• Supporting travel choices through the provision of bus shoulders, walking and cycleways along state highway corridors.
• Addition of much-needed capacity across the state highway network to improve journey time reliability for customers.
• Co-ordinated investment to support Auckland Transport’s programme including funding to support investigation, design and early work on East West Connections.
6.2 State highway costs Like Auckland Transport's investment in local roads, the Transport Agency's investment in state highways has three components: maintenance and operations; renewals, and infrastructure improvements.
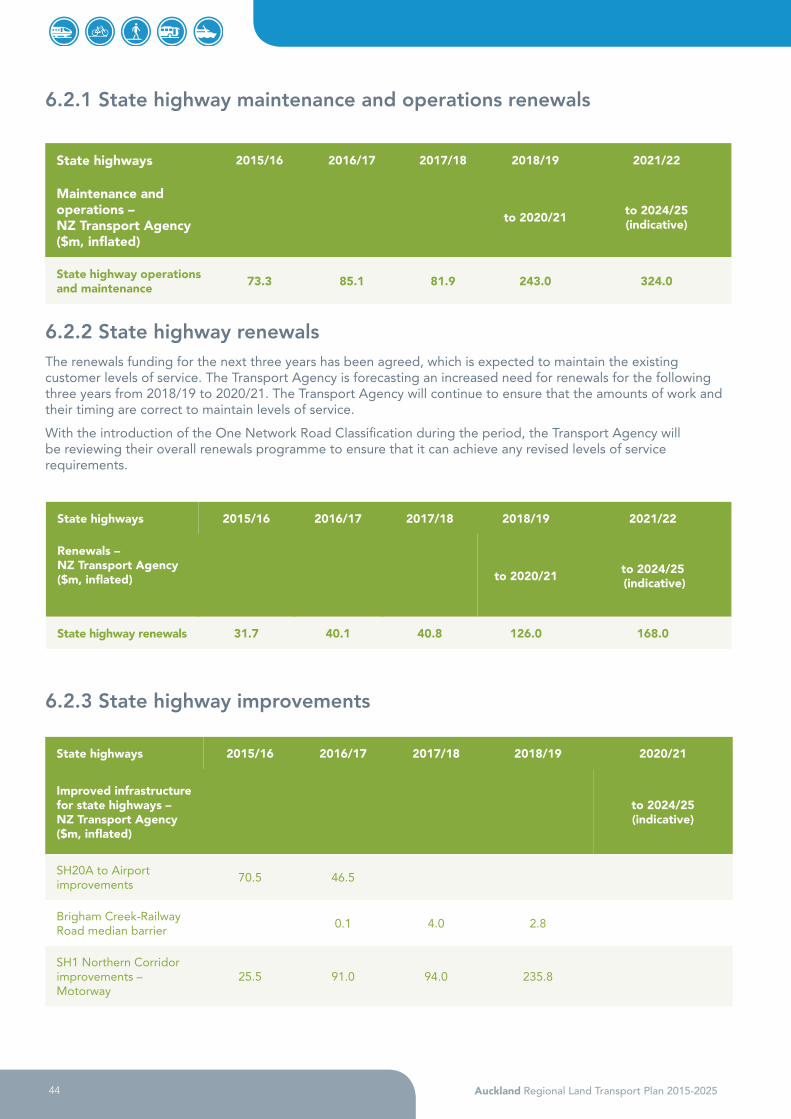
44 Auckland Regional Land Transport Plan 2015-2025
6.2.1 State highway maintenance and operations renewals
State highways 2015/16 2016/17 2017/18 2018/19 2021/22
Maintenance and operations – NZ Transport Agency ($m, inflated)
to 2020/21 to 2024/25 (indicative)
State highway operations and maintenance 73.3 85.1 81.9 243.0 324.0
6.2.2 State highway renewals The renewals funding for the next three years has been agreed, which is expected to maintain the existing customer levels of service. The Transport Agency is forecasting an increased need for renewals for the following three years from 2018/19 to 2020/21. The Transport Agency will continue to ensure that the amounts of work and their timing are correct to maintain levels of service.
With the introduction of the One Network Road Classification during the period, the Transport Agency will be reviewing their overall renewals programme to ensure that it can achieve any revised levels of service requirements.
State highways 2015/16 2016/17 2017/18 2018/19 2021/22
Renewals – NZ Transport Agency ($m, inflated) to 2020/21 to 2024/25
(indicative)
State highway renewals 31.7 40.1 40.8 126.0 168.0
6.2.3 State highway improvements
State highways 2015/16 2016/17 2017/18 2018/19 2020/21
Improved infrastructure for state highways – NZ Transport Agency ($m, inflated)
to 2024/25 (indicative)
SH20A to Airport improvements
70.5 46.5
Brigham Creek-Railway Road median barrier
0.1 4.0 2.8
SH1 Northern Corridor improvements – Motorway
25.5 91.0 94.0 235.8

45Auckland Regional Land Transport Plan 2015-2025
State highways 2015/16 2016/17 2017/18 2018/19 2020/21
Improved infrastructure for state highways – NZ Transport Agency ($m, inflated)
to 2024/25 (indicative)
East West Connections 6.9 29.2 10.8
SH1 Northern Corridor improvements – busway component
SH1 northbound auxiliary lane
8.3 1.4
Southern Corridor improvements
53.2 82.0 76.0 46.6
SH16/SH18 intersection
SH20/SH16 Western Ring Route
364.0 204.7 72.9
Hobsonville deviation 3.3
SH16/Muriwai Road intersection
2.4 5.0
Silverdale Interchange upgrade
2.5
SH1 Puhoi to Warkworth new road
27.8 2.3 2.3 6.7
SH1 Warkworth to Wellsford
15.0 7.0 9.0 20.0
Ngakoroa realignment (passing)
0.2 7.7
McKinney/Wech Drive intersection
Warkworth Stage 1 1.8
Wharehine Road 0.2 1.5 2.8
Noise improvements programme
0.5 8.5
SH1 Waitemata Harbour crossing (planning, route protection)
7.0 8.9 11.0 84.9
Minor state highways improvements including: safety, optimisation and resilience
6.1 1.2 1.3

46 Auckland Regional Land Transport Plan 2015-2025
State highways 2015/16 2016/17 2017/18 2018/19 2020/21
Improved infrastructure for state highways – NZ Transport Agency ($m, inflated)
to 2024/25 (indicative)
Auckland expenditure within nationally prioritised budgets including Safe Roads and Roadsides, advanced traffic management systems and small improvement projects are outlined as part of Chapter 13 – Transport Planning
Not Included Not included Not included Not included Not included
Auckland state highway improvements (excludes nationally allocated programmes)
590.1 484.3 286.7 412.0

47Auckland Regional Land Transport Plan 2015-2025
7. ARTERIAL AND LOCAL ROADS
KEY OUTCOMES
• Continuing the AMETI project, including replacing the Panmure roundabout with a signalised intersection and starting the Panmure-Pakuranga busway.
• Starting the local roading, walking and cycling and public transport elements of the East West Connections.
• Major arterial improvements to support growth and address urban congestion and safety concerns (e.g. Te Atatu Corridor, Mill Road).
Auckland's arterial and local road network is one of the highest value public assets in New Zealand, with a total value of close to $12 billion. Auckland Transport is responsible for:
• 7,560km of local and arterial roads
• 1,245 bridges and major culverts
• 624 traffic signal-controlled intersections
• 106,691 street lights
• 3,735 sea walls and retaining walls.
Private vehicle traffic is only one of many demands on Auckland's roads, which must also cater for public transport, walking, cycling and freight. Roads are not only for movement; the road is part of the experience of living, working or shopping in a place, not just a way to get to somewhere else. Almost the entire infrastructure that supports the city, including water, wastewater, stormwater and telecommunications, is located in the road corridor.
In this document, public transport, road safety, and walking and cycling, are covered in separate chapters, though there are many overlaps between these and the roads work programme.
7.1 The road network Local and collector roads make up 83 per cent of the road network in terms of length, but most of these roads serve their network function well, making them a lower priority for upgrades and traffic management than the arterials.
Auckland's primary and secondary arterial roads make up 16 per cent of the city’s road network by length. The arterial network has been well maintained but not sufficiently developed and managed to meet growing travel demands. Although not as busy as Auckland's motorways, arterials carry much more traffic than local roads and are the location of most of the network's safety and congestion problems, particularly those arterials which directly connect with the motorway network. The One System approach is especially important here as some motorway improvements cannot realise their intended benefits because the capacity constraint is actually traffic entering and leaving via the arterials.
Arterial roads are often not able to cope with additional vehicle traffic. Widening roads and intersections is prohibitively expensive and can create problems for pedestrians and local residents as multi-lane roads are significant barriers to local trips, especially for the young and elderly. Auckland's arterial roads are also the location of most of the city's shops, schools and other important destinations. It becomes essential to set priorities that consider public transport, freight, walking, cycling, and general traffic. The order of priority of these different road users will vary depending on the road, and may vary by time of day.
Over the 10 years of this plan, AT's focus for road improvements will be the arterial network as shown in Figure 15 and the regional freight network shown in Figure 16. The highest priority arterial improvements include the completion of Albany Highway and the construction of Te Atatu Corridor, which feed traffic onto and accept traffic from SH16. The programme provides for these roads to be upgraded during the first three years. Te Atatu Corridor is essential to securing the benefits of the Western Ring Route.

48 Auckland Regional Land Transport Plan 2015-2025
In addition, the Department of Conservation (DOC) holds a road network across Auckland and New Zealand. DOC has been working with the Transport Agency to strengthen their management of roads for the benefit of road users. Previously, DOC has received funding through the Transport Agency to manage and maintain Special Purpose Roads. However, as a Road Controlling Authority, co-funding through the NLTP will allow DOC to provide a more consistent level of service (where roads cross boundaries with AT or the Transport Agency) and to manage their road assets more effectively.
7.2 Moving people Everyone in Auckland uses the transport system and almost everyone uses the arterials at peak times, whether driver or car passenger, pedestrian, cyclist, motorcyclist or bus passenger. Even people travelling by train, ferry or on the motorway network use arterials for part of their journey.

49Auckland Regional Land Transport Plan 2015-2025
Figure 15: Auckland arterial road network
±
This map/plan is illustrative only and all informationshould be independently verified on site before takingany action. Copyright Auckland Transport. Land Parcel Boundary information from LINZ (Crown Copyright Reserved).Whilst due care has been taken, Auckland Transport gives no warranty as to the accuracy and completeness of any information on this map/plan and accepts no liability for any error, omission or use of the information.Height datum: Auckland 1946.
Job Code:
0 2.5 5
KilometresRegional ArterialRoads
@ A4Scale 1:300,000
Date: 15/09/2014AT14141
0 10 20
Kilometers
Overview Map
Legend
Regional Arterial Road Network
Motorway
Strategic Arterial
Primary Arterial
Secondary Arterial
Rural UrbanBoundary

50 Auckland Regional Land Transport Plan 2015-2025
While the great majority of trips go smoothly, if a customer does experience delays or safety issues this is most likely to be on an arterial road, and most likely at peak times. Unlike the motorway network, which works best when traffic flows smoothly, the ‘best’ arterial road is one where vehicle flow is balanced with other considerations including safety, the priority of different users, cross-movements, and the needs of retail and other land uses.
Widespread uptake of GPS tracking devices, the rollout of AT HOP cards on buses and advances in mapping and data analysis mean that AT has more information than ever about how the road network is performing. This data shows some interesting results, including:
• Overall vehicle travel is growing slower than the population. Growth in traffic on some routes in Auckland is offset by declines on other routes.
• The peak is not well defined by a specific time (e.g. 7-9am and 4-6pm). The actual peak differs by place (Pukekohe residents travel earlier than Ponsonby), by purpose of travel (there is a clear ‘school peak’ from 3-4pm), and by mode (bus travellers seem to be particularly late risers).
• On some links of the arterial network a bad run (defined as the worst 15 per cent of travel times, i.e. one trip in seven) takes twice as long as normal. However on the most congested arterials, travel times at peak are actually very consistent – that is, consistently slow.
• Public transport use is growing, especially in areas served by the Northern Busway and bus priority lanes. On some corridors including Fanshawe Street, Symonds Street and Dominion Road there are more people on buses than in cars at peak times.
To get the best performance out of the whole network, AT and the Transport Agency have established the Auckland Traffic Operations Centre (ATOC) which is the central hub for the network of traffic signals, sensors and CCTVs used to direct traffic flows, inform road users and respond to emergencies. The ATOC team works to improve the performance of each road and the resilience of the whole network. This includes managing traffic signals to optimise traffic flow, giving priority to buses and responding quickly to incidents. The team is constantly looking for ways to move more people along each corridor safely, while minimising the negative effects of traffic on neighbouring homes and businesses. This RLTP also provides for small infrastructure improvements to improve road productivity.
An arterial road is ‘optimised’ when:
• The road is safe
• The number and/or speed of people movements are improving and approaching the standard of productivity defined for arterial roads by Austroads. On many arterials the best way to improve productivity is to give priority to buses and/or cars with passengers
• Reliability, defined as the ratio of the worst 15 per cent of travel times compared to the median travel time, is improving
• Provision for cycling is in line with the Auckland Cycle Network standards
• Pedestrians have a choice of places to cross the road safely, with minimal detours or delays
• There is enough access to side roads to serve the adjacent land uses.
7.3 Moving freightThe demand for the movement of freight in Auckland is substantial. For 2012 it was estimated that 65.45 million tonnes were moved within, to or from the Auckland region. This represents 26 per cent of the national and about 47 per cent of the total Upper North Island (UNI) freight flows (excluding pipelines). The volumes reflect:
• The presence of several major international gateways (Ports of Auckland, Auckland International Airport and MetroPort), for the movement of goods by air and sea
• A high level of manufacturing and transport and distribution activities
• The substantial population in the region.
The international gateways are estimated to handle 12 per cent of total freight in the region.
The road network is the dominant mode for moving goods, accounting for 87 per cent of tonnes carried, which represents 25 per cent of the total tonnage moved by road in NZ. Rail freight accounted for seven per cent of the total for the region but this again was important nationally, accounting for 27 per cent of all movements by rail. Coastal shipping has a relatively small share of regional freight traffic but again this represents about a quarter of

51Auckland Regional Land Transport Plan 2015-2025
all movements nationally. Although not directly impacting on land transport movements, Auckland is also served by a pipeline that carries about 2.2 million tonnes of petroleum products between the refinery at Marsden Point and the oil terminal and distribution centre at Wiri.
The use of rail to carry freight has also been growing strongly in Auckland, driven in part by the development of inland ports at Wiri and Southdown.
Key freight movements
High heavy vehicle flows are experienced on both the state highway network and the regional arterials during the morning peak and inter-peak periods. The particular areas of high heavy commercial vehicle use on or around the strategic freight network include:-
• SH1 Southern Motorway – especially between Manukau and Greenlane
• SH1 Northern Motorway – North Shore down to Onewa Road
• SH20 between Manukau and the SH20A intersection
• SH16 from Westgate to Point Chevalier including access to the port along the Strand
• SH20A/SH20B airport access.
High flows experienced on the major arterials of the region include the Wairau Corridor between Albany and Takapuna, the Ti Rakau/SEART/Neilson Street corridor, Highbrook Drive, Great South Road in Mt Wellington, Mt Wellington Highway, Hunua Road and Beach Road in Papakura.
The freight network is forecast to come under increasing pressure (16). Key elements are general traffic growth across the city in various centres, in particular the logistics and distribution areas of Onehunga/Penrose, Highbrook/East Tamaki, and the airport business area.
Freight traffic is forecast to grow substantially in future years increasing by almost 75 per cent between 2012 and 2042, from 65.45 million tonnes to over 100 million tonnes. Although much of this growth is related to traffic growth within the region, freight movements between Auckland and the other UNI regions are also expected to increase by about 60 per cent. The relatively high increase for internal movements means the freight network within the region will be under the greatest pressure and not the strategic routes linking to other regions. This is consistent with the importance of the first mile – last mile part of the journey, which creates the biggest challenge to freight movement in the region.
Freight movement can often be assisted by good network management even without physical changes to the road. Optimising traffic signals on freight routes can potentially ensure that heavy commercial vehicles proceed steadily, avoiding the need for repeated stops and starts. Road works and planned disruptions can be communicated widely, with unplanned disruptions managed via contingency plans. Over the period from 2012–2014, transport agencies in the region have managed to hold inter-peak travel times and travel time reliability for freight roughly constant on those freight routes used for performance measurement, despite increases in freight and business travel volumes. This indicates that the types of measures introduced to improve routes for heavy commercial vehicle movements could also potentially benefit some types of business movements.
Figure 16 shows the Auckland regional freight network. It consists of three levels:
• All roads defined as level 1 are important for the strategic movement of inter- and intra-regional freight.
• Roads defined as level 2 are intended to serve primarily freight movements in areas such as industrial parks.
• Roads classified as level 3 where freight has no particular priority but requires active management.
The entire rail network is considered of strategic value for inter-regional freight.

52 Auckland Regional Land Transport Plan 2015-2025
Figure 16: Auckland regional freight network

53Auckland Regional Land Transport Plan 2015-2025
7.4 Road costs Auckland's rapid growth creates pressure to prioritise spending on new assets, but AT and the Transport Agency must ensure this is not at the expense of the central task of maintaining the value of existing assets and delivering the best performance from the network.
Auckland Transport applies a hierarchy of four transport interventions as shown below in order to derive the greatest benefit from transport investment.
Figure 17: The four stage intervention process
Look after what we have1
Make better use of what we have
Encourage smarter travel choices
Build new assets
2
3
4 Auckland Transport is working with the Transport Agency to improve consistency in the way road assets are managed in the various elements of the state highway and local transport networks. The One Network Road Classification aims to improve value for money through a nationally consistent roading hierarchy, with evidence-based service levels that will meet stakeholder and customer requirements appropriate to the role of each road in the national network, and the optimal works associated with delivering these.
7.4.1 Road maintenance and operations The maintenance of road assets is one of the largest areas of expenditure for AT. Road maintenance is considered a non-discretionary expenditure, as short-term savings add to later costs. AT uses an advanced asset management planning model, recorded through the publication of an Asset Management Plan (AMP) every three years, to determine the most cost-effective and sustainable management regimes for the road network, to meet the levels of service required and achieve the best value for money in the long term. This has involved defining the required level of service for each road – the more important links in the road network need to be maintained to a higher standard in keeping with their higher role. AT is securing better value for money through setting clear priorities and negotiating longer term (three-to-five year) contracts covering maintenance of the road network.
These costs also cover the work of the ATOC to manage traffic flows and to optimise people movement on key arterials.

54 Auckland Regional Land Transport Plan 2015-2025
Roads 2015/16 2016/17 2017/18 2018/19 to 2024/25
Operating cost $m $m $m $m
Road maintenance and operations 115.3 115.3 115.3 851.6
7.4.2 Road renewals Maintenance is the day-to-day activity needed to keep the networks operating safely. Renewals restore the service capability of an asset.
The benefits of investment to renew assets include:
• Optimising the useful life of assets and minimising the costs of renewing and maintaining items
• Effective management of the asset to meet present and future demands
• Reducing and managing the risk of asset failure.
For the first three years of the RLTP, renewals funding has been approved at a level close to the AMP recommended levels. This will enable AT to maintain the current levels of service without any adverse effects for the first three years. However in the seven years from 2018/19, the Long-term Plan proposes to reduce renewals funding by a significant margin relative to the AMP’s recommendation.
The implications of the approved LTP renewals funding are:
• Customer satisfaction with roads, footpaths and public transport maintained at their current high levels to 2017/18, but are at risk thereafter
• The renewals backlog reduces from $1.2 billion to $968 million by the end of the 10-year period
• Maintenance needs will increase from 2018/19 as assets in worse condition cost more to maintain.
Roads 2015/16 2016/17 2017/18 2018/19 to 2024/25
Renewals $m $m $m $m
Renewals – roads 175.7 202.7 212.9 1,629.6
The table below shows the outcomes that investment will bring
Outcomes from investment
• Full funding of the optimum renewals programme over the 2015/16 - 2017/18 period. As a result Auckland Transport’s assets will be renewed as needed and will continue to deliver the level of service that customers expect.
• Beyond 2018, funding for renewals has been set at a level below Auckland Transport’s recommen-dation, with forecast consequences for asset condition and value which are described in detail in Auckland Transport’s Asset Management Plan (AMP). The 2018 Long-term Plan process, leading to publication of the 2018-28 AMP, provides an opportunity to review the level of funding for renewals of road and public transport assets.

55Auckland Regional Land Transport Plan 2015-2025
7.4.3 Road infrastructure improvements The transport programme provides for funding to complete the Albany Highway North project and Te Atatu Corridor improvements. These types of projects are generally funded as road projects although they also contribute to public transport, walking and cycling goals. The Albany Highway North project demonstrates this approach, providing walking and cycling links to schools and Massey University and a priority lane shared by buses and cars with two or more occupants. Te Atatu Corridor improvements will enable additional road capacity to take advantage of the Western Ring Route, whilst also improving safety for cyclists heading towards the North Western Cycleway. It also provides for the investigation, design and property acquisition for projects that will not be constructed in the first three years of the programme, such as Lincoln Road, East West Connections, planning and route protection for a future rapid transit route to the airport (up to designation only) and the Mill Road improvements.
Outside these areas, AT's focus for the road network is on making better use of assets, including by managing demand. Many of the new projects proposed during the term of this plan are bus priority projects or minor enhancements to existing roads and traffic management projects which make the most of new technology to enhance safety, optimise traffic flows, and respond promptly to incidents.
Roads 2015/16 2016/17 2017/18 2018/19 to 2024/25 Other benefits
Capital expenditure $m $m $m $m (in addition to road benefits)
Akoranga Busway Station improvements
1.4
Albany Highway upgrade (North)
23.5 13.1 1.1 PT, Active
AMETI programme 10.3 21.1 32.5 488.3 PT, Active
ATOC integration of JTOC and ATOC
3.6 3.7 3.8 22.1
Dominion Road Corridor upgrade
59.6
East West Connections
1.5 1.6 1.6 130.8 PT, Active
Encroachment resolutions land purchase
1.2 1.3 1.3 10.5
Lincoln Road – corridor improvements
1.8 2.1 50.7 PT, Active
Manukau/Harris/Custom intersection improvement
0.5 1.3
Network Operating Plan capital programme
2.6 2.6 2.7 15.8
Newmarket Crossing 1.0 5.3

56 Auckland Regional Land Transport Plan 2015-2025
Roads 2015/16 2016/17 2017/18 2018/19 to 2024/25 Other benefits
Capital expenditure $m $m $m $m (in addition to road benefits)
North Western Busway
43.0
NWT Hobsonville Point P n R (PC13)
0.5
Penlink Toll Road 1.3
Seal Extensions 3.3 3.3 3.3 8.6
Seismic strengthening 1.0 1.1 1.1 59.6
Seismic strengthening – Quay Street
48.7
Street lighting improvements –regionwide
0.3 0.3 0.3 2.6
Street lighting LED upgrade
4.5 4.6 4.8 47.9
Taharoto/Wairau – Stage 3 Forrest Hill -Shakespeare
4.3 Active
Tamaki Drive and Ngapipi intersection safety
4.3
Te Atatu Corridor improvements
13.7 6.6 Active
Warkworth Western Collector
3.4
Wynyard Quarter – integrated road programme
5.5
Roads total 75.7 76.2 52.5 993.8
The Auckland Development Programme of Auckland Council also delivers improvements to local roads and streetscapes.

57Auckland Regional Land Transport Plan 2015-2025
7.5 Value for money – roads
7.5.1 Arterial and local road maintenance and optimisation – value for money The benefits of road maintenance and road network management and optimisation have been assessed using the prioritisation methodology set out in Section 4.6.
• Strategic fit is High because of the priority given to maintaining and optimising existing assets in the Auckland Plan and the Government Policy Statement
• Effectiveness is High because these activities are part of an integrated plan to achieve multiple outcomes as set out in the Arterial Road Deficiency Analysis and the Roads Asset Management Plan.
• Efficiency, which compares the costs against the Transport Agency's assessment of the dollar value of benefits. Again this is High:
o for road maintenance, because the programme reduces whole-of-life costs o for road corridor optimisation, because travel time savings from these projects commonly have a
value over 10 times the project cost.
Strategic Fit Effectiveness Efficiency
Road maintenance High High High
Road network management and optimisation
High High High
7.5.2 AMETI and East West Connections – value for money The table below shows the major projects in the programme and the outcomes that these improvements will bring.
Outcomes from investment
AMETI
• Momentum continued through the 2015-18 period, with Panmure roundabout replaced with a signalised intersection and the Panmure-Pakuranga busway commenced.
• Budget provision in 2015/16 is particularly low relative to current AMETI investment levels.
East West Connections
• There are two parts to East West Connections – the first is to improve freight and the region’s economic productivity which is being led by the Transport Agency. The second is to improve people movement between Mangere, Otahuhu and Sylvia Park.
• To improve the people movement, $1.5 million per year allows for investigation, design and potentially some small improvements across the 2015/16 to 2018/19 period. Construction is scheduled in the 2019/20 to 2021/22 period.
• Timing aligns with current expectations on the Transport Agency’s freight improvements in the area.
The AMETI package of projects has been assessed as a single, integrated programme of improvements with High strategic fit and High effectiveness, with a wide range of benefits. AMETI has a Low economic efficiency using the Transport Agency's process, due to many of the project benefits not being recognised in the evaluation. Constructing the required improvements now is expensive due to the need to cross water, purchase land, and make changes through a built-up area with high property values.

58 Auckland Regional Land Transport Plan 2015-2025
Level of service statement
Performance measure
Actual 2013/14
Annual Plan 2014/15
Long-term Plan targets
2015/16 2016/17 2017/18 2018/19- 24/25
Transform and elevate customer focus and experience
Customer satisfaction – roads
71% 70% 70% 70% 70% 70%
Build network optimisation and resilience
Arterial road productivity1 68%
53% of the ideal achieved
54% of the ideal achieved
55% of the ideal achieved
55% of the ideal achieved
55% of the ideal achieved
Travel times on key freight routes2
Baseline travel times maintained on six out of eight routes
Maintain traveltimes for 85thpercentile on allnominatedfreight routes
Maintain baseline travel times for the 85th percentile
Maintain baseline travel times for the 85th percentile
Maintain baseline travel times for the 85th percentile
Maintain baseline travel times for the 85th percentile
Road maintenance standards (ride quality) as measured by smooth travel exposure (STE) for all urban and rural roads maintenance standards (ride quality) as measured by smooth travel exposure (STE) for all urban and rural roads3
Rural 95 Urban 85
New MeasureRural 93 Urban 83
Rural 92 Urban 82
Rural 91 Urban 81
Decreasing to Rural 87 Urban 77
Percentage of the sealed local road network that is resurfaced
7.6% New Measure 8% 8% 8% 8%
Strategic Fit Effectiveness Efficiency
Auckland-Manukau Eastern Transport Initiative
High High Low (1.2)
The benefits of other projects in the Road Improvement Programme above have been assessed using the prioritisation methodology set out in Section 4.6. There are a large number of projects and a wide variation between them on all aspects of the evaluation. The full list is provided in Section 16.2.
7.6 Arterial and local road outcomes The table below shows the road improvement projects in the programme and the outcomes that these improvements will bring.
What gets delivered in this
programme
The first three years focuses on:
• The completion of committed projects, e.g. the Albany Highway Upgrade
• Local road initiatives that integrate and optimise state highway and other recent investments, e.g. Te Atatu Corridor delivered by 2017 to support the Western Ring Route
• Route optimisation/network operating plan initiatives including 30 minor network efficiency im-provements by 2018 and implementation of other efficiency interventions such as dynamic traffic lanes.
Outcomes from investment
• Reduced congestion and improved efficiency in moving people and goods on the roading net-work.
• Major arterial improvements delivered sooner to support growth, address urban congestion and safety concerns along existing corridors – e.g. Te Atatu Corridor, Mill Road (northern).
The proposed performance measures for roads reflect the great variety of roads and road users in Auckland. This is a very complex area; Aucklanders make millions of trips each day and every trip is different, so it is a challenge to develop measures that sum up how the network as a whole is performing for buses, freight, walking, cycling and general traffic.
Public transport, road safety and walking and cycling targets are in separate chapters of this RLTP but road projects can make important contributions to achieving these targets.
The proposed performance measures for roads, along with the targets achievable within proposed budgets, are set out below. Note these indicators are also influenced by external factors including fuel prices and population growth.

59Auckland Regional Land Transport Plan 2015-2025
Level of service statement
Performance measure
Actual 2013/14
Annual Plan 2014/15
Long-term Plan targets
2015/16 2016/17 2017/18 2018/19- 24/25
Transform and elevate customer focus and experience
Customer satisfaction – roads
71% 70% 70% 70% 70% 70%
Build network optimisation and resilience
Arterial road productivity1 68%
53% of the ideal achieved
54% of the ideal achieved
55% of the ideal achieved
55% of the ideal achieved
55% of the ideal achieved
Travel times on key freight routes2
Baseline travel times maintained on six out of eight routes
Maintain traveltimes for 85thpercentile on allnominatedfreight routes
Maintain baseline travel times for the 85th percentile
Maintain baseline travel times for the 85th percentile
Maintain baseline travel times for the 85th percentile
Maintain baseline travel times for the 85th percentile
Road maintenance standards (ride quality) as measured by smooth travel exposure (STE) for all urban and rural roads maintenance standards (ride quality) as measured by smooth travel exposure (STE) for all urban and rural roads3
Rural 95 Urban 85
New MeasureRural 93 Urban 83
Rural 92 Urban 82
Rural 91 Urban 81
Decreasing to Rural 87 Urban 77
Percentage of the sealed local road network that is resurfaced
7.6% New Measure 8% 8% 8% 8%

60 Auckland Regional Land Transport Plan 2015-2025
Level of service statement
Performance measure
Actual 2013/14
Annual Plan 2014/15
Long-term Plan targets
2015/16 2016/17 2017/18 2018/19- 24/25
Percentage of customer service requests relating to roads which receive a response within the time frame specified in Auckland Council’s Long-term Plan.
85% New Measure
85% 85% 85% 85%

61Auckland Regional Land Transport Plan 2015-2025
8. PUBLIC TRANSPORT
KEY OUTCOMES
• Increased public transport boardings and substantial travel time savings.• Longer and more frequent trains.• Improved safety at rail level crossings, on trains and at stations.• Successful rollout of the integrated public transport New Network – reducing
duplication and increasing frequency across the network.
The transformational shift to outstanding public transport is an essential component of Auckland's overall vision to become the world's most liveable city.
Everyone benefits from good public transport, including road freight businesses and car drivers. As more roads are built, more people choose to travel by car and soon traffic congestion is at the same level as before the new road was built. In contrast, public transport can provide people with the opportunity to avoid congestion (by using services that operate in their own right of way or along bus lanes), it can enable a greater number of people to be moved along constrained corridors and by attracting people out of their cars, it can free up road space for business, freight and other trips that continue to use private vehicles.
Not everyone who uses public transport has a choice. For people who cannot drive, or cannot afford a car, public transport opens up opportunities for education, work and a social life. A public transport system that works well for the young, the old and the mobility impaired, and serves the whole community including low income neighbourhoods, builds a stronger, more inclusive society.
Without increasing the patronage of public transport our road systems will grind to a halt as population increases. The basic public transport philosophy, known as the New Network, is proposing to use the high-capacity dedicated corridors (for example, rail and busways) as the backbone of the public transport system which other modes can feed into. This ensures that modes are not competing with each other and the savings in kilometres can be recycled into additional service frequency.
It is essential that AT is able to increase the capacity of the public transport network. Plans for the City Rail Link, light rail, double decker buses on dedicated bus lanes at higher frequency will encourage more Aucklanders to travel by public transport and, by doing so, decongest the road network.
Over the past 20 years, public transport patronage in Auckland has more than doubled, from 33.3 million trips in 1993/94 to 72.4 million in 2013/14, as shown in Figure 18.

62 Auckland Regional Land Transport Plan 2015-2025
Figure 18: Auckland public transport patronage 1994–2014Note: Does not take into account the patronage benefits of the CRL, which will be significant
Bus Ferry Train Accelerated Transport ProgrammmeAuckland Plan target
Ann
ual p
ublic
tran
spor
t boa
rdin
gs, m
illion
s
120
140
100
80
60
40
20
0
1994
1995
1996
1997
1998
1999
2000
2001
2002
2003
2004
2005
2006
2007
2008
2009
2010
2011
2012
2013
2014
2015
2016
2017
2018
2019
2020
2021
2022
2023
2024
2025
Auckland Plan target
140m by 2022
Transport Programmme 111m in 2025
Auckland Transport has commenced a transformational change of public transport within the region and has identified eight strategic priorities which are supported by an ongoing marketing growth strategy. These strategic priorities have been identified as an interdependent programme to deliver on the Auckland Plan target of doubling patronage to 140 million tips per annum by 2022:
1. Integrated fares2. Procurement and contract reform 3. Rail electrification4. Ferry improvements5. New network implementation6. On-time performance7. First and final leg8. Customer experience.
8.1 The New Network In the first year of this plan, AT will complete the deployment of fast, reliable new electric trains.
The next step forward for public transport will be the rollout of a simpler, better-connected bus network which offers more frequent and reliable access to more destinations. The New Network will untangle the complex web of infrequent bus services and put in place a simpler network of frequent bus services as shown in Figure 19. With the New Network and the City Rail Link in place, even more Aucklanders will have the option of fast, frequent and reliable travel, without having to use a car.
To make the most of the New Network, people will need to make some changes to the way they travel, and be willing to transfer from one public transport service to another to complete their journey. The essential infrastructure needed to support the New Network includes interchanges at Manukau, Otahuhu and Pukekohe, where buses from local suburbs can turn around, offering better frequency, while fast electric train services mean that for most passengers their trip will take less time in total.
Consultation on the New Network is progressing, and is completed for South Auckland, Green Bay/Titirangi,

63Auckland Regional Land Transport Plan 2015-2025
Hibiscus Coast, Warkworth, Pukekohe, Waiuku and Tuakau, and West Auckland. The New Network is due to be implemented from 2016 and is reliant on infrastructure being in place to achieve the anticipated benefits of the network changes.
In the draft RLTP, funding was limited for public transport infrastructure until 2021, however following consultation, additional funding has been identified in the first three years to enable key infrastructure (such as Otahuhu, Manukau, Te Atatu, Silverdale and Pukekohe interchanges, bus stop improvements, bus/transit lanes, bus priority and city centre bus improvements) to be delivered.
In addition to new services, AT is proposing to introduce integrated fares. Integrated fares build on the popularity of the AT HOP card, and offer the opportunity to make seamless journeys across public transport modes and services. While this will initially be across bus and train services, the inclusion of ferry services will be considered in consultation with ferry service providers. Public transport pricing will be simplified with the introduction of fewer zones. Additional cost will be incurred by crossing zone borders and not by changing services. So whether customers choose to travel by train or bus, and whether they catch one bus or transfer between bus services, a trip between the same two places will always cost the same.
Figure 18: Auckland public transport patronage 1994–2014Note: Does not take into account the patronage benefits of the CRL, which will be significant
Bus Ferry Train Accelerated Transport ProgrammmeAuckland Plan target
Ann
ual p
ublic
tran
spor
t boa
rdin
gs, m
illion
s
120
140
100
80
60
40
20
0
1994
1995
1996
1997
1998
1999
2000
2001
2002
2003
2004
2005
2006
2007
2008
2009
2010
2011
2012
2013
2014
2015
2016
2017
2018
2019
2020
2021
2022
2023
2024
2025
Auckland Plan target
140m by 2022
Transport Programmme 111m in 2025
Auckland Transport has commenced a transformational change of public transport within the region and has identified eight strategic priorities which are supported by an ongoing marketing growth strategy. These strategic priorities have been identified as an interdependent programme to deliver on the Auckland Plan target of doubling patronage to 140 million tips per annum by 2022:
1. Integrated fares2. Procurement and contract reform 3. Rail electrification4. Ferry improvements5. New network implementation6. On-time performance7. First and final leg8. Customer experience.
8.1 The New Network In the first year of this plan, AT will complete the deployment of fast, reliable new electric trains.
The next step forward for public transport will be the rollout of a simpler, better-connected bus network which offers more frequent and reliable access to more destinations. The New Network will untangle the complex web of infrequent bus services and put in place a simpler network of frequent bus services as shown in Figure 19. With the New Network and the City Rail Link in place, even more Aucklanders will have the option of fast, frequent and reliable travel, without having to use a car.
To make the most of the New Network, people will need to make some changes to the way they travel, and be willing to transfer from one public transport service to another to complete their journey. The essential infrastructure needed to support the New Network includes interchanges at Manukau, Otahuhu and Pukekohe, where buses from local suburbs can turn around, offering better frequency, while fast electric train services mean that for most passengers their trip will take less time in total.
Consultation on the New Network is progressing, and is completed for South Auckland, Green Bay/Titirangi,

64 Auckland Regional Land Transport Plan 2015-2025
Figure 19: Public transport New Network in 2022

65Auckland Regional Land Transport Plan 2015-2025
8.2 Rail The Auckland region contains over 185km of rail tracks (95 route kilometres). The vast majority is double-tracked allowing trains to move in both directions at the same time. At present 77 route kilometres are electrified and the lines served by the new electric trains. There are 42 stations in the Auckland region, the majority of which have been upgraded over the past decade. This RLTP will see the last few stations upgraded and the removal of the Newmarket level crossing.
The region contains 31 combined vehicle/pedestrian level crossings and 20 pedestrian level crossings, the majority being in the core network between Swanson and Papakura. More train movements will result in the level crossings being closed for longer a period which, in turn, leads to more congestion on the local road network. It will also increase the risk of accidents as road users (and pedestrians) may become frustrated at the delays and try and attempt to cross in front of oncoming trains.
8.2.1 City Rail Link The City Rail Link (CRL) is a 3.4km underground rail line that will connect Britomart Station with the Western Line at Mt Eden via new stations at Aotea Square and Karangahape Road. The CRL is Auckland's biggest economic development project with investment already starting to grow around the route prior to the start of construction.
The CRL will remove the bottleneck at Britomart, which currently constrains Auckland's rail access to the city centre. It will also enable the rail network to serve the busiest parts of Auckland's city centre. By providing easy, congestion-free access to the city centre, the CRL will enable a more productive local economy through faster travel times into the city. For example, the travel time between New Lynn and the city centre will reduce from 50 minutes to about 25 minutes.
Indicative travel times to City Rail Link stations
Travel times to City Rail Link stations
From To
Travel by train / bus (minutes)
Percentage improvement in
travel timeBefore CRL After CRL Reduced travel
time
New Lynn Aotea Station 51 23 28 55%
Morningside Aotea Station 39 14 25 64%
Onehunga K’ Road Station 47 27 20 43%
Manukau K’ Road Station 61 42 19 31%
Newmarket Aotea Station 27 10 17 63%
Britomart Mt Eden 16 9 7 44%

66 Auckland Regional Land Transport Plan 2015-2025
Figure 20: The City Rail Link
Providing a more frequent and reliable rail service will allow bus feeder routes to be realigned and linked to rail services, instead of providing trips across town.
In addition to providing rail users with faster, more frequent and more reliable services, the CRL will significantly reduce pressure on our roads. Relying on more buses, even with continuous bus lanes, will not help as bus congestion in the city centre is already becoming an issue.
More people using public transport to, from and through the city centre will free up parking and traffic space which can be reallocated to facilitate growing pedestrian numbers. Projects such as the Victoria Street Linear Park will encourage people to linger and enjoy being in the centre of a world class city. The successful transformations of the Viaduct, Wynyard Quarter and Britomart are a model for how vibrant and lively the heart of the city can become.
8.2.2 City Rail Link costs The CRL project consists of two construction phases. The first phase entails early enabling works, timed alongside the redevelopment of the Downtown Shopping Centre. Completing the enabling works, including a ‘cut and cover’ tunnel between Britomart and Downtown, and under Albert Street as far as Wyndham Street is a sensible sequencing of enabling works, which will minimise disruption of critical intersections in the CBD, and enable compliance with the planning conditions that only one intersection can be out of action at any one time. A more compact construction schedule at a later time would prove too disruptive.
City Rail Link 2015/16 2016/17 2017/18 2018/19 to 2024/25
Capital expenditure $m $m $m $m
City Rail Link 113.8 156.5 124.8 1,947.0
This RLTP is based on the CRL being open for business in 2023, which is consistent with the Long-term Plan. The operating costs of the new CRL stations and facilities are included in the later years of this 10-year plan as indicated in the table below:

67Auckland Regional Land Transport Plan 2015-2025
City Rail Link 2015/16 2016/17 2017/18 2018/19 to 2024/25
Operating costs $m $m $m $m
City Rail Link operating costs 89.6
8.2.3 City Rail Link value for money The CRL project has been prioritised using the methodology set out in Section 4.6, and has the following profile:
Strategic Fit Effectiveness Efficiency
City Rail Link High High Low*
The CRL has the highest strategic fit score of any project when assessed using the prioritisation methodology for this RLTP, and also scores High for effectiveness. The project is anticipated to have far-reaching benefits, many of which have not been taken into account in the current evaluation. Costs are significant because the CRL corridor was not protected in past plans, so its construction now includes substantial expenses including the purchase of land in the city centre and deep tunnelling.
8.2.4 Rail network improvements KiwiRail is the government agency responsible for the national rail network. AT and KiwiRail have worked together to develop a rail development pathway, which sets out the network investments required to deliver a robust and reliable rail network capable of supporting growth in passenger and freight services.
The pathway includes:
• Core network, capacity, resilience and electrification improvements
• Rail network renewals (including any necessary catch-up renewals)
• Improvements that support a combination of passenger and freight services (including a potential new third main trunk rail line).
Initiatives identified for completion during the 10 years of this RLTP involve network resilience, performance and capacity improvements necessary to bring the network up to a fit-for-purpose state and to provide for future passenger and freight service frequencies.
Improvements also include extending electrification to Pukekohe, future stages of the third rail line, and other improvements to separate potentially conflicting train movements as frequencies continue to increase.
Figure 21: Example of track in poor condition Figure 22: Example of track in good condition

68 Auckland Regional Land Transport Plan 2015-2025
8.2.5 Rail network challenges The performance of passenger rail services has improved over the past decade at the same time as service levels have increased significantly. Service punctuality (trains arriving within five minutes of schedule) improved from just over 70 per cent in 2005 to around 88 per cent in the year to June 2014. Delays to trains caused by network infrastructure problems dropped from an average of 1.4 minutes per train in 2005 to just over 0.4 minutes in 2014. However, further improvement in infrastructure performance will be needed if desired levels of reliability and performance are to be achieved by the opening of the CRL.
One factor in improving punctuality and reliability will be ensuring that rail infrastructure is in a fit-for-purpose condition. While there has been significant improvement in the condition of the Auckland network over the past decade through KiwiRail's DART (Developing Auckland’s Rail Transport) and AEP (Auckland Electrification Project) projects, including total replacement of the signalling system, there is still a significant extent of track and underlying formation which has not been renewed.
8.2.6 Rail network response The development pathway needed to achieve this comprises a:
Network Performance Programme – to address existing network performance issues, including catch-up renewals to address existing formation, drainage and track issues and replace sleepers.
Network Resilience Programme – to improve current network resilience to provide additional operational flexibility, ability to recover from delays and incidents, make maximum use of the existing network capacity and capability, and improve management of network maintenance and development.
Network Capacity Programme – to enable the operation of regular 10-minute peak electric train services and existing peak freight services and to provide the base for the pattern and frequency of passenger services planned for introduction following the completion of the CRL.
Level Crossing Programme – to remove level crossings on the Auckland electrified rail network to reduce safety risk for vehicles, pedestrians, cyclists and rail users through closure or grade separation, including safety improvements at existing vehicle and pedestrian crossings. The new electric trains have a safety feature enabled which enforces a reduction of speed as a train approaches a level crossing. Consequently the train operates slower on lines where there are level crossings and removing the crossing will also improve network efficiency.
8.2.7 Rail network costs The table below illustrates the cost of the rail development pathway:
Rail network 2015/16 2016/17 2017/182018/19 to
2024/25
Capital expenditure – KiwiRail ($m, inflated)
Third main trunk rail line Otahuhu/Wiri
15.4 15.8 16.3
Auckland Train Control Centre KiwiRail ITP
10.5 10.8
Crossovers 6.4 6.6 6.8 7.0
Signalling improvements 1.0 1.1
Catch-up renewals etc. 16.2 16.7 17.1 54.6
Traction 12.8 13.2 13.5 13.9

69Auckland Regional Land Transport Plan 2015-2025
Rail network 2015/16 2016/17 2017/182018/19 to
2024/25
Capital expenditure – KiwiRail ($m, inflated)
POAL access improvements 10.3 10.5
Pukekohe rail electrification 174.6
Paerata Junction/Mission Bush 13.2
Total KiwiRail network improvements 62.2 74.4 64.5 263.3
Dependent on confirmation of funding
The need for further investment in rail in Auckland over the next five to 10 years has been identified in the rail development pathway described above. KiwiRail has advised its support for the four elements of the pathway. However, delivery of the pathway has yet to be confirmed due to the lack of funding.
There is currently no clear avenue for the funding of rail infrastructure improvements. The Transport Agency is currently unable to fund rail infrastructure and KiwiRail’s investment is limited to freight projects where there is a demonstrated commercial return. Auckland Council’s role, if any, in funding rail network infrastructure improvements e.g. track, signalling and electrification is also unclear given the Auckland rail network is owned by the Crown and managed by KiwiRail.
Without confirmation of funding, the programme of improvements required to ensure a robust and reliable rail network to support future passenger and freight services cannot be implemented.
Benefits from investing in rail network improvements include:
• Providing a robust and resilient Auckland rail network to support the operation of passenger rail services at a 95 per cent punctuality by the opening of the City Rail Link
• Increasing capacity to enable the operation of regular 10-minute peak passenger rail services and to cater for expected growth in both passenger and freight services
• Incorporating extensions to the existing Auckland rail network
• Reducing safety risk, especially at level crossings.
8.2.8 Rail costs (Auckland Transport) Auckland Transport's rail costs comprise:
• The operational costs of providing a rail service and of maintaining stations and facilities
• Renewals of 42 rail stations in service on five lines, and of 57 electric trains and one maintenance depot.
These costs are summarised below:
Rail (excluding City Rail Link) 2015/16 2016/17 2017/18 2018/19 to 2024/25
Operating cost $m $m $m $m
Rail services and facilities
(excludes City Rail Link)138.2 139.6 141.1 1,049.4
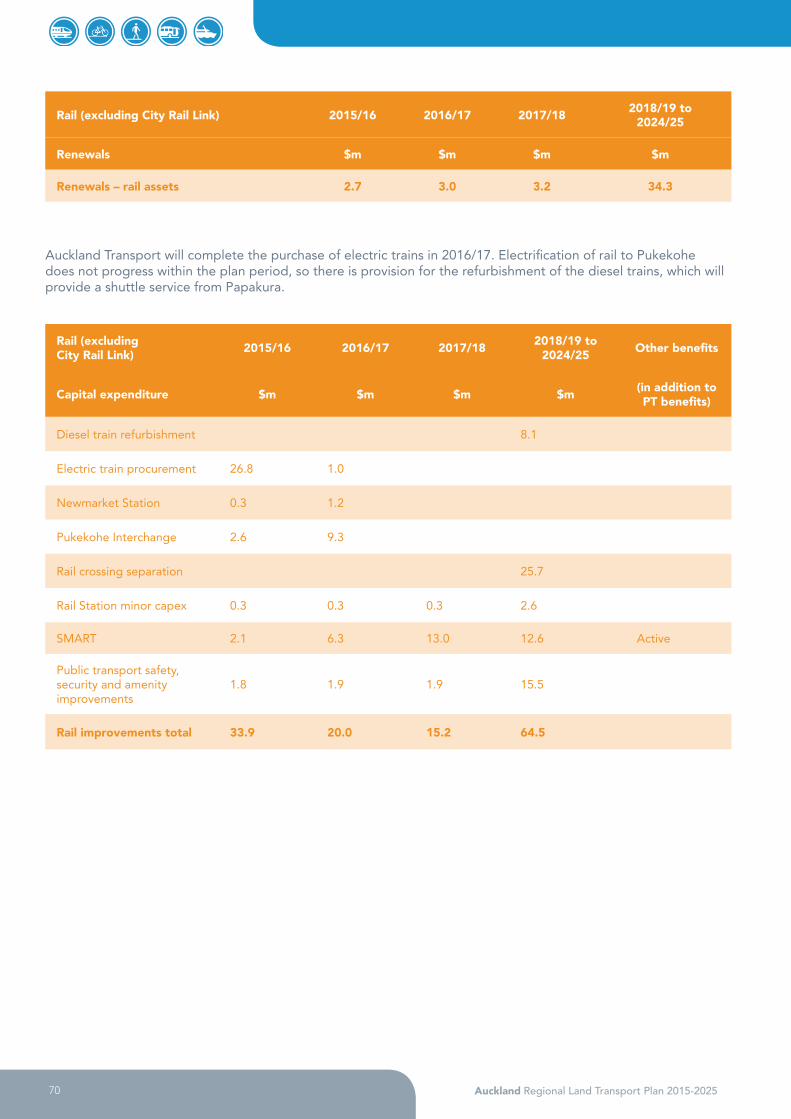
70 Auckland Regional Land Transport Plan 2015-2025
Rail (excluding City Rail Link) 2015/16 2016/17 2017/18 2018/19 to 2024/25
Renewals $m $m $m $m
Renewals – rail assets 2.7 3.0 3.2 34.3
Auckland Transport will complete the purchase of electric trains in 2016/17. Electrification of rail to Pukekohe does not progress within the plan period, so there is provision for the refurbishment of the diesel trains, which will provide a shuttle service from Papakura.
Rail (excluding City Rail Link) 2015/16 2016/17 2017/18 2018/19 to
2024/25 Other benefits
Capital expenditure $m $m $m $m (in addition to PT benefits)
Diesel train refurbishment 8.1
Electric train procurement 26.8 1.0
Newmarket Station 0.3 1.2
Pukekohe Interchange 2.6 9.3
Rail crossing separation 25.7
Rail Station minor capex 0.3 0.3 0.3 2.6
SMART 2.1 6.3 13.0 12.6 Active
Public transport safety, security and amenity improvements
1.8 1.9 1.9 15.5
Rail improvements total 33.9 20.0 15.2 64.5

71Auckland Regional Land Transport Plan 2015-2025
8.3 Light railThe Auckland city centre has the fastest population growth of any area in New Zealand, growing from 18,000 residents in 2006 to over 26,000 in 2013. Employment and tertiary numbers are also growing. The success of Auckland as a city will continue to cause congestion issues in and around the city centre. This is inevitable and to some extent a sign of a successful city and economy. However, the extraordinary growth in the city's population is creating the need for further innovative transport solutions.
The 2012 City Centre Future Access Study (CCFAS) showed that the CRL, together with surface bus improvement, provided the best regional solution. It also identified that the city centre is already facing access capacity issues across all road entry points which, if not addressed now, will steadily worsen. While the CCFAS was designed to address regional needs it also highlighted city centre access issues. These were particularly from the central and southern isthmus not served by the rail network including:
• Key arterials such as Dominion Road and Symonds Street where major bus routes will be significantly over capacity in the future, even with the CRL and surface bus improvements
• Area-specific problems, including the impact of a high number of buses on urban amenity. These include existing bus route terminations at Britomart and Wellesley Street.
To address these issues, work is under way to determine an effective public transport solution for those parts of inner Auckland and the city centre that cannot be served by the commuter rail network. The CRL will not address access from the north and the triangle from the central and southern isthmus. Critical locations such as university campuses and Wynyard Quarter cannot be served effectively by commuter rail.
Figure 23: Rapid Transit Network showing the ‘void’ in the central isthmus
Analysis of the forecast demand on the public transport network compared to the expected capacity shows many bus routes in the inner city and central isthmus being over-capacity in the near future. Increasing the number of buses on these routes will lead to greater bus congestion.
The future solution must provide additional capacity, without degrading the quality of the city centre or surrounding neighbourhoods. AT is evaluating a number of options to address this including double-deckers, bus lane expansion and bus interchanges. While many of these bus improvements still need to happen, they will not

72 Auckland Regional Land Transport Plan 2015-2025
provide sufficient capacity in the longer term to provide for the increase in Aucklanders wishing to travel into the city centre.
Following assessment of options, a light rail network that progressively expands to serve the central isthmus has been identified as the best option to overcome these issues. Similar issues and constraints in successful cities such as Sydney, Canberra and the Gold Coast have reached the same conclusion; that light rail has the ability to provide the necessary public transport capacity and support the city's intended development. Recent projects in Australasia mean significant recent experience can be drawn on for analysis.
Modern light rail solutions avoid the visual pollution of overhead lines and generate significantly less carbon emissions than the equivalent movement of passengers by bus. Figure 24 below illustrates how different modes have different capacities and travel speeds.
Figure 24: Mode capacity – comparison of carrying capacity of buses, light rail and commuter rail
Mode type Average speed (km/hr) Maximum capacity (people/hr)
Bus shared path 10–14 2,500
Bus lane separate 14–18 4,000
Busway priority 15–22 6,000
Light rail shared path 15–22 12,000
Light rail priority 18–40 18,000
Commuter rail 18–40 20–25,000
Studies of the most suitable routes for light rail have been assessed and the following routes are considered the most appropriate:
• Queen Street • Symonds Street • Dominion Road • Sandringham Road • Manukau Road • Mt Eden Road.
It is perhaps unsurprising that these routes are similar to those which operated in Auckland until the mid 1950s, providing an effective means of moving large numbers of Aucklanders around before cars were in widespread use.
The development of a light rail network also opens up the potential for this mode to be considered for the long-term travel solutions to the airport, the North Shore and other possibilities.
The potential cost of light rail is significant. While expensive to implement, the on-going operating cost is lower than the equivalent bus fleet and the benefits of the initial investment extend over generations. The capital cost of this activity is not provided for in this RLTP or in the Long-term Plan. AT is undertaking further investigations within its operating budget. Funding options are being evaluated, including the potential to introduce private sector investment.
Next steps include further analysis and planning, including refinement of cost, funding and procurement.
Light Rail Transit 2015/16 2016/17 2017/18 2018/19 to 2024/25
Operating costs $m $m $m $m
Light Rail Transit operating costs 2.9 2.9 2.9 20.3

73Auckland Regional Land Transport Plan 2015-2025
8.4 Rail outcomes The table below shows the rail projects in the programme and the outcomes that these improvements will bring.
What gets delivered in this
programme
The programme incorporates the following activities:
• City Rail Link
• Removal of Newmarket Level Crossing at Sarawia Street
• $90 million from 2020 to facilitate significant improvements to other rail level crossings
• $1.8 million pa throughout the programme period for public transport safety, security and amenity improvements, to be spread across the bus, rail and ferry networks
• Additional electric trains.
Outcomes from investment
• City centre rail stations and Britomart as a through station, opening up the entire rail network for faster, more frequent services.
• Longer and more frequent trains reduce future overcrowding.
• Improved safety at rail level crossings and elsewhere on the network.
8.5 Bus, ferry and multi-modal public transport The rollout of the public transport New Network will deliver the routes, frequencies and service levels set out in the Regional Public Transport Plan. These changes are underpinned by new contracts and a new way of working with service providers. A key aim of these new contracts is to give AT the tools it needs to untangle the ‘spaghetti’ of bus routes and services that grew up over decades of operator-dominated service provision, and put in place a logical network of frequent, reliable, connected routes. The public transport New Network will provide more direct routes, and more frequent services; however more customers will need to transfer between services to reach their destination.
While the New Network and new Public Transport Operating Model each have significant impacts on budgets at a detailed level, overall operational budgets have been prepared on the basis that most of the proposed changes will be cost neutral. For example, it is assumed that the cost to AT is the same for net contracts (in which the operator keeps all revenue) and gross contracts (in which AT pays the full cost of running the service, and also keeps the revenue). What does change however is the risk. Under gross contracts, AT stands to lose money from any drop in patronage, and must ensure it has the staff and systems in place to continuously build customer satisfaction and patronage.
Ferry services continue to add patronage albeit at a rate slower than rail and bus. New contracted ferry services are proposed to increase frequency and provide greater capacity across the ferry network. Some of these services will support proposed growth in the Gulf Harbour and Hobsonville areas.
In addition, the quality of the service provided to public transport users will be enhanced by providing timetable and fare/ticketing information, promotion and marketing and maintaining our public transport facilities such as the Northern Busway stations and ferry wharves.
8.5.1 Bus, ferry and multi-modal costs Bus service costs are the single largest item of operating expenditure for AT. Over the 10 years of this plan, the cost of bus and ferry contract costs increase more slowly than patronage, so the proportion of costs recovered from fares is forecast to reach 50 per cent (range 49%–52%) by 2018 and to stay at this level until 2025. These improvements to efficiency only partly offset the inevitable increases in costs as patronage grows, so operating budgets increase each year.

74 Auckland Regional Land Transport Plan 2015-2025
Bus, ferry and multi-modal 2015/16 2016/17 2017/18 2018/19 to 2024/25
Operational activities $m $m $m $m
Bus services and facilities 172.7 281.6 323.1 2,585.0
Ferry services and facilities 19.5 29.0 36.1 286.7
Public transport ticketing, marketing and information services
39.9 40.1 41.6 297.8
Bus, ferry and multi-modal activities total 232.1 351.5 400.8 3,169.6
Auckland Transport is responsible for maintaining and renewing:
• Five busway stations
• 2,342 bus shelters
• Approximately 5,500 park-and-ride bays at rail, ferry and bus stations
• 21 ferry wharves.
Costs associated with the renewal, maintenance and operation of these assets are growing as the number of facilities expands. These consequential operational costs are becoming a major factor in transport costs, as the transport system becomes more complicated.
Bus, ferry and multi-modal 2015/16 2016/17 2017/18 2018/19 to 2024/25
Renewals $m $m $m $m
Renewals – bus assets 0.9 1.1 1.1 8.5
Renewals – wharves and ferry terminals 2.3 2.4 2.5 19.4
Renewals – multi-modal 0.1
Renewals – bus, ferry and multi–modal 3.2 3.5 3.6 28.0
The major costs in bus, ferry and multi-modal are the Otahuhu Bus Interchange and the city centre bus infrastructure requirements for the Downtown Interchange.
Otahuhu Bus Interchange will enable passengers to make bus to rail and bus to bus transfers in a comfortable and convenient interchange. Without the interchange, it will be difficult to implement the New Network in the South.
The city centre bus infrastructure project (including Downtown Interchange project) aims to reduce bus congestion in the city centre. It will be designed in such as a way as to complement other activities proposed to be undertaken in the city centre such as the CRL and light rail.

75Auckland Regional Land Transport Plan 2015-2025
Bus, ferry and
multi-modal 2015/16 2016/17 2017/18 2018/19 to
2024/25 Other benefits
Capital expenditure $m $m $m $m(in addition to
public transport benefits)
Bus infrastructure
Bus stop improvements programme
3.7 2.3 2.3 11.4
City centre bus improvements 2.1 15.8 16.2 72.5
Te Atatu bus interchange 0.5 4.7
Bus station minor capex 0.1 0.1 0.1 0.9
Manukau Bus Interchange (Lot 59)
9.5 11.5
Otahuhu Bus Interchange 14.4 3.8
Bus lane improvement 4.0 5.6 5.8 52.9
Northern Busway extension new stations
6.4
Ferry infrastructure
Wharves capex – minor 0.6 0.6 0.6 5.2
Multi-modal infrastructure
AT Metro business technology 1.1 1.2 1.2 7.0
AIFS infrastructure and equipment
1.8 1.9 4.2 28.1
Public transport on-street information and retail capex
1.5 1.6 1.6 9.5
Double decker network mitigation works
6.5 6.2 6.4 7.7
Public transport integrated fares
6.2
Bus, ferry and multi-modal total 52.0 55.3 38.5 201.4

76 Auckland Regional Land Transport Plan 2015-2025
8.6 Public transport – value for money
8.6.1 Public transport services The benefits of public transport services have been assessed using the prioritisation methodology set out in Section 4.6.
• The strategic fit of public transport services is High because of the importance of urban public transport in contributing to the goals of the Auckland Plan and the Government Policy Statement.
• Effectiveness is High because public transport services are part of an integrated plan to achieve multiple outcomes (the Regional Public Transport Plan).
• Efficiency compares the costs of public transport services against the Transport Agency's assessment of the dollar value of benefits. For public transport, there are two types of benefits:
o benefits to users, some of whom do not have the choice to travel by car o benefits to road users due to less traffic on congested roads.
Bus and ferry services have High economic efficiency, but rail services are rated Medium because of their higher cost.
Strategic Fit Effectiveness Efficiency
Bus services High High High
Rail services High High Medium
Ferry services High High High
8.6.2 Public transport infrastructure Each public transport infrastructure project has been separately assessed for strategic fit, effectiveness and efficiency, as set out in Section 4.6. Some general patterns are:
• As with public transport services, most public transport infrastructure projects included in the budget have High strategic fit
• Effectiveness varies. Projects early in the planning stages may improve their effectiveness rating during the term of this plan as there is more time to consider options and develop a robust business case
• Efficiency is the ratio of the benefits of a project to its costs and will always vary between projects, but there are some patterns:
o park-and-ride projects in the outer reaches of the public transport network, where land costs are low and trip lengths are long, gain a High efficiency rating
o Bus interchange projects in the city centre are essential to the rollout of the public transport New Network, which is forecast to significantly increase bus patronage, so these projects gain a High efficiency rating.
8.7 Public transport outcomes The table below shows the major projects in the programme and the outcomes that these improvements will bring.

77Auckland Regional Land Transport Plan 2015-2025
What gets delivered in this
programme
The following items are included within the first three years of the programme:
• 45 additional km of bus lanes, including the airport route, Ellerslie-Panmure Highway, Pakuranga Road, Ti Rakau Drive, parts of Great South Road and Great North Road, Greenlane West, Mt Eden Road, Manukau Road and Remuera Road.
• Double deckers enabled on 42km of the frequent bus network.
• Essential New Network infrastructure completed – interchanges at Otahuhu, Manukau, Te Atatu, Pukekohe and Silverdale.
• Park-and-ride extensions at Silverdale and Papakura, replacement facilities at Glen Eden and Hob-sonville.
• 600 new bus stops.
Outcomes from investment
• Increased public transport boardings.
• Substantial travel time savings for existing and new users.
• Successful rollout of the integrated public transport New Network – reducing duplication and increasing frequency across the network.
• Network efficiency and cost recovery improvements – from increased demand and peak vehicle savings due to faster and more reliable services.
• Increased capacity from double deckers reduces overcrowding and allows for patronage growth in high demand corridors.
• Improved safety and security from ongoing investment in CCTV and minor safety and security projects.
The proposed performance measures for public transport are set out below, along with the targets achievable within funding constraints.
Level of service
statement
Performance measure
Actual 2013/14
Annual Plan
2014/15
Long-term Plan targets
2015/16 2016/17 2017/18 2018/19- 24/25
Prioritise rapid, high frequency public transport
Total public transport boardings (millions)
72.4 73.7 84.5 89.0 93.0Increasing to 110.7
Boardings on rapid or frequent network (rail, busway, FTN bus)
TBA (new measure)
New Measure
Increase at faster rate than total boardings
Increase at faster rate than total boardings
Increase at faster rate than total boardings
Increase at faster rate than total boardings

78 Auckland Regional Land Transport Plan 2015-2025
Level of service
statement
Performance measure
Actual 2013/14
Annual Plan
2014/15
Long-term Plan targets
2015/16 2016/17 2017/18 2018/19- 24/25
Transform and elevate customer focus and experience
Public transport punctuality (weighted average across all modes)
85.9%New
measure92% 93% 94%
Average 95%
Customer satisfaction index – public transport
81.4% 83% 83% 84% 85% 85%
Ensure a sustainable funding model
Public transport farebox recovery %4
45.4%New
Measure46-48% 47-50% 49-52%
Average 50%+

79Auckland Regional Land Transport Plan 2015-2025
9. SUPPORTING AUCKLAND'S GROWTH AND INTENSIFICATION
KEY OUTCOMES
• Special Housing Areas and pre-existing growth areas are supported.• Targeted transport funding available to ensure Housing Accord targets are met
and that key growth locations are supported.
The 2013 Census counted a usually resident population of 1.42 million people in the Auckland Region, a growth of over 110,000 people since 2006 – roughly the population of Tauranga in a seven-year period. Over the 10 years of this RLTP it is forecast that Auckland's population will grow by around 270,000, with a proportional (or faster) increase in jobs (17).
Auckland Council anticipates that to accommodate this growth, 109,000 new dwellings and 4.3 million square meters of business space will need to be built over the next 10 years, along with the roads and public transport services to support them.
The transport impacts of Auckland's growth are not confined to projects which are directly associated with plan changes and decisions of the Environment Court, but even by this narrow definition AT currently has obligations to deliver 38 growth-related projects during the 10 years of this RLTP. The most significant of these projects are in Wynyard Quarter, the North West Transformation Area (Massey/Hobsonville/Whenuapai), Long Bay and Manukau City Centre.
Over the next 10 years new obligations will be added to this list, particularly in the Special Housing Area (SHA) projects in Scotts Point, Red Hills, Wesley, Kumeu and Hingaia. Auckland Council and Central Government have agreed to fast track development in the SHAs, to address the shortage of affordable homes in Auckland. Better transport connections to these areas are an essential component of the overall Housing Accord.
In addition to the SHAs, transport improvements are also needed to support the development and intensification of Auckland's spatial priority areas as shown in Figure 25.
The transport impacts of growth extend beyond the growth areas themselves, as more people create demand for more road space and more public transport right across Auckland. While the transport needs of growth areas are a current focus, the majority of the growth in Auckland's population will continue to be in existing built up areas.
AT and the Transport Agency are continuously upgrading state highways, local roads and public transport networks to cope with continually increasing demand. Without these upgrades, levels of service will get progressively worse as Auckland's population grows.
This is especially true if there is no improvement in public transport. While Auckland has, in the Proposed Auckland Unitary Plan, a strategy to accommodate the population of another Tauranga every seven years, providing for the number of cars in Tauranga to be added to the Auckland vehicle fleet every seven years is clearly not an option.
While the remainder of this section focusses on specific AT growth-related projects, the Transport Agency's state highway projects play a fundamental role in supporting Auckland's growth. See Chapter 6 for more detail.

80 Auckland Regional Land Transport Plan 2015-2025
Figure 25: Auckland spatial priorities and Special Housing Areas
!
!
!
!
!
!
!
!
!
!
!
!
Albany
Henderson
New Lynn
CityCentre
Newmarket
SylviaPark
Manukau
Manurewa
Papakura
Takapuna
Botany
Westgate /Massey
North
±
This map/plan is illustrative only and all informationshould be independently verified on site before takingany action. Copyright Auckland Transport. Land Parcel Boundary information from LINZ (Crown Copyright Reserved).Whilst due care has been taken, Auckland Transport gives no warranty as to the accuracy and completeness of any information on this map/plan and accepts no liability for any error, omission or use of the information.Height datum: Auckland 1946.
Job Code:
0 3 6
KilometresSpatial PriorityAreas
@ A4Scale 1:250,000
Date: 15/09/2014AT14141
0 2.5 5
Kilometers
Pukekohe
Legend
Rural Urban Boundary
Metropolitan Area
Special Housing Areas (Tranche 1-4)
Spatial Priority Areas
Motorway
RTN
Warkworth
0 2 4
Kilometres

81Auckland Regional Land Transport Plan 2015-2025
9.1 Growth projects
9.1.1 Growth project costs The following projects in the programme relate to known growth areas.
Transport improvements – growth 2015/16 2016/17 2017/18 2018/19 to 2024/25 Other benefits
Capital expenditure ($m, inflated) (in addition to growth benefits)
Brigham Creek Road Corridor improvements
10.7 Active
Huapai North transport mitigation (PC 127)
2.5
Improvements complementing developments
0.8 0.8 0.9 12.8
Long Bay Glenvar Ridge Road 3.1 2.7 2.6 Active
Mill Road (Northern) 3.1 3.2 3.2 123.9 PT, Active
Murphys Road upgrade bridge improvements (Plan Change 20)
4.4 4.5 Active
North West Transformation (NORSGA PC 14 Hobsonville Village)
22.8 Active
North West Transformation (NORSGA PC 15 Massey North Town Centre)
17.1 14.0 6.2 7.1 PT, Active
Ormiston Town Centre main street link 1.5 5.5
PC 12 Drury South transport implementation
3.1 25.8 15.1 22.6
Penihana North transport mitigation (PC 32)
0.4 Active
Transport improvements – growth 28.7 56.5 32.5 202.9
Auckland Council has also decided to establish a $398 million, 10-year, Local Residential Growth Fund which provides a ring-fenced budget for transport-related projects that enable growth and development in Auckland. The fund, which equates to $35 million per annum (plus inflation) for each of the next 10 years, is intended to provide AT with the ability to respond quickly to evolving growth and development needs in Auckland. This is particularly relevant for SHAs, where developments are expected to be fast tracked.
The criteria for prioritising projects for the Local Residential Growth Fund are yet to be finalised, however the following factors will be taken into account.
• Delivers housing outcomes (SHAs or already approved growth location)
• Aligns with the availability of other infrastructure (water, wastewater etc.)
• Project should be approximately 75 per cent growth related/funded

82 Auckland Regional Land Transport Plan 2015-2025
• For locations where deliverability of subsequent housing has been confirmed (e.g. commitment from developer)
• The need for infrastructure is evidence based and documented – e.g. identified as required in a Resource Manage-ment Act Plan Change, resource consent, or an integrated transport assessment.
Note the fund is:
• Not intended to replace developer local infrastructure obligations unless by special agreement and where costs are fully recoverable
• Intended to facilitate growth where there are multiple landowners involved.
The budget will be used to facilitate the following types of projects:
• Growth-based initiatives in SHAs and other residential growth locations.
• Local scale initiatives (e.g. new local roads and intersection upgrades – not major regional improvements such as Mill Road).
• Initiatives where developers have demonstrated their ability to deliver growth within agreed timeframes.
• Road, walking and cycling, and public transport improvements are all eligible for the fund.
The fund will predominantly be paid for through local development contributions.
Transport improvements – growth 2015/16 2016/17 2017/18 2018/19 to
2024/25 Other benefits
Capital expenditure ($m, inflated) (in addition to
growth benefits)
Local Residential Growth Fund 35.0 35.9 36.8 290.6
The following are a selection of example projects that are being considered for delivery under the Local Residential Growth Fund:
• Albany – Medallion Drive extension, Gills to Oteha Valley connection
• Long Bay Southern Corridor improvements
• Paerata Rail Station
• Flat Bush – Chapel Road, Flat Bush School Road East, Thomas Road, McQuoids Road
• New Lynn – Crown Lynn Regeneration – new public roads
• Hingaia Peninsula roading improvements
• Takanini growth area roading improvements
• Station/Tapu/SH16 intersection improvements in Kumeu/Huapai
• Whitford-Maraetai Road/Jack Lachlan intersection improvements
• New and improved local roads at Whenuapai, Scotts Point and Hobsonville.
9.1.2 Growth projects – value for money Generally, growth projects perform poorly in a value-for-money assessment relative to projects which solve existing problems. If transport infrastructure is provided before new developments are built, then in comparison to the existing urban area there are no current issues to resolve. This needs to be balanced by considering other factors including:
• The extra costs and difficulties of retro-fitting transport improvements once an area is already built up
• The opportunity to provide attractive transport options from the start, before the habit of daily car travel becomes part of people's lifestyles
• Legal obligations arising from Environment Court decisions or Plan Changes
• Obligations placed on AT through Development Contributions paid to Auckland Council.

83Auckland Regional Land Transport Plan 2015-2025
The table below shows the major projects in the programme and the outcomes that these improvements will bring.
What gets delivered in this
programme
• North West Transformation, Flat Bush and Long Bay Glenvar Ridge Road projects delivered by 2019.
• Mill Road and other regional arterial improvements included to support growth areas.
• A Local Residential Growth Fund is established to provide dedicated funding to support pre-exist-ing regional growth locations and the successful delivery of Special Housing Areas.
Outcomes from investment
• Special Housing Areas and pre-existing growth areas are supported.
• Targeted transport funding available to ensure Housing Accord targets are met and that key growth locations are supported.

84 Auckland Regional Land Transport Plan 2015-2025
10. WALKING, CYCLING AND TRAVEL DEMAND MANAGEMENT
KEY OUTCOMES
• Increased level of cycling • Safety benefits• Auckland leverages the Urban Cycleways Fund• Health and environmental benefits• Improved links to public transport.
Walking, cycling and travel demand management are expected to become an increasing focus over the coming years, for the following reasons:
• More intense urban developments, so more people live within walking and cycling distance of more destinations
• Population growth, a renewed interest in city living and Auckland's ageing population. Good footpaths are useful for people of all ages, but for children, older adults, and those with disabilities, they are essential
• A decrease in per capita car travel
• Improvements to public transport leading to more focus on the ‘first and last leg’ of public transport journeys
• Growing popularity of cycling for recreation and transport and increased demand for safe cycling facilities
• Growing interest in health, community and social benefits from active transport in a world-class city
• Constrained funding and limited opportunities to expand road capacity leading to an increasing focus on manag-ing demand and optimising the efficiency of the transport network.
10.1 Place Roads are not just for travelling along; adjacent to roads are places where people live, work, study and gather. Our arterial roads tend to go through the region’s historic town centres, as shown in Figure 26. Over time, more people are choosing to live in the Auckland city centre, metropolitan centres and in town centres, where it is easy to shop, work and socialise close to home. Consequently it is important to consider the places along the road as opposed to just the movement function.
AT's role in getting Auckland moving operates within important constraints which protect the places we value. On a purpose-built arterial road, buildings are set well back, access is restricted and the movement of vehicles takes priority. In a town centre, by contrast, the place values will be high and any changes to the road will need to put the highest priority on walking, cycling, safety and liveability.
Good planning for walking and cycling is inseparable from good land use planning – distances seem much shorter if the journey is safe and interesting. AT works with Auckland Council, local boards and other council-controlled organisations to maintain and improve streetscapes so more people will naturally walk and cycle for short trips.
There will always be a tension between providing attractive, walkable, bikeable streetscapes which support a local sense of place and community, and moving more vehicles along a constricted road corridor. There are no easy answers to this issue, but having clearly identified and prioritised place values enables the inevitable trade-offs to be made in a clear and transparent way.

85Auckland Regional Land Transport Plan 2015-2025
Figure 26: Major centres (high place values) and major roads
I2
I2
I2
I2
I2
I2
I2
I2
I2
I2
I2
I2
I2
I2
I2
I2
I2
I2I2
I2I2
I2
I2
I2
I2
I2
I2I2
I2
I2
I2I2
I2
I2
I2
I2
I2
I2
I2
I2
I2
I2
")
")
")
")
")
")
")
")
!
!
!
!
!
!
!
!
!
!
!
!
!
!
!
!
!
!
!
!
!
!
! !
!
!
!
!
!
!
!
!
!
!
!
!
Albany
New Lynn
Newmarket
SylviaPark
Manukau
Papakura
Takapuna
Westgate /MasseyNorth
Orewa
BrownsBay
Milford
Glenfield
Northcote
Highbury
Te AtatuPeninsula
Henderson
GlenEden
Avondale
Mt Albert
Pt Chevalier
RoyalOak Onehunga
GlenInnes
Pakuranga
Otahuhu
MangereOtara
Papatoetoe
Manurewa
Remuera
Ellerslie Panmure
HuntersCorner
Howick
Sunnynook
Takanini
Ormiston
St Lukes
Whangaparaoa
ThreeKings
Silverdale
Botany
Morningside
HighlandPark
±
This map/plan is illustrative only and all informationshould be independently verified on site before takingany action. Copyright Auckland Transport. Land Parcel Boundary information from LINZ (Crown Copyright Reserved).Whilst due care has been taken, Auckland Transport gives no warranty as to the accuracy and completeness of any information on this map/plan and accepts no liability for any error, omission or use of the information.Height datum: Auckland 1946.
Job Code:
0 2 4
KilometresTown Centres withMajor Road Network
@ A4Scale 1:220,000
Date: 23/09/2014AT14141
Legend
! Town Centre
") Metropolitan Centre
I2 Rail Stations
Railway
Motorway
Arterial
Major Road
Rural Urban Boundary

86 Auckland Regional Land Transport Plan 2015-2025
10.2 Walking In terms of trip numbers, walking comes a close second to driving, with over half a million walk-only trips each day on Auckland's 6,956km of footpaths. If trips on public transport and by car which begin and/or end with a walk are included, walking is the most common way to travel. Walking is great for communities, for health and for the environment, and frees up space on the transport network for people who need to travel longer distances.
Walking to school is a great start to a lifetime of walking. Most primary school children want to walk to school; it is their parents who choose to drive (18). AT's TravelWise Schools programme now works with 408 schools to make it easier and safer to walk, bike or bus to school. In the nine years that the TravelWise programme has been operating, Auckland's TravelWise Schools have achieved a 58 per cent reduction in injury crashes involving child pedestrians and cyclists in their local areas. There are also 12,736 fewer car trips each morning peak as a result of the programme. Taking these trips off the network makes a huge difference to traffic congestion, because so many of Auckland's schools are located on busy, congested roads.
The TravelWise schools programme is supported by the Safety around Schools capital project, which is included in Chapter 11 – Safety.
10.3 Cycling In the Auckland region cycling as a transport mode generates a small proportion of the total number of trips. About one percent of journeys to work are by cycle, however this does not represent cycling potential, for example in some European cities about a third of trips are by bicycle.
10.3.1 The Auckland Cycle NetworkAlmost one in four Aucklanders already owns a bicycle and cycling has grown 23.8 per cent since 2010 but further growth is constrained by a lack of dedicated cycleways. Surveys indicate a sizeable latent demand for safe cycling facilities. The number of people cycling is growing fastest where new facilities are provided as part of the Regional Cycle Network (ACN), proving that the ‘build it and they will come’ approach is working. The ACN comprises more than 1,000km of safe, connected on- and off-road cycle facilities. The network is shown in Figure 27 and has three levels:
• Cycle metros are separate facilities on main routes, for example the North Western Cycleway
• Cycle connectors may be on-road cycle lanes, or off-road shared paths, designed to provide safe and direct routes for cyclists
• Cycle feeders link schools, parks and community destinations to each other and to the network.
Metro and Connector links provide the backbone of the ACN and can have a dramatic impact on ridership. These routes will deliver a high level of service for cyclists and link key destinations in Auckland. The delivery of these links will be prioritised to those areas most likely to result in the highest increase in cycle numbers, in and around the city centre and around public transport hubs.
Feeder routes or greenways along quiet streets, through parks and along streams, encourage people to walk or cycle for short trips around their local community. Off-road facilities are the natural place to learn to cycle and encourage parents to let their children travel independently. Cycling among young people has declined over past decades; in 1990 over a quarter of intermediate and secondary school-aged children cycled regularly (19), but today almost half (49%) of Auckland's intermediate and secondary schools have no students arriving to school by bicycle. In contrast, schools in areas with good off-road cycle networks, including Belmont, Okiwi, Hobsonville Point and Silverdale, recorded over 20 per cent of the school roll cycling to school (20).
10.3.2 The cycle programmeThe government has recognised the growing demand for cycling and has announced a $100 Urban Cycleway Fund to be used on new cycleways and walkways across the country. AT and the Transport Agency submitted packages for funding and have been allocated $24.75 million to accelerate the ACN.
This RLTP contains a programme of dedicated cycle projects and cycling links delivered through road construction and road maintenance projects. Cycle training programmes and awareness campaigns, aimed at drivers as well as

87Auckland Regional Land Transport Plan 2015-2025
cyclists, are an essential part of the package.
New cycleways are planned to complement existing facilities and to form a connected network. The Waterview Shared Path is one of these projects; it links into existing infrastructure and has the potential to lead to a significant increase in cycling. Priority areas for cycle parking are also identified as part of the network.
Figure 28 shows the priority projects for the next three years that will deliver the largest three-year cycle programme Auckland has undertaken.
The target set in the Auckland Plan is to complete 70 per cent of the ACN by 2022, and 100% by 2030. Despite this accelerated investment, that target will not be met until after 2040.
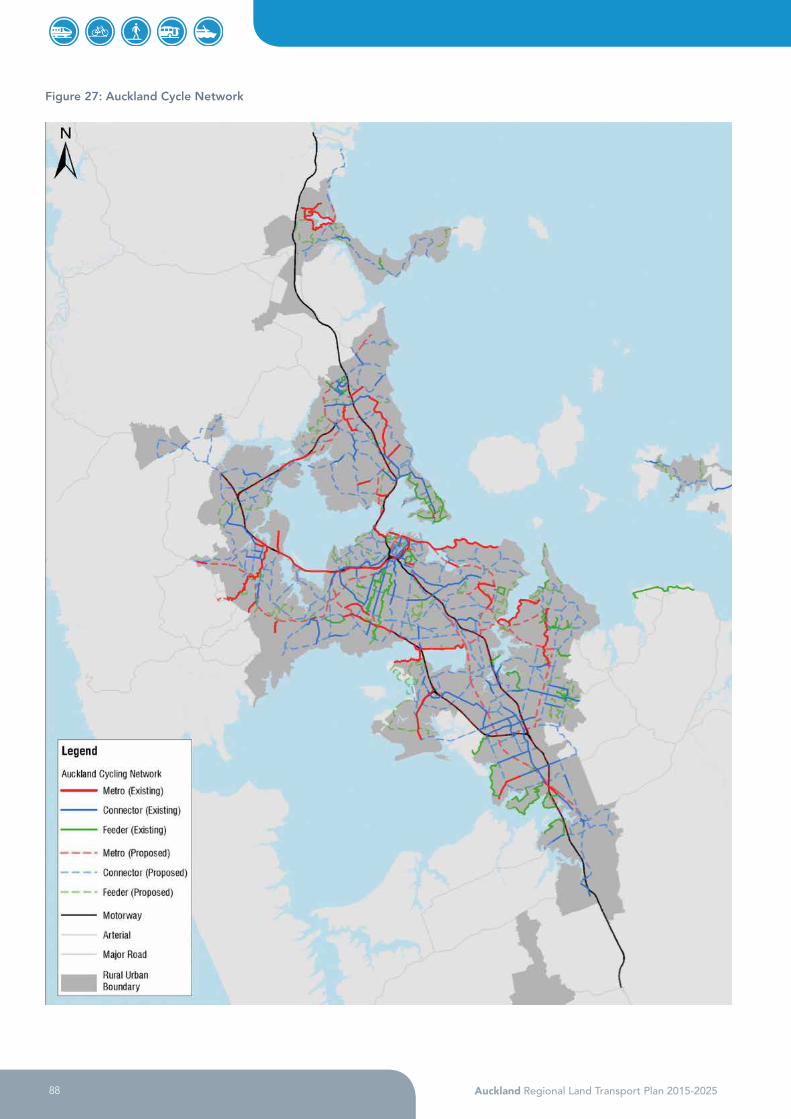
88 Auckland Regional Land Transport Plan 2015-2025
Figure 27: Auckland Cycle Network

89Auckland Regional Land Transport Plan 2015-2025
Figure 28: Progress on Auckland Cycle Network 2015–2018

90 Auckland Regional Land Transport Plan 2015-2025
10.4 Travel demand management Travel demand management (TDM) initiatives are delivered to commuters through travel planning with businesses, business associations and tertiary institutes and personalised journey planning programmes with individual commuters. Travel demand programmes are also linked to maximising the benefits of new infrastructure and services and improving accessibility to key employment destinations, town centres and public transport.
Auckland Transport manages the Commute programme, which supports Auckland businesses, business areas and tertiary institutes to encourage commuting and business travel by means other than the single occupant vehicle. Commute projects are cost effective, delivering over $8.60 in decongestion benefits for every dollar spent, and taking 3,800 cars off the road each morning peak.
Personalised journey planning (PJP) projects have been a recent innovation to the programme and have linked to public transport service and infrastructure improvements but also support walking, cycling and carpooling. Around half of participants who completed PJP have made a shift from single driver private car use to public transport, carpooling and active modes for their regular commute.
10.5 Walking, cycling and TDM costs
10.5.1 Walking, cycling and TDM Auckland's 6,956km of footpaths require regular maintenance and periodic renewals in order to continue to link local communities, provide a safe and attractive option for short trips and to add to the value of adjacent property. AT uses its Asset Management planning model to set the level of operational, maintenance and renewal expenditure at a level that minimises whole-of-life costs, while also taking into account required service levels.
Other elements of attractive streetscapes, besides footpaths, also need a high level of maintenance. The Transport Agency does not currently subsidise the maintenance of footpaths or ‘amenity’ features such as footpath lighting (as distinct from streetlights), amenity planting or street furniture. Yet walking trips have a vital role in the wider transport network.
Key activities delivered through the operational budgets below are:
• The TDM programme including Travelwise Schools and the Commute programmes
• Planning for the Auckland Cycle Network and monitoring implementation and uptake
• Progressing walk and cycle infrastructure projects through the investigation phase
• Delivering walking and cycling road safety activities
• Delivering cycle training to over 1,000 people each year and working with cyclist groups to promote cycling for fun and transport.
Walking, cycling and TDM 2015/16 2016/17 2017/18 2018/19 to 2024/25
Operating cost $m $m $m $m
Footpath maintenance 3.1 3.1 3.1 21.8
Travel demand management 2.2 2.2 2.2 15.7
Walking, cycling and TDM total 5.4 5.4 5.4 37.5
Auckland Transport has moved to an integrated asset management approach in which levels of renewals for footpaths are set based on where people walk most often, with the priority given to the city centre, town centres and transport hubs, rather than according to legacy council areas. However, the move to regionally consistent levels of service has highlighted some areas of past underinvestment, and renewals budgets need to increase over

91Auckland Regional Land Transport Plan 2015-2025
the decade to avoid much higher asset replacement costs and ensure levels of service are met.
Walking, cycling and TDM 2015/16 2016/17 2017/18 2018/19 to 2024/25
Renewals $m $m $m $m
Renewals – footpaths 14.5 16.7 17.5 135.1
The proposed transport programme provides for over $100 million to be spent on new cycleways and walkways over the next three years. The government’s Urban Cycleways Fund (UCF) is providing $24.75 million of the funding for cycleways over the first three years of the RLTP 2015–25. The funding proportion for the overall programme is one-third Auckland Council share investment, one-third Transport Agency co-investment, and one-third UCF.
Walking, cycling and TDM 2015/16 2016/17 2017/18 2018/19 to 2024/25
Capital expenditure $m $m $m $m
Local board initiatives 10.3 10.5 10.8 85.9
Walking and Cycling Programme 24.6 35.8 57.6 74.7
Waterview Shared Path 3.6 1.8
Walking, cycling and TDM total* 38.5 48.2 68.5 160.5
*Excludes improvements delivered as part of wider road or public transport projects
10.5.2 Walking and cycling – Transport AgencyThe Transport Agency has constructed some of Auckland's most popular cycle links including the North Western Cycleway. In the 10 years of this plan, the Transport Agency is proposing to build a number of priority links in the ACN.
The Old Mangere Bridge scheme will replace the current structure which has been permitted for use solely by pedestrian and cyclists since the first motorway crossing of the Manukau Harbour was completed in 1983. The new structure will be designed for the exclusive use of walkers and cyclists, supporting the current use of the route.
Several of the Transport Agency's major roading projects include a walking and cycling component. For example, the Western Ring Route includes improving and extending the North Western Cycleway. The Northern and Southern Cycleway projects are closely linked to the improvements described in Chapter 6 State Highways.
In addition, the Transport Agency will be linking to the privately funded Skypath across the Auckland Harbour Bridge into the Wynyard Quarter, by funding a project called Seapath, which will connect Takapuna and the North Shore suburbs to the Skypath.

92 Auckland Regional Land Transport Plan 2015-2025
Walking and cycling 2015/16 2016/17 2017/18 2018/19 to 2020/21
2021/22 to 2024/25
(indicative)Capital expenditure – NZ Transport Agency ($m, inflated)
Eastern Rail Cycleway (Glen Innes to Tamaki Drive)
5.1 5.6
Grafton Gully Connection 1.1
Nelson Street Downtown Cycleway 5.5
Northern Cycleway 0.4 0.6 3.6 3.6
Old Mangere Bridge Replacement 9.8 4.0
SeaPath 11.1 10.5
SH20B (Puhinui Road) Cycleway 0.5
Southern Cycleway 0.4 0.6 3.6 3.6
Walking and cycling – Transport Agency 33.9 11.3 7.2 7.2 50.8
10.5.3 Walking and cycling – value for money Auckland Transport is confident that investments in footpaths, streetscapes, cycleways and the promotion of walking and cycling are targeted to enhance delivery of the Auckland Plan. Programmes have been aligned to levels of service defined through the Integrated Transport Programme, and detailed asset management planning links activities and costs to this level of service framework. Transport modelling has confirmed the significant transport benefits possible, for limited cost, through shifting even a small proportion of short trips from car to either walking or cycling.
Recent changes to Transport Agency policy have made evaluation procedures more consistent across all transport modes, and this has meant that cycling projects score much better on a value-for-money assessment than under the previous processes. That said, it remains very difficult to assess some categories of project, especially those which improve walking environments (such as pram crossings) and the local board projects which are not subject to an AT evaluation.
The benefits of road network management and optimisation have been assessed using the prioritisation methodology set out in Section 4.6.
• The strategic fit, which is High because of the priority given to walking and cycling in the Auckland Plan and the Government Policy Statement on Land Transport Funding.
• Effectiveness is High for most of the specific projects assessed.
• Efficiency compares the costs against the Transport Agency's assessment of the dollar value of benefits. This is High on average for all of the individual projects assessed within the cycling and walking programme, as detailed in Section 16.2 and is also High for the road safety improvements around schools.
Strategic Fit Effectiveness Efficiency
New cycleways and walkways High High High
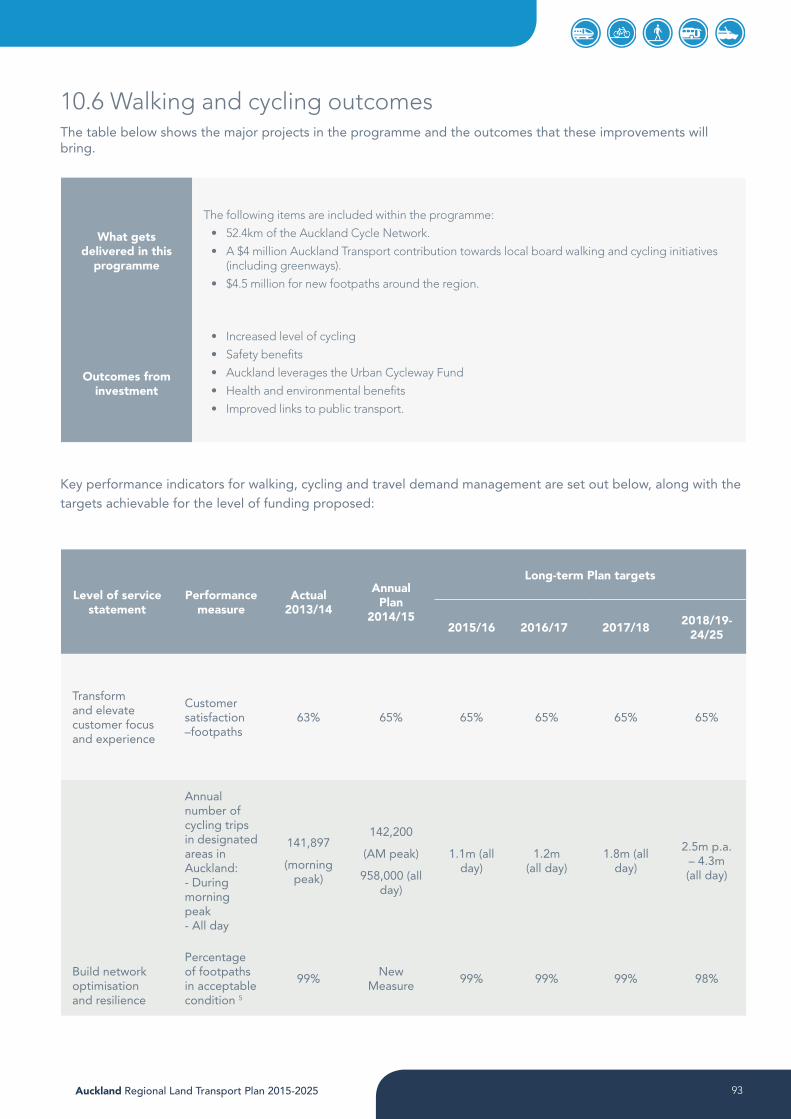
93Auckland Regional Land Transport Plan 2015-2025
10.6 Walking and cycling outcomesThe table below shows the major projects in the programme and the outcomes that these improvements will bring.
What gets delivered in this
programme
The following items are included within the programme:
• 52.4km of the Auckland Cycle Network.
• A $4 million Auckland Transport contribution towards local board walking and cycling initiatives (including greenways).
• $4.5 million for new footpaths around the region.
Outcomes from investment
• Increased level of cycling
• Safety benefits
• Auckland leverages the Urban Cycleway Fund
• Health and environmental benefits
• Improved links to public transport.
Key performance indicators for walking, cycling and travel demand management are set out below, along with the targets achievable for the level of funding proposed:
Level of service statement
Performance measure
Actual 2013/14
Annual Plan
2014/15
Long-term Plan targets
2015/16 2016/17 2017/18 2018/19- 24/25
Transform and elevate customer focus and experience
Customer satisfaction –footpaths
63% 65% 65% 65% 65% 65%
Build network optimisation and resilience
Annual number of cycling trips in designated areas in Auckland: - During morning peak - All day
141,897
(morning peak)
142,200
(AM peak)
958,000 (all day)
1.1m (all day)
1.2m (all day)
1.8m (all day)
2.5m p.a. – 4.3m (all day)
Percentage of footpaths in acceptable condition 5
99%New
Measure99% 99% 99% 98%

94 Auckland Regional Land Transport Plan 2015-2025
Level of service statement
Performance measure
Actual 2013/14
Annual Plan
2014/15
Long-term Plan targets
2015/16 2016/17 2017/18 2018/19- 24/25
Percentage of customer service requests relating to footpaths which receive a response within specified timeframes6
85%New
measure85% 85% 85% 85%
New cycleways added to Auckland Cycle Network (km)
N/A
New measure Complete additional 52 km over the
three-year period
Develop creative, adaptive, innovative implementation
Number of car trips avoided through travel planning initiatives
16,587 16,700 17,500 18,400 20,240Increasing to 22,264

95Auckland Regional Land Transport Plan 2015-2025
11. SAFETY
KEY OUTCOMES
• An annual 2.6 per cent reduction in local road Death and Serious Injuries.• Increased safe walking and cycling trips in high-risk urban central and south
communities.• Progress on 25 of the national high-risk intersections and 25 high-risk roads.
Interacting with Auckland’s transport system is one of the riskiest daily activities that Aucklanders engage in. Safety is one of the components of the transport system that can significantly drift into failure if road design, regulation, education and enforcement do not keep pace with constantly changing, complex travel patterns. Unfortunately, this appears to be the case in Auckland, where the trend of decreasing road trauma from 2009–2012 suddenly reversed in 2013, when 485 people were killed or seriously injured on Auckland’s roads. In 2014, road trauma reduced slightly with 477 people killed or seriously injured, but this remains higher than levels of road trauma in 2011 and 2012 (6).
Figure 29: Death and Serious Injuries on Auckland roads 2010-2014
Serious Injuries Deaths
600
500
400
300
200
100
0
2010
2011
2012
2013
2014
The annual average 2.6% reduction in local road deaths and serious injuries has not been met from 2010 to 2014. This is primarily due to a five year upward trend in vulnerable road user (pedestrian, cyclists and motorcyclist) deaths and serious injuries on local roads in the urban central and urban south areas. Auckland's motorways stand out as high risk, but given that around a third of all vehicle travel is on motorways, the relative risk is low. Arterial roads, especially those in and close to the city centre, experience much of Auckland's road trauma.
The number and seriousness of crashes on roads in the Auckland region, per km, is shown in Figure 30.

96 Auckland Regional Land Transport Plan 2015-2025
Figure 30: Auckland roads by risk category, based on fatal and serious crashes per km

97Auckland Regional Land Transport Plan 2015-2025
The five-year upward trend in vulnerable road user deaths and serious injuries runs directly counter to the aspirations in the Auckland Plan to create world class urban environments, and to significantly increase walking and cycling to improve health outcomes and the overall functioning of the transport system.
Auckland also faces challenges in enhancing safety at pedestrian and vehicle level crossings, in particular at crossings on the electrified network between Swanson and Papakura. Significant increases in rail service frequencies mean that level crossing barriers will be down for longer periods of time, increasing delays to vehicles, pedestrian and cyclists. At the same time, the introduction of new electric trains which are much quieter than the existing diesels means that level crossing users may be much less aware of an approaching train. Much greater care is needed.
11.1 Roles and responsibilities AT, the Transport Agency and NZ Police face a significant challenge to learn from recent trends and to take action to return to the long-term trend of reducing road trauma, especially for vulnerable road users.
The Ministry of Transport developed the Safer Journeys Strategy in 2010 and continues to guide and monitor progress towards its vision of a safe road system increasingly free from deaths and serious injuries, through:
• Safe roads and roadsides
• Safe speeds
• Safe road use
• Safe vehicles. (21)
The Safe System approach represents a significant shift away from the historical notion of ‘blaming the road user’ towards a growing responsibility for planners, designers and engineers to design and operate a transport system that does not result in road users being killed or seriously injured if they make a mistake.
Auckland Transport's role in creating a more forgiving transport environment involves transport planning, infrastructure design, asset management, road corridor operations and maintenance and public transport activities. These business units work closely with the above partners and with road user groups and communities to deliver a safe system. Prominent safety engineering programmes include crash reduction studies, safer communities, regional safety projects (high-risk intersections and roads), minor safety improvements, speed management and road death investigations.
Auckland Transport convenes RoadSafe Auckland with partner agencies, which is responsible for developing Road Safety Action Plans for Auckland North, West, Central and South. It also provides an educational function through road safety promotion, targeting Safer Journeys high-risk themes such as alcohol, speed, intersections, young drivers and vulnerable road users (cycling, motorcycling and pedestrians). While this education supports some NZ Police activities region wide, AT’s growing focus is on targeting high-risk communities in conjunction with other RoadSafe Auckland partners. Local road safety education is also offered through the Travelwise Safe School Travel Plan programme. By fostering student leadership and a whole-school approach, the programme increases community capacity for making safe and sustainable transport choices.
The NZ Transport Agency is represented on RoadSafe Auckland and has a similar role to AT, but in relation to state highways nationally.
The NZ Police are key partners in Road Safety Action Plans. Their role is unique as only the Police have an enforcement mandate. Police activity is targeted at Safer Journeys priorities including speed, alcohol and drug affected driving, motorcycle safety, young drivers, and high-risk drivers where enforcing the law saves lives.
The Auckland Transport Operations Centre (Smales Farm) involving AT, the Transport Agency and the NZ Police, is responsible for responding quickly to incidents on the road network and for improving personal safety through its network of CCTV monitors. The Auckland Transport Operations Centre (Central) has a similar role in relation to incident management and personal security on the public transport network.

98 Auckland Regional Land Transport Plan 2015-2025
11.2 Safety costs Safety is integral to all of Auckland Transport's activities, however relatively few budgets are dedicated solely to safety. The costs set out below relate only to those investments where safety is the only or overriding factor. A significant component of other roads costs (maintenance, local road improvements) also relate to safety. Other AT activities directly depend on safety for their outcomes, such as increased walking and cycling activity, reduced congestion around schools and town centres, and increased public transport use.
Safety 2015/16 2016/17 2017/18 2018/19 to 2024/25
Operating cost $m $m $m $m
Community Transport – road safety total 6.9 6.9 6.9 48.1
Safety 2015/16 2016/17 2017/18 2018/19 to 2024/25
Capital expenditure $m $m $m $m
Red light cameras (new) 0.1 0.1 0.1 1.0
Regional safety programme 2.6 2.1 1.5
Safety and minor improvements 13.7 14.1 14.5 104.7
Safer communities 6.2 6.3 6.5 6.3
Safety total 22.6 22.6 22.6 112.0
11.3 Safety outcomes The table below shows the major projects in the programme and the outcomes that these improvements will bring.
What gets delivered in this
programme
• Annually over the 2015/16 to 2017/18: 106 minor safety improvement projects, three high-risk intersection or high-risk road improvements, 30 fatal crash investigations, 35 speed management projects, eight crash reduction studies and 18 safer communities school projects.
Outcomes from investment
• An annual 2.6 per cent reduction in local road Death and Serious Injuries (DSI) for the 2015-18 period, providing the progress necessary to achieve both the Auckland Plan 2020 (410 DSI) and 2014/2017 Statement of Intent (SOI) local road safety targets.
• The safer communities’ initiative will contribute to increased safe walking and cycling trips in high-risk Urban Central and South areas, helping to achieve the 2014/17 SOI walking and cycling target.
• Progress will be made on Auckland’s high-risk intersections and high-risk roads.
• Statutory obligations for fatal crash investigations will be met. Customer and NZ Police safety requests will also be met.
• Speed management changes will meet existing requirements and new national speed management regulations introduced from 2018/19 onwards.

99Auckland Regional Land Transport Plan 2015-2025
Level of service
statement
Performance measure
Actual 2013/14
Annual Plan
2014/15
Long Term Plan targets
2015/16 2016/17 2017/18 2018/19- 24/25
Transform and elevate customer focus and experience
Customer satisfaction - Road Safety
63%New
Measure60% 60-65% 60-65% 60-65%
Change from the previous financial year in the number of fatalities and serious injury crashed on the local road network, expressed as a number.
429 (year to 31 Dec 2013)
2.66% reduction
from previous
year
Reduce by at least 9
Reduce by at least 9
Reduce by at least 9

100 Auckland Regional Land Transport Plan 2015-2025
12. PARKING AND ENFORCEMENT
There are over a million registered vehicles in Auckland, and each vehicle takes up space when it is parked at home, and at its destination, meaning that parking is an integral part of the transport system. While many road users are currently able to park without direct payment, there is no such thing as a ‘free’ car park – parking consumes land and other resources and has wider impacts on the transport networks and on the city as a whole.
Auckland Transport allows parking, without charge, on most local roads, however there is no ‘right’ to park on the road. As demand for parking exceeds the supply of road space, it becomes increasingly important to set priorities and ensure the best use of the limited resource available. Paid parking, off-street parking (whether provided by AT or by private operators) and improved public transport, walking and cycling all have a role to play where parking demand exceeds supply.
Auckland Transport has recently adopted a new Parking Strategy (13), which provides the guiding principles and policies for managing and supplying on-street and AT-controlled off-street parking in Auckland, including park-and-ride facilities.
It directly manages:
• 13 multi-storey car park buildings
• 895 on-street pay-and-display machines
• 171 off-street car park sites.
A team of parking wardens enforces time restrictions for on-road parking and no-parking areas, as well as other safety regulations including vehicle warrants and registration. This is a physically demanding job, walking long distances each day and dealing with customers. AT is committed to providing a zero harm working environment for all its employees and has included the costs of continuously improving health and safety in its capital and operating budgets for parking and enforcement.
12.1 Outcomes The key performance indicator for parking is occupancy rates. For on-street paid car parks, a low occupancy (below 70%) could mean that the price is set too high, or that space has been allocated to parking that is not needed. A high occupancy rate (over 90%) means wasted time and traffic congestion as people drive around
looking for a place to park.
Level of service statement
Performance measure
Actual 2013/14
Annual Plan
2014/15
Long Term Plan targets
2015/16 2016/17 2017/18 2018/19- 24/25
Ensure optimal use of parking resources
On-street parking
occupancy rates (peak four-hour)7
N/AWithin 70-90% range
70% - 90% 70% - 90% 70% - 90% 70% - 90%
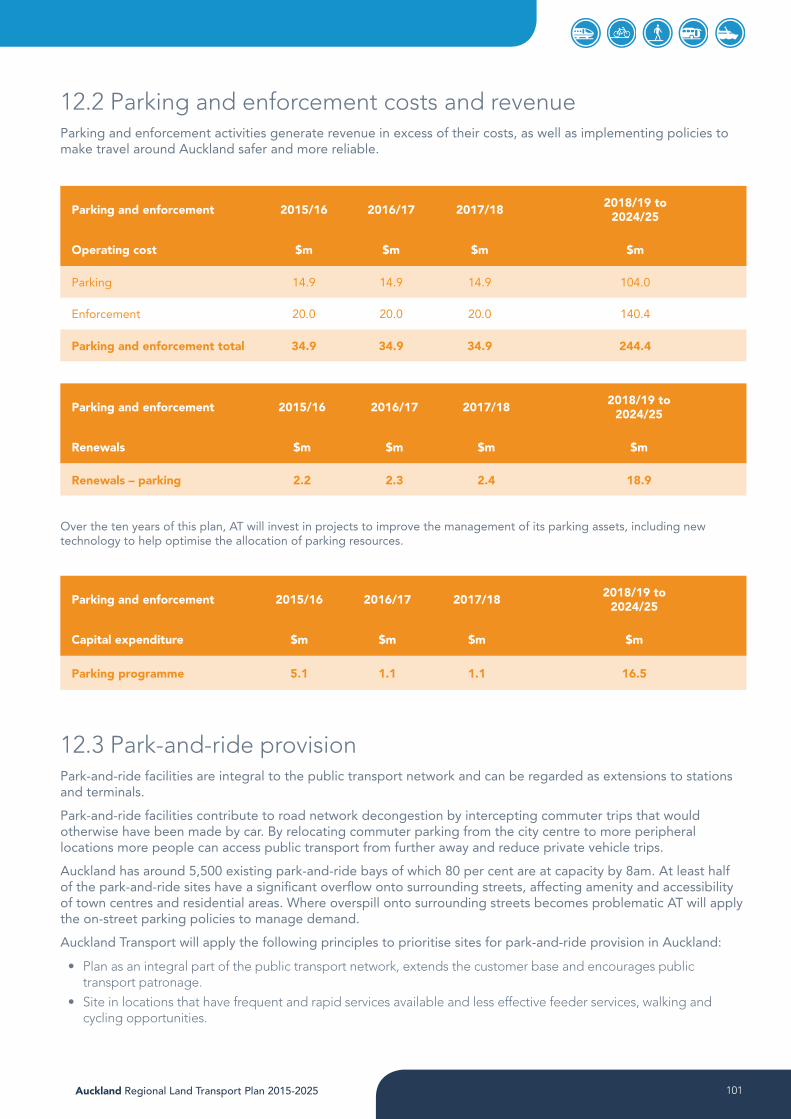
101Auckland Regional Land Transport Plan 2015-2025
12.2 Parking and enforcement costs and revenue Parking and enforcement activities generate revenue in excess of their costs, as well as implementing policies to make travel around Auckland safer and more reliable.
Parking and enforcement 2015/16 2016/17 2017/18 2018/19 to 2024/25
Operating cost $m $m $m $m
Parking 14.9 14.9 14.9 104.0
Enforcement 20.0 20.0 20.0 140.4
Parking and enforcement total 34.9 34.9 34.9 244.4
Parking and enforcement 2015/16 2016/17 2017/18 2018/19 to 2024/25
Renewals $m $m $m $m
Renewals – parking 2.2 2.3 2.4 18.9
Over the ten years of this plan, AT will invest in projects to improve the management of its parking assets, including new technology to help optimise the allocation of parking resources.
Parking and enforcement 2015/16 2016/17 2017/18 2018/19 to 2024/25
Capital expenditure $m $m $m $m
Parking programme 5.1 1.1 1.1 16.5
12.3 Park-and-ride provisionPark-and-ride facilities are integral to the public transport network and can be regarded as extensions to stations and terminals.
Park-and-ride facilities contribute to road network decongestion by intercepting commuter trips that would otherwise have been made by car. By relocating commuter parking from the city centre to more peripheral locations more people can access public transport from further away and reduce private vehicle trips.
Auckland has around 5,500 existing park-and-ride bays of which 80 per cent are at capacity by 8am. At least half of the park-and-ride sites have a significant overflow onto surrounding streets, affecting amenity and accessibility of town centres and residential areas. Where overspill onto surrounding streets becomes problematic AT will apply the on-street parking policies to manage demand.
Auckland Transport will apply the following principles to prioritise sites for park-and-ride provision in Auckland:
• Plan as an integral part of the public transport network, extends the customer base and encourages public transport patronage.
• Site in locations that have frequent and rapid services available and less effective feeder services, walking and cycling opportunities.

102 Auckland Regional Land Transport Plan 2015-2025
• Locate facilities to intercept commuter trips by being ‘on the way’ from high potential catchment areas based on assessed demand.
• Locate to relieve congestion by intercepting commuter traffic, and ensure vehicles accessing the facilities would not worsen local traffic congestion.
• Provide in line with corresponding improvements to the public transport network such as station/ferry terminal upgrades to maximise investment.
• Enable a transition of land use that supports transit-oriented development in the right locations.
Over the next 10 years, AT aims to introduce a further 2,800 park-and-ride bays and will invest in three types of delivery modes for park-and-ride facilities. These include leasing opportunities, new builds (including commercial/alternative funding) and rationalising existing parking in on-street spaces adjacent to public transport stations. Pricing of AT’s park-and-ride facilities will also be introduced during the period of this RLTP to manage demand.
The priority park-and-ride facilities that are proposed in the first three years are detailed in the table below.
Park-and-ride 2015/16 2016/17 2017/18 2018/19 to 2024/25
Capital expenditure ($m, inflated)
Papakura 0.8
Glen Eden 0.9
Silverdale Stage 2 6.1
Westgate 3.4
Park-and-ride total 0.9 6.9 3.4

103Auckland Regional Land Transport Plan 2015-2025
13. TRANSPORT PLANNING
The transition to the One System approach described in Chapter 6 necessitates a new way of planning and managing Auckland’s transport system. It requires much greater collaboration between agencies responsible for transport planning including AT, Auckland Council, KiwiRail, the Transport Agency, and with stakeholders. Collaboration enables regional strategic planning and integration of transport and land use in a more effective, efficient and affordable way. It also enables a co-ordinated response to planning and investment, and transition to the One Road Network Classification system. Planning also needs to be co-ordinated to ensure investment makes the best use of existing infrastructure and the best overall outcomes can be achieved.
Auckland Council’s Future Urban Land Supply Strategy (FULSS) will outline the intended timing and sequencing of structure planning in greenfield areas. Structure planning and the necessary plan changes to ‘live zone’ greenfield areas are intended to occur in the three years prior to development commencing. Collaboration to co-ordinate the timing of future transport interventions with the intended timing of development will be a key required outcome from the transport planning activities in these areas.
Auckland Transport is responsible for, amongst other planning activities, developing:
• This RLTP, the 30-year Integrated Transport Programme, the Regional Public Transport Plan and AT's input into strategies and plans of Auckland Council, the Transport Agency, and other organisations
• Strategic plans for arterial roads, public transport, freight networks, cycling, walking and parking. These plans define the demands, priorities and future development for each mode/asset
• Integrated planning for major infrastructure projects (described in Chapters 6 and 7), city centre initiatives and growth-related projects (as discussed in Chapter 9).
• Asset management planning for the AT road network of 7,560km (local and arterial roads).
An example of consolidation is the previously separate regional land use and traffic modelling teams being merged into the Joint Modelling Application Centre (JMAC). JMAC has recently been established to deliver an integrated operational approach to traffic modelling and forecasting for the Auckland region. By combining resources, JMAC is able to integrate into Auckland a robust, reliable, up to date, internationally recognised service.
Using the business case approach, the intent is to ensure that interventions to deliver against the problem, or problems, will be identified and agreed by stakeholders and that these interventions will provide better value for money and that opportunities for making better use of existing capacity are explored before supply measures.

104 Auckland Regional Land Transport Plan 2015-2025
13.1 Regional transport planning costs The transport planning budgets for AT, the Transport Agency and Auckland Council are set out below.
Transport planning 2015/16 2016/17 2017/18 2018/19 to 2024/25
Operating cost – Auckland Transport $m $m $m $m
Regional land transport planning 0.6 0.5 0.5 3.9
Regional strategic planning 0.8 0.8 0.7 5.0
Programme business cases 5.6 5.1 5.0 28.8
Land use planning 1.4 1.4 1.4 9.9
Transport modelling 0.7 0.7 0.7 4.8
Asset management planning and policy
1.6 1.6 1.6 11.2
Transport planning total 10.6 10.1 10.0 63.7
Transport planning 2015/16 2016/17 2017/18 2018/19 to 2024/25
Operating cost – Transport Agency $m $m $m $m
Activity management planning – Auckland
0.3 0.2 0.3
Programme business cases 1.2 4.2 0.5
Transport planning total – Transport Agency 1.5 4.4 0.8
Transport planning 2015/16 2016/17 2017/18 2018/19 to 2024/25
Operating cost – Auckland Council $m $m $m $m
Transport modelling 0.2 0.1 2.9 2.3
Transport planning total – Auckland Council 0.2 0.1 2.9 2.3
The following table outlines the high-level planning, known as programme business cases that AT and the Transport Agency are proposing in the next three years.

105Auckland Regional Land Transport Plan 2015-2025
Auckland Transport
Improving transport choice and accessibility
New Network gap and deficiency resolution
North West Auckland public transport accessibility
Northern Corridor transport choice improvements
Responding to growth areas Warkworth, SMART – improving accessibility and transport choice
Reducing adverse effects from rail crossings.
Auckland Transport / Transport Agency
Responding to growth in the city centre and fringe, north Auckland, north west, south.
Transport Agency
Auckland Network Operating Plan Implementation
Automated optimisation, compliance and enforcement
Improving cycling for clusters of schools
Integrated freight transport requirements
National LED lighting for state highways
National business case for state highway operations
National business case for state highway optimisation
National business case for speed management implementation
Resilience Auckland
SH1 Wellsford to Warkworth (NRR2); SH16 Brigham Creek to Waimauku (NRR11); SH20B – Manukau Gardens to Airport (NRR38) and SH22 – SH1 to Glenbrook Road (NRR37).
106 Auckland Regional Land Transport Plan 2015-2025
14. MONITORING AND REVIEW
This RLTP will not have its own separate monitoring and review process. Rather, it will rely on existing reporting mechanisms to ensure that information on progress towards the goals of this RLTP is available to the public. These reporting mechanisms are:
Auckland Transport monthly performance reports The Auckland Transport Board receives monthly updates on transport network performance, as well as on those aspects of the wider economy, such as fuel prices and freight trends, that impact the transport sector. Almost all of the KPIs included in this RLTP are included in these monthly reports, which are available on the Board Agendas page of www.aucklandtransport.govt.nz.
Auckland Transport annual report Annual, audited measures for each of the KPIs in this RLTP are included in AT’s Annual Report.
Annual and project achievement reports The Annual Achievement Report is submitted by AT to the Transport Agency each July. These results, along with results from other areas of NZ, are published in the Transport Agency's Annual Report. Performance of significant projects in achieving their forecast benefits is also measured and reported to the Transport Agency.
Auckland Transport's Asset Management Plan Measures relating to asset condition and performance will be reported through the annual Asset Management Report on the AMP 2015-18.
Auckland Transport’s performance measures (KPIs)Performance measures contained in AT’s Statement of Intent 2015-19 and reported on in the Annual Report are included in the relevant chapters of the RLTP. The full set of performance measures is:

107Auckland Regional Land Transport Plan 2015-2025
Level of service statement
Performance measure
Actual 2013/14
Annual Plan
2014/15
Long Term Plan targets
2015/16 2016/17 2017/18 2018/19- 24/25
Prioritise rapid, high frequency public transport
Total public transport boardings (millions)
72.4 73.7 84.5 89.0 93.0Increasing to 110.7
Boardings on rapid or frequent network (rail, busway, FTN bus)
TBA (new
measure)
New Measure
Increase at faster rate than total boardings
Increase at faster rate than total boardings
Increase at faster rate than total boardings
Increase at faster rate than total boardings
Transform and elevate customer focus and experience
Customer satisfaction – roads
71% 70% 70% 70% 70% 70%
Customer satisfaction –footpaths
63% 65% 65% 65% 65% 65%
Customer satisfaction – road safety
63%New
measure60% 60-65% 60-65% 60-65%
Public transport punctuality (weighted average across all modes)
85.9%New
Measure92% 93% 94% Average 95%
Customer satisfaction – public transport
81.4% 83% 83% 84% 85% 85%

108 Auckland Regional Land Transport Plan 2015-2025
Level of service statement
Performance measure
Actual 2013/14
Annual Plan
2014/15
Long Term Plan targets
2015/16 2016/17 2017/18 2018/19- 24/25
Build network optimisation and resilience
Arterial road productivity1
68%53% of
the ideal achieved
54% of the ideal achieved
55% of the ideal achieved
55% of the ideal achieved
55% of the ideal achieved
Travel times on key freight routes2
Baseline travel times
maintained on six out of eight routes
Maintain baseline
travel times for the 85th
percentile
Maintain baseline
travel times for the 85th
percentile
Maintain baseline
travel times for the 85th
percentile
Maintain baseline
travel times for the 85th
percentile
Maintain baseline
travel times for the 85th percentile
Annual number of cycling trips in designated areas in Auckland:
- During Morning peak
- All day
141,897 (morning
peak)
142,200 (morning
peak)
958,000 (all day)
1.1m (all day)
1.2m (all day)
1.8m (all day)
2.5m p.a. – 4.3m (all day)
Road maintenance standards (ride quality) as measured by smooth travel exposure (STE) for all urban and rural roads3
Rural 95 Urban 85
New Measure
Rural 93
Urban 83
Rural 92
Urban 82
Rural 91
Urban 81
Decreasing to Rural 87
Urban 77

109Auckland Regional Land Transport Plan 2015-2025
Level of service statement
Performance measure
Actual 2013/14
Annual Plan
2014/15
Long Term Plan targets
2015/16 2016/17 2017/18 2018/19- 24/25
Build network optimisation and resilience
Percentage of the sealed local road network that is resurfaced
7.6%New
Measure8% 8% 8% 8%
Percentage of footpaths in acceptable condition (as defined in AT’s AMP)
99%New
Measure99% 99% 99% 98%
Percentage of customer service requests relating to roads and footpaths which receive a response within the time frame specified in Auckland Council’s Long-term Plan
85%New
Measure85% 85% 85% 85%
New cycleways added to regional cycle network
N/ANew
MeasureComplete additional 52 km over the three-year period

110 Auckland Regional Land Transport Plan 2015-2025
Level of service statement
Performance measure
Actual 2013/14
Annual Plan
2014/15
Long Term Plan targets
2015/16 2016/17 2017/18 2018/19- 24/25
Develop creative, adaptive, innovative implementation
Number of car trips avoided through travel planning initiatives
16,587 16,700 17,500 18,400 20,240Increasing to 22,264
Ensure a sustainable funding model
Public transport Farebox recovery %4
45.4%New
Measure46-48% 47-50% 49-52% 50%+
Ensure optimal use of parking resources
On-street parking occupancy rates (peak four-hour)7
N/AWithin 70-90% range
70% - 90% 70% - 90% 70% - 90% 70% - 90%

111Auckland Regional Land Transport Plan 2015-2025
15. LOOKING FORWARD
15.1 Transport fundingAuckland Transport’s and the Transport Agency’s programmes will address the most urgent transport needs in the short-term. However, in the longer term if Auckland’s transport system is to cope with the population growth expected, alternative funding solutions will need to be considered, otherwise Auckland will also miss out on opportunities to achieve significant benefits from aligning investment with that made by the Transport Agency on the state highway network. Over time, the performance of the transport system will get progressively worse as Auckland’s population grows.
Aucklanders want improved speed, frequency, affordability, reliability and attractiveness of the transport network so that more Aucklanders will choose to travel by public transport more often. The Auckland Plan envisages us doubling the number of public transport passenger trips to 140 million trips each year by 2025. An expanded public transport network would also improve connection with and allow development of outlying areas.
The main benefit of additional transport investment would be less congested roads (than would otherwise occur), as well as faster and more frequent public transport that becomes the preferred way of getting around for many more Aucklanders. Additional investment would give people much more choice to make more trips on buses, trains and ferries as well as by walking and cycling. This in turn would release capacity on the road network for freight and other road trips.
Additional transport funding (over and above the funding provided for in this 10-year budget) would enable:
• More frequent bus services, providing faster connections to more destinations
• Additional investment in bus and rail stations and interchanges, with increased park-and-ride capacity
• More new cycleways and shared cycling and walking paths
• Enhanced safety programmes and greater investment to address high priority rail level crossings
• More arterial and local road improvement projects to address growth pressures and existing congestion
• A more optimal and sustainable approach to managing our transport assets.
Transport modelling for the proposed Auckland Plan Transport Network indicated that businesses would see a large improvement in their ability to move goods around the region. By 2046 we would see improvements in key freight routes by 15 to 30 per cent, which will assist in region wide productivity improvements.
By 2046 trips across the city would be faster for both private vehicles and public transport. A trip from Westgate to the city centre would be 19 minutes faster. The proportion of jobs accessible by a public transport trip within 45 minutes would improve by five per cent and a 30-minute car ride by five to 10 per cent by 2046.
Moving commuters from private vehicle use to public transport, and reducing time spent in traffic congestion for the remaining road users, is one of the most significant contributions that can be made to improving the impact that the city has on the natural environment.
A Transport Accord for Auckland
Central Government has signalled its willingness to work with Auckland Council to develop an Accord that will address the long-term funding of transport in Auckland. Whatever the outcome, it is expected that Auckland will need to significantly revise its long-term transport plans as part of developing the 2018 RLTP, if not before.
112 Auckland Regional Land Transport Plan 2015-2025
16. PRIORITISED LIST OF PROJECTS
The following tables show the prioritised list of projects which form the basis of AT, the Transport Agency and Auckland Council funding requests for the Regional Land Transport Plan 2015–18.
Not all the activities in the detailed tables are expected to receive subsidy from the Transport Agency. The programme shows all significant land transport projects and activities that will be carried out in Auckland over the next three years, and how these will be funded.
One role of the RLTP is to make the business case to the Transport Agency for investment in AT activities. Those activities which the Transport Agency considers to be a cost-effective contribution to achieving the goals set out in the Government Policy Statement on Land Transport Funding (1) will be included in the National Land Transport Programme. AT has estimated the funding it will receive from the Transport Agency in its budget; however this funding cannot be guaranteed and must be applied for in individual detailed applications. Consequently, there are no financial implications of this RLTP, however when detailed applications for funding are made and the Transport Agency decides whether to support individual applications for subsidy, there are significant financial implications.
16.1 Key to format and content of prioritised list All projects have been evaluated for their strategic fit, effectiveness and efficiency using the process set out in Chapter 4. For projects in the outer years of this plan, information is currently incomplete and it is likely that the profile and therefore priority of the project will change.
The tables (and headings) below use the following abbreviations and terms:
Project name Shaded projects are delivered by the Transport Agency Highway and Network Operations (state highways) – HNO
Some of the activities listed in the tables (for example, walking and cycling programme and safety programmes) provide for a single region-wide funding allocation that covers a large number of individual projects. Within each of these groups of projects, AT and/or the Transport Agency have agreed a methodology for bringing forward the highest priority projects for funding.
Cost ($) This is the total cost of the identified activity for that particular year in the RLTP (which may be blank or zero, and may be the sum of multiple phases). Most activities are funded through a combination of local share and Transport Agency co-investment, but some activities have more complex funding arrangements.
Phase: refers to the stage of development:
I = Investigation D = Design P = Property purchase C = Construction
Year 4–10 cost: The amount of money being requested for all phases in years four to 10 of the RLTP. The accumulation of the total costs in 2015/16, 2016/17 and the year four–10 costs equals the total 10-year cost.
Profile: The prioritisation profile assigned to the activity based on Auckland Transport’s prioritisation process as set out in Appendix 2.
The first letter represents the project’s strategic fit
The second letter represents the project’s effectiveness
The third letter represents the project’s efficiency
Together the three letters create the profile
High = H
Medium = M
Low = L

113Auckland Regional Land Transport Plan 2015-2025
L* = Efficiency of the project has not been assessed yet.
Transport Agency work category: This is AT’s estimate of the likely work category (22) under which the Transport Agency may choose to fund the activity.

114 Auckland Regional Land Transport Plan 2015-2025
16.2 Details of projects and priorities20
18/19
Proj
ects
with
com
mitm
ents
$m, in
flate
dPh
ase*
$m, in
flate
dPh
ase*
$m, in
flate
dPh
ase*
to 20
24/25
Com
mitt
edCo
re se
al ex
tensio
ns3.3
I, D, C
3.3I, D
, C3.3
I, D, C
8.6Co
mm
itted
Loca
l boa
rd in
itiativ
es10
.3D,
C10
.5D,
C10
.8D,
C85
.9Co
mm
itted
AT re
newa
ls19
8.422
8.223
9.61,8
46.0
Com
mitt
edLE
D str
eetlig
hting
4.5C
4.6C
4.8C
47.9
Com
mitt
edNZ
Tra
nspo
rt Ag
ency
rene
wals
31.7
40.1
40.8
294.0
Com
mitt
edEs
timate
for s
eismi
c stre
ngthe
ning w
orks
(exc
luding
Qua
y Stre
et)1.0
I, D,C
1.1I, D
,C1.1
I, D,C
59.6
Com
mitt
edAl
bany
High
way U
pgra
de (N
orth)
23.5
C13
.1C
1.1C
Com
mitt
edEl
ectric
train
(EMU
) Pro
cure
ment
26.8
C1.0
CCo
mm
itted
Impr
ovem
ents
comp
lemen
ting d
evelo
pmen
ts0.8
C0.8
C0.9
C6.9
Com
mitt
edLo
ng B
ay G
lenva
r Ridg
e Roa
d3.1
D, C
2.7C
2.6C
Com
mitt
edNo
rth W
est T
rans
forma
tion (
NORS
GA P
C 15
Mas
sey N
orth
Town
Cen
tre)
17.1
D, P
, C14
.0D,
C6.2
D, C
7.1Co
mm
itted
North
Wes
t Tra
nsfor
matio
n (NO
RSGA
PC
13 H
obso
nvilll
e Poin
t Par
k and
ride)
0.5C
Com
mitt
edNo
rth W
est T
rans
forma
tion (
NORS
GA P
C 14
Hob
sonv
ille V
illage
)22
.8Co
mm
itted
Plan
Cha
nge 3
2 Pen
ihana
Nor
th Tr
ansp
ort M
itigati
on0.4
Com
mitt
edPe
nlink
Toll
Roa
d Des
ignati
on (S
ilver
dale
Tran
spor
t Impr
ovem
ents)
1.3I,P
Com
mitt
edW
ynya
rd Q
uarte
r Inte
grate
d Roa
d Pro
gram
me5.5
CCo
mm
itted
Newm
arke
t Stat
ion ac
cess
impr
ovem
ents
0.3D
1.2C
Com
mitt
edSt
ocky
ard F
alls l
ight in
dustr
ial an
d reta
il par
ks (V
ariat
ion 15
8) (W
arkw
orth
Wes
tern C
ollec
tor)
3.4C
Com
mitt
edPr
ivate
Plan
Cha
nge 1
2 Dru
ry So
uth T
rans
port
Imple
menta
tion
3.1I,D
,P25
.8D,
C,P
15.1
C22
.6
Com
mitt
edLo
cal R
oad I
mpro
veme
nts co
mnple
menti
ng H
NO in
itiativ
es (p
revio
usly
know
n as W
arkw
orth
SH1 I
nterse
ction
Im
prov
emen
ts)5.9
Com
mitt
edW
atervi
ew sh
ared
path
3.6I, P
, C1.8
C*P
hase
- I=
Inve
stig
atio
n, D
=Des
ign,
P=P
rope
rty,
C=C
onst
ruct
ion
2015
/1620
16/17
2017
/1820
18/19
AT o
ngoi
ng o
pera
tiona
l req
uire
men
ts$m
, infla
ted
Phas
e*$m
, infla
ted
Phas
e*$m
, infla
ted
Phas
e*to
2024
/25O
ngoi
ngAI
FS sy
stem
- exte
nsion
s, en
hanc
emen
ts an
d equ
ipmen
t rep
lacem
ent
1.81.9
4.228
.1O
ngoi
ngAI
FS sy
stem
- integ
rated
fare
s6.2
Ong
oing
Dies
el re
furbis
hmen
t (alt
erna
tive t
o elec
trifica
tion P
apak
ura t
o Puk
ekoh
e)8.1
Ong
oing
Digit
al tec
hnolo
gy6.7
6.97.1
56.4
Ong
oing
Park
and R
ide -
Glen
Ede
n0.9
C,P
Ong
oing
Gene
ral A
T as
set r
eplac
emen
t6.2
6.36.5
51.5
Ong
oing
Oper
ation
al as
set r
eplac
emen
t – pa
id pa
rking
tech
nolog
y5.1
1.11.1
16.5
Ong
oing
Reso
lution
of en
croac
hmen
ts an
d leg
acy l
and p
urch
ase a
rrang
emen
ts1.2
C1.3
C1.3
C10
.5*P
hase
- I=
Inve
stig
atio
n, D
=Des
ign,
P=P
rope
rty,
C=C
onst
ruct
ion
2015
/1620
16/17
2017
/1820
18/19
Gree
nfiel
d Gr
owth
Net
work
s$m
, infla
ted
Phas
e*$m
, infla
ted
Phas
e*$m
, infla
ted
Phas
e*to
2024
/25Tr
ansp
ort im
prov
emen
ts in
Stra
tegic
Hous
ing A
reas
Loca
l Res
identi
al Gr
owth
Fund
35.0
C,P
35.9
C,P
36.8
C29
0.6
2017
/1820
16/17
2015
/16
Tran
spor
t pro
gram
me

115Auckland Regional Land Transport Plan 2015-2025
21AT
Tran
spor
t Age
ncy w
ork
2018
/19Pr
iority
Rank
ed ca
pex p
rojec
tsPr
ofile
categ
ory
$m, in
flated
Phas
e*$m
, infla
tedPh
ase*
$m, in
flated
Phas
e*to
2024
/251
City
Rail L
inkHH
LPu
blic t
ransp
ort im
prove
ments
113.8
D,C,
P15
6.5D,
C,P
124.8
D,C,
P1,9
47.0
2AM
ETI P
rogram
meHH
LRo
ad im
prove
ments
10.3
I,D,C
21.1
D,C,
P32
.5D,
C,P
488.3
3Ci
ty Ce
ntre B
us Im
prove
ments
HH
HPu
blic t
ransp
ort im
prove
ments
2.1I,C
15.8
C16
.2C
72.5
4Ea
st W
est C
onne
ction
s (wa
s Eas
t Wes
t Link
)HH
LRo
ad im
prove
ments
1.5I
1.6I,D
1.6D
130.8
5Ea
st W
est C
onne
ction
s Stat
e High
way c
ompo
nent
HHL*
State
high
way i
mprov
emen
ts6.9
29.2
10.8
6Lin
coln
Rd - C
orrido
r Impro
veme
ntsHH
HRo
ad im
prove
ments
1.8I,D
,P2.1
D,P
50.7
7Do
minio
n Roa
d Corr
idor U
pgrad
eHH
LRo
ad im
prove
ments
59.6
8Bu
s Prio
rity Im
prove
ments
and T
ransit
Lane
sHH
HRo
ad im
prove
ments
4.0I,D
,C5.6
I,D,C
5.8I,D
,C52
.99
Walk
ing an
d Cyc
ling P
rogram
me - A
THH
MW
alking
and C
yclin
g24
.6I,D
,C35
.8I,D
,C57
.6I,D
,C74
.710
Walk
ing an
d Cyc
ling P
rogram
me - T
ransp
ort A
genc
yHH
L*W
alking
and C
yclin
g33
.911
.37.2
58.0
11So
uthern
Corr
idor Im
prove
ments
HHH
State
high
way i
mprov
emen
ts53
.282
.076
.046
.612
SH1 N
orthe
rn Co
rridor
Impro
veme
nts - M
otorw
ayHH
LSt
ate hi
ghwa
y imp
rovem
ents
25.5
91.0
94.0
235.8
13Ne
wmark
et Cr
ossin
gHH
LRo
ad im
prove
ments
1.0D,
P5.3
C14
Puke
kohe
Inter
chan
ge (in
cludin
g Cus
toms /
Harr
is / M
anuk
au S
treet
inters
ectio
n imp
rovem
ent)
HHL
Publi
c tran
sport
impro
veme
nts
3.1I,D
,C,P
10.6
C15
Otah
uhu B
us In
terch
ange
HHL
Publi
c tran
sport
impro
veme
nts14
.4D,
C3.8
P16
Manu
kau I
nterch
ange
(was
Man
ukau
City
Rail
Link
)HH
MPu
blic t
ransp
ort im
prove
ments
9.5D,
C11
.5D,
C17
SH1 W
aitem
ata H
arbou
r cros
sing (
Plann
ing an
d rou
te pro
tectio
n)HH
L*St
ate hi
ghwa
y imp
rovem
ents
7.08.9
11.0
84.9
18Sa
fety p
rogram
mes (
includ
ing sa
fety a
nd m
inor im
prove
ments
, safe
ty aro
und s
choo
ls, cr
ash r
educ
tion i
mplem
entat
ion,
region
al sa
fety p
rogram
me an
d safe
ty sp
eed m
anag
emen
t)HH
HRo
ad im
prove
ments
22.5
22.5
22.5
111.0
19SH
20 / S
H16 W
ester
n Ring
Rou
teHH
LSt
ate hi
ghwa
y imp
rovem
ents
364.0
204.7
72.9
20Qu
ay S
treet
Seaw
all (in
cludin
g seis
mic s
treng
thenin
g)HH
L*Re
silien
ce im
prove
ments
48.7
21Re
d Ligh
t Cam
eras n
ewHH
HNe
w tra
ffic m
anag
emen
t facil
ities
0.10.1
0.11.0
22Ak
orang
a Bus
way S
tation
impro
veme
ntsHH
HRo
ad im
prove
ments
1.423
Plan C
hang
e 127
Hua
pai N
orth T
ransp
ort M
itigati
onHH
HRo
ad im
prove
ments
2.524
Taha
roto/W
airau
- Stag
e 3HH
HRo
ad im
prove
ments
4.325
Te A
tatu M
otorw
ay B
us In
terch
ange
HHH
Publi
c tran
sport
impro
veme
nts0.5
D4.7
C26
Flat B
ush M
ain S
treet
Colle
ctor L
inkHH
MNe
w roa
ds1.5
D,C,
P5.5
C27
Murph
ys R
odd u
pgrad
e brid
ge im
prove
ments
(Plan
Cha
nge 2
0)HH
MRo
ad im
prove
ments
4.4C
4.5C
28AT
Metr
o Bus
iness
Tech
nolog
y (wa
s Rea
l Tim
e Pas
seng
er Inf
ormati
on S
ystem
enha
ncem
ents)
HHL
Publi
c tran
sport
impro
veme
nts1.1
C1.2
C1.2
C7.0
29Pu
blic T
ransp
ort sa
fety,
secu
rity an
d ame
nity i
mprov
emen
ts (w
as st
ation
amen
ity im
prove
ments
)HH
L*Pu
blic t
ransp
ort im
prove
ments
1.8I,D
,C1.9
I,D,C
1.9I,D
,C15
.530
Te A
tatu R
d: Co
rridor
Impro
veme
ntsHH
HRo
ad im
prove
ments
13.7
C,P
6.6C
31SM
ART (
Airpo
rt Rail
- Plan
ning a
nd R
oute
Prote
ction
)HH
L*Pu
blic t
ransp
ort im
prove
ments
2.1C
6.3C
13.0
C12
.632
Mino
r PT c
apex
allow
ance
for b
us st
ops,
mino
r impro
veme
nts at
stati
ons,
wharv
es, p
rovisi
on of
PT i
nform
ation
etc
HHL
Publi
c tran
sport
impro
veme
nts6.3
C5.0
C5.0
C29
.533
SH16
/ SH1
8 Inte
rsecti
onHH
MSt
ate hi
ghwa
y imp
rovem
ents
34Br
igham
Cree
k Roa
d Corr
idor im
prove
ments
HHL
Road
impro
veme
nts10
.735
Route
Opti
misa
tion /
Netw
ork O
perat
ing P
lan ca
pital
progra
mme
HHH
Road
impro
veme
nts2.6
I,D,C
2.6I,D
,C2.7
I,D,C
15.8
36SH
1 Puh
oi to
Wark
worth
new
road
HHL*
State
high
way i
mprov
emen
ts27
.82.3
2.36.7
37SH
1 Wark
worth
to W
ellsfo
rdHH
L*St
ate hi
ghwa
y imp
rovem
ents
15.0
7.09.0
20.0
38Air
port a
cces
s imp
rovem
ents
HML
State
high
way i
mprov
emen
ts70
.546
.539
North
ern B
uswa
y – ad
dition
al sta
tions
asso
ciated
with
busw
ay ex
tensio
nHM
HPu
blic t
ransp
ort im
prove
ments
6.4
40SH
1 Nort
hern
Corrid
or Im
prove
ments
- bus
way c
ompo
nent
HML*
State
high
way i
mprov
emen
ts41
Doub
le de
cker
netw
ork m
itigati
on w
orks
HMH
Road
impro
veme
nts6.5
C6.2
C6.4
C7.7
*Pha
se -
I=In
vest
igat
ion,
D=D
esig
n, P
=Pro
perty
, C=C
onst
ruct
ion
2015
/1620
17/18
2016
/17
Tran
spor
t pro
gram
me

116 Auckland Regional Land Transport Plan 2015-2025
21AT
Tran
spor
t Age
ncy w
ork
2018
/19Pr
iorit
yRa
nked
cape
x pro
jects
Prof
ileca
tego
ry$m
, infla
ted
Phas
e*$m
, infla
ted
Phas
e*$m
, infla
ted
Phas
e*to
2024
/2542
North
weste
rn B
uswa
y (AT
comp
onen
t) - e
arly
works
and /
or ro
ute pr
otecti
on
HML*
Road
impr
ovem
ents
43.0
43Mi
ll Roa
d (No
rther
n)HM
HRo
ad im
prov
emen
ts3.1
I,P3.2
I,D,P
3.2D,
P12
3.944
Tama
ki Dr
ive an
d Nga
pipi In
terse
ction
HMM
Road
impr
ovem
ents
4.3C
45Si
lverd
ale In
terch
ange
upgr
ade
HMM
State
high
way i
mpro
veme
nts2.5
46Ra
il cro
ssing
sepa
ratio
n HM
L*Ro
ad im
prov
emen
ts25
.747
Intell
igent
Tran
spor
t Sys
tems I
nfras
tructu
re (J
TOC,
ATO
C, C
CTV,
incid
ent m
anag
emen
t res
pons
e sys
tems)
HMH
New
traffic
man
agem
ent fa
ciliti
3.6C
3.7C
3.8C
22.1
48St
reet
Lighti
ng im
prov
emen
ts- re
gionw
ideHM
L*Ro
ad im
prov
emen
ts0.3
C0.3
C0.3
C2.6
49Mi
nor S
H Im
prov
emen
ts inc
. Safe
ty, op
timisa
tion a
nd re
sillie
nce
HML*
State
high
way i
mpro
veme
nts6.1
1.21.3
50Pa
rk n R
ide -
Papa
kura
HMH
Publi
c tra
nspo
rt im
prov
emen
ts0.8
D,C
51Pa
rk n R
ide -
Wes
tgate
HMH
Publi
c tra
nspo
rt im
prov
emen
ts3.4
C52
Park
n Ride
Silv
erda
le-St
g 2HM
LPu
blic t
rans
port
impr
ovem
ents
6.1C
53SH
1 Nor
thbou
nd au
xiliar
y lan
eHM
MSt
ate hi
ghwa
y imp
rove
ments
8.31.4
54W
arkw
orth
Stag
e 1 (H
ill St
reet)
MHM
State
high
way i
mpro
veme
nts1.8
55Ho
bson
ville
devia
tion
MMM
State
high
way i
mpro
veme
nts3.3
56No
ise im
prov
emen
ts pr
ogra
mme
MMM
State
high
way i
mpro
veme
nts0.5
8.557
Brigh
am C
reek
- Ra
ilway
Roa
d med
ian ba
rrier
MML*
State
high
way i
mpro
veme
nts0.1
4.02.8
58Ng
akor
oa re
align
ment
(pas
sing)
MLM
State
high
way i
mpro
veme
nts0.2
7.759
McKi
nney
/Wec
h Driv
e Inte
rsecti
onLM
L*St
ate hi
ghwa
y imp
rove
ments
60W
hare
hine R
oad
MLL
State
high
way i
mpro
veme
nts0.2
1.52.8
61SH
16/M
uriw
ai Ro
ad In
terse
ction
LLL*
State
high
way i
mpro
veme
nts2.4
5.0*P
hase
- I=
Inve
stig
atio
n, D
=Des
ign,
P=P
rope
rty,
C=C
onst
ruct
ion
ATTr
ansp
ort A
genc
y wor
k20
18/19
Auck
land
Coun
cil p
rojec
ts to
be t
rans
ferre
d to
AT
- prio
ritisa
tion
scor
es p
endi
ngPr
ofile
cate
gory
$m, in
flate
dPh
ase*
$m, in
flate
dPh
ase*
$m, in
flate
dPh
ase*
to 20
24/25
Quay
Stre
et Bo
uleva
rd up
grad
eHo
bson
and N
elson
upgr
ade
ATTr
ansp
ort A
genc
y wor
k20
18/19
Park
ing
initi
ative
s - to
be c
onsid
ered
out
side o
f prio
ritisa
tion
met
hodo
logy
abov
ePr
ofile
cate
gory
$m, in
flate
dPh
ase*
$m, in
flate
dPh
ase*
$m, in
flate
dPh
ase*
to 20
24/25
New
resid
entia
l par
king s
chem
esN/
ANo
t elig
ible f
or su
bsidy
Off-s
treet
paid
parki
ng (n
ew)
N/A
Not e
ligibl
e for
subs
idyOn
-stre
et inf
orma
tion p
aid pa
rking
new
area
sN/
ANo
t elig
ible f
or su
bsidy
Licen
ce pl
ate re
cogn
ition -
car p
arks
N/A
Not e
ligibl
e for
subs
idyMi
nor o
n-str
eet p
arkin
g imp
rove
ments
N/A
Not e
ligibl
e for
subs
idyPa
rking
enfor
ceme
nt - p
rojec
tsN/
ANo
t elig
ible f
or su
bsidy
2015
/1620
16/17
2017
/18
2015
/1620
16/17
2017
/18
Tran
spor
t pro
gram
me
2015
/1620
16/17
2017
/18
21AT
Tran
spor
t Age
ncy w
ork
2018
/19Au
cklan
d ra
il ini
tiativ
es (d
elive
red
by K
iwiR
ail, d
epen
dent
on
Cent
ral G
over
nmen
t fun
ding
)Pr
ofile
cate
gory
$m, in
flate
dPh
ase*
$m, in
flate
dPh
ase*
$m, in
flate
dPh
ase*
to 20
24/25
Third
Rail
Line
Otah
uhu /
Wiri
Kiwi
Rail I
TPN/
AAu
cklan
d Rail
15.4
15.8
16.3
Auck
land T
rain
Contr
ol Ce
ntre K
iwiR
ailN/
AAu
cklan
d Rail
10.5
10.8
Cros
sove
rsN/
AAu
cklan
d Rail
6.46.6
6.87.0
Sign
alling
impr
ovem
ents
N/A
Auck
land R
ail1.0
1.1Ca
tch-u
p ren
ewals
etc.
N/A
Auck
land R
ail16
.216
.717
.154
.6Tr
actio
nN/
AAu
cklan
d Rail
12.8
13.2
13.5
13.9
Port
of Au
cklan
d acc
ess i
mpro
veme
ntsN/
AAu
cklan
d Rail
10.3
10.5
Puku
kohe
rail e
lectrif
icatio
nN/
AAu
cklan
d Rail
174.6
Paer
ata Ju
nctio
n/Miss
ion B
ush
N/A
Auck
land R
ail13
.2
Tran
spor
t pro
gram
me
2015
/1620
16/17
2017
/18

117Auckland Regional Land Transport Plan 2015-2025
APPENDIX 1: LEGISLATIVE REQUIREMENTS
The legislative requirements for Auckland’s RLTP are contained in the Land Transport Management Act 2013 (LTMA).
1.1 Core requirements
LTMA S14 Core requirements of regional land transport plans How this requirement is met in the RLTP
Before a regional transport committee submits a regional land transport plan to a regional council or Auckland Transport (as the case may be) for approval, the regional transport committee must
The Board of Auckland Transport is the Regional Transport Committee for Auckland and will adopt the draft RLTP for consultation, confident that it satisfies the requirements of the Act.
“(a) be satisfied that the regional land transport plan
“(i) contributes to the purpose of this Act; andChapters 3 to 5 set out how this plan contributes to an effective, efficient, and safe land transport system in the public interest.
“(ii) is consistent with the GPS on land transport; and
Auckland Transport considers that this RLTP is consistent with the final GPS released in July 2014, and will take the final GPS into account in finalising this RLTP.
“(b) have considered—
“(i) alternative regional land transport objectives that would contribute to the purpose of this Act; and Section 3 sets out the alternative transport
scenarios and funding scenarios considered in the preparation of this RLTP.“(ii) the feasibility and affordability of
those alternative objectives; and
“(c) have taken into account any
“(i) national energy efficiency and conservation strategy; and
The Transport goal of the NEECS is “A more energy efficient transport system, with a greater diversity of fuels and alternative energy technologies.” Energy efficiency and alternative fuels were among the criteria used to evaluate projects as set out in [Appendix 3].
“(ii) relevant national policy statements and any relevant regional policy statements or plans that are for the time being in force under the Resource Management Act 1991; and
Auckland Transport worked closely with Auckland Council in the preparation of this RLTP, to ensure that it was consistent with the Unitary Plan and Auckland Plan.
“(iii) likely funding from any source.”The RLTP sets planning sources of funding, by activity, in the detailed chapters. The overall balance of this funding is considered in [section 3.2].

118 Auckland Regional Land Transport Plan 2015-2025
1.2 Form and content requirements LTMA S14 Form and content of regional land transport plans
How this requirement is met in the RLTP
(1) A regional land transport plan must set out the region’s land transport objectives, policies, and measures for at least 10 financial years from the start of the regional land transport plan.
Objectives, policies, and detailed performance measures are included in the Activity chapters of this RLTP.
(2) A regional land transport plan must include—
“(a) a statement of transport priorities for the region for the 10 financial years from the start of the regional land transport plan; and
As set out in chapters 3 to 5.
“(b) a financial forecast of anticipated revenue and expenditure on activities for the 10 financial years from the start of the regional land transport plan; and
Expenditures and revenues are covered in outline in Chapter 5 and in detail in the Activity chapters of this RLTP.
“(c) all regionally significant expenditure on land transport activities to be funded from sources other than the national land transport fund during the 6 financial years from the start of the regional land transport plan; and
Chapter 16 includes all regionally significant expenditure on land transport including activities funded 100 percent by Auckland Council, KiwiRail projects, and all NZ Transport Agency projects funded from Government sources outside the NLTF.
“(d) an identification of those activities (if any) that have inter-regional significance.
A statement on interregional significance has been agreed between AT and Upper North Island councils and is included in Chapter 6 of this RLTP.
“(3) For the purpose of seeking payment from the national land transport fund, a regional land transport plan must contain, for the first 6 financial years to which the plan relates,—
“(a) for regions other than Auckland […]
“(b) in the case of Auckland, activities proposed by Auckland Transport; and
All activities proposed by AT are included.
“(c) the following activities that the regional transport committee decides to include in the regional land transport plan:
“(i) activities proposed by approved organisations in the region or, in the case of Auckland, by the Auckland Council, other than those activities specified in paragraphs (a) and (b); and
Auckland Council’s transport planning activities are included in Chapter 13.
“(ii) activities relating to State highways in the region that are proposed by the Agency; and
All Transport Agency (Highway and Network Operations) activities that were submitted for inclusion in this RLTP have been included.
“(iii) activities, other than those relating to State highways, that the Agency may propose for the region and that the Agency wishes to see included in the regional land transport plan; and
All Transport Agency (Highway and Network Operations) activities that were submitted for inclusion in this RLTP have been included.
“(d) the order of priority of the significant activities that a regional transport committee includes in the regional land transport plan under paragraphs (a), (b), and (c); and
The prioritisation methodology is set out in Section 4 and Appendix 3, and the prioritised list of projects is in Chapter 16.

119Auckland Regional Land Transport Plan 2015-2025
LTMA S14 Form and content of regional land transport plans
How this requirement is met in the RLTP
“(e) an assessment of each activity prepared by the organisation that proposes the activity under paragraph (a), (b), or (c) that includes—
AT has included in this RLTP all information supplied by the Transport Agency Highway and Network Operations in support of requirements (i) through (v).
“(i) the objective or policy to which the activity will contribute; and
Objectives and policies are included in each of the Activity chapters.
“(ii) an estimate of the total cost and the cost for each year; and
Costs are included in each of the Activity chapters.
“(iii) the feasibility and affordability of those alternative objectives; and
Timing and project phases are included in Chapter 16.
“(iv) the expected duration of the activity; andProposed funding of activities is included in each of the Activity chapters.
“(v) any proposed sources of funding other than the national land transport fund (including, but not limited to, tolls, funding from approved organisations, and contributions from other parties); and
Each chapter also provides background on the activity, and a statement of value for money/ prioritisation.
“(vi) any other relevant information; andKPIs and targets are included in each of the Activity chapters.
“(f) the measures that will be used to monitor the performance of the activities.
The RLTP sets planned sources of funding, by activity, in the detailed chapters. The overall balance of funding is considered in Chapter 5.
“(4) An organisation may only propose an activity for inclusion in the regional land transport plan if it or another organisation accepts financial responsibility for the activity.
Proposed funding of activities is included in each of the Activity chapters.
“(5) For the purpose of the inclusion of activities in a national land transport programme,—
“(a) a regional land transport plan must be in the form and contain the detail that the Agency may prescribe in writing to regional transport committees; and
AT have followed all Transport Agency guidelines in the preparation of this RLTP.
“(b) the assessment under subsection (3)(e) must be in a form and contain the detail required by the regional transport committee, taking account of any prescription made by the Agency under paragraph (a).
The Transport Agency has been closely involved in the preparation of this RLTP and has not raised any issues with the level of detail of financial and policy information presented.
“(6) A regional land transport plan must also include
“(a) an assessment of how the plan complies with section 14; and
Section 3 sets out how this RLTP contributes to the Act, the GPS, and the Auckland Plan.
“(b) an assessment of the relationship of Police activities to the regional land transport plan; and
Road Safety priorities set out in Chapter 11 - Safety have been agreed with NZ Police.
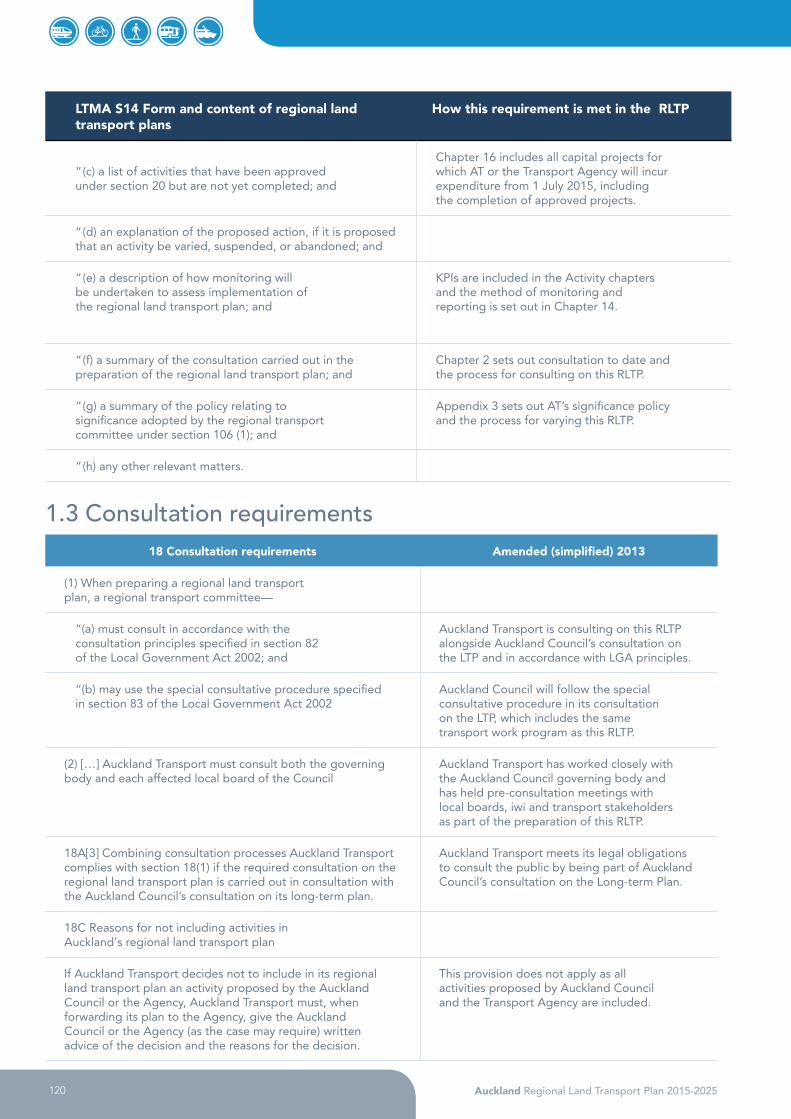
120 Auckland Regional Land Transport Plan 2015-2025
LTMA S14 Form and content of regional land transport plans
How this requirement is met in the RLTP
“(c) a list of activities that have been approved under section 20 but are not yet completed; and
Chapter 16 includes all capital projects for which AT or the Transport Agency will incur expenditure from 1 July 2015, including the completion of approved projects.
“(d) an explanation of the proposed action, if it is proposed that an activity be varied, suspended, or abandoned; and
“(e) a description of how monitoring will be undertaken to assess implementation of the regional land transport plan; and
KPIs are included in the Activity chapters and the method of monitoring and reporting is set out in Chapter 14.
“(f) a summary of the consultation carried out in the preparation of the regional land transport plan; and
Chapter 2 sets out consultation to date and the process for consulting on this RLTP.
“(g) a summary of the policy relating to significance adopted by the regional transport committee under section 106 (1); and
Appendix 3 sets out AT’s significance policy and the process for varying this RLTP.
“(h) any other relevant matters.
1.3 Consultation requirements 18 Consultation requirements Amended (simplified) 2013
(1) When preparing a regional land transport plan, a regional transport committee—
“(a) must consult in accordance with the consultation principles specified in section 82 of the Local Government Act 2002; and
Auckland Transport is consulting on this RLTP alongside Auckland Council’s consultation on the LTP and in accordance with LGA principles.
“(b) may use the special consultative procedure specified in section 83 of the Local Government Act 2002
Auckland Council will follow the special consultative procedure in its consultation on the LTP, which includes the same transport work program as this RLTP.
(2) […] Auckland Transport must consult both the governing body and each affected local board of the Council
Auckland Transport has worked closely with the Auckland Council governing body and has held pre-consultation meetings with local boards, iwi and transport stakeholders as part of the preparation of this RLTP.
18A[3] Combining consultation processes Auckland Transport complies with section 18(1) if the required consultation on the regional land transport plan is carried out in consultation with the Auckland Council’s consultation on its long-term plan.
Auckland Transport meets its legal obligations to consult the public by being part of Auckland Council’s consultation on the Long-term Plan.
18C Reasons for not including activities in Auckland's regional land transport plan
If Auckland Transport decides not to include in its regional land transport plan an activity proposed by the Auckland Council or the Agency, Auckland Transport must, when forwarding its plan to the Agency, give the Auckland Council or the Agency (as the case may require) written advice of the decision and the reasons for the decision.
This provision does not apply as all activities proposed by Auckland Council and the Transport Agency are included.

121Auckland Regional Land Transport Plan 2015-2025
APPENDIX 2: PRIORITISATION METHODOLOGY
The following tables detail the system that Auckland Transport has employed to consider strategic fit, and effectiveness when prioritising improvement projects.
2.1 Strategic fit assessmentThe strategic fit of an activity relates to the issue or problem being addressed. Strategic fit has been assessed using a detailed prioritisation methodology developed together with the Transport Agency and Auckland Council which assesses the contribution of transport projects to Auckland and Government outcomes as set out in Chapter 3.

122 Auckland Regional Land Transport Plan 2015-2025
Benefit ITP desired outcome ITP scoring criteria
BE
NE
FIT
1: IN
CR
EA
SED
AC
CE
SS T
O A
WID
ER
RA
NG
E O
F Q
UA
LITY
AFF
OR
DA
BLE
TR
AN
SPO
RT
CH
OIC
ES
Services that align with future land use
patterns
2: Significantly increases the proportion of Aucklanders living within walking distance (500m) of frequent PT (FTN/RTN) e.g. RTN extensions or geographic widening of the FTN 1: Increases the proportion of Aucklanders living within walking distance (500m) of frequent PT (FTN/RTN) e.g. additional station on existing RTN OR increases the proportion of Aucklanders living within walking distance of any form of PT 0: No effect on the proportion of Aucklanders living within walking distance of frequent PT RED FLAG: Decreases the proportion of Aucklanders living within walking distance of frequent PT
Services that meet customer needs
2: Significantly increases the proportion of PT customers satisfied with their service 1: Likely to increase the proportion of PT customers satisfied with their service 0: No effect on customer satisfaction RED FLAG: Detrimental effect on customer satisfaction
Increased use of public transport
2: Significantly increases use of the PT system AND consequentially has an impact on reducing peak congestion 1: Increases use of the PT system 0: No effect on use of the PT system RED FLAG: Decreases use of the PT system
Improved connections between transport modes &
services
2: Improves connections between modes/services THAT optimise PT services and infrastructure 1: Improves connections between modes/services 0: No effect on connections between modes/services RED FLAG: Negative effect on connections between modes/services
Faster PT and reduced journey
times
2: Significantly reduces PT travel times and/or significantly increases PT travel speeds and/or reduces delay to PT services due to severe congestion 1: Reduces PT travel times and/or increases PT travel speeds and/or reduces delay to PT services due to congestion 0: No effect on PT speed/journey times RED FLAG: Detrimental effect on PT speed/journey times
Improved reliability of PT services
2: Significantly increases the punctuality/reliability of PT services 1: Increases the punctuality/reliability of PT services 0: No effect on the reliability of PT services RED FLAG: Detrimental effect on the reliability of PT services
Reduced private vehicle dependency
THIS IS A PROGRAMME MEASURE – Not proposing to use this to prioritise individual projects – remove from 'Calculator' but keep in Strategic Framework
Improved affordability of
transport
THIS IS A PROGRAMME MEASURE – Not proposing to use this to prioritise individual projects – remove from 'Calculator' but keep in Strategic Framework
Significant increase in use of active modes
2: Significantly increases use of active modes AND consequentially has an impact on easing urban congestion 1: Increases use of active modes OR links to complete or complement existing walking & cycling networks 0: No effect on use of active modes RED FLAG: Decreases use of active modes

123Auckland Regional Land Transport Plan 2015-2025
Benefit ITP desired outcome ITP scoring criteria
BE
NE
FIT
2: A
UC
KLA
ND
'S T
RA
NSP
OR
T SY
STE
M M
OV
ES
PEO
PLE
& G
OO
DS
EFF
ICIE
NTL
Y
Managing severe urban congestion
2: Significantly reduces delay due to severe congestion OR maintains average vehicle speeds in a growing Auckland OR significantly relieves capacity constraints 1: Reduces delay due to congestion OR relieves capacity constraints 0: No effect on severe urban congestion RED FLAG: Detrimental effect on severe urban congestion
More efficient freight supply
chains
2: Significantly reduces delay to freight vehicles due to severe congestion – including designated routes for HPMV vehicles 1: Reduces delay to freight vehicles due to congestion 0: No effect on delay to freight vehicles RED FLAG: Detrimental effect to freight supply chains
Support Auckland's economic
aspirations
2: Directly facilitates the concentration of economic activity in a major business area, metropolitan centre or the city centre (as identified in the map below); OR has potential to deliver a nationally significant contribution to economic growth and/or productivity on a key route – including key freight routes, designated HPMV routes and key tourism routes 1: Supports economic activity in a major business area, metropolitan centre or the city centre 0: No effect on the agglomeration of economic activity into centres RED FLAG: Detrimental effect on the agglomeration of economic activity into centres
Improved network resilience and
travel time reliability
2: Significantly improves the network's ability to cope with unexpected events OR significantly improves travel time reliability 1: Improves the network's ability to cope with unexpected events OR improves travel time reliability 0: No effect on network resilience or travel time reliability RED FLAG: Detrimental effect on network resilience or travel time reliability

124 Auckland Regional Land Transport Plan 2015-2025
Benefit ITP desired outcome ITP scoring criteria
BE
NE
FIT
3: B
ETT
ER
USE
OF
TRA
NSP
OR
T IN
VE
STM
EN
T
Missing links in the strategic
transport network are filled
2: Links to complete or complement existing networks AND implementation will result in the easing of severe urban congestion 1: Links to complete or complement existing networks 0: No relevance to links in existing networks RED FLAG: Detrimental effect to links in existing networks
Wider network benefits achieved through smaller investments in existing assets
2. Wider network benefits are achieved which result in the reduction of severe congestion (project cost is less than $5 million) OR makes better use of existing transport capacity on a key route 1. Wider network benefits are achieved which result in the reduction of congestion or improved travel time reliability (project cost is less than $5 million) 0: Project costs more than $5 million, or does not deliver wider network benefits RED FLAG: Project has detrimental effects on the wider transport network
The transport network is
optimised through being managed
and prioritised as a single system
2: One System initiatives that manage demand to address journey time reliability/ease severe congestion OR One System initiatives that make better use of existing transport capacity on a key route 1: One System initiatives that manage demand/ease congestion 0: Not a One System/demand management initiative RED FLAG: Detrimental effect to a One System approach
Improved value for money from future operating
expenditure
2: Improves whole-of-life costs OR optimises the cost of PT services (for example: increased PT fare-box recovery ratio, reduced operating subsidy per PT passenger km, or via a reduction in network operating costs) 1: Not applicable for this criteria 0: Normal project effect on operating costs RED FLAG: Project significantly increases network operating costs which are likely to exceed network benefits
Assets are renewed and maintained optimally
THIS IS AN ASSET MANAGEMENT MEASURE AND DOES NOT RELATE DIRECTLY TO PRIORITISING NEW CAPEX PROJECTS
Right sized solutions at the
appropriate time
2: Delivers an optimised solution which has been proven to balance cost with the achievement of benefits OR the project provides an acceptable interim solution which postpones the need for significant further investment 1: Options evaluation has been undertaken which proves this project to be the best alternative available 0: Project not related to this measure OR no options evaluation completed to date RED FLAG: Ignores cheaper and/or interim solutions that may delay the need for larger-scale investment

125Auckland Regional Land Transport Plan 2015-2025
Benefit ITP desired outcome ITP scoring criteria
BE
NE
FIT
4: A
UC
KLA
ND
'S T
RA
NSP
OR
T SY
STE
M E
NA
BLE
S G
RO
WTH
IN A
WA
Y TH
AT
SUPP
OR
TS C
OM
MU
NIT
IES
AN
D A
HIG
H Q
UA
LITY
U
RB
AN
FO
RM
Support housing and employment growth in identified strategic
growth areas (including Special Housing Areas)
2: Required to enable the development of an identified strategic growth area OR AT/Transport Agency obligation documented in an operative Plan Change
1: Highly desirable to support the development of an identified strategic growth area
0: Not related an identified strategic growth area
RED FLAG: Detrimental effect on the development of an identified strategic growth area
Note that for the purposes of this criteria, strategic growth areas include: identified Strategic Housing Areas; greenfield growth areas identified in the Auckland Plan; priority infill growth areas identified in the Auckland Plan
Improved connectivity to
and within the city centre, metropolitan
centres and town centres
2: Significantly improves connectivity for the city centre or a metropolitan centre or a town centre 1: Improves connectivity for the city centre or a metropolitan centre or a town centre 0: Not related to the connectivity of centres RED FLAG: Detrimental effect on the connectivity of centres
Improved accessibility to employment
2: Significantly improves the accessibility to markets/areas of employment or economic growth 1: Improves the accessibility to markets/areas of employment or economic growth 0: No effect on the accessibility to employment areas RED FLAG: Detrimental effect on the accessibility to employment areas
Aligns with the goals of the Auckland Plan's identified
geographic priorities (city centre and
Southern Initiative)
2: Aligns with the goals for the Auckland Plan's identified geographic projects (city centre or Southern Initiative area) 1: Aligns with the delivery of another identified Auckland Council geographic priority area 0: Not related to an Auckland Council geographic priority area RED FLAG: Detrimental to an Auckland Council geographic priority area
Improved social and cultural outcomes
and focus on those in most need
2: Reduces the financial burden for those most in need OR improves accessibility for young people/Ma ori (to employment or other activities) OR improves Ma ori social wellbeing 1: Provides improved transport choices for those with limited access to a car/most in need 0: Not related RED FLAG: Detrimental effect on social and cultural aspirations OR reduces transport choices for those most in need
Contribute to place-making and helps
achieve a high quality urban form
2: Significantly contributes to place-making and the achievement of a high quality urban form 1: Contributes to place-making and the achievement of a high quality urban form 0: No effect on place-making or the achievement of a high quality urban form RED FLAG: Detrimental effect on place-making or the achievement of a high quality urban form

126 Auckland Regional Land Transport Plan 2015-2025
Benefit ITP desired outcome ITP scoring criteria
BE
NE
FIT
5A: R
ED
UC
E A
DV
ER
SE
EFF
EC
TS F
RO
M A
UC
KLA
ND
'S
TRA
NSP
OR
T SY
STE
M -
SA
FETY
Reduce serious injuries and fatalities
2: Potential to significantly reduce the actual crash risk involving deaths and serious injuries OR part of a model walking/cycling community to make walking and cycling a safer transport choice 1: Potential to reduce transport related deaths and serious injuries 0: No effect on reducing deaths and serious injuries RED FLAG: Detrimental effect on deaths and serious injuries
Improved personal security
2: Significantly improves personal security 1: Improves personal security 0: No effect on personal security RED FLAG: Detrimental effect on personal security
BE
NE
FIT
5B: R
ED
UC
E A
DV
ER
SE E
FFE
CTS
FR
OM
AU
CK
LAN
D'S
TR
AN
SPO
RT
SYST
EM
- E
NV
IRO
NM
EN
TAL
& H
EA
LTH
: IN
CLU
DIN
G M
AO
RI V
ALU
ES
(TA
NG
IBLE
AN
D IN
TAN
GIB
LE)
Reduced greenhouse gas
emissions
2: Significantly reduces greenhouse gas emissions 1: Reduces greenhouse gas emissions 0: No effect on greenhouse gas emissions RED FLAG: Detrimental effect on greenhouse gas emissions
Reduced air and water pollutants
2: Significantly reduces air or water pollutants 1: Reduces air or water pollutants 0: No effect on air or water pollutants RED FLAG: Detrimental effect on air or water pollutants
Increased health through active
transport
2: Promotes a significant increase in the level of walking and cycling thereby produces positive health outcomes 1: Increases the level of walking and cycling 0: No effect on walking and cycling uptake RED FLAG: Detrimental effect on walking and cycling uptake
Increased fuel resilience
THIS IS A PROGRAMME MEASURE – Not proposing to use this to prioritise individual projects – remove from 'Calculator' but keep in Strategic Framework
Increased use of renewable fuels
2: Directly increases the level of renewable fuel use in Auckland 1: Indirectly increases the level of renewable fuel use in Auckland 0: No effect on renewable fuel use RED FLAG: Detrimental effect on the use of renewable fuel use
Protect Ma ori Values (tangible and intangible)
Waterways: Adverse effects to be avoided, if not, remedy or mitigate adverse effects on Ma ori tangible and intangible values (mauri, wahitapu, historical, customary needs, customary resources, customary esteem) in a way that reflects the scale and degree of adverse effects. RED FLAG EXAMPLES: Mauri of the waterways is diminished, exercise of kaitiakitanga is reduced, customary resource is limited Methodology: Unitary Plan provisions, draft PAUP section 2.5.2 for definitions Notes: 1) Methodology already utilised in multi-criteria analysis for AMETI and Newmarket Station option assessment 2) Covered in Mauri Model in environmental or ecosystem domain
Places and sites of value and significance: Adverse effects to be avoided, if not, remedy or mitigate adverse effects on Ma ori tangible and intangible values (mauri, wa hi tapu, historical, customary needs, customary esteem) in a way that reflects the scale and degree of adverse effects. RED FLAG EXAMPLES: Destruction or partial destruction of wa hi tapu; adverse cumulative effects on the site; destruction or significant reduction of Ma ori values associated with the area. Methodology: Unitary Plan provisions, draft PAUP section 2.5.4 for definitions Notes: 1) Methodology already utilised in multi-criteria analysis for AMETI and Newmarket Station option assessment 2) Cultural covered in Mauri Model regarding cultural wellbeing (hapu ūor iwi)

127Auckland Regional Land Transport Plan 2015-2025
Benefit ITP Desired Outcome ITP Scoring Criteria
BE
NE
FIT
5C
: RE
DU
CE
AD
VE
RSE
EFF
EC
TS F
RO
M
AU
CK
LAN
D'S
TR
AN
SPO
RT
SYST
EM
- C
ULT
UR
AL:
IN
CLU
DIN
G M
AO
RI V
ALU
ES
(TA
NG
IBLE
AN
D IN
TAN
GIB
LE)
Minimal cultural adverse
effects from transport
Recognise protected customary activity and treaty settlement redress Description of Ma ori Values: Protected customary activities refer to recognition as prescribed in accordance with the Marine and Coastal area (Takutaimoana Act) 2011. Treaty settlement redress as per settlement legislation for Ta maki Makaurau tribes RED FLAG EXAMPLES: Diminishes ability to perform protected customary activities or impacts on the ability to exercise treaty redress. Methodology: Recognised in draft PAUP provisions Notes: Methodology already utilised in multi-criteria analysis for AMETI and Newmarket Station option assessment
Protect Ma ori values (mauri, wa hi tapu, historical, customary resources, customary needs, customary esteem) associated with Ma ori cultural landscapes RED FLAG: Damage to Ma ori values associated with Ma ori cultural landscapes Methodology: Unitary Plan provisions, draft PAUP, section 2.5.4 and Regional Policy Statement Notes: Methodology already utilised in multi-criteria analysis for AMETI and Newmarket Station option assessment
2.2 Effectiveness Assessment The effectiveness evaluation assesses how well the proposed investment addresses the strategic issue or problem identified in the strategic fit evaluation. Activities are most effective if they provide long-term, integrated and enduring solutions.
• For a project to be considered as highly effective it must:
o improve integration within and between transport modes/services o be part of a whole of network/One System approach o be a key component of one of AT's strategic plans (e.g. Regional Public Transport Plan) or part of a
State Highway Strategy (e.g.Roads of National Significance Network Plan) or a key component of a Transport Agency-supported strategy, endorsed package, programme or plan
o support regional transport networks o provide a solution that successfully integrates land transport, land use, other infrastructure and
other activities o provide a solution that significantly contributes to more than one benefit in the Integrated
Transport Programme (ITP) Strategic Framework, where appropriate to the activity o be optimised against multiple transport outcomes and objectives.
For this RLTP, effectiveness has been assessed for all significant activities proposed in the 10 years from 2015/16, based on the best available information. Inevitably, the assessment for activities which are already well advanced is more robust than for indicative projects in outer years.

128 Auckland Regional Land Transport Plan 2015-2025
HIGH MEDIUM LOW NO RATING
Evidence is provided to demonstrate that the activity or combination of activities delivers on each of the following:
Evidence is provided to demonstrate that the activity or combination of activities delivers on each of the following:
Evidence is provided to demonstrate that the activity or combination of activities delivers on each of the following:
When there is no supporting evidence or the assessment has not been conducted
Covers all of the low and medium effectiveness criteria plus:
All the low effectiveness criteria, plus
• Improves integration with-in and between transport modes/ services
• It part of a whole of network/ One system approach
• Is a key component of one of AT’s strategic plans (e.g. the RPTP) or a part of a State Highway Strategy (e.g. the RoNS Network Plan) or a key component of a Transport Agency - supported strategy, endorsed package, programme or plan
• Supports regional transport networks
• Provides a solution that successfully integrates land transport, land use, other infrastructure and other activities
• Provides a solution that significantly contributes to more than one benefit in the ITP Strategic Framework, where appropriate to the activity
• Is optimised against multiple transport outcomes and objectives
• Provides a long term solu-tion with enduring benefits appropriate to the scale of the solution
• Delivers a measurable impact outcome in achiev-ing the potential impact or outcome identified in the “Strategic Fit” assessment.
• Is a part of one of AT’s stra-tegic plans (e.g. the RPTP) or part of State Highway Strat-egy (e.g. the RoNS Network Plan) or a part of a Trans-port Agency - supported strategy, endorsed package, programme or plan
• Provides a transport solution that is consistent with the land use described in the Auckland Plan/ Unitary Plan
• Provides a solution that makes a contribution to more than one benefit in the ITP Strategic Framework, where appropriate to the activity
• Delivers the potential benefit or outcome iden-tified in the “Strategic Fit” assessment
• An agreed level of service as described in the AMP or existing strategic document
• The purpose and objectives of the Land Transport Management Act (LTMA)
• Has defined and considered:
- The relevant problems, issues & opportunities
- The appropriate alternatives & options
- Opportunities for collaboration
- Any adverse effects or impacts
- Is an affordable solution with a funding plan
- The scale of the proposed solution is appropriate to the potential benefit or outcome in the Strategic Fit assessment
- Avoids duplication of activities

129Auckland Regional Land Transport Plan 2015-2025
Efficiency The efficiency rating is the benefit/cost ratio calculated according to the Transport Agency’s Economic Evaluation Manual (EEM). The EEM calculation has been significantly reviewed for the 2015 planning round; key changes are:
• A revised discount rate of 6 per cent, along with an extended evaluation period of 40 years
• The addition of wider economic benefits relating to imperfect competition and increased labour supply
• Greater emphasis on a multi-modal approach to evaluation, including:
o Public transport evaluation periods made consistent with other modes o Equal values of travel time across modes for monetising the total value of travel time benefits o Discontinuing the use of default traffic growth rates. Evidence will be required to support any
traffic growth assumptions
Overall these changes make the efficiency evaluation more useful than it was in the past, especially for comparing different types of projects; for example a road project and a public transport project will now be assessed with the same discount rate, evaluation period and value of time so the results will enable a valid comparison of the two projects.
While the efficiency criterion is clearly defined, it is always the hardest criterion to assess because it relies on detailed information about costs and about expected outcomes and benefits. Like the effectiveness evaluation, efficiency needs to be refined, updated and re-assessed as activities progress through the planning phases, and in response to performance monitoring.
The output of the efficiency calculation is a benefit/cost ratio or BCR, which is converted to a profile as follows:
>5 High
3.0 - 4.9 Medium
1.0 - 2.9 Low

130 Auckland Regional Land Transport Plan 2015-2025
APPENDIX 3: SIGNIFICANCE POLICY
Background
3.1.1 Requirement to develop a Significance Policy Section 106(2) of the Land Transport Management Act 2003 requires Auckland Transport to adopt a policy that determines significance in respect of:
(a) variations made to the regional land transport plan; and
(b) the activities that are included in the regional land transport plan.
In adopting its Significance Policy, AT is acting in its role as the Regional Transport Committee for Auckland.
3.1.2 Legal definitions of significance The following decisions are defined in legislation as significant:
• Developing the Regional Land Transport Plan by June 2015 and reviewing it at least every six years thereafter (23);
• Replacing or varying this significance policy (23); and
• Any decision involving transfer of ownership or control of a strategic asset (24).
3.1.3 Auckland Council Significance Policy Auckland Council adopted its Significance and Engagement Policy (25) in November 2014, following public consultation. The council's Significance and Engagement Policy is required by the Section 76AA of the Local Government Act 2002 and is distinct from Auckland Transport's Significance Policy.
Auckland Council's Significance and Engagement Policy applies to Auckland Transport through the CCO Accountability Policy.
Some extracts from Auckland Council's policy are quoted below for context:
"The council's thresholds relevant to determining significance are:
• creating a new group of activity;
• stopping carrying out a group of activity;
• increasing (by 33 per cent or more) or decreasing (by 20 per cent decrease or more) spending on a group of activi-ty; [The groups of activities delivered by Auckland Transport are defined in Auckland Council's 2015 Long Term Plan and are: The Public Transport and Travel Demand Management; Roads and Footpaths; Parking and Enforcement.]
• Transferring the ownership or control of our strategic assets.
Where a decision meets this criteria it will be "significant" and will automatically trigger a requirement to consult."[...]
"Auckland Council has defined as strategic assets any Auckland Council or Auckland Transport-owned asset which is integral to the functioning of:
• The public transport network, including Britomart; and
• The roading network."[...]
"The governing body and local boards will consider the following matters when determining the degree of significance of a decision:
• the number of people affected, the degree to which they are affected and the likely impact of a decision;
• whether this type of decision has a history of generating wide public interest within the local board area (for a local board decision) or Auckland or New Zealand generally (for a governing body decision);
• the impact of the decision on the governing body or local board ability to deliver on actions that contribute to the

131Auckland Regional Land Transport Plan 2015-2025
Auckland Plan, as well as any statutory responsibility;
• the impact of the decision on intended service levels for a group of activities, including the start/or stop of any group of activity;
• The degree to which the decision or proposal can be reversed should circumstances warrant."
3.2 Auckland Transport's Significance Policy Auckland Transport is committed to involving the public in decisions which affect them.
Auckland Transport will undertake public consultation, in accordance with the consultation principles set out in the Local Government Act, for decisions which it decides are significant under this Significance Policy.
If a change to the RLTP is not considered significant, then the change can be made by AT. This includes making the decision in an open and transparent way, and consulting with those affected, in a way appropriate to the scale of the decision.
The following decisions are significant:
• Decisions which are defined in legislation as significant.
• Any decision involving transfer of ownership or control of an asset defined by Auckland Council as a strategic asset.
• A new AT activity or project, or a change to the scope of an AT activity or project, which the Auckland Transport Board considers to represent a 30 per cent or greater increase or a 20 per cent or greater decrease in the nature of a group of activities. The groups of activities delivered by AT are defined in Auckland Council's 2015 Long-term Plan and are:
o public transport and travel demand management; o roads and footpathso parking and enforcement.
• The inclusion of a construction phase for a new state highway project with a total activity or project cost greater than 10 per cent of the activity class New and Improved Infrastructure for State Highways in this RLTP.
• Changes to the scope of an activity or project, whether delivered by AT or the Transport Agency, that increase expenditure by more than $10 million and increases expenditure in the relevant activity class by more than 10 per cent, relative to the totals set out in Chapter 16 of this RLTP.
• Public transport decisions which represent a significant variation to the Regional Public Transport Plan (see Section 3.2.1 below).
• Any other decision which AT considers to be a significant variation to this Regional Land Transport Plan (see Sec-tion 3.2.2 below).
The following decisions will generally not be significant:
• Replacement of an activity or project by another activity or project of the same or substantially similar type.
• Cost or timing changes that do not affect the scope of an activity or project.
• A change arising from the decision of a third party (for example, the declaration or revocation of a State Highway by the Transport Agency).
• An increase in revenue or decrease in costs which does not significantly change the nature of a group of activities (as defined by Auckland Council) or activity class (as defined by the Transport Agency).
• A decision to progress emergency works.
3.2.1 Varying the Regional Public Transport Plan Auckland Transport recognises that changes to the nature of the public transport network have historically been of high public interest, can affect residents and ratepayers both positively and negatively, and can be difficult or impossible to reverse. Therefore variations the Regional Public Transport Plan (10) are subject to a more restrictive Significance Policy, as set out in the RPTP.
3.2.2 Varying this Regional Land Transport Plan Legislation provides for this Regional Land Transport Plan to remain in force for six years. However, the plan must be reviewed by AT, having regard to the views of representative groups of land transport users and providers,
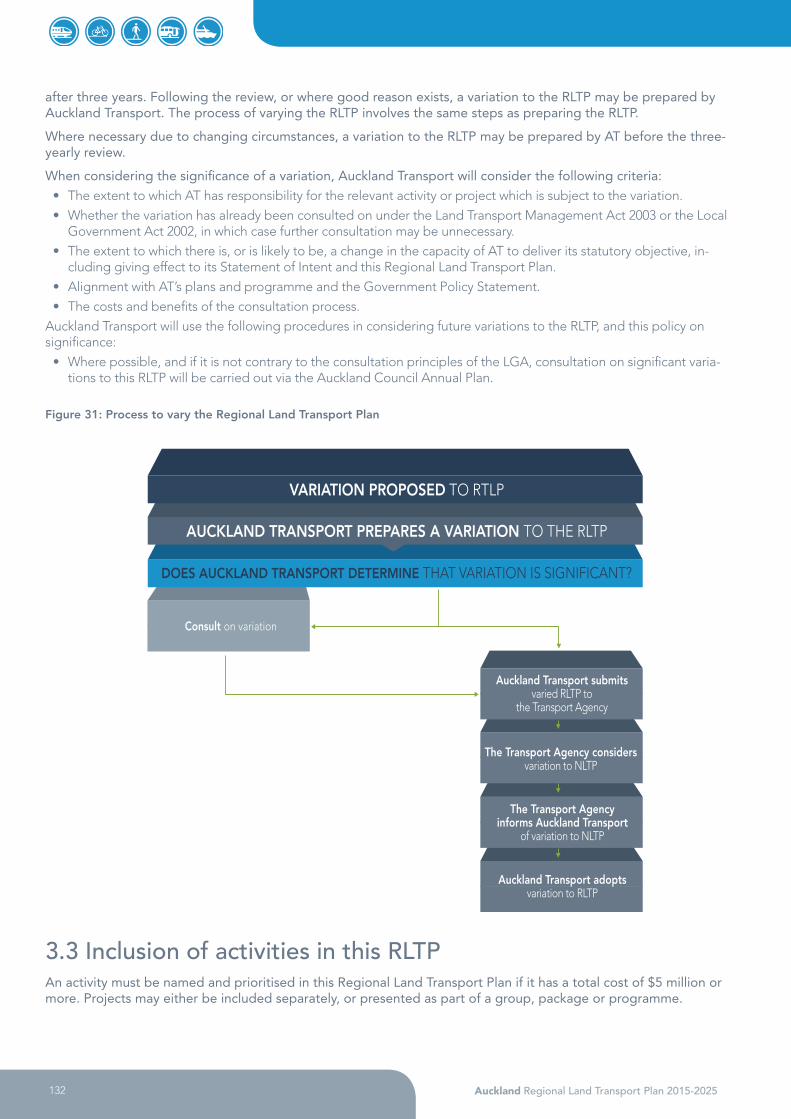
132 Auckland Regional Land Transport Plan 2015-2025
after three years. Following the review, or where good reason exists, a variation to the RLTP may be prepared by Auckland Transport. The process of varying the RLTP involves the same steps as preparing the RLTP.
Where necessary due to changing circumstances, a variation to the RLTP may be prepared by AT before the three-yearly review.
When considering the significance of a variation, Auckland Transport will consider the following criteria:
• The extent to which AT has responsibility for the relevant activity or project which is subject to the variation.
• Whether the variation has already been consulted on under the Land Transport Management Act 2003 or the Local Government Act 2002, in which case further consultation may be unnecessary.
• The extent to which there is, or is likely to be, a change in the capacity of AT to deliver its statutory objective, in-cluding giving effect to its Statement of Intent and this Regional Land Transport Plan.
• Alignment with AT’s plans and programme and the Government Policy Statement.
• The costs and benefits of the consultation process.
Auckland Transport will use the following procedures in considering future variations to the RLTP, and this policy on significance:
• Where possible, and if it is not contrary to the consultation principles of the LGA, consultation on significant varia-tions to this RLTP will be carried out via the Auckland Council Annual Plan.
Figure 31: Process to vary the Regional Land Transport Plan
3.3 Inclusion of activities in this RLTP An activity must be named and prioritised in this Regional Land Transport Plan if it has a total cost of $5 million or more. Projects may either be included separately, or presented as part of a group, package or programme.
Consult on variation
Auckland Transport submits varied RLTP to
the Transport Agency
The Transport Agency considers variation to NLTP
AUCKLAND TRANSPORT PREPARES A VARIATION TO THE RLTP
VARIATION PROPOSED TO RTLP
DOES AUCKLAND TRANSPORT DETERMINE THAT VARIATION IS SIGNIFICANT?
The Transport Agency informs Auckland Transport
of variation to NLTP
Auckland Transport adopts variation to RLTP

133Auckland Regional Land Transport Plan 2015-2025
GLOSSARY
AC Auckland Council
ACN Auckland Cycle Network
ACP Accelerated Capital Programme
AEP Auckland Electrification Project
AMETI Auckland-Manukau Eastern Transport Initiative
AMP Asset Management Plan
AT Auckland Transport
ATOC Auckland Traffic Operations Centre
BCR Benefit to cost ratio
CCFAS City Centre Future Access Study
CRL City Rail Link
DART Developing Auckland’s Rail Transport
DOC Department of Conservation
DSI Deaths and Serious Injuries
EEM The Transport Agency’s Economic Evaluation Manual
EMU Electric Multiple Units (Electric Trains)
FTN Frequent Transit Network (key bus and ferry routes)
FULSS Future Urban Land Supply Strategy
GHG Greenhouse gas emissions
GPS Government Policy Statement on land transport funding
HNO Transport Agency Highways Network and Operations responsible for state highways
HPMV High productivity motor vehicles
ITP Integrated Transport Programme
KPIs Key performance indicators
LBTCF Local Board Transport Capital Fund
LGA Local Government Act 2002
LTMA Land Transport Management Act 2003
LTP Long-term Plan
NLTF National Land Transport Fund

134 Auckland Regional Land Transport Plan 2015-2025
NLTP National Land Transport Programme
NORSGA Northern Strategic Growth Area
PEVs Plug-in electric Vehicles
PJP Personalised Journey Planning
PT Public Transport
PUAP Proposed Auckland Unitary Plan
RLTP Regional Land Transport Plan
RoNS Roads of National Significance
RPTP Regional Public Transport Plan
RTC Regional Transport Committee
RTN Rapid Transit Network (passenger rail and Northern Busway)
SH State highway
SHA Special Housing Area
SOI Statement of Intent
TDM Travel Demand Management
UCF Urban Cycleways Fund
UNI Upper North Island
UNIFS Upper North Island Freight Study

135Auckland Regional Land Transport Plan 2015-2025
BIBLIOGRAPHY
1. Ministry of Transport. Governement Policy Statement on Land Transport 2015/16-2024/25. [Online] http://www.transport.govt.nz/ourwork/keystrategiesandplans/gpsonlandtransportfunding/gps2015/.
2. Dearnely, Mathew. Transport is Auckland's big issue. NZ Herald. [Online] 22 October 2013. http://www.nzherald.co.nz/nz/news/article.cfm?c_id=1&objectid=11143807.
3. Ministry of Transport. Household Travel Survey (Auckland urban area, 2011-2013, Mode share of trip legs). [Online] July 2014. http://nzdotstat.stats.govt.nz/wbos/Index.aspx?DataSetCode=TABLECODE7431.
4. Auckland Council and Sinclair Knight Merz. City Centre Future Access Study. 2012.
5. Auckland Council. Auckland Plan. 2012.
6. Ministry of Transport. Road Crash Statistics. [Online] http://www.transport.govt.nz/research/roadcrashstatistics/.
7. International Traffic Safety Data and Analysis Group. Road Safety Annual Report 2014. [Online] http://internationaltransportforum.org/Pub/pdf/14IrtadReport.pdf.
8. Ministry of Transport. Climate Change and Energy. [Online] http://www.transport.govt.nz/ourwork/climatechange/.
9. - . Arterial Roads Deficiency Analysis. 2014.
10. Auckland Transport. Regional Public Transport Plan. 2013.
11. Road Safe Auckland. Strategic Guidance for Road Safety Planning. s.l. : Unpublished, available from Auckland Transport Road Safety, 2014.
12. Auckland Transport. Draft Parking Discussion Document. 2014.
13. —. Auckland Transport Parking Strategy. [Online] May 2015. https://at.govt.nz/media/1119147/Auckland-Transport-Parking-Strategy-May-2015.pdf.
14. Ministry of Transport. Transport Monitoring Indicator Framework. [Online] http://www.transport.govt.nz/ourwork/tmif/infrastructureandinvestment/ii001/.
15. Prime Minister of New Zealand. PM signals next generation of Auckland transport projects. 2013.
16. Ministry of Transport. National Freight Demand Study. 2014.
17. Auckland Council. Draft Long-term Plan 2015-25 Consultation Document. [Online] http:/www.shapeauckland.co.nz/.
18. Hinckson, E and Badland, H. School Travel Plan Evaluation Report. s.l. : Auckland Regional Transport Authority, 2006.
19. Ministry of Transport. Fact Sheet: Cycling for Transport. Continuous Household Travel Survey. [Online] 2013. http://www.transport.govt.nz/assets/Import/Documents/Cycling-2013.pdf.
20. Auckland Transport. Auckland Transport Regional Cycle Monitoring Report. [Online] 2014. https://at.govt.nz/media/572288/AT-RegionalCycle-Monitoring-Regional-Summary2014.pdf.
21. Ministry of Transport. Safer Journeys. [Online] 2010. http://www.saferjourneys.govt.nz/.
136 Auckland Regional Land Transport Plan 2015-2025
22. NZ Transport Agency. NZTA Work Categories and Activity Classes.
23. Land Transport Management Act 2003. [Online] [Cited: 4 October 2014.]
24. Local Government Act. [Online] 2002. [Cited: 1 April 2014.]
25. Auckland Council. Significance and Engagement Policy. [Online] November 2014. http://www.shapeauckland.co.nz/consultations/significance-and-engagement-policy/documents/.
26. —. Mayor's Proposal for the Long-term Plan 2015-25. [Online] [Cited: 28 August 2014.] http://www.aucklandcouncil.govt.nz/EN/planspoliciesprojects/plansstrategies/longtermplan2015/Documents/mayorsltpproposal201525.pdf.
27. Auckland Transport and Ascari Consulting. The Auckland Frieght Story (draft). 2014.
28. Statistics NZ. Census Journey To Work. 2001, 2006, 2013.
29. Ministry of Transport. Safer Journeys. [Online] 2010. http://www.saferjourneys.govt.nz/.
30. Duranton, Giles and Turner, Matthew A. The Fundamental Law of Road Congestion: Evidence from US cities. s.l. : National Bureau of Economic Research , 2009. Working Paper 15376.

137Auckland Regional Land Transport Plan 2015-2025
END NOTES
1Road productivity is a measure of the efficiency of the road in moving people during the peak hour. It is measured as the product of number of vehicles, their average journey speed and average vehicular occupancy. Key arterial routes include:
- Airport to city centre (via Manukau Road) - St Lukes to St Johns (via Balmoral/Greenlane West/Greenlane East/Remuera Road) - Albany to Birkenhead (via Glenfield Road) - Henderson to city centre (via Great North Road) - SH1 to Ti Rakau Drive (via Te Irirangi Drive) - SH20 to Portage Road (via Tiverton/Wolverton Road).
2Target travel times on nominated strategic freight routes:
Route Travel time (mins)SEART (from Sylvia Park to East Tamaki) 11SEART (from East Tamaki to Sylvia Park) 12Wairau Road (from SH1 to SH18) 8Wairau Road (from SH18 to SH1) 8Harris Road (from East Tamaki to SH1 Highbrook interchange) 10Harris Road (from SH1 Highbrook interchange to East Tamaki) 11Kaka Street/James Fletcher Drive/Favona Road/Walmsley Road (SH20 to Walmsley)* 13Kaka Street/James Feltcher Drive/Favona Road/Walmsley Road (Walmsley to SH20)* 13Great South Road (SH1 Ellerslie Panmure Highway Interchange to Portage Road)* 11Great South Road (Portage Road to SH1 Ellerslie Panmure Highway Interchange)* 11
*New added route3 Smooth travel exposure measures the proportion of vehicles kilometres travelled in a year (VKT) that occurs on ‘smooth’ sealed roads and indicates the ride quality experienced by motorists.
4A farebox recovery ratio measures the contribution fares make to the operating cost of providing public transport services.5As defined in AT’s Asset Management Plans.6As defined in AT’s customer service standards.7Four-hour peak period is defined as the four busiest hours of the day. These hours are not often coincidental and can vary depending on contributing factors. A sample of streets with paid parking is monitored to report on this KPI.

www.AT.govt.nzAuckland Transport’s Call Centre operates24 hours / 7 days / weekPhone +64 9 355 3553Fax +64 9 355 3550
Visit our Head Office6 Henderson Valley Road, Henderson,Auckland 0612Private Bag 92 250, Auckland 1142