Embed Size (px)
Citation preview
Each year, >9 million foodborne illnesses are estimated to be caused by major pathogens acquired in the United States. Preventing these illnesses is challenging because resources are limited and linking individual illnesses to a particular food is rarely possible except during an outbreak. We developed a method of attributing illnesses to food com-modities that uses data from outbreaks associated with both simple and complex foods. Using data from outbreak-associ-ated illnesses for 1998–2008, we estimated annual US food-borne illnesses, hospitalizations, and deaths attributable to each of 17 food commodities. We attributed 46% of illnesses to produce and found that more deaths were attributed to poultry than to any other commodity. To the extent that these estimates reflect the commodities causing all foodborne ill-ness, they indicate that efforts are particularly needed to prevent contamination of produce and poultry. Methods to incorporate data from other sources are needed to improve attribution estimates for some commodities and agents.
Despite advances in food safety, foodborne illness re-mains common in the United States; >9 million per-
sons each year have a foodborne illness caused by a major pathogen (1). One challenge in preventing foodborne ill-ness is determining how to prioritize limited food safety resources across a large number of foods (2). Furthermore, attributing all illnesses to specific foods is challenging because most agents are transmitted through a variety of foods, and linking an illness to a particular food is rarely possible except during an outbreak.
To help determine priorities for food safety efforts, we organized the large number of foods implicated in out-breaks in the United States into 17 mutually exclusive food
commodities. Here, we provide estimates of the number of domestically acquired foodborne illnesses, hospitaliza-tions, and deaths attributable to these commodities.
Methods
Data SourcesState and local health departments report foodborne
disease outbreaks to the Centers for Disease Control and Prevention (CDC) through the Foodborne Disease Outbreak Surveillance System (3). Reports include, when available, number of persons ill, outbreak etiology, description of the implicated food vehicle(s), lists of ingredients, and identi-fication of the contaminated ingredient(s). We reviewed all outbreaks from 1998, the first year with detailed information on ingredients, through 2008 that were reported to the CDC by October 2010. For this analysis, we included all outbreaks with an implicated food vehicle and a single etiologic agent.
Health officials may report whether an etiologic agent was confirmed or suspected on the basis of published cri-teria (4,5) and the method of confirmation. Reports may include >1 of 5 reasons for implicating a food vehicle: 1) statistical evidence from an epidemiologic investigation; 2) laboratory evidence identifying the etiologic agent in the implicated food; 3) compelling or other supportive data; 4) previous experience suggesting that the food vehicle is the source; and 5) other data, such as identification of the same etiologic subtype on the farm that supplied the implicated food. We considered an implicated food confirmed when 1 of the first 2 reasons was reported. Other implicated food vehicles were considered suspect.
To determine whether to analyze outbreaks with sus-pect foods, we reviewed a convenience sample of 117 out-break reports for which the reason for implication was not reported. Supporting evidence implicated the food vehicle
Attribution of Foodborne Illnesses, Hospitalizations, and Deaths to Food
Commodities by using Outbreak Data, United States, 1998–2008
John A. Painter, Robert M. Hoekstra, Tracy Ayers, Robert V. Tauxe, Christopher R. Braden, Frederick J. Angulo, and Patricia M. Griffin
Emerging Infectious Diseases • www.cdc.gov/eid • Vol. 19, No. 3, March 2013 407
Author affiliation: Centers for Disease Control and Prevention, Atlanta, GA, USA
DOI: http://dx.doi.org/10.3201/eid1903.111866
RESEARCH
for 65% of these reports. Some of these outbreaks involved too few persons to conduct an epidemiologic investigation; in most, no food was tested. Outbreaks with suspect ve-hicles constituted a large proportion of the dataset, but it was not possible to locate and review the documentation for all investigations. However, because a large percent-age of documentation reviewed had reasonable evidence to implicate the reported food, we included all outbreaks with suspect foods in the analysis.
During 1998–2008, a total of 13,352 foodborne dis-ease outbreaks, causing 271,974 illnesses, were reported in the United States (online Technical Appendix 1 Table 1, wwwnc.cdc.gov/EID/article/19/3/11-1866-Techapp1.pdf). Of those outbreaks, 4,887 (37%), causing 128,269 (47%) illnesses, had an implicated food vehicle and a single etiol-ogy; 298 of those outbreaks were excluded because infor-mation about the vehicle was insufficient to categorize the ingredients. We also did not include the 3% of outbreaks that had multiple etiologies reported.
To assess possible bias when including outbreaks with a suspected vehicle or etiology in our estimates, we com-pared the rank order of each of the 17 food commodities in our model based on the total number of associated ill-nesses with the rank order when including only those ill-nesses with a confirmed etiology and vehicle. The order of the top 8 commodities associated with the highest number of illnesses changed only slightly (ranks 5 and 6 switched); therefore, we included all outbreaks to maximize the data available for the lower-ranking commodities.
The estimated number of domestically acquired ill-nesses, hospitalizations, and deaths for each etiology was obtained from published estimates (1) or, when not avail-able, by extrapolating from available data. To highlight dif-ferences in sources for nontyphoidal Salmonella spp. sero-types, we made estimates for those most frequently isolated from humans (i.e., Enteritidis, Heidelberg, Javiana, New-port, Typhimurium) and, separately, for all others. We es-timated the number of illnesses, hospitalization, and deaths by multiplying the numbers for nontyphoidal Salmonella spp. (1) by the proportion of all serotyped human Salmo-nella isolates reported during 1998–2008 (6).
The outbreak dataset included outbreaks with chemical etiologies and those caused by Anisakis simplex, for which published illness estimates were not available. For these, the number of illnesses was estimated as the product of the mean annual number of illnesses reported to CDC through outbreak surveillance during 1998–2008 by using the same multipliers for underdiagnosis (×25), underreporting (×30), case-hospitalization rate (×0.006), and case-fatality rate (×0.0004) as for infection with Clostridium perfringens, a short-duration illness (1).
We attempted to attribute food commodities for an estimated 9,638,301 illnesses, 57,462 hospitalizations, and 1,451 deaths caused by known agents (online Techni-cal Appendix 1 Table 2). We did not attribute illnesses to commodities for illnesses caused by astrovirus, Mycobac-terium bovis, Toxoplasma gondii, and Vibrio vulnificus because no outbreaks were reported for these pathogens. These pathogens caused an estimated 1.1% of illnesses, 8.1% of hospitalizations, and 25.2% of deaths (a high number of deaths were estimated to be caused by toxo-plasmosis [1]).
Food CategorizationWe defined 3 commodities for aquatic animals (fish,
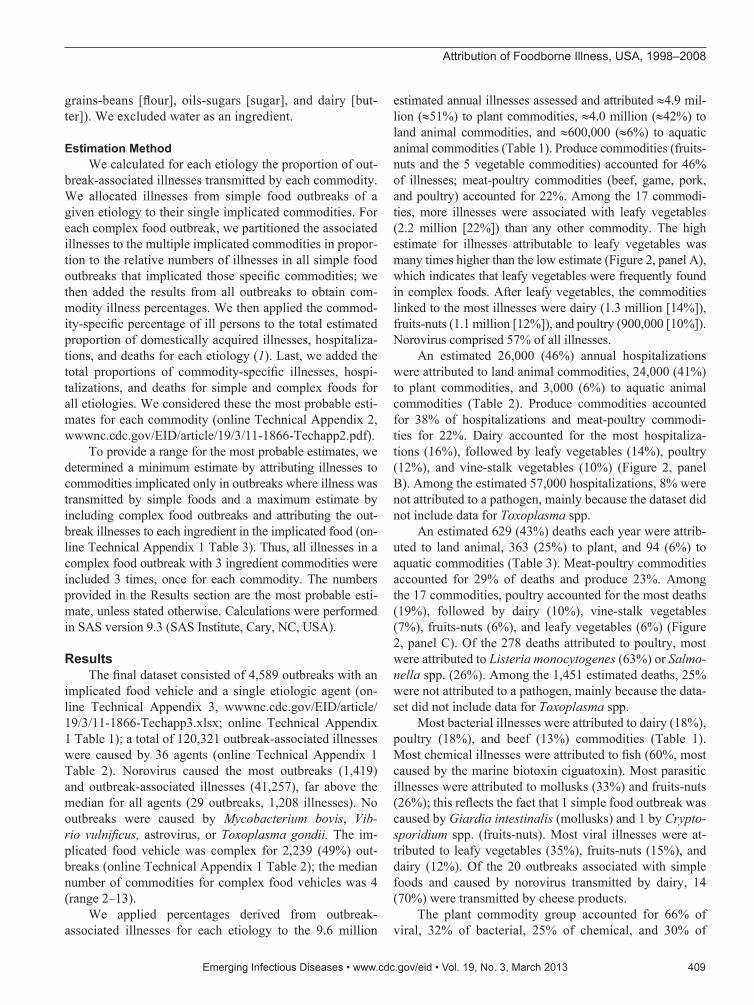
crustaceans, and mollusks), 6 for land animals (dairy, eggs, beef, game, pork, and poultry), and 8 for plants (grains-beans; oils-sugars [refined plant foods]; fruits-nuts; fungi; and leafy, root, sprout, and vine-stalk vegetables) (7). Foods were categorized into >1 of 17 mutually exclusive commodities according to ingredients listed in outbreak re-ports, or, when ingredients were not listed, in recipes found on the Internet (7). In some analyses, we grouped com-modities (Figure 1).
We defined as simple an implicated food vehicle that contained ingredients from 1 commodity, such as apple juice (fruits-nuts commodity). This category included foods such as fruit salad that were composed of several ingredients from the same commodity. We defined as complex an implicated food vehicle that contained ingre-dients from >1 commodity, such as apple pie (made of in-gredients from several commodities: fruits-nuts [apples],
408 Emerging Infectious Diseases • www.cdc.gov/eid • Vol. 19, No. 3, March 2013
Figure 1. Hierarchy of food commodities. Italics indicate commodity groups.
Attribution of Foodborne Illness, USA, 1998–2008
grains-beans [flour], oils-sugars [sugar], and dairy [but-ter]). We excluded water as an ingredient.
Estimation MethodWe calculated for each etiology the proportion of out-
break-associated illnesses transmitted by each commodity. We allocated illnesses from simple food outbreaks of a given etiology to their single implicated commodities. For each complex food outbreak, we partitioned the associated illnesses to the multiple implicated commodities in propor-tion to the relative numbers of illnesses in all simple food outbreaks that implicated those specific commodities; we then added the results from all outbreaks to obtain com-modity illness percentages. We then applied the commod-ity-specific percentage of ill persons to the total estimated proportion of domestically acquired illnesses, hospitaliza-tions, and deaths for each etiology (1). Last, we added the total proportions of commodity-specific illnesses, hospi-talizations, and deaths for simple and complex foods for all etiologies. We considered these the most probable esti-mates for each commodity (online Technical Appendix 2, wwwnc.cdc.gov/EID/article/19/3/11-1866-Techapp2.pdf).
To provide a range for the most probable estimates, we determined a minimum estimate by attributing illnesses to commodities implicated only in outbreaks where illness was transmitted by simple foods and a maximum estimate by including complex food outbreaks and attributing the out-break illnesses to each ingredient in the implicated food (on-line Technical Appendix 1 Table 3). Thus, all illnesses in a complex food outbreak with 3 ingredient commodities were included 3 times, once for each commodity. The numbers provided in the Results section are the most probable esti-mate, unless stated otherwise. Calculations were performed in SAS version 9.3 (SAS Institute, Cary, NC, USA).
ResultsThe final dataset consisted of 4,589 outbreaks with an
implicated food vehicle and a single etiologic agent (on-line Technical Appendix 3, wwwnc.cdc.gov/EID/article/ 19/3/11-1866-Techapp3.xlsx; online Technical Appendix 1 Table 1); a total of 120,321 outbreak-associated illnesses were caused by 36 agents (online Technical Appendix 1 Table 2). Norovirus caused the most outbreaks (1,419) and outbreak-associated illnesses (41,257), far above the median for all agents (29 outbreaks, 1,208 illnesses). No outbreaks were caused by Mycobacterium bovis, Vib-rio vulnificus, astrovirus, or Toxoplasma gondii. The im-plicated food vehicle was complex for 2,239 (49%) out-breaks (online Technical Appendix 1 Table 2); the median number of commodities for complex food vehicles was 4 (range 2–13).
We applied percentages derived from outbreak-associated illnesses for each etiology to the 9.6 million
estimated annual illnesses assessed and attributed ≈4.9 mil-lion (≈51%) to plant commodities, ≈4.0 million (≈42%) to land animal commodities, and ≈600,000 (≈6%) to aquatic animal commodities (Table 1). Produce commodities (fruits-nuts and the 5 vegetable commodities) accounted for 46% of illnesses; meat-poultry commodities (beef, game, pork, and poultry) accounted for 22%. Among the 17 commodi-ties, more illnesses were associated with leafy vegetables (2.2 million [22%]) than any other commodity. The high estimate for illnesses attributable to leafy vegetables was many times higher than the low estimate (Figure 2, panel A), which indicates that leafy vegetables were frequently found in complex foods. After leafy vegetables, the commodities linked to the most illnesses were dairy (1.3 million [14%]), fruits-nuts (1.1 million [12%]), and poultry (900,000 [10%]). Norovirus comprised 57% of all illnesses.
An estimated 26,000 (46%) annual hospitalizations were attributed to land animal commodities, 24,000 (41%) to plant commodities, and 3,000 (6%) to aquatic animal commodities (Table 2). Produce commodities accounted for 38% of hospitalizations and meat-poultry commodi-ties for 22%. Dairy accounted for the most hospitaliza-tions (16%), followed by leafy vegetables (14%), poultry (12%), and vine-stalk vegetables (10%) (Figure 2, panel B). Among the estimated 57,000 hospitalizations, 8% were not attributed to a pathogen, mainly because the dataset did not include data for Toxoplasma spp.
An estimated 629 (43%) deaths each year were attrib-uted to land animal, 363 (25%) to plant, and 94 (6%) to aquatic commodities (Table 3). Meat-poultry commodities accounted for 29% of deaths and produce 23%. Among the 17 commodities, poultry accounted for the most deaths (19%), followed by dairy (10%), vine-stalk vegetables (7%), fruits-nuts (6%), and leafy vegetables (6%) (Figure 2, panel C). Of the 278 deaths attributed to poultry, most were attributed to Listeria monocytogenes (63%) or Salmo-nella spp. (26%). Among the 1,451 estimated deaths, 25% were not attributed to a pathogen, mainly because the data-set did not include data for Toxoplasma spp.
Most bacterial illnesses were attributed to dairy (18%), poultry (18%), and beef (13%) commodities (Table 1). Most chemical illnesses were attributed to fish (60%, most caused by the marine biotoxin ciguatoxin). Most parasitic illnesses were attributed to mollusks (33%) and fruits-nuts (26%); this reflects the fact that 1 simple food outbreak was caused by Giardia intestinalis (mollusks) and 1 by Crypto-sporidium spp. (fruits-nuts). Most viral illnesses were at-tributed to leafy vegetables (35%), fruits-nuts (15%), and dairy (12%). Of the 20 outbreaks associated with simple foods and caused by norovirus transmitted by dairy, 14 (70%) were transmitted by cheese products.
The plant commodity group accounted for 66% of viral, 32% of bacterial, 25% of chemical, and 30% of
Emerging Infectious Diseases • www.cdc.gov/eid • Vol. 19, No. 3, March 2013 409
RESEARCH
parasitic illnesses (Table 1). This group accounted for a greater proportion of illnesses than the land or aquatic ani-mal commodity groups for Bacillus cereus; Clostridium botulinum; enterotoxigenic Escherichia coli; Shiga tox-in–producing Escherichia coli (STEC) O157; non-O157 STEC; Salmonella enterica serotypes Javiana, Newport, and other (e.g., serotypes other than Javiana, Newport, Enteritidis, Heidelberg, Typhimurium, and Typhi); Shi-gella spp.; mycotoxins; other chemicals; Cryptosporidi-um spp.; Cyclospora cayetansesis; hepatitis A; norovirus; and sapovirus (Table 4, Appendix, wwwnc.cdc.gov/EID/article/19/3/11-1866-T4.htm). The land animal group ac-counted for the highest proportion of illnesses for Cam-pylobacter spp., Clostridium perfringens, Listeria spp., Salmonella serotypes Enteritidis and Heidelberg, Strepto-coccus spp. group A, Yersinia enterocolitica, and Trichi-nella spp.
DiscussionWe developed a method to attribute domestically ac-
quired foodborne illnesses, hospitalizations, and deaths in the United States to specific commodities by using outbreak data. We found most illnesses were attributed to plant com-modities and most deaths to land animal commodities. We attributed 46% of illnesses to produce; the large number of
norovirus illnesses was a major driver of this result. More deaths were attributed to poultry than to any other com-modity. To the extent that these outbreak-based estimates reflect the commodities associated with all foodborne ill-ness, they indicate that efforts are particularly needed to prevent contamination of produce and poultry.
More illnesses were attributed to leafy vegetables (22%) than to any other commodity; illnesses associated with leafy vegetables were the second most frequent cause of hospitalizations (14%) and the fifth most frequent cause of death (6%). Previous studies have shown that produce-containing foods were the food source for approximately half of norovirus outbreaks with an identified simple food vehicle during 2001–2008 (8) and the second most frequent food source for E. coli O157 outbreaks during 1982–2002 (9). Outbreaks of E. coli O157 infections transmitted by spinach (10) and lettuce (11) and Salmonella spp. infec-tions transmitted by tomatoes (12,13), juice (14,15), man-goes (16), sprouts (17,18), and peppers (19,20) underline concerns about contamination of produce consumed raw.
More deaths were attributed to poultry (19%) than to any other commodity, and most poultry-associated deaths were caused by Listeria or Salmonella spp. From 1998 through 2002, three large listeriosis outbreaks were linked to turkey delicatessen meat contaminated in the processing
410 Emerging Infectious Diseases • www.cdc.gov/eid • Vol. 19, No. 3, March 2013
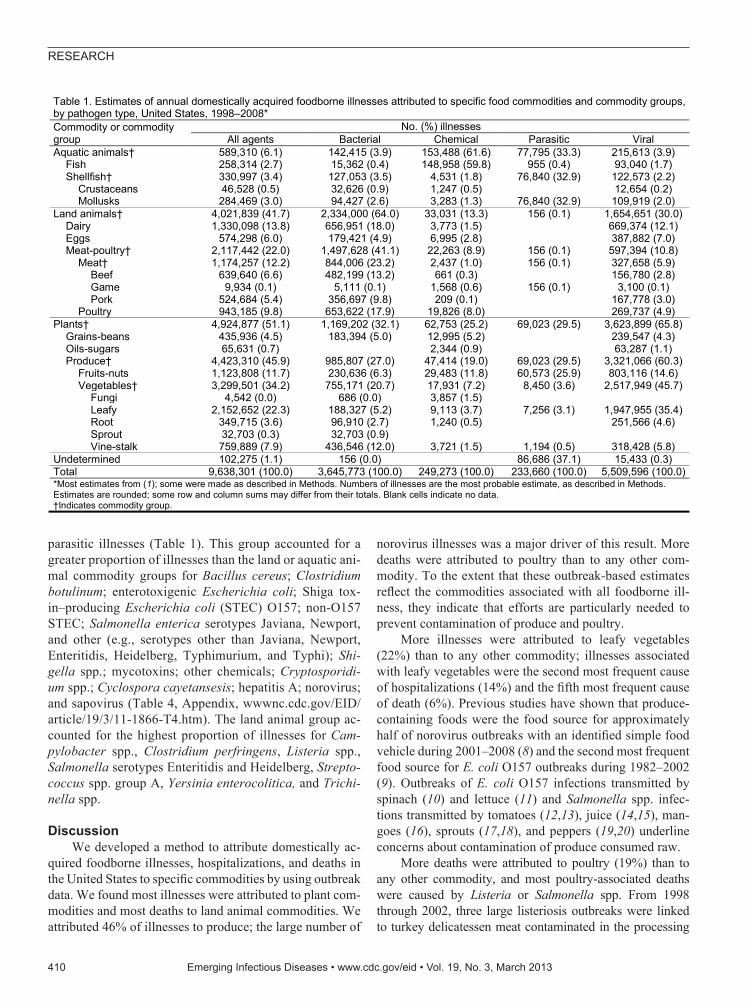
Table 1. Estimates of annual domestically acquired foodborne illnesses attributed to specific food commodities and commodity groups, by pathogen type, United States, 1998–2008* Commodity or commodity group
No. (%) illnesses All agents Bacterial Chemical Parasitic Viral
Aquatic animals† 589,310 (6.1) 142,415 (3.9) 153,488 (61.6) 77,795 (33.3) 215,613 (3.9) Fish 258,314 (2.7) 15,362 (0.4) 148,958 (59.8) 955 (0.4) 93,040 (1.7) Shellfish† 330,997 (3.4) 127,053 (3.5) 4,531 (1.8) 76,840 (32.9) 122,573 (2.2) Crustaceans 46,528 (0.5) 32,626 (0.9) 1,247 (0.5) 12,654 (0.2) Mollusks 284,469 (3.0) 94,427 (2.6) 3,283 (1.3) 76,840 (32.9) 109,919 (2.0) Land animals† 4,021,839 (41.7) 2,334,000 (64.0) 33,031 (13.3) 156 (0.1) 1,654,651 (30.0) Dairy 1,330,098 (13.8) 656,951 (18.0) 3,773 (1.5) 669,374 (12.1) Eggs 574,298 (6.0) 179,421 (4.9) 6,995 (2.8) 387,882 (7.0) Meat-poultry† 2,117,442 (22.0) 1,497,628 (41.1) 22,263 (8.9) 156 (0.1) 597,394 (10.8) Meat† 1,174,257 (12.2) 844,006 (23.2) 2,437 (1.0) 156 (0.1) 327,658 (5.9) Beef 639,640 (6.6) 482,199 (13.2) 661 (0.3) 156,780 (2.8) Game 9,934 (0.1) 5,111 (0.1) 1,568 (0.6) 156 (0.1) 3,100 (0.1) Pork 524,684 (5.4) 356,697 (9.8) 209 (0.1) 167,778 (3.0) Poultry 943,185 (9.8) 653,622 (17.9) 19,826 (8.0) 269,737 (4.9) Plants† 4,924,877 (51.1) 1,169,202 (32.1) 62,753 (25.2) 69,023 (29.5) 3,623,899 (65.8) Grains-beans 435,936 (4.5) 183,394 (5.0) 12,995 (5.2) 239,547 (4.3) Oils-sugars 65,631 (0.7) 2,344 (0.9) 63,287 (1.1) Produce† 4,423,310 (45.9) 985,807 (27.0) 47,414 (19.0) 69,023 (29.5) 3,321,066 (60.3) Fruits-nuts 1,123,808 (11.7) 230,636 (6.3) 29,483 (11.8) 60,573 (25.9) 803,116 (14.6) Vegetables† 3,299,501 (34.2) 755,171 (20.7) 17,931 (7.2) 8,450 (3.6) 2,517,949 (45.7) Fungi 4,542 (0.0) 686 (0.0) 3,857 (1.5) Leafy 2,152,652 (22.3) 188,327 (5.2) 9,113 (3.7) 7,256 (3.1) 1,947,955 (35.4) Root 349,715 (3.6) 96,910 (2.7) 1,240 (0.5) 251,566 (4.6) Sprout 32,703 (0.3) 32,703 (0.9) Vine-stalk 759,889 (7.9) 436,546 (12.0) 3,721 (1.5) 1,194 (0.5) 318,428 (5.8) Undetermined 102,275 (1.1) 156 (0.0) 86,686 (37.1) 15,433 (0.3) Total 9,638,301 (100.0) 3,645,773 (100.0) 249,273 (100.0) 233,660 (100.0) 5,509,596 (100.0) *Most estimates from (1); some were made as described in Methods. Numbers of illnesses are the most probable estimate, as described in Methods. Estimates are rounded; some row and column sums may differ from their totals. Blank cells indicate no data. †Indicates commodity group.
Attribution of Foodborne Illness, USA, 1998–2008
plant after cooking (21–23). A risk-ranking model for liste-riosis among ready-to-eat foods identified delicatessen meat as the highest risk food (24).
The dairy commodity was the second most frequent food source for infections causing illnesses (14%) and deaths (10%). Foods in this commodity are typically con-sumed after pasteurization, which eliminates pathogens, but improper pasteurization and incidents of contamination after pasteurization occur (25). In our dataset, norovirus outbreaks associated with cheese illustrate the role of con-tamination of dairy products after pasteurization by food handlers. Because of the large volume of dairy products consumed, even infrequent contamination of commercially distributed products can result in many illnesses (26). The prominence of dairy in our model reflects a relatively high number of reported outbreaks associated with raw milk compared with the quantity of raw milk consumed (27) and issues related to Campylobacter spp. infection (discussed below); these factors likely resulted in an overestimation of illnesses attributed to dairy. Models that partition raw ver-sus pasteurized milk and that incorporate other data sources for Campylobacter spp. infection could improve estimates of illnesses related to dairy.
Our method of attributing illnesses incorporated data from outbreaks associated with complex foods and attrib-uted most of the estimated number of illnesses caused by known pathogens to specific food sources. Other methods for attributing illnesses to food sources may be applied to
various stages of the food distribution chain and therefore may yield different but complementary estimates (2). A method for Salmonella spp. attribution used in Denmark compared isolates from food animal reservoirs with human isolates to attribute infections to the reservoirs, the live animals (28). A similar method in a US study attributed Salmonella spp.–associated foodborne illnesses to the point of processing (29). Risk assessment models have focused primarily on the point of processing; case studies of sporad-ic illness, expert elicitation, and analysis of outbreak data represent attribution at the point of consumption. Outbreak investigations have been reported for most foodborne eti-ologies and food commodities and provide the most com-prehensive data for attribution.
We made several assumptions. We assumed that us-ing the number of outbreak-associated illnesses rather than number of outbreaks would enable better assignment of illnesses to commodities. Our choice had the potential to bias the results toward large outbreaks. However, large outbreaks often represent system failures that have resulted in smaller, undetected outbreaks; investigation may deter-mine the source for illnesses that otherwise might have been considered sporadic. Small outbreaks may better represent sources of sporadic illnesses, but because many small out-breaks are not detected or investigated, their sources would not be well represented by any method. Similar studies have used outbreak counts (30,31); either choice (number of outbreak-associated illnesses or number of outbreaks)
Emerging Infectious Diseases • www.cdc.gov/eid • Vol. 19, No. 3, March 2013 411
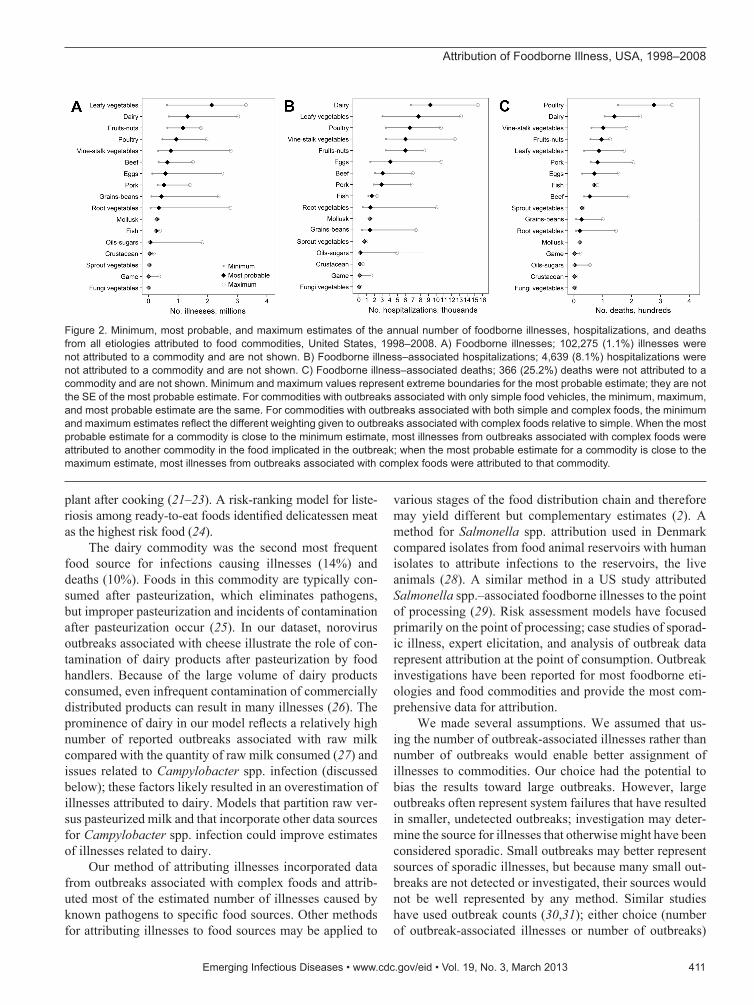
Figure 2. Minimum, most probable, and maximum estimates of the annual number of foodborne illnesses, hospitalizations, and deaths from all etiologies attributed to food commodities, United States, 1998–2008. A) Foodborne illnesses; 102,275 (1.1%) illnesses were not attributed to a commodity and are not shown. B) Foodborne illness–associated hospitalizations; 4,639 (8.1%) hospitalizations were not attributed to a commodity and are not shown. C) Foodborne illness–associated deaths; 366 (25.2%) deaths were not attributed to a commodity and are not shown. Minimum and maximum values represent extreme boundaries for the most probable estimate; they are not the SE of the most probable estimate. For commodities with outbreaks associated with only simple food vehicles, the minimum, maximum, and most probable estimate are the same. For commodities with outbreaks associated with both simple and complex foods, the minimum and maximum estimates reflect the different weighting given to outbreaks associated with complex foods relative to simple. When the most probable estimate for a commodity is close to the minimum estimate, most illnesses from outbreaks associated with complex foods were attributed to another commodity in the food implicated in the outbreak; when the most probable estimate for a commodity is close to the maximum estimate, most illnesses from outbreaks associated with complex foods were attributed to that commodity.
RESEARCH
results in biases (32). Because of other methodological dif-ferences, direct comparison of the results for these studies is difficult. To assess the effect of outbreak size on our esti-mates, we adjusted our model to give no weight to outbreak size (online Technical Appendix 1 Tables 4, 5); the rank order of commodities by number of attributed illnesses changed by no more than 1 for most commodities. The largest outbreak in our study was 1,644 Campylobacter spp.–associated illnesses resulting from the consumption of pasteurized milk; even so, counting outbreaks instead of illnesses resulted in a relatively small (2.6%) reduction in the percentage of illnesses attributed to dairy.
We further assumed outbreak illnesses represented all illnesses and weighted the results for each agent by number of all foodborne illnesses attributed to each agent (1). Un-weighted outbreak data may be biased toward seafood out-breaks caused by marine biotoxins (e.g., scombroid) that are frequently reported but cause relatively few illnesses. For some agents, foods implicated in outbreaks might not well represent foods responsible for sporadic illnesses. For example, outbreak data underrepresent poultry (8%) and overrepresent dairy (67%) as sources of Campylobacter spp. infection; studies of sporadic infections implicate consumption of poultry but not dairy as a major risk factor (33). Campylobacter spp. are estimated to be the third most
common bacterial cause of foodborne illness, but relatively few outbreaks are detected (1). For pathogens for which outbreaks are uncommon or do not reflect major modes of transmission, methods that incorporate data from nonout-break sources are needed.
We also assumed that, for a given agent, when an out-break was associated with a complex food, the likelihood that any commodity was the source was proportional to the frequency of illnesses for outbreaks associated with simple foods associated with that commodity. However, when the number of outbreaks associated with simple foods for an etiology is small compared with the number associated with complex foods, the result may be biased toward commodi-ties for which simple foods were vehicles for outbreaks. Other attribution estimates that used outbreak surveillance data have excluded complex foods or have not partitioned them into component commodities (9,34). Were complex food outbreaks excluded, the result for each commodity would be the same as our minimum estimate. However, inclusion of outbreaks associated with complex foods pro-vides important information. For example, in a review of egg-associated S. enterica serotype Enteritidis outbreaks (35), eggs were implicated as simple food vehicles in 20% of the outbreaks, but complex foods containing eggs were implicated in an additional 57% of the outbreaks.
412 Emerging Infectious Diseases • www.cdc.gov/eid • Vol. 19, No. 3, March 2013
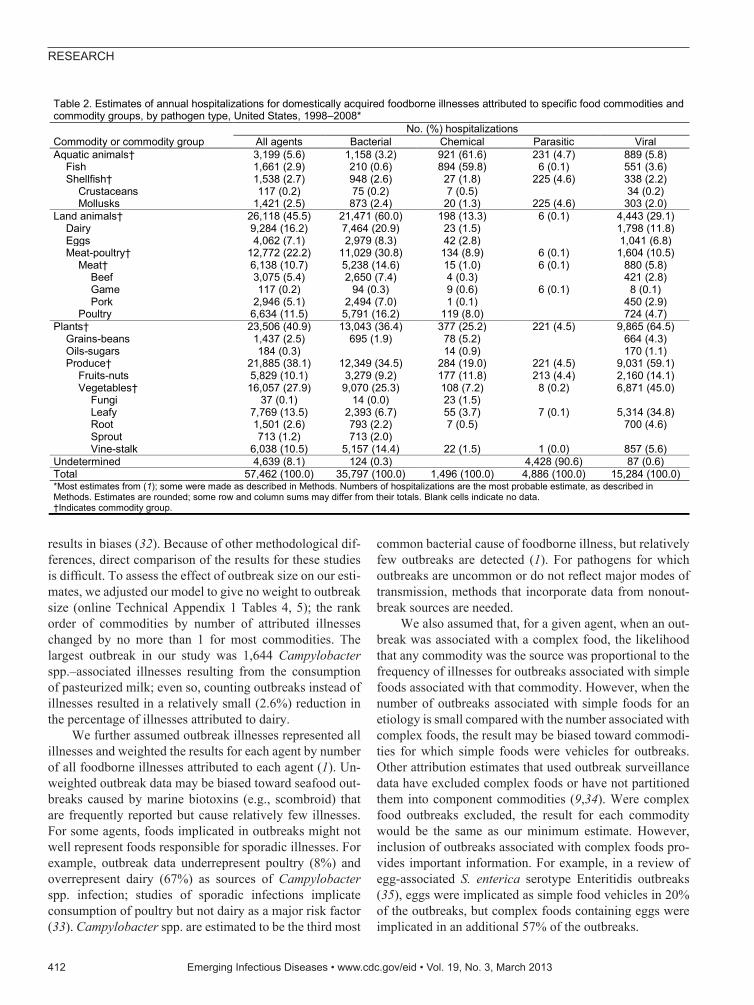
Table 2. Estimates of annual hospitalizations for domestically acquired foodborne illnesses attributed to specific food commodities and commodity groups, by pathogen type, United States, 1998–2008*
Commodity or commodity group No. (%) hospitalizations
All agents Bacterial Chemical Parasitic Viral Aquatic animals† 3,199 (5.6) 1,158 (3.2) 921 (61.6) 231 (4.7) 889 (5.8) Fish 1,661 (2.9) 210 (0.6) 894 (59.8) 6 (0.1) 551 (3.6) Shellfish† 1,538 (2.7) 948 (2.6) 27 (1.8) 225 (4.6) 338 (2.2) Crustaceans 117 (0.2) 75 (0.2) 7 (0.5) 34 (0.2) Mollusks 1,421 (2.5) 873 (2.4) 20 (1.3) 225 (4.6) 303 (2.0) Land animals† 26,118 (45.5) 21,471 (60.0) 198 (13.3) 6 (0.1) 4,443 (29.1) Dairy 9,284 (16.2) 7,464 (20.9) 23 (1.5) 1,798 (11.8) Eggs 4,062 (7.1) 2,979 (8.3) 42 (2.8) 1,041 (6.8) Meat-poultry† 12,772 (22.2) 11,029 (30.8) 134 (8.9) 6 (0.1) 1,604 (10.5) Meat† 6,138 (10.7) 5,238 (14.6) 15 (1.0) 6 (0.1) 880 (5.8) Beef 3,075 (5.4) 2,650 (7.4) 4 (0.3) 421 (2.8) Game 117 (0.2) 94 (0.3) 9 (0.6) 6 (0.1) 8 (0.1) Pork 2,946 (5.1) 2,494 (7.0) 1 (0.1) 450 (2.9) Poultry 6,634 (11.5) 5,791 (16.2) 119 (8.0) 724 (4.7) Plants† 23,506 (40.9) 13,043 (36.4) 377 (25.2) 221 (4.5) 9,865 (64.5) Grains-beans 1,437 (2.5) 695 (1.9) 78 (5.2) 664 (4.3) Oils-sugars 184 (0.3) 14 (0.9) 170 (1.1) Produce† 21,885 (38.1) 12,349 (34.5) 284 (19.0) 221 (4.5) 9,031 (59.1) Fruits-nuts 5,829 (10.1) 3,279 (9.2) 177 (11.8) 213 (4.4) 2,160 (14.1) Vegetables† 16,057 (27.9) 9,070 (25.3) 108 (7.2) 8 (0.2) 6,871 (45.0) Fungi 37 (0.1) 14 (0.0) 23 (1.5) Leafy 7,769 (13.5) 2,393 (6.7) 55 (3.7) 7 (0.1) 5,314 (34.8) Root 1,501 (2.6) 793 (2.2) 7 (0.5) 700 (4.6) Sprout 713 (1.2) 713 (2.0) Vine-stalk 6,038 (10.5) 5,157 (14.4) 22 (1.5) 1 (0.0) 857 (5.6) Undetermined 4,639 (8.1) 124 (0.3) 4,428 (90.6) 87 (0.6) Total 57,462 (100.0) 35,797 (100.0) 1,496 (100.0) 4,886 (100.0) 15,284 (100.0) *Most estimates from (1); some were made as described in Methods. Numbers of hospitalizations are the most probable estimate, as described in Methods. Estimates are rounded; some row and column sums may differ from their totals. Blank cells indicate no data. †Indicates commodity group.
Attribution of Foodborne Illness, USA, 1998–2008
A limitation of our study is the absence of outbreaks caused by some agents. None caused by Toxoplasma spp. or Vibrio vulnificus were reported. The attributable risk for Toxoplasma infection is highest for meat (49%) and mol-lusks (16%) (36); most foodborne V. vulnificus infections are linked to oysters (37). The effect of this absence of data for agents that are uncommon but often cause fatal illnesses is reflected mostly in the number of deaths in our study, 25% of which were not attributed. Attributing an additional 49% of Toxoplasma spp.–associated deaths to meats would make meats a more frequent source of foodborne illness–associated deaths than poultry. Attributing all foodborne deaths caused by V. vulnificus and 16% of those caused by Toxoplasma spp. to mollusks would move this commodity from the thirteenth to the fourth most frequent source of foodborne illness–associated deaths.
Other limitations of our study included the choice not to use the credible interval for the estimated number of illnesses, hospitalization, and deaths (1); the lack of published estimates for the number of illnesses caused by chemical etiologies; and the fact that the quality of out-break data is dependent on the quality and quantity of in-vestigations reported. We maximized the amount of data we compiled by including outbreaks with suspect etiolo-gies or vehicles and developing a method to incorporate
data from outbreaks attributed to both simple and complex foods; even so, our study yielded a paucity of data for some agents. Among the agents associated with <10 outbreaks in the dataset, only 1 (non-O157 STEC) is estimated to cause >1% of foodborne illnesses caused by known agents (1). Our estimates should be considered an approximation, to be refined by further research and analyses. To improve the quality and accuracy of outbreak attribution, models can be developed that include other types of data (e.g., studies of sporadic cases, isolates from foods and animals, agent subtypes). Measurements that indicate the substantial un-certainty of many of the estimates are particularly critical for agents causing few outbreaks and those for which the major sources for outbreaks are dissimilar to those for spo-radic cases. Ultimately, the best data sources and methods for estimating the number of illnesses, hospitalizations, and deaths attributable to each food commodity may vary by etiologic agent, commodity, point of food chain analyzed, and other factors.
For consistency and to obtain sufficient data, we chose to use all years of data for all pathogens, but a shorter, more recent period is desirable when major im-plicated commodities have changed. For example, out-breaks of Listeria spp. infection caused by contamina-tion of ready-to-eat meats markedly decreased after 2002
Emerging Infectious Diseases • www.cdc.gov/eid • Vol. 19, No. 3, March 2013 413
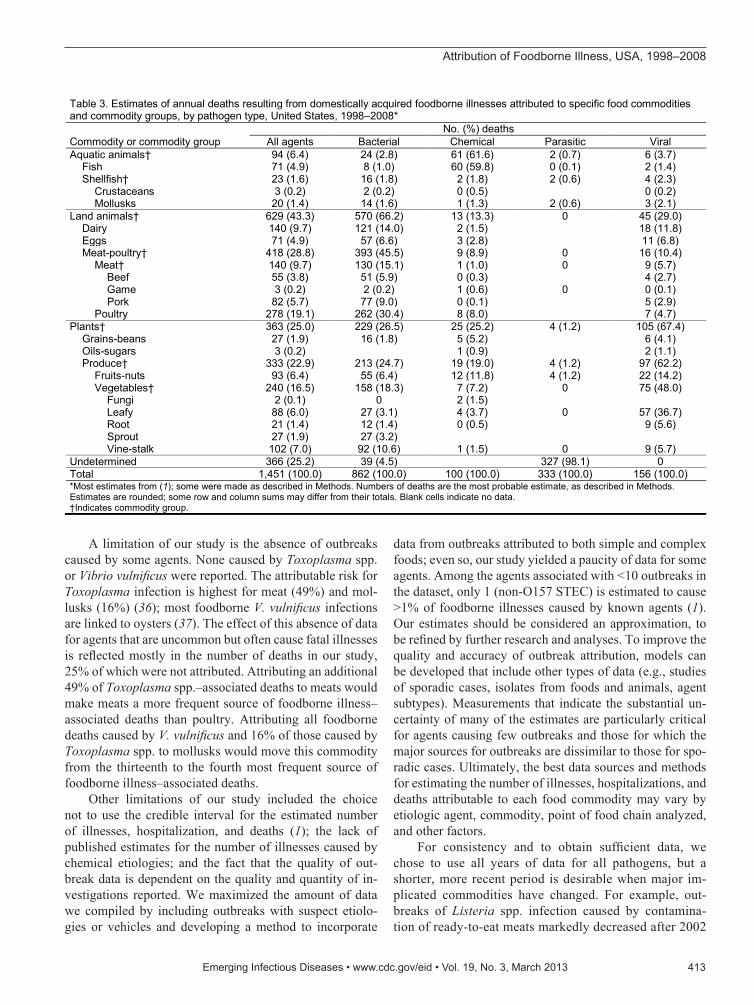
Table 3. Estimates of annual deaths resulting from domestically acquired foodborne illnesses attributed to specific food commodities and commodity groups, by pathogen type, United States, 1998–2008*
Commodity or commodity group No. (%) deaths
All agents Bacterial Chemical Parasitic Viral Aquatic animals† 94 (6.4) 24 (2.8) 61 (61.6) 2 (0.7) 6 (3.7) Fish 71 (4.9) 8 (1.0) 60 (59.8) 0 (0.1) 2 (1.4) Shellfish† 23 (1.6) 16 (1.8) 2 (1.8) 2 (0.6) 4 (2.3) Crustaceans 3 (0.2) 2 (0.2) 0 (0.5) 0 (0.2) Mollusks 20 (1.4) 14 (1.6) 1 (1.3) 2 (0.6) 3 (2.1) Land animals† 629 (43.3) 570 (66.2) 13 (13.3) 0 45 (29.0) Dairy 140 (9.7) 121 (14.0) 2 (1.5) 18 (11.8) Eggs 71 (4.9) 57 (6.6) 3 (2.8) 11 (6.8) Meat-poultry† 418 (28.8) 393 (45.5) 9 (8.9) 0 16 (10.4) Meat† 140 (9.7) 130 (15.1) 1 (1.0) 0 9 (5.7) Beef 55 (3.8) 51 (5.9) 0 (0.3) 4 (2.7) Game 3 (0.2) 2 (0.2) 1 (0.6) 0 0 (0.1) Pork 82 (5.7) 77 (9.0) 0 (0.1) 5 (2.9) Poultry 278 (19.1) 262 (30.4) 8 (8.0) 7 (4.7) Plants† 363 (25.0) 229 (26.5) 25 (25.2) 4 (1.2) 105 (67.4) Grains-beans 27 (1.9) 16 (1.8) 5 (5.2) 6 (4.1) Oils-sugars 3 (0.2) 1 (0.9) 2 (1.1) Produce† 333 (22.9) 213 (24.7) 19 (19.0) 4 (1.2) 97 (62.2) Fruits-nuts 93 (6.4) 55 (6.4) 12 (11.8) 4 (1.2) 22 (14.2) Vegetables† 240 (16.5) 158 (18.3) 7 (7.2) 0 75 (48.0) Fungi 2 (0.1) 0 2 (1.5) Leafy 88 (6.0) 27 (3.1) 4 (3.7) 0 57 (36.7) Root 21 (1.4) 12 (1.4) 0 (0.5) 9 (5.6) Sprout 27 (1.9) 27 (3.2) Vine-stalk 102 (7.0) 92 (10.6) 1 (1.5) 0 9 (5.7) Undetermined 366 (25.2) 39 (4.5) 327 (98.1) 0 Total 1,451 (100.0) 862 (100.0) 100 (100.0) 333 (100.0) 156 (100.0) *Most estimates from (1); some were made as described in Methods. Numbers of deaths are the most probable estimate, as described in Methods. Estimates are rounded; some row and column sums may differ from their totals. Blank cells indicate no data. †Indicates commodity group.
RESEARCH
(38). However, using data from only the few listeriosis outbreaks that occurred after 2002 would result in a few commodities having a large effect on results. Develop-ing methods to examine trends should be a high priority. When combined with updated estimates of the number of illnesses, attribution analyses performed at appropriate intervals could help determine the results of prevention efforts. Longer intervals would increase data for agents with few outbreaks, but if the frequency of illness attrib-uted to a commodity changes substantially, results might not reflect the current situation.
In summary, our outbreak-based method attributed most foodborne illnesses to food commodities that consti-tute a major portion of the US diet. When food commodi-ties are consumed frequently, even those with a low risk for pathogen transmission per serving may result in a high number of illnesses. The attribution of foodborne-associ-ated illnesses and deaths to specific commodities is useful for prioritizing public health activities; however, additional data on the specific food consumed is needed to assess per-serving risk. The risk for foodborne illness is just one part of the risk–benefit equation for foods; other factors, such as the health benefits of consuming a diet high in fruits and vegetables, must also be considered (39).
AcknowledgmentThis study was made possible through the efforts of state and
local health department officials who investigated and reported most foodborne outbreaks. In addition, we acknowledge Dana Cole for her assistance preparing the outbreak data set for analy-sis and Barbara Mahon for suggestions that improved the content and clarity.
Dr Painter is an epidemiologist with the Centers for Disease Control and Prevention who worked for the Division of Food-borne, Waterborne, and Environmental Diseases while most of the work for this study was completed. Currently, he is the epi-demiology team lead for the Immigrant, Refugee, and Migrant Health Branch of the Division of Global Migration and Quaran-tine. His research interests include outbreak investigations and the epidemiology of tuberculosis among foreign-born persons.
References
1. Scallan E, Hoekstra RM, Angulo FJ, Tauxe RV, Widdowson MA, Roy SL, et al. Foodborne illness acquired in the United States—ma-jor pathogens. Emerg Infect Dis. 2011;17:7–15.
2. Batz MB, Doyle MP, Morris G Jr, Painter J, Singh R, Tauxe RV, et al. Attributing illness to food. Emerg Infect Dis. 2005;11:993–9. http://dx.doi.org/10.3201/eid1107.040634
3. Centers for Disease Control and Prevention. Outbreak surveillance data. 2010 [cited 2012 Jun 22]. http://www.cdc.gov/outbreaknet/ surveillance_data.html
4. Lynch M, Painter J, Woodruff R, Braden C. Surveillance for food-borne-disease outbreaks—United States, 1998–2002. MMWR Surveill Summ. 2006;55:1–42.
5. Olsen SJ, MacKinnon LC, Goulding JS, Bean NH, Slutsker L. Sur-veillance for foodborne-disease outbreaks—United States, 1993–1997. MMWR CDC Surveill Summ. 2000;49:1–62.
6. Centers for Disease Control and Prevention. Salmonella surveil-lance: annual summary. 2008 [cited 2012 Jun 22]. http://www.cdc.gov/ncidod/dbmd/phlisdata/salmonella.htm
7. Painter JA, Ayers T, Woodruff R, Blanton E, Perez N, Hoekstra RM, et al. Recipes for foodborne outbreaks: a scheme for categorizing and grouping implicated foods. Foodborne Pathog Dis. 2009;6:1259–64. http://dx.doi.org/10.1089/fpd.2009.0350
8. Hall AJ, Eisenbart VG, Etingue AL, Gould LH, Lopman BA, Para-shar UD. Epidemiology of foodborne norovirus outbreaks, United States, 2001–2008. Emerg Infect Dis. 2012;18:1566–73. http://dx.doi.org/10.3201/eid1810.120833
9. Rangel JM, Sparling PH, Crowe C, Griffin PM, Swerdlow DL. Epidemiology of Escherichia coli O157:H7 outbreaks, United States, 1982–2002. Emerg Infect Dis. 2005;11:603–9. http://dx.doi.org/10.3201/eid1104.040739
10. Centers for Disease Control and Prevention. Ongoing multistate out-break of Escherichia coli serotype O157:H7 infections associated with consumption of fresh spinach—United States, September 2006. MMWR Morb Mortal Wkly Rep. 2006;55:1045–6.
11. Hilborn ED, Mermin JH, Mshar PA, Hadler JL, Voetsch A, Wojt-kunski C, et al. A multistate outbreak of Escherichia coli O157:H7 infections associated with consumption of mesclun lettuce. Arch Intern Med. 1999;159:1758–64. http://dx.doi.org/10.1001/archinte.159.15.1758
12. Centers for Disease Control and Prevention. Multistate outbreaks of Salmonella infections associated with raw tomatoes eaten in restau-rants—United States, 2005–2006. MMWR Morb Mortal Wkly Rep. 2007;56:909–11.
13. Greene SK, Daly ER, Talbot EA, Demma LJ, Holzbauer S, Pa-tel NJ, et al. Recurrent multistate outbreak of Salmonella New-port associated with tomatoes from contaminated fields, 2005. Epidemiol Infect. 2008;136:157–65. http://dx.doi.org/10.1017/S095026880700859X
14. Jain S, Bidol SA, Austin JL, Berl E, Elson F, Lemaile-Williams M, et al. Multistate outbreak of Salmonella Typhimurium and Saint-paul infections associated with unpasteurized orange juice—Unit-ed States, 2005. Clin Infect Dis. 2009;48:1065–71. http://dx.doi.org/10.1086/597397
15. Vojdani JD, Beuchat LR, Tauxe RV. Juice-associated outbreaks of human illness in the United States, 1995 through 2005. J Food Prot. 2008;71:356–64.
16. Sivapalasingam S, Barrett E, Kimura A, Van Duyne S, De Witt W, Ying M, et al. A multistate outbreak of Salmonella enterica Serotype Newport infection linked to mango consumption: impact of water-dip disinfestation technology. Clin Infect Dis. 2003;37:1585–90. http://dx.doi.org/10.1086/379710
17. Brooks JT, Rowe SY, Shillam P, Heltzel DM, Hunter SB, Slutsker L, et al. Salmonella Typhimurium infections transmitted by chlorine-pretreated clover sprout seeds. Am J Epidemiol. 2001;154:1020–8. http://dx.doi.org/10.1093/aje/154.11.1020
18. Winthrop KL, Palumbo MS, Farrar JA, Mohle-Boetani JC, Abbott S, Beatty ME, et al. Alfalfa sprouts and Salmonella Kottbus infection: a multistate outbreak following inadequate seed disinfection with heat and chlorine. J Food Prot. 2003;66:13–7.
19. Barton Behravesh C, Mody RK, Jungk J, Gaul L, Redd JT, Chen S, et al. 2008 outbreak of Salmonella Saintpaul infections associated with raw produce. N Engl J Med. 2011;364:918–27. http://dx.doi.org/10.1056/NEJMoa1005741
20. Mody RK, Greene SA, Gaul L, Sever A, Pichette S, Zambrana I, et al. National outbreak of Salmonella serotype Saintpaul infections: importance of Texas restaurant investigations in implicating jalape-no peppers. PLoS ONE. 2011;6:e16579. http://dx.doi.org/10.1371/journal.pone.0016579
414 Emerging Infectious Diseases • www.cdc.gov/eid • Vol. 19, No. 3, March 2013
Attribution of Foodborne Illness, USA, 1998–2008
21. Gottlieb SL, Newbern EC, Griffin PM, Graves LM, Hoekstra RM, Baker NL, et al. Multistate outbreak of listeriosis linked to turkey deli meat and subsequent changes in US regulatory policy. Clin In-fect Dis. 2006;42:29–36. http://dx.doi.org/10.1086/498113
22. Mead PS, Dunne F, Graves L, Wiedmann M, Patrick M, Hunter S, et al. Nationwide outbreak of listeriosis due to contaminated meat. Epidemiol Infect. 2006;134:744–51. http://dx.doi.org/10.1017/S0950268805005376
23. Olsen SJ, Patrick M, Hunter SB, Reddy V, Kornstein L, MacKenzie WR, et al. Multistate outbreak of Listeria monocytogenes infection linked to delicatessen turkey meat. Clin Infect Dis. 2005;40:962–7. http://dx.doi.org/10.1086/428575
24. Food and Drug Administration. Quantitative assessment of rela-tive risk to public health from foodborne Listeria monocytogenes among selected categories of ready-to-eat foods. 2003 Sep [cited 2012 Dec 20]. http://www.fda.gov/downloads/food/scienceresearch/researchareas/riskassessmentsafetyassessment/ucm197330.pdf
25. Olsen SJ, Ying M, Davis MF, Deasy M, Holland B, Iampietro L, et al. Multidrug-resistant Salmonella Typhimurium infection from milk contaminated after pasteurization. Emerg Infect Dis. 2004;10:932–5. http://dx.doi.org/10.3201/eid1005.030484
26. Ryan CA, Nickels MK, Hargrett-Bean NT, Potter ME, Endo T, Mayer L, et al. Massive outbreak of antimicrobial-resistant sal-monellosis traced to pasteurized milk. JAMA. 1987;258:3269–74. http://dx.doi.org/10.1001/jama.1987.03400220069039
27. Langer AJ, Ayers T, Grass J, Lynch M, Angulo FJ, Mahon BE. Non-pasteurized dairy products, disease outbreaks, and state laws-Unit-ed States, 1993–2006. Emerg Infect Dis. 2012;18:385–91. http://dx.doi.org/10.3201/eid1803.111370
28. Hald T, Vose D, Wegener HC, Koupeev T. A Bayesian approach to quantify the contribution of animal-food sources to human sal-monellosis. Risk Anal. 2004;24:255–69. http://dx.doi.org/10.1111/j.0272-4332.2004.00427.x
29. Guo C, Hoekstra RM, Schroeder CM, Pires SM, Ong KL, Hartnett E, et al. Application of Bayesian techniques to model the burden of human salmonellosis attributable to U.S. Food commodities at the point of processing: adaptation of a Danish model. Foodborne Pat-hog Dis. 2011;8:509–16. http://dx.doi.org/10.1089/fpd.2010.0714
30. Batz MB, Hoffmann S, Morris JG. Ranking the disease burden of 14 pathogens in food sources in the United States using attribution data from outbreak investigations and expert elicitation. J Food Prot. 2012;75:1278–91. http://dx.doi.org/10.4315/0362-028X.JFP-11-418
31. Dewall CS, Hicks G, Barlow K, Alderton L, Vegosen L. Foods as-sociated with foodborne illness outbreaks from 1990 through 2003. Food Prot Trends. 2006;26:466–73.
32. Pires SM, Vieira AR, Perez E, Lo Fo Wong D, Hald T. Attributing human foodborne illness to food sources and water in Latin Amer-ica and the Caribbean using data from outbreak investigations. Int J Food Microbiol. 2012;152:129–38. http://dx.doi.org/10.1016/j. ijfoodmicro.2011.04.018
33. Friedman CR, Hoekstra RM, Samuel M, Marcus R, Bender J, Shif-eraw B, et al. Risk factors for sporadic Campylobacter infection in the United States: a case-control study in FoodNet sites. Clin Infect Dis. 2004;38(Suppl 3):S285–96. http://dx.doi.org/10.1086/381598
34. Adak GK, Meakins SM, Yip H, Lopman BA, O’Brien SJ. Disease risks from foods, England and Wales, 1996–2000. Emerg Infect Dis. 2005;11:365–72.
35. St Louis ME, Morse DL, Potter ME, DeMelfi TM, Guzewich JJ, Tauxe RV, et al. The emergence of grade A eggs as a major source of Salmonella Enteritidis infections. New implications for the control of salmonellosis. JAMA. 1988;259:2103–7. http://dx.doi.org/10.1001/jama.259.14.2103
36. Jones JL, Dargelas V, Roberts J, Press C, Remington JS, Montoya JG. Risk factors for Toxoplasma gondii infection in the United States. Clin Infect Dis. 2009;49:878–84. http://dx.doi.org/10.1086/605433
37. Altekruse SF, Bishop RD, Baldy LM, Thompson SG, Wilson SA, Ray BJ, et al. Vibrio gastroenteritis in the US Gulf of Mexico region: the role of raw oysters. Epidemiol Infect. 2000;124:489–95. http://dx.doi.org/10.1017/S0950268899003714
38. Cartwright EJ, Jackson KA, Johnson SD, Graves LM, Silk BJ, Ma-hon BE. Listeriosis outbreaks and associated food vehicles, United States, 1998–2008. Emerg Infect Dis. 2013;19:1–9 http://dx.doi.org/10.3201/eid1901.120393.
39. US Department of Agriculture; US Department of Health and Hu-man Services. Dietary guidelines for Americans, 2010. 7th ed. 2010 Dec [cited 2012 Dec 20]. http://www.health.gov/dietaryguidelines/dga2010/dietaryguidelines2010.pdf
Address for correspondence: John A. Painter, Centers for Disease Control and Prevention, 1600 Clifton Rd NE, Mailstop E03, Atlanta, GA 30333, USA; email: [email protected]
Emerging Infectious Diseases • www.cdc.gov/eid • Vol. 19, No. 3, March 2013 415
The Public Health Image Library (PHIL)
The Public Health Image Library (PHIL), Centers for Disease Control and Prevention, contains thousands of public health-related images, including high-resolution (print quality) photographs, illustrations, and videos.
PHIL collections illustrate current events and articles, supply visual content for health promotion brochures, document the effects of disease, and enhance instructional media.
PHIL Images, accessible to PC and Macintosh users, are in the public domain and available without charge.
Visit PHIL at http://phil.cdc.gov/phil.