Embed Size (px)
Citation preview
13th World Conference on Earthquake Engineering
Vancouver, B.C., Canada August 1-6, 2004
Paper No. 1271
ATTENUATION MODELS FOR RESPONSE SPECTRA DERIVED FROM JAPANESE STRONG-MOTION RECORDS ACCOUNTING FOR
TECTONIC SOURCE TYPES
Toshimasa Takahashi1, Akihiro Asano1, Taketoshi Saiki2, Hidenobu Okada1, Kojiro Irikura3, John X. Zhao4, Jian Zhang4, Hong K. Thio5,
Paul G. Somerville5, Yasuhiro Fukushima6 and Yoshimitsu Fukushima7
SUMMARY A spectral acceleration attenuation model for Japan is presented. It accounts for effects of tectonic source type and the faulting mechanisms for crustal earthquakes. Site class terms, instead of individual site correction terms, are used based on a recent study on site classification for strong motion recording stations in Japan. By using site class terms, source type effects are identified. For crustal and interface earthquakes, a simple form of attenuation model is able to capture the main strong motion characteristics and achieve unbiased estimates. For subduction slab events, a simple distance modification factor is employed to achieve plausible and unbiased prediction. Effects of source depth, tectonic source type, and faulting mechanisms for crustal earthquakes are significant. INTRODUCTION Many attenuation relations for strong ground motion have been developed as an important component of seismic hazard studies. In a deterministic manner engineers also use attenuation models to estimate the forces and/or displacements induced in engineering structures. In a probabilistic seismic hazard analysis, both the mean values and the prediction uncertainties of an attenuation model are utilised. The amplitude of model prediction uncertainties can have a similar impact as the level of mean prediction to the ground motion estimates. High model prediction uncertainties lead to high levels of probabilistic ground motion estimates.
1 Shikoku Electric Power Co. Inc., Takamatsu, Japan 2 Yonden Consultants Co.,Inc., Kagawa, Japan 3 DPRI, Kyoto University, Kyoto, Japan 4 Institute of Geological & Nuclear Sciences, Lower Hutt, New Zealand, Email: [email protected] 5 URS Corporation, Pasadena, CA 91101-2560, USA 6 Japan Engineering Consultants CO.,LTD., Tokyo, Japan 7 Ohsaki Research Institute Co., Inc., Japan

Japan is located at a plate boundary and, therefore, has a complicated geological and tectonic setting. In the data set of 249 Japanese earthquakes with moment magnitude greater than 5.0 that we compiled, 25% are crustal events, 35% are subduction interface events and the rest are subduction slab events. Because the path from fault rupture of these earthquakes to the ground surface varies from one type of earthquakes to another, the ground motions generated by different types of earthquakes are expected to be different even if the events have identical magnitudes and source distances. Such source type effects have been recognized by a number of researchers in Japan and overseas. Attenuation models developed for subduction events by overseas researchers, using a data set containing a relatively large number of records from Japanese earthquakes, show clearly different attenuation behaviour from the models developed for shallow crustal earthquakes. In the past, attenuation models developed for Japanese earthquakes have not usually accounted for tectonic source type, though different attenuation characteristics between interface and slab events were widely recognized. The site conditions at a recording station have a very strong influence on ground motions induced by earthquakes, and a significant amount of effort on collecting geotechnical information for recording stations has been made in both Japan and overseas. The collection of geotechnical information for recording stations is difficult and expensive. Before the K-net strong-motion network was in operation, only a handful of recording stations, all operated by Port and Harbour Research Institute, had measured shear-wave velocity profiles. For the K-net stations shear-wave velocities were measured only down to 20m depth which is unlikely to have been deep enough to reach very stiff soils or bedrock for many stations. Researchers in Japan have attempted to overcome this difficulty by assigning individual site terms for each recording station (Molas & Yamazaki [1], Kobayashi et al [2] and Takahashi et al [3]). A possible drawback to this approach is that model prediction error and some of the source effects may propagate into individual site terms. With reasonably reliable site classifications assigned by Zhao el al [4], we are able to evaluate the effects of tectonic source types and faulting mechanisms for crustal earthquakes.
STRONG-MOTION DATA SET
The magnitude and source distance (defined in Equations 1 and 2 in the next section) distribution for earthquakes with focal depths of up to 162 km is shown in Figure 1(a) for the Japanese strong-motion data set, and Figure 1(b) for the overseas data sets. In order to eliminate the bias that could be introduced by untriggered instruments, these data were truncated at distances larger than a specified value for a given magnitude (see Figure 1(a)). For subduction slab events, the maximum source distance was set to 300km. There are only a small number of records within 30km source distance in the Japanese data set, and all near source data within 10km are from the 1995 Kobe earthquake and Tottori 2000 earthquake. The overseas data from the western part of the USA and the Tabas Iran 1978 earthquake provide a small but valuable amount of additional data within 40km source distance and these records were used primarily to constrain the near-source behaviour of the model. Magnitude and focal depth distributions for the Japanese data are shown in Figure 1(c) for crustal and subduction earthquakes. There is a reasonably good distribution of data for all magnitude and focal depth ranges and the records from deep slab events provide good constraint to the depth term of the attenuation model. The maximum depth for crustal earthquakes was set to 25km. Figure 1(d) shows a strong correlation between focal depth and source distance, because focal depth contributes to the distance, especially for slab events. We found that the epicentral latitudes and longitudes and focal depths determined by JMA were not consistent with those determined by other seismological organizations, and so the relocated ISC locations and depths were used in the present study. The moment magnitudes are from the Harvard catalogue unless moment magnitude from a special study is available.

Tables 1, 2 and 3 show the break down of event and record numbers by source type, focal mechanism, regional and site class categories. Among the total of 249 Japanese events, 61 are crustal events, 87 are interface and 101 are slab events. For crustal events, many published attenuation models show that events with reverse-faulting mechanisms produce higher ground motions than strike-slip events. The number of records from reverse-fault events is large enough for the present study to account for the possible difference in the ground motions from reverse and strike-slip events (see Table 2). The very small number of records from crustal events with normal faulting mechanisms does not warrant the normal-fault events being considered as a separate group. Table 1 Numbers of earthquakes, by faulting mechanism, source type, and region
Japan Focal mechanism Crustal Interface Slab Total for each focal mech.
Reverse 18 87 44 149 Strike-slip 39 33 72 Normal 4 22 26 Unknown 2 2 Total for each source type 61 87 101 249
Iran and Western USA Reverse 10 1 11 Strike-slip 10 10 Total for each source type 20 1 0 21
Total for each source type from all regions Grand total 81 88 101 270 Table 2 Numbers of records by source type, faulting mechanism, and region
Japan Focal mechanism Crustal Interface Slab Total for each focal mech. Reverse 250 1176 408 1834 Strike-slip 1027 574 1601 Normal 24 725 749 Unknown 8 8 Total for each source type 1301 1176 1715 4192
Iran and Western USA Reverse 123 12 135 Strike-slip 73 73 Total for each source type 196 12 208
Total for each source type from all regions Grand total 1497 1188 1715 4400 The data from the western part of the USA are all from crustal earthquakes (except for a 1992-04-25 event that was identified as interface event) with focal depths less than 20km. Among 20 overseas crustal earthquakes, 10 events have reverse-faulting mechanism, and 10 have strike-slip faulting mechanism. Of the total of 196 near-source records from crustal earthquakes, 123 records are from reverse-faulting events and 73 records are from strike-slip events. For the overseas interface event, 12 near-source records were used.
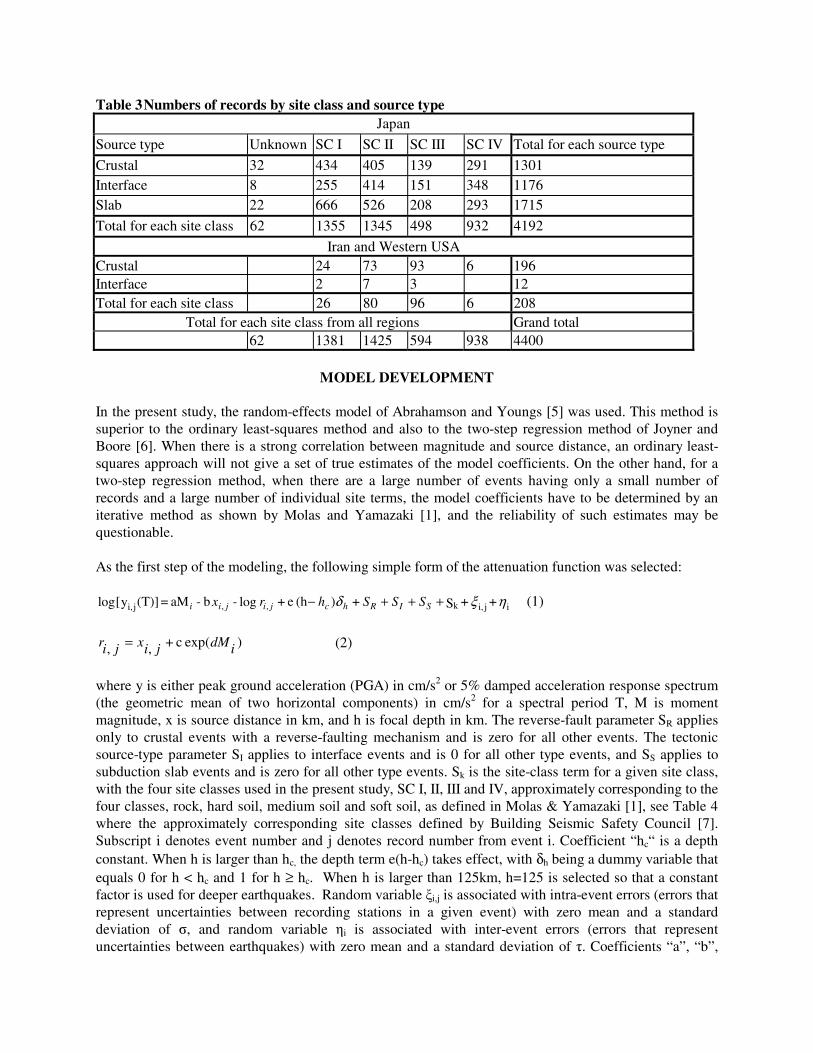
Table 3 Numbers of records by site class and source type Japan
Source type Unknown SC I SC II SC III SC IV Total for each source type
Crustal 32 434 405 139 291 1301 Interface 8 255 414 151 348 1176 Slab 22 666 526 208 293 1715
Total for each site class 62 1355 1345 498 932 4192
Iran and Western USA Crustal 24 73 93 6 196 Interface 2 7 3 12 Total for each site class 26 80 96 6 208
Total for each site class from all regions Grand total 62 1381 1425 594 938 4400
MODEL DEVELOPMENT In the present study, the random-effects model of Abrahamson and Youngs [5] was used. This method is superior to the ordinary least-squares method and also to the two-step regression method of Joyner and Boore [6]. When there is a strong correlation between magnitude and source distance, an ordinary least-squares approach will not give a set of true estimates of the model coefficients. On the other hand, for a two-step regression method, when there are a large number of events having only a small number of records and a large number of individual site terms, the model coefficients have to be determined by an iterative method as shown by Molas and Yamazaki [1], and the reliability of such estimates may be questionable. As the first step of the modeling, the following simple form of the attenuation function was selected:
ηξδ iji,k,,ji, + + S + )(h e + log -b - aM = (T)]y[log +++− SIRhcjijii SSShrx (1)
)exp( c +,, idMjixjir = (2)
where y is either peak ground acceleration (PGA) in cm/s2 or 5% damped acceleration response spectrum (the geometric mean of two horizontal components) in cm/s2 for a spectral period T, M is moment magnitude, x is source distance in km, and h is focal depth in km. The reverse-fault parameter SR applies only to crustal events with a reverse-faulting mechanism and is zero for all other events. The tectonic source-type parameter SI applies to interface events and is 0 for all other type events, and SS applies to subduction slab events and is zero for all other type events. Sk is the site-class term for a given site class, with the four site classes used in the present study, SC I, II, III and IV, approximately corresponding to the four classes, rock, hard soil, medium soil and soft soil, as defined in Molas & Yamazaki [1], see Table 4 where the approximately corresponding site classes defined by Building Seismic Safety Council [7]. Subscript i denotes event number and j denotes record number from event i. Coefficient “hc“ is a depth constant. When h is larger than hc, the depth term e(h-hc) takes effect, with δh being a dummy variable that equals 0 for h < hc and 1 for h ≥ hc. When h is larger than 125km, h=125 is selected so that a constant factor is used for deeper earthquakes. Random variable ξi,j is associated with intra-event errors (errors that represent uncertainties between recording stations in a given event) with zero mean and a standard deviation of σ, and random variable ηi is associated with inter-event errors (errors that represent uncertainties between earthquakes) with zero mean and a standard deviation of τ. Coefficients “a”, “b”,

“c”, “d” and “e”, site class term Sk, reverse-fault term SR and source-type terms SI and SS are determined by regression analysis for each period. Source distance x is the shortest distance to the rupture zone for earthquakes with available fault models, and hypocentral distance for the other events. Table 4 Site class definitions used in the present study and the approximately
corresponding NEHRP site classes (BSSC 2000) [7] Site class Description Natural period V30 calculated from
site period NEHRP site classes
SC I Rock T < 0.2s V30 > 600 A+B
SC II Hard soil 0.2 = T < 0.4s 300 < V30 = 600 C
SC III Medium soil 0.4 = T < 0.6s 200 < V30 = 300 D
SC IV Soft soil T = 0.6s V30 = 200 E+F
The coefficients of the simple model in Equation (1) were derived from the data set and extensive residuals analysis was then carried out. The results of analysis suggested that the simple model in Equation (1) predicts reasonably unbiased spectral accelerations for crustal and interface events, but the residuals for slab events were biased with respect to source distance for all spectral periods. For slab events, the spectral accelerations at a distance range of 40-125km were under-predicted, and were over-predicted at distances between150-250 km. The biased residuals can be corrected by using a number of methods. For example, if a separate anelastic term is allowed for the slab events, the bias could be nearly completely corrected. However, this method will lead to larger anelastic attenuation rates for subduction events than for crustal and interface events, in contrary to the common understanding that Q values tend to be high in subduction zones. As there are no records from slab events in the distance range of 0-40km in our data set, near-source parameters (“c”, “d” and the relationship between parameter “a” and “b”) have to be assumed in order to derive a separate model for slab events. Instead of subjectively selecting coefficients for near-source terms of a separate model for slab events, the magnitude scaling is assumed to be the same for all three types of earthquakes, since this assumption works well for crustal and subduction interface events, and a magnitude independent path modification factor SF is proposed to compensate for the complex seismic wave travel path for slab events. The modification factor takes the following form,
)]log()([log)log( 22caSL RRxSSF −
+= (3)
where Ra and Rc are distance constants. Note that Rc is not independent as SSLlog(Rc) and SS in Equation (1) can be combined together as one term. The function of Ra is to provide a saturated scale factor at short distance, and the largest value that does not increase the fitting of overall model to the data was selected. Ra = 90.0 and Rc=125.0 were selected for all periods. This modification factor provided a convenient way to eliminate the biased residuals. The residuals analysis also suggested that a magnitude dependent modification factor could be used with some improvement of model prediction. The total standard error of the model prediction is defined by
22T τσ=σ + (4)
with σ and τ as defined above. Both intra- and inter-event errors σ and τ are period dependent, but are assumed independent of magnitude. Because the number of near-source records is still small, as shown in Figure 1, the coupling between the estimates for coefficients “c” and “d” is strong, and the errors associated with both coefficients are so large that statistically reliable estimates are not possible. A simple approach was used in the present study. First simultaneous estimates for these two parameters were obtained by a nonlinear regression method developed in the previous studies (Kobayashi et al [2]). The estimate of coefficient “c” was then used as a
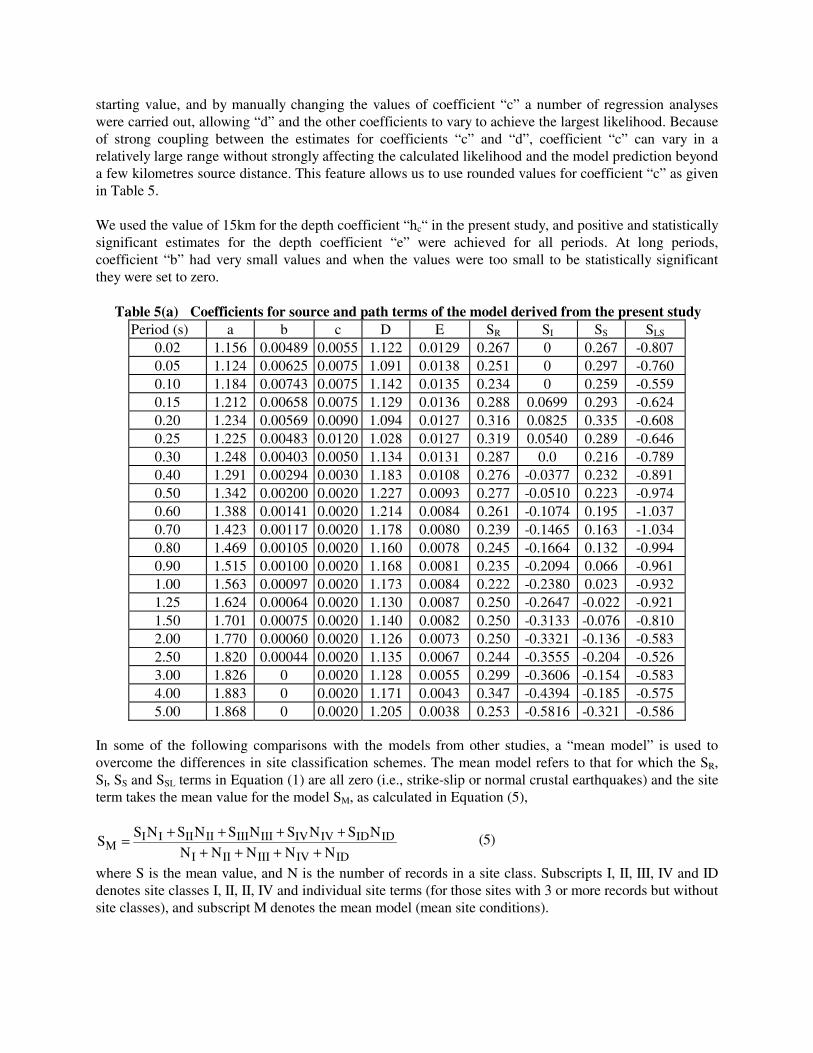
starting value, and by manually changing the values of coefficient “c” a number of regression analyses were carried out, allowing “d” and the other coefficients to vary to achieve the largest likelihood. Because of strong coupling between the estimates for coefficients “c” and “d”, coefficient “c” can vary in a relatively large range without strongly affecting the calculated likelihood and the model prediction beyond a few kilometres source distance. This feature allows us to use rounded values for coefficient “c” as given in Table 5. We used the value of 15km for the depth coefficient “hc“ in the present study, and positive and statistically significant estimates for the depth coefficient “e” were achieved for all periods. At long periods, coefficient “b” had very small values and when the values were too small to be statistically significant they were set to zero.
Table 5(a) Coefficients for source and path terms of the model derived from the present study Period (s) a b c D E SR SI SS SLS
0.02 1.156 0.00489 0.0055 1.122 0.0129 0.267 0 0.267 -0.807 0.05 1.124 0.00625 0.0075 1.091 0.0138 0.251 0 0.297 -0.760 0.10 1.184 0.00743 0.0075 1.142 0.0135 0.234 0 0.259 -0.559 0.15 1.212 0.00658 0.0075 1.129 0.0136 0.288 0.0699 0.293 -0.624 0.20 1.234 0.00569 0.0090 1.094 0.0127 0.316 0.0825 0.335 -0.608 0.25 1.225 0.00483 0.0120 1.028 0.0127 0.319 0.0540 0.289 -0.646 0.30 1.248 0.00403 0.0050 1.134 0.0131 0.287 0.0 0.216 -0.789 0.40 1.291 0.00294 0.0030 1.183 0.0108 0.276 -0.0377 0.232 -0.891 0.50 1.342 0.00200 0.0020 1.227 0.0093 0.277 -0.0510 0.223 -0.974 0.60 1.388 0.00141 0.0020 1.214 0.0084 0.261 -0.1074 0.195 -1.037 0.70 1.423 0.00117 0.0020 1.178 0.0080 0.239 -0.1465 0.163 -1.034 0.80 1.469 0.00105 0.0020 1.160 0.0078 0.245 -0.1664 0.132 -0.994 0.90 1.515 0.00100 0.0020 1.168 0.0081 0.235 -0.2094 0.066 -0.961 1.00 1.563 0.00097 0.0020 1.173 0.0084 0.222 -0.2380 0.023 -0.932 1.25 1.624 0.00064 0.0020 1.130 0.0087 0.250 -0.2647 -0.022 -0.921 1.50 1.701 0.00075 0.0020 1.140 0.0082 0.250 -0.3133 -0.076 -0.810 2.00 1.770 0.00060 0.0020 1.126 0.0073 0.250 -0.3321 -0.136 -0.583 2.50 1.820 0.00044 0.0020 1.135 0.0067 0.244 -0.3555 -0.204 -0.526 3.00 1.826 0 0.0020 1.128 0.0055 0.299 -0.3606 -0.154 -0.583 4.00 1.883 0 0.0020 1.171 0.0043 0.347 -0.4394 -0.185 -0.575 5.00 1.868 0 0.0020 1.205 0.0038 0.253 -0.5816 -0.321 -0.586
In some of the following comparisons with the models from other studies, a “mean model” is used to overcome the differences in site classification schemes. The mean model refers to that for which the SR, SI, SS and SSL terms in Equation (1) are all zero (i.e., strike-slip or normal crustal earthquakes) and the site term takes the mean value for the model SM, as calculated in Equation (5),
IDIVIIIIII
IDIDIVIVIIIIIIIIIIIIM NNNNN
NSNSNSNSNSS
++++++++= (5)
where S is the mean value, and N is the number of records in a site class. Subscripts I, II, III, IV and ID denotes site classes I, II, II, IV and individual site terms (for those sites with 3 or more records but without site classes), and subscript M denotes the mean model (mean site conditions).

Table 5(b) Coefficients for the model derived from the present study Period (s) SH S1 S2 S3 S4 σ τ σT
0.02 0.406 0.794 0.979 0.993 1.041 0.609 0.382 0.719 0.05 1.005 1.430 1.495 1.449 1.499 0.645 0.427 0.773 0.10 1.267 1.702 1.742 1.636 1.671 0.692 0.487 0.846 0.15 1.014 1.440 1.650 1.537 1.579 0.698 0.442 0.826 0.20 0.709 1.116 1.479 1.401 1.411 0.690 0.414 0.804 0.25 0.582 0.975 1.394 1.407 1.382 0.681 0.382 0.781 0.30 0.236 0.621 1.080 1.217 1.158 0.670 0.374 0.767 0.40 -0.311 0.064 0.481 0.848 0.745 0.663 0.383 0.766 0.50 -0.906 -0.535 -0.148 0.283 0.290 0.660 0.384 0.764 0.60 -1.416 -1.046 -0.673 -0.268 -0.112 0.660 0.401 0.772 0.70 -1.815 -1.441 -1.080 -0.729 -0.441 0.659 0.414 0.778 0.80 -2.251 -1.878 -1.532 -1.214 -0.844 0.653 0.422 0.777 0.90 -2.650 -2.275 -1.939 -1.645 -1.227 0.660 0.416 0.781 1.00 -3.072 -2.693 -2.362 -2.100 -1.663 0.664 0.409 0.780 1.25 -3.824 -3.422 -3.084 -2.862 -2.480 0.665 0.400 0.776 1.50 -4.515 -4.091 -3.753 -3.560 -3.257 0.664 0.406 0.778 2.00 -5.397 -4.916 -4.589 -4.418 -4.200 0.666 0.404 0.779 2.50 -6.071 -5.518 -5.217 -5.011 -4.871 0.663 0.402 0.776 3.00 -6.497 -5.869 -5.580 -5.381 -5.261 0.657 0.389 0.764 4.00 -7.318 -6.592 -6.350 -6.160 -6.066 0.628 0.373 0.731 5.00 -7.556 -6.699 -6.473 -6.286 -6.225 0.619 0.365 0.718
10 SC I stations have average shear-wave velocity in a rage of 1020-2200m/s with 1436 records available. The average intra-event residuals are calculated from the following three equations,
( ) )6(log)(),()6(log)6(log ,, cV
VTVTbVVaV
V
SCI
SS
N
jSCISj
N
jjii
SCI
Sjiji
ii
==
= ∑∑ µξξµµξ
In Equation (6a) the intra-event residuals ξi,j for period i and station j is assumed to be a function of Vsj, the average shear-wave velocity for station j and VSCI=700m/s is selected for the average shear-wave velocity for SC I sites. By calculating the average residuals over Ni stations for each period µi can be obtained from Equation (6b) and a cubic function of period is then fitted to µi so that smoothed value µ(T) can be used to calculate the hard rock site terms. Equation (6c) is to calculate the mean intra-event residuals for a site with a given average shear-wave velocity Vs. The hard rock site terms SH are calculated by adding ξ(T,VS) to the corresponding SC I site terms and are shown in Table 5(b) for sites with VS=1500m/s. The other model coefficients are shown in Table 5. The predicted PGAs of the crustal and interface models are compared with data from crustal and interface earthquakes of magnitude 6.0 or larger in Figure 2(a). The PGA data have been normalized to magnitude 7.0, a focal depth of 30 km, strike-slip crustal events and to SC II site conditions. It can be seen that the model fits this subset of the data reasonably well. In particular the near-source data, in the source distance range of 0-10km, including data recorded in the Kobe 1995 earthquake and a few recordings of earthquakes in the western part of USA, are reasonably well predicted. The predicted PGAs of slab models are compared with the normalized PGAs from subduction slab evens in Figure 2(b). Figures 3a and 3b show a comparison with PGAs predicted by the model of Fukushima et al. [8] and the Si & Midorikawa [9] model for crustal and slab events. At all magnitudes, the crustal and interface model

derived in the present study predicts very similar PGA to that predicted by the Fukushima et al. [8] and the Si & Midorikawa [9] models at all distances (Figure 3a) for the mean models. At source (< 0.2km), the present model predicts a PGA of about 0.7g, while the Fukushima et al. [8] model predicts a PGA of about 0.65g. A focal depth of 30km is used for the comparison of the present model prediction with that of the Fukushima et al. [8] model because that data set contains records from events within a focal depth range of 0-30km and there is no depth term in the Fukushima et al. [8] model. The selection of 30km focal depth in our model should result in a fair comparison. Note that for a magnitude 5 earthquake with a focal depth of 30 km, a source distance less than 10 km may be impossible, because of the small rupture area for a magnitude 5 event. The PGA levels for distances less than 10km shown in Figure 3 and subsequent figures illustrate the near-source behaviour of the model but may be physically not possible for small magnitudes. The present study and the Si & Midorikawa [9] study found that crustal and interface events on average produce similar PGAs. However, in the Si & Midorikawa [9] model the PGAs from slab events are much larger than those from crustal and interface events, by a factor of 1.66 (Figure 3(b) while the model of the present study has a factor 1.6 for slab events at a source distance of 40km. Their model generally predicts considerably larger PGAs than the present model. The difference is likely to come from two sources. The number of events in their study was only a fraction of the number in the present study and the majority of their 127 slab event records were from two large intra-plate events (1993-01-15 Off Kushiro Mw=7.6 (51 records) and 1994-10-04 East Off Hokkaido Mw=8.3 event (41 records)). In the present dataset, 19 records are from the 1993-01-15 event, and 10 records from 1994-10-04 event due to distance truncation. Our residuals analysis shows that the inter-event errors for the 1994-10-04 event and 28-1-2001 event in the same area are large and the large ground motions from these events may be a local anomaly. The inter-event error for the 1993-01-15 event is very small, suggesting the present model predicts the records from this event very well. Figure 4 shows the effects of focal mechanism, tectonic source types and focal depth. In the present study, the base model is for crustal earthquakes with strike-slip or normal focal mechanism at a focal depth of 15km or less. For slab events, the modification factor is distance dependent and the scale factors for distances of 40, 60, 80 and 120km are presented. Figure 4(a) shows that crustal events with reverse focal mechanism produce about 20-40% larger ground motions than that predicted by the base model. For PGA at 0.05s and 0.1s periods, the scale factors for interface events were set at 1.0 as the coefficients derived in the regression analysis were not statistically significant. Up to 0.4s, the scale factors for interface events are very small. Beyond 0.4s, ground motions produced by interface events decrease quickly with increasing period and at 4.0s ground motions from interface events are about 60% of the motions predicted by the base model (Figure 4(a)). At a source distance of 40km, the scale factors for slab events are about 1.6 up to 0.7s, then decrease to about 1.0 at 2.0s period, while the scale factors at 120km have similar values to those for interface events. Figure 4(b) shows the effect of focal depth for the ground motions predicted by the present model. The scale factors decrease with increasing periods beyond 0.3s and the effect of focal depth is very large. However, there are very few data beyond 120km depth (the deepest event has a focal depth of 160km). For an attenuation model used for a probabilistic seismic hazard study, uncertainty associated with the model has a very large effect on the level of the probabilistic ground motion. In Figures 5, comparison is made between the total prediction errors and those published previously. For crustal events shown in Figure 5(a), at periods less than 2.0s the total errors of the present study lie between the total errors from the Abrahamson & Silva [10] model for MW = 5 and 6 events. However at periods beyond 2.5s, the prediction errors of the present model are markedly smaller than those for MW = 5 and 6 events and are similar to those for MW ≥ 7 events of the Abrahamson & Silva [10] model. Figure 5(b) shows the total errors from the Youngs et al [11] model calculated for MW =5, 6, 7, and 8 events, and those from the present model.

The total errors of the present model for subduction events are significantly smaller than those from the Youngs et al [11] model for Mw=5 and 6 events (except at 0.1s period), especially for the interface events. Up to 1.5s, the total errors for interface events from the present study lie between those of the Youngs et al [11] model for Mw=7 and 8 events, and beyond 2s period the prediction errors for both interface and slab events are markedly smaller than those for Mw=8 events. Intra-event PGA residual distributions with magnitude and source distance are shown in Figure 6 for interface events and in Figure 7 for slab events. The error distribution is not significantly biased with respect to either magnitude or source distance for all three types of earthquakes. Similar error distributions were also found for crustal events. Figure 8 shows the inter-event residual distribution with magnitude and focal depth for PGAs, and again there is no clear trend in the residual distribution. However, the PGAs from the 10-4-1994 MW=8.3 event and the 28-1-2001 MW=6.8 of the eastern coast of Hokkaido are under-estimated, and further investigation is required to identify if this is a regional anomaly. The ground motions for the 26-5-2003 Miyagi MW=7.0 event were also under-estimated and slab events from this area are known to produce higher ground motions than in the other parts of Japan. Figure 9(a) shows the variation of the amplification factors, with respect to the SC I sites, for the three soil classes. The amplification factors for a particular site class are the exponential of the difference between the site class terms and SC I site class terms, for example, exp(SIII-SI) for SC III site class. The amplification curves are consistent with the definition of site class in terms of site dominant periods shown in Table 4. All three site classes show a trough at about 0.1s which can be interpreted as the period of the spectral peak for SC I sites. The amplification curve for SC II sites shows a broad-band amplification at periods beyond 0.15s. SC III class shows a peak amplification at about 0.5s which lies in the middle of dominant periods, 0.4-0.6s, for this site class. The amplification curve for SC IV sites has a peak at 0.9s that is also reasonably consistent with the definition of this site class having dominant periods larger than 0.6s. The corresponding spectral shapes, i.e., the spectral acceleration SA(T) (calculated from the model coefficients in Table 6) divided by PGA, for an MW=7.0 event at a depth of 20km and a distance of 30km) are shown in Figure 9(b) for crustal strike-slip and normal-fault events and four site classes. The peak value of the spectral shape is between 2.0-2.5 and the spectral periods of the peaks increase with increasing site class which is consistent with the site classification scheme used in the present study. Figure 10 shows the pseudo-velocity spectra for crustal, interface and slab events for MW=7 events at 10 and 40km source distances. The large spectra from slab events are evident and the elevation of the spectra for slab events reduces with increasing source distance.
DISCUSSION AND CONCLUSIONS An attenuation model accounting for tectonic source types and focal mechanisms of crustal events is derived in this study. The model predictions for all site classes and source types are plausible. The present model for crustal events predicts similar PGAs to those predicted by the Fukushima et all [8] model. Because of much smaller prediction error of the present model, we believe that the present model is more robust for subduction events than the other models. The present model for crustal reverse-fault events predicts ground motions about 20-40% higher than those from crustal strike-slip and normal-fault events. This result is similar to those from many other models derived from overseas crustal events. The present model also indicates that interface events produce ground motions that are similar to those of crustal strike-slip events up to 0.4s but produce much smaller ground motions at longer periods. At 4.0s, the present model predicts 40% lower ground motions for interface events than for crustal strike-slip events. The present model predicts 60% higher ground motions for slab events at a source distance of 40km than for crustal strike-slip events for periods up to
0.7s. At a 120km distance the spectral accelerations predicted for slab events are similar to those for the interface events. At periods beyond 0.8s, the spectral accelerations predicted for slab events decrease rapidly with increasing period. The difference between the factor for slab events and interface events is period-and source distance dependent, varying from a scale factor of 1.6 at a source distance of 40km for short and intermediate periods to a scale factor of 1.0 at all periods at a source distance of 120km, instead of a constant of 0.364 (a scale factor of 1.44) as in the Youngs et al [11] model. In the present model, earthquake depth has the greatest effect on the prediction of ground motions, especially at short periods. An earthquake at a depth of 80km may produce ground motions 2.5 times those of an earthquake of 15km deep, at the same source distance. The present model is valid for earthquakes with a depth up to 120km. The most important feature of the present model is that site class terms, rather than individual site terms, are used to account for site effects. This method is consistent with the methodology that is most commonly used for developing attenuation models. This approach is believed to be capable of modelling source terms without causing source effects to be shifted into individual site terms. Using site class terms is likely to retain the statistical power of ground motion data from stations with few records. In the present model, predictions for subduction events in the near-source region are largely constrained by shallow crustal events from the western part of the USA. Adding records from large subduction events within a distance of 50km could possibly result in improvement.
ACKNOWLEDGEMENTS The authors thank Drs. Tomotaka Iwata and Haruko Sekiguchi of DPRI, Kyoto University for their generous support. We also thank Drs. Jim Cousins and Graeme McVerry for reviewing the manuscript and their constructive comments. The support from the Japanese Society for Promotion of Science for Dr. John X. Zhao during his fellowship leave in Kyoto University in 2000 is appreciated.
REFERENCES 1. Molas, G.L. and Yamazaki, F. (1995), Attenuation of earthquake ground motion in Japan including
deep focus events, Bulletin of the Seismological Society of America, Vol. 85, No. 5, pp. 1343-1358 2. Kobayashi, S., Takahashi, T., Matruzaki, S., Mori, M., Fukushima, Y., Zhao, J.X. and Somervill,
P.G. (2000), A spectral attenuation model for Japan using digital strong motion records of JMA87 type, 12th World Conference of Earthquake Engineering, 2000, Auckland, New Zealand
3. Takahashi, T., S. Kobayashi, Y. Fukushima, J.X. Zhao, H. Nakamura and P.G. Somerville (2000), A spectral attenuation model for Japan using strong motion data base, to be presented in the 6th International Conference on Seismic Zonation held November 12–15, 2000 Palm Springs Riviera Resort, California, USA
4. Zhao, J.X., Irikura, K., Zhang, J., Fukushima, Y., Somerville, P.G., Saiki, T., Okada, H. and Takahashi, T. (2004) Site classification for strong-motion stations in Japan using h/v response spectral ratio, 13th World Conference of Earthquake Engineering, Vancouver, B.C., Canada, paper No. 1278
5. Abrahamson, N.A. and Youngs, R.R. (1992), A stable algorithm for regression analysis using the random effect model, Bulletin of the Seismological Society of America, Vol. 82, pp. 505-510
6. Joyner, W.B. and Boore, D.M. (1993), Methods for regression analysis of strong motion data, Bulletin of the Seismological Society of America, Vol. 83, pp. 469-487

7. Building Seismic Safety Council (BSSC) (2000), The 2000 NEHRP Recommended Provisions for New Buildings and Other Structures, Part I (Provisions) and Part II (Commentary), FEMA 368/369, Washington DC
8. Fukushima, Y. K. Irikura, T. Uetake and H. Matsumoto (2000), Characteristics of observed peak amplitude for strong ground motion from the 1995 Hyogo-ken Nanbu (Kobe) earthquake, Bulletin of the Seismological Society of America, Vol. 90, pp. 545-565.
9. Si, H. and Midorikawa, S. (1999), New attenuation relationships for peak ground acceleration and velocity considering effects of fault type and site condition, J. Struct. Constr. Eng., AIJ. No. 523, pp63-70. Sep. 1999
10. Abrahamson, N.A. and Silva, W.J. (1997), Empirical response spectral attenuation relations for shallow crustal earthquakes, Seismological Research Letters, Vol. 68, pp. 94-127
11. Youngs, R.R., Chiou, S.-J., Silva, W.J. and Humphrey, J.R. (1997), Strong ground motion attenuation relationships for subduction zone earthquakes, Seismological Research Letters, Vol. 68, pp. 94-127
Figure 1 Distribution of the strong motion data used in this study. Magnitude-distance distribution for (a)
data from Japan; and (b) overseas data; (c) magnitude-focal depth distribution and (d) source distance-focal depth distribution of Japanese data.

Figure 2 Comparison predicted PGA by the present model with the PGAs from earthquakes with
magnitude 6.0 or larger, (a) for crustal and interface events and (b) for slab events. The PGAs have been normalized to MW = 7.0 at a focal depth of 30 km for SC II site conditions.
Figure 3 Comparison of predicted PGA by the present model with those of (a) Fukushima et al [8] and Si
& Midorikawa [9] for crustal strike-slip events and (b) Si & Midorikawa [9] for slab events, with the mean site terms for magnitudes 5, 6 ,7 and 8.
Figure 4 Scale factors for (a) source types and reverse crustal events with respect to strike-slip & normal
crustal events; and for (b) focal depth with respect to events of focal depth h=15 km or less. Note that scale factors for slab events are shown for 40, 60, 80 and 120km source distances and that PGA is labeled at 0.02 to indicate that the scale factor is for peak ground accelerations

Figure 5 Total standard deviation calculated by Equation (4) for PGAs, (a) crustal events; and (b)
subduction events.
Figure 6 Intra-event residuals distributions for PGAs from interface events with respect to (a) magnitude,
and (b) source distance.
Figure 7 Intra-event residuals distributions for PGAs from slab events with respect to (a) magnitude, and
(b) source distance.
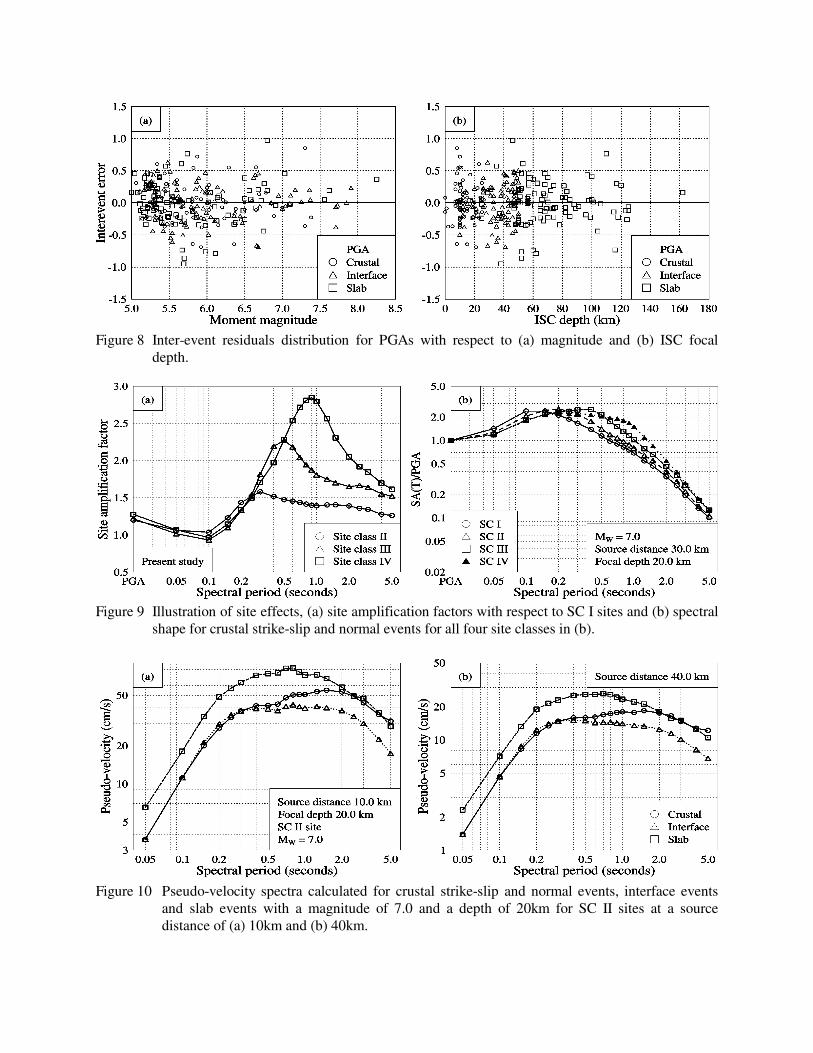
Figure 8 Inter-event residuals distribution for PGAs with respect to (a) magnitude and (b) ISC focal
depth.
Figure 9 Illustration of site effects, (a) site amplification factors with respect to SC I sites and (b) spectral
shape for crustal strike-slip and normal events for all four site classes in (b).
Figure 10 Pseudo-velocity spectra calculated for crustal strike-slip and normal events, interface events
and slab events with a magnitude of 7.0 and a depth of 20km for SC II sites at a source distance of (a) 10km and (b) 40km.