Embed Size (px)
Citation preview
Stantec Consulting Ltd. 300W-675 Cochrane Drive, Markham ON L3R 0B8
July 31, 2018 File: 160950528
Attention: Mr. Gioseph Anello, Manager, Waste Planning, and Technical Services
The Regional Municipality of Durham 605 Rossland Road East P.O. Box 623 Whitby, ON L1N 6A3
Dear Mr. Anello,
Reference: Durham York Energy Centre, Ambient Monitoring Program – Elevated Dioxins/Furans at Courtice WPCP on May 26, 2018
The purpose of this letter is to provide notice and supplemental information to the Regions of Durham and York of an elevated measured ambient concentration of Dioxins and Furans (D/F) on May 26, 2018 at the Courtice WPCP Station. Formal notification of the Ontario Ministry of the Environment, Conservation and Parks (MECP) and Durham Medical Officer of Health is required.
Following the guidance of the Ambient Monitoring Plan (AMP), Stantec reviewed and confirmed the D/F filter results with the analytical laboratory (Maxxam) and conducted a review of the elevated D/F concentration. Additionally, Stantec requested Maxxam to re-analyze the May 26th samples from the Courtice WPCP, Rundle Road and Crago Road Stations. Furthermore, the potential impact on human health was evaluated by a Stantec Toxicologist.
The following summarizes our findings:
1. The May 26, 2018, D/F Toxic Equivalency Quotient (TEQ) concentration at the Courtice WPCP Station was determined to be 0.109 pg TEQ/m3 which is 9% above the MECP Schedule 3 air quality Standard from Regulation 419/05 – Air Pollution – Local Air Quality (O. Reg. 419/05). D/F TEQ concentrations at the Crago Road and Rundle Road Stations (0.098 and 0.091 pg TEQ/m3, respectively) were also elevated relative to recent measurements. D/F TEQ values were below the MECP’s Upper Risk Threshold (URT) of 1.0 pg TEQ/m3.
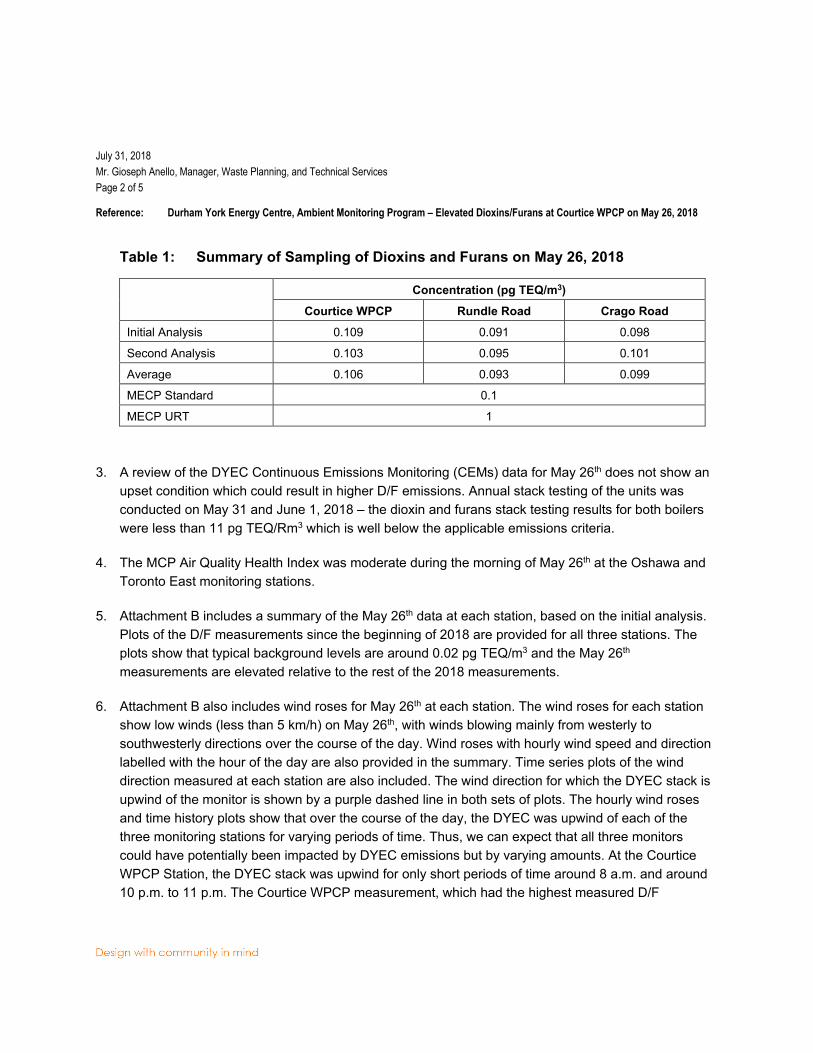
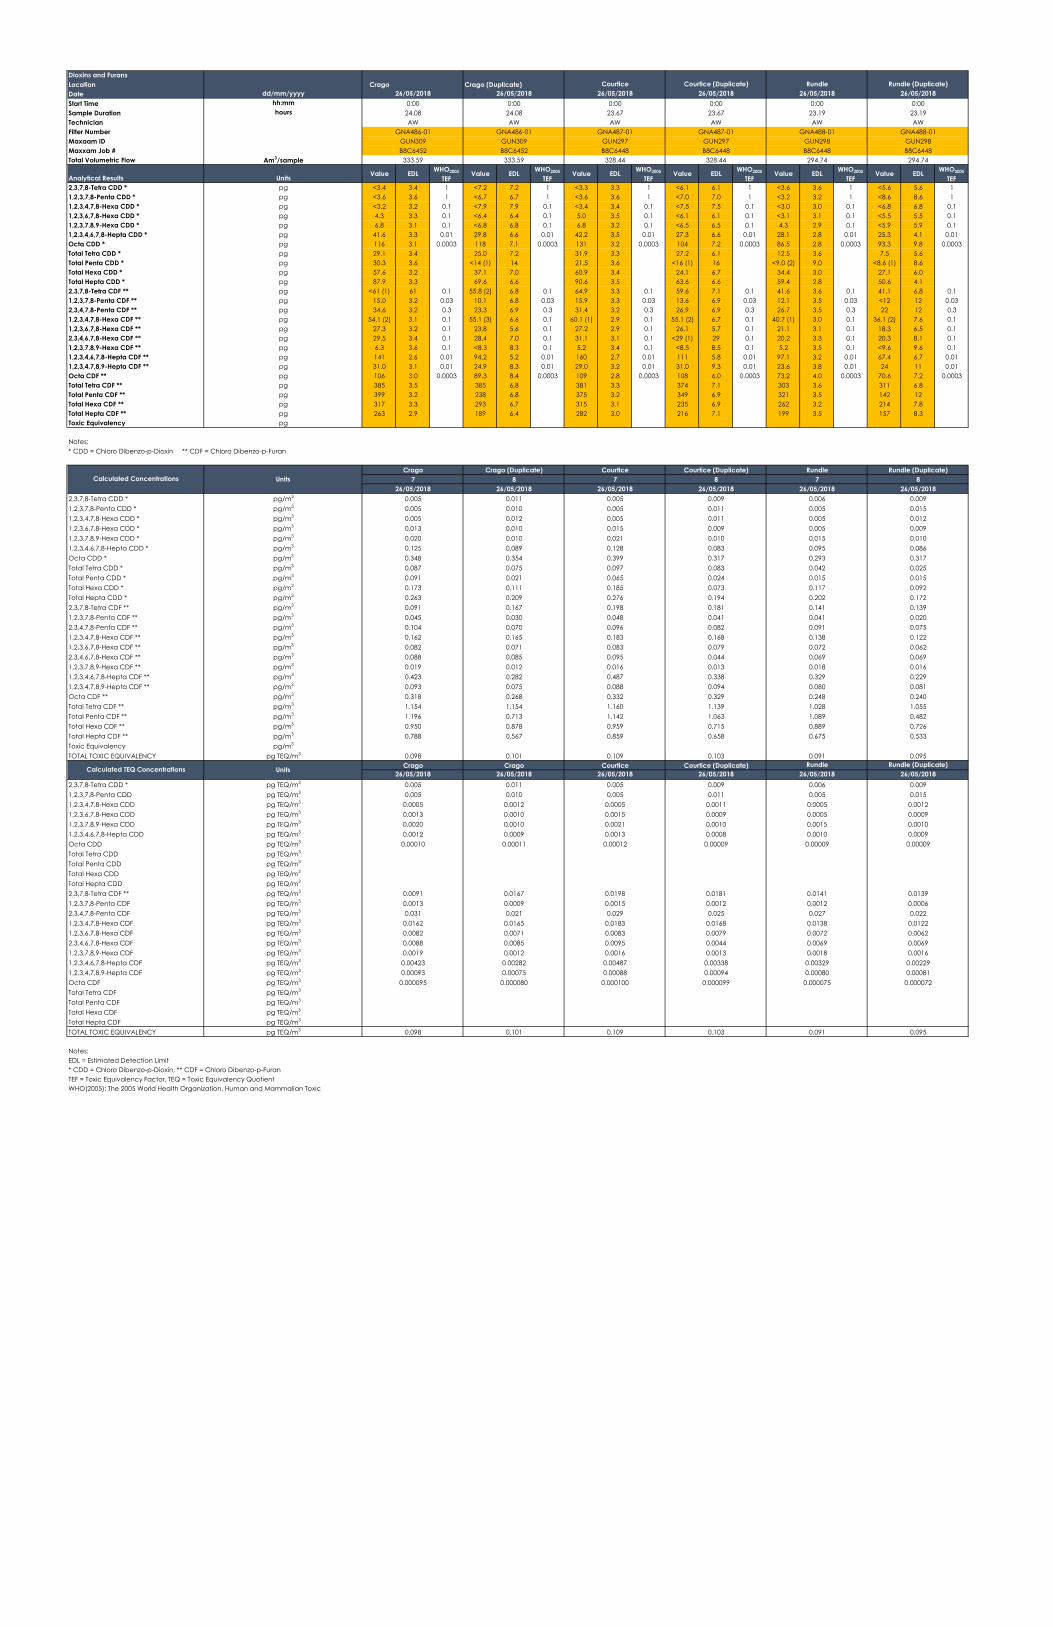
2. Stantec requested the May 26, 2018 samples at all three stations be re-analyzed by Maxxam to confirm the results. The re-run was found to be similar to the initial results. The average of the initial and re-analysis lab results for the Courtice WPCP was 0.106 which is also above the air quality Standard. Attachment A provides the laboratory results and Stantec’s calculation of the TEQ values. The D/F TEQ results for May 26, 2018 at each station are summarized below.
July 31, 2018 Mr. Gioseph Anello, Manager, Waste Planning, and Technical Services Page 2 of 5
Reference: Durham York Energy Centre, Ambient Monitoring Program – Elevated Dioxins/Furans at Courtice WPCP on May 26, 2018
Table 1: Summary of Sampling of Dioxins and Furans on May 26, 2018
Concentration (pg TEQ/m3) Courtice WPCP Rundle Road Crago Road
Initial Analysis 0.109 0.091 0.098
Second Analysis 0.103 0.095 0.101
Average 0.106 0.093 0.099
MECP Standard 0.1
MECP URT 1
3. A review of the DYEC Continuous Emissions Monitoring (CEMs) data for May 26th does not show an upset condition which could result in higher D/F emissions. Annual stack testing of the units was conducted on May 31 and June 1, 2018 – the dioxin and furans stack testing results for both boilers were less than 11 pg TEQ/Rm3 which is well below the applicable emissions criteria.
4. The MCP Air Quality Health Index was moderate during the morning of May 26th at the Oshawa and Toronto East monitoring stations.
5. Attachment B includes a summary of the May 26th data at each station, based on the initial analysis. Plots of the D/F measurements since the beginning of 2018 are provided for all three stations. The plots show that typical background levels are around 0.02 pg TEQ/m3 and the May 26th measurements are elevated relative to the rest of the 2018 measurements.
6. Attachment B also includes wind roses for May 26th at each station. The wind roses for each station show low winds (less than 5 km/h) on May 26th, with winds blowing mainly from westerly to southwesterly directions over the course of the day. Wind roses with hourly wind speed and direction labelled with the hour of the day are also provided in the summary. Time series plots of the wind direction measured at each station are also included. The wind direction for which the DYEC stack is upwind of the monitor is shown by a purple dashed line in both sets of plots. The hourly wind roses and time history plots show that over the course of the day, the DYEC was upwind of each of the three monitoring stations for varying periods of time. Thus, we can expect that all three monitors could have potentially been impacted by DYEC emissions but by varying amounts. At the Courtice WPCP Station, the DYEC stack was upwind for only short periods of time around 8 a.m. and around 10 p.m. to 11 p.m. The Courtice WPCP measurement, which had the highest measured D/F
July 31, 2018 Mr. Gioseph Anello, Manager, Waste Planning, and Technical Services Page 3 of 5
Reference: Durham York Energy Centre, Ambient Monitoring Program – Elevated Dioxins/Furans at Courtice WPCP on May 26, 2018
concentration, was also the station for which winds were blowing from the DYEC to the station for the least amount of time.
7. Based on the relative similarity of the D/F measurements at each station, and that the Courtice WPCP Station was the primarily upwind station over the majority of the day, the most likely source for the elevated D/F concentrations measured at each station was a regional source rather than the DYEC.
8. The MECP develops Ambient Air Quality Criteria (AAQC) and air quality Standards based on available toxicological information for individual chemicals. In general, the MECP uses an approach that is based on identifying the highest reported exposure level that does not result in an observable adverse health effect (referred to as the No Observable Adverse Effect Level or NOAEL), or the lowest reported exposure associated with an observable adverse health effect (referred to as the Lowest Observable Adverse Effect Level or LOAEL). For each chemical, the MECP sets the AAQC or Standard at a concentration that is typically more than 100 times lower than the NOAEL or LOAEL selected for use in the derivation. This approach is used to account for uncertainties that may exist in the toxicological information used in the derivation of the Standard.
Using this approach, the MECP developed a 24-hour AAQC and Standard for D/F of 0.1 pg TEQ/m3 (where TEQ = Toxic Equivalency Quotient that represents the total concentration of D/F expressed relative to the toxicity of 2,3,7,8-TCDD). The 24-hour value was derived from toxicological studies that noted developmental effects associated with exposures to D/F (MECP 2009)1. The MECP considers the 24-hour D/F concentration in air to represent an essentially negligible health risk (MECP, 2009). This means that measured 24-hour average D/F concentrations that are at or below the AAQC/Standard would represent a negligible human health risk for people in the local community.
On May 26, 2018, a D/F TEQ concentration of 0.109 pg TEQ/m3 was measured at the Courtice WPCP station. Although the D/F TEQ measurement on May 26, 2018 exceeded the MECP 24-hour AAQC, the exceedance was marginal (9% higher than the AAQC). In interpreting the human health risks that may be associated with this exceedance it is important to understand the pattern and frequency of these exceedances. Exposures that exceed a defined exposure limit on an intermittent basis (exceedances are separated by weeks or months) do not represent as much of a human health risk as exceedances that occur on a more frequent basis (occur on multiple consecutive sampling events). Therefore, to properly evaluate the potential health risks that may be associated with the
1 MECP EBR website accessed Aug 21, 2017: http://www.ebr.gov.on.ca/ERS-WEB-External/displaynoticecontent.do?noticeId=MTA3MDk2&statusId=MTY5OTQz
July 31, 2018 Mr. Gioseph Anello, Manager, Waste Planning, and Technical Services Page 4 of 5
Reference: Durham York Energy Centre, Ambient Monitoring Program – Elevated Dioxins/Furans at Courtice WPCP on May 26, 2018
occasional exceedances of the 24-hour D/F exposure limit, it is important to also consider the frequency of these occurrences. The D/F TEQ concentrations at the Courtice WPCP station have consistently been around 0.02 pg TEQ/m3 for the past several years and in the subsequent sample collected June 19, 2018. In addition, the D/F TEQ concentrations at the Rundle Road and Crago Road stations were 0.091 pg TEQ/m3 and 0.098 pg TEQ/m3, respectively.
Based on these results, the exceedance noted on May 26, 2018 would appear to represent an isolated event and as such, would be considered to represent a negligible human health risk.
9. The MECP’s Upper Risk Threshold (URT) for D/F TEQ is 1.0 pg TEQ/m3. The URTs are not air quality Standards; rather, URTs represent management limits that are not directly tied to human health effects. An exceedance of an URT is not an indication of potential human health effects. Rather, an exceedance of an URT is an indication that timely action is required to lower the concentrations, and thereby reduce potential human health risks (MECP, 2017)2. Although URTs are not directly linked to the occurrence of human health effects, human health risks associated with prolonged exposures to chemicals in air at concentrations that exceed their respective URTs would not be considered negligible by the MECP.
2 MECP, February 2017: Guideline for the Implementation of Air Standards in Ontario (GIASO) (Guideline A-12) (Version 3).
July 31, 2018 Mr. Gioseph Anello, Manager, Waste Planning, and Technical Services Page 5 of 5
Reference: Durham York Energy Centre, Ambient Monitoring Program – Elevated Dioxins/Furans at Courtice WPCP on May 26, 2018
CONCLUSION
Based on Stantec’s review, the DYEC is unlikely to have substantially contributed to the elevated D/F concentration at the Courtice WPCP Station measured on May 26, 2018. Furthermore, the measured D/F concentration is not expected to have resulted in an adverse effect on human health or the environment.
If you have comments or questions, please contact the undersigned.
Regards,
Stantec Consulting Ltd.
Bryan Leece Ph.D. Senior Toxicologist Phone: (905) 381-3264 Fax: (905) 385-3534 [email protected]
Connie Lim B.A.Sc. Project Manager, Atmospheric Environment Phone: (905) 415-6385 Fax: (905) 474-9889 [email protected]
Gregory Crooks M.Eng., P.Eng. Principal, Environmental Services Phone: (416) 598-7687 Fax: (416) 596-6680 [email protected]
Attachments: Attachment A D/F Data Tables
Attachment B Analysis
c. Christian Shelepuk, The Regional Municipality of Durham Seth Dittman, The Regional Municipality of York Celeste Dugas, District Manager, York-Durham District Office, MOEC Dr. Robert Kyle, Commissioner & Medical Officer of Health, Region of Durham Kimberly Ireland, Stantec Consulting Ltd.
pk v:\01609\active\160950528\planning\correspondence\moecc\df_exceedance_may_2018\let_160950528_elevated-df_20180731_rev1.docx
ATTACHMENT A D/F DATA TABLES
Dioxins and FuransLocation Crago Crago (Duplicate)DateStart TimeSample Duration TechnicianFilter NumberMaxaam IDMaxxam Job #Total Volumetric Flow
Analytical Results Value EDL WHO2005
TEFValue EDL WHO2005
TEFValue EDL WHO2005
TEFValue EDL WHO2005
TEFValue EDL WHO2005
TEFValue EDL WHO2005
TEF2,3,7,8-Tetra CDD * <3.4 3.4 1 <7.2 7.2 1 <3.3 3.3 1 <6.1 6.1 1 <3.6 3.6 1 <5.6 5.6 11,2,3,7,8-Penta CDD * <3.6 3.6 1 <6.7 6.7 1 <3.6 3.6 1 <7.0 7.0 1 <3.2 3.2 1 <8.6 8.6 11,2,3,4,7,8-Hexa CDD * <3.2 3.2 0.1 <7.9 7.9 0.1 <3.4 3.4 0.1 <7.5 7.5 0.1 <3.0 3.0 0.1 <6.8 6.8 0.11,2,3,6,7,8-Hexa CDD * 4.3 3.3 0.1 <6.4 6.4 0.1 5.0 3.5 0.1 <6.1 6.1 0.1 <3.1 3.1 0.1 <5.5 5.5 0.11,2,3,7,8,9-Hexa CDD * 6.8 3.1 0.1 <6.8 6.8 0.1 6.8 3.2 0.1 <6.5 6.5 0.1 4.3 2.9 0.1 <5.9 5.9 0.11,2,3,4,6,7,8-Hepta CDD * 41.6 3.3 0.01 29.8 6.6 0.01 42.2 3.5 0.01 27.3 6.6 0.01 28.1 2.8 0.01 25.3 4.1 0.01Octa CDD * 116 3.1 0.0003 118 7.1 0.0003 131 3.2 0.0003 104 7.2 0.0003 86.5 2.8 0.0003 93.3 9.8 0.0003Total Tetra CDD * 29.1 3.4 25.0 7.2 31.9 3.3 27.2 6.1 12.5 3.6 7.5 5.6Total Penta CDD * 30.3 3.6 <14 (1) 14 21.5 3.6 <16 (1) 16 <9.0 (2) 9.0 <8.6 (1) 8.6Total Hexa CDD * 57.6 3.2 37.1 7.0 60.9 3.4 24.1 6.7 34.4 3.0 27.1 6.0Total Hepta CDD * 87.9 3.3 69.6 6.6 90.6 3.5 63.6 6.6 59.4 2.8 50.6 4.12,3,7,8-Tetra CDF ** <61 (1) 61 0.1 55.8 (2) 6.8 0.1 64.9 3.3 0.1 59.6 7.1 0.1 41.6 3.6 0.1 41.1 6.8 0.11,2,3,7,8-Penta CDF ** 15.0 3.2 0.03 10.1 6.8 0.03 15.9 3.3 0.03 13.6 6.9 0.03 12.1 3.5 0.03 <12 12 0.032,3,4,7,8-Penta CDF ** 34.6 3.2 0.3 23.3 6.9 0.3 31.4 3.2 0.3 26.9 6.9 0.3 26.7 3.5 0.3 22 12 0.31,2,3,4,7,8-Hexa CDF ** 54.1 (2) 3.1 0.1 55.1 (3) 6.6 0.1 60.1 (1) 2.9 0.1 55.1 (2) 6.7 0.1 40.7 (1) 3.0 0.1 36.1 (2) 7.6 0.11,2,3,6,7,8-Hexa CDF ** 27.3 3.2 0.1 23.8 5.6 0.1 27.2 2.9 0.1 26.1 5.7 0.1 21.1 3.1 0.1 18.3 6.5 0.12,3,4,6,7,8-Hexa CDF ** 29.5 3.4 0.1 28.4 7.0 0.1 31.1 3.1 0.1 <29 (1) 29 0.1 20.2 3.3 0.1 20.3 8.1 0.11,2,3,7,8,9-Hexa CDF ** 6.3 3.6 0.1 <8.3 8.3 0.1 5.2 3.4 0.1 <8.5 8.5 0.1 5.2 3.5 0.1 <9.6 9.6 0.11,2,3,4,6,7,8-Hepta CDF ** 141 2.6 0.01 94.2 5.2 0.01 160 2.7 0.01 111 5.8 0.01 97.1 3.2 0.01 67.4 6.7 0.011,2,3,4,7,8,9-Hepta CDF ** 31.0 3.1 0.01 24.9 8.3 0.01 29.0 3.2 0.01 31.0 9.3 0.01 23.6 3.8 0.01 24 11 0.01Octa CDF ** 106 3.0 0.0003 89.3 8.4 0.0003 109 2.8 0.0003 108 6.0 0.0003 73.2 4.0 0.0003 70.6 7.2 0.0003Total Tetra CDF ** 385 3.5 385 6.8 381 3.3 374 7.1 303 3.6 311 6.8Total Penta CDF ** 399 3.2 238 6.8 375 3.2 349 6.9 321 3.5 142 12Total Hexa CDF ** 317 3.3 293 6.7 315 3.1 235 6.9 262 3.2 214 7.8Total Hepta CDF ** 263 2.9 189 6.4 282 3.0 216 7.1 199 3.5 157 8.3Toxic Equivalency
Notes:* CDD = Chloro Dibenzo-p-Dioxin ** CDF = Chloro Dibenzo-p-Furan
2,3,7,8-Tetra CDD *1,2,3,7,8-Penta CDD *1,2,3,4,7,8-Hexa CDD *1,2,3,6,7,8-Hexa CDD *1,2,3,7,8,9-Hexa CDD *1,2,3,4,6,7,8-Hepta CDD *Octa CDD *Total Tetra CDD *Total Penta CDD *Total Hexa CDD *Total Hepta CDD *2,3,7,8-Tetra CDF **1,2,3,7,8-Penta CDF **2,3,4,7,8-Penta CDF **1,2,3,4,7,8-Hexa CDF **1,2,3,6,7,8-Hexa CDF **2,3,4,6,7,8-Hexa CDF **1,2,3,7,8,9-Hexa CDF **1,2,3,4,6,7,8-Hepta CDF **1,2,3,4,7,8,9-Hepta CDF **Octa CDF **Total Tetra CDF **Total Penta CDF **Total Hexa CDF **Total Hepta CDF **Toxic EquivalencyTOTAL TOXIC EQUIVALENCY
2,3,7,8-Tetra CDD *1,2,3,7,8-Penta CDD1,2,3,4,7,8-Hexa CDD1,2,3,6,7,8-Hexa CDD1,2,3,7,8,9-Hexa CDD1,2,3,4,6,7,8-Hepta CDDOcta CDDTotal Tetra CDDTotal Penta CDDTotal Hexa CDDTotal Hepta CDD2,3,7,8-Tetra CDF **1,2,3,7,8-Penta CDF2,3,4,7,8-Penta CDF1,2,3,4,7,8-Hexa CDF1,2,3,6,7,8-Hexa CDF2,3,4,6,7,8-Hexa CDF1,2,3,7,8,9-Hexa CDF1,2,3,4,6,7,8-Hepta CDF1,2,3,4,7,8,9-Hepta CDFOcta CDFTotal Tetra CDFTotal Penta CDFTotal Hexa CDFTotal Hepta CDFTOTAL TOXIC EQUIVALENCY
Notes:EDL = Estimated Detection Limit* CDD = Chloro Dibenzo-p-Dioxin, ** CDF = Chloro Dibenzo-p-FuranTEF = Toxic Equivalency Factor, TEQ = Toxic Equivalency Quotient
pg TEQ/m3
pg TEQ/m3
pg TEQ/m3
pg TEQ/m3
pg TEQ/m3
pg TEQ/m3
pg TEQ/m3
pg TEQ/m3
pg TEQ/m3
pg TEQ/m3
pg TEQ/m3
pg TEQ/m3
pg TEQ/m3
pg TEQ/m3
pg TEQ/m3
pg TEQ/m3
pg TEQ/m3
pg TEQ/m3
pg TEQ/m3
pg TEQ/m3
pg TEQ/m3
pg TEQ/m3
pg TEQ/m3
pg TEQ/m3
pg TEQ/m3
pg TEQ/m3
Units
pg/m3
pg/m3
pg/m3
pg/m3
pg/m3
pg/m3
pg/m3
pg/m3
pg/m3
pg/m3
pg/m3
pg/m3
pg/m3
pg/m3
pg/m3
pg/m3
pg/m3
pg/m3
pg/m3
pg/m3
pg/m3
WHO(2005): The 2005 World Health Organization, Human and Mammalian Toxic
pg
Calculated Concentrations
Calculated TEQ Concentrations
pg/m3
pg/m3
pg/m3
pg/m3
pg/m3
pg TEQ/m3
Units
pgpgpgpgpgpgpgpgpg
pgpgpgpgpgpgpgpgpg
Am3/sample
Unitspgpgpgpgpgpgpg
dd/mm/yyyyhh:mmhours 24.08 24.08
AW AWGNA486-01 GNA486-01
26/05/2018 26/05/20180:00 0:00
Crago Crago (Duplicate)7 8
26/05/2018 26/05/2018
GUN309 GUN309B8C6452 B8C6452
333.59 333.59
0.013 0.0100.020 0.0100.125 0.089
0.005 0.0110.005 0.0100.005 0.012
0.173 0.1110.263 0.2090.091 0.167
0.348 0.3540.087 0.0750.091 0.021
0.082 0.0710.088 0.0850.019 0.012
0.045 0.0300.104 0.0700.162 0.165
1.154 1.1541.196 0.7130.950 0.878
0.423 0.2820.093 0.0750.318 0.268
Crago Crago26/05/2018 26/05/2018
0.005 0.011
0.788 0.567
0.098 0.101
0.0020 0.00100.0012 0.00090.00010 0.00011
0.005 0.0100.0005 0.00120.0013 0.0010
0.0091 0.01670.0013 0.0009
0.0019 0.00120.00423 0.00282
0.031 0.0210.0162 0.01650.0082 0.0071
0.098 0.101
26/05/2018 26/05/20180:00 0:0023.67 23.67
0.00093 0.000750.000095 0.000080
0.0088 0.0085
B8C6448 B8C6448328.44 328.44
Courtice Courtice (Duplicate)
AW AWGNA487-01 GNA487-01
GUN297 GUN297
0.005 0.0110.005 0.0110.015 0.009
7 826/05/2018 26/05/2018
0.005 0.009
0.097 0.0830.065 0.0240.185 0.073
0.021 0.0100.128 0.0830.399 0.317
0.096 0.0820.183 0.1680.083 0.079
0.276 0.1940.198 0.1810.048 0.041
0.088 0.0940.332 0.3291.160 1.139
0.095 0.0440.016 0.0130.487 0.338
0.109 0.103Courtice Courtice (Duplicate)
1.142 1.0630.959 0.7150.859 0.658
0.0005 0.00110.0015 0.00090.0021 0.0010
26/05/2018 26/05/20180.005 0.0090.005 0.011
0.0013 0.00080.00012 0.00009
0.109 0.103
0.000100 0.000099
0.0016 0.00130.00487 0.003380.00088 0.00094
26/05/2018 26/05/20180:00 0:00
0.0183 0.01680.0083 0.00790.0095 0.0044
0.0198 0.01810.0015 0.00120.029 0.025
GUN298 GUN298B8C6448 B8C6448
294.74 294.74
23.19 23.19AW AW
GNA488-01 GNA488-01
0.006 0.0090.005 0.0150.005 0.012
Rundle Rundle (Duplicate)7 8
26/05/2018 26/05/2018
0.293 0.3170.042 0.0250.015 0.015
0.005 0.0090.015 0.0100.095 0.086
0.041 0.0200.091 0.0750.138 0.122
0.117 0.0920.202 0.1720.141 0.139
0.329 0.2290.080 0.0810.248 0.240
0.072 0.0620.069 0.0690.018 0.016
0.091 0.095
1.028 1.0551.089 0.4820.889 0.726
Courtice Courtice (Duplicate) Rundle Rundle (Duplicate)
0.0015 0.00100.0010 0.00090.00009 0.00009
0.005 0.0150.0005 0.00120.0005 0.0009
Rundle Rundle (Duplicate)26/05/2018 26/05/2018
0.006 0.009
0.675 0.533
0.0141 0.01390.0012 0.0006
0.0069 0.00690.0018 0.00160.00329 0.00229
0.027 0.0220.0138 0.01220.0072 0.0062
0.091 0.095
0.00080 0.000810.000075 0.000072
ATTACHMENT B ANALYSIS
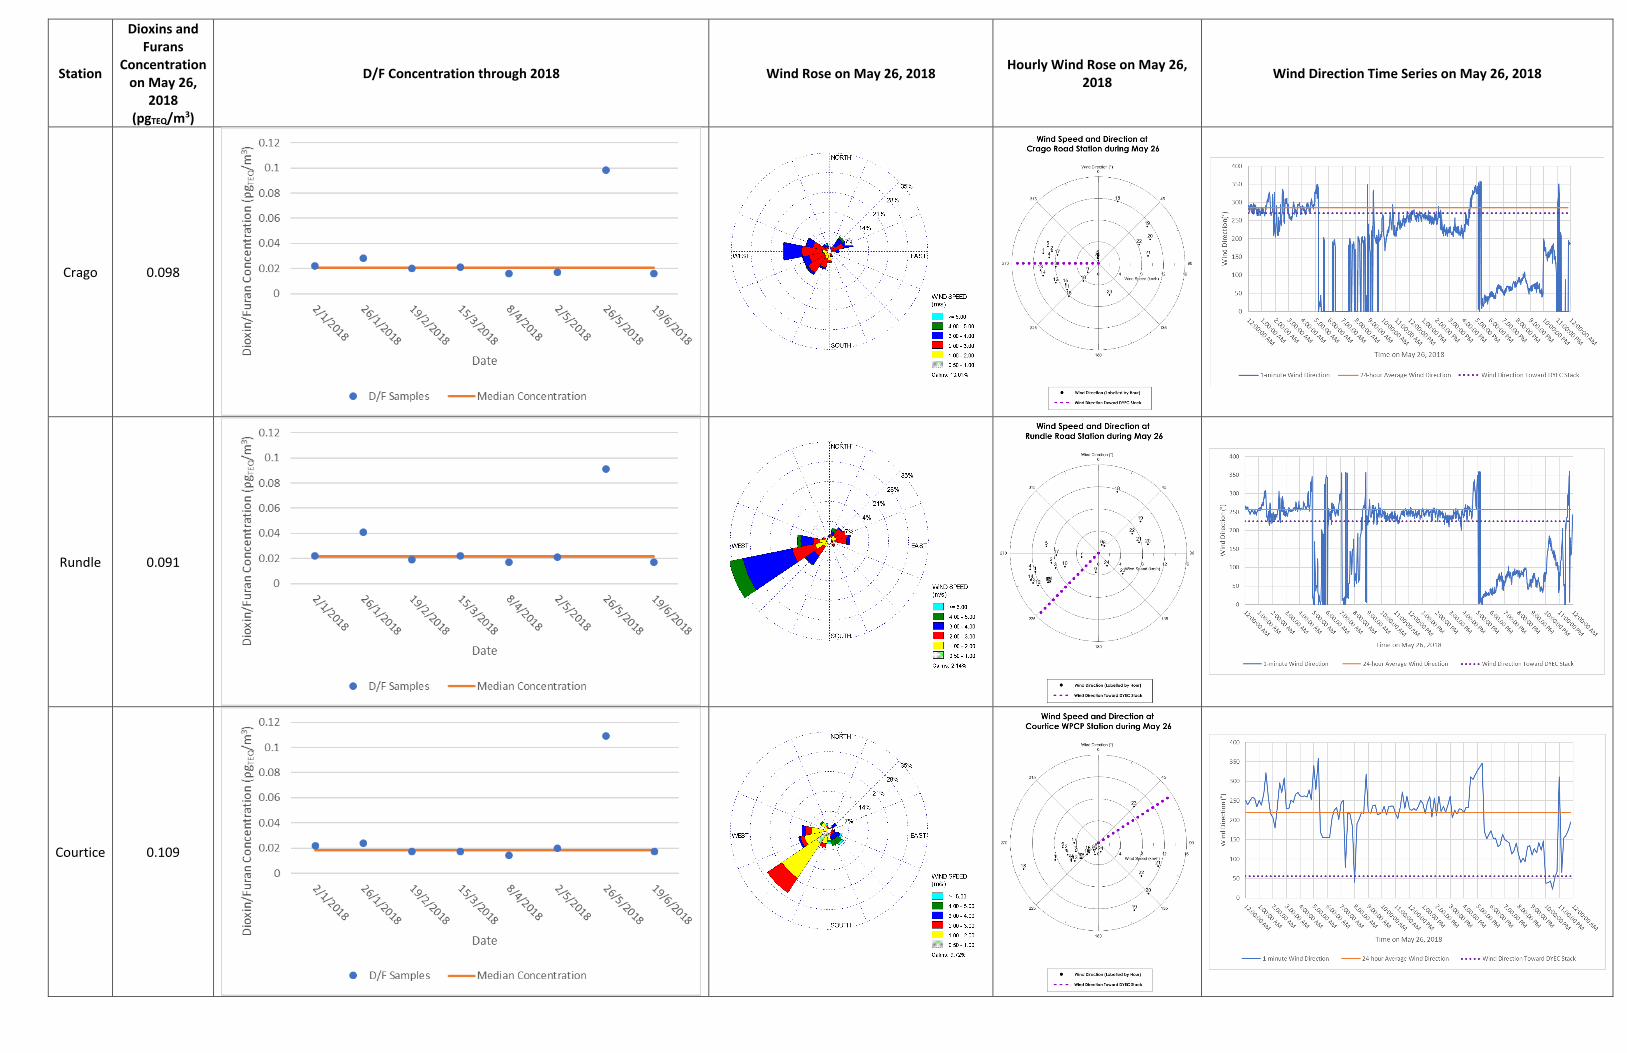
Station
Dioxins and Furans
Concentration on May 26,
2018 (pgTEQ/m3)
D/F Concentration through 2018 Wind Rose on May 26, 2018 Hourly Wind Rose on May 26, 2018 Wind Direction Time Series on May 26, 2018
Crago 0.098
Rundle 0.091
Courtice 0.109
![Notes on the Dynamics of Disorder On the ... - Gavin E. Crooks · Jarzynski equality: Jarzynski (1997)[50]. Crooks fluc-tuation theorem: Crooks (1999)[75]. Hatano-Sasa fluctuation](https://img.pdfslide.us/doc/110x75/60770f743369d13f85533931/notes-on-the-dynamics-of-disorder-on-the-gavin-e-crooks-jarzynski-equality.jpg)