Embed Size (px)
Citation preview

AusPAR Attachment 2
Extract from the Clinical Evaluation Report for Ertugliflozin
Proprietary Product Name: Steglatro
Sponsor: Merck Sharpe and Dohme (Australia) Pty Ltd.
Date of first round report: 14 September 2017 Date of second round report: 18 January 2018

Therapeutic Goods Administration
Submission PM-2017-001328-1-5 Extract from the Clinical Evaluation Report for Steglatro Attachment 2 PART 1 FINAL 31 January 2019
Page 2 of 121
About the Therapeutic Goods Administration (TGA) • The Therapeutic Goods Administration (TGA) is part of the Australian Government
Department of Health, and is responsible for regulating medicines and medical devices.
• The TGA administers the Therapeutic Goods Act 1989 (the Act), applying a risk management approach designed to ensure therapeutic goods supplied in Australia meet acceptable standards of quality, safety and efficacy (performance), when necessary.
• The work of the TGA is based on applying scientific and clinical expertise to decision-making, to ensure that the benefits to consumers outweigh any risks associated with the use of medicines and medical devices.
• The TGA relies on the public, healthcare professionals and industry to report problems with medicines or medical devices. TGA investigates reports received by it to determine any necessary regulatory action.
• To report a problem with a medicine or medical device, please see the information on the TGA website <https://www.tga.gov.au>.
About the Extract from the Clinical Evaluation Report • This document provides a more detailed evaluation of the clinical findings, extracted
from the Clinical Evaluation Report (CER) prepared by the TGA. This extract does not include sections from the CER regarding product documentation or post market activities.
• The words (Information redacted), where they appear in this document, indicate that confidential information has been deleted.
• For the most recent Product Information (PI), please refer to the TGA website <https://www.tga.gov.au/product-information-pi>.
Copyright © Commonwealth of Australia 2019 This work is copyright. You may reproduce the whole or part of this work in unaltered form for your own personal use or, if you are part of an organisation, for internal use within your organisation, but only if you or your organisation do not use the reproduction for any commercial purpose and retain this copyright notice and all disclaimer notices as part of that reproduction. Apart from rights to use as permitted by the Copyright Act 1968 or allowed by this copyright notice, all other rights are reserved and you are not allowed to reproduce the whole or any part of this work in any way (electronic or otherwise) without first being given specific written permission from the Commonwealth to do so. Requests and inquiries concerning reproduction and rights are to be sent to the TGA Copyright Officer, Therapeutic Goods Administration, PO Box 100, Woden ACT 2606 or emailed to <[email protected]>.

Therapeutic Goods Administration
Submission PM-2017-001328-1-5 Extract from the Clinical Evaluation Report for Steglatro Attachment 2 PART 1 FINAL 31 January 2019
Page 3 of 121
Contents List of common abbreviations_______________________________________________ 5
1. Submission details _____________________________________________________ 10
1.1. Submission Type ___________________________________________________________ 10
1.2. Drug class and therapeutic indication ___________________________________ 10
1.3. Dosage forms and strengths ______________________________________________ 10
1.4. Dosage and administration _______________________________________________ 10
2. Background _____________________________________________________________ 11
2.1. Information on the condition being treated _____________________________ 11
________________________________________________ 11
___________________________________________________________ 12
________________________________________________________________
_______________________________________________________ 13
______________________________________ 13
2.2. Current treatment options
2.3. Clinical rationale
2.4. Formulation 12
2.5. Related submissions
3. Contents of the clinical dossier 3.1. Scope of the clinical dossier _______________________________________________ 13
_____________________________________________________________ 14
______________________________________________________ 15
3.2. Paediatric data
3.3. Good clinical practice
3.4. Evaluator’s commentary on the clinical dossier ________________________ 15
4. Pharmacokinetics ______________________________________________________ 15
___________________________________________ 16
________________________________
_____________________________________________ 26
____________________________________________ 26
____________________________________________________ 30
________________________________
4.1. Studies providing pharmacokinetic information ________________________ 15
4.2. Summary of pharmacokinetics
4.3. Pharmacokinetics in the target population ______________________________ 20
4.4. Pharmacokinetics in special populations 21
4.5. Population pharmacokinetics
4.6. Pharmacokinetic interactions
4.7. Evaluator’s overall conclusions on pharmacokinetics __________________ 29
5. Pharmacodynamics 5.1. Studies providing pharmacodynamic information ______________________ 30
5.2. Summary of pharmacodynamics _________ 31
_________________________________________________ 31
______________________________________________ 38
5.3. Pharmacodynamic effects
5.4. Evaluator’s overall conclusions on pharmacodynamics ________________ 36
6. Dosage selection for the pivotal studies ___________________________ 386.1. Pharmacokinetics and pharmacodynamics: dose finding studies _____ 38
6.2. Phase II dose finding studies
6.3. Phase III pivotal studies investigating more than one dose regimen __ 39

Therapeutic Goods Administration
Submission PM-2017-001328-1-5 Extract from the Clinical Evaluation Report for Steglatro Attachment 2 PART 1 FINAL 31 January 2019
Page 4 of 121
6.4. Evaluator’s conclusions on dose finding for the pivotal studies _______ 39
_________________________________________________________ 40
___________________________________________ 41
7. Clinical efficacy 7.1. Studies providing evaluable efficacy data _______________________________ 40
7.2. Pivotal or main efficacy studies
The presentation of this clinical evaluation is continued in Attachment 2 PART 2 120
Therapeutic Goods Administration
Submission PM-2017-001328-1-5 Extract from the Clinical Evaluation Report for Steglatro Attachment 2 PART 1 FINAL 31 January 2019
Page 5 of 121
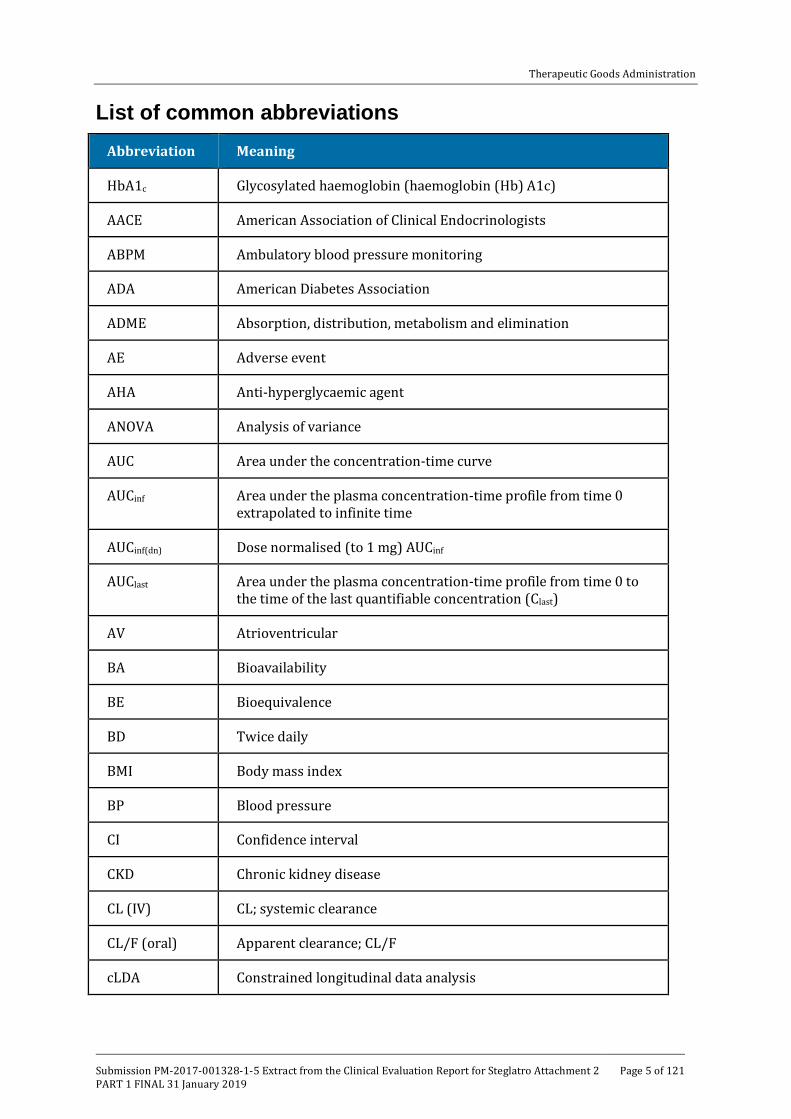
List of common abbreviations Abbreviation Meaning
HbA1c Glycosylated haemoglobin (haemoglobin (Hb) A1c)
AACE American Association of Clinical Endocrinologists
ABPM Ambulatory blood pressure monitoring
ADA American Diabetes Association
ADME Absorption, distribution, metabolism and elimination
AE Adverse event
AHA Anti-hyperglycaemic agent
ANOVA Analysis of variance
AUC Area under the concentration-time curve
AUCinf Area under the plasma concentration-time profile from time 0 extrapolated to infinite time
AUCinf(dn) Dose normalised (to 1 mg) AUCinf
AUClast Area under the plasma concentration-time profile from time 0 to the time of the last quantifiable concentration (Clast)
AV Atrioventricular
BA Bioavailability
BE Bioequivalence
BD Twice daily
BMI Body mass index
BP Blood pressure
CI Confidence interval
CKD Chronic kidney disease
CL (IV) CL; systemic clearance
CL/F (oral) Apparent clearance; CL/F
cLDA Constrained longitudinal data analysis

Therapeutic Goods Administration
Submission PM-2017-001328-1-5 Extract from the Clinical Evaluation Report for Steglatro Attachment 2 PART 1 FINAL 31 January 2019
Page 6 of 121
Abbreviation Meaning
CLr Renal clearance
Cmax Maximum observed plasma concentration
Cmin Lowest concentration observed during the dosing interval
CSR Clinical study report
CV Cardiovascular
CVOT Cardiovascular outcome trial
CYP Cytochrome P450
DBP Diastolic blood pressure
DDI Drug-drug interaction
DPP Dipeptidyl peptidase
E5/S100 Ertugliflozin 5 mg/sitagliptin 100 mg
E15/S100 Ertugliflozin 15 mg/ sitagliptin 100 mg
EASD European Association for the Study of Diabetes
ECG Electrocardiograph
ED50 Dose at half maximum effect
eGFR Estimated glomerular filtration rate
EMA European Medicines Agency
Ertu/Met ertugliflozin/metformin
ESRD End stage renal disease
EU European Union
F Bioavailability
FAS Full analysis set
FDA Food and Drug Administration
FDC Fixed-dose combination
FME Full model estimation

Therapeutic Goods Administration
Submission PM-2017-001328-1-5 Extract from the Clinical Evaluation Report for Steglatro Attachment 2 PART 1 FINAL 31 January 2019
Page 7 of 121
Abbreviation Meaning
FPG Fasting plasma glucose
GCP Good Clinical Practice
GIP Glucose-dependent insulinotropic polypeptide
GLP-1 Glucagon-like peptide-1
GMR Geometric mean ratio
h Hour(s)
HCTZ Hydrochlorothiazide
HDL-C High-density lipoprotein-cholesterol
hOAT-3 Human organic anion transporter-3
HPLC-MS/MS High-performance liquid chromatography tandem mass spectrometric
HTCZ Hydrochlorothiazide
LDA Longitudinal data analysis
LDL Low-density lipoprotein
LDL-C Low-density lipoprotein-cholesterol
LLOQ Lower limit of quantitation
L-PGA L-pyroglutamic acid
LS Least-squares
MACE Major adverse cardiovascular event
min Minute(s)
MR Modified release
MRI Magnetic Resonance Imaging
NONMEM Non-linear mixed effects modelling
NTX-1 N-terminal telopeptide-1
OAD Oral anti-diabetic
OC Osteocalcin

Therapeutic Goods Administration
Submission PM-2017-001328-1-5 Extract from the Clinical Evaluation Report for Steglatro Attachment 2 PART 1 FINAL 31 January 2019
Page 8 of 121
Abbreviation Meaning
P1NP Procollagen type 1 amino-terminal propeptide
PD Pharmacodynamics
PDLC Pre-defined limit of change
P-gp P-glycoprotein
PK Pharmacokinetic
PO Per os (oral)
popPK Population pharmacokinetic
PPAS Per protocol analysis set
PPG Post-prandial glucose
Q/F Apparent inter-compartmental clearance
QD Once daily
QT Time from the start of the Q wave to the end of the T wave
QTc QT interval corrected for heart rate
RAAS Renin-angiotensin-aldosterone system
Rac Observed accumulation ratio
RNA Ribonucleic acid
RTG Renal threshold for glucose
SA Specific activity
SAE Serious adverse event
SBP Systolic blood pressure
SD Standard deviation
SGLT1 Sodium-glucose co-transporter 1
SGLT2 Sodium glucose co-transporter 2
SOC System Organ Class
SU Sulfonylurea

Therapeutic Goods Administration
Submission PM-2017-001328-1-5 Extract from the Clinical Evaluation Report for Steglatro Attachment 2 PART 1 FINAL 31 January 2019
Page 9 of 121
Abbreviation Meaning
t1/2 Terminal half-life
T2DM Type 2 diabetes mellitus
TEAE Treatment-emergent adverse event
TECOS Trial Evaluating Cardiovascular Outcomes with Sitagliptin
Tmax Time for Cmax
UGE Urinary glucose excretion
UGE0-24 Cumulative urinary glucose excretion over 24 h
UGT Uridine 5’-diphospho-glucuronosyltransferase
UK United Kingdom
ULN Upper limit of normal
US United States
Vc/F Apparent Central Volume Of Distribution
Vz/F (oral) Apparent volume of distribution following oral administration
Therapeutic Goods Administration
Submission PM-2017-001328-1-5 Extract from the Clinical Evaluation Report for Steglatro Attachment 2 PART 1 FINAL 31 January 2019
Page 10 of 121
1. Submission details
1.1. Submission Type This is an application to register ertugliflozin film coated tablets (5 mg and 15 mg) for the treatment of type 2 Mellitus (T2DM).
1.2. Drug class and therapeutic indication Ertugliflozin is an oral, selective inhibitor of sodium glucose co-transporter-2 (SGLT2) which inhibits renal glucose reabsorption and results in urinary glucose excretion (UGE) and reductions in plasma glucose and haemoglobin A1c (HbA1c) in patients with T2DM. It possesses a high selectivity for SGLT2 versus SGLT1 and other glucose transporters (GLUT1-4).
The proposed indication is:
‘Steglatro (ertugliflozin) is indicated as an adjunct to diet and exercise to improve glycaemic control in adults with type 2 diabetes mellitus as monotherapy when metformin is considered inappropriate due to intolerance or in combination with other anti-hyperglycaemic agents.’
1.3. Dosage forms and strengths Steglatro 5 mg tablets are pink, triangular-shaped, film coated tablets debossed with ‘701’ on one side and plain on the other side. Available in aluminium/aluminium blister packs of 7 tablets (starter packs) and 28 tablets.
Steglatro 15 mg tablets are red, triangular-shaped, film coated tablets debossed with ‘702’ on one side and plain on the other side. Available in aluminium/aluminium blister packs of 7 tablets (starter pack) and 28 tablets.
1.4. Dosage and administration The following information was provided in the ‘Dosage and administration’ section of the proposed PI:
‘General: The recommended starting dose of Steglatro is 5 mg once daily, taken in the morning, with or without food. In patients tolerating Steglatro 5 mg once daily, the dose may be increased to 15 mg once daily if additional glycaemic control is needed. In patients with volume depletion, correcting this condition prior to initiation of Steglatro is recommended (see Precautions).
Renal Impairment: Assessment of renal function is recommended prior to initiation of Steglatro and periodically thereafter (see Precautions). Initiation of Steglatro is not recommended in patients with an eGFR less than 45 mL/min/1.73 m2 (see Precautions).
In patients with an eGFR of 45 to less than 60 mL/min/1.73 m2 and tolerating Steglatro 5 mg, titrate to Steglatro 15 mg once daily as 15 mg provided clinically meaningful reductions in HbA1c. Use of Steglatro is not recommended in patients with eGFR persistently less than 45 mL/min/1.73 m2.
Hepatic Impairment: No dosage adjustment of Steglatro is necessary in patients with mild or moderate hepatic impairment. Benefit-risk for the use of Steglatro in patients with severe hepatic impairment should be individually assessed since Steglatro has not been specifically studied in this population.

Therapeutic Goods Administration
Submission PM-2017-001328-1-5 Extract from the Clinical Evaluation Report for Steglatro Attachment 2 PART 1 FINAL 31 January 2019
Page 11 of 121
Paediatric Population: Safety and effectiveness of Steglatro in paediatric patients under 18 years of age have not been established.
Elderly: No dosage adjustment of Steglatro is recommended based on age.’
2. Background
2.1. Information on the condition being treated The increasing worldwide prevalence of T2DM, along with its microvascular and macrovascular complications, is a major health issue and poses an increasing burden to health care systems around the world. The worldwide prevalence of diabetes in adults is expected to increase from 8.8% in 2015 (approximately 415 million people) to an estimated 10.4% (642 million people) by 2040; this represents a 55% increase in the number of people with diabetes relative to 2015.1 There are 1.7 million Australians with diabetes (85% of these have T2DM).2 Type 2 diabetes is associated with reduced life expectancy, significant morbidity due to the specific diabetes related microvascular complications (retinopathy, nephropathy and neuropathy), and the increased risk of macrovascular complications (ischemic heart disease, stroke and peripheral vascular disease). The development of these complications impacts on quality of life.
Multiple pathophysiologic deficits contribute to hyperglycaemia in patients with T2DM. Insulin resistance in muscle and liver as well as beta-cell failure represent the core pathophysiologic defects in T2DM. Approximately 85% of patients with T2DM are obese or overweight, a key factor underlying the development and maintenance of insulin resistance. In addition to muscle and liver, the kidney also plays a key role in glucose homeostasis. Under normal physiologic conditions, the kidney reabsorbs all of the glucose from the glomerular filtrate, and returns it to the blood. The SGLT2 protein, which is primarily expressed in the renal proximal tubules, is responsible for approximately 90% of the reabsorption of glucose filtered through the glomerulus. Filtered glucose is completely reabsorbed until the transporters reach their maximum capacity, which is called the transport maximum for glucose. The plasma glucose concentration at which this occurs is referred to as the renal threshold for glucose (RTG). Above this threshold, UGE increases in proportion to plasma glucose concentrations. In healthy subjects, the RTG is approximately 180 mg/dL (10 mmol/L). Patients with diabetes have an increase in the RTG compared with healthy subjects such that glucosuria generally does not occur until plasma glucose values reach approximately 240 mg/dL (13.5mmol/L). Studies have shown that SGLT2 inhibitors lower the RTG, resulting in increased UGE, which is responsible for many of the pharmacodynamic (PD) effects seen with this class of agents. While SGLT2 inhibitors lower the RTG, the new RTG set point is above the usual threshold for hypoglycaemia suggesting that hypoglycaemia is unlikely with this mechanism.
2.2. Current treatment options Current guidelines from the American Diabetes Association (ADA), the European Association for the Study of Diabetes (EASD) and Diabetes Australia recommend a stepwise and individualised treatment approach to T2DM. These guidelines recommend metformin as the optimal first-line anti-hyperglycaemic agent (AHA), unless the patient has contraindications to metformin. Subsequently, if the HbA1c target is not achieved after approximately 3 months, therapy should be augmented to a 2-drug combination followed by the addition of other AHAs approximately every 3 months if the HbA1c goal is not achieved.
1 IDF Diabetes Atlas Group. Update of mortality attributable to diabetes for the IDF Diabetes Atlas: Estimates for the year 2013. Diabetes Res Clin Pract. 2015; 109:461-465. 2 www.diabetesaustralia.com.au

Therapeutic Goods Administration
Submission PM-2017-001328-1-5 Extract from the Clinical Evaluation Report for Steglatro Attachment 2 PART 1 FINAL 31 January 2019
Page 12 of 121
A number of systematic reviews have examined the relationship between blood glucose control and long term complications in people with T2DM. These studies concluded that improved glycaemic control can reduce retinopathy, renal disease and neuropathy in T2DM. Long term data from the United Kingdom Prospective Diabetes Study (UKPDS; Stratton, 2000) also suggests that glycaemic control reduces the risk of macrovascular complications of T2DM. Although pharmacological intervention, either in the form of a single agent or in combination, may provide effective glycaemic control for some patients, many do not achieve their target HbA1c levels, and glycaemic control deteriorates over time. The SGLT2 inhibitors are a new class of agents for T2DM therapy that have been shown to improve glycaemic control, reduce body weight, and lower blood pressure.
Agents of this class approved for use in Australia include empagliflozin (Jardiance, approved in April 2014), dapagliflozin (Forxiga in October, 2012) and canagliflozin (Invokana in September 2013). FDCs of empagliflozin with metformin (Jardiamet in July 2015) and dapagliflozin with metformin (Xigduo XR in July 2014) are also approved in Australia.
2.3. Clinical rationale Only about half of patients with T2DM achieve glycaemic control as per treatment guidelines despite the availability of a broad array of AHAs. Furthermore, while new classes of AHA medications have been introduced over the last decade, the percentage of patients reaching glycaemic targets has not improved (Stark, 2013).
Some of the factors contributing to the low attainment of HbA1c goals are (1) patients with T2DM exhibit declining beta-cell function, which influences disease progression and leads to elevated HbA1c levels over time; (2) increased body weight leads to worsening insulin resistance; and (3) several classes of anti-hyperglycaemic medications are associated with adverse reactions, including weight gain (which may further worsen underlying insulin resistance), hypoglycaemia, oedema or gastrointestinal effects, which often limit their use, (4) patient non-compliance.
The SGLT2 inhibitors are a new class of AHAs for T2DM therapy that when used as monotherapy or in combination with other AHAs are shown to improve glycaemic control, reduce body weight and lower blood pressure and also have tolerable safety profiles. SGLT2 inhibitors have low rates of hypoglycaemia when used as monotherapy or in combinations with agents not associated with hypoglycaemia (Cefalu, 2013). Due to the insulin-independent mechanism of action, SGLT2 inhibitors may also provide durable glycaemic efficacy. Data from the CV outcome trial (CVOT) with the SGLT2 inhibitor empagliflozin (Zinman, 2014), demonstrated a significant reduction in major adverse CV events (MACE), as well as significant reductions in CV death and hospitalisation for worsening heart failure (Fitchett, 2016).
2.4. Formulation 2.4.1. Formulation development
Comment: MSD-Ertugliflozin tablets contain the isolated form of the active ingredient ertugliflozin, which is a co-crystal comprising 1:1 ertugliflozin and L-pyroglutamic acid (L-PGA). Although the co-crystal was used throughout development, the drug load and dose strengths in the present submission are expressed as ertugliflozin free-form.
The proposed commercial formulation of ertugliflozin L-PGA is an orally administered, immediate-release (IR), film coated tablet which was manufactured using a direct compression process that are available in 5 mg and 15 mg strengths. A number of other formulations were used during early development, these included: extemporaneously prepared solution/suspension formulations, which were used in the single and multiple ascending dose

Therapeutic Goods Administration
Submission PM-2017-001328-1-5 Extract from the Clinical Evaluation Report for Steglatro Attachment 2 PART 1 FINAL 31 January 2019
Page 13 of 121
and 14C absorption, distribution, metabolism and elimination (ADME) Phase I studies; as well as uncoated 15 mg tablets, which contained amorphous ertugliflozin free-form and a 14C ertugliflozin solution for intravenous (IV) and oral administration. In addition, the Phase II studies and some early Phase I studies used uncoated tablets of 1 mg (using a blend containing 1% drug load), and 5 mg and 25 mg (using a common blend containing 5% drug load) dose strengths prepared by dry granulation. The tablets used in the Phase III studies and later Phase I studies were white, film coated tablets manufactured from a common blend containing 5% drug load using a direct compression process. The Phase III studies used 5 mg and 10 mg tablets, and the later Phase I studies used the 2.5 mg, 5 mg and 10 mg tablets.
The proposed 5 mg and 15 mg commercial tablets are made from a common blend and use the same composition as the Phase III formulation for tablet cores. The pink and red film coats used for the 5 mg and 15 mg commercial tablets are the same as the white film coat used in Phase III tablets except for the addition of iron oxide colorant, and subsequent adjustment of titanium dioxide level. The 5 mg commercial tablet is presented as a triangular, pink film coated tablet debossed with ‘701’ on one side. The 15 mg commercial tablet is presented as a triangular, red film coated tablet debossed with ‘702’ on one side.
2.5. Related submissions Concurrent applications are being made for two new fixed-dose combinations (FDCs): ertugliflozin/sitagliptin film coated tablets (Steglujan; submission PM-2017-1329-1-5) and ertugliflozin/metformin film coated tablets (Segluromet; submission PM-2017-1330-1-5).
Metformin and sitagliptin are approved for treatment of T2DM in Australia; they are both approved for monotherapy and in combination with other AHAs.
2.5.1. Evaluator’s commentary on the background information
Evaluation of background information did not raise any concerns. The stated clinical rationale is valid and acceptable.
3. Contents of the clinical dossier
3.1. Scope of the clinical dossier The ertugliflozin clinical development program is intended to support the approval of ertugliflozin as a stand-alone product, as well as the ertugliflozin/metformin and ertugliflozin/sitagliptin FDCs, and consists of 29 Phase I studies, 2 Phase II studies, and 9 Phase III studies.
3.1.1. Clinical Pharmacology
There are 24 studies related to the PK/PDs of ertugliflozin. Of these, 19 contain PK data and 10 contain data related to the PDs of ertugliflozin; however, one study, P039/1005 examined the comparative bioavailability (BA) of 3 modified release (MR) formulations of ertugliflozin and as a request for approval of these formulations is not contained in the present application and they were not used in any other trials this study will not be discussed in either the PK or PD sections of this report. One of the dedicated PK studies, Study PMAR-EQDD-B152a-DP4-403, represented a population PK (popPK) analysis, whereas 3 of the PD studies (PMAR-EQDD-B152c-DP4-444, PMAR-EQDD-B152a-DP4-407 and ASR-EQDD-B152a-DP3-253), represented either population PD or dose-response analyses. All Phase I studies in support of this submission are complete.

Therapeutic Goods Administration
Submission PM-2017-001328-1-5 Extract from the Clinical Evaluation Report for Steglatro Attachment 2 PART 1 FINAL 31 January 2019
Page 14 of 121
3.1.2. Efficacy and safety
3.1.2.1. Pivotal Phase III studies
One monotherapy, 5 combination therapy and 1 Phase III study in patients with moderate renal impairment (see table below).
Table 1: Overview of Phase III studies contributing to efficacy
3.1.2.2. Other studies
Phase II dose-finding studies: Studies P042/1004 and P016/1006
Integrated summary of efficacy and safety; Phase I and 2 Safety analyses
Comment: The Phase III studies investigated ertugliflozin as monotherapy or in combination with other AHAs across a broad and diverse population of subjects with T2DM. However, recruitment in 2 of the 9 Phase III Studies (a CVOT study (Study P004/1021) and an Asia Pacific regional study (Study P012/1045)) are ongoing and limited (CVOT) or no data (Asia Pacific) from these studies are currently available. These studies will remain blinded until its completion according to agreement with the US Food and Drug Administration (FDA) and the European Medicines Agency (EMA). Neither the detailed results of the CV meta-analysis report nor any other results from the CVOT study have been included in this submission. The CVOT study is estimated to complete in 2019, with the exact timing dependent on the accrual of CV events.
3.2. Paediatric data There is no paediatric data in the current submission. The sponsors have submitted a PIP (Paediatric investigation plan) in the EU and the date on which the sponsors are first required to submit a report of a study conducted as part of the PIP is September 2026.

Therapeutic Goods Administration
Submission PM-2017-001328-1-5 Extract from the Clinical Evaluation Report for Steglatro Attachment 2 PART 1 FINAL 31 January 2019
Page 15 of 121
3.3. Good clinical practice Studies comprising the ertugliflozin clinical development program were conducted in accordance with Guidelines for Good Clinical Practice (GCP) and the Declaration of Helsinki.
3.4. Evaluator’s commentary on the clinical dossier The submission was well presented. There were some limitations of the PK/PD studies as well as the efficacy and safety studies (summarised in relevant sections below).
4. Pharmacokinetics
4.1. Studies providing pharmacokinetic information Table 2: Submitted pharmacokinetic studies
PK topic Subtopic Study ID *
PK in healthy adults
BE P023/1037
BE of the ertugliflozin 15 mg commercial image tablet and the 15 mg ertugliflozin dose studied in Phase III
BA P020/1043
Absolute BA of ertugliflozin
BA/BE P011/1034
Relative BA of ertugliflozin when administered as a tablet containing amorphous form versus tablets containing co-crystal
Food P024/1048
The effect of food on the PKs of ertugliflozin 15 mg commercial image tablet.
Escalating Single dose
P036/1001
Ertugliflozin PKs following single oral doses ranging from 0.5- to 300-mg
P037/1002
PKs of ertugliflozin and its metabolite M2
Mass balance P038/1003
Rate and extent of excretion of total radioactivity in urine and faeces, following a single oral dose of 25 mg (14C)ertugliflozin
Effect of timing of doses
P035/1051
Equivalence of exposure following daily dosing with 5 mg QD versus BD.
PK in special populations
Target population§
P040/1007
Ertugliflozin PKs following administration QD and BD in adults with T2DM; and to investigate the relationship between plasma concentrations and PD.

Therapeutic Goods Administration
Submission PM-2017-001328-1-5 Extract from the Clinical Evaluation Report for Steglatro Attachment 2 PART 1 FINAL 31 January 2019
Page 16 of 121
PK topic Subtopic Study ID *
Hepatic impairment
P014/1024
Effect of moderate hepatic impairment on the ertugliflozin PKs following a single oral dose of 15 mg.
Renal impairment
P009/1023
Effect of renal impairment on ertugliflozin PKs and PDs following a single oral dose of 15 mg.
Other special population
P041/1009
Comparison of ertugliflozin PKs and PDs following single and multiple doses in healthy Japanese and Westerners.
PK interactions
Metformin P019/1032
Effect of 1000 mg metformin on the PKs of a 15 mg dose of ertugliflozin
Sitagliptin P022/1033
Effect of 100 mg sitagliptin on the PKs of a 15 mg dose of ertugliflozin
Simvastatin P030/1036
Effect of 40 mg simvastatin on the PKs of a 15 mg dose of ertugliflozin
Rifampin? P021/1040
Effect of steady-state rifampin? on the PKs of a single 15 mg dose of ertugliflozin
Glimepiride P032/1044
Effect of 1mg glimepiride on the PKs of 15 mg ertugliflozin
Population PK analyses
Healthy and target pop
PMAR-EQDD-B152a-DP4-403
To describe the structural PK model and quantify the population variability in ertugliflozin PKs
* Indicates the primary PK aim of the study. † Bioequivalence of different formulations. § Subjects who would be eligible to receive the drug if approved for the proposed indication.
Table 3: Pharmacokinetic results excluded from consideration
Study ID Subtopics PK results excluded
P039/1005 Bioavailability/ Bioequivalence
Relative BA of modified release formulations of ertugliflozin that are not part of the current marketing application and were not used in any other clinical studies that form a part of this application.
4.2. Summary of pharmacokinetics 4.2.1. Pharmacokinetics in healthy subjects
Plasma concentrations of ertugliflozin were determined using validated, sensitive and specific HPLC-MS/MS methods with a lower limit of quantification (LLOQ) ranging from 0.020 to 0.50 ng/mL.
Therapeutic Goods Administration
Submission PM-2017-001328-1-5 Extract from the Clinical Evaluation Report for Steglatro Attachment 2 PART 1 FINAL 31 January 2019
Page 17 of 121
4.2.2. Absorption
4.2.2.1. Sites and mechanism of absorption
The proposed commercial formulation of MSD-ertugliflozin is an orally administered, IR, film coated tablet, which is provided in 5 mg and 15 mg tablet strengths. Following administration of a single oral 15 mg dose of the commercial image tablet or the ertugliflozin Phase III form under fasted conditions, the median Tmax occurred 1 h after dosing for both treatments and the mean t1/2 values ranged from 12.18 h to 12.58 h.
1.1.1.1 Bioavailability
4.2.2.2. Absolute bioavailability
Study P020/1043 examined the absolute oral bioavailability (F) of ertugliflozin by comparing the PKs of ertugliflozin following a single 15 mg oral dose of unlabelled ertugliflozin (amorphous) and a single 100 µg IV dose of 14C-ertugliflozin, which contained approximately 400 nCi of 14C and was administered as an infusion, in eight White males. The results indicated that the ratio (PO/IV) of adjusted geometric mean (GMR) AUCinf(dn) values (that is, F) was 104.7% (90% CI: 101.6%, 107.9%).
4.2.2.3. Bioavailability relative to an oral solution or micronised suspension
Not applicable.
4.2.2.4. Bioequivalence of clinical trial and market formulations
Study P023/1037 examined the bioequivalence of the ertugliflozin 15 mg commercial image tablet and the ertugliflozin Phase III, 15 mg dose (administered as one 10 mg tablet + one 5 mg tablet) under fasted conditions. The results indicated that the two formulations were bioequivalent as the 90% CIs for the ratios for Tmax, AUCinf and AUClast all fell within the (80%, 125%) acceptance range for bioequivalence.
Study P011/1034 estimated the relative bioavailability of ertugliflozin when administered as an uncoated 15 mg tablet, which contained amorphous ertugliflozin free form and a tablet containing co-crystal that was used during the Phase III studies, under fasted conditions. Although slightly different in terms of median Tmax, that is, 1 h verses 1.5 h, the results indicated that the two tablets were bioequivalent in regards to their AUC and Tmax as the GMR (90% CI) values were 98.70% (95.44%, 102.06%) and 98.32% (92.23%, 104.81%), respectively, for the amorphous form relative to the co-crystal and thus the 90% CIs were also wholly contained within the acceptance range for bioequivalence (that is, 80% to 125%).
4.2.2.5. Bioequivalence of different dosage forms and strengths
Not applicable.
4.2.2.6. Bioequivalence to relevant registered products
Not applicable.
4.2.2.7. Influence of food
The effect of food (high fat, high calorie breakfast) on ertugliflozin PKs was evaluated in two studies. The first of these, Study P024/1048, was undertaken using the 15 mg commercial image tablet and indicated that food had no meaningful effect on AUCinf (90% CI for the GMR: 88.0 to 95.4), whereas, Tmax was reduced by approximately 29% compared to the fasted condition. This decrease in ertugliflozin Tmax with food is unlikely to be clinically relevant.
Comment: These results justify proposed dosing of ertugliflozin with or without food. Ertugliflozin was administered at same time in mornings in all Phase III studies. This is similar to the proposed dosing in the PI which also recommends once daily dosing in the morning, with or without food.’

Therapeutic Goods Administration
Submission PM-2017-001328-1-5 Extract from the Clinical Evaluation Report for Steglatro Attachment 2 PART 1 FINAL 31 January 2019
Page 18 of 121
The second study, Study P036/1001, examined the effect of food on the PKs of a 100 mg dose of the suspension formulation. For this formulation, compared to the fasted condition, food resulted in delayed Tmax (median 2.5 h) and lower peak exposure (Tmax decreased by 54%) while total exposure, as measured by AUCinf, decreased by 18%.
4.2.2.8. Dose proportionality
Study P036/1001 also examined the PKs of ertugliflozin following escalating single oral doses under fasted conditions. The results indicated that following administration of single 0.5 to 300 mg doses, peak concentrations were observed at 1 h post-dose. Tmax and AUCinf increased proportionally with increasing dose. Terminal t1/2 values were reasonably consistent across all doses, with arithmetic mean values ranging from 11 to 17 h and the variability in ertugliflozin exposure was less than 25% across all doses.
4.2.2.9. Bioavailability during multiple-dosing
Study P037/1002 characterised the PKs of ertugliflozin following administration of once-daily (QD) doses ranging from 1mg to 100 mg for 14 days in otherwise healthy overweight or obese subjects. In this study, the 1 mg doses were administered as a solution, whereas, the 5, 25, and 100 mg doses were administered as a suspension. Following 14 days of treatment, median Tmax ranged from 1.5 to 2 h and mean t1/2 ranged from 12.3 to 14.8 h. Mean Tmax and AUCτ values increased proportionally with dose over the 100-fold dose range examined and the relative accumulation ratios following 14 days dosing compared to a single dose for the 1 mg, 5 mg, 25 mg and 100 mg doses were, 1.36, 1.25, 1.22 and 1.38, respectively.
4.2.2.10. Effect of administration timing
Study P035/1051 compared the PKs of ertugliflozin following 6 days dosing with either 5 mg QD or 2.5 mg BD and 15 mg QD or 7.5 mg BD in 70 healthy subjects. Following 6 days of treatment, the mean AUC24 was similar for both BD and QD treatments, whereas, the mean Tmax after the morning dose was higher for the QD treatment than that for the BD treatment. Similar results were observed following oral administration of ertugliflozin 7.5 mg BD or 15 mg QD for 6 days. The GMRs (BD/QD) of ertugliflozin AUC24 were 100.78% (98.76%, 102.83%) for comparison between 2.5 mg BD versus 5 mg QD, and 99.73% (97.08%, 102.45%) for comparison between 7.5 mg BD versus 15 mg QD, respectively.
1.1.1.2 Distribution
4.2.2.11. Volume of distribution
The apparent volume of distribution following oral administration (Vz/F) of a 15 mg dose (administered as three 5 mg tablets) of unlabelled ertugliflozin was 215.3 L. A second study provided an estimate of the Vz/F in healthy subjects of 304.5 L.
4.2.2.12. Plasma protein binding
In healthy subjects, Study P009/1023 the mean fraction unbound for ertugliflozin was 0.035, indicating that protein binding was high. This result was supported by in vitro studies which indicated that at a concentration of 2.3 µM (that is, 1.0 µg/mL), 93.6% of ertugliflozin was bound to plasma proteins (that is, the mean fraction unbound was 0.064).
4.2.2.13. Erythrocyte distribution
In human whole blood, ertugliflozin distributed preferentially into plasma relative to red blood cells with a blood-to-plasma concentration ratio of 0.66.
4.2.2.14. Tissue distribution
Although plasma protein binding is high, the volume of distribution would indicate that there is some level of ertugliflozin distribution to the tissues.
Therapeutic Goods Administration
Submission PM-2017-001328-1-5 Extract from the Clinical Evaluation Report for Steglatro Attachment 2 PART 1 FINAL 31 January 2019
Page 19 of 121
1.1.1.3 Metabolism
4.2.2.15. Interconversion between enantiomers
Not applicable.
4.2.2.16. Sites of metabolism and mechanisms / enzyme systems involved
In the mass balance study, Study P038/1003, 8 metabolites were detected by HPLC analysis, all of which had been previously identified in non-clinical species. Ertugliflozin underwent minimal phase I metabolism and the major metabolic pathway was via glucuronidation, which occurred on the hydroxyl groups of the modified glucose moiety of ertugliflozin and its des-ethyl metabolite, M2. Glucuronides were primarily excreted in urine. Isomeric glucuronides of ertugliflozin, that is, M5a, M5b, M5c, and those of M2, that is, M6a and M6b, were the major radioactivity constituents in urine. Collectively, they accounted for 43.9% of the administered dose, and 87.8% of radioactivity excreted in urine. Glucuronides M5a, M5b, M5c, and M6a were also the major circulating metabolites, representing 12.2%, 4.1%, 24.1%, and 6.0% of total radioactivity in plasma, respectively.
4.2.2.17. Non-renal clearance
Following an oral dose of 25 mg (14C) ertugliflozin as a suspension (100 µCi) 40.9±7.1% of radioactivity was recovered in the faeces (P038/1003). The excretion of radioactivity in faeces was prolonged due to irregular bowel movements observed in some subjects. At 24, 48, 72, and 96 h post-dose, the mean ± SD cumulative recovery was 4.5±9.8%, 11.4±16.7%, 20.9±17.8%, and 28.3±17.5%, respectively, which accounted for approximately 11%, 28%, 51%, and 69% of radioactivity recovered in faeces, respectively.
4.2.2.18. Metabolites identified in humans: active and other
The two primary circulating glucuronide metabolites, M5c (PF-06481944), and M5a (PF-06685948) were identified as being pharmacologically inactive at clinically relevant concentrations. For further information refer to the preceding section of this report entitled ‘Sites of metabolism and mechanisms / enzyme systems involved’.
4.2.2.19. Pharmacokinetics of metabolites
Study P037/1002 compared the PKs of ertugliflozin and its metabolite PF-05217539 (also known as M2) following single and multiple QD doses of 1 to 100 mg ertugliflozin. Based on the GMR of AUCτ values on Day 14, total plasma PF-05217539 exposure represented less than 2% of that for the parent compound.
4.2.2.20. Consequences of genetic polymorphism
Not examined.
1.1.1.4 Excretion
4.2.2.21. Routes and mechanisms of excretion
The total recovery of administered radioactivity ranged from 83.7% to 96.6%. The mean ± SD total recovery of radioactivity for all subjects was 91.0±4.6%, 40.9±7.1% of which was recovered in faeces and 50.2±10.1% in urine.
4.2.2.22. Mass balance studies
Peak concentrations of ertugliflozin and total radioactivity in plasma generally occurred 1 h after oral dosing. The t1/2 was the same for ertugliflozin and total radioactivity, averaging approximately 17 h. Geometric mean Tmax and AUCinf values were approximately 1.5 fold and 2.3 fold higher, respectively, for total radioactivity than for ertugliflozin, suggesting that the parent ertugliflozin accounted for approximately 50% of the circulating radioactivity.

Therapeutic Goods Administration
Submission PM-2017-001328-1-5 Extract from the Clinical Evaluation Report for Steglatro Attachment 2 PART 1 FINAL 31 January 2019
Page 20 of 121
4.2.2.23. Renal clearance
Approximately 50% of a 25 mg oral dose of (14C) ertugliflozin suspension (100 µCi) was recovered in the urine. The excretion of radioactivity in urine was rapid; at 24 h post-dose, the mean cumulative recovery was 40.0±7.0%, accounting for approximately 80% of total radioactivity recovered in urine; at 48 h post-dose, the mean cumulative recovery was 46.1±8.7%, accounting for approximately 92% of total radioactivity recovered in urine.
1.1.1.5 Intra and inter individual variability of pharmacokinetics
The PopPK analysis, PMAR-EQDD-B152a-DP4-403 provided an estimate of the inter-individual variance on CL/F expressed as %CV of 32%. Residual error estimates were 38.7% for the Phase I studies and 83.6% for the Phase II and III studies.
4.3. Pharmacokinetics in the target population Two Phase II studies, Studies P042/1004 and P016/1006 examined ertugliflozin trough concentrations at various time points following 4 and 12 weeks of treatment, respectively, with a range of QD doses in subjects with T2DM. In Study P042/1004 ertugliflozin doses of 1 mg, 5 mg or 25 mg were administered to 193 subjects with T2DM and inadequate glycaemic and blood pressure control. The results indicated that in this population ertugliflozin trough concentrations increased proportionally with increasing dose and appeared to be stable over 4 weeks of dosing (Table 4). For instance, following QD dosing with 1 mg, 5 mg and 25 mg ertugliflozin for 4 weeks the median trough concentrations were 0.94, 3.71 and 22.35 ng/mL respectively, whereas, the trough concentrations were 4.02 and 3.71 ng/mL following 1 and 4 weeks of QD dosing with 5 mg, respectively.
Table 4: Study P042/1004 Summary of Plasma ertugliflozin trough concentrations (ng/mL) by Visit
4.3.1. Study P016/1006
Study P016/1006 examined ertugliflozin trough levels following QD doses of 1 mg, 5 mg, 10 mg and 25 mg ertugliflozin in subjects with inadequately controlled T2DM who were receiving stable doses of metformin. As in the preceding study, ertugliflozin concentrations increased

Therapeutic Goods Administration
Submission PM-2017-001328-1-5 Extract from the Clinical Evaluation Report for Steglatro Attachment 2 PART 1 FINAL 31 January 2019
Page 21 of 121
proportionally with increasing dose and appeared to be stable over the multiple weeks of dosing (Table 5). For instance, following QD dosing with 1 mg, 5 mg, 10 mg and 25 mg ertugliflozin for 12 weeks in patients also receiving stable doses of metformin the median trough concentrations of ertugliflozin were 0.84, 4.37, 9.69 and 24.2 ng/mL respectively, whereas, the trough concentrations were 5.86 and 4.37 ng/mL, following 2 and 12 weeks of QD dosing with 5 mg, respectively.
Table 5: Study P016/1006 Summary of ertugliflozin pharmacokinetic concentrations (ng/ml) versus time
Comment: It is important to note that none of the above Phase II dose-ranging studies
evaluated the proposed 15 mg dose of ertugliflozin.
4.3.2. Study P040/1007
Study P040/1007 assessed the PK of ertugliflozin following administration of 1 mg or 2 mg twice-daily (BD) and 2 mg BD or 4 mg QD in 52 adults with T2DM. Following BD administration, Tmax generally occurred after the second dose, with a median value of 6 h compared to 1 h for QD dosing. Tmax for BD dosing was approximately 30% lower than that observed following the QD dose. However, total ertugliflozin exposure following BD and QD dose was comparable, as supported by nearly identical geometric mean AUClast values for equivalent total doses. For instance, for the 2 mg BD and 4 mg QD doses the AUCt values were 272 ng.h/mL and 270.5 ng.h/mL, respectively.
Comment: This study in T2DM did not evaluate the proposed daily doses of 5 mg and 15 mg. However, no difference between once daily (5 mg and 15 mg QD) and twice daily (2.5 mg bd and 7.5 mg bd) dosing was observed in Study P035/1051 in healthy subjects.
4.4. Pharmacokinetics in special populations 4.4.1. Pharmacokinetics in subjects with impaired hepatic function
Study P014/1024 compared the PKs following a single oral dose of ertugliflozin 15 mg in healthy subjects and in subjects with moderate hepatic impairment under fasted conditions. Under these conditions the GMRs (90% CI) for AUCinf, Tmax, and AUClast in subjects with moderate hepatic impairment compared to subjects with normal hepatic function were 87.43% (68.11%,

Therapeutic Goods Administration
Submission PM-2017-001328-1-5 Extract from the Clinical Evaluation Report for Steglatro Attachment 2 PART 1 FINAL 31 January 2019
Page 22 of 121
112.22%), 78.70% (65.74%, 94.23%) and 87.31 (68.01%, 112.08%), respectively. Ertugliflozin Tmax ranged from 1.00-1.25 h for subjects with moderate hepatic impairment and for normal subjects and the estimates of mean t1/2 were similar (14.6 versus 13.8 h) (Table 6). Inter-subject variability was greater in subjects with moderate hepatic impairment as the %CV for AUC and Tmax were 39% and 27%, respectively, compared to 14% and 11%, respectively for normal subjects. In addition, the levels of ertugliflozin unbound in plasma were similar in both groups of subjects (that is, 3 to 4%) and the CL/F for unbound ertugliflozin was 4702 and 4512 mL/min for subjects with moderate hepatic impairment and subjects with normal hepatic function, respectively. Although there was little change in ertugliflozin exposure between the two groups, plasma levels of the M5c metabolite were approximately 1.46-fold higher (based on AUCinf; Table 7), whereas, plasma levels of the M5a metabolite were approximately 1.36-fold lower (Table 8). Plasma protein binding was unaffected in patients with moderate hepatic impairment.
Table 6: Study P014/1024; Summary of plasma and urine ertugliflozin pharmacokinetic parameter values following single oral doses of ertugliflozin 15 mg
Table 7: Study P014/1024; Summary of plasma and urine PF-06481944 pharmacokinetic parameter values following single oral doses of ertugliflozin 15 mg

Therapeutic Goods Administration
Submission PM-2017-001328-1-5 Extract from the Clinical Evaluation Report for Steglatro Attachment 2 PART 1 FINAL 31 January 2019
Page 23 of 121
Table 8: Study P014/1024; Summary of plasma and urine PF-06685948 pharmacokinetic parameter values following single oral doses of ertugliflozin 15 mg
Comment: The small decreases in ertugliflozin exposure associated with moderate hepatic
impairment are unlikely to be clinically relevant. However, the PKs of ertugliflozin were not evaluated in patients with severe hepatic impairment.
1.1.1.6 Pharmacokinetics in subjects with impaired renal function
Study P009/1023 compared the effect of renal impairment and T2DM on ertugliflozin PKs following a single dose of 15 mg ertugliflozin in healthy subjects with normal renal function and subjects with T2DM and normal renal function or mild, moderate or severe renal impairment. In subjects with normal renal function, either healthy or with T2DM, the AUC values for ertugliflozin were similar (1189 and 1222 ng.h/mL, respectively, Table 9), whereas, based on the log-linear regression analysis of AUCinf and BSA-un-normalised eGFR for all subjects, the predicted mean AUCinf values for mild (eGFR = 75 mL/min), moderate (eGFR = 45 mL/min) and severe (eGFR = 15 mL/min) renal impairment in subjects with T2DM were 1585 ng.h/mL, 1875 ng.h/mL and 2219 ng.h/mL, respectively, which are approximately 1.2, 1.4 and 1.7-fold higher than AUCinf values in subjects with normal renal function (pooled mean 1340 ng.h/mL; eGFR = 105 mL/min). Log-linear regression of CL/F versus BSA-unnormalised eGFR showed a corresponding decrease in CL/F with declining renal function. Plasma protein binding was unaffected in patients with renal impairment.

Therapeutic Goods Administration
Submission PM-2017-001328-1-5 Extract from the Clinical Evaluation Report for Steglatro Attachment 2 PART 1 FINAL 31 January 2019
Page 24 of 121
Table 9: Study P009/1023; Descriptive summary of ertugliflozin pharmacokinetic parameter values
4.4.2. Pharmacokinetics according to age
Please refer to the section of this report that describes the PopPK analysis below.
1.1.1.7 Pharmacokinetics related to genetic factors
Study P041/1009 compared the PKs following single doses of 1 mg, 5 mg and 25 mg ertugliflozin in 9 Japanese and 6 Western males and examined ertugliflozin PKs following multiple doses of 25 mg QD in Japanese subjects. Following a single oral dose of ertugliflozin under fasted conditions, absorption of ertugliflozin was rapid with Tmax occurring between 1.0 and 1.5 h in both the Japanese and Western subjects (Table 10). Following attainment of Tmax, plasma concentrations of ertugliflozin declined in a biphasic manner over time with mean t1/2 values ranging from 12.4 to 13.6 h in Japanese and 10.7 h in Western subjects, which appeared independent of doses. Ertugliflozin Tmax and AUClast increased dose-proportionally in both populations. Overall, the GMRs for AUClast and AUCinf ranged from 90.32% to 99.66% and 91.05% to 98.94%, respectively, suggesting that AUClast and AUCinf values were similar between the 2 populations (Table 11). Following multiple oral doses of ertugliflozin, the Tmax of ertugliflozin occurred at approximately 2.50 h post-dose on both Day 1 and Day 7 (Table 12). The geometric mean observed accumulation ratio was 1.11, suggesting minimal accumulation after multiple dose administration.

Therapeutic Goods Administration
Submission PM-2017-001328-1-5 Extract from the Clinical Evaluation Report for Steglatro Attachment 2 PART 1 FINAL 31 January 2019
Page 25 of 121
Table 10: Study P041/1009: Summary of ertugliflozin pharmacokinetic parameters in Japanese and Western healthy subjects following single oral doses in Cohort A
Table 11: Study P041/1009: Statistical summary of ertugliflozin exposure comparison between Japanese and Western healthy subjects in Cohort A
Table 12: Study P041/1009 Summary of ertugliflozin pharmacokinetic parameter values following multiple doses with ertugliflozin in Cohort B
Therapeutic Goods Administration
Submission PM-2017-001328-1-5 Extract from the Clinical Evaluation Report for Steglatro Attachment 2 PART 1 FINAL 31 January 2019
Page 26 of 121
4.4.3. Pharmacokinetics in other special population / with other population characteristic
Please refer to the section of this report that describes the PopPK analysis below.
4.5. Population pharmacokinetics 4.5.1. PopPK analysis ID
Study PMAR-EQDD-B152a-DP4-403 represented a PopPK analysis, which was based on the results of 13691 PK observations from 2276 subjects who were enrolled in 15 clinical studies (nine Phase I, two Phase II, and four Phase III studies). As initial analysis suggested that ertugliflozin was rapidly absorbed and concentration levels in plasma were characterised by a biphasic decline, a 2 compartment model with lag time, first-order absorption, and first-order elimination was used to fit the observed data in terms of the following parameters: CL/F, Q/F, Vc/F, Vp/F, ka, and ALAG1. Inter-individual variance was included on CL/F. The effect of baseline body weight was included on CL/F, Vc/F, Vp/F, and Q/F as an allometric relationship, with the exponent fixed to 0.75 and 1.0 for apparent clearances and volumes, respectively. The effect of food (fed and without regard to food) was included on the ka and on F1.
Based upon the Phase II and III demographics for this dataset, the typical T2DM patient was defined as a 58-year old, white male with a baseline body weight of 85.3 kg, an eGFR of 85.0 mL/min/1.73 m2, who was taking ertugliflozin without regard to food. For a reference subject the population estimates (95% CI) of the CL/F, Vc/F, Vp/F, Q/F and ka for ertugliflozin were 12.0 L/h (11.5,12.5), 6.54 L (5.17,8.48), 107 L (102, 113), 7.77 L/h (7.00, 8.67) and 0.329 h-1 (0.303, 0.364), respectively.
A number of significant covariates were identified for CL/F, including baseline bodyweight, eGFR, T2DM status, gender and Asian race. However, as the maximum % change in CL/F attained at the fifth and ninth percentiles of the population estimates for any one of these parameters was 56%, the effects of any one of these parameters were not considered to be clinically relevant. Similarly, a number of significant covariates, including body weight, eGFR, T2DM status, gender and Asian race, were identified for AUCt; however, as for CL/F, the magnitude of the changes induced by any one of the covariates were not considered to be clinically relevant, as were the changes induced by the significant covariates of ka and relative bioavailability. For the apparent central volume of distribution, significant covariates included body weight, gender and Asian race; however, only the effects of Asian race can be considered clinically significant as Vc/F was increased by 112% in Asian subjects relative to White subjects.
4.6. Pharmacokinetic interactions 4.6.1. DDI between ertugliflozin and metformin
Study P019/1032 examined the potential for a DDI between a single dose of 15 mg ertugliflozin and 1000 mg metformin in healthy volunteers. Metformin is a first line therapy used in the treatment of T2DM, which, primarily acts by decreasing hepatic gluconeogenesis. It is not metabolised and therefore it is cleared via tubular secretion and excreted unchanged in urine. Co-administration of ertugliflozin with a single dose of metformin had no effect on ertugliflozin exposure, as reflected by the GMRs (test/reference) of 100.34% and 97.14% for AUCinf and Tmax, respectively (Table 13). The corresponding 90% CIs for the ratios were (97.43%, 103.34%) for AUCinf and (88.77%, 106.30%) for Tmax, and both fell wholly within the (80%, 125%) equivalence bounds. Similarly for metformin, co-administration with ertugliflozin had little to no effect on metformin Tmax and AUC values and the corresponding GMRs and 90%CIs fell entirely within in the equivalence bounds (Table 14).

Therapeutic Goods Administration
Submission PM-2017-001328-1-5 Extract from the Clinical Evaluation Report for Steglatro Attachment 2 PART 1 FINAL 31 January 2019
Page 27 of 121
Table 13: Study P019/1032: Statistical summary of treatment comparisons for plasma ertugliflozin
Table 14: Study P019/1032: Statistical summary of treatment comparisons for plasma metformin
4.6.2. DDI between a single dose of ertugliflozin and sitagliptin
Study P022/1033 examined the PK interaction following co-administration of a single dose of 100 mg sitagliptin and 15 mg ertugliflozin in healthy volunteers. Sitagliptin is an oral anti-hyperglycaemic of the dipeptidyl peptidase 4 (DPP-4) inhibitor class, which is a substrate of CYP3A4- and CYP2C8. The results indicated that following co-administration there was no adverse DDI between the two drugs as the GMRs (90% CI) for ertugliflozin AUCinf and Tmax were 102.27% (99.72%, 104.89%) and 98.18% (91.20%, 105.70%), respectively and the GMRs (90% CIs) for sitagliptin AUCinf and Tmax were 101.67% (98.40%, 105.04%) and 101.68% (91.65%, 112.80%), respectively.
4.6.3. DDI between ertugliflozin and simvastatin
Study P030/1036 examined the potential for a DDI between a single dose of ertugliflozin 15 mg and CYP3A4 and OATP1B1 substrate simvastatin 40 mg in healthy subjects. Co-administration of ertugliflozin with a single dose of simvastatin had no effect on ertugliflozin exposure, as reflected by the GMRs (90%CIs) (Test/Reference) of 102.40% (99.57%, 105.31%) and 105.16% (98.26%, 112.54%) for AUCinf and Tmax, respectively. By contrast, co-administration with ertugliflozin resulted in a small but significant increase in simvastatin AUCinf and Tmax values
Therapeutic Goods Administration
Submission PM-2017-001328-1-5 Extract from the Clinical Evaluation Report for Steglatro Attachment 2 PART 1 FINAL 31 January 2019
Page 28 of 121
with GMRs (90%CIs) of 123.83 (90.92%, 168.66%) and 119.05% (97.22%, 145.77%), respectively. This small increase in simvastatin following co-administration with ertugliflozin is unlikely to be clinically relevant.
4.6.4. DDI between ertugliflozin and steady-state rifampin
Study P021/1040 examined the effects of steady-state rifampin 600 mg QD, (which acts as an inducer of CYPs and P-gp following multiple doses) on the PKs of a single dose of 15 mg ertugliflozin. The presence of steady state rifampin reduced exposure to single dose of ertugliflozin as the GMRs (90%CIs) for ertugliflozin AUCinf and Tmax were 61.16% (57.22%, 65.37%) and 84.62% (74.17%, 96.53%), respectively.
4.6.5. DDI between single dose ertugliflozin and glimepiride
Study P032/1044 examined the potential for a DDI between a single dose of ertugliflozin 15 mg and glimepiride 1 mg in healthy subjects. Glimepiride is a medium to long-acting sulfonylurea, which acts by increasing pancreatic insulin production and is a substrate for CYP2C9. Co-administration of ertugliflozin with single doses of glimepiride did not alter ertugliflozin AUCinf and Tmax, as reflected by the GMRs (90%CIs) of 102.11% (97.19%, 107.27%) and 98.20% (92.17%, 104.63%), respectively. For glimepiride, co-administration with ertugliflozin had little to no effect on the AUCinf and Tmax of glimepiride as reflected in the GMRs (90%CIs) of 109.80% (98.14%, 122.86%) and 97.39% (71.07%, 133.46%), respectively.
4.6.6. Clinical implications of in vitro findings
As it is estimated that glucuronidation is responsible for 86% of the metabolism of ertugliflozin in humans and oxidative metabolism accounts for a further 12%, in vitro studies were undertaken using recombinant UGT and CYP enzymes to determine which isoforms were responsible for the various components of ertugliflozin metabolism. The results indicated that UGT1A9 and UGT2B7 were responsible for the glucuronidation of ertugliflozin to M5c and M5a and that CYP3A4 and CYP3A5 were involved in the formation of the primary oxidative metabolites M1 and M2.
Ertugliflozin demonstrated little or no inhibition at 7 CYP enzymes (CYP1A2, CYP2B6, CYP2C8, CYP2C9, CYP2C19, CYP2D6, and CYP3A4/5), nor did it induce CYP3A4, CYP2B6, or CYP1A2 activity. In addition, ertugliflozin demonstrated little or no reversible inhibition of UGT1A6, UGT1A9, and UGT2B7 (IC50 >100 μM). By contrast, ertugliflozin inhibited UGT1A1 and UGT1A4 activities in the presence of 0.1% bovine serum albumin with unbound IC50 values of 39 and 45 µM, respectively, and P-gp and BCRP with estimated Ki values of 176 μM and ~100 μM, respectively. Ertugliflozin also inhibited the OATP1B1-, OATP1B3-, and OCT1-mediated transport with IC50 values of 35.4, 141, and 53 μM, respectively (Ki of 17.7, 141, and 53 μM, respectively). Further in vitro studies indicated that ertugliflozin was a substrate for both P-gp and BCRP efflux transporters, whereas, it was not a substrate for the hepatic uptake transporters OATP1B1, OATP1B3, OATP2B1, OCT1, OAT1, OAT3 or OCT2.
Comment: Although ertugliflozin did not induce or inhibit a range of CYP enzymes, it is in part a substrate for both CYP3A4 and CYP3A5; however, no studies have examined the effects of a strong CYP3A inhibitor, such as clarithromycin or itraconazole, on the PKs of ertugliflozin. Furthermore, pharmacokinetic interactions between ertugliflozin and other commonly administered drugs in this patient population such as diuretics, warfarin, and digoxin and so on was not evaluated. The effect of smoking and alcohol use on ertugliflozin PKs was also not specifically studied.

Therapeutic Goods Administration
Submission PM-2017-001328-1-5 Extract from the Clinical Evaluation Report for Steglatro Attachment 2 PART 1 FINAL 31 January 2019
Page 29 of 121
4.7. Evaluator’s overall conclusions on pharmacokinetics Overall, the conduct of the PK studies of ertugliflozin was satisfactory and was compliant with existing TGA guidelines, validated analytical methods were employed and the data analyses undertaken were appropriate.
4.7.1. Absorption, distribution, metabolism and excretion
The proposed commercial formulation of MSD-ertugliflozin is an orally administered, IR, film coated tablet, which is provided in 5 mg and 15 mg tablet strengths.
The absolute oral bioavailability of a single 15 mg dose of amorphous ertugliflozin was 104.7%. Following administration of a single oral 15 mg dose of the commercial image tablet the median Tmax occurred 1 h after dosing and the mean t1/2 was 12.6 h. A high fat/high calorie breakfast had no effect on the AUCinf of a 15 mg dose and reduced Tmax by 29%, which is unlikely to be clinically relevant. Hence, the proposed dosing with or without food is justified; however, dosing should be undertaken at the same time of day as indicated by the Phase III studies. The commercial image tablet (1 x 15 mg) and Phase III tablets (administered as a 10 mg tablet + a 5 mg tablet) were bioequivalent, as were the tablets that contained the Phase III and amorphous formulations.
Following administration of single 0.5- to 300-mg doses, ertugliflozin Tmax and AUCinf increased linearly with increasing dose. Similarly, following 14 days of treatment with QD doses ranging from 1mg to 100 mg, mean Tmax and AUCτ values increased proportionally with dose and the relative accumulation ratios for the 1 mg, 5 mg, 25 mg and 100 mg doses were, 1.36, 1.25, 1.22 and 1.38, respectively.
A study that compared the PKs of ertugliflozin following 6 days of dosing with either 7.5 mg BD or 15 mg QD identified that the AUC24 was similar following both treatments, whereas, Tmax after the morning dose was higher following QD rather than BD dosing.
The Vz/F for a 15 mg dose of unlabelled ertugliflozin was 215.3 L. Plasma protein binding was high with in vitro studies indicating that 93.6% of a 2.3 µM concentration being protein bound. In human whole blood, ertugliflozin distributed preferentially into plasma relative to red blood cells with a blood-to-plasma concentration ratio of 0.66.
HPLC analysis identified 8 metabolites following dosing with ertugliflozin in humans. Glucuronidation, which accounts for approximately 86% of ertugliflozin metabolism, was identified as the major metabolic pathway and the glucuronides, M5a, M5b, M5c, and M6a, were identified as the major circulating metabolites. They were responsible for 12.2%, 4.1%, 24.1%, and 6.0% of total radioactivity in plasma, respectively. Following multiple QD doses of 1 to 100 mg of ertugliflozin, M2 exposure represented less than 2% of that of the parent compound. Following an oral dose of radioactive ertugliflozin, 50.2% of the radioactivity was recovered in the urine and 40.9% was recovered in the faeces. Ertugliflozin accounted for approximately 50% of the circulating radioactivity.
The inter-individual variance on CL/F expressed as %CV was 32%, whereas, the residual error estimates were 38.7% for the Phase I studies and 83.6% for the Phase II and III studies.
4.7.1.1. Target population
PopPK analysis predicted that ertugliflozin CL/F was reduced by approximately 10% in patients with T2DM compared to healthy subjects; however; this difference is unlikely to be clinically relevant.
Following QD administration of a range of ertugliflozin doses to subjects with T2DM manifesting inadequate glycaemic and blood pressure control ertugliflozin trough concentrations increased proportionally with increasing dose and appeared to be stable over time. Similarly, following QD doses to subjects with inadequately controlled T2DM who were receiving stable doses of metformin, ertugliflozin trough levels increased proportionally with increasing dose and

Therapeutic Goods Administration
Submission PM-2017-001328-1-5 Extract from the Clinical Evaluation Report for Steglatro Attachment 2 PART 1 FINAL 31 January 2019
Page 30 of 121
appeared to be stable over time. It is important to note that none of the above Phase II dose-ranging studies evaluated the proposed 15 mg dose of ertugliflozin.
4.7.1.2. Special populations
The GMRs for AUCinf and Tmax in subjects with moderate hepatic impairment compared to subjects with normal hepatic function were approximately 12 and 22% lower, respectively.
In subjects with normal renal function, either healthy or with T2DM, the AUC values for ertugliflozin were similar. In comparison to subjects with normal renal function, AUCinf values for subjects with T2DM and mild, moderate and severe renal impairment were 1.2, 1.4 and 1.7 fold higher, respectively.
Following single doses of 1 mg, 5 mg and 25 mg in Japanese and Western males, the GMRs for AUCinf ranged from 91.05% to 98.94%.
4.7.1.3. PopPK
The popPK analysis identified that ertugliflozin plasma concentration data from patients with T2DM could be characterised by a 2-compartment model with lag time, first-order absorption, and first-order elimination. A number of significant covariates were identified for CL/F, AUCt, relative bioavailability and ka; however, the magnitude of the changes (≤ 56%) induced by any one of the covariates could not be considered clinically relevant. By contrast, the covariate Asian race increased Vc/F by 112%.
4.7.1.4. DDIs
There was no DDI between ertugliflozin and metformin, sitagliptin or glimepiride.
Although a single dose of simvastatin had no effect on ertugliflozin exposure, co-administration increased simvastatin AUCinf by approximately 24%.
Steady-state rifampin 600 mg QD reduced ertugliflozin AUCinf and Tmax following a single dose by approximately 39% and 15%, respectively.
Overall, the PK sections of the proposed PI accurately reflect the submitted data.
The following limitations have been identified in the PK data:
• The bioequivalence of the 5 mg commercial image tablet and 5 mg Phase III tablet has not been assessed.
• A limited number of DDI studies were undertaken with drugs that are known to interact with the pathways via which ertugliflozin is metabolised (for example, CYP3A4-inhibitors). Although ertugliflozin is in part metabolised by CYP3A4, no studies have examined the effects of a strong CYP3A-inhibitor on ertugliflozin PKs.
• Pharmacokinetic interactions between ertugliflozin and other commonly administered drugs in this patient population such as diuretics, warfarin, digoxin, etc were not evaluated.
5. Pharmacodynamics
5.1. Studies providing pharmacodynamic information Comment: A number of PD studies reported in this section of the CER also contain PK data and
have been previously summarised in Table 2; therefore, they are not included in Table 15.

Therapeutic Goods Administration
Submission PM-2017-001328-1-5 Extract from the Clinical Evaluation Report for Steglatro Attachment 2 PART 1 FINAL 31 January 2019
Page 31 of 121
Table 15: Submitted pharmacodynamic studies
PD Topic Subtopic Study ID *
Secondary Pharmacology
Healthy subjects
P010/1025 Effect of 100 mg ertugliflozin on QTc
Dose/response in target population
Patients with T2DM
P042/1004 Ertugliflozin dose/response in patients with T2DM
P016/1006 Dose-response of ertugliflozin QD in patients with T2DM on stable doses of metformin
Population PD and dose-response analyses
Patients with T2DM
PMAR-EQDD-B152c-DP4-444
Model based meta-analysis that attempts to quantify the relationship between urinary glucose excretion and HbA1c
PMAR-EQDD-B152a-DP4-407
Ertugliflozin population dose-response analysis in subjects with T2DM
ASR-EQDD-B152a-DP3-253
Characterisation of the relationship between UGE and ertugliflozin dose in subjects with T2DM
* Indicates the primary PD aim of the study. § Subjects who would be eligible to receive the drug if approved for the proposed indication.
5.2. Summary of pharmacodynamics 5.2.1. Mechanism of action
Patients with diabetes have been shown to have elevated reabsorption of glucose which may result in persistence of hyperglycaemia. Ertugliflozin is an orally administered selective inhibitor of SGLT2 and it possesses a high selectivity for SGLT2 versus SGLT1 and other glucose transporters (GLUT1-4). By inhibiting SGLT2, ertugliflozin reduces renal reabsorption of filtered glucose and lowers the renal threshold for glucose, and thereby increases urinary glucose excretion (UGE), which lowers fasting plasma glucose (FPG) and haemoglobin HbA1c levels (HbHbA1c) in an insulin-independent manner. Additionally, UGE results in caloric loss and an associated weight loss. Ertugliflozin also causes osmotic diuresis, which may result in a reduction of blood pressure.
5.3. Pharmacodynamic effects 5.3.1. Primary pharmacodynamic effects
5.3.1.1. UGE healthy subjects
Study P036/1001 examined UGE following escalating (0.5 to 300 mg) single oral doses of ertugliflozin in the fasted state or 100 mg ertugliflozin in the fed or fasted state in healthy subjects. Overall, the results indicated that there was a dose-dependent effect on UGE; however, for mean UGE (0-24 h), a plateau was reached between 58 and 65 grams/day with doses ≥ 30 mg (fasted state). Following a high fat meal the UGE0-24 for a 100 mg dose of ertugliflozin was 71.2 grams/day, whereas, in the fasted state this value was 58.4 grams/day. Given that a high

Therapeutic Goods Administration
Submission PM-2017-001328-1-5 Extract from the Clinical Evaluation Report for Steglatro Attachment 2 PART 1 FINAL 31 January 2019
Page 32 of 121
fat meal reduces ertugliflozin exposure by approximately 18% for AUCinf these results are consistent with the higher caloric intake in this dose group.
A second study, P037/1002 examined UGE and renal glucose reabsorption following multiple QD doses of 1 mg to 100 mg ertugliflozin in otherwise healthy overweight or obese subjects. In this study, ertugliflozin demonstrated a dose dependent effect on UGE as well as inhibition of renal glucose reabsorption on Day 1 which persisted for the 14 days of QD dosing. This effect occurred without changes in serum glucose and plasma C-peptide levels. Of note, there were no episodes of hypoglycaemia reported in this study despite the sustained UGE observed highlighting the inherently low hypoglycaemia risk associated with this glucose dependent mechanism. There was no significant trend in body weight observed during the study.
5.3.1.2. UGE and plasma glucose in patients with T2DM
Two Phase II studies (P016/1006 and P042/1004) involving over 500 T2DM patients provided the main data to enable the dose-response modelling which was used to determine the doses to be evaluated in the Phase III studies (discussed below). However, the proposed ertugliflozin dose of 15 mg QD was not evaluated in either of these studies and the choice of the 15 mg dose appears to be arbitrary in the materials provided regarding the modelling studies. The sponsors have been asked to provide further justification regarding the choice of the 15 mg dose for the pivotal studies.
Study P040/1007 examined UGE and plasma glucose following a single 2 mg or 4 mg dose of ertugliflozin in patients with T2DM. Cumulative UGE0-24 was dose dependent with 70.4 g secreted following the 2 mg dose and 80.5 g following the 4 mg dose. By contrast, weighted mean plasma glucose over 24 h was similar following both the 2 mg (175.6 mg/dL) and 4 mg (170.4 mg/dL) doses.
5.3.2. Secondary pharmacodynamic effects
5.3.2.1. QTc Effects
Study P010/1025 examined the QTc intervals following administration of ertugliflozin 100 mg, or matching placebo or moxifloxacin 400 mg in healthy subjects. The results indicated that, unlike moxifloxacin, at each of the 10 pre-specified time points up to 48 h post-dose, the upper bounds of the 2-sided 90% CIs (equivalent to 1-sided 95% CI) for all of the time-matched mean differences between ertugliflozin 100 mg and placebo were less than the pre-defined cut-off of 10 msec (highest value of the upper bound was 4.30 msec) (Table 16).
Table 16: Study P010/1025: Summary of statistical comparisons of QTcF between ertugliflozin 100 mg and Placebo at each time point post dose by mixed effect model
Therapeutic Goods Administration
Submission PM-2017-001328-1-5 Extract from the Clinical Evaluation Report for Steglatro Attachment 2 PART 1 FINAL 31 January 2019
Page 33 of 121
5.3.2.2. Markers of RAAS activation
The Phase II study, P042/1004 evaluated the effect on exploratory biomarkers of RAAS activation following 4 weeks of administration of a range of oral doses of ertugliflozin plus 12.5 mg QD HCTZ in adults with T2DM. The results indicated that all doses of ertugliflozin induced a mild diuretic effect. However, there were no significant changes in 24 h urinary aldosterone, urinary sodium, or urinary potassium levels. In addition, both ertugliflozin (5 mg and 25 mg) and HCTZ induced a small increase in trough plasma renin activity compared to baseline from baseline to Week 4, which is unlikely to be clinically relevant.
5.3.2.3. Serum and urinary biomarkers
Study P037/1002 also examined the effects of multiple QD doses of 1 mg to 100 mg ertugliflozin on a range of exploratory serum and urinary biomarkers. For all dose groups examined, ertugliflozin had no effect on serum sodium, potassium and calcium levels on Day 1 and Day 14 post-dose compared with baseline and no clear dose-related effect was identified for serum magnesium levels. For serum phosphate and urinary sodium excretion, dose-related effects of ertugliflozin were only transitory and appeared on Day 1 but not Day 14. For urinary phosphate excretion, a visual trend for a transient decrease was also noted only on Day 1. In addition, ertugliflozin had no effect 24 h urinary potassium, magnesium and calcium excretion on either Days 1 or 14 and there was no clear dose-related effect present on Day 14 for iPTH area under the curve from 0 to 8 h post-dose or from 0 to 24 h post-dose.
5.3.2.4. Bone biomarkers
The Phase II study, P016/1006 examined the effects of ertugliflozin and sitagliptin on a range of exploratory bone biomarkers. The results indicated that following administration of ertugliflozin there were small shifts in serum electrolytes, though within the laboratory reference ranges, and consistent with these changes was a numerical increase in iPTH. In contrast to sitagliptin, some bone resorption was identified, as levels of serum CTX1 and urinary NTX-1 were increased, following treatment with ertugliflozin; however, these effects did not appear to be dose-dependent (Table 17). By contrast, no effects on markers of bone formation (that is, OC, BSAP, and P1NP) were identified.

Therapeutic Goods Administration
Submission PM-2017-001328-1-5 Extract from the Clinical Evaluation Report for Steglatro Attachment 2 PART 1 FINAL 31 January 2019
Page 34 of 121
Table 17: Study P016/1006: Summary of Baseline and change from Baseline to Week 12 in markers of bone homeostasis (Observed Cases)
5.3.3. Time course of pharmacodynamic effects
5.3.3.1. Healthy subjects
Study P035/1051
Study P035/1051 examined UGE0-24 at steady state following ertugliflozin doses of 2.5 mg BD and 7.5 mg BD or 5 mg QD and 15 mg QD in healthy subjects. The results identified that the GMRs (BD/QD) of UGE0-24 for comparisons between 2.5 mg BD versus 5 mg QD and 7.5 mg BD versus 15 mg QD were 110.16% (102.96%, 117.87%), and 102.77% (97.69%, 108.12%), respectively, and the GMR 90%CIs fell within the pre-specified similarity boundaries (70%, 143%). Therefore, UGE0-24 at steady state is similar following ertugliflozin BD and QD administration of a total daily dose of 5 mg (5 mg QD and 2.5 mg BD) or 15 mg (15 mg QD and 7.5 mg BD).
5.3.3.2. Patients with T2DM
Study P040/1007 also compared the effects of ertugliflozin on UGE0-24 and mean plasma glucose following administration of 1 mg or 2 mg BD (that is, total daily doses of 2mg and 4 mg respectively) and QD doses of 2 mg or 4 mg. The results indicated that there was no marked difference in UGE0-24 across the 4 treatment arms studied, although UGE was numerically greater following the higher dose regimens (4 mg versus 2 mg total daily dose) whereas, the

Therapeutic Goods Administration
Submission PM-2017-001328-1-5 Extract from the Clinical Evaluation Report for Steglatro Attachment 2 PART 1 FINAL 31 January 2019
Page 35 of 121
weighted mean plasma glucose over 24 h was similar for all treatment groups, and the mean values ranged from 169 mg/dL to 176 mg/dL.
Comment: These results indicate that there is no noticeable benefit in moving from a QD to a BD dosing regimen.
Study PMAR-EQDD-B152c-DP4-444 was a model based meta-analysis (MBMA) that was undertaken in an attempt to quantify the relationship between UGE and HbA1c for 4 SGLT2 inhibitors, including ertugliflozin. In this study, the relationship between dose and UGE and HbA1c treatment effect was characterised by an Emax or sigmoid Emax dose response relationship and the impact of between-trial differences in time of response measurement, baseline HbA1c, baseline fasting glucose, eGFR, background anti-diabetic treatment, Asian versus non-Asian studies, SGLT2 selectivity and SGLT2 inhibitor on the treatment effect was evaluated. The MBMA model was then used together with the individual subject level UGE data from Study P035/1051 to predict the potential difference in steady-state HbA1c response following either BD or QD dosing in subjects with T2DM. For a typical patient population with OAD background treatment, baseline HbA1c of 8%, and baseline eGFR of 90 ml/min/1.73m2, the predicted potential difference in HbA1c effect following BD and QD ertugliflozin was -0.025% (-0.045 to -0.008; 95% CI) for 2.5 mg BD and 5 mg QD and -0.010% (-0.019 to -0.003; 95% CI) for 7.5 mg BD and 15 mg QD. Moreover, the ratio of the predicted HbA1c effect was 1.043 (1.018 to 1.072; 90% CI) for 2.5 mg BD and 5 mg QD and was 1.016 (1.007 to 1.026; 90% CI) for 7.5 mg BD and 15 mg QD.
5.3.4. Relationship between drug concentration and pharmacodynamic effects
5.3.4.1. HbA1c
Study PMAR-EQDD-B152a-DP4-407 represented a population dose response analysis, which attempted to identify an appropriate structural exposure-response or dose-response model, as well as to quantify the population response and variability in ertugliflozin-induced HbA1c reduction. Data from one Phase II (MK-8835-016/B1521006) and four Phase III studies (MK-8835-001/B1521016, MK-8835-007/B1521017, MK-8835-003/B1521022 and MK-8835-005/B1521019) were included in the analysis.
The final longitudinal dose-response model, which included baseline HbA1c, baseline eGFR, duration of diabetes and anti-hyperglycaemic background treatment on Emax, and age and baseline body weight on ED50, provided estimates for mean Emax (95% CI) and ED50 of -0.745% (-0.899% to -0.624%) and 1.30 mg (0.0699 mg to 2.64 mg), respectively. The results also indicated that response to placebo was significant with a mean (95% CI) of -0.135% (-0.223% to -0.00412%).
In a representative T2DM patient, defined as a 57.3 year old patient, weighing 85 kg, with a baseline HbA1c of 8.1%, an eGFR of 88.9 mL/min/1.73 m2, disease duration of 7.5 years, on a background treatment of metformin, the model predicted placebo-adjusted change from baseline (CFB) responses (mean (95% CI)) following 26 weeks of treatment with either 5 mg or 15 mg ertugliflozin were -0.674% (-0.805% to -0.565%) and -0.735% (-0.869% to -0.626%), respectively.
The impact of significant covariates baseline HbA1c, eGFR and diabetes duration on Emax, based on the 5th and 95th quantiles of observed values and expressed as a percentage of Emax, was as follows: baseline HbA1c from 6.9% to 10.1% resulted in 80.4% and 141% of Emax, respectively; baseline eGFR of 41 mL/min/1.73 m2 to 123 mL/min/1.73 m2 resulted in 74.9% and 112% of Emax, respectively; and baseline diabetes duration of 0.417 years to 20.9 years resulted in 120% and 65.8% of Emax, respectively. While the offset for other background treatment (background treatment different from metformin or diet and exercise alone) on Emax was significant, it was confounded by study and interpretation is specific to MK-8835-001/B1521016. The offset background treatment of diet and exercise alone on Emax was not significant.

Therapeutic Goods Administration
Submission PM-2017-001328-1-5 Extract from the Clinical Evaluation Report for Steglatro Attachment 2 PART 1 FINAL 31 January 2019
Page 36 of 121
The 1.30 mg estimate of ED50 was not precise, with a RSE and 95% CI of 45.0% and 0.0699 mg to 2.64 mg, respectively, and subsequent covariates introduced on ED50 were also not well estimated. Weight was not a significant predictor of ED50 as evidenced by the associated 95% CI (-11.0 to 6.37), and would not be expected to impact predictions of HbA1c. Age was a significant predictor of ED50; however, the effect of age on ED50 was not well estimated (mean, 3.25; 95% CI, 0.648 to 16.7). Therefore, any predictions incorporating age should be interpreted with caution.
5.3.4.2. UGE
Study ASR-EQDD-B152a-DP3-253 represented a population PK/PD analysis, which was undertaken using nonlinear mixed-effects modelling in an attempt to characterise the relationship between UGE0-24 and ertugliflozin dose in patients with T2DM using data from the ambulatory blood pressure study B1521004. The final model provided an estimate of the maximal baseline-adjusted UGE0-24 response (95% CI) of 71.5 (57.9 to 87.3) g/day and an ED50 (95% CI) of 0.752 (0.299, 1.58) mg. Baseline UGE (95% CI) was estimated as 2.37 (1.69, 3.37) g/day and 0.622 (0.381, 1.03) g/day, respectively, for males and females. Following 28 days of administration the predicted UGE (90% CI) for the 5 mg ertugliflozin dose was 62.5 (54.9, 69.7) g/day and for the 15 mg dose was 68.9 (58.9, 78.7) g/day.
5.3.5. Effect of renal impairment on pharmacodynamic response
Study P009/1023 examined the effects of mild, moderate and severe renal impairment on the PD effects of ertugliflozin following a single oral dose of 15 mg in subjects with T2DM.
5.3.5.1. UGE
The results of the UGE analysis indicated that the adjusted geometric mean values for the change from baseline in UGE on Day 1 were lower in the T2DM renal impairment groups than in subjects with T2DM but normal renal function. For instance, the UGE0-24 values on Day 1 in the mild, moderate and severe renal impairment groups were 49.75% (90% CI: 27.22%, 90.93%), 38.10% (90% CI: 20.85%, 69.64%), and 13.95% (90% CI: 7.32%, 26.58%) compared to subjects with T2DM but normal function group (72.31 g).
5.3.5.2. 24 h Inhibition of glucose reabsorption
The geometric mean changes from baseline in 24 h inhibition of glucose reabsorption (%) at Day 1 were 29.19% and 33.34% in the healthy and T2DM normal renal function groups, respectively. A one way ANOVA analysis that there was no apparent difference between the T2DM renal impairment groups and the T2DM normal renal function group in change from baseline in 24 h inhibition of glucose reabsorption (%) at Day 1 and the Day 1 adjusted geometric mean changes from baseline in 24 h inhibition of glucose reabsorption (%) were 25.58%, 28.84%, and 24.25% for the mild, moderate, and severe renal impairment groups respectively.
5.3.6. Pharmacodynamic interactions
The population dose-response analysis, PMAR-EQDD-B152a-DP4-407, also provided predictions of mean placebo-adjusted CFB HbA1c response following co-administration of rifampicin with either 5 mg or 15 mg ertugliflozin. The results indicated that in the presence of rifampin the effectiveness of ertugliflozin to lower CFB HbA1c was slightly decreased as the values for the 5 mg and 15 mg doses were approximately 0.05 and 0.02 lower, respectively.
5.4. Evaluator’s overall conclusions on pharmacodynamics Ertugliflozin is an oral, selective inhibitor of SGLT2 that inhibits renal glucose reabsorption and results in increased UGE and reductions in plasma glucose and HbA1c in subjects with T2DM.

Therapeutic Goods Administration
Submission PM-2017-001328-1-5 Extract from the Clinical Evaluation Report for Steglatro Attachment 2 PART 1 FINAL 31 January 2019
Page 37 of 121
5.4.1. Primary PD in healthy subjects
For healthy subjects in the fasted state, increases in UGE0-24 were dose dependent over the range of 0.5 mg to 30 mg. At doses ≥ 30 mg UGE0-24 plateaued between 58 and 65 grams/day. Following multiple QD doses of 1 mg to 100 mg ertugliflozin in otherwise healthy overweight or obese subjects UGE increased and renal glucose reabsorption decreased dose dependently.
5.4.2. Primary PD in T2DM
Two Phase II studies (Studies P016/1006 and P042/1004) involving over 500 T2DM patients provided the main data to enable the dose-response modelling which was used to determine the doses to be evaluated in the Phase III studies. However, the proposed ertugliflozin dose of 15 mg QD was not evaluated in either of these studies and the choice of the 15 mg dose appears to be arbitrary in the materials provided regarding the modelling studies. The sponsors have been asked to provide further justification regarding the choice of the 15 mg dose for the pivotal studies.
5.4.3. PD modelling and analyses
For a typical patient with T2DM, MBMA predicted that following ertugliflozin doses of 2.5 mg BD or 5 mg QD and 7.5 mg QID or 15 mg BD there was little difference in effect of ertugliflozin.
Population dose-response analysis predicted that in a typical patient with T2DM on a background of metformin, the placebo-adjusted CFB in HbA1c following 26 weeks of treatment with either 5 mg or 15 mg ertugliflozin were -0.674% (-0.805% to -0.565%) and -0.735% (-0.869% to -0.626%), respectively. Whereas, for a typical patient with Stage 3a CKD the predicted mean placebo-adjusted CFB HbA1c response for the 5 mg and 15 mg ertugliflozin doses were -0.458% (-0.603% to -0.339%) and -0.518% (-0.681% to -0.393%), respectively.
Following 28 days of administration the predicted UGE (90% CI) values for the 5 mg and 15 mg doses of ertugliflozin were 62.5 (54.9, 69.7) g/day and 68.9 (58.9, 78.7) g/day, respectively.
Rifampin co-administration induced a slight decrease in the ability of ertugliflozin to lower CFB HbA1c.
In patients with T2DM, UGE0-24 was dose dependent with 70.4 g excreted following the 2 mg dose and 80.5 g following the 4 mg dose. By contrast, weighted mean plasma glucose over 24 h was similar following both the 2 mg (175.6 mg/dL) and 4 mg (170.4 mg/dL) doses.
5.4.4. Secondary pharmacodynamic effects
5.4.4.1. Healthy subjects
Unlike 400 mg moxifloxacin, 100 mg ertugliflozin had no effect on QTc interval in healthy subjects. Following multiple QD doses ranging from 1 mg to 100 mg to otherwise healthy overweight or obese subjects, ertugliflozin had no effect on serum sodium, potassium and calcium levels or magnesium and calcium excretion on either Day 1 or Day 14 of treatment and no clear dose-related effect was identified for serum magnesium levels or iPTH AUC.
5.4.4.2. T2DM
Following co-administration of a range of oral doses of ertugliflozin and 12.5 mg QD HCTZ for 4 weeks in patients with T2DM, ertugliflozin had a mild diuretic effect. By contrast it had no effect on 24 h urinary aldosterone, urinary sodium or urinary potassium. In contrast to sitagliptin, ertugliflozin induced minor bone resorption, as indicated by increased levels of serum CTX1 and urinary NTX-1; however, these effects did not appear to be dose-dependent. By contrast, no effects on markers of bone formation were identified.
5.4.4.3. Time course of PD effects
UGE0-24 was similar following BD and QD doses of ertugliflozin, following the equivalent total daily dose, in healthy subjects and in subjects with T2DM.

Therapeutic Goods Administration
Submission PM-2017-001328-1-5 Extract from the Clinical Evaluation Report for Steglatro Attachment 2 PART 1 FINAL 31 January 2019
Page 38 of 121
Comment: The sponsor states the following in regards to the selection of doses for the Phase III studies:
‘Since single oral doses as high as 300 mg, multiple doses of 100 mg QD up to 14 days and 25 mg QD up to 12 weeks were associated with an acceptable safety profile in the Phase I and Phase II studies, the key drivers for Phase III dose selection were the dose-response relationships for the change from baseline in HbA1c, FPG, and body weight in T2DM subjects from the 12 week Phase II dose-ranging study (Study P016/1006). The relationship between change from baseline in HbA1c or FPG or body weight at Week 12 versus dose was described by an maximum effect (Emax) model that included dose as a continuous variable. Phase III dose selection was also supported by dose-response modelling of the PD marker, 24 hour UGE, in subjects with T2DM from the 4 week Phase II Study P042/1004.’
The two Phase II studies mentioned (Studies P016/1006 and P042/1004) examined the following doses of ertugliflozin: 1 mg, 5 mg, 10 mg and 25 mg. Therefore as neither of the dose ranging/dose response Phase II studies directly examined the 15 mg dose and its choice appears to be arbitrary in the materials provided regarding the modelling studies, it is unclear why the 15 mg dose was chosen for the Phase III and additional Phase I trials.
6. Dosage selection for the pivotal studies
6.1. Pharmacokinetics and pharmacodynamics: dose finding studies Oral doses of ertugliflozin as high as 300 mg (single dose), 100 mg QD (up to 14 days), and 25 mg QD (up to 12 weeks) demonstrated appropriate safety and tolerability in the early Phase I and 2 studies. The selection of the 5 mg and 15 mg doses for the Phase III studies was also supported by the safety and tolerability profile for ertugliflozin in Phase I and II clinical studies up to 12 weeks in duration. When accounting for species differences in protein binding, the highest Phase III dose of 15 mg QD represented an exposure which was approximately 12 fold (for Tmax (maximum concentration)) and 11 fold (for area under curve over 24 hours (AUC0-24)) lower than exposure at the no observed adverse effect level (NOAEL) in the 6-month toxicology study in the most sensitive species (rat).
6.2. Phase II dose finding studies The Phase II Study P016/1006 assessed dose-response following 12 weeks of treatment with ertugliflozin (1 mg, 5 mg, 10 mg and 25 mg QD) and sitagliptin 100 mg QD in 328 subjects with inadequately controlled T2DM who were receiving stable doses of metformin (refer section Efficacy below). Results from this study confirmed the minimally efficacious dose as 1 mg with the 2 highest doses (10 mg and 25 mg) offering little incremental increase in efficacy (that is, effect on HbA1c, FPG and body weight) relative to the 5 mg once daily dose. The efficacy observed with the 5 mg QD represents greater than ED80 for the endpoints of HbHbA1c, FPG and body weight. In addition to effect on glycaemic control and body weight, ertugliflozin was observed to result in a clinically meaningful decline in seated trough blood pressure. There was no overall dose related increase in the frequency of AEs across the 25 fold range of doses evaluated (1 mg QD to 25 mg QD).
Another Phase II Study P042/1004 evaluated dose response (in terms of reduction in SBP, UGE and FPG) following 4 weeks treatment with ertugliflozin doses (1 mg, 5 mg or 25 mg) and HCTZ in 193 subjects with T2DM and inadequate glycaemic and blood pressure control. Consistent with the mechanism of ertugliflozin , there was a statistically significant increase in 24 hour UGE

Therapeutic Goods Administration
Submission PM-2017-001328-1-5 Extract from the Clinical Evaluation Report for Steglatro Attachment 2 PART 1 FINAL 31 January 2019
Page 39 of 121
and decrease in FPG at Week 4 for all 3 dose groups of ertugliflozin versus placebo although the 25 mg dose did not lead to much greater increase in UGE or decrease in FPG compared to the 5 mg dose (Table 18). These Phase II studies were discussed in detail. The above two Phase II studies provided the main data to enable the dose-response modelling which was used to determine the dose selection for the pivotal Phase III studies.
Table 18: Statistical analysis (ANCOVA) of change from Baseline in 24 hour urinary glucose excretion (Grams/day) at week 4 (FAS LOCF)
However, the proposed ertugliflozin dose of 15 mg QD was not evaluated in either of these studies and the choice of the 15 mg dose appears to be arbitrary in the materials provided regarding the modelling studies. The sponsors have been asked to provide further justification regarding the choice of the 15 mg dose for the pivotal studies.
6.3. Phase III pivotal studies investigating more than one dose regimen
Ertugliflozin doses of 5 mg and 15 mg QD were evaluated in all seven Phase III studies. Both ertugliflozin 5 mg and 15 mg demonstrated clinical efficacy in the Phase III studies. The recommended starting dose is 5 mg and the 15 mg dose provides incremental glycaemic efficacy compared to the 5 mg dose. Although the studies were not powered for or designed to detect between-dose differences, the effects on HbA1c, FPG, and 2 h PPG were generally greater for 15 mg versus 5 mg ertugliflozin across the Phase III studies.
6.4. Evaluator’s conclusions on dose finding for the pivotal studies The doses of ertugliflozin evaluated in the Phase III clinical studies were 5 mg and 15 mg once daily (QD). Since oral doses of ertugliflozin as high as 300 mg (single dose), 100 mg QD (up to 14 days) and 25 mg QD (up to 12 weeks) were safe and well tolerated in Phase I/ 2 studies, dose selection was based on dose-response modelling of efficacy endpoints (HbA1c, FPG, body weight) from Study P016/B1521006 (12 week Phase II dose-ranging study) as well as 24 hour UGE (mechanism biomarker) in T2DM subjects from Study P042/B1521004 (4 week Phase II dose-ranging study). The sponsors have stated that for these endpoints, the 5 mg and 15 mg doses consistently elicited a response that was >80% and >90% of the maximum response, respectively (Table 19). However, it is not clear how the results shown in the table summarising the ‘Estimated percent maximum response for various endpoints’ were calculated. Furthermore, it is important to note that neither of the Phase II studies evaluated the proposed 15 mg QD

Therapeutic Goods Administration
Submission PM-2017-001328-1-5 Extract from the Clinical Evaluation Report for Steglatro Attachment 2 PART 1 FINAL 31 January 2019
Page 40 of 121
dose of ertugliflozin and the sponsors have been asked to provide further clarification regarding choice of the 15 mg QD dose for the pivotal Phase III studies.
Table 19: Estimated percent maximum response for various endpoints
7. Clinical efficacy
7.1. Studies providing evaluable efficacy data The Phase III program included 7 pivotal studies to support the efficacy of ertugliflozin as monotherapy and combination therapy. All Phase III studies evaluated 2 doses of ertugliflozin (15 mg and 5 mg QD) (Table 20).
Table 20: Overview of Phase III studies

Therapeutic Goods Administration
Submission PM-2017-001328-1-5 Extract from the Clinical Evaluation Report for Steglatro Attachment 2 PART 1 FINAL 31 January 2019
Page 41 of 121
7.1.1. Monotherapy
Study P003/1022: A Phase III, randomised, double blind, placebo controlled, 26 week multicentre study with a 26 week extension to evaluate the efficacy and safety of ertugliflozin monotherapy in the treatment of subjects with T2DM and inadequate glycaemic control despite diet and exercise.
7.1.2. Combination with other anti-hyperglycaemic agents (AHAs)
7.1.2.1. Add-on to metformin
Study P007/1017: A Phase III, randomised, double blind, placebo controlled, 26 week multicentre study with a 78 week extension to evaluate the efficacy and safety of ertugliflozin in subjects with T2DM and inadequate glycaemic control on metformin monotherapy.
Study P002/1013: A Phase III, multicentre, randomised, double blind, active comparator controlled clinical trial to study the safety and efficacy of the addition of ertugliflozin (MK-8835/PF-04971729) compared with the addition of glimepiride in subjects with T2DM who have inadequate glycaemic control on metformin.
Study P005/1019: A Phase III, randomised, double blind, multicentre study to evaluate the efficacy and safety of the combination of ertugliflozin (MK- 8835/PF-04971729) with sitagliptin compared with ertugliflozin alone and sitagliptin alone, in the treatment of subjects with T2DM with inadequate glycaemic control on metformin monotherapy.
7.1.2.2. Add-on to metformin plus sitagliptin
Study P006/1015: Phase III, multicentre, randomised, double blind, placebo controlled, parallel group clinical trial to evaluate the safety and efficacy of ertugliflozin (MK- 8835/PF-04971729) in the treatment of subjects with T2DM who have inadequate glycaemic control on metformin and sitagliptin.
7.1.2.3. Co-administration with sitagliptin in subjects on diet and exercise alone
Study P017/1047: A Phase III, randomised, double blind, placebo controlled, parallel group, multicentre clinical trial to evaluate the efficacy and safety of the initial combination of ertugliflozin (MK-8835/PF-04971729) with sitagliptin in the treatment of subjects with T2DM with inadequate glycaemic control on diet and exercise.
7.1.2.4. Studies in special populations
Study P001/1016: A Phase III, multicentre, randomised, double blind, placebo controlled clinical trial to evaluate the efficacy and safety of ertugliflozin (MK-8835/PF-04971729) in subjects with T2DM with Stage 3 chronic kidney disease who have inadequate glycaemic control on background anti-hyperglycaemic therapy.
7.2. Pivotal or main efficacy studies 7.2.1. Study P003/1022: Monotherapy
7.2.1.1. Study design, objectives, locations and dates
This was a 52 week, multi-centre, randomised, parallel-group study with a 26 week, double blind, placebo controlled treatment period (Phase A) followed by a 26 week active controlled treatment period (Phase B);3 in men and women, ≥ 18 years of age with T2DM, diagnosed in
3 At entry into Phase B (following completion of Week 26 procedures), non-rescued subjects in the placebo treatment group received blinded metformin in addition to placebo for ertugliflozin while non-rescued subjects in the ertugliflozin groups received placebo for metformin in addition to ertugliflozin 5 mg or ertugliflozin 15 mg. Subjects rescued with metformin in Phase A entered into Phase B and continued to receive open label metformin in addition to their original randomised treatment.
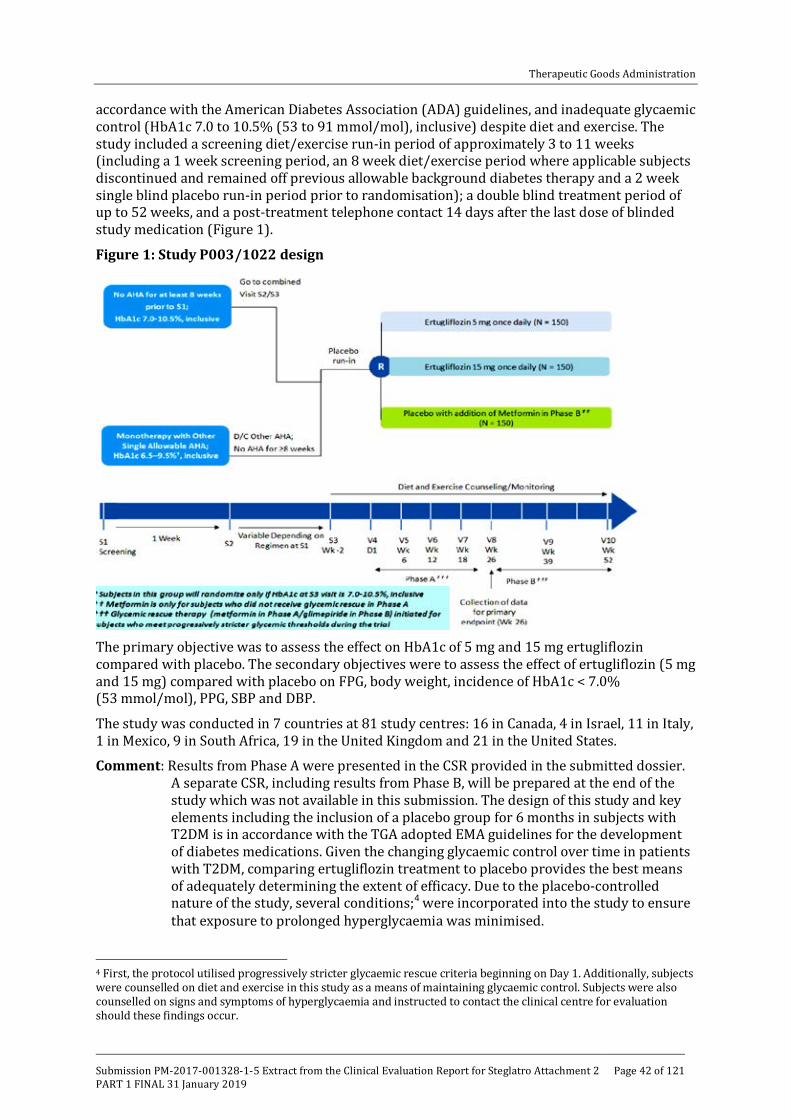
Therapeutic Goods Administration
Submission PM-2017-001328-1-5 Extract from the Clinical Evaluation Report for Steglatro Attachment 2 PART 1 FINAL 31 January 2019
Page 42 of 121
accordance with the American Diabetes Association (ADA) guidelines, and inadequate glycaemic control (HbA1c 7.0 to 10.5% (53 to 91 mmol/mol), inclusive) despite diet and exercise. The study included a screening diet/exercise run-in period of approximately 3 to 11 weeks (including a 1 week screening period, an 8 week diet/exercise period where applicable subjects discontinued and remained off previous allowable background diabetes therapy and a 2 week single blind placebo run-in period prior to randomisation); a double blind treatment period of up to 52 weeks, and a post-treatment telephone contact 14 days after the last dose of blinded study medication (Figure 1).
Figure 1: Study P003/1022 design
The primary objective was to assess the effect on HbA1c of 5 mg and 15 mg ertugliflozin compared with placebo. The secondary objectives were to assess the effect of ertugliflozin (5 mg and 15 mg) compared with placebo on FPG, body weight, incidence of HbA1c < 7.0% (53 mmol/mol), PPG, SBP and DBP.
The study was conducted in 7 countries at 81 study centres: 16 in Canada, 4 in Israel, 11 in Italy, 1 in Mexico, 9 in South Africa, 19 in the United Kingdom and 21 in the United States.
Comment: Results from Phase A were presented in the CSR provided in the submitted dossier. A separate CSR, including results from Phase B, will be prepared at the end of the study which was not available in this submission. The design of this study and key elements including the inclusion of a placebo group for 6 months in subjects with T2DM is in accordance with the TGA adopted EMA guidelines for the development of diabetes medications. Given the changing glycaemic control over time in patients with T2DM, comparing ertugliflozin treatment to placebo provides the best means of adequately determining the extent of efficacy. Due to the placebo-controlled nature of the study, several conditions;4 were incorporated into the study to ensure that exposure to prolonged hyperglycaemia was minimised.
4 First, the protocol utilised progressively stricter glycaemic rescue criteria beginning on Day 1. Additionally, subjects were counselled on diet and exercise in this study as a means of maintaining glycaemic control. Subjects were also counselled on signs and symptoms of hyperglycaemia and instructed to contact the clinical centre for evaluation should these findings occur.

Therapeutic Goods Administration
Submission PM-2017-001328-1-5 Extract from the Clinical Evaluation Report for Steglatro Attachment 2 PART 1 FINAL 31 January 2019
Page 43 of 121
7.2.1.2. Inclusion and exclusion criteria
The main inclusion criteria were:
• Subjects aged > 18 years with a diagnosis of T2DM in accordance with ADA guidelines;
• HbA1c at initial screening visit (S1) of 7.0 to 10.5% (53 to 91 mmol/mol) for subjects with no prior allowable oral AHA for ≥ 8 weeks prior to S1 and 6.5 to 9.5% (48 to 80 mmol/mol) for subjects on monotherapy with a single allowable oral AHA;
• Subjects on a single allowable oral AHA had to be willing to discontinue this medication starting at Screening Visit (S2) and remain off this medication for the duration of the study. Allowable oral AHAs for discontinuation were metformin, sulfonylureas, dipeptidyl peptidase-4 (DPP-4) inhibitors, glinides or alpha-glucosidase inhibitors;
• BMI > 18 kg/m2 and written informed consent;
• Male or female not of reproductive potential5 or female of reproductive potential practising acceptable birth control measures.6
The main exclusion criteria were history of type 1 diabetes mellitus, other specific types of diabetes, subjects with < 80% compliance based on pill count with placebo run-in medication; history of MI, unstable angina, arterial revascularisation, stroke, TIA or NYHA functional Class III/IV heart failure within 3 months of screening; SBP > 160 mmHg and/ or DBP > 90 mmHg after at least a 5 minute seated rest; clinical significant laboratory or ECG abnormality; obstructive uropathy or indwelling urinary catheter, clinically significant malabsorption syndromes.
7.2.1.3. Study treatments
Ertugliflozin 5 mg, ertugliflozin 10 mg and matching placebos were supplied as immediate-release tablets for oral administration. Tablets were packaged into bottles. During the single blind placebo run-in was administered starting at Day -14/Visit S3 where subjects were instructed to take 1 tablet of placebo ertugliflozin 5 mg and 1 tablet of placebo ertugliflozin 10 mg each morning. Subjects were prescribed glycaemic rescue therapy in the form of open label metformin in Phase A, and dosed according to physician judgment, if they met specific, progressively more stringent, glycaemic criteria based on a repeated, confirmed FPG or HbA1c measured by the central laboratory (refer Table 21).
Table 21: Glycaemic thresholds
5 Was postmenopausal defined as at least 12 months with no menses in women ≥ 45 years of age, or had a hysterectomy and/or bilateral oophorectomy, or had bilateral tubal ligation or occlusion at least 6 weeks prior to Screening Visit 6 Agreed to remain abstinent from heterosexual activity (if this form of birth control was accepted by local regulatory agencies and ethics review committees as the sole method of birth control), or agreed to use (or have their partner use) acceptable contraception to prevent pregnancy while the subject was receiving study medication and for 14 days after the last dose of study medication. Two methods of contraception were used to avoid pregnancy. Acceptable combinations of methods included: • Use of one of the following double-barrier methods: diaphragm with spermicide and a condom; cervical cap and a condom; or a contraceptive sponge and condom. • Use of hormonal contraception (any registered and marketed contraceptive agent that contained an oestrogen and/or a progestational agent [including oral, subcutaneous, intrauterine and intramuscular agents, and cutaneous patch]) with one of the following: diaphragm with spermicide; cervical cap; contraceptive sponge; condom; vasectomy; or intrauterine device (IUD). • Use of an IUD with one of the following: condom; diaphragm with spermicide; contraceptive sponge; vasectomy; or hormonal contraception • Vasectomy with one of the following: diaphragm with spermicide; cervical cap; contraceptive sponge; condom; IUD; or hormonal contraception.

Therapeutic Goods Administration
Submission PM-2017-001328-1-5 Extract from the Clinical Evaluation Report for Steglatro Attachment 2 PART 1 FINAL 31 January 2019
Page 44 of 121
The investigator was responsible for managing the initiation and titration of the rescue metformin therapy consistent with the country-specific product label standards of care for management of subjects with T2DM. Before initiating open label metformin therapy in Phase A, the investigator was to review the subject's most recent eGFR and creatinine values to assess if metformin treatment was appropriate based on formal guidelines (local clinical practice guidelines or the approved metformin product label in the country of the investigator site). For subjects who initiated glycaemic rescue therapy, discontinuation criteria for hyperglycaemia applied to subjects who had completed titration of metformin to the maximal tolerated, approved dose, as per the dose approved in the country of the site, and had been maintained on a stable tolerated dose for ≥ 4 weeks for metformin.
Medications that were prohibited (as indicated in the exclusion criteria)7 were not permitted prior to or during the study. Thyroid replacement medication (for example, thyroxine) was permitted, but subjects were to be on a stable dose for at least 6 weeks prior to randomisation. Subjects who were not on a stable dose of blood pressure or lipid altering medications at S1 were scheduled appropriately for S3 and Day 1 to ensure they had a stable dose for at least 4 weeks prior to randomisation. Subjects had to abstain from all food and drink (except water) at least 10 hours prior to any blood sample collections for clinical laboratory tests and fasting glucose monitoring. Subjects were counselled on appropriate dietary and lifestyle guidelines for T2DM at S2 and asked to maintain these guidelines throughout participation in the study. Counselling on dietary guidelines was in accordance with local medical standards of care for subjects with T2DM.
7.2.1.4. Efficacy variables and outcomes
The primary glycaemic efficacy endpoint was the change from baseline in HbA1c at Week 26. HbA1c reflects average glucose concentrations over the past 3 to 4 months and, therefore, provides a useful index of glycaemic control and it is a standard efficacy endpoint used to assess the glycaemic efficacy of AHAs. HbA1c is also a key glycaemic parameter which correlates with reduction of risk of diabetic microvascular complications.
Secondary glycaemic efficacy endpoint was the change from baseline in FPG at Week 26. FPG was assessed to characterise the earlier time course of glucose control with the ertugliflozin treatment. Other secondary endpoints were change from baseline in blood pressure8 and body weight9 and incidence of subjects achieving HbA1c < 7% and < 6.5%. Other efficacy endpoints included the proportion of subjects who received glycaemic rescue therapy, time to initiation of rescue.
PD assessments: Samples collected for glucose, insulin and C-peptide as part of the MMTT were evaluated to assess measures of insulin sensitivity and insulin secretion (including HOMA-beta, IGI, and AUC C-peptide/AUC-glucose). Area under the curve (AUC) for glucose, insulin and C-peptide was calculated for each subject at Day 1 and Week 26 using the linear trapezoidal method. Fasting glucose and C-peptide were used to calculate beta cell function (HOMA-beta). In addition to the total AUC and the 2-hour post-prandial glucose assessments, incremental AUCglu and incremental 2 hour post-prandial glucose changes from baseline were evaluated.
Treatment compliance: Subjects were directed to bring any used and unused bottles to each visit. The investigator was to maintain a complete and current accountability record for the
7 Use of the following prohibited therapeutic agents. These agents were not to be used from 12 weeks prior to Screening Visit (S1) through the completion of the study: a. Insulin of any type (except for short-term use during hospitalization). b. Other injectable AHAs (eg, pramlintide, exenatide, liraglutide). c. Pioglitazone or rosiglitazone. d. Another SGLT2 inhibitor. e. Bromocriptine (Cycloset). f. Colesevelam (Welchol). g. Any other anti-hyperglycaemic therapy with the exception of the protocol-approved agents. 8 Sitting blood pressure (and pulse rate) was measured in triplicate using an automated, oscillometric blood pressure measuring device at specified time points 9 Body weight was measured in duplicate using a standardised, digital scale at specified time points.

Therapeutic Goods Administration
Submission PM-2017-001328-1-5 Extract from the Clinical Evaluation Report for Steglatro Attachment 2 PART 1 FINAL 31 January 2019
Page 45 of 121
blinded study medication. Compliance with the placebo run-in medication was monitored by study personnel at the site at the end of the placebo run-in on Visit 4/Day 1, by comparing the returned single blind study medication with the amount dispensed and the information reported by the subject. Subjects who were < 80% compliant (based on pill count) with the placebo run-in medication were ineligible for randomisation.
7.2.1.5. Randomisation and blinding methods
Phase A of this study was subject, investigator, and Sponsor blinded. On Day 1 of Phase A randomised, double blind primary treatment period, each subject was randomly assigned (in a 1:1:1 ratio) to ertugliflozin 5 mg, ertugliflozin 15 mg or placebo. The study utilised a double-dummy approach to maintain double blinding, with a placebo tablet matching the ertugliflozin 5 mg tablet and another placebo tablet matching the ertugliflozin 10 mg tablet. Subjects were instructed to take 1 ertugliflozin 5 mg tablet (or matching placebo) and 1 ertugliflozin 10 mg tablet (or matching placebo) daily. Thus, all subjects were to take 2 tablets each day of ertugliflozin/placebo.
Allocation of subjects to treatment groups proceeded through the use of a randomisation system (interactive voice response system (IVRS)) that was accessible 24 hours per day, 365 days per year. Subject information was entered into the system starting at S1 when the subject was assigned to a unique identifier which was retained throughout the duration of participation in the study. A computer-generated randomisation code using the method of random permuted blocks was utilised to assign on Day 1 (V4) subjects to 1 of 3 treatment regimens (ertugliflozin 5 mg, ertugliflozin 15 mg or placebo).
7.2.1.6. Analysis populations
The Full Analysis Set (FAS) population was the primary analysis population for most efficacy endpoints. For analyses that used the constrained longitudinal data analysis (cLDA) model, the FAS population, defined separately for each analysis endpoint, consisted of all randomised subjects who:
• Received at least 1 dose of study treatment;
• Had a baseline measurement or at least 1 post-randomisation measurement for the analysis endpoint subsequent to at least 1 dose of study treatment.
7.2.1.7. Sample size
The sample size of approximately 450 subjects was based on providing safety data for subjects on no background diabetes medication (that is, on the use of ertugliflozin as monotherapy). This number was also expected to enable a statistically robust assessment of the primary endpoint which was the change in HbA1c from baseline at Week 26. With a sample size of approximately 450 subjects randomised equally to ertugliflozin 5 mg, ertugliflozin 15 mg or placebo, 120 subjects per group were expected to complete the 26 weeks duration of treatment assuming a dropout rate of 20%. This sample size provided greater than 99% power to detect a difference of 0.6% in the change from baseline at Week 26 in HbA1c assuming a SD of 1.0%10 based on a 2-sided test at a 5% level of significance.
7.2.1.8. Statistical methods
An ordered testing procedure was used to assess a collection of primary and secondary hypothesis tests (see Table 22 below)
10 In studies of monotherapy with other SGLT2 inhibitors (dapagliflozin and canagliflozin) in subjects with T2DM and inadequate glycaemic control by diet and exercise alone, estimates of the standard deviation (SD) of the change from baseline in A1C after 24 or 26 weeks ranged from 0.80% to 1.05%. Therefore, a SD of 1.0% was taken as a conservative estimate for sample size calculations.

Therapeutic Goods Administration
Submission PM-2017-001328-1-5 Extract from the Clinical Evaluation Report for Steglatro Attachment 2 PART 1 FINAL 31 January 2019
Page 46 of 121
Table 22: Statistical decision rules Ordered testing procedure
Beginning with the first hypothesis, a test was conducted at a 5% level of significance. If significance was not achieved (that is, p-value > 0.05), then no further hypothesis testing was conducted. If significance was achieved, the next hypothesis was then tested at a 5% level of significance with the decision process repeated. Any reported confidence interval (CI) was constructed with 95% CIs and was 2-sided in nature. All statistical tests were conducted at the alpha = 0.05 (2-sided) level.
Analysis of primary efficacy endpoint: The primary efficacy analyses compared the efficacy of ertugliflozin relative to placebo in change from baseline in HbA1c at Week 26, excluding data obtained after the initiation of glycaemic rescue therapy or after bariatric surgery. The mean changes from baseline in HbA1c at Week 26 for the ertugliflozin groups were compared to the mean changes in the placebo group using the estimated treatment differences via a cLDA model, proposed by Liang and Zeger. The statistical model included terms for treatment (categorical), time (categorical), the treatment by time interaction, AHA status at study entry (binary; yes/no), and baseline eGFR (continuous). No imputation of missing data was performed. A cLDA, based on the FAS and including data obtained after the initiation of glycaemic rescue therapy or after bariatric surgery, was used to evaluate the change from baseline in HbA1c levels at Week 26 as a supportive analysis.
Comment: The sponsors have stated the following regarding use of the cLDA model for analysis of efficacy endpoints:
‘Although the baseline measurements are included in the response vector for a cLDA model, it is independent of treatment, and hence, the baseline means were constrained to be the same for all treatment groups. It is important to note that in the event that there were no missing data, the estimated treatment difference from a cLDA model would have been identical to that from a traditional longitudinal analysis of covariance (ANCOVA) model which uses the baseline value as a covariate. However, unlike longitudinal ANCOVA, the cLDA model accounts for variability in the baseline values among treatments, thus providing more accurate standard errors (SEs) and CIs for individual treatment effects. Moreover, this model allowed the inclusion of subjects who were missing either the baseline or post-baseline measurements, thereby increasing efficiency.’
It appears that the cLDA model may be more suited for accurate assessment of treatment differences when there is missing data. However, it is noted that the efficacy results have not been confirmed using the more commonly used longitudinal ANCOVA analysis.
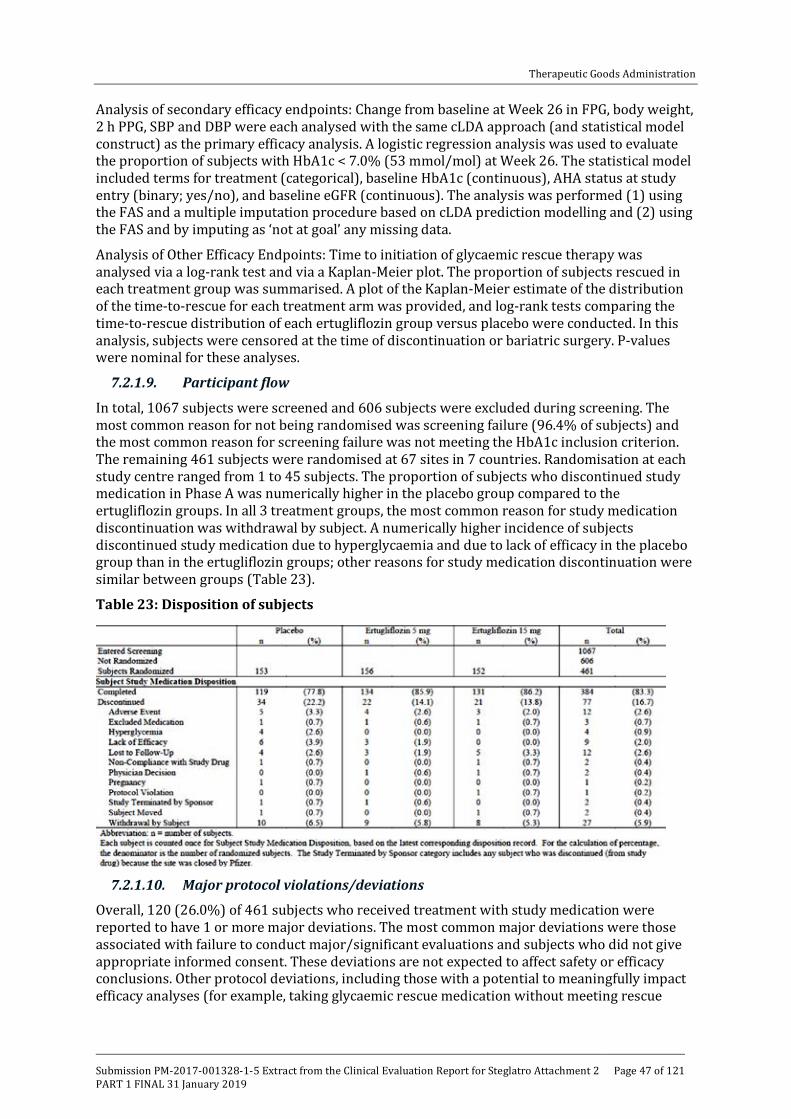
Therapeutic Goods Administration
Submission PM-2017-001328-1-5 Extract from the Clinical Evaluation Report for Steglatro Attachment 2 PART 1 FINAL 31 January 2019
Page 47 of 121
Analysis of secondary efficacy endpoints: Change from baseline at Week 26 in FPG, body weight, 2 h PPG, SBP and DBP were each analysed with the same cLDA approach (and statistical model construct) as the primary efficacy analysis. A logistic regression analysis was used to evaluate the proportion of subjects with HbA1c < 7.0% (53 mmol/mol) at Week 26. The statistical model included terms for treatment (categorical), baseline HbA1c (continuous), AHA status at study entry (binary; yes/no), and baseline eGFR (continuous). The analysis was performed (1) using the FAS and a multiple imputation procedure based on cLDA prediction modelling and (2) using the FAS and by imputing as ‘not at goal’ any missing data.
Analysis of Other Efficacy Endpoints: Time to initiation of glycaemic rescue therapy was analysed via a log-rank test and via a Kaplan-Meier plot. The proportion of subjects rescued in each treatment group was summarised. A plot of the Kaplan-Meier estimate of the distribution of the time-to-rescue for each treatment arm was provided, and log-rank tests comparing the time-to-rescue distribution of each ertugliflozin group versus placebo were conducted. In this analysis, subjects were censored at the time of discontinuation or bariatric surgery. P-values were nominal for these analyses.
7.2.1.9. Participant flow
In total, 1067 subjects were screened and 606 subjects were excluded during screening. The most common reason for not being randomised was screening failure (96.4% of subjects) and the most common reason for screening failure was not meeting the HbA1c inclusion criterion. The remaining 461 subjects were randomised at 67 sites in 7 countries. Randomisation at each study centre ranged from 1 to 45 subjects. The proportion of subjects who discontinued study medication in Phase A was numerically higher in the placebo group compared to the ertugliflozin groups. In all 3 treatment groups, the most common reason for study medication discontinuation was withdrawal by subject. A numerically higher incidence of subjects discontinued study medication due to hyperglycaemia and due to lack of efficacy in the placebo group than in the ertugliflozin groups; other reasons for study medication discontinuation were similar between groups (Table 23).
Table 23: Disposition of subjects
7.2.1.10. Major protocol violations/deviations
Overall, 120 (26.0%) of 461 subjects who received treatment with study medication were reported to have 1 or more major deviations. The most common major deviations were those associated with failure to conduct major/significant evaluations and subjects who did not give appropriate informed consent. These deviations are not expected to affect safety or efficacy conclusions. Other protocol deviations, including those with a potential to meaningfully impact efficacy analyses (for example, taking glycaemic rescue medication without meeting rescue
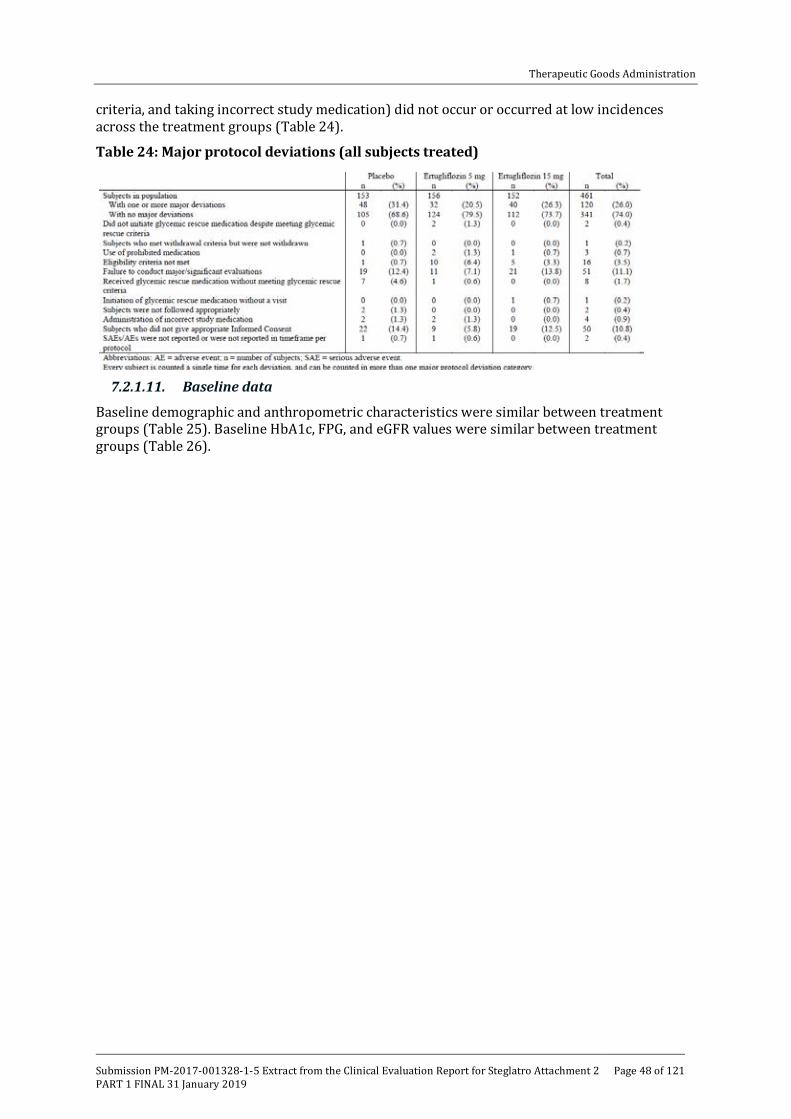
Therapeutic Goods Administration
Submission PM-2017-001328-1-5 Extract from the Clinical Evaluation Report for Steglatro Attachment 2 PART 1 FINAL 31 January 2019
Page 48 of 121
criteria, and taking incorrect study medication) did not occur or occurred at low incidences across the treatment groups (Table 24).
Table 24: Major protocol deviations (all subjects treated)
7.2.1.11. Baseline data
Baseline demographic and anthropometric characteristics were similar between treatment groups (Table 25). Baseline HbA1c, FPG, and eGFR values were similar between treatment groups (Table 26).
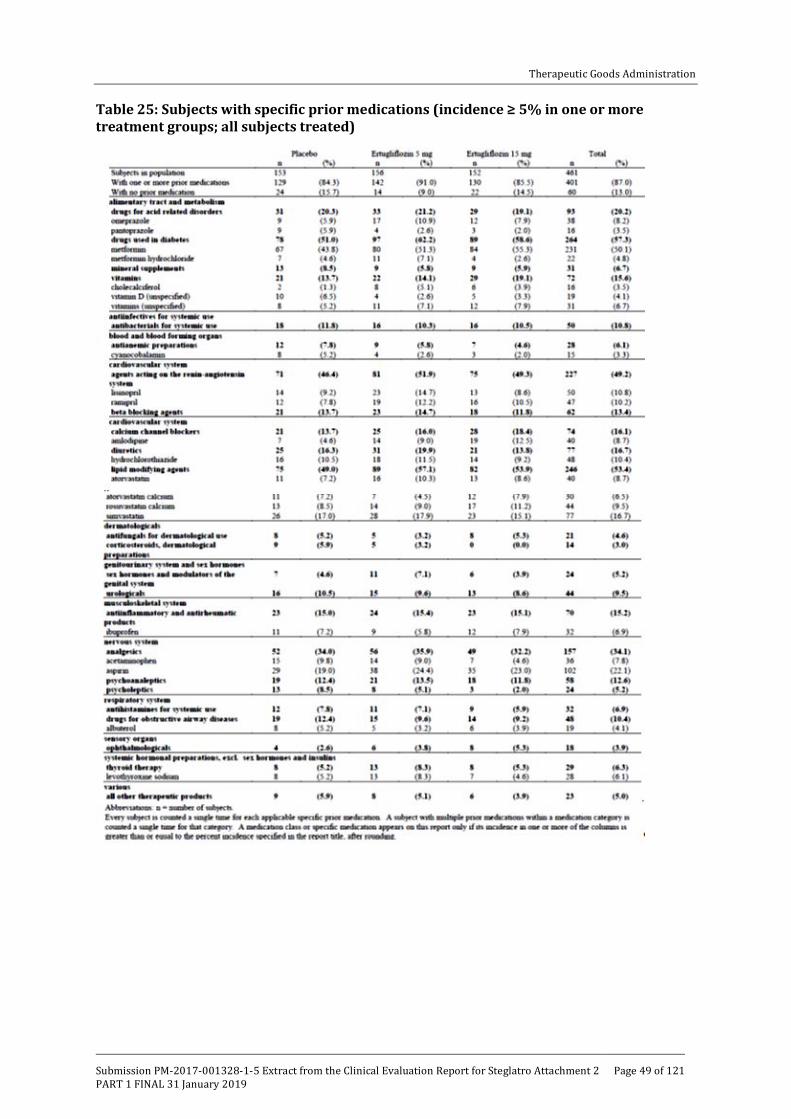
Therapeutic Goods Administration
Submission PM-2017-001328-1-5 Extract from the Clinical Evaluation Report for Steglatro Attachment 2 PART 1 FINAL 31 January 2019
Page 49 of 121
Table 25: Subjects with specific prior medications (incidence ≥ 5% in one or more treatment groups; all subjects treated)

Therapeutic Goods Administration
Submission PM-2017-001328-1-5 Extract from the Clinical Evaluation Report for Steglatro Attachment 2 PART 1 FINAL 31 January 2019
Page 50 of 121
Table 26: Subjects with specific concomitant medications (incidence ≥ 5% in one or more treatment groups; all subjects treated)
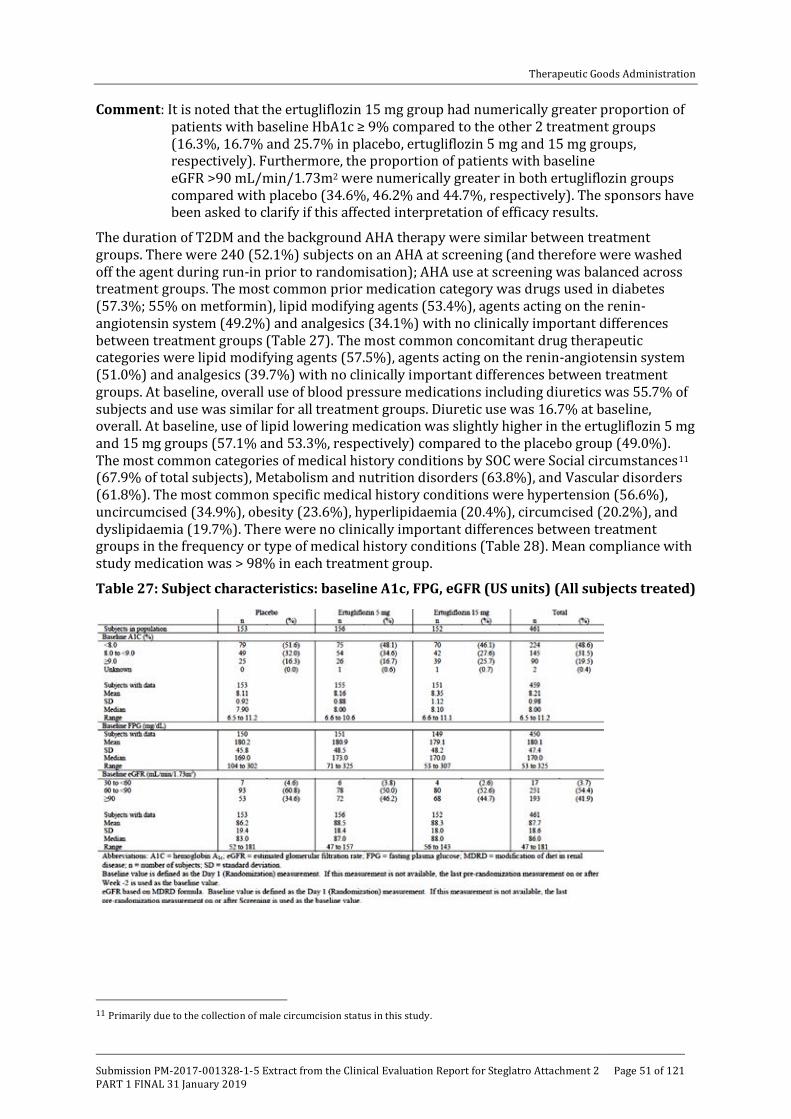
Therapeutic Goods Administration
Submission PM-2017-001328-1-5 Extract from the Clinical Evaluation Report for Steglatro Attachment 2 PART 1 FINAL 31 January 2019
Page 51 of 121
Comment: It is noted that the ertugliflozin 15 mg group had numerically greater proportion of patients with baseline HbA1c ≥ 9% compared to the other 2 treatment groups (16.3%, 16.7% and 25.7% in placebo, ertugliflozin 5 mg and 15 mg groups, respectively). Furthermore, the proportion of patients with baseline eGFR >90 mL/min/1.73m2 were numerically greater in both ertugliflozin groups compared with placebo (34.6%, 46.2% and 44.7%, respectively). The sponsors have been asked to clarify if this affected interpretation of efficacy results.
The duration of T2DM and the background AHA therapy were similar between treatment groups. There were 240 (52.1%) subjects on an AHA at screening (and therefore were washed off the agent during run-in prior to randomisation); AHA use at screening was balanced across treatment groups. The most common prior medication category was drugs used in diabetes (57.3%; 55% on metformin), lipid modifying agents (53.4%), agents acting on the renin-angiotensin system (49.2%) and analgesics (34.1%) with no clinically important differences between treatment groups (Table 27). The most common concomitant drug therapeutic categories were lipid modifying agents (57.5%), agents acting on the renin-angiotensin system (51.0%) and analgesics (39.7%) with no clinically important differences between treatment groups. At baseline, overall use of blood pressure medications including diuretics was 55.7% of subjects and use was similar for all treatment groups. Diuretic use was 16.7% at baseline, overall. At baseline, use of lipid lowering medication was slightly higher in the ertugliflozin 5 mg and 15 mg groups (57.1% and 53.3%, respectively) compared to the placebo group (49.0%). The most common categories of medical history conditions by SOC were Social circumstances11 (67.9% of total subjects), Metabolism and nutrition disorders (63.8%), and Vascular disorders (61.8%). The most common specific medical history conditions were hypertension (56.6%), uncircumcised (34.9%), obesity (23.6%), hyperlipidaemia (20.4%), circumcised (20.2%), and dyslipidaemia (19.7%). There were no clinically important differences between treatment groups in the frequency or type of medical history conditions (Table 28). Mean compliance with study medication was > 98% in each treatment group.
Table 27: Subject characteristics: baseline A1c, FPG, eGFR (US units) (All subjects treated)
11 Primarily due to the collection of male circumcision status in this study.

Therapeutic Goods Administration
Submission PM-2017-001328-1-5 Extract from the Clinical Evaluation Report for Steglatro Attachment 2 PART 1 FINAL 31 January 2019
Page 52 of 121
Table 28: Subject medical history conditions (incidence ≥ 5% in one or more treatment groups) (all subjects treated)
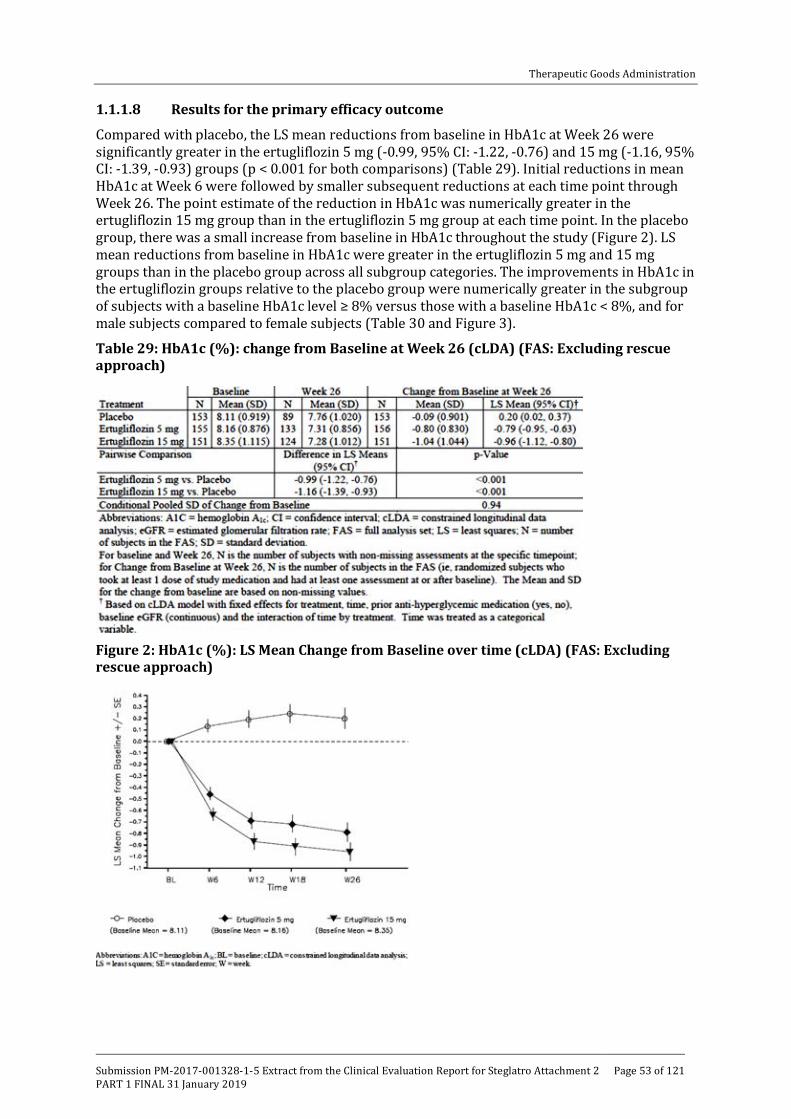
Therapeutic Goods Administration
Submission PM-2017-001328-1-5 Extract from the Clinical Evaluation Report for Steglatro Attachment 2 PART 1 FINAL 31 January 2019
Page 53 of 121
1.1.1.8 Results for the primary efficacy outcome
Compared with placebo, the LS mean reductions from baseline in HbA1c at Week 26 were significantly greater in the ertugliflozin 5 mg (-0.99, 95% CI: -1.22, -0.76) and 15 mg (-1.16, 95% CI: -1.39, -0.93) groups (p < 0.001 for both comparisons) (Table 29). Initial reductions in mean HbA1c at Week 6 were followed by smaller subsequent reductions at each time point through Week 26. The point estimate of the reduction in HbA1c was numerically greater in the ertugliflozin 15 mg group than in the ertugliflozin 5 mg group at each time point. In the placebo group, there was a small increase from baseline in HbA1c throughout the study (Figure 2). LS mean reductions from baseline in HbA1c were greater in the ertugliflozin 5 mg and 15 mg groups than in the placebo group across all subgroup categories. The improvements in HbA1c in the ertugliflozin groups relative to the placebo group were numerically greater in the subgroup of subjects with a baseline HbA1c level ≥ 8% versus those with a baseline HbA1c < 8%, and for male subjects compared to female subjects (Table 30 and Figure 3).
Table 29: HbA1c (%): change from Baseline at Week 26 (cLDA) (FAS: Excluding rescue approach)
Figure 2: HbA1c (%): LS Mean Change from Baseline over time (cLDA) (FAS: Excluding rescue approach)

Therapeutic Goods Administration
Submission PM-2017-001328-1-5 Extract from the Clinical Evaluation Report for Steglatro Attachment 2 PART 1 FINAL 31 January 2019
Page 54 of 121
Table 30: HbA1c (0%) Change from Baseline at Week 26 (Repeated measures analysis of covariance subgroup analysis) (FAS: Excluding rescue approach)

Therapeutic Goods Administration
Submission PM-2017-001328-1-5 Extract from the Clinical Evaluation Report for Steglatro Attachment 2 PART 1 FINAL 31 January 2019
Page 55 of 121
Table 30: HbA1c (0%) Change from Baseline at Week 26 (Repeated measures analysis of covariance subgroup analysis) (FAS: Excluding rescue approach)
Figure 3: HbA1c (0%); Forest plot of change from baseline at Week 26 for all subgroups (Repeated measures analysis of covariance) (FAS: excluding rescue approach)
1.1.1.9 Results for other efficacy outcomes
Compared with placebo, the raw proportions of subjects with an HbA1c < 7.0% were 2 and 3 times greater in the ertugliflozin 5 mg and 15 mg groups, respectively (28.2%, 35.8% and 13.1% in the ertugliflozin 5 mg, 15 mg and placebo groups, respectively). The model based odds of having an HbA1c < 7.0% at Week 26, using multiple imputation for subjects with missing Week 26 data, were significantly greater in both ertugliflozin groups compared to the placebo group (p < 0.001 for both comparisons) (Table 31). The raw proportions of subjects with an

Therapeutic Goods Administration
Submission PM-2017-001328-1-5 Extract from the Clinical Evaluation Report for Steglatro Attachment 2 PART 1 FINAL 31 January 2019
Page 56 of 121
HbA1c < 6.5% were 3 times greater for both ertugliflozin groups than for the placebo group (12.2%, 12.6% and 3.9%, respectively). The model based odds of having an HbA1c < 6.5% at Week 26, using multiple imputation for subjects with missing Week 26 data, were greater in the ertugliflozin 5 mg and 15 mg groups compared to the placebo group (nominal p = 0.003 and p = 0.001, respectively) (Table 32).
Table 31: Analysis of subjects with HbA1c < 7.0% (<53 mmol/mol) at Week 26 (Logistic regression using multiple imputations) (FAS: excluding rescue approach)
Table 32: Analysis of subjects with HbA1c < 6.5% (< 48 mmol/mol) at Week 26 (Logistic regression using multiple imputations) (FAS: Excluding rescue approach)
The LS mean reductions from baseline in FPG at Week 26 were significantly (p < 0.001 for both comparisons) greater in the ertugliflozin 5 mg and 15 mg groups compared to the placebo group -1.88, -2.41 and +0.03mmol/L, respectively) (Table 33). Initial reductions in FPG at Week 6 were followed by smaller subsequent reductions at each time point through Week 26. The magnitude of the reduction in FPG was numerically greater in the ertugliflozin 15 mg group than in the ertugliflozin 5 mg group at each time point (Figure 4). The LS mean reductions from baseline in 2 h PPG at Week 26 were significantly (p < 0.001 for both comparisons) greater in the ertugliflozin 5 mg and 15 mg groups compared to the placebo group -3.56, -3.47 and +0.27mmol/L, respectively) (Table 34). The LS mean reductions from baseline in body weight at Week 26 were significantly (p < 0.001 for both comparisons) greater in the ertugliflozin 5 mg and 15 mg groups compared to the placebo group (-3.2, -3.6 and -1.4kg, respectively) (Table 35). In both ertugliflozin groups and in the placebo group, body weight decreased from baseline at Week 6 and continued to decrease at each subsequent time point to Week 26 with the magnitude of the decrease numerically greater in both ertugliflozin groups than in the placebo group at each time point. Changes from baseline in body weight through Week 26 were numerically greater in the ertugliflozin 15 mg group compared to the ertugliflozin 5 mg group (Figure 5).
Compared with placebo, the LS mean reduction from baseline in sitting SBP at Week 26 was significantly greater in the ertugliflozin 5 mg group (nominal = 0.015) but only numerically (but not significantly) greater in the ertugliflozin 15 mg group (-5.5, -3.9 and -2.2 mmHg,

Therapeutic Goods Administration
Submission PM-2017-001328-1-5 Extract from the Clinical Evaluation Report for Steglatro Attachment 2 PART 1 FINAL 31 January 2019
Page 57 of 121
respectively) (Table 36). Hence, all subsequent endpoints in the ordered testing procedure are therefore ineligible for statistical testing. Reductions from baseline in SBP at Week 26 were numerically greater in the ertugliflozin 5 mg compared to the ertugliflozin 15 mg group. No meaningful difference in the proportions of subjects taking antihypertensive medication at Week 26 relative to baseline was observed in the ertugliflozin or placebo groups. Compared with placebo, the LS mean reductions from baseline in sitting DBP at Week 26 were greater in the ertugliflozin 5 mg group (nominal p = 0.039) and numerically greater in the ertugliflozin 15 mg group (Table 37). The cumulative percentage of subjects who received glycaemic rescue medication through Week 26 was 25.5% in the placebo group, with infrequent initiation of rescue therapy in both ertugliflozin groups (< 3% in both groups; nominal p < 0.001 for both comparisons) (Table 38). Table 33: FPG (mmol/L); Change from Baseline at Week 26 (cLDA) (FAS: Excluding rescue approach)
Figure 4: FPG (mmol/L); LS Mean change from Baseline over time (cLDA) (FAS: Excluding rescue approach)

Therapeutic Goods Administration
Submission PM-2017-001328-1-5 Extract from the Clinical Evaluation Report for Steglatro Attachment 2 PART 1 FINAL 31 January 2019
Page 58 of 121
Table 34: 2 h PPG (mmol/L); Change from Baseline at Week 26 (cLDA) (FAS: excluding rescue approach)
Table 35: Body weight (kg); Change from Baseline at Week 26 (cLDA) (FAS: excluding rescue approach)
Figure 5: Body weight (kg); LS mean change from baseline over time (cLDA) (FAS: excluding rescue approach)

Therapeutic Goods Administration
Submission PM-2017-001328-1-5 Extract from the Clinical Evaluation Report for Steglatro Attachment 2 PART 1 FINAL 31 January 2019
Page 59 of 121
Table 36: Sitting systolic blood pressure (mmHg); change from Baseline at Week 26 (cLDA) (FAS: excluding rescue approach)
Table 37: Sitting diastolic BP (mmHg); Change from Baseline at Week 26 (cLDA) (FAS: excluding rescue approach)
Table 38: Analysis of subjects receiving glycaemic rescue medication at Week 26 (all subject as treated)

Therapeutic Goods Administration
Submission PM-2017-001328-1-5 Extract from the Clinical Evaluation Report for Steglatro Attachment 2 PART 1 FINAL 31 January 2019
Page 60 of 121
7.2.1.12. Results related to MMTT
Mean decreases in glucose AUC from baseline were observed at Week 26 in the ertugliflozin 5 mg and 15 mg groups (-6388.1 and -6508.2 mg*min/dL, respectively), compared to an increase of 829.3 mg*min/dL in the placebo group. Baseline glucose AUC values ranged from 29,405.3 to 29,832.7 mg*min/dL among the 3 treatment groups. The mean reductions in insulin AUC from baseline in the ertugliflozin 5 mg and 15 groups at Week 26 (-1681.08 and -1419.23 μIU*min/mL) were numerically greater than the reduction in the placebo group (-630.70 μIU*min/mL). Baseline insulin AUC values ranged from 10,035.51 to 10,784.76 μIU*min/mL among the 3 treatment groups. Mean increases in HOMA-beta cell function were observed at Week 26 in the ertugliflozin 5 mg and 15 mg groups (19.86% and 18.65%, respectively), compared to a decrease of 1.63% in the placebo group. Baseline HOMA-beta cell function values ranged from 50.04 to 53.29% among the 3 treatment groups. Mean changes in C-peptide-based IGI from baseline were minimal: the C-peptide-based IGI in the ertugliflozin 15 mg group was 0.004 ng/mL per mg/dL, 0.00045 ng/mL per mg/dL in the ertugliflozin 5 mg group (rounded to 0.000 ng/mL per mg/dL in the statistical output) and -0.007 ng/mL per mg/dL in the placebo group at Week 26. Baseline C-peptide based IGI values ranged from 0.033 to 0.040 ng/mL per mg/mL among the 3 treatment groups. The mean reduction in insulin-based IGI in the placebo group at Week 26 was -0.106 μIU/mL per mg/dL compared to the reductions seen in the ertugliflozin 5 mg and 15 mg groups (-0.029 and -0.008 μIU/mL per mg/dL, respectively). Baseline insulin-based IGI values ranged from 0.874 to 1.101 μIU/mL per mg/dL among the 3 treatment groups. Mean decreases in incremental glucose AUC were observed at Week 26 in the ertugliflozin 5 mg and 15 mg groups (-1547.7 and -1213.4 mg*min/dL, respectively), compared to an increase of 31.4 mg*min/dL in the placebo group. Baseline incremental glucose AUC values ranged from 7863.6 to 8409.3 mg*min/dL among the 3 treatment groups. Mean decreases in incremental 2 h PPG were observed at Week 26 in the ertugliflozin 5 mg and 15 mg groups (-21.0 and -19.5 mg/dL, respectively), compared to an increase of 0.9 mg/dL in the placebo group. Baseline incremental 2-hr PPG values ranged from 76.0 to 84.6 mg/dL among the treatment groups.
7.2.1.13. Evaluator commentary
This was the only Phase III monotherapy study which assessed the efficacy and safety of proposed ertugliflozin (5 mg and 15 mg QD) in T2DM adult patients with inadequate glycaemic control on diet and exercise. The design of this pivotal Phase III study involving 461 T2DM adults was adequate including the inclusion of a placebo group for 6 months which is in accordance with the TGA adopted EMA guidelines for the development of diabetes medications. The CSR submitted in this dossier only presents results for the initial 26 week Phase A placebo controlled period.
The primary efficacy endpoint of LS mean reductions from baseline in HbA1c at Week 26 were significantly greater in the ertugliflozin 5 mg and 15 mg groups compared with placebo (difference from placebo was -0.99 and -1.16, respectively; p < 0.001 for both comparisons). Subgroup analyses for change from baseline in HbA1c at Week 26 showed consistent results across the subgroups and were similar to those seen in the overall FAS population; however improvements in HbA1c in the ertugliflozin groups relative to the placebo group were numerically greater in the subgroup of subjects with a baseline HbA1c level ≥ 8% versus those with a baseline HbA1c < 8%, and for male subjects compared to female subjects.
The primary efficacy results were supported by the secondary efficacy results as the LS mean reductions from baseline in FPG, body weight and 2 h PPG at Week 26 were significantly greater in the ertugliflozin 5 mg and 15 mg groups compared to the placebo group. Furthermore, subjects treated with ertugliflozin 5 mg and 15 mg were significantly more likely to have an HbA1c < 7.0% at Week 26 when compared to placebo (28%, 36% and 13% in ertugliflozin 5 mg, 15 mg and placebo groups, respectively). The proportion of subjects having HbA1c < 6.5% was also significantly greater in ertugliflozin groups although there was no difference between the

Therapeutic Goods Administration
Submission PM-2017-001328-1-5 Extract from the Clinical Evaluation Report for Steglatro Attachment 2 PART 1 FINAL 31 January 2019
Page 61 of 121
5 mg and 15 mg doses (12.2%, 12.6% and 3.9%, respectively) . Furthermore, glycaemic rescue medication was also required in a higher percentage of placebo subjects (25%) relative to ertugliflozin-treated subjects (< 3%). The LS mean reduction from baseline for sitting SBP was numerically greater for the ertugliflozin 5 mg and 15 mg groups compared with placebo but the difference was not statistically significant (5.54, 3.93 and 2.2 mmHg, respectively). As a result no further sequential hypothesis testing was conducted for the comparison of 5 mg on SBP or DBP for the 2 doses.
Overall, treatment with ertugliflozin 5 mg and 15 mg once daily for 26 weeks provided statistically significant and clinically relevant improvements in glycaemic control and body weight in adult T2DM patients who had inadequate glycaemic control on diet and exercise. While the study was not powered to formally compare efficacy of the 2 doses, the 15 mg dose of ertugliflozin provided a numerically greater reduction of HbA1c, FPG and body weight relative to the 5 mg dose. However, long-term maintenance of efficacy of ertugliflozin monotherapy would require confirmation from the Phase B (Week 26 to 52) data which was not submitted in the current dossier.
7.2.2. P007/1017: Add-on to metformin
7.2.2.1. Study design, objectives
This is a 104 week, multicentre, randomised, parallel-group study with a 26 week, double blind, placebo controlled treatment period (Phase A) followed by a 78 week active controlled treatment period (Phase B) in adults with T2DM, diagnosed in accordance with the ADA guidelines, and inadequate glycaemic control (HbA1c 7.0to 10.5% (53 to 91 mmol/mol), inclusive) on metformin monotherapy at a dose ≥ 1500 mg/day. The study includes a screening period of 1 week, a minimum 8 week metformin stable dose period (when subjects discontinued and remained off any previous allowable background diabetes therapy except for metformin), and a 2 week single blind placebo run-in period prior to randomisation; a double blind treatment period of up to 104 weeks (the 26 week Phase A reported in submitted dossier while the 78 week Phase B extension is still ongoing), and a post-treatment telephone contact 14 days after the last dose of blinded study medication (Figure 6).
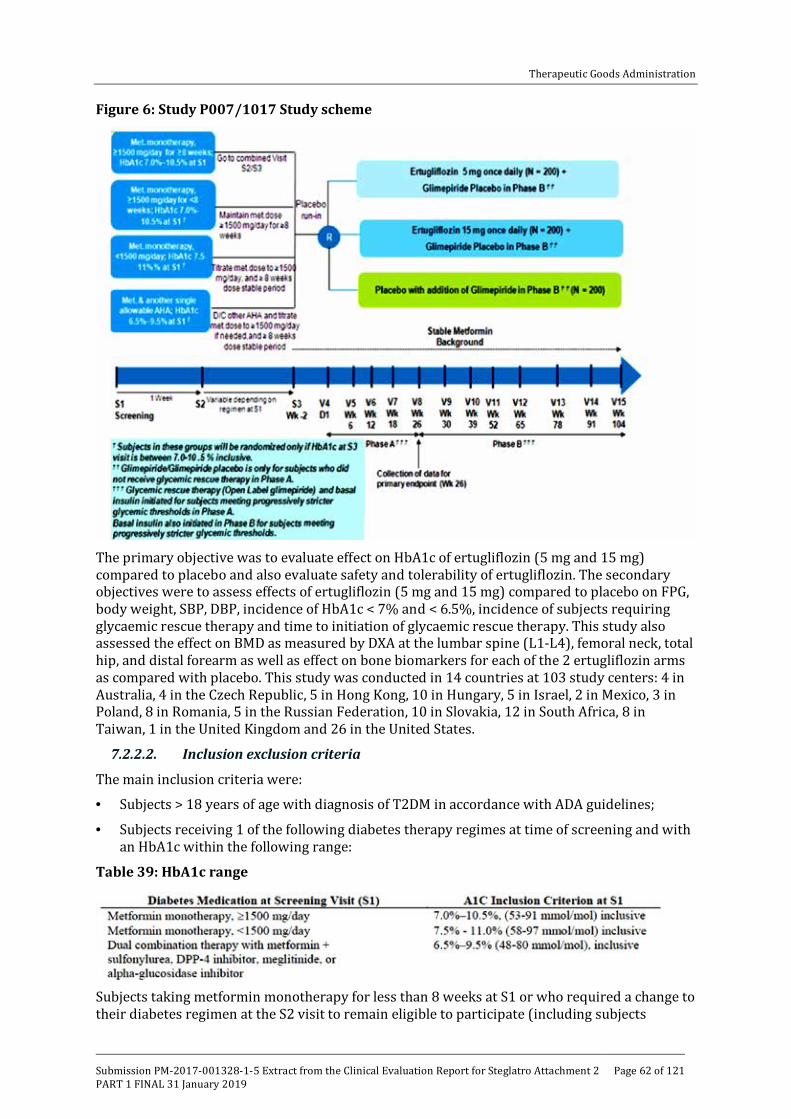
Therapeutic Goods Administration
Submission PM-2017-001328-1-5 Extract from the Clinical Evaluation Report for Steglatro Attachment 2 PART 1 FINAL 31 January 2019
Page 62 of 121
Figure 6: Study P007/1017 Study scheme
The primary objective was to evaluate effect on HbA1c of ertugliflozin (5 mg and 15 mg) compared to placebo and also evaluate safety and tolerability of ertugliflozin. The secondary objectives were to assess effects of ertugliflozin (5 mg and 15 mg) compared to placebo on FPG, body weight, SBP, DBP, incidence of HbA1c < 7% and < 6.5%, incidence of subjects requiring glycaemic rescue therapy and time to initiation of glycaemic rescue therapy. This study also assessed the effect on BMD as measured by DXA at the lumbar spine (L1-L4), femoral neck, total hip, and distal forearm as well as effect on bone biomarkers for each of the 2 ertugliflozin arms as compared with placebo. This study was conducted in 14 countries at 103 study centers: 4 in Australia, 4 in the Czech Republic, 5 in Hong Kong, 10 in Hungary, 5 in Israel, 2 in Mexico, 3 in Poland, 8 in Romania, 5 in the Russian Federation, 10 in Slovakia, 12 in South Africa, 8 in Taiwan, 1 in the United Kingdom and 26 in the United States.
7.2.2.2. Inclusion exclusion criteria
The main inclusion criteria were:
• Subjects > 18 years of age with diagnosis of T2DM in accordance with ADA guidelines;
• Subjects receiving 1 of the following diabetes therapy regimes at time of screening and with an HbA1c within the following range:
Table 39: HbA1c range
Subjects taking metformin monotherapy for less than 8 weeks at S1 or who required a change to their diabetes regimen at the S2 visit to remain eligible to participate (including subjects

Therapeutic Goods Administration
Submission PM-2017-001328-1-5 Extract from the Clinical Evaluation Report for Steglatro Attachment 2 PART 1 FINAL 31 January 2019
Page 63 of 121
discontinuing AHA therapy at S2) must have had an HbHbA1c of 7.0 to 10.5% (53 to 91 mmol/mol) at S3 after at least 8 weeks on a regimen of metformin in monotherapy.
• BMI 18 to 40 kg/m2 and written informed consent;
• Male or non-childbearing female or female of reproductive practising acceptable birth control measures.12 Approximately 50% of the population enrolled in the study were to be women who had been postmenopausal for 3 years or more (at least 3 years since their last menstrual period (LMP) or had bilateral oophorectomy performed 3 years or more prior to screening), and the randomisation was stratified based on this postmenopausal status.
The main exclusion criteria were similar to those described for Study P003/1022. Due to assessment of BMD, the following subjects were also excluded from this study: with a gender specific BMD T-score of <-2.5 at any site assessed at Screening Visit 3; with a documented history of osteoporosis (prior documented BMD T-score of <-2.5) with rheumatoid arthritis; with any other illness that could impact BMD assessment such as inherited bone disorders, metabolic bone disease or autoimmune endocrinopathies; with bilateral hip prosthesis or subjects who had fewer than 3 vertebrae which were evaluable by DXA at Screening Visit 3 (S3); with hyperparathyroidism defined as a parathyroid hormone (PTH) value at Screening Visit 1 that exceeded the upper limit of the reference range of the central laboratory and with previously diagnosed atraumatic vertebral fracture or high and low impact fracture of the hip or wrist.
7.2.2.3. Study treatments
Ertugliflozin 5 mg, ertugliflozin 10 mg and matching placebos were supplied as immediate-release tablets for oral administration.
Placebo run-in period: A single blind placebo run-in was administered starting at Day -14/Visit S3 where subjects were instructed to take 1 tablet of placebo ertugliflozin 5 mg and 1 tablet of placebo ertugliflozin 10 mg each morning from the bottles provided for this period. The last dose of placebo run-in study medication was to be taken on the day prior to Day 1. Subjects were not informed that they were taking placebo during this period. Phase A randomised, double blind primary treatment period: On Day 1, each subject was randomly assigned (in a 1:1:1 ratio) to ertugliflozin 5 mg, ertugliflozin 15 mg, or placebo. If a subject missed a dose of study medication during the study, he/she was instructed to take it as soon as the subject remembered unless it was time for the next dose. Subjects were instructed not to ‘make up’ for the missed dose by taking a double dose at the same time.
Subjects were prescribed open label glycaemic rescue therapy and dosed according to physician judgment if they met specific, progressively more stringent, glycaemic criteria based on a repeated, confirmed FPG or HbA1c measured by the central laboratory (Table 40).
12 Agreed to remain abstinent from heterosexual activity (if this form of birth control was accepted by local regulatory agencies and ethics review committees as the sole method of birth control), or agreed to use (or have their partner use) acceptable contraception to prevent pregnancy while the subject was receiving study medication and for 14 days after the last dose of study medication. Two methods of contraception were used to avoid pregnancy. Acceptable combinations of methods included: • Use of one of the following double-barrier methods: diaphragm with spermicide and a condom; cervical cap and a condom; or a contraceptive sponge and condom. • Use of hormonal contraception (any registered and marketed contraceptive agent that contained an oestrogen and/or a progestational agent [including oral, subcutaneous, intrauterine and intramuscular agents, and cutaneous patch]) with one of the following: diaphragm with spermicide; cervical cap; contraceptive sponge; condom; vasectomy; or intrauterine device (IUD). • Use of an IUD with one of the following: condom; diaphragm with spermicide; contraceptive sponge; vasectomy; or hormonal contraception • Vasectomy with one of the following: diaphragm with spermicide; cervical cap; contraceptive sponge; condom; IUD; or hormonal contraception.

Therapeutic Goods Administration
Submission PM-2017-001328-1-5 Extract from the Clinical Evaluation Report for Steglatro Attachment 2 PART 1 FINAL 31 January 2019
Page 64 of 121
Table 40: Glycaemic thresholds
Subjects were to have the repeat FPG measurement performed as early as possible (within 7 days following the receipt of test results) to determine if they met the criterion for glycaemic rescue therapy. During Phase A, subjects exceeding pre-specified glycaemic thresholds after randomisation had glycaemic rescue therapy initiated with open label glimepiride. Subjects who were initiated on open label glimepiride rescue therapy, and who reached the maximum allowed dose (or tolerated dose, if lower), and met glycaemic rescue FPG criteria (after at least 2 weeks on maximum dose of glimepiride), had additional glycaemic rescue therapy with basal insulin initiated and managed as considered appropriate by the investigator (that is, including selection of agent and starting dose, timing of administration, and up-titration).
Medications that were indicated as prohibited in the exclusion criteria were not permitted prior to or during the study. Thyroid replacement medication (for example, thyroxine) was permitted, but subjects were to be on a stable dose for at least 6 weeks prior to randomisation. Subjects who were not on a stable dose of blood pressure or lipid altering medications at S1 were scheduled appropriately for S3 and Day 1 to ensure they had a stable dose for at least 4 weeks prior to randomisation. Subjects had to abstain from all food and drink (except water) at least 10 hours prior to any blood sample collections for clinical laboratory tests and fasting glucose monitoring. Subjects were counselled on appropriate dietary and lifestyle guidelines for T2DM at S2 and asked to maintain these guidelines throughout participation in the study. Counselling on dietary guidelines was in accordance with local medical standards of care for subjects with T2DM.
7.2.2.4. Efficacy variables and outcomes
The efficacy endpoints were identical to those discussed previously.
7.2.2.5. Randomisation and blinding
The randomisation was stratified based on postmenopausal status (as well as the geographical region). Approximately 50% of the population enrolled in the trial was planned to be women who were postmenopausal for 3 years or more (at least 3 years since their LMP or had bilateral oophorectomy performed 3 years or more prior to screening). The stratification factor had 4 levels:
• Men
• Premenopausal women
• Women who were perimenopausal or postmenopausal for less than 3 years after LMP or had bilateral oophorectomy performed less than 3 years prior to screening
• Women who were postmenopausal for 3 years or more after LMP or women with a history of bilateral oophorectomy performed 3 years or more prior to screening.
Allocation of subjects to treatment groups proceeded through the use of a randomisation system (IVRS) that was accessible 24 hours per day, 365 days per year. A computer generated randomisation code using the method of random permuted blocks was utilised to assign subjects to 1 of 3 treatment regimens (ertugliflozin 5 mg, ertugliflozin 15 mg or placebo) on Day 1 (V4). Phase A of this study was subject-, investigator-, and Sponsor-blinded. The study utilised a double-dummy approach to maintain double blinding, with a placebo tablet matching the ertugliflozin 5 mg tablet and another placebo tablet matching the ertugliflozin 10 mg tablet. Subjects were instructed to take 1 ertugliflozin 5 mg tablet (or matching placebo) and

Therapeutic Goods Administration
Submission PM-2017-001328-1-5 Extract from the Clinical Evaluation Report for Steglatro Attachment 2 PART 1 FINAL 31 January 2019
Page 65 of 121
1 ertugliflozin 10 mg tablet (or matching placebo) daily. Thus, all subjects were to take 2 tablets each day of ertugliflozin/placebo.
7.2.2.6. Analysis populations
The Full Analysis Set (FAS) population was the primary analysis population for most efficacy endpoints and also for the BMD endpoints (labelled as the BMD FAS). For analyses that used the constrained longitudinal data analysis (cLDA) model, the FAS population, defined separately for each analysis endpoint, consisted of all randomised subjects who:
• Received at least 1 dose of study treatment
• Had a baseline measurement or a post-randomisation measurement for the analysis endpoint subsequent to at least 1 dose of study treatment.
Data Censoring: Post-glycaemic rescue therapy data from subjects who received glycaemic rescue therapy, as well as post-bariatric surgery data, were censored from analyses of glycaemic, body weight and blood pressure endpoints, but these analyses were not censored after the initiation of BMD rescue therapy. BMD related endpoint data including Bone Biomarker and PTH data were excluded from the analysis at the point of a subject taking BMD rescue therapy or undergoing bariatric surgery, but were not censored after initiation of glycaemic rescue therapy, as glycaemic rescue therapy was unlikely to have an impact on BMD endpoints. Bone biomarker data and PTH data were also censored from the analysis if the samples were collected > 7 days from the last dose of study medication.
A secondary population for safety constructed at 3 specific time points for analysing the BMD endpoints was the BMD Per-Protocol (BMD PP);13 population (1) at Week 26, (2) at Week 52 and (3) at Week 104.
All Subjects Treated (AST) population was used for the time-to-rescue analysis and for summarising baseline characteristics, subject disposition and compliance. The AST population consisted of all randomised subjects who received at least 1 dose of study treatment. Subjects were classified according to randomised treatment.
7.2.2.7. Sample size
The sample size of approximately 600 subjects (200 per arm) provided at least 99% power to detect a difference of 0.5% in the primary endpoint of reduction in HbA1c from baseline to Week 26 (assuming a standard deviation of 1.0%) between each ertugliflozin dose and placebo (and 98% power for detecting this difference for both doses versus placebo) using a 2-sided 0.05 alpha level test, allowing for a dropout rate of up to 20%. To control the overall Type I error rate at 0.05, a sequential testing approach was used across the primary and secondary efficacy endpoints for which hypotheses were tested, and for the 2 doses of ertugliflozin.
The sample size for this study also provided adequate precision for the comparisons of ertugliflozin versus placebo with respect to the changes in BMD from baseline to Week 26.
13 All randomised subjects who took at least 1 dose of study medication, with a BMD measurement both at baseline and in the day range for the time point of interest (that is, Week 26 for Week 26 BMD PP; Week 52 for Week 52 BMD PP and Week 104 for Week 104 BMD PP – with no imputation of missing data) prior to initiation of BMD rescue therapy or bariatric surgery, and did not meet any of following conditions were included in this population. • Study medication compliance < 75%. • Use of pharmacologic doses of systemic corticosteroids for ≥ 2 consecutive weeks during the final 180 days prior to the analysis time point. • Incorrect double blind study medication for ≥ 14 consecutive days, during the final 180 days prior to the analysis time point. • Use of bisphosphonates (for > 7 days) or other medications indicated to treat osteoporosis (that is, denosumab, calcitonin, oestrogen replacement or analogues/ SERMs, PTH) during the final 180 days prior to the analysis time point, or use for more than 1 month in total any time during the study prior to the analysis time point. • Any disorders affecting bone metabolism (including but not limited to active endocrinopathies such as Cushing’s disease, thyrotoxicosis, active inflammatory arthritis and disorders associated with marked weight loss, that is, ≥ 10% reduction from baseline).

Therapeutic Goods Administration
Submission PM-2017-001328-1-5 Extract from the Clinical Evaluation Report for Steglatro Attachment 2 PART 1 FINAL 31 January 2019
Page 66 of 121
Assuming an SD of 3.3%;14 and allowing for a dropout rate of up to 15% at Week 26, the half width of the 95% confidence interval (CI) for the between-treatment difference was expected to be ± 0.7% from the point estimate for the overall study population, and also of approximately ± 1.0% for the post-menopausal for ≥ 3 years subgroup, which was analysed separately (assuming this would be approximately 50% of the overall study population). These CI half widths were precise enough to rule out clinically relevant changes in BMD, both for the overall study population and the ≥ 3 years postmenopausal subgroup. This was based on changes in BMD that were approximately 50% of the average changes from baseline to Week 80 observed for thiazolidinediones, which were known to be associated with significant bone loss and an increased risk of fracture.
7.2.2.8. Statistical methods
A cLDA, based on the FAS (for cLDA analyses) was used to evaluate the change from baseline in HbA1c levels at Week 26 as the primary efficacy analysis. The statistical model included terms for treatment (categorical), visit (categorical), the treatment by visit interaction, menopausal status randomization stratum (categorical), AHA status at study entry and baseline eGFR (continuous). No explicit imputation of missing data was performed. All statistical tests were conducted at the alpha = 0.05 (2-sided) level. Change from baseline at Week 26 in FPG, body weight, systolic blood pressure, and diastolic blood pressure were each analyzed with the same cLDA approach (and statistical model construct) as the primary efficacy analysis.
Comment: Confirmation of the cLDA analysis was not done using the longitudinal ANCOVA model.
7.2.2.9. Participant flow
In total, 1535 subjects were screened and 914 subjects were excluded during screening. The most common reason for subjects not being randomised was screen failure (98.2% of subjects who were not randomised) and the most common reason for screen failure was not meeting the HbA1c inclusion criterion The remaining 621 subjects were randomised at 103 sites in 14 countries (randomisation at each centre ranged from 1 to 20 subjects). A high completion rate was observed for all treatment groups (> 90% of subjects) during Phase A of the study. The proportion of subjects who discontinued study medication in Phase A was numerically higher in the placebo group compared to the ertugliflozin groups. In the ertugliflozin 15 mg group and placebo group the most common reason for study medication discontinuation was withdrawal by subject; in the ertugliflozin 5 mg group the most common reasons were withdrawal by subject and AE. Reasons for study medication discontinuation were generally similar between groups.
7.2.2.10. Major protocol violations
Overall, 204 (32.9%) of 621 subjects who received treatment with study medication were reported to have 1 or more major deviations. The most common major deviations were those associated with subjects who did not give appropriate informed consent (18.5%) and failure to conduct major/significant evaluations (12.1%). These deviations were not expected to affect safety or efficacy conclusions. Other protocol deviations, including those with a potential to meaningfully impact efficacy analyses (for example, < 75% compliance with study medication, and taking glycaemic rescue therapy without meeting rescue criteria) did not occur or occurred at low incidences across treatment groups. Furthermore, during the conduct of this study, 4 subjects were identified who were randomised at more than 1 site in this trial, who
14 In a recent study of another SGLT2 inhibitor (dapagliflozin) in subjects with inadequately controlled T2DM on metformin, the largest variability for the change from baseline in BMD was at the total hip site, with an SD of approximately 3.3% after 50 weeks. Assuming that the SD of the change in BMD increased over time, 3.3% was taken as a conservative estimate of the variability at 26 weeks for precision calculations and also to ensure adequate precision for all BMD sites.

Therapeutic Goods Administration
Submission PM-2017-001328-1-5 Extract from the Clinical Evaluation Report for Steglatro Attachment 2 PART 1 FINAL 31 January 2019
Page 67 of 121
randomised at a site in this trial and at least 1 other site in the ertugliflozin Phase III development program and thus were multiply-enrolled and were counted as major protocol violations.
7.2.2.11. Baseline data
Overall, majority of the subjects were female (53.6%), White (66.2%) and aged between 45 to 64 years (75%). Majority of female subjects (76.6%) were postmenopausal for ≥ 3 years. The percentage of female subjects, including the percentage of subjects who were postmenopausal, was similar across treatment groups. However, 11 subjects; 3 subjects in the ertugliflozin 15 mg group, 6 subjects in the ertugliflozin 5 mg group and 2 subjects in the placebo group, were incorrectly stratified with regards to postmenopausal status by the IVR/IWR system The stratification was not corrected in analyses. Baseline demographic and anthropometric characteristics were similar between-treatment groups. Baseline HbA1c, FPG, and eGFR values were similar between groups (Table 41).
Table 41: Subjects with specific concomitant medications (incidence ≥ 5% in 1 or more treatment groups; all subjects treated) Phase A

Therapeutic Goods Administration
Submission PM-2017-001328-1-5 Extract from the Clinical Evaluation Report for Steglatro Attachment 2 PART 1 FINAL 31 January 2019
Page 68 of 121
Table 41 (continued): Subjects with specific concomitant medications (incidence ≥ 5% in 1 or more treatment groups; all subjects treated) Phase A
In order to be enrolled in the study, subjects were required to be on a stable dose of metformin monotherapy; therefore, 100% of subjects were taking drugs used for diabetes (~30% of subject were on two AHAs prior to study enrolment). The other most common prior medication categories were agents acting on the renin-angiotensin system (60.5%), lipid modifying agents (56.7%) and analgesics (35.9%) with no clinically important differences between-treatment groups. Following randomisation, subjects were to remain on metformin during the study. The most common concomitant drug therapeutic categories were agents acting on the renin-angiotensin system (61.5%), lipid modifying agents (58.8%) and analgesics (41.1%) with no clinically important differences between-treatment groups (Table 42). The duration of T2DM and the background AHA therapy were similar between the 3 treatment groups. All subjects were on background AHA therapy (99.8% on metformin, 26.4% on SUs and 3.4% on DPP-4 inhibitors). One (1) subject in the ertugliflozin 15 mg group was not on biguanides (metformin) at S1 visit, but started at S2 visit. The overall mean and median dose of metformin at randomisation was approximately 2000 mg/day and was similar across all groups. No subject was on a minimum metformin dose < 1500 mg/day at randomisation. Besides T2DM, the other most common categories of medical history conditions by SOC were Metabolism and nutrition disorders (74.7%), Vascular disorders (72.6%) and Social circumstances (71.8%) primarily due to the collection of male circumcision status in this study. The most common (> 25% of subjects) specific medical history conditions (by PT) were hypertension (70.4%), hyperlipidaemia (27.1%) and dyslipidaemia (25.6%) with no clinically important differences among treatment groups. Mean compliance with study medication was ≥ 98% in each treatment group.

Therapeutic Goods Administration
Submission PM-2017-001328-1-5 Extract from the Clinical Evaluation Report for Steglatro Attachment 2 PART 1 FINAL 31 January 2019
Page 69 of 121
Table 42: Subject characteristics baseline HbA1c, FPG, eGFR (US units; all subjects treated)
7.2.2.12. Primary efficacy results
Compared with placebo, the LS mean reduction from baseline in HbA1c at Week 26 was significantly greater (p < 0.001 for both comparisons) for both ertugliflozin 5 mg (placebo subtracted difference =-0.70, 95% CI: -0.87, -0.53) and 15 mg (-0.88, 95% CI: -1.05, -0.71) groups (Table 43). Large reductions in mean HbA1c in the ertugliflozin groups through Week 12 were followed by smaller reductions through Week 26. The point estimate of the reduction in HbA1c was numerically greater in the ertugliflozin 15 mg group than in the ertugliflozin 5 mg group at each time point. In the placebo group, there was no clinically meaningful change from baseline in HbA1c throughout the study (Figure 7).
LS mean reductions from baseline in HbA1c were greater in the ertugliflozin 15 mg and 5 mg groups than in the placebo group across all subgroup categories. Additionally, the numerically greater reduction in HbA1c with ertugliflozin 15 mg relative to 5 mg was seen consistently across all subgroups. Reductions in HbA1c in the ertugliflozin groups relative to the placebo group were numerically greater in the subgroup of subjects with a baseline HbA1c ≥ 9%, followed by those with HbA1c ≥ 8% to < 9% at baseline and lowest in those with a baseline HbA1c < 8%. Reductions in HbA1c in the ertugliflozin groups relative to the placebo group were also numerically greater in the subgroup of subjects with a baseline median age of ≤ 58 years versus those with a baseline median age of > 58 years (Table 44). The improvements in HbA1c in the ertugliflozin groups relative to the placebo group were not affected by gender or race (Figure 8).

Therapeutic Goods Administration
Submission PM-2017-001328-1-5 Extract from the Clinical Evaluation Report for Steglatro Attachment 2 PART 1 FINAL 31 January 2019
Page 70 of 121
Table 43: HbA1c (%) change from Baseline at Week 26 (cLDA) (FAS: excluding rescue approach)
Figure 7: HbA1c (%) LS mean change from baseline over time (cLDA) (FAS: excluding rescue approach)
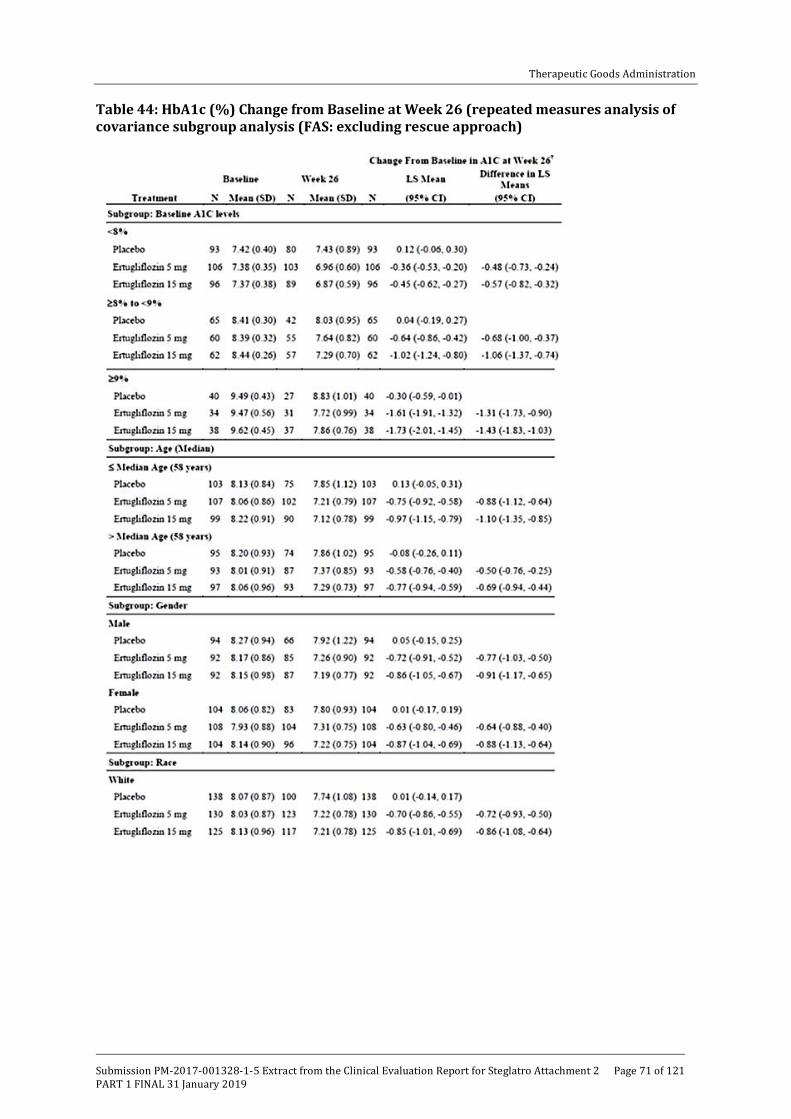
Therapeutic Goods Administration
Submission PM-2017-001328-1-5 Extract from the Clinical Evaluation Report for Steglatro Attachment 2 PART 1 FINAL 31 January 2019
Page 71 of 121
Table 44: HbA1c (%) Change from Baseline at Week 26 (repeated measures analysis of covariance subgroup analysis (FAS: excluding rescue approach)
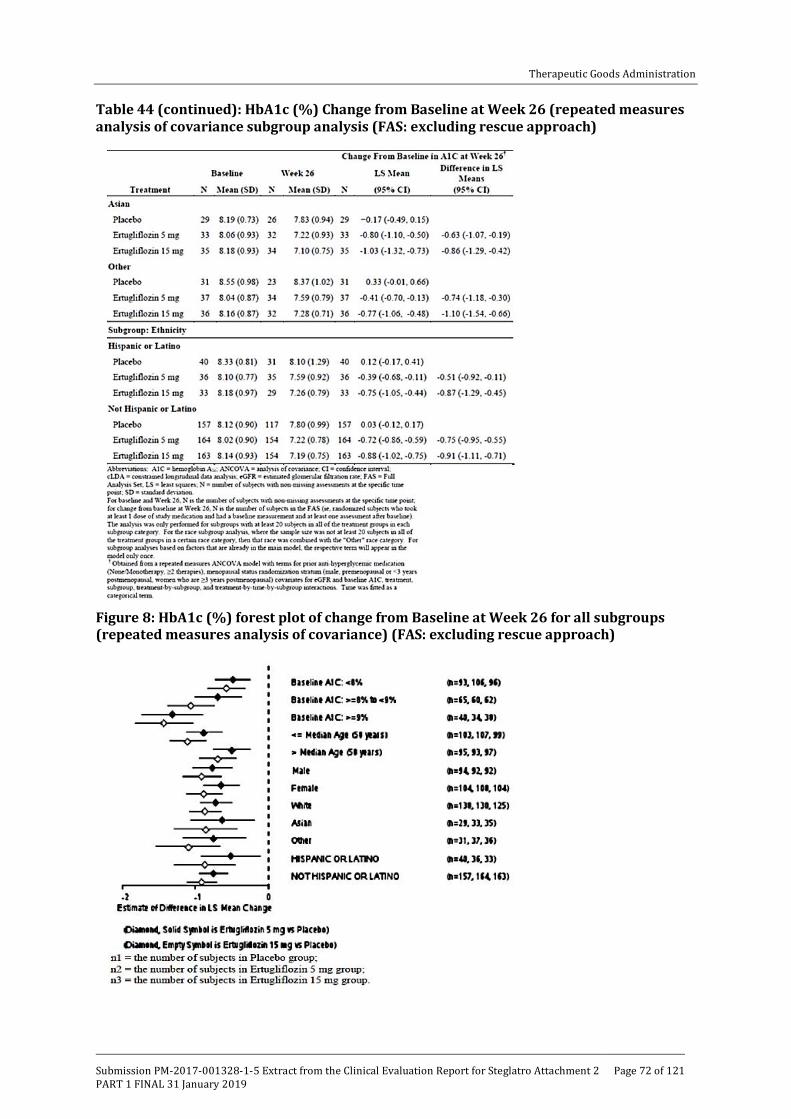
Therapeutic Goods Administration
Submission PM-2017-001328-1-5 Extract from the Clinical Evaluation Report for Steglatro Attachment 2 PART 1 FINAL 31 January 2019
Page 72 of 121
Table 44 (continued): HbA1c (%) Change from Baseline at Week 26 (repeated measures analysis of covariance subgroup analysis (FAS: excluding rescue approach)
Figure 8: HbA1c (%) forest plot of change from Baseline at Week 26 for all subgroups (repeated measures analysis of covariance) (FAS: excluding rescue approach)

Therapeutic Goods Administration
Submission PM-2017-001328-1-5 Extract from the Clinical Evaluation Report for Steglatro Attachment 2 PART 1 FINAL 31 January 2019
Page 73 of 121
7.2.2.13. Other efficacy results
The raw proportions of subjects with an HbA1c < 7.0% were approximately 2.5-times greater in the ertugliflozin 5 mg and 15 mg groups than in the placebo group (35.3%, 40% and 15.8% in th ertugliflozin 5 mg, 15 mg and placebo group, respectively). The model based odds of having an HbA1c < 7.0% at Week 26, using multiple imputation for subjects with missing Week 26 data, were significantly greater in both ertugliflozin groups compared to the placebo group (p < 0.001 for both comparisons). Similarly, the proportion of subjects with an HbA1c < 6.5% were approximately 3 and 4 times greater in the ertugliflozin 5 and 15 mg groups, respectively, than in the placebo group (8.7%, 12.2% and 2.9%, respectively). The model based odds of having an HbA1c < 6.5% at Week 26, using multiple imputation for subjects with missing Week 26 data, were greater in the ertugliflozin 15 mg group and the ertugliflozin 5 mg group compared to the placebo group (nominal p < 0.001 and p = 0.023, respectively) (Table 45).
Table 45: Analysis of subjects with HbA1c < 7% and < 6.5%
Compared with placebo, the LS mean reductions from baseline in FPG at Week 26 were significantly (p < 0.001 for both comparisons) greater in the 5 mg and 15 mg ertugliflozin groups -1.5, -2.2 and -0.05mmol/L, respectively). The mean FPG decreased at Week 6 in the ertugliflozin groups and was followed by further reductions through Week 26. The magnitude of the reduction in FPG was numerically greater in the ertugliflozin 15 mg group than in the ertugliflozin 5 mg group at each time point (Figure 9).

Therapeutic Goods Administration
Submission PM-2017-001328-1-5 Extract from the Clinical Evaluation Report for Steglatro Attachment 2 PART 1 FINAL 31 January 2019
Page 74 of 121
Figure 9: FPG (mg/dL) LS Mean change from Baseline over time (cLDA) (FAS: excluding rescue approach)
Compared with placebo, the LS mean reductions from Baseline in body weight at Week 26 were significantly (p < 0.001 for both comparisons) greater in the ertugliflozin groups (-3.0, -2.9 and -1.3kg, respectively). In both ertugliflozin groups, body weight decreased from baseline through Week 18 and had further reductions through Week 26. In the placebo group body weight decreased from baseline through Week 26. The decrease at each time point was numerically greater in both ertugliflozin groups compared to the placebo group, and not notably different between the ertugliflozin groups (Figure 10).
Figure 10: Body weight (kg): LS Mean change from Baseline over time (cLDA) (FAS: excluding rescue approach)
Compared with placebo, the LS mean reductions from baseline in sitting SBP at Week 26 were significantly greater in the ertugliflozin 5 mg and 15 mg groups (-4.4, -5.2 and -0.7mmHg

Therapeutic Goods Administration
Submission PM-2017-001328-1-5 Extract from the Clinical Evaluation Report for Steglatro Attachment 2 PART 1 FINAL 31 January 2019
Page 75 of 121
respectively; p = 0.002 and p < 0.001 versus placebo for 5 mg and 15 mg, respectively). In both ertugliflozin groups, sitting SBP decreased from baseline through Week 26. Reductions from baseline in sitting SBP were numerically greater in the ertugliflozin 15 mg group compared to the ertugliflozin 5 mg group at each time point through Week 26 (Figure 11). The LS mean reductions from baseline in sitting DBP at Week 26 were also significantly greater in the ertugliflozin 5 mg and 15 mg groups (-1.6, -2.2 and +0.23mmHg, respectively; p = 0.001 and p = 0.013 versus placebo, respectively). In both ertugliflozin groups, sitting DBP decreased from baseline through Week 6, which decreased further through Week 26. In the placebo group, sitting DBP was stable at Week 6, increased slightly through Week 18 and was stable again through Week 26. Reductions from baseline in sitting DBP were numerically greater in the ertugliflozin 15 mg group compared to the ertugliflozin 5 mg group at all time points after Week 6 (Figure 12).
Figure 11: Sitting systolic blood pressure (mmHg) LS mean change from Baseline over time (cLDA) (FAS: excluding rescue approach)

Therapeutic Goods Administration
Submission PM-2017-001328-1-5 Extract from the Clinical Evaluation Report for Steglatro Attachment 2 PART 1 FINAL 31 January 2019
Page 76 of 121
Figure 12: Change from Baseline in sitting DBP and change over time
The percentage of subjects who received glycaemic rescue therapy at Week 26 was 17.7% in the placebo group, with infrequent initiation of glycaemic rescue therapy in both ertugliflozin groups (< 3% in both groups; nominal p < 0.001 for both comparisons).
Sensitivity analyses were performed to assess the impact of missing data on the conclusions from the primary analysis. LS mean reductions in HbA1c at Week 26 were greater in the ertugliflozin groups relative to the placebo group (nominal p < 0.0001 for both comparisons) in the J2R analyses, excluding data after initiation of glycaemic rescue therapy (Table 46). The tipping-point analyses, in which data collected after initiation of glycaemic rescue therapy were also considered missing showed that, to shift the primary result to a non-significant result, the HbA1c change from baseline among subjects in the ertugliflozin groups with missing data would need to have been substantially worse than that expected under the missing at random

Therapeutic Goods Administration
Submission PM-2017-001328-1-5 Extract from the Clinical Evaluation Report for Steglatro Attachment 2 PART 1 FINAL 31 January 2019
Page 77 of 121
assumption (over 6.9% and over 7.4% for ertugliflozin 5 mg and 15 mg, respectively, with no change in placebo). Since these HbA1c increases are clinically highly unlikely, the tipping point analysis results support the robustness of the conclusions based upon the primary analytic approach (Table 47).
Table 46: HbA1c (%); Change from Baseline at Week 26 jump to reference missing data approach (FAS: excluding rescue approach)
Table 47: HbA1c (%); Change from Baseline at Week 26 tipping point analysis missing data approach (FAS: excluding rescue approach)
7.2.2.14. Evaluator commentary
This pivotal Phase III study evaluated the efficacy and safety of the addition of ertugliflozin (5 mg and 15 mg) for treatment of 621 subjects with T2DM and inadequate glycaemic control on metformin monotherapy at a dose ≥ 1500 mg/day. The population studied reflected patients with a wide range of glycaemic control, from mild to moderately severe, and a typical profile for patients with T2DM, with regard to age and sex and co-morbidities. About 30% of the subjects were on prior treatment with two AHAs (metformin + SUs most common). Approximately 40% of the randomised subjects were women greater than 3 years post-menopause in order to assess bone safety in this population. These baseline characteristics were comparable across the

Therapeutic Goods Administration
Submission PM-2017-001328-1-5 Extract from the Clinical Evaluation Report for Steglatro Attachment 2 PART 1 FINAL 31 January 2019
Page 78 of 121
three treatment groups and the study population was representative of patients with inadequate control on metformin monotherapy in clinical practice.
The decreases in HbA1c were robust and clinically important with both ertugliflozin doses compared with placebo (difference from placebo = 0.70 and -0.88, respectively; p < 0.001 for both comparisons) with a modestly greater decrease seen at 15 mg relative to 5 mg of ertugliflozin. Treatment with ertugliflozin also demonstrated significant improvements on other measures of glycaemia, including reducing FPG and increasing the proportion of subjects reaching an HbA1c < 7% relative to placebo with numerically greater improvements observed in the 15 mg relative to 5 mg ertugliflozin dose. In addition to the clinically meaningful improvements in glycaemic control, subjects in the ertugliflozin 5 mg and 15 mg groups had significantly greater reductions in body weight and systolic and diastolic blood pressure at Week 26 compared to the placebo group. More than 70% of subjects in this study were on antihypertensive medication at randomisation with mean baseline SBP/DBP of approximately 130/78 mmHg and the reductions in mean SBP and DBP by ertugliflozin (5 mg and 15 mg) may be clinically relevant.
Overall, this study provided evidence of efficacy of ertugliflozin (5 mg and 15 mg QD) over placebo when used in combination with metformin (daily doses ≥ 1500 mg) for T2DM adults with inadequate glycaemic control on diet/ exercise and metformin monotherapy (at a dose ≥ 1500 mg /day). Evidence of efficacy beyond 6 months was not provided in this submission although results of Phase B (weeks 26 to 104) of the study should provide data on long term maintenance of efficacy following treatment with ertugliflozin plus metformin.
7.2.3. Study P002/1013: Add-on to metformin
7.2.3.1. Study design, objectives
This was a multicentre, randomised, double blind, active comparator controlled parallel group clinical trial of ertugliflozin in adults with T2DM and inadequate glycaemic control ((HbA1c ≥ 7.0% and ≤ 9.0% (≥ 53 and ≤ 75 mmol/mol)) on ≥ 1500 mg/day metformin monotherapy for at least 8 weeks. The double blind treatment period was 104 weeks in duration and divided into two 52 week phases (Phase A; Weeks 0 to 52; Phase B; Weeks 52 to 104) and only Phase A results were provided in submitted dossier (Figure 13).

Therapeutic Goods Administration
Submission PM-2017-001328-1-5 Extract from the Clinical Evaluation Report for Steglatro Attachment 2 PART 1 FINAL 31 January 2019
Page 79 of 121
Figure 13: Study P002/1013 Overview of trial design
The primary objective was: In subjects with T2DM and inadequate control on metformin, to assess the HbA1c lowering efficacy after 52 weeks of the addition of ertugliflozin 15 mg compared with the addition of glimepiride. The secondary objectives were to assess the effects on the following parameters in subjects with T2DM and inadequate control on metformin, after 52 weeks: effects of the addition of ertugliflozin 15 mg compared with the addition of glimepiride:
• incidence of symptomatic hypoglycaemia, change in body weight from baseline, change in SBP
• effect of the addition of ertugliflozin 5 mg QD compared with the addition of glimepiride on HbA1c, incidence of symptomatic hypoglycaemia, change in body weight and SBP
• effect of the addition of ertugliflozin compared with the addition of glimepiride on the proportion of subjects at the HbA1c goal of < 7.0% (< 53 mmol/mol).
• effect of the addition of ertugliflozin compared with the addition of glimepiride on DBP.
• effect of the addition of ertugliflozin compared with the addition of glimepiride on durability of glycaemic efficacy.
• effect of the addition of ertugliflozin compared with the addition of glimepiride on the proportion of subjects meeting the composite endpoint of an HbA1c decrease > 0.5% with no symptomatic hypoglycaemia and no body weight gain.
• effect of the addition of ertugliflozin compared with the addition of glimepiride on the proportion of subjects meeting the composite endpoint of an HbA1c < 7.0% with no symptomatic hypoglycaemia.
The study was initiated on 17 Dec 2013 and is still ongoing (last subject visit for Phase A was 28 April 2016). It was conducted in 16 countries at 232 trial centers: 9 in Argentina, 16 in Canada, 11 in the Czech Republic, 14 in Hungary, 18 in South Korea, 7 in Lithuania, 10 in Mexico, 10 in the Philippines, 14 in Poland, 18 in Romania, 14 in Russia, 12 in Slovakia, 10 in South Africa, 7 in Taiwan, 5 in Ukraine and 57 in the United States.

Therapeutic Goods Administration
Submission PM-2017-001328-1-5 Extract from the Clinical Evaluation Report for Steglatro Attachment 2 PART 1 FINAL 31 January 2019
Page 80 of 121
7.2.3.2. Inclusion exclusion criteria
The main inclusion criteria were: ≥ 18 years of age, have BMI ≥ 18.0 kg/m2. have diagnosis of T2DM in accordance with ADA guidelines and meet one of the following criteria: On metformin monotherapy ≥ 1500 mg/day for ≥ 8 weeks with a Visit 1/Screening HbA1c ≥ 7.0% and ≤ 9.0% (≥ 53 mmol/mol and ≤ 75 mmol/mol) OR On metformin monotherapy ≥ 1500 mg/day for < 8 weeks with a Visit 1/Screening HbA1c ≥ 7.0% and ≤ 9.0% (≥ 53 mmol/mol and ≤ 75 mmol/mol) OR On metformin monotherapy < 1500 mg/day with a Visit 1/Screening HbA1c ≥ 7.5% and ≤ 9.5% (≥ 58 mmol/mol and ≤ 80 mmol/mol) OR On metformin in combination with a single allowable AHA (that is, SUs at < 50% the maximum approved dose in the local country label, DPP-4 inhibitors, meglitinides, or AGIs) with a Visit 1/Screening HbA1c ≥ 6.5% and ≤ 8.5% (≥ 48 mmol/mol and ≤ 69 mmol/mol). Other inclusion and exclusion criteria were similar to those described previously with exception that subjects with known hypersensitivity or intolerance to glimepiride or other sulfonylureas were also excluded.
7.2.3.3. Study treatments
Subjects underwent a 2 week, single blind placebo run-in period after their metformin dose had been stable for ≥ 8 weeks. Subjects on < 1500 mg/day of metformin with an HbA1c of ≥ 7.5% and ≤ 9.5% (≥ 58 and ≤ 80 mmol/mol) received diet/exercise counselling, titrated their dose of metformin to ≥ 1500 mg/day, and underwent a metformin dose-stabilisation period ≥ 8 weeks in duration. Subjects on any dose of metformin in combination with a single allowable AHA who had an HbA1c of ≥ 6.5% and ≤ 8.5% (≥ 48 and ≤ 69 mmol/mol) received diet/exercise counselling, discontinued the non-metformin AHA, titrated their dose of metformin to ≥ 1500 mg/day (if necessary), and underwent a metformin dose stabilisation period ≥ 8 weeks in duration. Allowable AHAs included sulfonylureas (SUs) administered at < 50% the maximum approved dose (per local country label), DPP-4 inhibitors, meglitinides and alpha-glucosidase inhibitors. The metformin dose stabilisation period was ≥ 10 weeks in duration for subjects who discontinued an SU. After the metformin titration (if necessary) and dose-stabilisation periods, subjects with an HbA1c of ≥ 7.0 and ≤ 9.0% (≥ 53 and ≤ 75 mmol/mol) entered a 2 week, single blind, placebo run-in period. Subjects who had adequate compliance during the placebo run-in period and who met all other entry criteria were eligible to enter the 104 week double blind treatment period and randomised in a 1:1:1 ratio to ertugliflozin 5 mg QD, ertugliflozin 15 mg QD or glimepiride. Glimepiride/matching placebo was initiated at 1 mg QD and titrated up to the maximum approved dose (6 or 8 mg QD based on the local country label) or maximum tolerated dose. Subjects who met progressively more stringent glycaemic rescue criteria (Table 48) were to receive open label sitagliptin in accordance with the local country label. Subjects who had a prior history of hypersensitivity or intolerance to sitagliptin were to be discontinued from study medication. After initiating glycaemic rescue therapy, subjects were to continue the same dose and regimen of their study medication and background metformin (Tables 49 and 50). Medications prohibited while subjects were receiving study medication during the double blind treatment periods is summarised in the footnote).15 The investigator or subject’s
15 Medications listed below were prohibited while subjects were receiving study medication during the double blind treatment period: 1) Other Anti-hyperglycaemic Medications: Insulin of any type (except for short-term use during hospitalisation and no longer required); Other injectable AHAs [for example, pramlintide, exenatide, liraglutide]; Pioglitazone or rosiglitazone; SGLT2 inhibitors (except blinded ertugliflozin); SUs (except blinded glimepiride); DPP4 inhibitors (except sitagliptin rescue medication); Bromocriptine (Cycloset); Colesevelam (Welchol); Any other AHA with the exception of the protocol-approved agents. 2) Corticosteroids: Treatment for ≥ 14 consecutive days or repeated courses of pharmacologic doses of corticosteroid was prohibited. Note: Inhaled, nasal, and topical corticosteroids and physiological replacement doses of adrenal steroids were permitted. 3) Weight-loss medications: associated with Initiation of a weight-loss medication (for example, orlistat, phentermine, topiramate, lorcaserin) was prohibited. Note: Subjects who were on treatment with a weight-loss medication or other medication weight changes (for example, anti-psychotic agents) and who were weight-stable (that is, <5% change in body weight within 6 months of Visit 1/Screening) at Visit 1/Screening were eligible to participate in the study and permitted to continue these medications during the study.

Therapeutic Goods Administration
Submission PM-2017-001328-1-5 Extract from the Clinical Evaluation Report for Steglatro Attachment 2 PART 1 FINAL 31 January 2019
Page 81 of 121
physician/health care provider was permitted to make adjustments in the subject’s non-AHA therapies throughout the trial if clinically warranted. Guidance for specific medications which were permitted during the study is summarised in Table 51).
Table 48: Phase A/Year 1 glycaemic thresholds
Table 49: Guidelines for run-in management

Therapeutic Goods Administration
Submission PM-2017-001328-1-5 Extract from the Clinical Evaluation Report for Steglatro Attachment 2 PART 1 FINAL 31 January 2019
Page 82 of 121
Table 50: Trial treatments
Table 51: Guidance for other medications
Guidance for other medications
The investigator or subject’s physician/health care provider was permitted to make adjustments in the subject’s non-AHA therapies throughout the trial if clinically warranted. Guidance for specific medications which were permitted during the study is provided below.
Blood Pressure and Lipid-altering Medications: Concurrent blood pressure and lipid-lowering medications were permitted. Subjects were to be on stable doses of these medications for at least 4 weeks before Visit 4/Day 1. Subjects whose blood pressure or lipid-lowering medications were not stable at Visit 1/Screening were scheduled appropriately to ensure these medications were stable for at least 4 weeks prior to Visit 4/Day 1.
Hormonal Replacement Therapy and Birth Control Medications: Hormone replacement therapy and birth control medications were permitted, but subjects were to be on stable regimens, and were expected to remain on their stable regimen while receiving study medication during the double blind treatment period and for 14 days after the last dose of study medication.
Thyroid Hormone Replacement Therapy: Thyroid replacement medication (for example, thyroxine) was permitted, but subjects were to be on a stable dose for at least 6 weeks prior to Visit 1/Screening. Subjects who met the thyroid stimulating hormone (TSH) exclusion criterion specified could have been re-screened after being on a stable thyroid replacement
Therapeutic Goods Administration
Submission PM-2017-001328-1-5 Extract from the Clinical Evaluation Report for Steglatro Attachment 2 PART 1 FINAL 31 January 2019
Page 83 of 121
Guidance for other medications
regimen for at least 6 weeks.
Supplements and/or Traditional Medicines: The use of herbal supplements and other natural products was discouraged. Subjects who did not discontinue the use of such supplements prior to Visit 3/Week -2 or combined Visit 2/3 were to be instructed not to change the use or dose of the supplement during the trial. Subjects were to have been instructed not to initiate new supplements during the trial.
7.2.3.4. Efficacy variables and outcomes
Glycaemic efficacy endpoints included the changes from baseline in HbA1c and FPG at Week 52. Blood pressure and body weight were measured at regular time-points during study. HOMA-%beta is a well-accepted means of assessing fasting beta-cell function, and is calculated using the measured fasting insulin or C-peptide and glucose levels. C-peptide16 was chosen to be used for HOMA-%beta calculations in this study. The proportion of subjects who received glycaemic rescue therapy and time to initiation of rescue were also assessed. The efficacy endpoints are summarised in Table 52. The coefficient of durability (COD), defined as the slope of the time profile of mean change from baseline, was derived via least squares (LS) from the constrained longitudinal data analysis (cLDA) model, using analysis time points beginning with Week 26. The estimation of COD provides a quantitative assessment for the rate of deterioration of a treatment after reaching its peak efficacy. A treatment with larger COD tends to be less ‘durable’ than a treatment with smaller COD.
16 Because C-peptide is not (but insulin is) extracted by the liver, the use of C-peptide to calculate HOMA-%β is not confounded by increased hepatic extraction such as that which can occur in conditions of improved hepatic insulin sensitivity. Given that ertugliflozin is predicted to cause weight loss, which could lead to improved hepatic insulin sensitivity.

Therapeutic Goods Administration
Submission PM-2017-001328-1-5 Extract from the Clinical Evaluation Report for Steglatro Attachment 2 PART 1 FINAL 31 January 2019
Page 84 of 121
Table 52: Analysis strategy for efficacy endpoints
7.2.3.5. Randomisation and blinding
A double blind/masking technique was used in this study. Ertugliflozin and glimepiride were packaged identically relative to their matching placebos so that the blind/masking was maintained. The subject, the investigator, sponsor personnel and personnel from the sponsors’ designees, Covance and Parexel, who were involved in the treatment or clinical evaluation of the subjects were unaware of treatment group assignments. Randomisation occurred centrally using an IVRS/IWRS. Subjects were assigned randomly in a 1:1:1 ratio to ertugliflozin 5 mg QD, ertugliflozin 15 mg QD, or glimepiride using a computer-generated randomisation schedule.
7.2.3.6. Analysis populations
The Full Analysis Set (FAS) population was the primary analysis population for all efficacy endpoints. For analyses that used the cLDA model, the FAS population, defined separately for each analysis endpoint, consisted of all randomised subjects who: -Received at least one dose of study medication; -Had a baseline measurement or a post-randomisation measurement for the analysis endpoint subsequent to at least one dose of study medication.
For analyses that used the analysis of covariance (ANCOVA) model, the FAS population defined separately for each analysis endpoint, consisted of all randomised subjects who:
• Received at least one dose of study medication;
• Had baseline data for the analysis endpoint;

Therapeutic Goods Administration
Submission PM-2017-001328-1-5 Extract from the Clinical Evaluation Report for Steglatro Attachment 2 PART 1 FINAL 31 January 2019
Page 85 of 121
• Had at least one post-randomisation observation for the analysis endpoint subsequent to at least one dose of study medication.
A secondary population used for analysing the primary efficacy endpoint at Week 52 was the Per Protocol (PP) population. All randomised subjects who took at least one dose of study medication, with a measurement of the analysis endpoint at both baseline and drug compliance < 75%; use of prohibited AHA medications for a total of ≥ 14 days or ≥ 7 consecutive days after randomisation and within 180 days prior to the analysis time point; Use of pharmacologic doses of corticosteroids for ≥ 2 consecutive weeks after randomisation and within 180 days prior to the analysis time point; Incorrect double blind study medication or a change in metformin dose for ≥ 14 days, during the last 180 days prior to the analysis time point.
A modified FAS (mFAS) population, defined as all subjects in the FAS who did not have any of the protocol deviations defined above, was an additional secondary population. Subjects who discontinued prematurely without a protocol deviation were included in the mFAS.
7.2.3.7. Sample size
Approximately 1230 subjects were to be randomised in a 1:1:1 ratio among the 3 treatment groups. A sample size of 410 per arm was equivalent to an effective sample size of 337 per arm at Week 52 in the power calculation for the primary hypothesis test using the cLDA model in the FAS population. This sample size provided 97% power to declare non-inferiority in HbA1c reduction at Week 52 between a given ertugliflozin dose and glimepiride, using a non-inferiority margin of 0.3%, assuming the true mean difference in HbA1c is 0% (α = 0.05, two-sided test), based on the primary analysis population (FAS). The half-width of the 95% CI was expected to be 0.15%. The probability of meeting the non-inferiority criterion for both ertugliflozin doses in the FAS was 95%.
7.2.3.8. Statistical methods
The primary efficacy analyses compared the efficacy of ertugliflozin relative to glimepiride in change from baseline in HbA1c at Week 52. The mean change from baseline in HbA1c at Week 52 in the ertugliflozin 15 mg group was compared to that in the glimepiride group using the estimated treatment difference via a cLDA model, proposed by Liang and Zeger. Ertugliflozin 15 mg was to be declared non-inferior to glimepiride in terms of HbA1c reduction if the upper limit of the two-sided 95% CI for the mean difference between ertugliflozin 15 mg and glimepiride at Week 52 was less than δ = 0.3%. The non-inferiority test for ertugliflozin 5 mg in HbA1c reduction used the same approach described above following the multiplicity control strategy. All other continuous efficacy endpoints were analysed using the above cLDA method described for HbA1c.
An ANCOVA model was used in the per protocol (PP) population as sensitivity analyses for the primary and key secondary efficacy endpoints at Week 52. The ANCOVA model included treatment, prior antihyperglycaemic medication, baseline eGFR, and baseline value. The ANCOVA model as described above was also used in the FAS population for the primary efficacy endpoint. The last observation carried forward (LOCF) method was used to impute missing data. If the size of the modified FAS (mFAS) population differed from the size of the FAS by > 2% in any treatment group, primary and key secondary endpoints were to be analysed in the mFAS population using the same cLDA methodology described for the FAS.
For the analysis of the percentage of subjects at the HbA1c goals of < 7.0% and < 6.5% at Week 52, the cLDA model that was used for the analysis of HbA1c was used to impute17 missing data for HbA1c. To assess the overall benefit of the trial treatment, two composite endpoints
17 Imputations of the missing data were based on the marginal univariate normal distributions with means equal to the predicted values and variances equal to the squared standard errors for the predicted values from the cLDA model. Ten sets of imputations of each missing value were constructed from the cLDA model. Observed data were not imputed. Subjects were categorised as at or not at the A1C goal (< 7.0% or < 6.5%) at Week 52 after imputation.
Therapeutic Goods Administration
Submission PM-2017-001328-1-5 Extract from the Clinical Evaluation Report for Steglatro Attachment 2 PART 1 FINAL 31 January 2019
Page 86 of 121
were also analyses: (1) the proportion of subjects meeting the composite endpoint of an HbA1c decrease > 0.5% with no AE of symptomatic hypoglycaemia and no weight gain by the end of Week 52 using the Miettinen and Nurminen method in the FAS population for HbA1c and body weight; (2) the proportion of subjects with an HbA1c < 7% with no symptomatic hypoglycaemia at Week 52 was analysed. Missing data were imputed via the LOCF method for both composite endpoints.
Durability of the ertugliflozin treatment effect was evaluated by examining the time profile plot of mean change from baseline in HbA1c from Week 26 to Week 52 for each group. In addition, the COD, defined as the slope of the time profile of mean change from baseline, was derived via least squares from the cLDA model, using analysis time points beginning with Week 26.
7.2.3.9. Participant flow
Of the 2985 subjects who were screened, 1659 subjects were excluded due to screen failure and the most common reasons were not meeting the inclusion criteria for HbA1c at Visit 1 and/or meeting exclusionary laboratory values. Overall, 448, 441 and 437 subjects were randomised to ertugliflozin 5 mg, ertugliflozin 15 mg and glimepiride, respectively; one randomised subject (ertugliflozin 15 mg group) did not receive treatment. The proportion of subjects who discontinued study medication in Phase A was similar in the ertugliflozin 15 mg and glimepiride groups, and numerically higher in the ertugliflozin 5 mg group (24.1%, 18.8% and 20.4% in ertugliflozin 5 mg, 15 mg and glimepiride groups, respectively), primarily related to discontinuations for hyperglycaemia and non-compliance with study drug. The number of subjects who discontinued due to an AE was numerically higher in the ertugliflozin 15 mg group relative to the other 2 groups (3.3%, 5% and 3%, respectively). A total of 20 subjects were discontinued from the study due to site closure: 14 subjects were discontinued at Site 0855, which was closed by the sponsor due to GCP non-compliance issues and 6 subjects were discontinued from sites 0035 and 0559, which closed or terminated participation in the study for non GCP-related reasons. Of the 1326 randomised subjects, 1161 (87.6%) completed Phase A with similar completion rates in all treatment groups (75.9%, 81% and 79.6%, respectively).
Comment: The CSR mentions that besides the 14 subjects from study site 0855 who discontinued another 3 subjects from study site 0042 were also discontinued. However, it is mentioned that these 17 subjects were still included in analyses. Could the sponsors confirm if inclusion of these subjects from study sites which were non-compliant with GCP guidelines had any impact on interpretation of results from this pivotal study. Could the sponsors also clarify if the 6 subjects who discontinued from study sites 0035 and 0559 due to non-GCP related reasons were included in the efficacy analyses.
7.2.3.10. Major protocol violations
During the conduct of this study, 23 subjects were identified who were randomised at more than 1 site in this study, or who were randomised at a site in this study and at least 1 other site in the ertugliflozin Phase III program. These 23 subjects account for 30 randomisations in this study. All of the multiply-enrolled subjects identified in this study were located in the US in South Florida.18 Subjects identified as multiply-enrolled while participating in the study were discontinued from study medication and these multiply-enrolled subjects were reported as major protocol deviators. The significant misconduct of these multiply-enrolled subjects compromises the integrity of their study data because it is not possible to ascertain the treatment they administered, if any, during the study. Therefore, results from these subjects are excluded from all analyses, as well as from disposition and demographic tabulations. Thirty-five (2.6%) subjects are listed as protocol deviators due to fraudulent behaviour in the conduct of
18 Covance initiated measures to prevent additional cases by controlling IVRS randomisation, requiring sites in South Florida to call for permission to randomise new subjects who had passed identity screening.

Therapeutic Goods Administration
Submission PM-2017-001328-1-5 Extract from the Clinical Evaluation Report for Steglatro Attachment 2 PART 1 FINAL 31 January 2019
Page 87 of 121
the study, which consisted mostly of subjects unsuccessfully attempting to randomise more than once in this study or other site in the ertugliflozin Phase III program (described above), exceeding the maximum glimepiride dose for the study or country, and missing source documentation for the results of a study procedure; incidence was similar across the 3 treatment groups (22%, 2.7% and 3%, respectively).
Overall, 414 (31.2%) of 1325 subjects who received treatment with study medication were reported to have 1 or more major protocol deviations. The incidences of major protocol deviations by deviation category were generally similar between the 3 treatment groups.
The 3 most common major deviations categories overall were ‘failure to conduct major/ significant evaluations’, ‘subjects who did not give appropriate informed consent’, and ‘eligibility criteria not met’ and these deviations were not expected to affect safety or efficacy conclusions. Other protocol deviations, including those with a potential to meaningfully impact efficacy analyses (for example, < 75% compliance with study medication, taking glycaemic rescue medication without meeting rescue criteria, taking incorrect study medication, and change of background AHA medication) occurred at low incidences across the treatment groups.
One randomised subject (ertugliflozin 15 mg group) who never took a dose of study medication and who did not have HbA1c data at baseline or post-baseline was excluded from the FAS population for HbA1c analysis; no other subjects were excluded from this population. The proportions of subjects excluded from the cLDA mFAS population were similar across the treatment groups with the most common reason being ‘study medication compliance < 75%’. The proportion of subjects excluded from the PP population was higher in the ertugliflozin 5 mg group relative to the ertugliflozin 15 mg and glimepiride groups due to numerically larger number of subjects in the ertugliflozin 5 mg group who discontinued study medication prematurely, and therefore did not have an HbA1c evaluation within the day range attributable to Week 52 (a requirement for inclusion in the PP population).
7.2.3.11. Baseline data
Baseline demographic and anthropometric characteristics were generally similar between treatment groups except for fewer male subjects in the ertugliflozin 15 mg group (43.4%) relative to the 2 other groups, where approximately 51% of the subjects were male. The duration of T2DM was generally similar across treatment groups (approximately 7 years). Subjects eligible to participate in this study were to be on background treatment with metformin alone or in combination with another allowable AHA.19 The mean dose of metformin was approximately 2000 mg/day in all treatment groups (Table 53). Baseline HbA1c, FPG, and eGFR values were similar between groups. The mean HbA1c overall was 7.79%; 58.8% of subjects had baseline HbA1c ≥ 7.0% and < 8.0% (Table 54). Subjects were required to have a history of T2DM for entry into the study. The other most common categories of medical history conditions by SOC were vascular disorders (74.9%), metabolism and nutrition disorders (72.8%), hypertension (70.7%), dyslipidaemia (36.2%), obesity (25.0%) and Social Circumstances20 (58.8%) with no clinically important differences among treatment groups.
19 One subject in the ertugliflozin 15 mg group was reported as not on an AHA at screening; however, this subject was actually taking metformin at screening. Two subjects (1 each in ertugliflozin 15 mg and glimepiride group) were taking 3 AHAs at screening. These subjects should have been included in the protocol deviations list under the category ‘Eligibility criteria not met’. Subject in the glimepiride group is also reported as taking 3 AHAs at screening; however, the subject was taking glyburide monotherapy and glyburide + metformin combination therapy which should have been counted as 2 AHAs. In addition, the dose of glyburide was not < 50% of the maximum; therefore, this subject should also have been added to the protocol deviations list. 20 Primarily due to the collection of male circumcision status in this study.

Therapeutic Goods Administration
Submission PM-2017-001328-1-5 Extract from the Clinical Evaluation Report for Steglatro Attachment 2 PART 1 FINAL 31 January 2019
Page 88 of 121
Table 53: Subject characteristics duration of type II diabetes mellitus and background AHA therapy. All subjects treated
Table 54: Subject characteristics Baseline A1c, FPG, eGFR (US units) All subjects treated
Subjects screened for this study were to be receiving metformin as monotherapy; therefore, 100% of subjects were taking drugs used for diabetes. The other most common prior medication categories were agents acting on the renin-angiotensin system (60.8%) and lipid-modifying agents (52.5%) with no clinically important differences among treatment groups. Following randomisation, subjects were to remain on a stable dose of metformin during the study; therefore, 100% of subjects were taking drugs used for diabetes. The other most common concomitant drug therapeutic categories were agents acting on the renin-angiotensin system

Therapeutic Goods Administration
Submission PM-2017-001328-1-5 Extract from the Clinical Evaluation Report for Steglatro Attachment 2 PART 1 FINAL 31 January 2019
Page 89 of 121
(61.9%), lipid-modifying agents (54.9%) and analgesics (37.6%) with no clinically important differences among treatment groups. Mean compliance with study medication was >96% in all treatment groups.
7.2.3.12. Primary efficacy results
At Week 52, there were clinically meaningful LS mean reductions from baseline in AIC in the ertugliflozin 5 mg group (-0.56%), 15 mg group (-0.64%) and the glimepiride group (-0.74%); the mean and median dose of glimepiride was 3 mg daily. The LS mean difference (95% CI) between ertugliflozin 15 mg and glimepiride (ertugliflozin minus glimepiride) at Week 52 was 0.10% (-0.02, 0.22). Since the upper bound of the CI around the treatment difference was less than the non-inferiority margin of 0.3%, ertugliflozin 15 mg met the pre-specified criterion for non-inferiority to glimepiride in reducing HbA1c (Table 55). The LS mean difference (95% CI) between ertugliflozin 5 mg and glimepiride (ertugliflozin minus glimepiride) at Week 52 was 0.18% (0.06, 0.30) and did not meet the pre-specified criterion for non-inferiority to glimepiride in reducing HbA1c (Table 55). Since the hypothesis of non-inferiority for the ertugliflozin 5 mg group relative to the glimepiride group was not met (excluding rescue approach), subsequent hypotheses in the testing sequence were not formally tested. The non-inferiority criterion compared to glimepiride was met for both ertugliflozin 15 mg and ertugliflozin 5 mg using the ‘including rescue approach’ (Table 56). In the ertugliflozin groups, large reductions in HbA1c at Week 6 were followed by smaller subsequent reductions through Week 12, after which HbA1c remained relatively stable in both groups through Week 52. The point estimates of the reductions in HbA1c were numerically greater in the ertugliflozin 15 mg group relative to the ertugliflozin 5 mg group at all time points after Week 12. In the glimepiride group, large reductions in HbA1c at Week 6, comparable to those observed in the ertugliflozin groups, were followed by the apparent nadir reached at Weeks 18 and 26, followed by a progressive rise in HbA1c although the HbA1c levels at week 52 were still lower than those in both ertugliflozin groups (Figure 14).
Table 55: HbA1c (%); Change from Baseline at Week 52 cLDA FAS: Excluding rescue approach
Table 56: HbA1c (%); Change from Baseline at Week 52 cLDA FAS: Including rescue approach

Therapeutic Goods Administration
Submission PM-2017-001328-1-5 Extract from the Clinical Evaluation Report for Steglatro Attachment 2 PART 1 FINAL 31 January 2019
Page 90 of 121
Figure 14: HbA1c (%); LS Mean change from Baseline over time. cLDA. FAS: Excluding rescue approach
Analyses of HbA1c change from baseline at Week 52 performed using the ANCOVA model in the PP population the ANCOVA model in the FAS population with LOCF and the mFAS population all supported the conclusion from the primary analysis. In addition, in the analysis of change from baseline at Week 52 using the ANCOVA model in the PP population, the non-inferiority criterion for ertugliflozin 5 mg compared to glimepiride was met, but was not met in the 2 other analyses (Table 57).

Therapeutic Goods Administration
Submission PM-2017-001328-1-5 Extract from the Clinical Evaluation Report for Steglatro Attachment 2 PART 1 FINAL 31 January 2019
Page 91 of 121
Table 57: Primary efficacy endpoint analyses in the PP- ANCOVA, FAS-(ANCOVA with LOCF and mFAS (cLDA) excluding rescue approach
Sensitivity analysis
The proportion of subjects with missing or excluded data at Week 52 was similar in the ertugliflozin 15 mg and glimepiride groups (20.5% and 19.5%, respectively) and numerically higher in the ertugliflozin 5 mg group (25.0%). Sensitivity analyses were performed to assess the impact of missing data on the primary analysis Unlike the primary analysis methodology, the methodology for the sensitivity analyses does not rely on an assumption of ‘missing at random’ for missing data. The tipping point analyses in which data collected after initiation of glycaemic rescue therapy were considered missing (Table 58) showed that, to shift the primary result such that ertugliflozin 15 mg was not non-inferior to glimepiride on HbA1c change from baseline at Week 52, the HbA1c change from baseline among subjects in the ertugliflozin 15 mg group with missing data would need to have been > 0.4% worse than that expected under the missing at random assumption, supporting the robustness of the primary analytic approach.
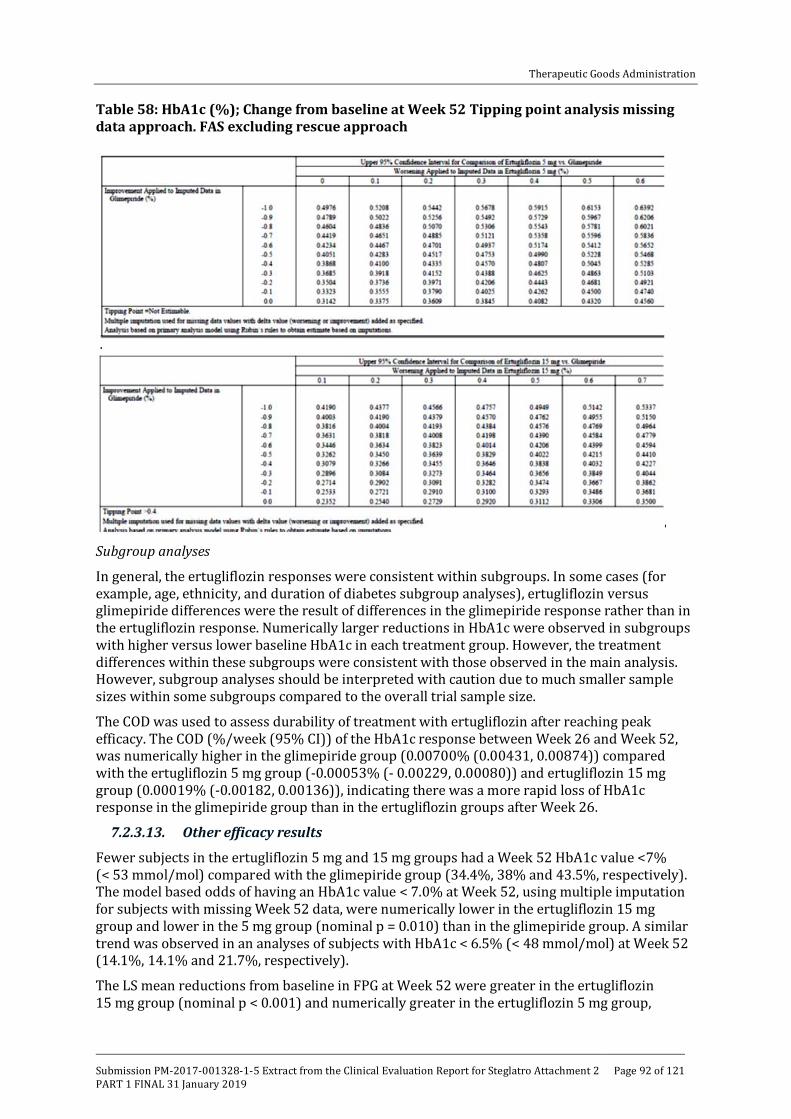
Therapeutic Goods Administration
Submission PM-2017-001328-1-5 Extract from the Clinical Evaluation Report for Steglatro Attachment 2 PART 1 FINAL 31 January 2019
Page 92 of 121
Table 58: HbA1c (%); Change from baseline at Week 52 Tipping point analysis missing data approach. FAS excluding rescue approach
Subgroup analyses
In general, the ertugliflozin responses were consistent within subgroups. In some cases (for example, age, ethnicity, and duration of diabetes subgroup analyses), ertugliflozin versus glimepiride differences were the result of differences in the glimepiride response rather than in the ertugliflozin response. Numerically larger reductions in HbA1c were observed in subgroups with higher versus lower baseline HbA1c in each treatment group. However, the treatment differences within these subgroups were consistent with those observed in the main analysis. However, subgroup analyses should be interpreted with caution due to much smaller sample sizes within some subgroups compared to the overall trial sample size.
The COD was used to assess durability of treatment with ertugliflozin after reaching peak efficacy. The COD (%/week (95% CI)) of the HbA1c response between Week 26 and Week 52, was numerically higher in the glimepiride group (0.00700% (0.00431, 0.00874)) compared with the ertugliflozin 5 mg group (-0.00053% (- 0.00229, 0.00080)) and ertugliflozin 15 mg group (0.00019% (-0.00182, 0.00136)), indicating there was a more rapid loss of HbA1c response in the glimepiride group than in the ertugliflozin groups after Week 26.
7.2.3.13. Other efficacy results
Fewer subjects in the ertugliflozin 5 mg and 15 mg groups had a Week 52 HbA1c value <7% (< 53 mmol/mol) compared with the glimepiride group (34.4%, 38% and 43.5%, respectively). The model based odds of having an HbA1c value < 7.0% at Week 52, using multiple imputation for subjects with missing Week 52 data, were numerically lower in the ertugliflozin 15 mg group and lower in the 5 mg group (nominal p = 0.010) than in the glimepiride group. A similar trend was observed in an analyses of subjects with HbA1c < 6.5% (< 48 mmol/mol) at Week 52 (14.1%, 14.1% and 21.7%, respectively).
The LS mean reductions from baseline in FPG at Week 52 were greater in the ertugliflozin 15 mg group (nominal p < 0.001) and numerically greater in the ertugliflozin 5 mg group,

Therapeutic Goods Administration
Submission PM-2017-001328-1-5 Extract from the Clinical Evaluation Report for Steglatro Attachment 2 PART 1 FINAL 31 January 2019
Page 93 of 121
relative to the glimepiride group (-1.04, -1.32 and 0.90mmol/L, respectively). LS mean changes from baseline in FPG over time, excluding data after initiation of rescue therapy showed that in the ertugliflozin groups, large dose related reductions in FPG at Week 6 were followed by generally stable values with some variability, such that the Week 6 and Week 52 values were numerically similar. In the glimepiride group, FPG rapidly decreased, reaching a nadir at Week 18, and was followed by a progressive rise through Week 52, so that the change from baseline in FPG was less than that observed in both ertugliflozin groups (Figure 15).
Figure 15: FPG (mg/dL); LS Mean change from Baseline over time cLDA FAS excluding rescue approach
Compared with glimepiride, the LS mean reduction from baseline in body weight was significantly greater in the ertugliflozin 5 mg and 15 mg groups (-3.0, -3.4 and +0.91kg, respectively; p < 0.001 for both comparisons). However, the p-value is considered nominal for the ertugliflozin 5 mg group because formal hypothesis testing was stopped earlier in the testing sequence. LS mean changes from baseline in body weight over time, excluding data after initiation of rescue therapy showed that in the ertugliflozin groups, body weight gradually decreased through Week 26 (ertugliflozin 5 mg) and Week 39 (ertugliflozin 15 mg) and then remained stable through Week 52. Small, gradual increases in body weight were observed through Week 52 in the glimepiride group (Figure 16). Analyses of body weight change from baseline at Week 52 performed using the ANCOVA model in the PP population and the mFAS population were consistent with the main analysis.

Therapeutic Goods Administration
Submission PM-2017-001328-1-5 Extract from the Clinical Evaluation Report for Steglatro Attachment 2 PART 1 FINAL 31 January 2019
Page 94 of 121
Figure 16: Body weight (kg) LS Mean change from baseline over time cLDA FAS excluding rescue approach
Compared with glimepiride, the LS mean reductions from baseline in sitting SBP at Week 52 were greater in the ertugliflozin 5 and 15 mg groups compared with glimepiride (-2.3, -3.8 and +0.95 mmHg, respectively; nominal p < 0.001 for both comparisons). The p-values are considered nominal for the ertugliflozin 15 mg and 5 mg comparisons with glimepiride because formal hypothesis testing was stopped earlier in the testing sequence. LS mean change in SBP over time, excluding data after initiation of rescue therapy showed reductions in SBP through Week 12 (ertugliflozin 15 mg) and through Week 18 (ertugliflozin 5 mg) were followed by small fluctuations, which remained below baseline through Week 52. The point estimates of the reductions in SBP were numerically greater in the ertugliflozin 15 mg group relative to the ertugliflozin 5 mg group. In the glimepiride group, small increases in SBP were observed at Week 12 and remained stable through Week 52 (Figure 17). Analyses of SBP change from baseline at Week 52 performed using the ANCOVA model in the PP population and the mFAS population were consistent with the main analysis.

Therapeutic Goods Administration
Submission PM-2017-001328-1-5 Extract from the Clinical Evaluation Report for Steglatro Attachment 2 PART 1 FINAL 31 January 2019
Page 95 of 121
Figure 17: Sitting systolic BP (mmHg); LS Mean change from baseline over time. cLDA FAS: excluding rescue approach
Similarly, LS mean reductions from baseline in sitting DBP at Week 52 were greater in the ertugliflozin 5 and 15 mg groups than in the glimepiride group (-0.92, -1.22 and +0.32mmHg, respectively; nominal p = 0.015 and p = 0.002, respectively). Reductions in DBP through Week 18 in the ertugliflozin groups, were followed by small fluctuations which remained below baseline through Week 52. The point estimates of the reductions in DBP were similar in the ertugliflozin 5 mg and 15 mg groups. In the glimepiride group, small increases in DBP were observed at Week 18 and remained stable through Week 52.
The cumulative percentage of subjects who received glycaemic rescue medication through Week 52 was low in each of the 3 treatment groups, but was numerically higher in the ertugliflozin 5 mg group (5.6%) and similar in the ertugliflozin 15 mg group (3.6%) and glimepiride (3.2%) groups (Figure 18).

Therapeutic Goods Administration
Submission PM-2017-001328-1-5 Extract from the Clinical Evaluation Report for Steglatro Attachment 2 PART 1 FINAL 31 January 2019
Page 96 of 121
Figure 18: Cumulative percentage of subjects with glycaemic rescue therapy; Kaplan-Meier curves: All subjects treated
The proportion of subjects who met the composite endpoint of >0.5% decrease from baseline in HbA1c at Week 52, no symptomatic hypoglycaemia between baseline and Week 52, and no increase in body weight at Week 52, excluding data after initiation of rescue therapy was higher in the ertugliflozin 5 mg and 15 mg groups relative to the glimepiride group (45.5%, 48.5% and 21.4%, respectively; nominal p < 0.001 for both comparisons). Results for the corresponding analysis including data after initiation of rescue therapy were also similar. However, analysis of the other composite endpoint of subjects who had HbA1c < 7.0% at Week 52 and no symptomatic hypoglycaemia from baseline through Week 52, excluding data after initiation of rescue therapy failed to show any benefits of ertugliflozin over glimepiride (39.7%, 42.4% and 42%, respectively). Results for the corresponding analysis, including data after initiation of rescue therapy were also similar.
Results for the analysis of change from baseline in HOMA-%beta at Week 52 showed that the LS mean increases from baseline at Week 52 were smaller in the ertugliflozin 15 mg and 5 mg groups than in the glimepiride group (nominal p = 0.042 and p = 0.008, respectively). Large mean reductions in proinsulin levels were observed in both ertugliflozin groups at Week 52 compared with a mean increase in the glimepiride group (nominal p < 0.001 for both comparisons). A mean reduction in C-peptide and proinsulin/C-peptide ratio (%) at Week 52 was observed in both ertugliflozin groups (and numerically larger with the 15 mg dose compared to the 5 mg dose) compared with a mean increase in the glimepiride group (nominal
Therapeutic Goods Administration
Submission PM-2017-001328-1-5 Extract from the Clinical Evaluation Report for Steglatro Attachment 2 PART 1 FINAL 31 January 2019
Page 97 of 121
p < 0.001 for both comparisons). The reduction in proinsulin relative to C-peptide suggests that ertugliflozin reduces beta cell ‘stress’ or ‘unloads’ the beta cell, and this may be reflected in the improvement in fasting insulin secretion, as shown by the rise in HOMA-%beta at Week 52 with ertugliflozin. HOMA-%beta also increased in the glimepiride group, associated with a relatively smaller reduction in the proinsulin/C-peptide ratio, consistent with the mechanism of SU action to directly stimulate insulin release.
7.2.3.14. Evaluator commentary
Combination therapy with metformin and an SU is a commonly used treatment regimen in subjects with T2DM. Although widely used, SUs are associated with the side effects of hypoglycaemia and body weight gain. This multicentre, randomised, double blind, active controlled, parallel group clinical trial compared the efficacy of ertugliflozin to glimepiride in 1326 subjects with T2DM and inadequate glycaemic control on a stable dose of metformin monotherapy (≥ 1500 mg/day). The primary efficacy objective was to assess the non-inferiority of treatment with ertugliflozin 15 mg to glimepiride on HbA1c after 52 weeks (Phase A). A separate CSR including results from Phase B (Weeks 52 to 104) will be prepared at the end of the study and was not included in present submission.
The study population was representative of patients with T2DM with baseline hyperglycaemia and intact renal function, and included a range of ethnic/racial backgrounds. Subjects had a mean duration of T2DM of approximately 7.5 years, mean baseline HbA1c of 7.79%, and a mean baseline eGFR of 87.2 mL/min/1.73 m2. The median metformin dose at entry was 2000 mg/day.
Ertugliflozin 15 mg met the pre-specified criteria for non-inferiority to glimepiride (where the mean glimepiride dose was 3.0 mg daily) for HbA1c reduction at 52 weeks of treatment. A clinically meaningful reduction from baseline in HbA1c at Week 52 was observed with the 5 mg dose of ertugliflozin; however, this did not meet the non-inferiority requirements relative to glimepiride. The HbA1c reductions observed in both ertugliflozin groups were evident by Week 6 and glycaemic efficacy was durable through Week 52. Although the Week 52 HbA1c reductions in the ertugliflozin groups were numerically smaller relative to glimepiride, the reduction in FPG was numerically greater with both ertugliflozin doses compared with glimepiride at Week 52. Ertugliflozin 15 mg and 5 mg resulted in greater reduction in body weight and in sitting SBP relative to the glimepiride group, but the differences were not formally tested. The COD (of the HbA1c response between Week 26 and Week 52) was used to assess durability of treatment with ertugliflozin after reaching peak efficacy and it was numerically higher in the glimepiride group compared with the ertugliflozin 5 mg and 15 mg groups indicating there was a more rapid loss of HbA1c response in the glimepiride group than in the ertugliflozin groups after Week 26.
Overall, results from this study provided evidence to support use of ertugliflozin (5 mg and 15 mg) as add-on to metformin with similar reductions in HbA1c to glimepiride for the 15 mg ertugliflozin dose, but greater improvements in body weight and SBP with both ertugliflozin doses compared with glimepiride, although these differences were not tested formally since prior hypotheses in the ordered sequence were not met. Evidence for long term maintenance of efficacy beyond 52 weeks was not provided as Phase B (week 52 to 104); the sponsor states that these results will be submitted later.
7.2.4. Study P005/1019: Add-on to metformin
7.2.4.1. Study design, objectives
The purpose of this randomised, double blind, parallel-group, factorial study was to evaluate the efficacy and safety of the addition of dual combination therapy with ertugliflozin and sitagliptin compared with the addition of ertugliflozin alone or sitagliptin alone, in subjects with T2DM and inadequate glycaemic control on metformin monotherapy over 26 weeks (Phase A period). This study was also designed to evaluate longer-term safety and efficacy of ertugliflozin and sitagliptin combination therapy over 52 weeks (26 week Phase A and 26 week Phase B periods).

Therapeutic Goods Administration
Submission PM-2017-001328-1-5 Extract from the Clinical Evaluation Report for Steglatro Attachment 2 PART 1 FINAL 31 January 2019
Page 98 of 121
Results from Phase A are presented in this CSR. A separate CSR including results from Phase B will be prepared at the end of the study.
Subjects on ≥ 1500 mg/day of metformin for ≥ 8 weeks with an HbA1c of ≥ 7.5 and ≤ 11% (≥ 58 and ≤ 97 mmol/mol) at screening were eligible to directly enter a 2 week, single blind, placebo run-in period. Subjects on ≥ 1500 mg/day of metformin for < 8 weeks with an HbA1c of ≥ 7.5 and ≤ 11% (≥ 58 and ≤ 97 mmol/mol) at screening received diet/exercise counselling and entered a 2 week, single blind, placebo run-in period after their metformin dose had been stable for ≥ 8 weeks.
Subjects on <1500 mg/day of metformin with an HbA1c of ≥ 8.0 and ≤ 11.5% (≥ 64 and ≤ 102 mmol/mol) entered a diet/exercise run-in and metformin titration (≤ 4 weeks)/dose stabilisation (≥ 8 weeks) period. After the metformin titration (if necessary) and dose stabilisation periods, subjects who had an HbA1c of ≥ 7.5 and ≤ 11% (≥ 58 and ≤ 97 mmol/mol) entered a 2 week, single blind, placebo run-in period. Subjects with adequate compliance during the placebo run-in and who met all other entry criteria were eligible to enter the 52 week double blind treatment period and were randomised in an equal ratio to 1 of 5 groups: (1) ertugliflozin 5 mg QD, sitagliptin 100 mg QD (E5/S100), (2) ertugliflozin 15 mg QD + sitagliptin 100 mg QD (E15/S100), (3) ertugliflozin 5 mg QD (E5), (4) ertugliflozin 15 mg QD (E15) and (5) sitagliptin 100 mg QD (S100) (Figure 19). Subjects who met progressively more stringent glycaemic rescue criteria during the double blind treatment period were to receive open label glimepiride (or insulin glargine if the investigator considered use of glimepiride to be inappropriate for the subject). After initiating glycaemic rescue therapy, subjects were to continue the same dose and regimen of their study medication and background metformin.
Figure 19: Study P005/1019 Overview of study design
The primary objectives were to assess the following after 26 weeks in subjects with T2DM and inadequate glycaemic control on metformin ≥ 1500 mg/day:

Therapeutic Goods Administration
Submission PM-2017-001328-1-5 Extract from the Clinical Evaluation Report for Steglatro Attachment 2 PART 1 FINAL 31 January 2019
Page 99 of 121
• HbA1c-lowering efficacy of the addition of ertugliflozin 15 mg once daily (QD) plus sitagliptin 100 mg QD compared with the addition of sitagliptin 100 mg QD alone and also compared with addition of ertugliflozin 15 mg QD alone.
• HbA1c-lowering efficacy of the addition of ertugliflozin 5 mg once daily (QD) plus sitagliptin 100 mg QD compared with the addition of sitagliptin 100 mg QD alone and also compared with addition of ertugliflozin 5 mg QD alone.
• The safety and tolerability of the addition of ertugliflozin plus sitagliptin 100 mg QD, ertugliflozin alone, and sitagliptin 100 mg QD alone.
• The secondary objectives were to assess the following after 26 weeks in subjects with T2DM and inadequate glycaemic control on metformin ≥ 1500 mg/day:
• Body weight lowering efficacy of the addition of ertugliflozin plus sitagliptin 100 mg QD compared with the addition of sitagliptin 100 mg QD alone:
• FPG lowering efficacy of the addition of ertugliflozin plus sitagliptin 100 mg QD compared with the addition of ertugliflozin alone and sitagliptin 100 mg QD alone.
• Change from baseline SBP and DBP with the addition of ertugliflozin plus sitagliptin 100 mg QD compared with the addition of sitagliptin 100 mg QD alone.
• The proportion of subjects at target HbA1c control (HbA1c < 7.0% (< 53 mmol/mol)) with the addition of ertugliflozin plus sitagliptin 100 mg QD compared with the addition of ertugliflozin alone and sitagliptin 100 mg QD alone.
• The efficacy of the addition of ertugliflozin plus sitagliptin 100 mg QD compared with the addition of sitagliptin 100 mg QD alone and ertugliflozin alone on the proportion of subjects who initiate glycaemic rescue medication and time to rescue.
Other objectives in the subset of subjects who undergo a frequently-sampled mixed meal tolerance test (MMTT), after 26 weeks were to assess the effect on a dynamic measure of beta cell function, indices of insulin resistance and on 2 hour post-prandial glucose and on total and incremental glucose AUC (0 to 180) during an MMTT with the addition of ertugliflozin plus sitagliptin 100 mg QD compared with the addition of ertugliflozin alone and sitagliptin 100 mg QD alone. The trial was conducted from 29 April 2014 to 11 November 2015 (end of Phase A) in 21 countries, including 242 trial centres.21
7.2.4.2. Inclusion exclusion criteria
The main inclusion criteria were be ≥ 18 years of age, BMI ≥ 18 kg/m2 with diagnosis of T2DM in accordance with ADA guidelines and meeting one of the following criteria: On metformin monotherapy (≥ 1500 mg/day) for ≥ 8 weeks with a Visit 1/Screening HbA1c ≥ 7.5% and ≤ 11.0% (≥ 58 mmol/mol and ≤ 97 mmol/mol) OR -On metformin monotherapy (≥ 1500 mg/day) for < 8 weeks with a Visit 1/Screening HbA1c ≥ 7.5% and ≤ 11.0% (≥ 58 mmol/mol and ≤ 97 mmol/mol) OR -On metformin monotherapy < 1500 mg/day with a Visit 1/Screening HbA1c ≥ 8.0% and ≤ 11.5% (≥ 64 mmol/mol and ≤ 102 mmol/mol). Other inclusion criteria were > 80% compliance with the placebo run-in medication (as determined by site-performed pill count). Other inclusion and exclusion criteria were similar to those discussed in section 7.2.1.2 with exception that subjects with known hypersensitivity or intolerance to any SGLT2 inhibitor or sitagliptin were also excluded.
7.2.4.3. Study treatments
Treatments used in the study are summarised in Table 59.
21 19 in Argentina, 7 in Bulgaria, 4 in Canada, 7 in Chile, 8 in Colombia, 9 in the Czech Republic, 4 in Finland, 11 in Hungary, 10 in Israel, 4 in Italy, 7 in Malaysia, 15 in Mexico, 6 in New Zealand, 7 in the Philippines, 13 in Poland, 13 in Romania, 19 in Russia, 12 in Slovakia, 3 in Thailand, 12 in Ukraine, and 52 in the United States.

Therapeutic Goods Administration
Submission PM-2017-001328-1-5 Extract from the Clinical Evaluation Report for Steglatro Attachment 2 PART 1 FINAL 31 January 2019
Page 100 of 121
Table 59: Trial treatments
During the placebo run-in and double blind treatment periods, subjects were to take 3 oral tablets of study medication once daily in the morning, including ertugliflozin 5 mg or matching placebo tablet, ertugliflozin 10 mg or matching placebo tablet, and sitagliptin 100 mg or matching placebo tablet. The first doses of single blind matching placebo for ertugliflozin and matching placebo for sitagliptin were to be administered at the trial site as witnessed doses at Visit 3/Week -2 or combined Visit 2/3. During the double blind treatment period, subjects who met progressively more stringent glycaemic rescue criteria (Table 60) were to receive open label glimepiride rescue medication (or insulin glargine, if open label glimepiride was not considered appropriate). The first doses of double blind ertugliflozin or matching placebo and sitagliptin or matching placebo were to be administered at the trial site as witnessed doses at Visit 4/Day 1. Subsequent dosing was to be performed once daily by the subject at approximately the same time each day in the morning without regard to timing of meal administration (except where noted below for the MMTT). On the days of clinic visits, subjects were to take their study medication, as well as background metformin and glimepiride (or insulin glargine) rescue therapy (if applicable), after all study procedures were completed. However, for the subset of subjects participating in the MMTT, at Visit 8/Week 26 (or Rescue/Discontinuation Visit occurring in Phase A), study medication was taken as part of the MMTT on the day of the visit.

Therapeutic Goods Administration
Submission PM-2017-001328-1-5 Extract from the Clinical Evaluation Report for Steglatro Attachment 2 PART 1 FINAL 31 January 2019
Page 101 of 121
Table 60: Glycaemic thresholds for rescue
The investigator or subject’s physician/health care provider was permitted to make adjustments in the subject’s non-AHA therapies throughout the trial if clinically warranted. Guidance for specific medications which were permitted during the study was summarised.
7.2.4.4. Efficacy variables and outcomes
Glycaemic efficacy endpoints included the changes from baseline in HbA1c and FPG at Week 26. Blood pressure and body weight were measured at regular time-points during study. The proportion of subjects who received glycaemic rescue therapy and time to initiation of rescue were also assessed.
Efficacy Parameters Derived from the MMTT: This study included a frequently sampled MMTT at Visit 4/Day 1 and Visit 8/Week 26 (or Rescue or Discontinuation Visit occurring in Phase A) for a subset of subjects who consented to participate. Blood samples (for measurement of glucose, insulin, and C-peptide) were collected at the following time points relative to the start of the meal: -30, 0, 15, 30, 60, 90, 120, and 180 minutes. Subjects were to take their double blind study medication and background metformin approximately 1 hour before consuming the standard meal;22 at Visit 8/Week 26 (or Rescue or Discontinuation Visit occurring in Phase A); double blind study medication and background metformin were not administered prior to the MMTT procedure at Visit 4/Day 1. Urine was also collected during the MMTT to assess UGE.
Efficacy and safety endpoints that were evaluated for within- and/or between-treatment differences are summarised in Table 61. The baseline value was defined as the Visit 4/Day 1 (Randomisation) measurement.23 For eGFR, if the baseline value was not available, the last available pre-randomisation measurement was used as the baseline value. The primary time point of the trial was Week 26. Analyses of efficacy endpoints were performed for the following treatment comparisons:
• E15/S100 group versus the S100 group and versus the E15 group separately (E15/S100 versus only the S100 group for body weight and SBP and DBP).
• E5/S100 group versus the S100 group and versus the E5 group separately (E5/S100 versus only the S100 group for body weight and SBP and DBP).
22 The standard meal for the MMTT consisted of two nutrition bars and one nutrition drink (~680 kcal; 111 g carbohydrate, 14 g fat, 26 g protein in total). 23 If this measurement was not available, the last pre-randomisation measurement on or after Week -2 was to be used as the baseline value, if available.

Therapeutic Goods Administration
Submission PM-2017-001328-1-5 Extract from the Clinical Evaluation Report for Steglatro Attachment 2 PART 1 FINAL 31 January 2019
Page 102 of 121
Table 61: Analysis strategy for efficacy endpoints
7.2.4.5. Randomisation and blinding
A double blind/masking technique was used in this study. Ertugliflozin and sitagliptin were packaged identically relative to their matching placebos so that blinding/masking was maintained. The subject, the investigator, Sponsor personnel, and personnel from the sponsors’ designees, Covance and Parexel, who were involved in the treatment or clinical evaluation of the subjects were unaware of treatment group assignments. An external DMC monitored unblinded interim data from this trial and other Phase III trials in the ertugliflozin development program. Subjects’ treatment assignments were unblinded at the completion of the 26 week Phase A portion of this study (defined as database lock) to permit authoring of this CSR. Personnel associated with the conduct of the trial at Covance, as well as trial site personnel and subjects, remained blinded until after the 26 week Phase B portion of this study completed.
Randomisation occurred centrally using an IVRS/IWRS. Subjects were assigned randomly using a computer-generated randomisation schedule to 1 of the following 5 treatment groups (1:1:1:1:1 ratio): ertugliflozin 5 mg QD + sitagliptin 100 mg QD (E5/S100 group); ertugliflozin 15 mg QD + sitagliptin 100 mg QD (E15/S100 group); ertugliflozin 5 mg QD (E5 group); ertugliflozin 15 mg QD (E15 group); sitagliptin 100 mg QD (S100 group). Randomisation was stratified by participation in the MMTT (yes/no).
7.2.4.6. Analysis populations
The Full Analysis Set (FAS) population was the primary analysis population for most efficacy endpoints. For analyses that used the constrained longitudinal data analysis (cLDA) model, the FAS population, defined separately for each analysis endpoint, consisted of all randomised

Therapeutic Goods Administration
Submission PM-2017-001328-1-5 Extract from the Clinical Evaluation Report for Steglatro Attachment 2 PART 1 FINAL 31 January 2019
Page 103 of 121
subjects who: - received at least one dose of study treatment; -had a baseline measurement or a post-randomisation measurement for the analysis endpoint subsequent to at least one dose of study treatment.
For analyses that used the analysis of covariance (ANCOVA) model, the FAS population defined separately for each analysis endpoint, consisted of all randomised subjects who: -received at least one dose of study treatment; -had measurements for the analysis endpoint both at baseline and at one or more post-baseline time points. Analyses of the proportions of subjects requiring rescue medication and time to rescue was performed in the All Subjects Treated population.
Data obtained after the initiation of rescue therapy were censored (that is, treated as missing) from the primary analyses of efficacy endpoints. Additional analyses inclusive of post rescue data were conducted for most endpoints. However, analyses including data after the initiation of rescue therapy should be interpreted with caution for endpoints such as HbA1c and FPG. The All Subjects as Treated (ASaT)24 population was used for the analysis of safety data in this trial.
7.2.4.7. Sample size
With a sample size of 1250 subjects randomised equally among the 5 treatment arms, 250 subjects per arm was calculated to provide approximately 94% power to detect a difference in HbA1c of 0.4% for each of the pairwise comparisons at a given ertugliflozin dose level assuming an SD of 1.2% based on a 2-sided test at a 5% level of significance. The power for success for both pairwise comparisons at a given ertugliflozin dose level was approximately 89%.
7.2.4.8. Statistical methods
The following between group comparisons were made for Phase A:
• Ertugliflozin 15 mg plus sitagliptin 100 mg versus sitagliptin 100 mg (E15/S100 versus S100)
• Ertugliflozin 15 mg plus sitagliptin 100 mg versus ertugliflozin 15 mg (E15/S100 versus E15)
• Ertugliflozin 5 mg plus sitagliptin 100 mg versus sitagliptin 100 mg (E5/S100 versus S100)
• Ertugliflozin 5 mg plus sitagliptin 100 mg versus ertugliflozin 5 mg (E5/S100 versus E5)
The primary efficacy analyses compared the efficacy of the combination of ertugliflozin and sitagliptin relative to sitagliptin alone and ertugliflozin alone in change from baseline in HbA1c at Week 26. The mean change from baseline in HbA1c at Week 26 for the combination of ertugliflozin and sitagliptin group was compared to the mean changes in the individual groups using the estimated treatment differences via a cLDA model, proposed by Liang and Zeger. As a supportive analysis, an ANCOVA model in the FAS population was also used for the primary efficacy endpoint. The ANCOVA model included treatment, baseline eGFR and baseline value. The last observation carried forward (LOCF) method was used to impute missing data. To explore the impact of missing data on the conclusions of the primary analysis, a detailed accounting of missing data was provided for the primary endpoint. Sensitivity analyses were performed that did not rely on the ‘missing at random’ assumption underlying the primary methodology. These analyses include a tipping-point analysis and a jump-to-reference (J2R) analysis.
24 The ASaT population consisted of all randomised subjects who took at least one dose of study medication. Subjects were included in the treatment group corresponding to the study medication they actually took for the analysis of safety data using the ASaT population. Because no subjects took incorrect study medication for the entire analysis period, analyses in the ASaT population classified all subjects according to their randomised treatment.

Therapeutic Goods Administration
Submission PM-2017-001328-1-5 Extract from the Clinical Evaluation Report for Steglatro Attachment 2 PART 1 FINAL 31 January 2019
Page 104 of 121
For the analysis of the percentage of subjects at the HbA1c goals of < 7.0% at Week 26, the cLDA model that was used for the analysis of HbA1c was used to impute missing data25 for HbA1c. To estimate the odds ratio, each of the imputed data sets was analysed by logistic regression. The logistic regression model included terms for treatment and baseline HbA1c. The same logistic regression model was also used to analyse the percentages of subjects at HbA1c goals in a sensitivity analysis where all subjects with missing Week 26 data were treated as not being at goal, regardless of the final observed HbA1c value. A time-to-rescue analysis was also performed and the proportion of subjects rescued in each treatment group was summarised. Plots of the Kaplan-Meier estimate of the distribution of the time-to-rescue were provided for each treatment arm, and log-rank tests comparing the time-to-rescue distribution of the combination of ertugliflozin and sitagliptin at a specific dose level versus each component were conducted. In this analysis, subjects were censored at the time of discontinuation or bariatric surgery.
The primary and key secondary hypotheses were tested using an ordered testing procedure combined with the Hochberg procedure. The ordered testing procedure included the tests of HbA1c, body weight, FPG, SBP and proportion of subjects with HbA1c< 7.0%, all using α = 0.05 (2-sided). If the success criterion was achieved for at least one of the preceding two tests, then testing continued with the ertugliflozin 5 mg + sitagliptin 100 mg group, starting with the final α level (0.05 or 0.025) adjusted as per the outcome of the ertugliflozin 15 mg + sitagliptin 100 mg group testing. The multiplicity adjustment strategy and testing order is described in Table 62. To assess whether the treatment effect at Week 26 was consistent across various subgroups, the estimate of the between-group treatment effect (with a nominal 95% CI) for the primary endpoint was estimated and plotted within each category of the following classification variables.26:1) Baseline HbA1c levels: by categories: < 8.0%; ≥ 8.0% and < 9%; ≥ 9% and <10%; ≥ 10%; 2) Age categories: ≤ or > median age; 3) Gender (female; male); 4) Race (White, Asian, Other) • Ethnicity (Hispanic or Latino, Not Hispanic or Latino).
25 Imputations of the missing data were based on the marginal univariate normal distributions with means equal to the predicted values and variances equal to the squared standard errors for the predicted values from the cLDA model. 26 For the subgroups that had only 2 categories, if the sample size was not at least 20 subjects in all of the treatment groups in each subgroup category, then that subgroup analysis would not be performed. For the race subgroup analysis, if the sample size was not at least 20 subjects in all of the treatment groups in a certain race category, then that race was combined with the “Other” race category.

Therapeutic Goods Administration
Submission PM-2017-001328-1-5 Extract from the Clinical Evaluation Report for Steglatro Attachment 2 PART 1 FINAL 31 January 2019
Page 105 of 121
Table 62: Multiplicity adjustment strategy
7.2.4.9. Participant flow
Overall, 1349 of the 2582 screened subjects were excluded during screening mainly due to screen failure; most common reasons for screen failure were not meeting the inclusion criteria for HbA1c at Visit 1 and/or meeting exclusionary laboratory values. The remaining 1233 subjects were randomised at 204 sites in 21 countries. The number of randomised subjects was balanced across the 5 treatment groups. One randomised subject (E15/S100 group) did not receive treatment. The proportion of subjects who discontinued study medication in Phase A was numerically higher in the S100 group relative to the 4 ertugliflozin-treated groups (7%, 9.4%, 6.8%, 8.9% and 10.5% in the E5, E15, S100, E5/S100 and E15/S100 groups, respectively) primarily due to a small increase in the proportion of subjects in the S100 group who discontinued for withdrawal by subject. The most common reason for study medication discontinuation in each treatment group was withdrawal by subject. A numerically higher proportion of subjects in the E15/S100 group discontinued study medication for an AE; other reasons for study medication discontinuation were generally similar between groups. Of the 105 subjects who discontinued study medication in Phase A, 66 subjects discontinued from the study (11, 14, 10, 12, and 19 subjects in the E5/S100, E15/S100, E5, E15, and S100 groups, respectively).
7.2.4.10. Major protocol violations
During the conduct of this study, 37 subjects;27 were multiply-randomised;28 and reported as major protocol deviators. The significant misconduct of these multiply-enrolled subjects
27 These 37 multiply-enrolled subjects account for 59 randomisations and 18 screen failures. The sponsor’s partner (Covance) implemented investigations to identify multiply-enrolled subjects by comparing subject identification information across sites and studies. All of the multiply-enrolled subjects identified in this study were located in the United States in South Florida. Covance initiated measures to prevent additional cases by controlling IVRS randomisation, requiring sites in South Florida to call for permission to randomise new subjects who had passed identity screening. 28 These subjects were randomised at more than 1 site in this trial, which randomised at a site in this trial and at least 1 other site in the ertugliflozin Phase III program, or who screened failed in this trial and randomised in at least 2 sites in the ertugliflozin Phase III program.

Therapeutic Goods Administration
Submission PM-2017-001328-1-5 Extract from the Clinical Evaluation Report for Steglatro Attachment 2 PART 1 FINAL 31 January 2019
Page 106 of 121
compromises the integrity of their study data and hence results from these subjects were excluded from all analyses, as well as from disposition and demographic tabulations.
Excluding multiply-randomised subjects, 1232 subjects were randomised into the study and received study medication and 23.6% (291/1232) were reported to have 1 or more major deviations. The incidences of major deviations, overall by deviation category, were generally similar between the 5 treatment groups, except in the E15/S100 group which had a slightly lower incidence of overall deviations primarily due to fewer subjects for whom failure to conduct major/significant evaluations occurred and fewer informed consent errors. The most common category of major deviations across the 5 treatment groups was ‘failure to conduct major/significant evaluations’. Within this category, failure to conduct ECGs at scheduled visits and errors in collection of laboratory parameters occurred most frequently. These deviations were not expected to affect safety or efficacy conclusions. Other protocol deviations, including those with a potential to meaningfully impact efficacy analyses (for example, < 75% compliance with study medication, taking glycaemic rescue medication without meeting rescue criteria, taking incorrect study medication, and change of background AHA medication) occurred at low incidences across the treatment groups.
7.2.4.11. Baseline data
Baseline demographic and anthropometric characteristics and the distribution of subjects by stratification factor were generally similar between treatment groups except for small differences in the distribution of subjects by race and a higher percentage of male subjects in the S100 group. Forty (3.2%) randomised subjects were incorrectly stratified across the 5 treatment groups, including 33 (2.7%) subjects who were reported as participating in the MMTT, but who did not, and 7 (0.6%) subjects who were reported as not participating in the MMTT, but who did so. Mis-stratification had no impact on the statistical analyses because the MMTT stratum was not a covariate in the models. The duration of T2DM was generally similar across treatment groups (approximately 7 years). One subject in the E5 group received treatment with dual AHA therapy at screening; however, the subject was actually on metformin monotherapy at screening. The second therapy was a rescue treatment which was started post-randomisation but an incorrect start date was recorded. The median dose of metformin was 2000 mg/day in all treatment groups. Baseline HbA1c, FPG, and eGFR values were similar between groups. The mean HbA1c overall was 8.55%; approximately 70% of subjects had baseline HbA1c ≥ 8%. Besides T2DM, the other most common categories of medical history conditions by SOC were vascular disorders (63.9%), Metabolism and nutrition disorders (63.1%) and Social Circumstances29 (78.2%). The most common specific medical history conditions, unrelated to circumcision status, were hypertension (61.1%) obesity (24.4%), and dyslipidaemia (23.7%) with no clinically important differences among treatment groups. Subjects screened for this study were to be receiving metformin as monotherapy; therefore, 100% of subjects were taking drugs used for diabetes. The other most common prior medication categories were agents acting on the renin-angiotensin system (53.7%) and lipid-modifying agents (43.8%) with no clinically important differences among treatment groups. Following randomisation, subjects were to remain on a stable dose of metformin during the study; therefore, 100% of subjects were taking drugs used for diabetes. The other most common concomitant drug therapeutic categories were agents acting on the renin-angiotensin system (54.8%), lipid modifying agents (46.3%) and analgesics (28.7%) with no clinically important differences among treatment groups. Mean compliance with study medication was ≥ 98% in all treatment groups.
7.2.4.12. Primary efficacy results
The LS mean reductions from baseline in HbA1c at Week 26 were significantly greater in the E15/S100 group relative to the individual component treatment groups (S100 group and E15
29 Primarily due to the collection of male circumcision status in this study.

Therapeutic Goods Administration
Submission PM-2017-001328-1-5 Extract from the Clinical Evaluation Report for Steglatro Attachment 2 PART 1 FINAL 31 January 2019
Page 107 of 121
group), and in the E5/S100 group relative to the individual component treatment groups (S100 group and E5 group) (-1.02, -1.08, -1.05, -1.49 and -1.52 in the E5, E15, S100, E5/S100 and E15/S100 groups, respectively; p < 0.001 for all pre-specified comparisons)(Table 63). Large reductions in HbA1c in all treatment groups at Week 6 were followed by smaller subsequent reductions through Week 26. The point estimates of the reductions in HbA1c were numerically greater in the E15/S100 and E5/S100 groups relative to the 3 other treatment groups at each time point (Figure 20).
The analysis of HbA1c change from baseline at Week 26 performed using ANCOVA/LOCF, excluding data after initiation of glycemic rescue therapy supported the conclusion from the primary analysis. Sensitivity analyses were performed to assess the impact of missing data on the primary analysis results. In the J2R analyses, LS mean reductions in HbA1c at Week 26 were greater in the E15/S100 and E5/S100 groups relative to individual component treatment groups at corresponding dose strengths (p < 0.0001 for all comparisons) (Table 64). The tipping-point analyses in which data collected after initiation of glycaemic rescue therapy were considered missing showed that, to shift the primary result to a non-significant result, the HbA1c change from baseline among subjects in the E15/S100 and E5/S100 groups with missing data would need to have been substantially worse than that expected under the missing at random assumption (over 3.2% and over 2.7% for E15/S100 and E5/S100 groups, respectively, compared to either ertugliflozin or sitagliptin) (Table 65). An analysis of change from baseline in HbA1c at Week 26, including data after initiation of glycaemic rescue therapy (which included more subjects with HbA1c data at Week 26, particularly in the E5 and S100 groups) also showed results which were consistent with the primary analysis.
Table 63: HbA1c (%); Change from Baseline at Week 26. cLDA. FAS: Excluding rescue approach

Therapeutic Goods Administration
Submission PM-2017-001328-1-5 Extract from the Clinical Evaluation Report for Steglatro Attachment 2 PART 1 FINAL 31 January 2019
Page 108 of 121
Figure 20: HbA1c (%): LS mean change from Baseline over time. cLDA FAS: Excluding rescue approach
Table 64: Sensitivity analysis; J2R analysis

Therapeutic Goods Administration
Submission PM-2017-001328-1-5 Extract from the Clinical Evaluation Report for Steglatro Attachment 2 PART 1 FINAL 31 January 2019
Page 109 of 121
Table 64 (continued): Sensitivity analysis; J2R analysis
Table 65: Sensitivity analysis; Tipping point analysis

Therapeutic Goods Administration
Submission PM-2017-001328-1-5 Extract from the Clinical Evaluation Report for Steglatro Attachment 2 PART 1 FINAL 31 January 2019
Page 110 of 121
Table 65 (continued): Sensitivity analysis; Tipping point analysis
Subgroup analysis
In general, the improvements in HbA1c were greater in the E15/S100 and E5/S100 groups relative to the individual component treatment groups (at corresponding dose strengths) across the subgroups evaluated. Numerically larger reductions in HbA1c were observed in the subgroups with higher versus lower baseline HbA1c in each treatment group. In the entire FAS, there was no notable numerical difference in HbA1c-lowering with E15/S100 relative to E5/S100; in the by-baseline HbA1c subgroups, numerically greater HbA1c reductions were observed in the E15/S100 group relative to the E5/S100 group for subjects with higher baseline HbA1c values (≥ 9 to < 10% and ≥ 10%). Otherwise, no meaningful differences in HbA1c reduction by subgroup were observed.
7.2.4.13. Other efficacy results
The model based probability of having an HbA1c value < 7.0% at Week 26, using multiple imputation for subjects with missing Week 26 data, were significantly greater in the E15/S100 and E5/S100 groups relative to the individual component treatment groups at corresponding dose strengths (26%, 32%, 33%, 52% and 49% in the E5, E15, S100, E5/S100 and E15/S100 groups, respectively; p < 0.001 for all comparisons).
The LS mean reductions from baseline in FPG at Week 26 were significantly greater in the E15/S100 and E5/S100 groups relative to the individual component treatment groups at corresponding dose strengths in the E5, E15, S100, E5/S100 and E15/S100 groups, respectively; -1.98, -2.05, -1.42, -2.44 and -2.70mmol/L, respectively) (p = 0.004 for E5/S100 versus E5; p < 0.001 for all other comparisons). Large reductions in FPG in all treatment groups

Therapeutic Goods Administration
Submission PM-2017-001328-1-5 Extract from the Clinical Evaluation Report for Steglatro Attachment 2 PART 1 FINAL 31 January 2019
Page 111 of 121
at Week 6 were followed by small subsequent reductions through Week 26. At each time point, the magnitude of the reductions in FPG was numerically greater in the E15/S100 and E5/S100 groups than in the 3 other groups, and was numerically greater in the E5 and E15 groups than in the S100 group (Figure 21).
Figure 21: FPG (mg/dL) LS Mean change from Baseline over time; cLDA FAS excluding rescue approach
The LS mean reductions from baseline in body weight were significantly greater in the E15/S100 and E5/S100 groups relative to the S100 group (-2.7, -3.7, -0.7, -2.5 and -2.9kg, respectively; p < 0.001 for both comparisons). Initial reductions in body weight in the 4 ertugliflozin-treated groups at Week 6 (first scheduled post-randomisation assessment) were followed by further subsequent reductions at each time point through Week 26. A small reduction from baseline in body weight at Week 26 was seen in the S100 group. The magnitude of the decrease in body weight was numerically greater in the E15 group than in the 4 other groups at each time point (Figure 22).

Therapeutic Goods Administration
Submission PM-2017-001328-1-5 Extract from the Clinical Evaluation Report for Steglatro Attachment 2 PART 1 FINAL 31 January 2019
Page 112 of 121
Figure 22: Body weight (kg) LS Mean change from baseline over time. cLDA; FAS: Excluding rescue approach
Decreases from baseline in sitting SBP were significantly greater in the E15/S100 and E5/S100 groups relative to the S100 group (-3.9, -3.7, -0.7, -3.4 and -3.7 mmHg, respectively; p = 0.002 and p = 0.005, respectively). Reductions in SBP were observed in the 4 ertugliflozin-treated groups at Week 6, with subsequent further reductions seen at Week 26. Small reductions in SBP at each time point through Week 18 in the S100 group were followed by an increase toward baseline at Week 26. The magnitudes of the reductions in SBP at Week 26 were similar in the 4 ertugliflozin-treated groups (Figure 23). The LS mean reductions from baseline in DBP at Week 26 were numerically greater in the E15/S100 and E5/S100 groups than in the S100 group. The magnitude of reductions in DBP in the four ertugliflozin treated groups was small and varied over time. There was essentially no change from baseline in DBP in the S100 group through Week 26 (Figure 24).
Figure 23: Sitting systolic BP (mmHg); LS Mean change from baseline over time. cLDA FAS: Excluding rescue approach.

Therapeutic Goods Administration
Submission PM-2017-001328-1-5 Extract from the Clinical Evaluation Report for Steglatro Attachment 2 PART 1 FINAL 31 January 2019
Page 113 of 121
Figure 24: Sitting diastolic BP (mmHg); LS Mean change from Baseline over time cLDA FAS excluding rescue approach
The percentages of subjects who received glycaemic rescue medication through Week 26 in the E15/S100 and E5/S100 groups were lower than in the individual component treatment groups at corresponding dose strengths (nominal p < 0.05 for all comparisons). Similar proportions of subjects received glycaemic rescue medication in the E5 and S100 groups (6.4% and 6.5%, respectively) and in the E5/S100 and E15 groups (2.5% and 2.8%); no subjects were rescued in the E15/S100 group. A graphical display of the Kaplan-Meier estimates for cumulative percentage of subjects rescued is in Figure 25. Sparse data at later time-points resulted in larger estimates of the cumulative percentages of subjects after Week 26 in some treatment groups.
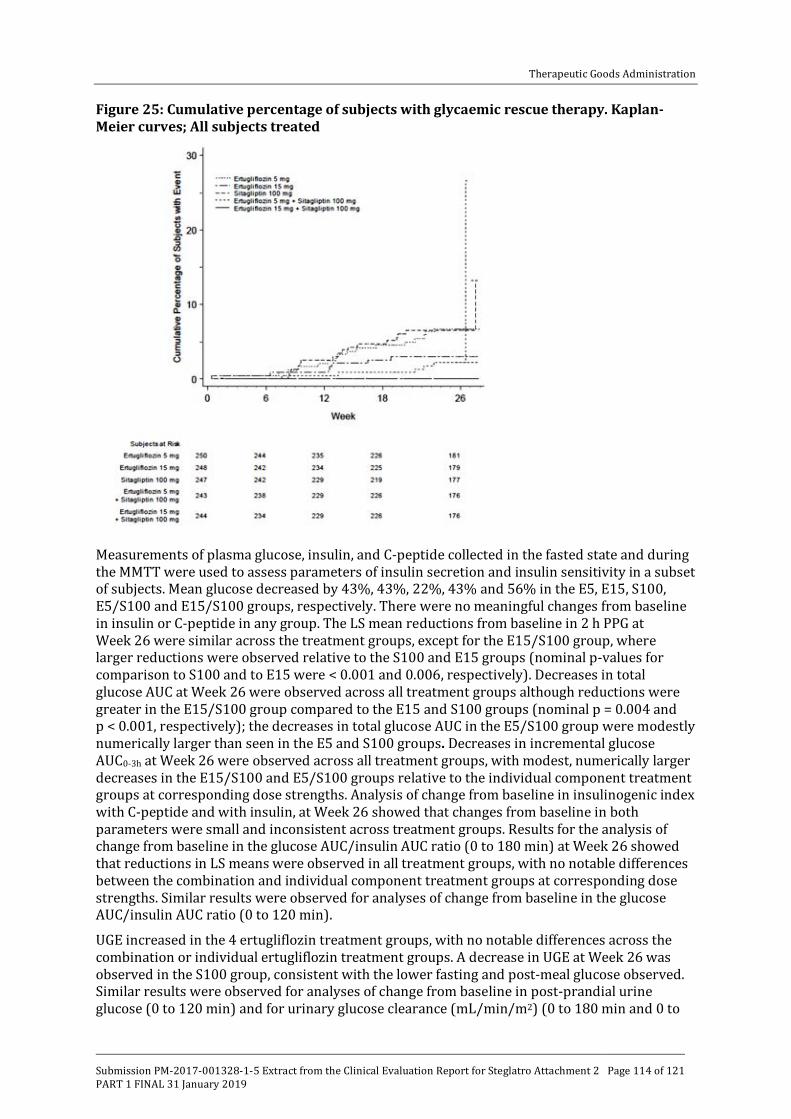
Therapeutic Goods Administration
Submission PM-2017-001328-1-5 Extract from the Clinical Evaluation Report for Steglatro Attachment 2 PART 1 FINAL 31 January 2019
Page 114 of 121
Figure 25: Cumulative percentage of subjects with glycaemic rescue therapy. Kaplan-Meier curves; All subjects treated
Measurements of plasma glucose, insulin, and C-peptide collected in the fasted state and during the MMTT were used to assess parameters of insulin secretion and insulin sensitivity in a subset of subjects. Mean glucose decreased by 43%, 43%, 22%, 43% and 56% in the E5, E15, S100, E5/S100 and E15/S100 groups, respectively. There were no meaningful changes from baseline in insulin or C-peptide in any group. The LS mean reductions from baseline in 2 h PPG at Week 26 were similar across the treatment groups, except for the E15/S100 group, where larger reductions were observed relative to the S100 and E15 groups (nominal p-values for comparison to S100 and to E15 were < 0.001 and 0.006, respectively). Decreases in total glucose AUC at Week 26 were observed across all treatment groups although reductions were greater in the E15/S100 group compared to the E15 and S100 groups (nominal p = 0.004 and p < 0.001, respectively); the decreases in total glucose AUC in the E5/S100 group were modestly numerically larger than seen in the E5 and S100 groups. Decreases in incremental glucose AUC0-3h at Week 26 were observed across all treatment groups, with modest, numerically larger decreases in the E15/S100 and E5/S100 groups relative to the individual component treatment groups at corresponding dose strengths. Analysis of change from baseline in insulinogenic index with C-peptide and with insulin, at Week 26 showed that changes from baseline in both parameters were small and inconsistent across treatment groups. Results for the analysis of change from baseline in the glucose AUC/insulin AUC ratio (0 to 180 min) at Week 26 showed that reductions in LS means were observed in all treatment groups, with no notable differences between the combination and individual component treatment groups at corresponding dose strengths. Similar results were observed for analyses of change from baseline in the glucose AUC/insulin AUC ratio (0 to 120 min).
UGE increased in the 4 ertugliflozin treatment groups, with no notable differences across the combination or individual ertugliflozin treatment groups. A decrease in UGE at Week 26 was observed in the S100 group, consistent with the lower fasting and post-meal glucose observed. Similar results were observed for analyses of change from baseline in post-prandial urine glucose (0 to 120 min) and for urinary glucose clearance (mL/min/m2) (0 to 180 min and 0 to
Therapeutic Goods Administration
Submission PM-2017-001328-1-5 Extract from the Clinical Evaluation Report for Steglatro Attachment 2 PART 1 FINAL 31 January 2019
Page 115 of 121
120 min). Urine glucose excretion was increased by a similar amount in the 4 ertugliflozin treated groups.
In all treatment groups, beta-cell responsivity static component (ϕs) increased at Week 26 relative to baseline with the largest increase occurring in the S100 group. There were no meaningful between-group differences. HOMA-%beta increased in all treatment groups at Week 26, with numerically greater increases in the E15/S100 and E5/S100 groups relative to the individual component treatment groups at corresponding dose strengths.
7.2.4.14. Evaluator commentary
This well-conducted randomised, double blind, parallel-group, factorial pivotal Phase III study evaluated the efficacy and safety of the co-administration of ertugliflozin (5 mg QD and 15 mg QD) with sitagliptin 100 mg QD compared with the individual treatments alone at corresponding dose strengths, in 1233 subjects with T2DM and inadequate glycaemic control on metformin monotherapy. Only Phase A results up to Week 26 were provided in the submitted CSR. The sponsors have stated that a separate CSR including results from Phase B (Weeks 26 to 52) will be prepared at the end of the study.
The study population was representative of patients with T2DM with moderate to severe baseline hyperglycaemia and intact renal function, and included a range of ethnic/racial backgrounds. Subjects had a mean duration of T2DM of approximately 7 years, mean baseline HbA1c of 8.55%, and a mean baseline eGFR of 92.4 mL/min/1.73 m2. The median metformin dose at entry was 2000 mg/day.
The LS mean reductions in HbA1c at Week 26 were clinically meaningful and significantly greater in both combination groups (E15/S100 and E5/S100) relative to the individual component treatment groups at corresponding dose strengths. The results of the sensitivity analyses to assess the potential impact of missing data suggested that the primary results were robust. A significantly greater proportion of subjects (about 50%) achieved glycaemic goal (HbA1c < 7%) with combination treatment, relative to treatment with the individual components (about 26 to 33%).
Marked reductions in FPG were also observed in all treatment groups, with significantly greater reductions in the combination groups relative to the individual component treatment groups at corresponding dose strengths. 2 h PPG was assessed in a subset of subjects who participated in a mixed meal tolerance test; the LS mean reductions from baseline in 2 h PPG at Week 26 were similar across the treatment groups, except for the E15/S100 group, where larger reductions were observed relative to the individual component treatments at corresponding dose strengths. Furthermore, the number of subjects who required glycaemic rescue therapy was lower in the combination therapy groups with no subjects in the E15/S100 requiring rescue therapy. Reductions in body weight and sitting SBP were observed in the 4 ertugliflozin-treated groups. Change from baseline in the beta-cell responsivity static component (ϕs), which was assessed via the MMTT increased from baseline in all treatment groups, but no meaningful between group differences were observed.
Two doses of ertugliflozin (5 mg and 15 mg) administered in combination with sitagliptin were evaluated in this study. No meaningful difference was observed between the 2 co-administration groups (E15/S100 and E5/S100) for HbA1c related endpoints, although there was a trend toward better efficacy for E15/S100 relative to E5/S100 for FPG and 2 h PPG However, interpretation was limited as this study was not powered to detect differences between the 2 combination groups.
7.2.5. Study P006/1015: Add-on to metformin plus sitagliptin
7.2.5.1. Study design, objectives
This was a multicentre, randomised, double blind, placebo controlled, parallel group clinical trial of ertugliflozin in subjects with T2DM on stable treatment with metformin ≥ 1500 mg/day

Therapeutic Goods Administration
Submission PM-2017-001328-1-5 Extract from the Clinical Evaluation Report for Steglatro Attachment 2 PART 1 FINAL 31 January 2019
Page 116 of 121
and sitagliptin 100 mg QD The double blind treatment period was 52 weeks in duration and divided into two 26 week phases. Results from Phase A were presented in the submitted CSR and the sponsors have stated that a separate CSR including results from Phase B will be prepared at the end of the study. Details of the study design are provided in Figure 26. The duration of the trial was up to approximately 69 weeks (with 10 clinic visits) for each subject. This included a 1 week Screening Period (Visit 1 to Visit 2); an up to 12 week wash-off/titration/dose-stabilisation period (Visit 2 to Visit 3); a 2 week single blind, placebo run-in period (Visit 3 to Visit 4); a 52 week double blind, placebo-controlled treatment period (including a 26 week Phase A (Visit 4 to Visit 8) followed by a 26 week Phase B (Visit 8 to Visit 10)); and a post-treatment telephone contact 14 days after the last dose of blinded study medication.
Figure 26: Study P006/1015 Overview of study design
The primary objectives were to assess the following after 26 weeks in subjects with T2DM and inadequate glycaemic control on treatment with metformin ≥ 1500 mg/day and sitagliptin 100 mg QD: HbA1c-lowering efficacy of the addition of ertugliflozin 15 mg and 5 mg QD relative to the addition of placebo; safety and tolerability of the addition of ertugliflozin. The secondary objectives were to assess the effects of the addition of ertugliflozin 15 mg and 5 mg QD relative to the addition of placebo on FPG, body weight, the proportion of subjects with an HbA1c < 7.0% (53 mmol/mol), SBP, DBP and a fasting measure of beta-cell function (that is, homeostasis model assessment of beta-cell function (HOMA-%beta)).
The study was conducted from 7 April 2014 to 18 November 2015 (last subject visit for Phase A) in 12 countries, including 104 trial centres.30
30 5 in Argentina, 5 in Bulgaria, 4 in Colombia, 10 in Czech Republic, 5 in Finland, 4 in Hungary, 9 in Israel, 6 in Malaysia, 9 in Romania, 7 in Slovakia, 12 in the Republic of Korea, and 28 in the United States.

Therapeutic Goods Administration
Submission PM-2017-001328-1-5 Extract from the Clinical Evaluation Report for Steglatro Attachment 2 PART 1 FINAL 31 January 2019
Page 117 of 121
7.2.5.2. Inclusion exclusion criteria
The main inclusion criteria were to be ≥ 18 years of age, BMI ≥ 18 kg/m2 with diagnosis of T2DM in accordance with ADA guidelines and meeting one of the following criteria:
• On metformin ≥ 1500 mg/day and sitagliptin 100 mg/day for ≥ 8 weeks with an HbA1c ≥ 7.0% and ≤ 10.5% (≥ 53 mmol/mol and ≤ 91 mmol/mol) OR
• On metformin ≥ 1500 mg/day and sitagliptin 100 mg/day for < 8 weeks with an HbA1c ≥ 7.0% and ≤ 10.5% (≥ 53 mmol/mol and ≤ 91 mmol/mol) OR
• On metformin ≥ 1500 mg/day and a DPP-4 inhibitor (other than sitagliptin) with an HbA1c ≥ 7.0% and ≤ 10.5% (≥ 53 mmol/mol and ≤ 91 mmol/mol) OR
• On metformin ≥ 1500 mg/day and an sulfonylurea with an HbA1c ≥ 7.0% and ≤ 10.5% (≥ 53 mmol/mol and ≤ 91 mmol/mol) OR
• On metformin <1500 mg/day and any DPP-4 inhibitor with an HbA1c ≥ 7.5% and ≤ 11.0% (≥ 58 mmol/mol and ≤ 97 mmol/mol).
Subjects on a fixed-dose combination (FDC) with metformin and a DPP-4 inhibitor at Visit 1/Screening were switched to co-administration treatment with metformin (titrated to ≥ 1500 mg/day as needed) and sitagliptin 100 mg QD at Visit 2 or Combined Visit 2/3 (as appropriate). Other inclusion and exclusion criteria were similar to those discussed previously with exception that subjects with known hypersensitivity or intolerance to any SGLT2 inhibitor or sitagliptin were also excluded.
7.2.5.3. Study treatments
Subjects who were on metformin ≥ 1500 mg/day and sitagliptin 100 mg QD for ≥ 8 weeks with a Visit 1/Screening HbA1c ≥ 7.0% and ≤ 10.5% (≥ 53 mmol/mol and ≤ 91 mmol/mol) and who met all other enrolment criteria directly entered the 2 week, single blind, placebo run-in period at a combined Visit 2/3. Subjects who did not meet the above criteria but who were within one of the following four groups at Visit 1/Screening were eligible to enter a wash-off/titration/dose-stabilisation period beginning at Visit 2 and have Visit 3/Week -2 according to Table 66). Subjects with adequate compliance (≥ 80% during the placebo run-in period) and who met all other entry criteria were eligible to enter the 52 week double blind treatment period and were randomised in a 1:1:1 ratio to 1 of 3 treatment groups: ertugliflozin 5 mg QD, ertugliflozin 15 mg QD or placebo. Details of trial treatments are summarised in Table 67. During the placebo run-in and double blind treatment periods, subjects were to take 2 oral tablets of study medication once daily in the morning31, including ertugliflozin 5 mg or matching placebo tablet and ertugliflozin 10 mg or matching placebo tablet. Doses of background metformin and sitagliptin were to remain stable throughout the 52 week double blind treatment period. Subjects who met progressively more stringent glycaemic rescue criteria during the double blind treatment period were to receive open label glimepiride (or insulin glargine if glimepiride was not considered appropriate for the subject). After initiating glycaemic rescue therapy, subjects were to continue the same dose and regimen of their study medication and background metformin and sitagliptin. Medications prohibited while subjects were receiving study medication during the double blind treatment periods were summarised in Table 68 and guidance for specific medications which were permitted during the study is summarised in Table 69.
31 On days without a clinic visit, subjects were to take blinded study medication at approximately the same time of day in the morning. Background metformin and sitagliptin, as well as glimepiride (or insulin glargine) rescue therapy (if applicable), were to be taken as prescribed by the investigator. On the days of clinic visits, subjects were to take their study medication, as well as background metformin and sitagliptin and glimepiride (or insulin glargine) rescue therapy (if applicable), after all study procedures were completed.

Therapeutic Goods Administration
Submission PM-2017-001328-1-5 Extract from the Clinical Evaluation Report for Steglatro Attachment 2 PART 1 FINAL 31 January 2019
Page 118 of 121
Table 66: Guidelines for management of subjects prior to placebo run-in

Therapeutic Goods Administration
Submission PM-2017-001328-1-5 Extract from the Clinical Evaluation Report for Steglatro Attachment 2 PART 1 FINAL 31 January 2019
Page 119 of 121
Table 67: Study treatments
Table 68: Prohibited medications
Medications listed below were prohibited while subjects were receiving study medication during the double blind treatment period:
1. Other anti-hyperglycaemic medications:
a. Insulin of any type (except for short-term use during hospitalisation and no longer required)
b. Other injectable AHAs (for example, pramlintide, exenatide, liraglutide)
c. Pioglitazone or rosiglitazone
d. SGLT2 inhibitors (except blinded ertugliflozin)
e. SUs (except blinded glimepiride)
f. DPP4 inhibitors (except sitagliptin rescue medication)
g. Bromocriptine (Cycloset)
h. Colesevelam (Welchol)
i. Any other AHA with the exception of the protocol-approved agents
2. Corticosteroids: Treatment for ≥14 consecutive days or repeated courses of pharmacologic doses of corticosteroid was prohibited. Note: Inhaled, nasal, and topical corticosteroids and physiological replacement doses of adrenal steroids were permitted.
3. Weight loss medications: Initiation of a weight-loss medication (for example, orlistat, phentermine, topiramate, lorcaserin) was prohibited. Note: Subjects who were on treatment with a weight loss medication or other medication associated with weight

Therapeutic Goods Administration
Submission PM-2017-001328-1-5 Extract from the Clinical Evaluation Report for Steglatro Attachment 2 PART 1 FINAL 31 January 2019
Page 120 of 121
changes (for example, anti-psychotic agents) and who were weight-stable (that is, < 5% change in body weight within 6 months of Visit 1/Screening) at Visit 1/Screening were eligible to participate in the study and permitted to continue these medications during the study.
Table 69: Guidance for other medications
Guidance for other medications
The investigator or subject’s physician/health care provider was permitted to make adjustments in the subject’s non-AHA therapies throughout the trial if clinically warranted. Guidance for specific medications which were permitted during the study is provided below.
1. Blood Pressure and Lipid-altering Medications: Concurrent blood pressure and lipid-lowering medications were permitted. Subjects were to be on stable doses of these medications for at least 4 weeks before Visit 4/Day 1. Subjects whose blood pressure or lipid-lowering medications were not stable at Visit 1/Screening were scheduled appropriately to ensure these medications were stable for at least 4 weeks prior to Visit 4/Day 1.
2. Hormonal Replacement Therapy and Birth Control Medications: Hormone replacement therapy and birth control medications were permitted, but subjects were to be on stable regimens, and were expected to remain on their stable regimen while receiving study medication during the double blind treatment period and for 14 days after the last dose of study medication.
3. Thyroid Hormone Replacement Therapy: Thyroid replacement medication (for example, thyroxine) was permitted, but subjects were to be on a stable dose for at least 6 weeks prior to Visit 1/Screening. Subjects who met the thyroid stimulating hormone (TSH) exclusion criterion specified (in Table 9-3) could have been re-screened after being on a stable thyroid replacement regimen for at least 6 weeks.
4. Supplements and/or Traditional Medicines: The use of herbal supplements and other natural products was discouraged. Subjects who did not discontinue the use of such supplements prior to Visit 3/Week -2 or combined Visit 2/3 were to be instructed not to change the use or dose of the supplement during the trial. Subjects were to have been instructed not to initiate new supplements during the trial.
7.2.5.4. Efficacy variables and outcomes
Glycaemic efficacy endpoints included changes from baseline in HbA1c and FPG. Other key endpoints were change from baseline in body weight, SBP and DBP, proportion of subjects with HbA1c <7% and HOMA-%beta. The effect of ertugliflozin on quality of life was assessed using the EQ-5D 3-Level Version (EQ-5D-3L) Score.32 The proportion of subjects who required glycaemic rescue therapy and time to initiation of rescue were also assessed. The primary, key secondary and other efficacy endpoints are summarised in Table 70.
The presentation of this clinical evaluation is continued in Attachment 2 PART 2
32 EQ-5D-3L is a standardised measure of health status developed by EuroQol Group (www.euroqol.org) to provide a simple generic measure of health for clinical and economic appraisal.

Therapeutic Goods Administration PO Box 100 Woden ACT 2606 Australia
Email: [email protected] Phone: 1800 020 653 Fax: 02 6232 8605 https://www.tga.gov.au


![SupplementaryAbstract] OR "ertugliflozin"[Supplementary Concept] OR "ertugliflozin"[Title/Abstract] OR "Steglatro"[Title/Abstract] OR "2s 3r 4r 5s 6r 2 4 chloro 3 4 ethoxybenzyl phenyl](https://img.pdfslide.us/doc/110x75/6131ed3bdfd10f4dd73a1dde/supplementary-abstract-or-ertugliflozinsupplementary-concept-or-ertugliflozintitleabstract.jpg)