Embed Size (px)
Citation preview

1
ATTACHMENT A
2016 State Wage Case – Economic Outlook1,2
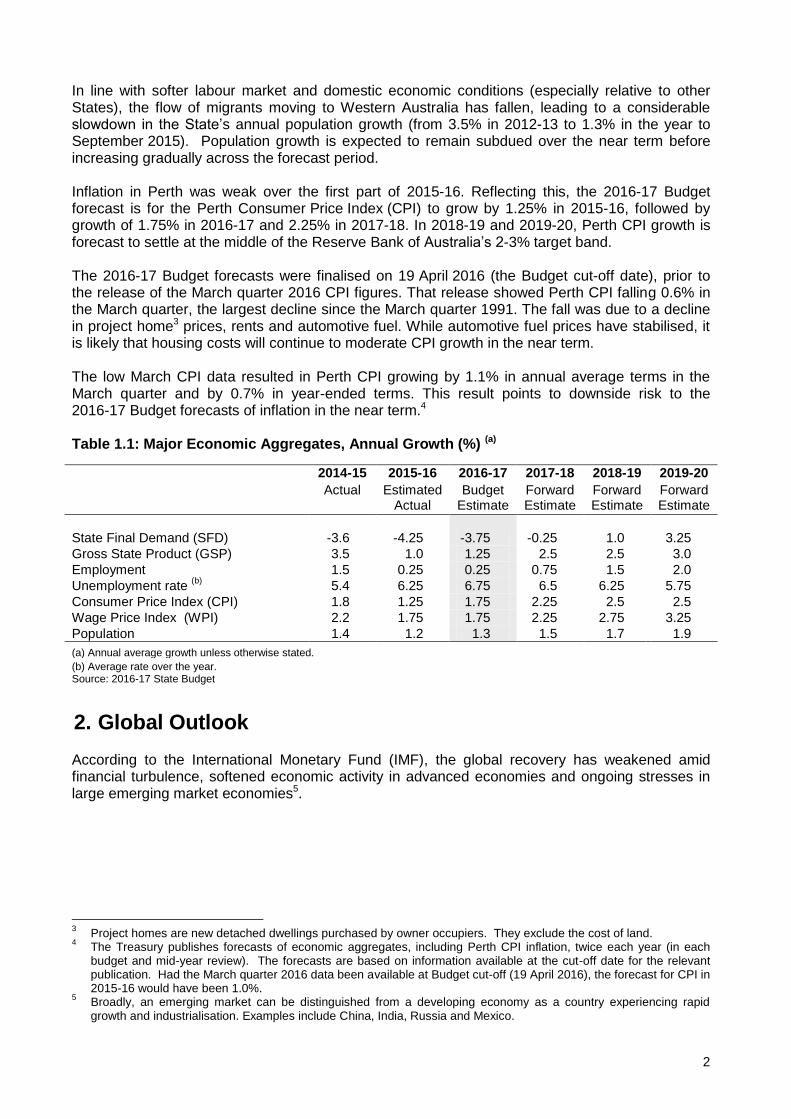
1. Overview Following very strong growth of 6.7% per annum over the three years to 2013-14, growth in the Western Australian economy (as measured by Gross State Product, GSP) slowed to 3.5% in 2014-15. GSP growth is expected to ease further to 1% in 2015-16 and 1.25% in 2016-17, as strong contributions from the external sector are moderated by a weak domestic economy (as measured by State Final Demand, SFD). After contracting by 3.6% in 2014-15, domestic economic activity is forecast to decline by a substantial 4.25% in 2015-16, 3.75% in 2016-17, and by a more modest decline of 0.25% in 2017-18. While this marks an extended period of weakness in SFD, it follows a decade of very strong growth. The weak outlook for SFD primarily reflects further large falls in business investment from unprecedented levels, after peaking at $78.7 billion in 2012-13. Business investment is projected to decline across the majority of the forecast period, mainly due to a continual wind down of capital expenditure on the State’s major LNG projects, compounded by subdued intentions for new investment (which has been hampered by lower commodity prices). At the same time, export volumes are expected to increase solidly as major resource projects increase their output. While continued growth in exports is expected to support GSP growth over the forecast period, large declines in key commodity prices means that while the volume of exports is rising, the income derived from them has been falling. This has reduced revenue for mineral and energy producers in the State, leading to cost cutting and lower growth in household incomes. Consequently, growth in household consumption has slowed to its weakest pace since 2008-09, and is expected to remain below its long-run average (4.1%) across the forecast period, constrained by subdued wages and population growth. These factors are also likely to impact dwelling investment, which is projected to contract in 2016-17 reflecting a combination of record dwelling completions over recent years and more moderate demand. GSP growth is expected to strengthen to 3% by 2019-20, largely underpinned by a recovery in the domestic economy (due to a return to modest growth in business investment). However this remains below its historical average of 4.7%. The weaker domestic economy has flowed through to softer labour market conditions in the State, as reflected in a rising unemployment rate, a decline in full-time employment and a further slowing of wage growth to its weakest pace on record. In line with the outlook for SFD, employment growth is expected to be negligible over the next two years, while the unemployment rate is expected to peak at 6.75% in 2016-17. In this environment, wage growth is expected to slow to a new record low.
1 The forecasts for Western Australia’s economic aggregates in this attachment are those published in the 2016-17
Budget, released on 12 May 2016. 2 Data for historical levels of activity and historical growth rates are based on data published by the
Australian Bureau of Statistics, unless otherwise stated.
2
In line with softer labour market and domestic economic conditions (especially relative to other States), the flow of migrants moving to Western Australia has fallen, leading to a considerable slowdown in the State’s annual population growth (from 3.5% in 2012-13 to 1.3% in the year to September 2015). Population growth is expected to remain subdued over the near term before increasing gradually across the forecast period. Inflation in Perth was weak over the first part of 2015-16. Reflecting this, the 2016-17 Budget forecast is for the Perth Consumer Price Index (CPI) to grow by 1.25% in 2015-16, followed by growth of 1.75% in 2016-17 and 2.25% in 2017-18. In 2018-19 and 2019-20, Perth CPI growth is forecast to settle at the middle of the Reserve Bank of Australia’s 2-3% target band. The 2016-17 Budget forecasts were finalised on 19 April 2016 (the Budget cut-off date), prior to the release of the March quarter 2016 CPI figures. That release showed Perth CPI falling 0.6% in the March quarter, the largest decline since the March quarter 1991. The fall was due to a decline in project home3 prices, rents and automotive fuel. While automotive fuel prices have stabilised, it is likely that housing costs will continue to moderate CPI growth in the near term. The low March CPI data resulted in Perth CPI growing by 1.1% in annual average terms in the March quarter and by 0.7% in year-ended terms. This result points to downside risk to the 2016-17 Budget forecasts of inflation in the near term.4 Table 1.1: Major Economic Aggregates, Annual Growth (%) (a)
2014-15 2015-16 2016-17 2017-18 2018-19 2019-20
Actual Estimated Actual
Budget Estimate
Forward Estimate
Forward Estimate
Forward Estimate
State Final Demand (SFD)
-3.6 -4.25 -3.75 -0.25 1.0 3.25
Gross State Product (GSP) 3.5 1.0 1.25 2.5 2.5 3.0
Employment 1.5 0.25 0.25 0.75 1.5 2.0
Unemployment rate (b)
5.4 6.25 6.75 6.5 6.25 5.75
Consumer Price Index (CPI) 1.8 1.25 1.75 2.25 2.5 2.5
Wage Price Index (WPI) 2.2 1.75 1.75 2.25 2.75 3.25
Population
1.4 1.2 1.3 1.5 1.7 1.9
(a) Annual average growth unless otherwise stated.
(b) Average rate over the year. Source: 2016-17 State Budget
2. Global Outlook According to the International Monetary Fund (IMF), the global recovery has weakened amid financial turbulence, softened economic activity in advanced economies and ongoing stresses in large emerging market economies5.
3 Project homes are new detached dwellings purchased by owner occupiers. They exclude the cost of land.
4 The Treasury publishes forecasts of economic aggregates, including Perth CPI inflation, twice each year (in each
budget and mid-year review). The forecasts are based on information available at the cut-off date for the relevant publication. Had the March quarter 2016 data been available at Budget cut-off (19 April 2016), the forecast for CPI in 2015-16 would have been 1.0%.
5 Broadly, an emerging market can be distinguished from a developing economy as a country experiencing rapid
growth and industrialisation. Examples include China, India, Russia and Mexico.
3
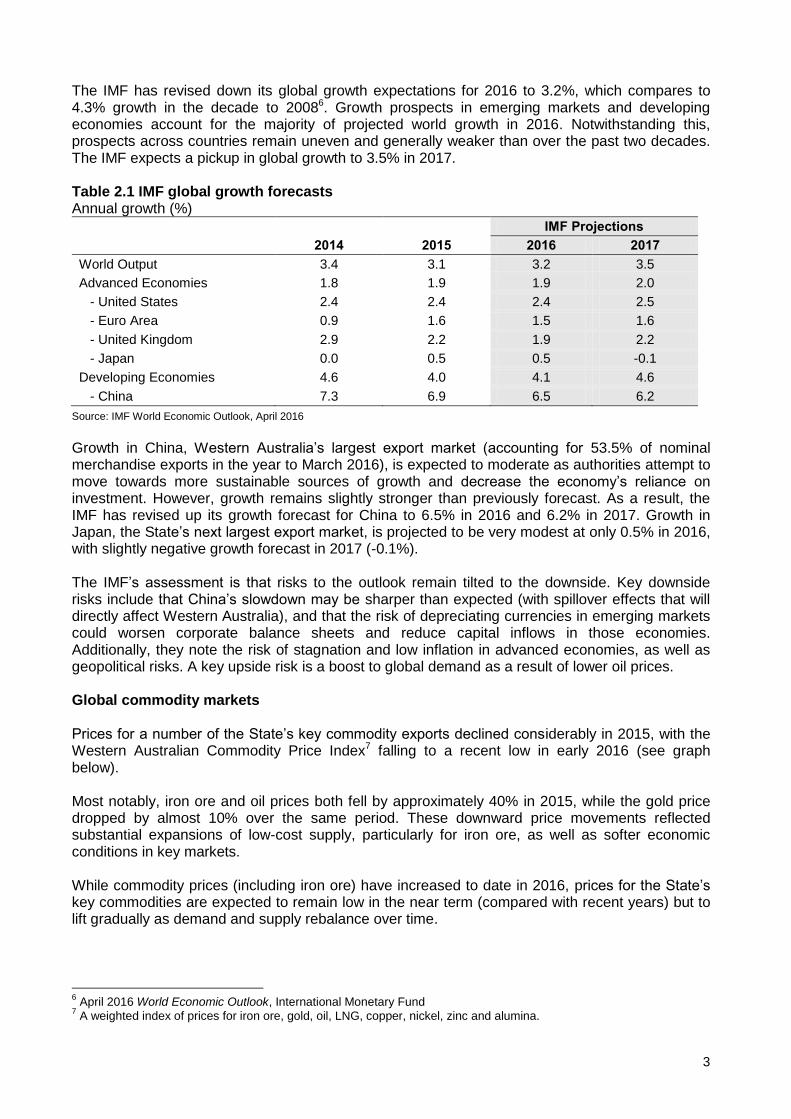
The IMF has revised down its global growth expectations for 2016 to 3.2%, which compares to 4.3% growth in the decade to 20086. Growth prospects in emerging markets and developing economies account for the majority of projected world growth in 2016. Notwithstanding this, prospects across countries remain uneven and generally weaker than over the past two decades. The IMF expects a pickup in global growth to 3.5% in 2017. Table 2.1 IMF global growth forecasts Annual growth (%) IMF Projections
2014 2015 2016 2017
World Output 3.4 3.1 3.2 3.5
Advanced Economies 1.8 1.9 1.9 2.0
- United States 2.4 2.4 2.4 2.5
- Euro Area 0.9 1.6 1.5 1.6
- United Kingdom 2.9 2.2 1.9 2.2
- Japan 0.0 0.5 0.5 -0.1
Developing Economies 4.6 4.0 4.1 4.6
- China 7.3 6.9 6.5 6.2
Source: IMF World Economic Outlook, April 2016
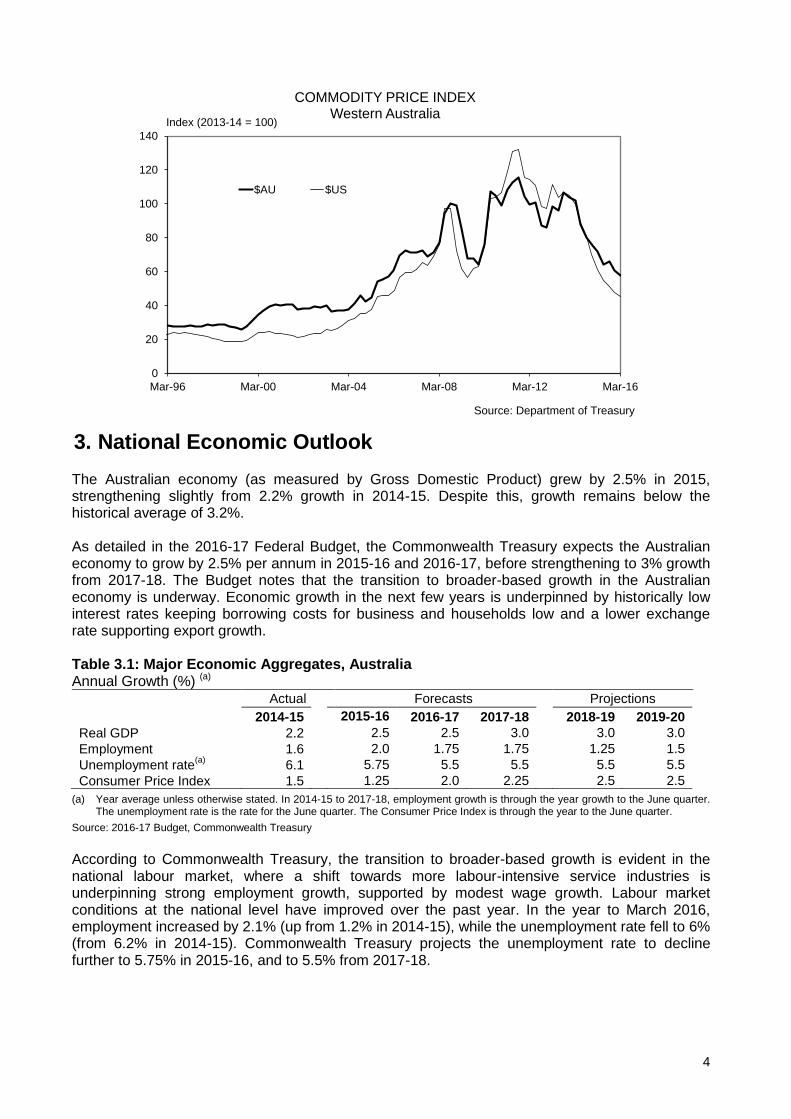
Growth in China, Western Australia’s largest export market (accounting for 53.5% of nominal merchandise exports in the year to March 2016), is expected to moderate as authorities attempt to move towards more sustainable sources of growth and decrease the economy’s reliance on investment. However, growth remains slightly stronger than previously forecast. As a result, the IMF has revised up its growth forecast for China to 6.5% in 2016 and 6.2% in 2017. Growth in Japan, the State’s next largest export market, is projected to be very modest at only 0.5% in 2016, with slightly negative growth forecast in 2017 (-0.1%). The IMF’s assessment is that risks to the outlook remain tilted to the downside. Key downside risks include that China’s slowdown may be sharper than expected (with spillover effects that will directly affect Western Australia), and that the risk of depreciating currencies in emerging markets could worsen corporate balance sheets and reduce capital inflows in those economies. Additionally, they note the risk of stagnation and low inflation in advanced economies, as well as geopolitical risks. A key upside risk is a boost to global demand as a result of lower oil prices. Global commodity markets Prices for a number of the State’s key commodity exports declined considerably in 2015, with the Western Australian Commodity Price Index7 falling to a recent low in early 2016 (see graph below). Most notably, iron ore and oil prices both fell by approximately 40% in 2015, while the gold price dropped by almost 10% over the same period. These downward price movements reflected substantial expansions of low-cost supply, particularly for iron ore, as well as softer economic conditions in key markets. While commodity prices (including iron ore) have increased to date in 2016, prices for the State’s key commodities are expected to remain low in the near term (compared with recent years) but to lift gradually as demand and supply rebalance over time.
6 April 2016 World Economic Outlook, International Monetary Fund
7 A weighted index of prices for iron ore, gold, oil, LNG, copper, nickel, zinc and alumina.
4
0
20
40
60
80
100
120
140
Mar-96 Mar-00 Mar-04 Mar-08 Mar-12 Mar-16
COMMODITY PRICE INDEXWestern Australia
$AU $US
Index (2013-14 = 100)
Source: Department of Treasury
3. National Economic Outlook The Australian economy (as measured by Gross Domestic Product) grew by 2.5% in 2015, strengthening slightly from 2.2% growth in 2014-15. Despite this, growth remains below the historical average of 3.2%. As detailed in the 2016-17 Federal Budget, the Commonwealth Treasury expects the Australian economy to grow by 2.5% per annum in 2015-16 and 2016-17, before strengthening to 3% growth from 2017-18. The Budget notes that the transition to broader-based growth in the Australian economy is underway. Economic growth in the next few years is underpinned by historically low interest rates keeping borrowing costs for business and households low and a lower exchange rate supporting export growth. Table 3.1: Major Economic Aggregates, Australia Annual Growth (%) (a)
Actual Forecasts Projections
2014-15 2015-16 2016-17 2017-18 2018-19 2019-20
Real GDP 2.2 2.5 2.5 3.0 3.0 3.0
Employment 1.6 2.0 1.75 1.75 1.25 1.5
Unemployment rate(a)
6.1 5.75 5.5 5.5 5.5 5.5
Consumer Price Index 1.5 1.25 2.0 2.25 2.5 2.5
(a) Year average unless otherwise stated. In 2014-15 to 2017-18, employment growth is through the year growth to the June quarter. The unemployment rate is the rate for the June quarter. The Consumer Price Index is through the year to the June quarter.
Source: 2016-17 Budget, Commonwealth Treasury
According to Commonwealth Treasury, the transition to broader-based growth is evident in the national labour market, where a shift towards more labour-intensive service industries is underpinning strong employment growth, supported by modest wage growth. Labour market conditions at the national level have improved over the past year. In the year to March 2016, employment increased by 2.1% (up from 1.2% in 2014-15), while the unemployment rate fell to 6% (from 6.2% in 2014-15). Commonwealth Treasury projects the unemployment rate to decline further to 5.75% in 2015-16, and to 5.5% from 2017-18.

5
After holding the cash rate at 2% for twelve months, the Reserve Bank of Australia (RBA) reduced the cash rate to a record low of 1.75% in May. The May rate cut was passed on in full to the standard variable home loan rate by three of the four major banks.8 In announcing its May 2016 decision, the RBA highlighted lower than expected inflationary pressure (reported in the March 2016 CPI data) as its primary reason for the rate cut.
0
2
4
6
8
10
12
May-96 May-00 May-04 May-08 May-12 May-16
%
INTEREST RATESAustralia
RBA target
Standard variable home loan rate
Source: Reserve Bank of Australia
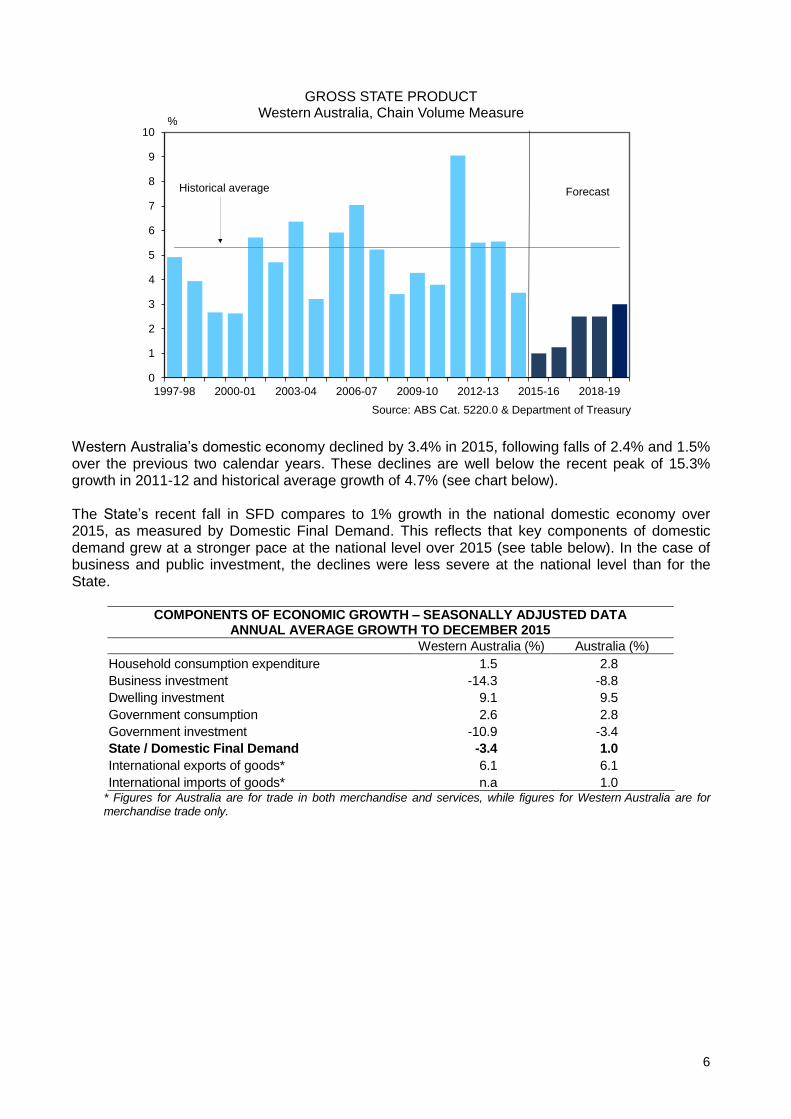
4. Western Australia’s Economic Outlook The Western Australian economy (as measured by GSP9) grew by 3.5% in 2014-15, down from 5.6% growth in 2013-14 but still above national economic growth of 2.2%. The latest data released by the Australian Bureau of Statistics (ABS) in March 2016 shows that the domestic economy (as measured by SFD) contracted by 3.4% in 2015 (mainly due to a 14.3% fall in business investment), while merchandise exports grew by 6.1%, demonstrating the economy’s transition to export-driven growth. Economic growth is expected to slow further in the immediate term to 1% in 2015-16 and 1.25% in 2016-17, with robust growth in exports, as a result of the completion of major resource projects, substantially offset by lower levels of business investment and dwelling investment. Growth is forecast to increase modestly over the remaining forecast period as business investment returns to modest growth and as exports continue to rise (see graph below).
8 ANZ reduced its home loan rates by 0.19 of a percentage point. ‘Banks pass on Reserve Bank of Australia’s interest
rate cut’, Sydney Morning Herald, 3 May 2016. 9 Gross State Product is a more complete measure of Western Australia’s economic activity, as it includes domestic
activity and net external demand for Western Australia’s goods.
6
0
1
2
3
4
5
6
7
8
9
10
1997-98 2000-01 2003-04 2006-07 2009-10 2012-13 2015-16 2018-19
%
GROSS STATE PRODUCTWestern Australia, Chain Volume Measure
Source: ABS Cat. 5220.0 & Department of Treasury
ForecastHistorical average
Western Australia’s domestic economy declined by 3.4% in 2015, following falls of 2.4% and 1.5% over the previous two calendar years. These declines are well below the recent peak of 15.3% growth in 2011-12 and historical average growth of 4.7% (see chart below). The State’s recent fall in SFD compares to 1% growth in the national domestic economy over 2015, as measured by Domestic Final Demand. This reflects that key components of domestic demand grew at a stronger pace at the national level over 2015 (see table below). In the case of business and public investment, the declines were less severe at the national level than for the State.
COMPONENTS OF ECONOMIC GROWTH – SEASONALLY ADJUSTED DATA ANNUAL AVERAGE GROWTH TO DECEMBER 2015
Western Australia (%) Australia (%)
Household consumption expenditure 1.5 2.8
Business investment -14.3 -8.8
Dwelling investment 9.1 9.5
Government consumption 2.6 2.8
Government investment -10.9 -3.4
State / Domestic Final Demand -3.4 1.0
International exports of goods* 6.1 6.1
International imports of goods* n.a 1.0 * Figures for Australia are for trade in both merchandise and services, while figures for Western Australia are for merchandise trade only.
7
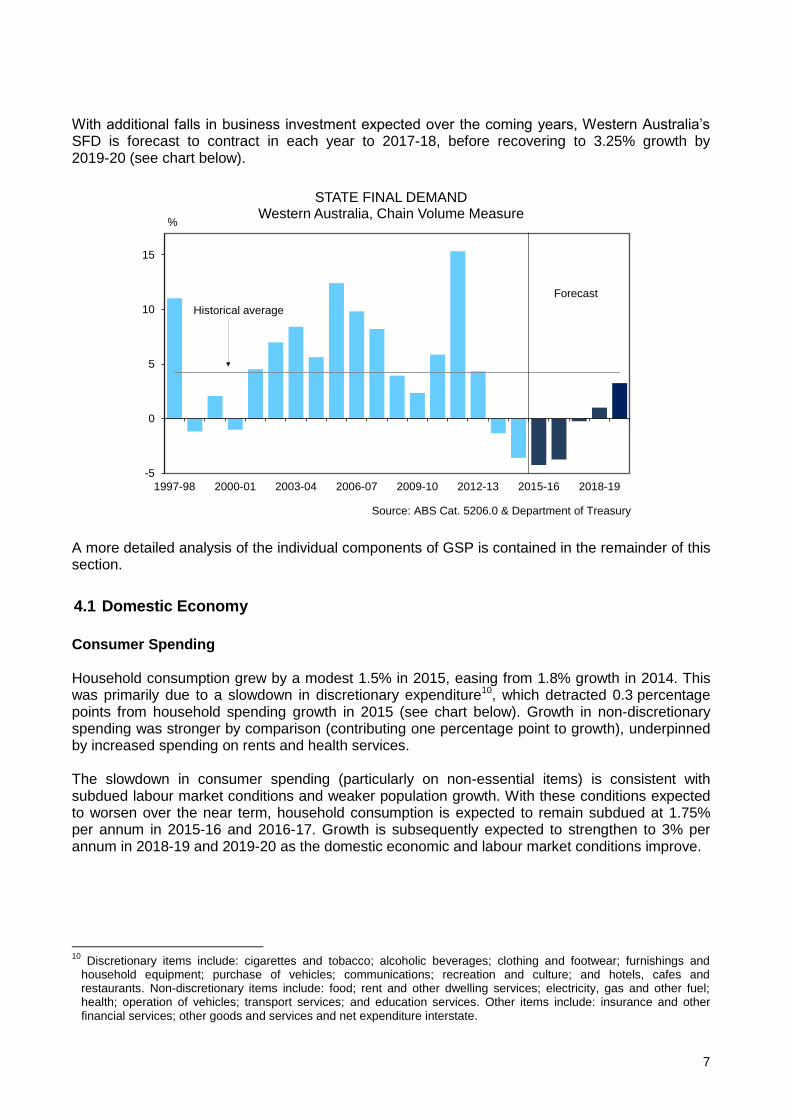
With additional falls in business investment expected over the coming years, Western Australia’s SFD is forecast to contract in each year to 2017-18, before recovering to 3.25% growth by 2019-20 (see chart below).
-5
0
5
10
15
1997-98 2000-01 2003-04 2006-07 2009-10 2012-13 2015-16 2018-19
%
STATE FINAL DEMANDWestern Australia, Chain Volume Measure
Source: ABS Cat. 5206.0 & Department of Treasury
Forecast
Historical average
A more detailed analysis of the individual components of GSP is contained in the remainder of this section.
4.1 Domestic Economy
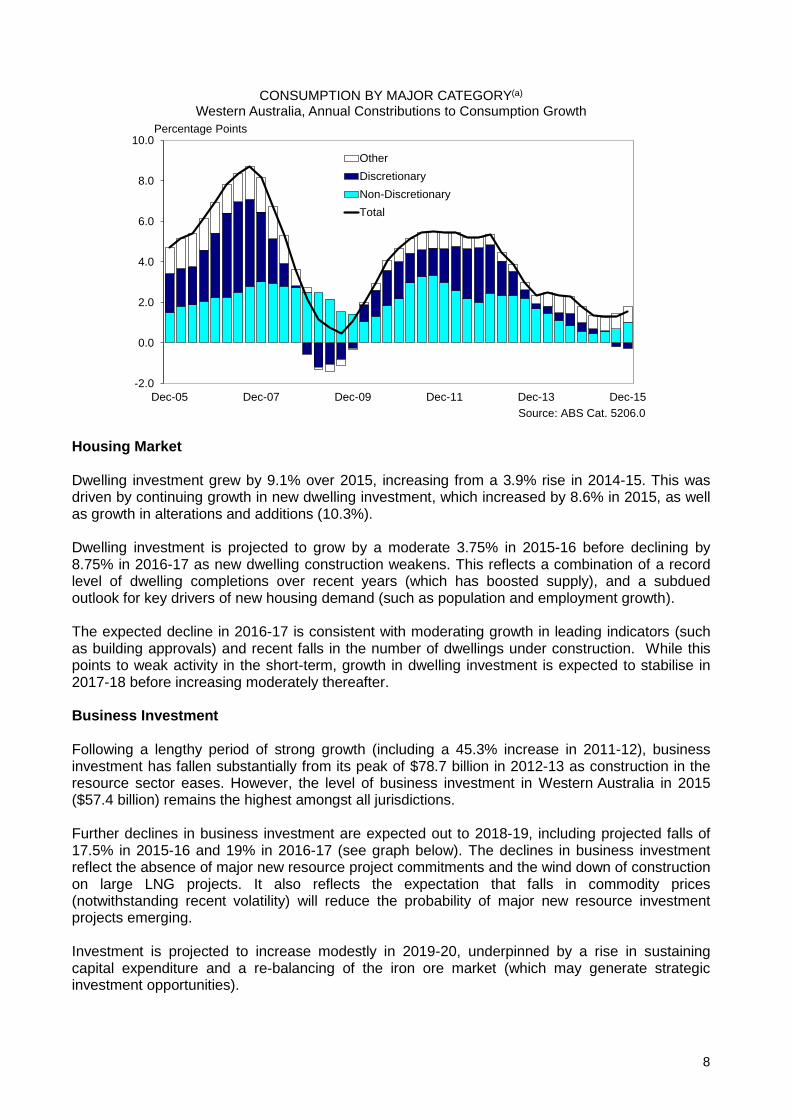
Consumer Spending Household consumption grew by a modest 1.5% in 2015, easing from 1.8% growth in 2014. This was primarily due to a slowdown in discretionary expenditure10, which detracted 0.3 percentage points from household spending growth in 2015 (see chart below). Growth in non-discretionary spending was stronger by comparison (contributing one percentage point to growth), underpinned by increased spending on rents and health services. The slowdown in consumer spending (particularly on non-essential items) is consistent with subdued labour market conditions and weaker population growth. With these conditions expected to worsen over the near term, household consumption is expected to remain subdued at 1.75% per annum in 2015-16 and 2016-17. Growth is subsequently expected to strengthen to 3% per annum in 2018-19 and 2019-20 as the domestic economic and labour market conditions improve.
10
Discretionary items include: cigarettes and tobacco; alcoholic beverages; clothing and footwear; furnishings and household equipment; purchase of vehicles; communications; recreation and culture; and hotels, cafes and restaurants. Non-discretionary items include: food; rent and other dwelling services; electricity, gas and other fuel; health; operation of vehicles; transport services; and education services. Other items include: insurance and other financial services; other goods and services and net expenditure interstate.
8
-2.0
0.0
2.0
4.0
6.0
8.0
10.0
Dec-05 Dec-07 Dec-09 Dec-11 Dec-13 Dec-15
CONSUMPTION BY MAJOR CATEGORY(a)
Western Australia, Annual Constributions to Consumption Growth
Other
Discretionary
Non-Discretionary
Total
Percentage Points
Source: ABS Cat. 5206.0
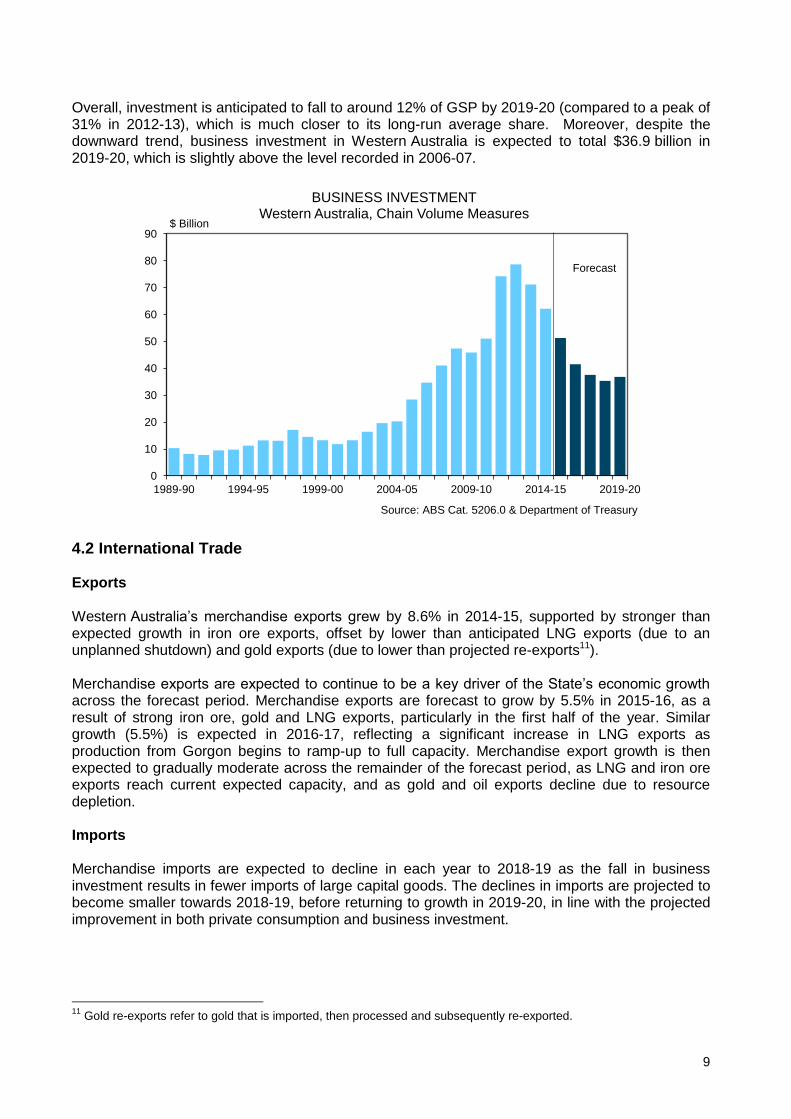
Housing Market Dwelling investment grew by 9.1% over 2015, increasing from a 3.9% rise in 2014-15. This was driven by continuing growth in new dwelling investment, which increased by 8.6% in 2015, as well as growth in alterations and additions (10.3%). Dwelling investment is projected to grow by a moderate 3.75% in 2015-16 before declining by 8.75% in 2016-17 as new dwelling construction weakens. This reflects a combination of a record level of dwelling completions over recent years (which has boosted supply), and a subdued outlook for key drivers of new housing demand (such as population and employment growth). The expected decline in 2016-17 is consistent with moderating growth in leading indicators (such as building approvals) and recent falls in the number of dwellings under construction. While this points to weak activity in the short-term, growth in dwelling investment is expected to stabilise in 2017-18 before increasing moderately thereafter. Business Investment Following a lengthy period of strong growth (including a 45.3% increase in 2011-12), business investment has fallen substantially from its peak of $78.7 billion in 2012-13 as construction in the resource sector eases. However, the level of business investment in Western Australia in 2015 ($57.4 billion) remains the highest amongst all jurisdictions. Further declines in business investment are expected out to 2018-19, including projected falls of 17.5% in 2015-16 and 19% in 2016-17 (see graph below). The declines in business investment reflect the absence of major new resource project commitments and the wind down of construction on large LNG projects. It also reflects the expectation that falls in commodity prices (notwithstanding recent volatility) will reduce the probability of major new resource investment projects emerging. Investment is projected to increase modestly in 2019-20, underpinned by a rise in sustaining capital expenditure and a re-balancing of the iron ore market (which may generate strategic investment opportunities).
9
Overall, investment is anticipated to fall to around 12% of GSP by 2019-20 (compared to a peak of 31% in 2012-13), which is much closer to its long-run average share. Moreover, despite the downward trend, business investment in Western Australia is expected to total $36.9 billion in 2019-20, which is slightly above the level recorded in 2006-07.
0
10
20
30
40
50
60
70
80
90
1989-90 1994-95 1999-00 2004-05 2009-10 2014-15 2019-20
$ Billion
BUSINESS INVESTMENTWestern Australia, Chain Volume Measures
Source: ABS Cat. 5206.0 & Department of Treasury
Forecast
4.2 International Trade Exports Western Australia’s merchandise exports grew by 8.6% in 2014-15, supported by stronger than expected growth in iron ore exports, offset by lower than anticipated LNG exports (due to an unplanned shutdown) and gold exports (due to lower than projected re-exports11). Merchandise exports are expected to continue to be a key driver of the State’s economic growth across the forecast period. Merchandise exports are forecast to grow by 5.5% in 2015-16, as a result of strong iron ore, gold and LNG exports, particularly in the first half of the year. Similar growth (5.5%) is expected in 2016-17, reflecting a significant increase in LNG exports as production from Gorgon begins to ramp-up to full capacity. Merchandise export growth is then expected to gradually moderate across the remainder of the forecast period, as LNG and iron ore exports reach current expected capacity, and as gold and oil exports decline due to resource depletion. Imports Merchandise imports are expected to decline in each year to 2018-19 as the fall in business investment results in fewer imports of large capital goods. The declines in imports are projected to become smaller towards 2018-19, before returning to growth in 2019-20, in line with the projected improvement in both private consumption and business investment.
11
Gold re-exports refer to gold that is imported, then processed and subsequently re-exported.
10
5. The Labour Market
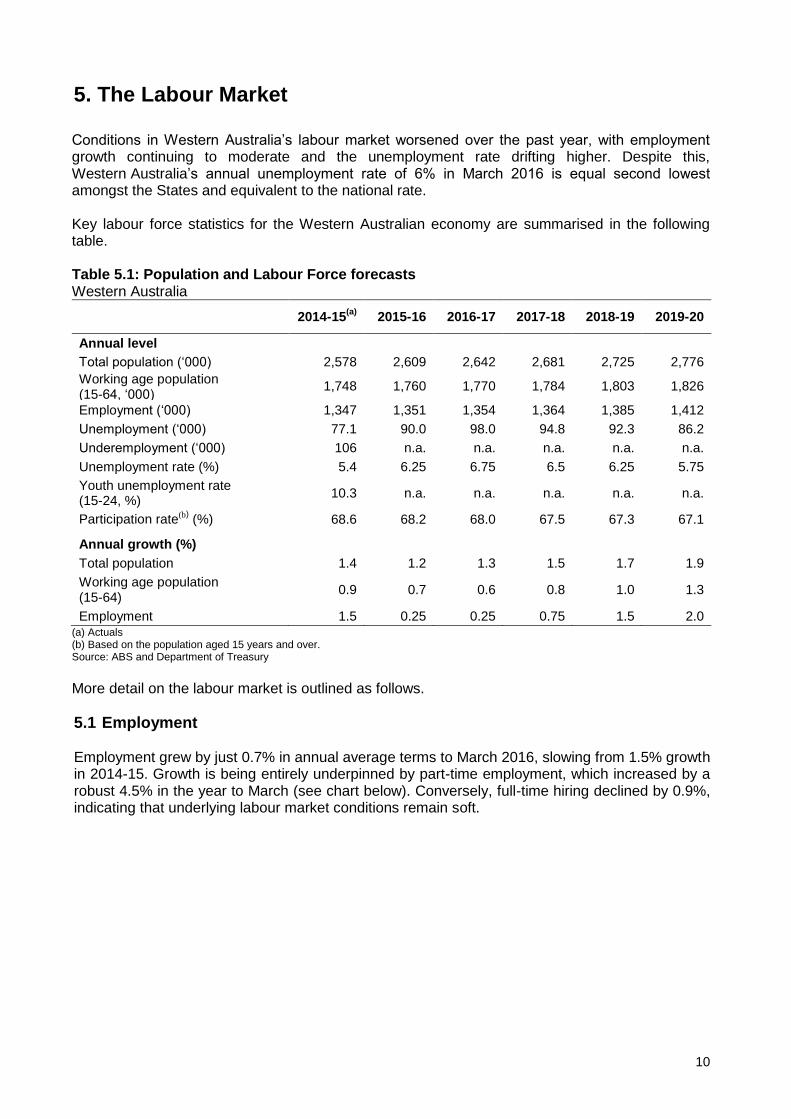
Conditions in Western Australia’s labour market worsened over the past year, with employment growth continuing to moderate and the unemployment rate drifting higher. Despite this, Western Australia’s annual unemployment rate of 6% in March 2016 is equal second lowest amongst the States and equivalent to the national rate. Key labour force statistics for the Western Australian economy are summarised in the following table. Table 5.1: Population and Labour Force forecasts Western Australia
2014-15(a)
2015-16 2016-17 2017-18 2018-19 2019-20
Annual level
Total population (‘000) 2,578 2,609 2,642 2,681 2,725 2,776
Working age population (15-64, ‘000)
1,748 1,760 1,770 1,784 1,803 1,826
Employment (‘000) 1,347 1,351 1,354 1,364 1,385 1,412
Unemployment (‘000) 77.1 90.0 98.0 94.8 92.3 86.2
Underemployment (‘000) 106 n.a. n.a. n.a. n.a. n.a.
Unemployment rate (%) 5.4 6.25 6.75 6.5 6.25 5.75
Youth unemployment rate (15-24, %)
10.3 n.a. n.a. n.a. n.a. n.a.
Participation rate(b) (%) 68.6 68.2 68.0 67.5 67.3 67.1
Annual growth (%)
Total population 1.4 1.2 1.3 1.5 1.7 1.9
Working age population (15-64)
0.9 0.7 0.6 0.8 1.0 1.3
Employment 1.5 0.25 0.25 0.75 1.5 2.0 (a) Actuals (b) Based on the population aged 15 years and over. Source: ABS and Department of Treasury
More detail on the labour market is outlined as follows.
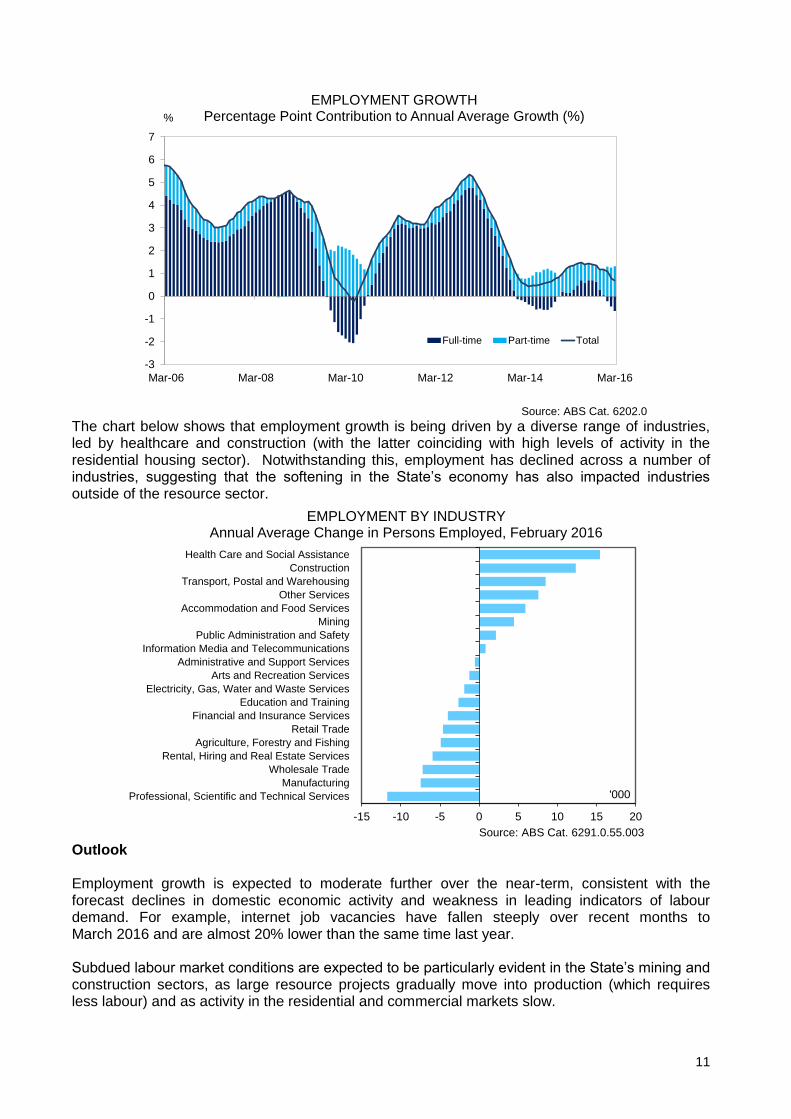
5.1 Employment Employment grew by just 0.7% in annual average terms to March 2016, slowing from 1.5% growth in 2014-15. Growth is being entirely underpinned by part-time employment, which increased by a robust 4.5% in the year to March (see chart below). Conversely, full-time hiring declined by 0.9%, indicating that underlying labour market conditions remain soft.
11
-3
-2
-1
0
1
2
3
4
5
6
7
Mar-06 Mar-08 Mar-10 Mar-12 Mar-14 Mar-16
EMPLOYMENT GROWTHPercentage Point Contribution to Annual Average Growth (%)
Full-time Part-time Total
Source: ABS Cat. 6202.0
%
The chart below shows that employment growth is being driven by a diverse range of industries, led by healthcare and construction (with the latter coinciding with high levels of activity in the residential housing sector). Notwithstanding this, employment has declined across a number of industries, suggesting that the softening in the State’s economy has also impacted industries outside of the resource sector.
-15 -10 -5 0 5 10 15 20
Professional, Scientific and Technical Services
Manufacturing
Wholesale Trade
Rental, Hiring and Real Estate Services
Agriculture, Forestry and Fishing
Retail Trade
Financial and Insurance Services
Education and Training
Electricity, Gas, Water and Waste Services
Arts and Recreation Services
Administrative and Support Services
Information Media and Telecommunications
Public Administration and Safety
Mining
Accommodation and Food Services
Other Services
Transport, Postal and Warehousing
Construction
Health Care and Social Assistance
'000
EMPLOYMENT BY INDUSTRYAnnual Average Change in Persons Employed, February 2016
Source: ABS Cat. 6291.0.55.003 Outlook Employment growth is expected to moderate further over the near-term, consistent with the forecast declines in domestic economic activity and weakness in leading indicators of labour demand. For example, internet job vacancies have fallen steeply over recent months to March 2016 and are almost 20% lower than the same time last year. Subdued labour market conditions are expected to be particularly evident in the State’s mining and construction sectors, as large resource projects gradually move into production (which requires less labour) and as activity in the residential and commercial markets slow.
12
Reflecting these factors, as well as weaker population growth, employment is projected to increase by just 0.25% per annum in 2015-16 and 2016-17. Growth is subsequently expected to strengthen to 2% by 2019-20 as the domestic economy recovers.
5.2 Unemployment and participation
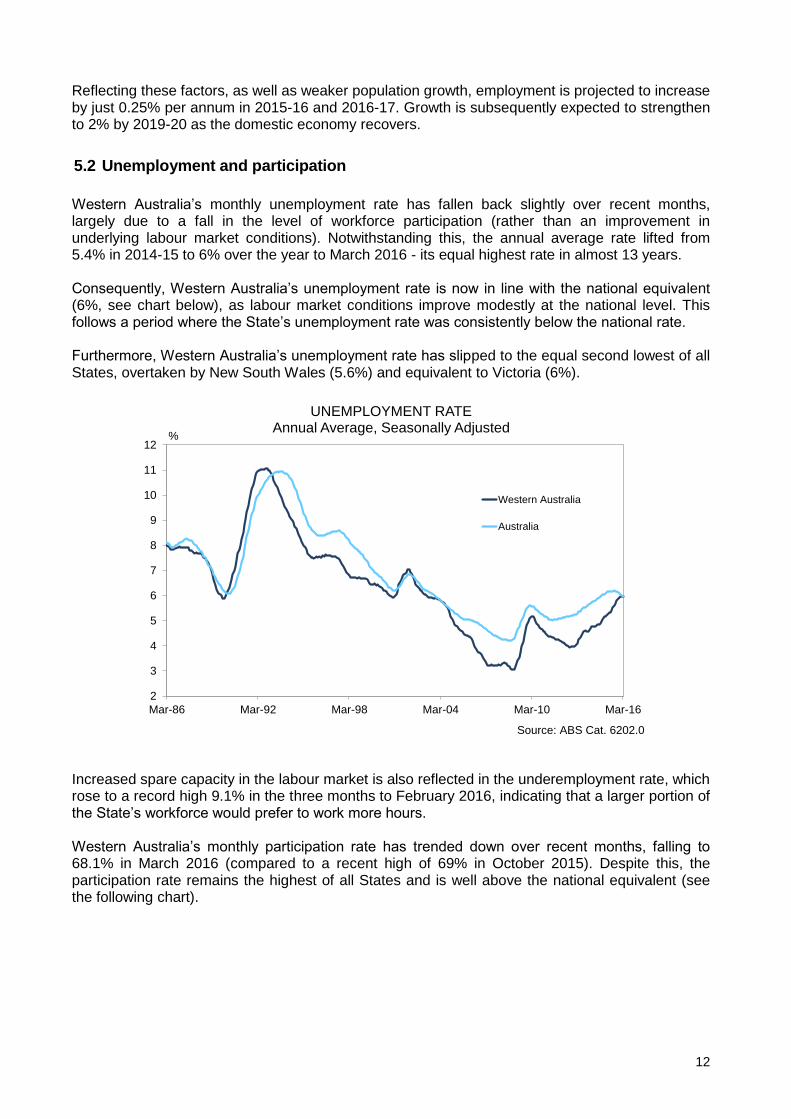
Western Australia’s monthly unemployment rate has fallen back slightly over recent months, largely due to a fall in the level of workforce participation (rather than an improvement in underlying labour market conditions). Notwithstanding this, the annual average rate lifted from 5.4% in 2014-15 to 6% over the year to March 2016 - its equal highest rate in almost 13 years. Consequently, Western Australia’s unemployment rate is now in line with the national equivalent (6%, see chart below), as labour market conditions improve modestly at the national level. This follows a period where the State’s unemployment rate was consistently below the national rate. Furthermore, Western Australia’s unemployment rate has slipped to the equal second lowest of all States, overtaken by New South Wales (5.6%) and equivalent to Victoria (6%).
2
3
4
5
6
7
8
9
10
11
12
Mar-86 Mar-92 Mar-98 Mar-04 Mar-10 Mar-16
%
UNEMPLOYMENT RATEAnnual Average, Seasonally Adjusted
Western Australia
Australia
Source: ABS Cat. 6202.0 Increased spare capacity in the labour market is also reflected in the underemployment rate, which rose to a record high 9.1% in the three months to February 2016, indicating that a larger portion of the State’s workforce would prefer to work more hours. Western Australia’s monthly participation rate has trended down over recent months, falling to 68.1% in March 2016 (compared to a recent high of 69% in October 2015). Despite this, the participation rate remains the highest of all States and is well above the national equivalent (see the following chart).

13
58
60
62
64
66
68
70
Mar-86 Mar-91 Mar-96 Mar-01 Mar-06 Mar-11 Mar-16
%
PARTICIPATION RATEAnnual Average, Seasonally Adjusted
Western Australia
Australia
Source: ABS Cat. 6202.0 Outlook Consistent with the subdued outlook for labour demand, the unemployment rate is projected to lift further to 6.25% in 2015-16, and to peak at 6.75% in 2016-17, which aligns with the expected falls in both business and dwelling investment. The unemployment rate is then projected to decline moderately out to 2019-20 as labour demand improves. The participation rate is expected to continue to trend downwards as a lower number of job opportunities discourage people from activity seeking work, and as a larger portion of the State’s population move into older age cohorts that have lower rates of workforce participation. As such, the participation rate is expected to moderate from 68.2% in 2015-16 to 67.1% in 2019-20.
6. Wages
6.1 Wage Price Index
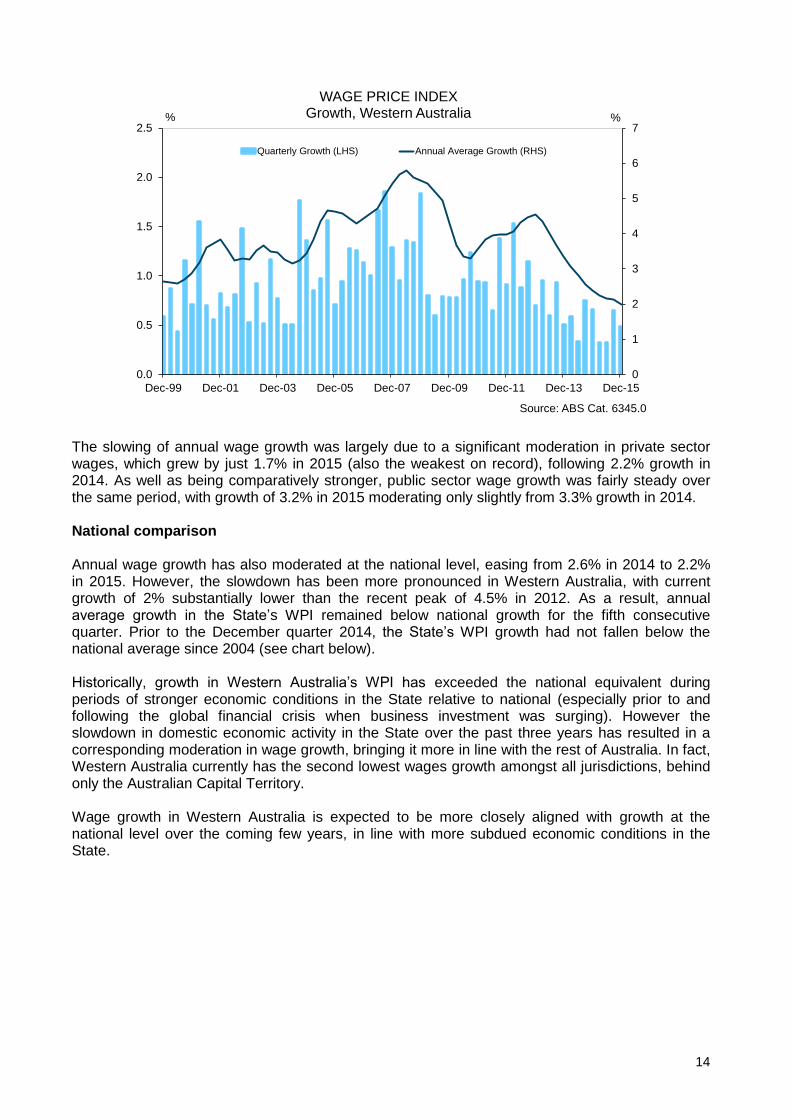
Wage growth in Western Australia remained subdued in 2015, falling to a new record low. This is consistent with continued increasing spare capacity in the labour market and ongoing efforts by businesses to reduce costs and improve efficiency. Of the various wage price indicators published by the ABS, the Wage Price Index (WPI) is generally viewed as the preferred measure of underlying wages growth. This is because the WPI is designed to measure wage changes for a fixed quantity and quality of labour, and thus abstracts from changes in average hours worked and other compositional changes in the labour market. The State’s WPI grew by 0.5% in the December quarter 2015, following growth of 0.6% in the September quarter of 2015, both below decade average quarterly growth of 0.9%. Consequently, annual growth moderated to just 2% in 2015, the slowest growth on record (since 1998-99, see chart below).
14
0
1
2
3
4
5
6
7
0.0
0.5
1.0
1.5
2.0
2.5
Dec-99 Dec-01 Dec-03 Dec-05 Dec-07 Dec-09 Dec-11 Dec-13 Dec-15
%%
Source: ABS Cat. 6345.0
WAGE PRICE INDEXGrowth, Western Australia
Quarterly Growth (LHS) Annual Average Growth (RHS)
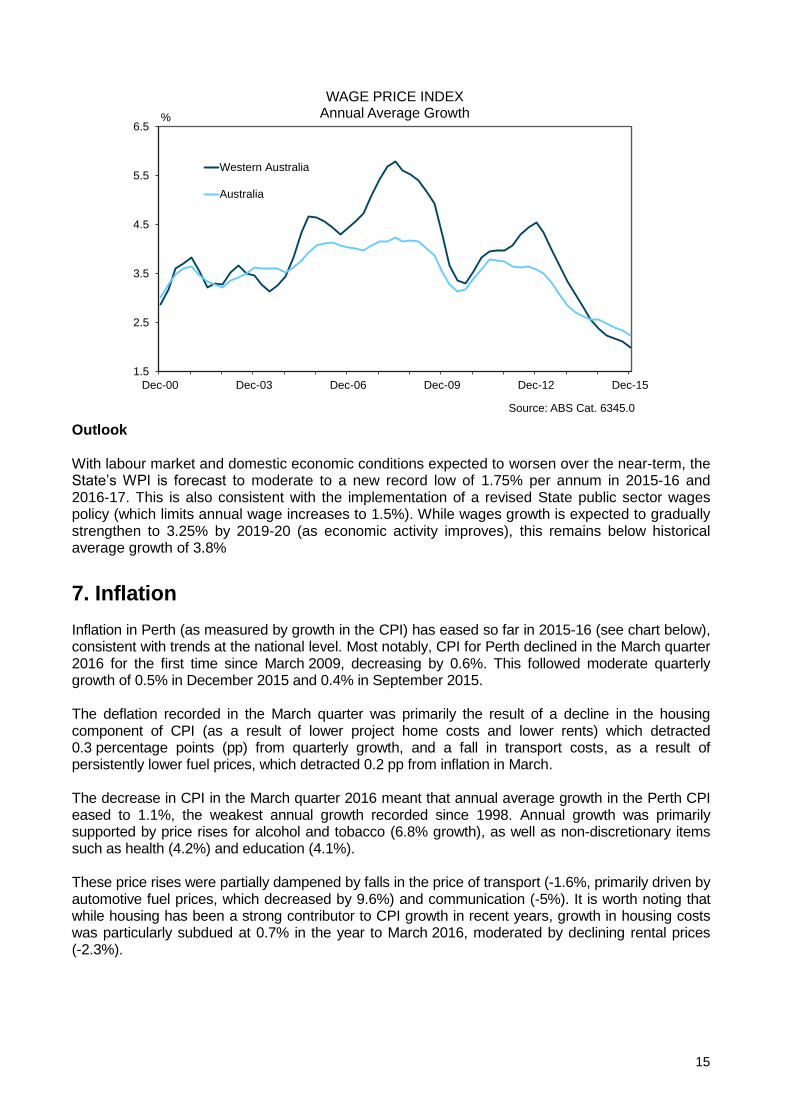
The slowing of annual wage growth was largely due to a significant moderation in private sector wages, which grew by just 1.7% in 2015 (also the weakest on record), following 2.2% growth in 2014. As well as being comparatively stronger, public sector wage growth was fairly steady over the same period, with growth of 3.2% in 2015 moderating only slightly from 3.3% growth in 2014. National comparison Annual wage growth has also moderated at the national level, easing from 2.6% in 2014 to 2.2% in 2015. However, the slowdown has been more pronounced in Western Australia, with current growth of 2% substantially lower than the recent peak of 4.5% in 2012. As a result, annual average growth in the State’s WPI remained below national growth for the fifth consecutive quarter. Prior to the December quarter 2014, the State’s WPI growth had not fallen below the national average since 2004 (see chart below). Historically, growth in Western Australia’s WPI has exceeded the national equivalent during periods of stronger economic conditions in the State relative to national (especially prior to and following the global financial crisis when business investment was surging). However the slowdown in domestic economic activity in the State over the past three years has resulted in a corresponding moderation in wage growth, bringing it more in line with the rest of Australia. In fact, Western Australia currently has the second lowest wages growth amongst all jurisdictions, behind only the Australian Capital Territory. Wage growth in Western Australia is expected to be more closely aligned with growth at the national level over the coming few years, in line with more subdued economic conditions in the State.
15
1.5
2.5
3.5
4.5
5.5
6.5
Dec-00 Dec-03 Dec-06 Dec-09 Dec-12 Dec-15
%
Source: ABS Cat. 6345.0
WAGE PRICE INDEXAnnual Average Growth
Western Australia
Australia
Outlook With labour market and domestic economic conditions expected to worsen over the near-term, the State’s WPI is forecast to moderate to a new record low of 1.75% per annum in 2015-16 and 2016-17. This is also consistent with the implementation of a revised State public sector wages policy (which limits annual wage increases to 1.5%). While wages growth is expected to gradually strengthen to 3.25% by 2019-20 (as economic activity improves), this remains below historical average growth of 3.8%
7. Inflation
Inflation in Perth (as measured by growth in the CPI) has eased so far in 2015-16 (see chart below), consistent with trends at the national level. Most notably, CPI for Perth declined in the March quarter 2016 for the first time since March 2009, decreasing by 0.6%. This followed moderate quarterly growth of 0.5% in December 2015 and 0.4% in September 2015. The deflation recorded in the March quarter was primarily the result of a decline in the housing component of CPI (as a result of lower project home costs and lower rents) which detracted 0.3 percentage points (pp) from quarterly growth, and a fall in transport costs, as a result of persistently lower fuel prices, which detracted 0.2 pp from inflation in March. The decrease in CPI in the March quarter 2016 meant that annual average growth in the Perth CPI eased to 1.1%, the weakest annual growth recorded since 1998. Annual growth was primarily supported by price rises for alcohol and tobacco (6.8% growth), as well as non-discretionary items such as health (4.2%) and education (4.1%). These price rises were partially dampened by falls in the price of transport (-1.6%, primarily driven by automotive fuel prices, which decreased by 9.6%) and communication (-5%). It is worth noting that while housing has been a strong contributor to CPI growth in recent years, growth in housing costs was particularly subdued at 0.7% in the year to March 2016, moderated by declining rental prices (-2.3%).

16
In year-ended terms, Perth’s CPI grew by only 0.7% in the year to March, which is below 1.3% growth nationally12.
-1
1
3
5
-0.8
0.2
1.2
2.2
Mar-06 Mar-08 Mar-10 Mar-12 Mar-14 Mar-16
%
Source: ABS Cat. 6401.0
CONSUMER PRICE INDEXPerth
Quarterly Growth (LHS) Annual Average Growth (RHS)
%
As shown in the following chart, underlying measures of national inflation have eased slightly less than the headline indicator. Excluding volatile items (mainly food and automotive fuel), the national CPI grew by 0.2% in the March quarter (compared to 0.2% decline in the overall measure). Likewise, the RBA’s ‘trimmed mean’ (which excludes the 15% of items with both the smallest and largest price changes) increased by 0.2% in the March quarter. Both alternative measures of CPI were still subdued, but relatively more robust at 2% in annual average terms, in line with the lower bound of the RBA’s target band.
1
2
3
4
5
Mar-06 Mar-08 Mar-10 Mar-12 Mar-14 Mar-16
%
Source: ABS Cat. 6401.0
MEASURES OF CONSUMER PRICE INFLATIONAnnual Average Growth, Australia
All Groups Excluding volatile items Trimmed mean
12
There are two ways in which annual changes in the Australian CPI (weighted average of eight capital cities) are commonly measured, year-ended growth and annual average growth. Year-ended growth (also referred to as “through the year” growth) compares the CPI for one quarter with the CPI for the same quarter a year earlier, while annual average growth compares the average of the CPI for four successive quarters with its average in the same four quarters of the previous year.
17
Outlook The 2016-17 Budget forecasts for the Perth CPI, which were finalised at the Budget cut-off date (19 April 2016), are for the Perth CPI to grow by 1.25% in 2015-16, 1.75% in 2016-17 and 2.25% in 2017-18. Subdued growth in 2015-16 reflects the combined impact of lower fuel prices (consistent with recent falls in the crude oil price), falling residential rents, moderating project home costs and historically low wages growth (partially offset by a 12.5% increase in the Commonwealth’s tobacco excise in September 2015).
In 2016-17 and 2017-18, growth in Perth’s CPI is expected to lift to 1.75% and 2.25% respectively,
in line with a further increase to the Commonwealth’s tobacco excise13, a gradual recovery in the
oil price flowing through to fuel prices, and increases in health insurance premiums,
tertiary education costs, property rates and charges, and utilities. Pressure from these sources is
expected to be tempered by subdued wage growth pressure and modest growth in consumer
spending, which may limit the scope for cost pass-through arising from past depreciation in the
Australian dollar for locally priced goods and services. A soft rental market and the possibility of
builders providing further incentives for new project homes may also have a moderating influence
on the rate of Perth CPI growth over at least part of the period.
CPI growth is forecast to increase by 2.5% per annum in the following two years, in line with the middle of the RBA’s target band of 2-3%. The forecast for Perth CPI growth in 2015-16 is higher than the RBA’s May 201614 forecast for national inflation. In year-ended terms, the RBA expects headline CPI inflation to be 1.0% in 2015-16, with underlying inflation at 1.5%. The forecast for 2016-17 is broadly consistent with the RBA’s forecasts for headline CPI to fall between 1.5% and 2.5% in year-ended. The RBA cites weak price pressure from subdued wages growth and heightened retail competition as having a moderating effect on price pressure from increased import prices due to exchange rate depreciation since 2013. A further increase to the tobacco excise later in 2016 is expected to add 0.25 percentage points to the headline inflation rate. The March 2016 CPI data release suggests downside risks to the 2016-17 Budget forecasts. Although automotive fuel detracted from the March quarter result, fuel prices have stabilised and are not expected to detract from price growth in the future. Declines in project home prices and rents were the largest since the early 1990s, and a softening in the new home construction market and high rental vacancy rate suggest that these sub-sectors will continue to act to moderate consumer price inflation in the near term.15
8. Risks to the economic outlook Notwithstanding the above, there are a number of potential risks that may impact the State’s economic outlook over the next few years. The magnitude of these risks is largely weighed on the downside.
13
A further increase in the tobacco excise rate of 12.5% is expected on 1 September 2016.
14 Reserve Bank of Australia, Statement on Monetary Policy, May 2016.
15 The Treasury publishes forecasts of economic aggregates, including Perth CPI inflation, twice each year (in each
budget and mid-year review). The forecasts are based on information available at the cut-off date for the relevant publication. Had the March quarter 2016 data been available at Budget cut-off (19 April 2016), the forecast for CPI in 2015-16 would have been 1.0%.
18
8.1 Global risks
Global risks mainly relate to conditions in China, which is by far the most important trading partner for Western Australia. A key risk for the Chinese economy is the rapid accumulation of debt, which has been used to finance the construction of fixed assets (such as dwellings, factories and offices). This appears to have generated over-capacity in the manufacturing and property sectors. Endeavors to slow debt accumulation will likely constrain growth. At the same time, the Chinese authorities have been facilitating a change in the structure of the economy toward one that is more reliant on household consumption. These developments could result in lower demand for iron ore and a weaker price for the commodity (all else equal). This could translate into lower profits for the State’s mineral producers, potentially leading to further cost cutting (which may adversely affect household incomes). However these risks must be balanced against continued urbanisation and increasing incomes in China, which are expected to support housing demand and economic growth over the longer term. Additionally, this may benefit some industries in Western Australia that have exposure to Chinese households, such as tourism and high value agriculture. Another key global risk is a ‘normalisation’ of monetary policy in the United States. This has had a negative impact on emerging market economies such as China by increasing capital outflows and exchange rate volatility. In addition, an appreciation of the US dollar has increased the cost of servicing US dollar debt in many countries.
8.2 Domestic risks The outlook for business investment is potentially the largest domestic risk for the State’s economy. While large declines are forecast over the near-term, the balance of risks is on the downside, reflecting that the forecasts assume some additional prospective and/or currently unidentified major project investment will emerge across the forecast period. In addition, the profile of investment may be more volatile than projected due to uncertainty around the exact timing of capital expenditure (especially the large LNG projects). This can flow through to delays in the ramp-up of output, which may result in lower export volumes and consequently, GSP growth. There is also a risk that dwelling investment and house prices may decline more strongly than forecast. This reflects that there is a large volume of new dwellings under construction at a time when the established housing market has substantial spare capacity. In the context of slowing population growth, this may translate to a heightened risk of over-supply in the housing market. Furthermore, there is a risk that banks may raise mortgage rates independently of official rates (due to changes to banks’ capital adequacy requirements), which could further dampen the State’s housing market. Given the extent of the projected contractions in the State’s domestic economy over the next two years, there is a risk that employment levels may be weaker than forecast, particularly given that employment growth in the construction industry (which is currently one of the largest contributors to growth) is expected to moderate. The future path of population growth also creates an element of uncertainty that will affect the domestic demand outlook. For example, if migration to Western Australia slows more rapidly than expected, this will have implications for growth in consumer spending and dwelling investment.
19
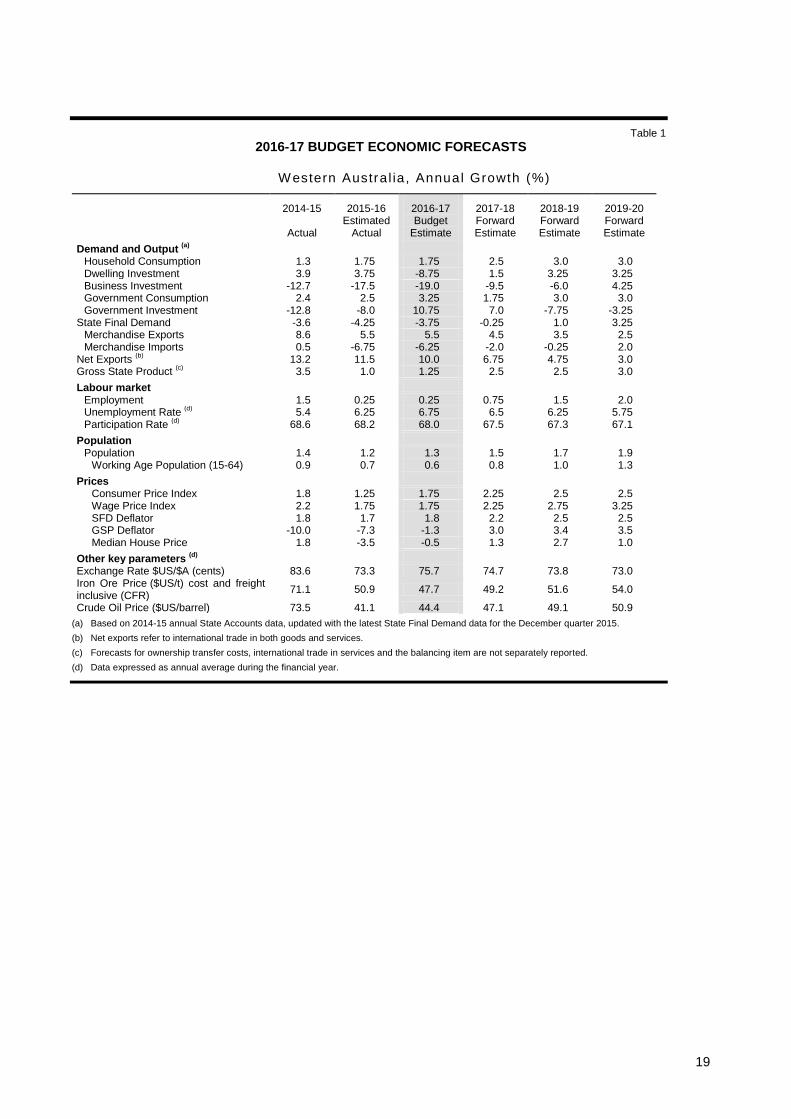
Table 1
2016-17 BUDGET ECONOMIC FORECASTS
Western Austra l ia , Annual Growth (%)
2014-15
Actual
2015-16 Estimated
Actual
2016-17 Budget
Estimate
2017-18 Forward Estimate
2018-19 Forward Estimate
2019-20 Forward Estimate
Demand and Output (a)
Household Consumption 1.3 1.75 1.75 2.5 3.0 3.0 Dwelling Investment 3.9 3.75 -8.75 1.5 3.25 3.25 Business Investment -12.7 -17.5 -19.0 -9.5 -6.0 4.25 Government Consumption 2.4 2.5 3.25 1.75 3.0 3.0 Government Investment -12.8 -8.0 10.75 7.0 -7.75 -3.25
State Final Demand -3.6 -4.25 -3.75 -0.25 1.0 3.25 Merchandise Exports 8.6 5.5 5.5 4.5 3.5 2.5 Merchandise Imports 0.5 -6.75 -6.25 -2.0 -0.25 2.0
Net Exports (b)
13.2 11.5 10.0 6.75 4.75 3.0 Gross State Product
(c) 3.5 1.0 1.25 2.5 2.5 3.0
Labour market
Employment 1.5 0.25 0.25 0.75 1.5 2.0 Unemployment Rate
(d) 5.4 6.25 6.75 6.5 6.25 5.75
Participation Rate (d)
68.6 68.2 68.0 67.5 67.3 67.1
Population
Population 1.4 1.2 1.3 1.5 1.7 1.9 Working Age Population (15-64) 0.9 0.7 0.6 0.8 1.0 1.3
Prices
Consumer Price Index 1.8 1.25 1.75 2.25 2.5 2.5 Wage Price Index 2.2 1.75 1.75 2.25 2.75 3.25 SFD Deflator 1.8 1.7 1.8 2.2 2.5 2.5 GSP Deflator -10.0 -7.3 -1.3 3.0 3.4 3.5 Median House Price 1.8 -3.5 -0.5 1.3 2.7 1.0
Other key parameters (d)
Exchange Rate $US/$A (cents) 83.6 73.3 75.7 74.7 73.8 73.0 Iron Ore Price ($US/t) cost and freight inclusive (CFR)
71.1 50.9 47.7 49.2 51.6 54.0
Crude Oil Price ($US/barrel) 73.5 41.1 44.4 47.1 49.1 50.9
(a) Based on 2014-15 annual State Accounts data, updated with the latest State Final Demand data for the December quarter 2015.
(b) Net exports refer to international trade in both goods and services.
(c) Forecasts for ownership transfer costs, international trade in services and the balancing item are not separately reported.
(d) Data expressed as annual average during the financial year.