Embed Size (px)
Citation preview
June 20, 2014
Mr. Robert Cooper
Office of Stormwater Management
Virginia Department of Environmental Quality
Re: Approval Request for Manufactured Treatment Device,
Aqua-FilterTM
Stormwater Filtration System
Dear Mr. Cooper,
AquaShieldTM
, Inc. is pleased to submit information in support of this approval request for the
Aqua-FilterTM
Stormwater Filtration System. This approval request is submitted in accordance
with Guidance Memo No. 14-2009 dated May 15, 2014, Interim Use of Stormwater MTDs.
We are requesting that the Aqua-FilterTM
be granted a Total Phosphorus (TP) removal credit of
40% based on NJCAT-verified field testing of an Aqua-FilterTM
Model AF-5.3 for 80% TSS
removal efficiency following the TARP Tier II protocol. NJDEP has issued Field Test
Certification based on the field verification.
The following documents are attached for your consideration:
Attachment 1, MTD Registration Form
NJCAT Field Test Verification Report for Aqua-FilterTM
Model AF-5.3, November 2013
NJDEP Aqua-FilterTM
Field Test Certification Letter, June 13, 2014
NJCAT Laboratory Verification Report for the Aqua-Swirl® and Aqua-Filter
TM, 2005 and
August 2007 Addendum for Aqua-FilterTM
[via NJCAT website link]
Aqua-FilterTM
Inspection & Maintenance Manual
AquaShieldTM
Limited Warranty
Thank you for considering this information, and of course please let me know if additional
information is needed at this time.
Respectfully submitted,
AquaShieldTM
, Inc.
Mark B. Miller, P.G.
Research Scientist
27
33
Kan
asi
ta D
riv
e,
Su
ite 1
11 •
Ch
att
an
oo
ga
, T
N 3
73
43
• P
ho
ne (
423)
870-8
88
8 •
ww
w.a
qu
ash
ield
inc.c
om
1
Attachment 1
Manufactured Treatment Device (MTD) Registration
1. Manufactured Treatment Device Name:
Aqua-FilterTM
Stormwater Filtration System
2. Company Name: AquaShieldTM
, Inc.
Mailing Address: 2733 Kanasita Drive, Suite 111
City: Chattanooga
State: Tennessee
Zip: 37343
3. Contact Name (to whom questions should be addressed): Mark B. Miller
Mailing Address: 2733 Kanasita Drive, Suite 111
City: Chattanooga
State: Tennessee
Zip: 37343
Phone number: (423) 870-8888
Fax number: (423) 826-2112
E-mail address: [email protected]
Web address: www.aquashieldinc.com
4. Technology
Specific size/capacity of MTD assessed (include units):
The Aqua-FilterTM
system utilizes a treatment train approach consisting of a pretreatment
hydrodynamic separator (swirl chamber) followed by a filtration chamber. The sizes of
the pretreatment hydrodynamic separator (swirl chamber) range from 2.5 feet to 13 feet
in diameter.
The maximum single filtration chamber is currently limited to 216 ft2 of media (18
“rows” of media x 12 ft2/row). Customization of the Aqua-Filter
TM allows for multiple
filtration chambers, with 18 rows being the current maximum number of rows in a single
chamber.
Range of drainage areas served by MTD (acres):
The customization of the Aqua-FilterTM
design allows for a wide range of drainage areas
to be treated; hence, there is no absolute range of drainage areas served by the device.
The maximum drainage area is ultimately limited by the practicality of utilizing an Aqua-
FilterTM
system to meet the water quality flow rate for a given site. See sizing criteria
below.
2
Include sizing chart or describe sizing criteria:
The Aqua-FilterTM
system utilizes a treatment train approach consisting of a pretreatment
hydrodynamic separator (swirl chamber) followed by a filtration chamber. Both the swirl
chamber and the filtration chamber are sized to meet the water quality treatment flow rate
(WQTFR).
The Aqua-FilterTM
is designated AF-Y.X where AF-Y designates the swirl chamber and
X designates the number of filter rows or filter media area. The first step of sizing is to
size the swirl chamber according to the site’s water quality flow (Q) using a sizing chart.
The second step is to size the filtration chamber to the site’s Q. Based on the NJCAT-
verified perlite filter loading rate of 16.5 gpm/ft2 (0.44 cfs/row of filter media), the
number of rows can be calculated such that Q / 0.44 cfs/row. One row of filter media has
12 ft2 of filter media.
Intended application: on-line or offline:
The Aqua-FilterTM
system is designed to be installed in an offline configuration.
Media used (if applicable):
Perlite is most common media type used for the Aqua-FilterTM
to target suspended
sediment and Total Phosphorus removal. Other filter media blends are available for other
pollutants of concern that can include zeolite, leaf compost, granular activated carbon
(GAC), bone char and PathShieldTM
Antimicrobial Filter Media (EPA and VA registered
antimicrobial pesticide per FIFRA).
5. Warranty Information (describe, or provide web address):
See attached Limited Warranty.
6. Treatment Type
Hydrodynamic Structure
X Filtering Structure
Manufactured Bioretention System
Provide Infiltration Rate (in/hr):
Other (describe):
7. Water Quality Treatment Mechanisms (check all that apply)
A treatment train mechanism is used for Total Phosphorus and sediment removal by the
Aqua-FilterTM
system. The upstream pretreatment hydrodynamic separation chamber
provides sedimentation/settling and the capture of floatables, while the downstream
component provides polishing filtration.
3
X Sedimentation/settling (pretreatment hydrodynamic separator)
Infiltration
X Filtration (based on perlite for TP removal)
Adsorption/cation exchange
Chelating/precipitation
Chemical treatment
Biological uptake
Other (describe):
8. Performance Testing and Certification (check all that apply):
Performance Claim (include removal efficiencies for treated pollutants, flow criteria,
drainage area):
The Aqua-FilterTM
NJCAT Field Test Verification Report for an AF-5.3 dated November
2013 is attached and is available on the NJCAT website at:
http://www.njcat.org/uploads/newDocs/AquaFilterNJCATFieldVerification1113.pdf
From the Aqua-FilterTM
field test verification report Section 5, Performance Verification on
page 27, the performance summary is copied below:
“A 26-month field test of an Aqua-FilterTM
Model AF-5.3 has been completed at an urban
shopping center in Silver Spring, Maryland. Analytical results and performance analysis
from 21 storm events and over 15 inches of rainfall demonstrated that 18 of the storms
achieved greater than 80% TSS removal efficiency for the fine-grained clay-loam textured
sediment influent. Average TSS removal efficiency is 91.9% for the 21 storms. The SSC
average removal efficiency is 93.3% for 20 storms. Both TSS and SSC removal efficiencies
are calculated to be greater than 95% by the sum of loads method. These field results validate
the finding in the NJCAT technology verification addendum report titled “Aqua-Swirl™
Concentrator and Aqua-Filter™ Stormwater Filtration System” that the Aqua-Filter™
Model AF-5.3 at a filter loading rate of 16.5 gpm/ft2
would provide a TSS removal rate of
>80%.”
The NJDEP Field Test Certification letter for the Aqua-FilterTM
is attached and available on
the NJDEP website at: http://www.njstormwater.org/treatment.htm. NJDEP certifies the use
of the Aqua-FilterTM
at a TSS removal rate of 80%. From the NJDEP Field Test Certification
letter: “The peak inflow WQTFR for the filtration chamber is limited to the verified peak
filter loading rate of 16.5 gpm/ft2 (0.037 cfs/ft
2) of filter area. The maximum inflow
impervious drainage area per square foot of filter area is limited to 0.033 acres/ft2 based on
the verified field test.” The AF-5.3 field test drainage area was 1.19 acres.
Specific size/Capacity of MTD assessed:
The AF-5.3 uses a 5-foot diameter pretreatment hydrodynamic separator and a three row
filtration chamber (36 ft2 of perlite filter media).
4
Has the MTD been "approved" by an established granting agency, e.g. New Jersey
Department of Environmental Protection (NJDEP) , Washington State Department of
Ecology, etc.
No X Yes; For each approval, indicate (1) the granting agency, (2) use level if awarded (3)
the protocol version under which performance testing occurred (if applicable), and (4)
the date of award, and attach award letter.
Attached is the NJDEP Field Certification letter for the Aqua-FilterTM
dated June 13, 2014.
This certification is based on the NJCAT verification of the AF-5.3 field test. The letter is
available on the NJDEP website at: http://www.njstormwater.org/treatment.htm. Testing was
performed in accordance with the 2006 New Jersey Tier II Stormwater Test Requirements –
Amendments to TARP Tier II Protocol.
Was an established testing protocol followed?
No X Yes, (1) Provide name of testing protocol followed, (2) list any protocol deviations:
Testing was performed in accordance with the 2006 New Jersey Tier II Stormwater Test
Requirements – Amendments to TARP Tier II Protocol. The testing program falls under the
NJDEP directive “Transition for Manufactured Treatment Devices” dated July 15, 2011. The
Aqua-FilterTM
qualified under Category C, Manufactured Treatment Devices Seeking Final
Certification – In Process which are MTDs that have commenced field testing on or before
August 1, 2011.There were no deviations to the above-cited testing protocol.
NJCAT-verified independent laboratory testing followed acceptable laboratory practices in
place at the time using the NJDEP- specified fine-grained test sediment SIL-CO-SIL 106
manufactured by US Silica. The now superseded NJDEP Laboratory Test Certification
(September 2011) was issued based on the protocol that was followed.
Provide the information below and provide a performance report (attach report):
For lab tests:
i. Summarize the specific settings for each test run (flow rates, run times,
loading rates) and performance for each run:
The NJCAT verified laboratory test of an Aqua-FilterTM
filtration cartridge for
TSS removal (2005 and August 2007 Addendum) is available at the NJCAT
website http://www.njcat.org/verification-process/technology-verification-
database.html. It is not attached hereto due only to its large file size.
Initial laboratory testing (2005 report) demonstrated 80% TSS removal efficiency
at a surface area loading rate of 5 gpm/ft2. From the 2007 Addendum report:
“The Aqua-Filter Stormwater Filtration System, a stand-alone two component
structure, when sized with an Aqua-Swirl pretreatment device at no more than 50
gpm/ft2 as previously certified by NJDEP, followed by a Filter Chamber
5
containing Aqua-Filter cartridges filled with a coarse perlite media sized at no
more than 16.5 gpm/ft2, has been shown to have a calculated 84.6% TSS removal
efficiency utilizing the New Jersey Stormwater Best Management Practices
Manual approach for calculating treatment train removal efficiency.”
Note that the Laboratory Test Certification of 2011 is now superseded by the
above-cited Field Test Certification of 2014.
ii. If a synthetic sediment product was used, include information about the
particle size distribution of the test material:
SIL-CO-SIL 106 is manufactured by US Silica and has a range from
approximately 1 to 125 microns (µm) and a reported median (d50) of 22 µm.
Specific gravity for the sediment is reported to be 2.65. This test sediment was
specified by NJDEP for filter devices at the time Aqua-FilterTM
filtration cartridge
laboratory testing was performed.
iii. If less than full-scale setup was tested, describe the ratio of that tested to the
full-scale MTD:
It is important to keep in mind that the Aqua-FilterTM
filtration chamber is sized
based on surface area of media, not necessarily rows since other filtration
configurations can be used (e.g., round housing vs. rectangular rows). A 4 ft2 and
1 foot thick filter cartridge containing perlite filter media was used for the
laboratory test. The filtration chamber most commonly utilizes, but is not limited
to “rows,” one row containing 12 ft2 of media. The test cartridge to row ratio is 4
ft2 to 12 ft
2, or 1:3. Media thickness was 1:1. It is considered that the test ratio
does not strictly represent that a downscaled setup was used since filtration is not
governed by particle settling properties such as those of hydrodynamic separators
where scaling is a critical element for testing parameters.
The NJCAT-verified Aqua-FilterTM
field test used a full scale model AF-5.3.
For field tests:
Refer to attached NJCAT verification report dated November 2013 for the Aqua-FilterTM
Model AF-5.3 field test.
6
i. Provide the address, average annual rainfall and characterized rainfall
pattern, and the average annual number of storms for the field-test location:
Field test site address: Burnt Mills Shopping Center
10731 Columbia Pike
Silver Spring, MD 20901
A total of 21 TARP-qualifying storms and 15.83 inches of rainfall were sampled
over 26 months between March 2011 and May 2013. The required minimum
number of storm is 15 and at least 15 inches of rain are to be sampled. A TARP-
qualifying storm is ≥0.1 inch. Available information indicates that the area
receives approximately 42 inches of annual rainfall. Three storms exceeded 75%
of the design treatment capacity of 16.5 gpm/ft2, one of which exceeded 100% of
the design treatment capacity. An average of 80% storm flow volume was
sampled, TARP requires at least 60%.
According to the NRCS document 210-VI-TR-55, Second Edition, June 1986, the
field test site is located in the Type II rainfall distribution region. This same
rainfall distribution type covers all of Virginia except the extreme southeastern
coastal area. It is considered that the AF-5.3 rainfall conditions would be
consistent with rainfall patterns for the greatest majority of Virginia (~95%).
ii. Provide the total contributing drainage area for the test site, percent of
impervious area in the drainage area, and percentages of land uses within the
drainage area (acres):
The AF-5.3 field test drainage area is approximately 1.19 acres with an estimated
100% impervious area. An asphalt covered parking lot represents ± 85% of the
drainage area, roof runoff ± 15%. A precise determination of roof runoff
contribution could not be ascertained but probably does not exceed 20%.
iii. Describe pretreatment, bypass conditions, or other special circumstances at
the test site:
Aqua-FilterTM
system uses a treatment train approach that includes a pretreatment
hydrodynamic separator followed by a filtration chamber. Note that the
pretreatment device uses an Aqua-Swirl® AS-5 stormwater treatment system. That
unit also received NJCAT field test verification for over 80% TSS removal
efficiency on an annual basis for clay loam influent sediment. The AS-5
verification report is available at
http://www.njcat.org/verification-process/technology-verification-database.html.
7
The AF-5.3 is installed in an offline configuration using an upstream divergence
structure and a downstream convergence structure. It does not appear that bypass
conditions occurred during the testing period. It is known that the perlite media
can convey flow rates greater than the verified performance loading rate of 16.5
gpm/ft2. No special or adverse circumstances were encountered during the testing
program.
iv. Provide the number of storms monitored and describe the monitored storm
events (amount of precipitation, duration, etc.):
A total of 21 TARP-qualifying storms were sampled. Refer to Table 2 on page 15
of the NJCAT verification report for a summary of the sampling events. A total of
15.83 inches of rain was sampled. The TARP protocol requires at least 15 inches
of rain be sampled. Storm durations ranged from 2 hours 19 minutes up to 64
hours 8 minutes. Storm sizes ranged from 0.11 to 1.6 inches, averaging 0.75
inches. A TARP-qualifying storm is ≥ 0.1 inch.
v. Describe whether or not monitoring examined seasonal variation in MTD
performance:
The field test spanned 26 months that commenced in March 2011 and ended in
May 2013. It is considered that seasonal variations were effectively monitored
during the field testing program.
vi. If particle size distribution was determined for monitored runoff and/or
sediment collected by the MTD, provide this information:
Refer to pages 22-25 and Table 9 of the NJCAT verification report for a
discussion of particle size distribution (PSD) for the AF-5.3 field test. Serial
filtration was used to determine PSD and particles greater than 1,000 µm were
excluded from all analyses. The PSD distribution from three storms (as required
by TARP protocol) indicates that 100% of the particles are finer than 1,000 µm,
95.82% are finer than 500 µm, 87.41% are finer than 250 µm, 70.39% are finer
than 125 µm, 63.13% are finer than 63 µm and no particles are finer than 1.5 µm.
The AF-5.3 field test PSD is finer grained than the PSD specified by the NJDEP
January 2013 laboratory protocol for filtration MTDs.
8
9. MTD History:
How long has this specific model/design been on the market?
The Aqua-FilterTM
has been commercially available for 16 years, since 1998. The Aqua-
FilterTM
is a well established product within the stormwater community.
List no more than three locations where the assessed model size(s) has/have been
installed in Virginia. If applicable, provide permitting authority. If known, provide
latitude & longitude:
The Aqua-FilterTM
has been installed at hundreds of locations nationwide and
internationally. AquaShieldTM
can provide additional information on installation
locations on a confidential basis. Three example Virginia locations are listed below:
(1) Aqua-FilterTM
Model AF-3.2, River Oaks Subdivision, Dumfries
(2) Aqua-FilterTM
Model AF-10.12, River Oaks Subdivision, Dumfries
(3) Aqua-FilterTM
Model AF-3.2, New River Valley Shopping Center, Christiansburg
List no more than three locations where the assessed model size(s) has/have been
installed outside of Virginia. If applicable, provide permitting authority. If known,
provide latitude & longitude:
In addition to the AF-5.3 test site, three example installation locations near Virginia are
listed below. AquaShieldTM
can provide additional information about installation
locations on a confidential basis.
(1) Aqua-FilterTM
Filter Model AF-4.2, St. Marks Orthodox Church, 7124 River Road,
Bethesda, MD, Montgomery County Department of Permit Services
(2) Aqua-FilterTM
Model AF-5.3, Grandview Town Homes, 2602 Blue Ridge Avenue,
Wheaton, MD, Montgomery County Department of Permit Services
(3) Aqua-FilterTM
Model AF-4.6, Marten’s Volkswagen,5415 Butler Road, Bethesda,
MD, Montgomery County Department of Permit Services
10. Maintenance:
What is the generic inspection and maintenance plan/procedure? (attach necessary
documents):
See attached Aqua-FilterTM
Inspection & Maintenance Manual. We recommend at least
quarterly inspections during the first year of installation to determine site runoff
conditions and predict maintenance cycles. We also recommend at least annual
inspections and maintenance of both the hydrodynamic pretreatment chamber and the
filtration chamber. Inspections of both chambers are performed from the surface without
the need for entry. The single swirl chamber allows for easy and quick inspections for
9
floatables and accumulated sediment at the base of the chamber. The perlite filter media
turns from white to dark brown to black when the media is spent.
Maintenance events typically require a vacuum truck to remove captured materials from
both chambers. Confined space entry is needed for the filtration chamber to remove and
replace the filter containers. The vacuum truck suction arm can be used to assist with the
extraction of filter containers.
Is there a maintenance track record/history that can be documented?
X No, no track record.
Yes, track record exists; (provide maintenance track record, location, and sizing
of three to five MTDs installed in Virginia [preferred] or elsewhere):
AquaShieldTM
does not maintain a track record system for its systems, nor does it operate
its own fleet of maintenance equipment. Instead, AquaShieldTM
recommends that end
users/owners contract with independent local maintenance providers. We can assist with
that service at no cost upon request. AquaShieldTM
also has a nationwide service
agreement with a maintenance provider. We do not keep maintenance track records of
services provided by other independent contractors.
It is recognized in the industry that Montgomery County, Maryland administers and
operates a robust maintenance program for MTDs. AquaShieldTM
has a large number of
systems installed in that county, and to our knowledge the Aqua-FilterTM
system overall
meets the maintenance criteria that has been established by the county’s Department of
Permit Services.
Aqua-FilterTM
systems have been installed in a number of state transportation
departments that perform maintenance on a routine basis. To our knowledge, there have
been no instances of adverse system functionality or maintenance circumstances.
End users, owners, contractors, etc. can contact their local AquaShieldTM
representative
or our corporate office directly to order replacement filter media. It is not necessary for
AquaShieldTM
personnel or its representative to be present during inspections or
maintenance events.
Recognizing that maintenance is an integral function of the MTD, provide the
following: amount of runoff treated, the water quality of the runoff, and what is the
expected maintenance frequency for this MTD in Virginia, per year?
Aqua-FilterTM
systems are sized according to local stormwater regulations. There is no
limitation to the amount of runoff the Aqua-FilterTM
is capable of conveying provided
that maintenance is performed as required to ensure functionality. Annual maintenance
frequency is expected (and recommended) for Aqua-FilterTM
systems in Virginia as
supported through field testing. Site conditions will ultimately dictate maintenance
frequency.
10
Total life expectancy of MTD when properly operated in Virginia and, if relevant,
life expectancy of media:
The Aqua-FilterTM
system will have a life expectancy of 50 years or more. Media life
expectancy is typically one (1) year but is ultimately dependent on pollutant loading
conditions. Media life cycle is supported by the AF-5.3 field testing program.
For media or amendments functioning based on cation exchange or adsorption, how
long will the media last before breakthrough (indicator capacity is nearly reached)
occurs?
Laboratory testing indicates that the Aqua-FilterTM
filtration cartridge (4 ft2) of perlite
filter media can provide effective performance while capturing up to approximately 6.5
pounds of SIL-CO-SIL 106 sediment before breakthrough. Or, one row (12 ft2) of perlite
media would retain 19.5 pounds of SIL-CO-SIL 106 before breakthrough. See page 30 of
the NJCAT laboratory verification report Addendum 2007 for a discussion on Sediment
Retention Capacity.
For media or amendments functioning based on cation exchange or adsorption, how
has the longevity of the media or amendments been quantified prior to
breakthrough (attach necessary performance data or documents)?
Sediment retention capacity is described on page 30 of the NJCAT laboratory verification
report. Table 5 in the report shows the changing effluent TSS concentrations that
occurred during the fifth test performed overall, with a loading rate of 16.5 gpm/ft2 and
target influent TSS concentration of 175 mg/L.
Field testing did not allow for sediment retention capacity to be quantified, other than
recognizing decreasing TSS removal efficiency.
Is the maintenance procedure and/or are materials/components proprietary?
Yes, proprietary
X No, not proprietary
There are no proprietary maintenance procedures or materials used for the Aqua-FilterTM
system. The perlite filter media is a commodity and is publically available.
Maintenance complexity (check all that apply):
X Confined space training required for maintenance
All inspections can be performed from the surface. Entry to the filtration chamber is
needed to handle the removal and replacement of filter containers. No access is needed to
clean the single chamber of the pretreatment hydrodynamic separator.
11
X Liquid pumping and transportation
Specify method:
Water from pretreatment hydrodynamic separator can be pumped through the filtration
chamber for discharge thereby eliminating any off-site transportation. Any captured oil
can be vacuumed off, but it should be kept in mind that the Aqua-FilterTM
is not designed
as an equivalent to an oil-water separator. Any small amount of standing water near the
outlet pipe of the filtration chamber is typically not removed since it has already been
filtered and will be discharged with the next storm event.
X Solids removal and disposal
Specify method:
A vacuum truck is used to remove solids from the pretreatment hydrodynamic separator
after water is transferred through the filtration chamber. The vacuum truck’s suction arm
can also be used to lift filter containers to the surface. Spent media and solids can be
disposed following all applicable local guidelines.
Other noteworthy maintenance parameter (describe):
The pretreatment hydrodynamic separator utilizes a single swirl chamber for both
treatment and materials storage. There are no blind or limited access areas within the
structure that would prevent complete access for inspections and maintenance. All
inspections and maintenance events for this chamber can be performed from the surface.
An internal ingress/egress ladder is built into the downstream side wall of the filtration
chamber and is accessed through a manhole opening. The filtration chamber also includes
a manhole opening for every three rows of filter media to facilitate inspections as well as
the removal and replacement of filter containers. The manholes and ladder can also
facilitate any emergency actions.
11. Comments
Include any additional explanations or comments:
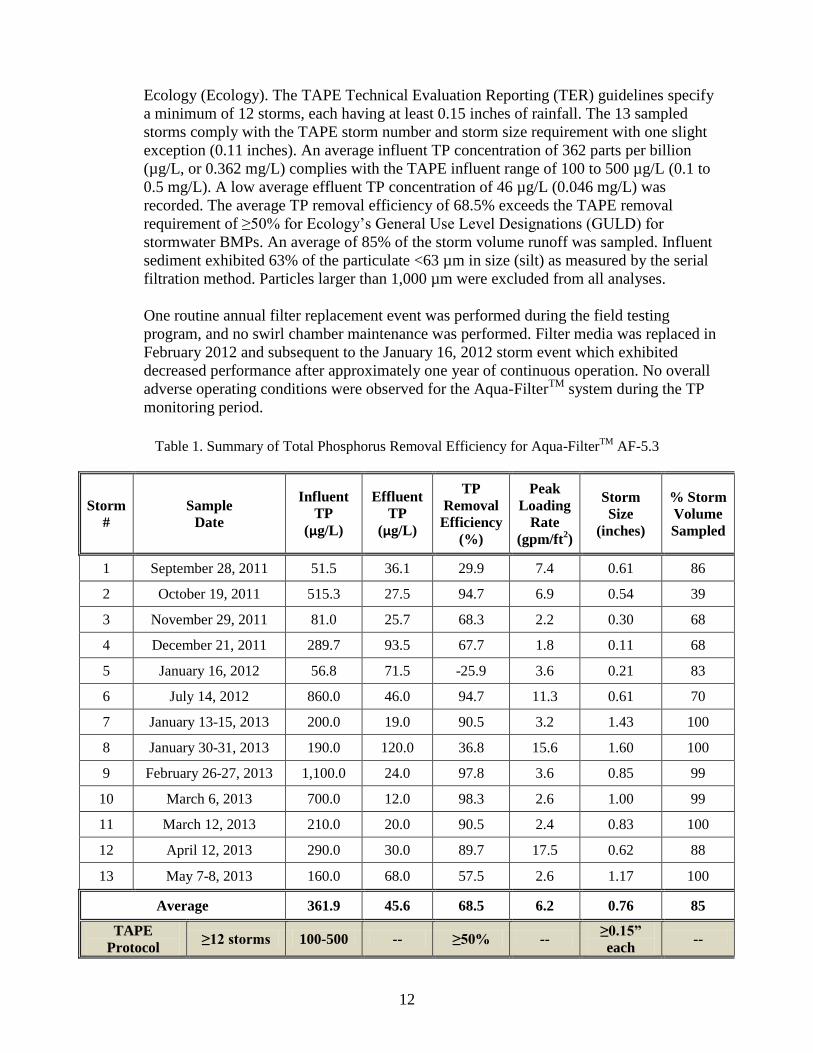
Independent field testing demonstrated that an offline Aqua-FilterTM
Model AF-5.3
achieved over 65% annual Total Phosphorus (TP) removal efficiency for a clay-loam
textured sediment influent at a filter surface area loading rate up to 17.5 gpm/ft2. Field
testing was performed between 2011 and 2013 at the Burnt Mills Shopping Center in
Silver Spring, Maryland while simultaneously documenting TSS removal efficiency for
the above-cited NJCAT verification. All field testing activities were performed following
TARP Tier II Protocol. Analytical results from 13 storms and approximately 10 inches of
rainfall demonstrated 68.5% annual TP removal efficiency at a perlite filter surface area
loading rate up to 17.5 gpm/ft2 (see Table 1 below).
Although the TARP field testing protocol does not include a specific provision for TP
testing, results are compared in Table 1 below to the Technology Assessment Protocol –
Ecology (TAPE) field test TP specifications of the Washington State Department of
12
Ecology (Ecology). The TAPE Technical Evaluation Reporting (TER) guidelines specify
a minimum of 12 storms, each having at least 0.15 inches of rainfall. The 13 sampled
storms comply with the TAPE storm number and storm size requirement with one slight
exception (0.11 inches). An average influent TP concentration of 362 parts per billion
(µg/L, or 0.362 mg/L) complies with the TAPE influent range of 100 to 500 µg/L (0.1 to
0.5 mg/L). A low average effluent TP concentration of 46 µg/L (0.046 mg/L) was
recorded. The average TP removal efficiency of 68.5% exceeds the TAPE removal
requirement of ≥50% for Ecology’s General Use Level Designations (GULD) for
stormwater BMPs. An average of 85% of the storm volume runoff was sampled. Influent
sediment exhibited 63% of the particulate <63 µm in size (silt) as measured by the serial
filtration method. Particles larger than 1,000 µm were excluded from all analyses.
One routine annual filter replacement event was performed during the field testing
program, and no swirl chamber maintenance was performed. Filter media was replaced in
February 2012 and subsequent to the January 16, 2012 storm event which exhibited
decreased performance after approximately one year of continuous operation. No overall
adverse operating conditions were observed for the Aqua-FilterTM
system during the TP
monitoring period.
Table 1. Summary of Total Phosphorus Removal Efficiency for Aqua-Filter
TM AF-5.3
Storm
#
Sample
Date
Influent
TP
(µg/L)
Effluent
TP
(µg/L)
TP
Removal
Efficiency
(%)
Peak
Loading
Rate
(gpm/ft2)
Storm
Size
(inches)
% Storm
Volume
Sampled
1 September 28, 2011 51.5 36.1 29.9 7.4 0.61 86
2 October 19, 2011 515.3 27.5 94.7 6.9 0.54 39
3 November 29, 2011 81.0 25.7 68.3 2.2 0.30 68
4 December 21, 2011 289.7 93.5 67.7 1.8 0.11 68
5 January 16, 2012 56.8 71.5 -25.9 3.6 0.21 83
6 July 14, 2012 860.0 46.0 94.7 11.3 0.61 70
7 January 13-15, 2013 200.0 19.0 90.5 3.2 1.43 100
8 January 30-31, 2013 190.0 120.0 36.8 15.6 1.60 100
9 February 26-27, 2013 1,100.0 24.0 97.8 3.6 0.85 99
10 March 6, 2013 700.0 12.0 98.3 2.6 1.00 99
11 March 12, 2013 210.0 20.0 90.5 2.4 0.83 100
12 April 12, 2013 290.0 30.0 89.7 17.5 0.62 88
13 May 7-8, 2013 160.0 68.0 57.5 2.6 1.17 100
Average 361.9 45.6 68.5 6.2 0.76 85
TAPE
Protocol ≥12 storms 100-500 -- ≥50% --
≥0.15”
each --
1
NJCAT TECHNOLOGY VERIFICATION
AQUA-FILTER™ MODEL AF-5.3 STORMWATER FILTRATION SYSTEM
AquaShieldTM, Inc.
November 2013
2
TABLE OF CONTENTS
1. Introduction 5 1.1 NJCAT Program 5 1.2 Interim Certification 6 1.3 Applicant Profile 6 1.4 Key Contacts 7
2. The Aqua-Filter™ Stormwater Filtration System 7
3. Technology System Evaluation: Project Plan 9
3.1 Introduction 9 3.2 Site and System Description 10 3.3 Sampling Design 10 3.4 Test Equipment and Apparatus 14 3.5 Test Methods and Procedures 14 3.6 Precipitation Measurements 15 3.7 Flow Measurements 17 3.8 Hydrographs 17 3.9 Stormwater Data Collection 18 3.10 Treatment System Maintenance 20
4. Technology System Performance 20
4.1 Test Results 20 4.2 Data Quality Assessment 25 4.3 Statistical Analysis 26 4.4 Performance Summary 27
5. Performance Verification 27
6. Net Environmental Benefit 28
7. References 28
Appendix A: Aqua-Filter™ Model AF-5.3 Specifications 30 Appendix B: Individual Storm Events 32
3
List of Tables
Table 1 Summary of Analytical Methods 15 Table 2 Summary of Storm Sampling Events 15 Table 3 Comparison of On-Site Rainfall to Off-Site Weather Station 16 Table 4 Aqua-Filter™ AF-5.3 Flow Volumes Comparison 17 Table 5 Aqua-Filter™ AF-5.3 Percentage of Storm Volumes Sampled 18 Table 6 Summary of Storm Characteristics 19 Table 7 Suspended Solids Event Sum of Loads Removal Efficiencies 20 Table 8 Summary of TSS and SSC Removal Efficiencies 21 Table 9 Influent PSD Summary 22 Table 10 Captured Sediment PSD in Swirl Chamber 25 Table 11 Storm Characteristics versus Performance 27
4
List of Figures
Figure 1 Aqua-Filter™ Mode of Operation 8
Figure 2 Aqua-Filter™ Filtration Chamber Operation 9 Figure 3 Aerial Site Plan of the Burnt Mills Shopping Center 11 Figure 4 Site Plan of the Burnt Mills Shopping Center 12 Figure 5 Sampling Locations for the Aqua-Filter™ 13
Figure 6 PSD Comparison of Field and NJDEP Laboratory Standard 23 Figure 7 Sediment Accumulation Profile in AS-5 Swirl Chamber 24 Figure 8 Swirl Chamber PSD Graph - Influent (side), Center, Effluent (side) 25
5
1. Introduction
1.1 New Jersey Corporation for Advance Technology (NJCAT) Program NJCAT is a not-for-profit corporation to promote in New Jersey the retention and growth of technology-based businesses in emerging fields such as environmental and energy technologies. NJCAT provides innovators with the regulatory, commercial, technological and financial assistance required to bring their ideas to market successfully. Specifically, NJCAT functions to:
• Advance policy strategies and regulatory mechanisms to promote technology commercialization;
• Identify, evaluate, and recommend specific technologies for which the regulatory and commercialization process should be facilitated;
• Facilitate funding and commercial relationships/alliances to bring new technologies to market and new business to the state; and
• Assist in the identification of markets and applications for commercialized technologies.
The technology verification program specifically encourages collaboration between vendors and users of technology. Through this program, teams of academic and business professionals are formed to implement a comprehensive evaluation of vendor specific performance claims. Thus, suppliers have the competitive edge of an independent third party confirmation of claims. Pursuant to N.J.S.A. 13:1D-134 et seq. (Energy and Environmental Technology Verification Program) the New Jersey Department of Environmental Protection (NJDEP) and NJCAT have established a Performance Partnership Agreement (PPA) whereby NJCAT performs the technology verification review and NJDEP certifies that the technology meets the regulatory intent and that there is a net beneficial environmental effect of the technology. In addition, NJDEP/NJCAT work in conjunction to develop expedited or more efficient timeframes for review and decision-making of permits or approvals associated with the verified/certified technology. The PPA also requires that: • The NJDEP shall enter into reciprocal environmental technology agreements concerning the
evaluation and verification protocols with the United States Environmental Protection Agency, other local required or national environmental agencies, entities or groups in other states and New Jersey for the purpose of encouraging and permitting the reciprocal acceptance of technology data and information concerning the evaluation and verification of energy and environmental technologies; and
• The NJDEP shall work closely with the State Treasurer to include in State bid specifications,
as deemed appropriate by the State Treasurer, any technology verified under the Energy and Environment Technology Verification Program.
6
1.2 Interim Certification
AquaShieldTM, Inc. (AquaShieldTM) manufactures a stormwater treatment system known as the Aqua-FilterTM Stormwater Filtration System. Treatment to stormwater runoff is accomplished via a treatment train approach using both hydrodynamic separation and filtration technologies. Based upon the results of independent laboratory studies, AquaShieldTM received NJCAT verification of claims for the Aqua-Swirl® Concentrator and Aqua-FilterTM Stormwater Treatment Systems in September 2005, revised in December 2005 and amended August 2007. A Conditional Interim Certification (CIC) was issued by NJDEP dated November 28, 2005 for the Aqua-Swirl® and February 14, 2006 for the Aqua-FilterTM Filtration Chamber. The Aqua-FilterTM has received Manufactured Treatment Device (MTD) Laboratory Test Certification from NJDEP effective September 1, 2011. This certification supersedes the CIC status.
A major condition of both the 2005 and 2006 CICs was the execution of a field evaluation in accordance with the Technology Acceptance Reciprocity Partnership (TARP) Tier II Protocol (TARP, 2003) and New Jersey Tier II Stormwater Test Requirements – Amendments to TARP Tier II Protocol (NJDEP, 2006). The TARP Tier II Protocol is designed to evaluate Total Suspended Solids (TSS) removal on an annual basis. The Aqua-Swirl® received NJCAT verification dated November 2012 for an Aqua-Swirl® Model AS-5 field test.
1.3 Applicant Profile
AquaShieldTM manufactures stormwater treatment systems used worldwide to protect sensitive receiving waters from the harmful effects of stormwater. The commitment of AquaShieldTM to provide quality environmental solutions began in the early 1980s with its founder solving surface water and groundwater contaminant issues at industrial and commercial facilities through his previously owned environmental consulting/contracting companies. The first product, a catch basin insert (now known as the Aqua-Guardian™), was introduced in 1997 for use at point source problem sites such as gas stations, fast food restaurants and high traffic parking lots. The AquaShieldTM stormwater filtration technology expanded into underground structures in 1999 with the installation of a "treatment train" structure utilizing pretreatment sediment removal incorporated with a filtration chamber to remove fine contaminants. This became the Aqua-FilterTM Stormwater Filtration System.
Early in 2000, AquaShieldTM formed its corporate office in Chattanooga, Tennessee and began its campaign as the vanguard for treatment of stormwater and industrial runoff. Recognition of the increasing compliance standards for waterborne pollutants set AquaShieldTM apart in a fast growing industry. AquaShieldTM received patents for treatment systems that integrated hydrodynamic swirl separation technology for pretreatment with high flow filtration technology in a single device. In 2001, the stand-alone AquaSwirl® hydrodynamic swirl concentrator was introduced to meet the increasing requests for primary pollutant removal of sediment and floatable debris and oils. Accordingly, AquaShieldTM offers three essential patented alternatives for treating stormwater and industrial runoff: the Aqua-Swirl® Stormwater Treatment System, the Aqua-FilterTM Stormwater Filtration System, and the Aqua-Guardian™ Catch Basin Insert. Other derivatives of these core products have been adapted for customers needing further enhanced water treatment. These products distinguish themselves from other systems with their high performance and lightweight construction material, providing unmatched flexibility and
7
adaptation to site-specific conditions. Each product arrives at the project job site completely assembled and ready for installation.
1.4 Key Contacts Dr. Richard S. Magee, P.E., BCEE Technical Director NJ Corporation for Advanced Technology Center for Environmental Systems Stevens Institute of Technology Castle Point on Hudson Hoboken, NJ 07030 201-216-8081 973-879-3056 mobile [email protected]
Mr. J. Kelly Williamson President AquaShieldTM, Inc. 2719 Kanasita Drive Chattanooga, Tennessee 37343 423-870-8888 [email protected]
Mr. Mark B. Miller, P.G. Research Scientist AquaShieldTM, Inc. 2719 Kanasita Drive Chattanooga, Tennessee 37343 423-870-8888 [email protected]
Mr. David J. Russell, P.E., BCEE, LSRP Senior Program Director AECOM 4 Neshaminy Interplex, Suite 300 Trevose, Pennsylvania 19053 267-784-7708 [email protected]
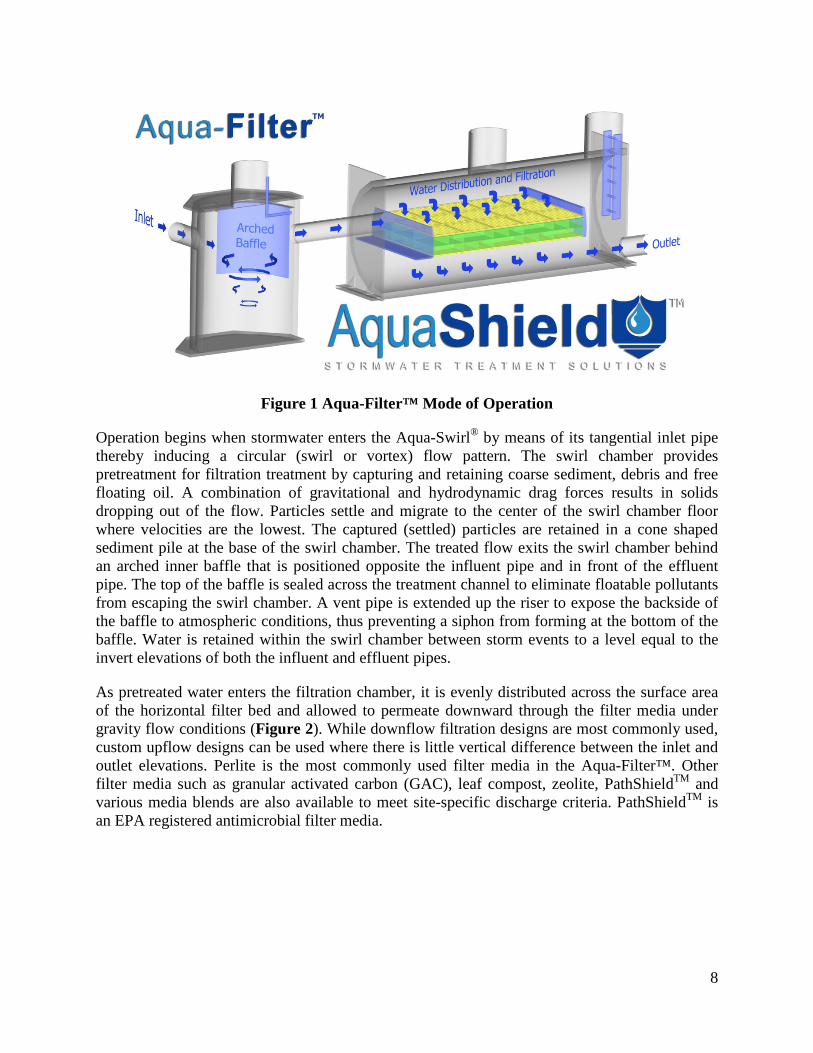
2. The Aqua-Filter™ Stormwater Filtration System The Aqua-Filter™ is designed for sites that require advanced treatment of runoff stormwater that may discharge into sensitive receiving waters. The Aqua-Filter™ uses a hydrodynamic separator and filtration for removal of sediment, debris and free-floating oil (Figure 1). Initial pretreatment of stormwater is not necessary when using the Aqua-Filter™. In fact, each Aqua-Filter™ system is custom engineered to utilize a unique treatment train sequence where both the coarse and fine pollutants are removed. The Aqua-Swirl® concentrator is designed to target the removal of Total Suspended Solids (TSS), debris and free-floating oil. The addition of the swirl concentrator allows for larger debris to settle before filtration and increases filtration effectiveness. The decreasing flow rate in the swirl concentrator causes suspended material to fall out of suspension and settle to the bottom of the chamber. An inner arched baffle minimizes the potential for oil and debris to be discharged. The filtration chamber is designed to refine and enhance the stormwater quality prior to discharge into sensitive receiving waters. As the pre-treated water enters the filtration chamber, it is evenly distributed across the filter bed and allowed to permeate through the filter media. The filter media are contained in individual containers, which are layered in a pattern to avoid short-circuiting. The peak filtration flow rate is based on the calculated water quality treatment requirements desired for the site.
8
Figure 1 Aqua-Filter™ Mode of Operation
Operation begins when stormwater enters the Aqua-Swirl® by means of its tangential inlet pipe thereby inducing a circular (swirl or vortex) flow pattern. The swirl chamber provides pretreatment for filtration treatment by capturing and retaining coarse sediment, debris and free floating oil. A combination of gravitational and hydrodynamic drag forces results in solids dropping out of the flow. Particles settle and migrate to the center of the swirl chamber floor where velocities are the lowest. The captured (settled) particles are retained in a cone shaped sediment pile at the base of the swirl chamber. The treated flow exits the swirl chamber behind an arched inner baffle that is positioned opposite the influent pipe and in front of the effluent pipe. The top of the baffle is sealed across the treatment channel to eliminate floatable pollutants from escaping the swirl chamber. A vent pipe is extended up the riser to expose the backside of the baffle to atmospheric conditions, thus preventing a siphon from forming at the bottom of the baffle. Water is retained within the swirl chamber between storm events to a level equal to the invert elevations of both the influent and effluent pipes.
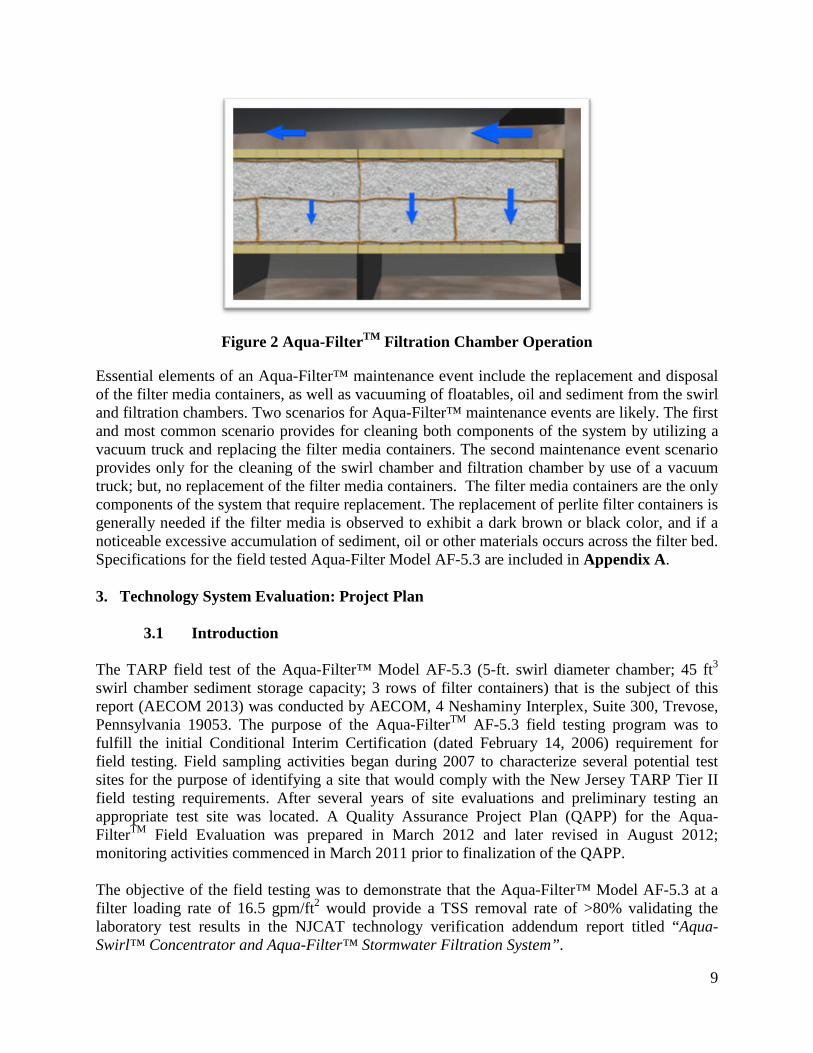
As pretreated water enters the filtration chamber, it is evenly distributed across the surface area of the horizontal filter bed and allowed to permeate downward through the filter media under gravity flow conditions (Figure 2). While downflow filtration designs are most commonly used, custom upflow designs can be used where there is little vertical difference between the inlet and outlet elevations. Perlite is the most commonly used filter media in the Aqua-Filter™. Other filter media such as granular activated carbon (GAC), leaf compost, zeolite, PathShieldTM and various media blends are also available to meet site-specific discharge criteria. PathShieldTM is an EPA registered antimicrobial filter media.
9
Figure 2 Aqua-FilterTM Filtration Chamber Operation
Essential elements of an Aqua-Filter™ maintenance event include the replacement and disposal of the filter media containers, as well as vacuuming of floatables, oil and sediment from the swirl and filtration chambers. Two scenarios for Aqua-Filter™ maintenance events are likely. The first and most common scenario provides for cleaning both components of the system by utilizing a vacuum truck and replacing the filter media containers. The second maintenance event scenario provides only for the cleaning of the swirl chamber and filtration chamber by use of a vacuum truck; but, no replacement of the filter media containers. The filter media containers are the only components of the system that require replacement. The replacement of perlite filter containers is generally needed if the filter media is observed to exhibit a dark brown or black color, and if a noticeable excessive accumulation of sediment, oil or other materials occurs across the filter bed. Specifications for the field tested Aqua-Filter Model AF-5.3 are included in Appendix A. 3. Technology System Evaluation: Project Plan
3.1 Introduction The TARP field test of the Aqua-Filter™ Model AF-5.3 (5-ft. swirl diameter chamber; 45 ft3 swirl chamber sediment storage capacity; 3 rows of filter containers) that is the subject of this report (AECOM 2013) was conducted by AECOM, 4 Neshaminy Interplex, Suite 300, Trevose, Pennsylvania 19053. The purpose of the Aqua-FilterTM AF-5.3 field testing program was to fulfill the initial Conditional Interim Certification (dated February 14, 2006) requirement for field testing. Field sampling activities began during 2007 to characterize several potential test sites for the purpose of identifying a site that would comply with the New Jersey TARP Tier II field testing requirements. After several years of site evaluations and preliminary testing an appropriate test site was located. A Quality Assurance Project Plan (QAPP) for the Aqua-FilterTM Field Evaluation was prepared in March 2012 and later revised in August 2012; monitoring activities commenced in March 2011 prior to finalization of the QAPP. The objective of the field testing was to demonstrate that the Aqua-Filter™ Model AF-5.3 at a filter loading rate of 16.5 gpm/ft2 would provide a TSS removal rate of >80% validating the laboratory test results in the NJCAT technology verification addendum report titled “Aqua-Swirl™ Concentrator and Aqua-Filter™ Stormwater Filtration System”.
10
3.2 Site and System Description
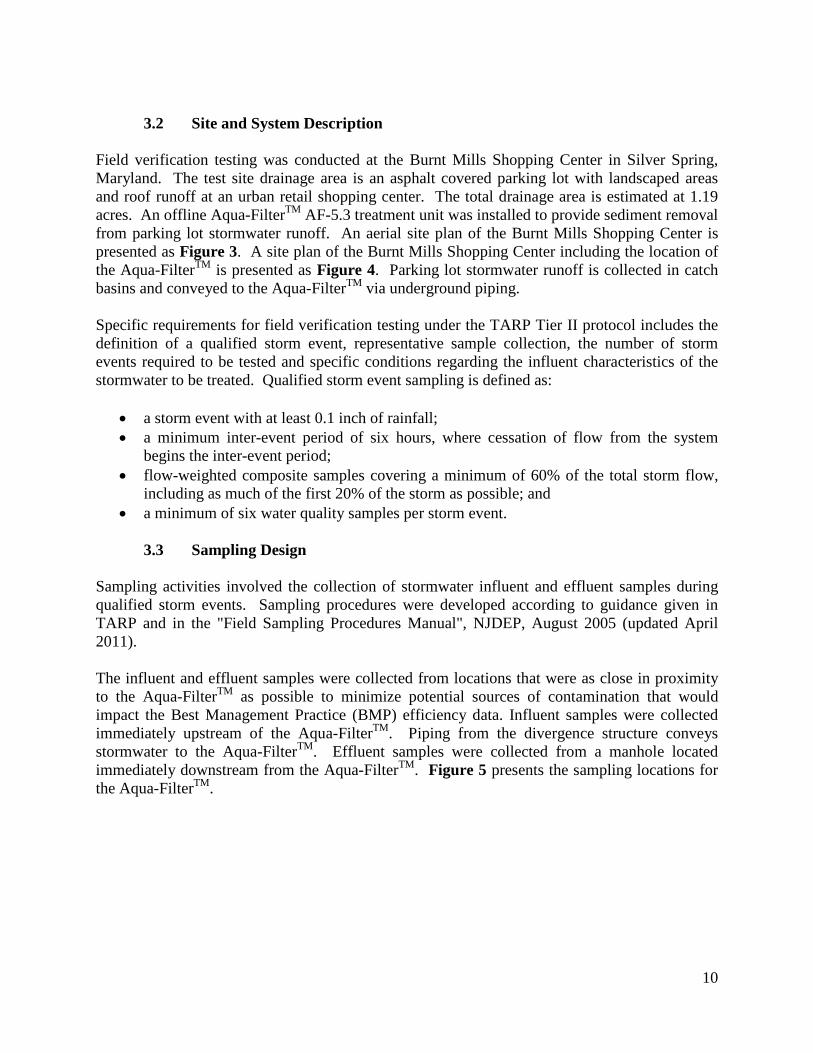
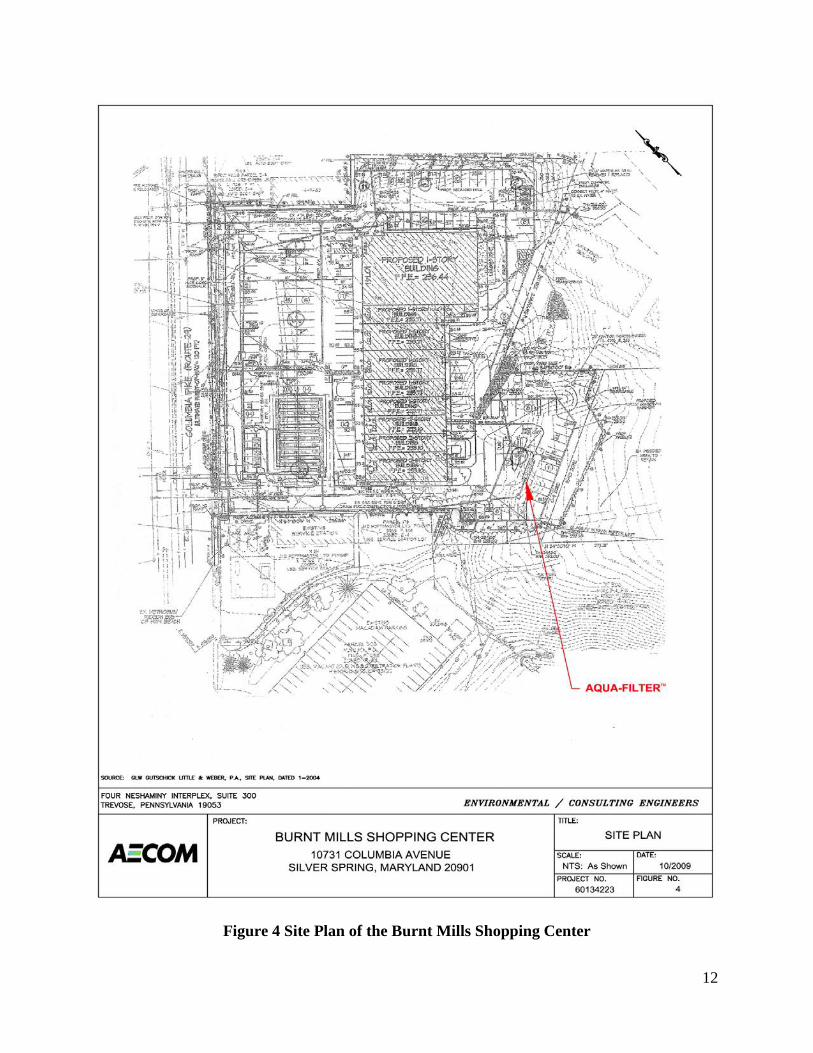
Field verification testing was conducted at the Burnt Mills Shopping Center in Silver Spring, Maryland. The test site drainage area is an asphalt covered parking lot with landscaped areas and roof runoff at an urban retail shopping center. The total drainage area is estimated at 1.19 acres. An offline Aqua-FilterTM AF-5.3 treatment unit was installed to provide sediment removal from parking lot stormwater runoff. An aerial site plan of the Burnt Mills Shopping Center is presented as Figure 3. A site plan of the Burnt Mills Shopping Center including the location of the Aqua-FilterTM is presented as Figure 4. Parking lot stormwater runoff is collected in catch basins and conveyed to the Aqua-FilterTM via underground piping. Specific requirements for field verification testing under the TARP Tier II protocol includes the definition of a qualified storm event, representative sample collection, the number of storm events required to be tested and specific conditions regarding the influent characteristics of the stormwater to be treated. Qualified storm event sampling is defined as:
• a storm event with at least 0.1 inch of rainfall; • a minimum inter-event period of six hours, where cessation of flow from the system
begins the inter-event period; • flow-weighted composite samples covering a minimum of 60% of the total storm flow,
including as much of the first 20% of the storm as possible; and • a minimum of six water quality samples per storm event.
3.3 Sampling Design
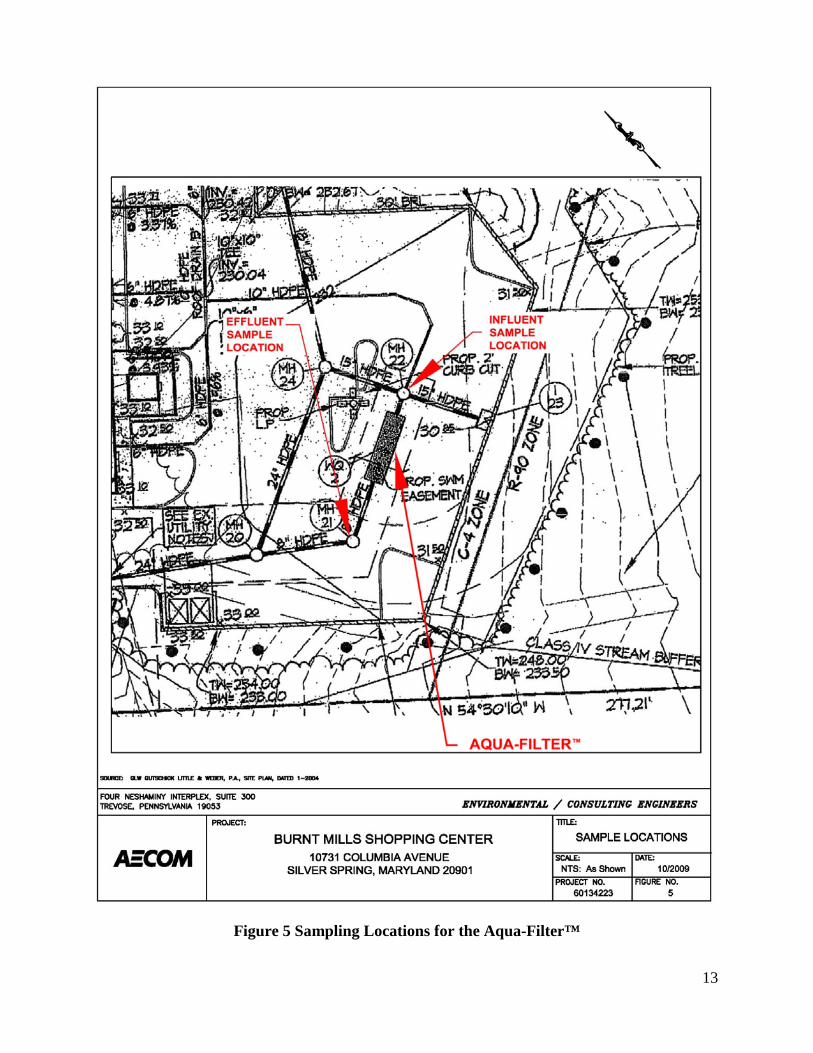
Sampling activities involved the collection of stormwater influent and effluent samples during qualified storm events. Sampling procedures were developed according to guidance given in TARP and in the "Field Sampling Procedures Manual", NJDEP, August 2005 (updated April 2011). The influent and effluent samples were collected from locations that were as close in proximity to the Aqua-FilterTM as possible to minimize potential sources of contamination that would impact the Best Management Practice (BMP) efficiency data. Influent samples were collected immediately upstream of the Aqua-FilterTM. Piping from the divergence structure conveys stormwater to the Aqua-FilterTM. Effluent samples were collected from a manhole located immediately downstream from the Aqua-FilterTM. Figure 5 presents the sampling locations for the Aqua-FilterTM.
11
Figure 3 Aerial Site Plan of the Burnt Mills Shopping Center
12
Figure 4 Site Plan of the Burnt Mills Shopping Center
13
Figure 5 Sampling Locations for the Aqua-Filter™
14
3.4 Test Equipment and Apparatus The ISCO Portable Sampler Model 6712 was used as the programmable automatic sampler for field verification testing. This sampler can be programmed to collect specific sample volumes over specified time periods and can be used in conjunction with an area velocity meter to allow flow proportional composite sampling. An ISCO 750 Area Velocity Meter was used to record flow during a storm event. The ISCO 750 uses Doppler technology to measure average velocity in the flow stream. A pressure transducer measures liquid depth to determine flow area. The ISCO 6712, when interfaced with the ISCO 750, calculates flow rate (cubic feet per second) by multiplying the area (square feet) of the flow stream by its average velocity (feet per second). A liquid level actuator was used to activate the ISCO 750 Area Velocity Meter and ISCO sampler once flow was present ensuring that the first flush of each storm event was sampled. Initially, the TARP requirement that a minimum of six samples be collected from each storm was interpreted as a minimum of six individual composite samples of the influent and effluent were required to be submitted for laboratory analysis. The six individual sample analytical results were then averaged to establish the overall influent and effluent composite analytical result. For these initial events a total of 24 1-liter aliquots were collected during each sampling event providing the volume required in order to prepare six individual composite samples for laboratory analysis. The collection of six individual samples from 24 aliquots provided additional data concerning the fluctuation of influent loading and removal efficiency over the storm period and well exceeded the TARP guidelines of a minimum of six and a goal of 10 sample aliquots collected during each storm. Following consultation with NJCAT in March 2012, the sampling procedure for subsequent sampling events was modified to result in one overall influent and effluent flow proportional composite sample being submitted to the laboratory for analysis. A minimum of six influent and effluent 1-liter flow proportional samples were collected for each storm event with the goal of at least 10 1-liter flow proportional samples being collected and combined to form one influent and effluent composite sample for laboratory analysis for each storm event. Collected samples were transferred in the field through a cone sample splitter (Dekaport Cone Sample Splitter) fitted with a 4-inch 1,000 micron (μm) sieve to remove particles greater than 1,000 µm and into laboratory prepared sample bottles for each of the analytes. The sample bottles were placed on ice and transported immediately to the laboratory for analysis to ensure analytical methodology holding times were met.
3.5 Test Methods and Procedures Table 1 presents the analytical methods used for the field testing program. Suspended sediment concentrations were determined by both the Total Suspended Solids (TSS) and Suspended Sediment Concentration (SSC) methods. Total Volatile Suspended Solids (TVSS) analysis was also performed to assess the organic content of the suspended sediment. The TSS, SSC and TVSS results are reported as mg/L by the laboratory. Particle size distribution (PSD) was determined by serial filtration techniques using sieves sized at 1,000, 500, 250, 125, 63 µm and filter paper at 1.5 µm.
15
Table 1 Summary of Analytical Methods
Parameter Matrix Method Reference Total Suspended Solids
Suspended-Sediment Concentration Total Volatile Suspended Solids
Water (Influent, Effluent)
SM 2540D ASTM D3977
EPA Method 160.4
Particle Size Distribution Water (Influent, Effluent) Serial Filtration Method
All analyses of samples were performed by a NELAC and New Jersey certified laboratory, Test America, Inc. of Burlington, Vermont.
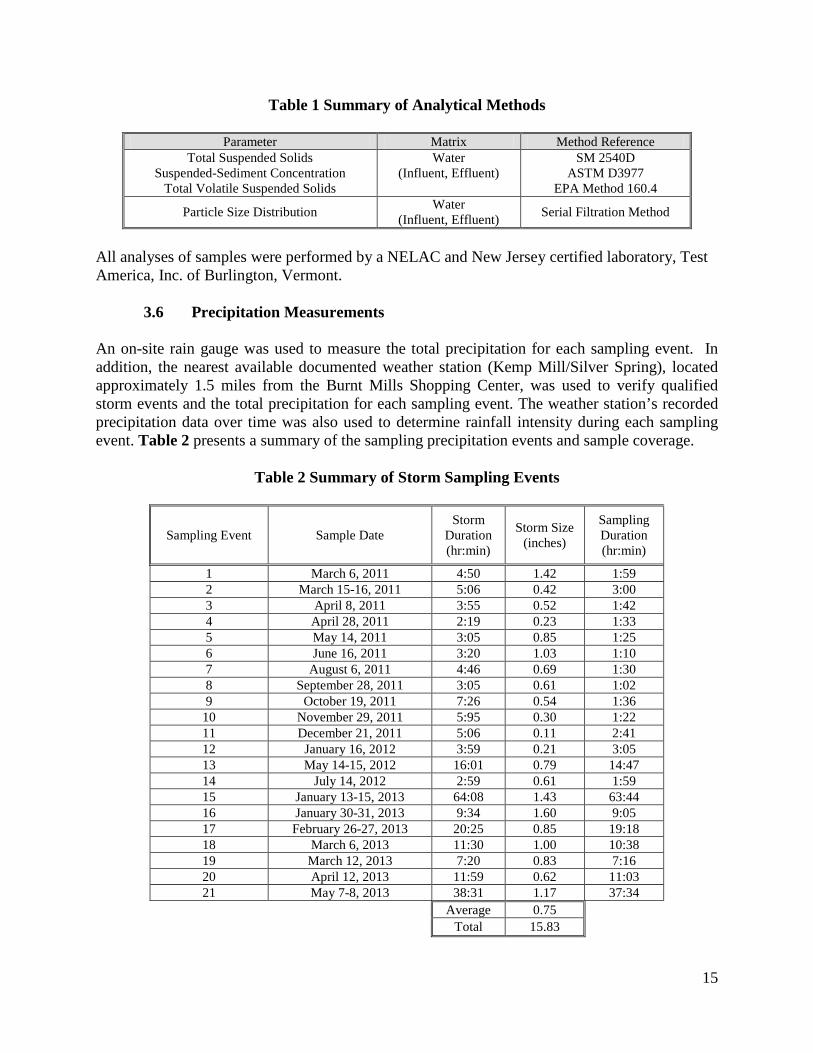
3.6 Precipitation Measurements An on-site rain gauge was used to measure the total precipitation for each sampling event. In addition, the nearest available documented weather station (Kemp Mill/Silver Spring), located approximately 1.5 miles from the Burnt Mills Shopping Center, was used to verify qualified storm events and the total precipitation for each sampling event. The weather station’s recorded precipitation data over time was also used to determine rainfall intensity during each sampling event. Table 2 presents a summary of the sampling precipitation events and sample coverage.
Table 2 Summary of Storm Sampling Events
Sampling Event Sample Date Storm
Duration (hr:min)
Storm Size (inches)
Sampling Duration (hr:min)
1 March 6, 2011 4:50 1.42 1:59 2 March 15-16, 2011 5:06 0.42 3:00 3 April 8, 2011 3:55 0.52 1:42 4 April 28, 2011 2:19 0.23 1:33 5 May 14, 2011 3:05 0.85 1:25 6 June 16, 2011 3:20 1.03 1:10 7 August 6, 2011 4:46 0.69 1:30 8 September 28, 2011 3:05 0.61 1:02 9 October 19, 2011 7:26 0.54 1:36
10 November 29, 2011 5:95 0.30 1:22 11 December 21, 2011 5:06 0.11 2:41 12 January 16, 2012 3:59 0.21 3:05 13 May 14-15, 2012 16:01 0.79 14:47 14 July 14, 2012 2:59 0.61 1:59 15 January 13-15, 2013 64:08 1.43 63:44 16 January 30-31, 2013 9:34 1.60 9:05 17 February 26-27, 2013 20:25 0.85 19:18 18 March 6, 2013 11:30 1.00 10:38 19 March 12, 2013 7:20 0.83 7:16 20 April 12, 2013 11:59 0.62 11:03 21 May 7-8, 2013 38:31 1.17 37:34
Average 0.75 Total 15.83
16
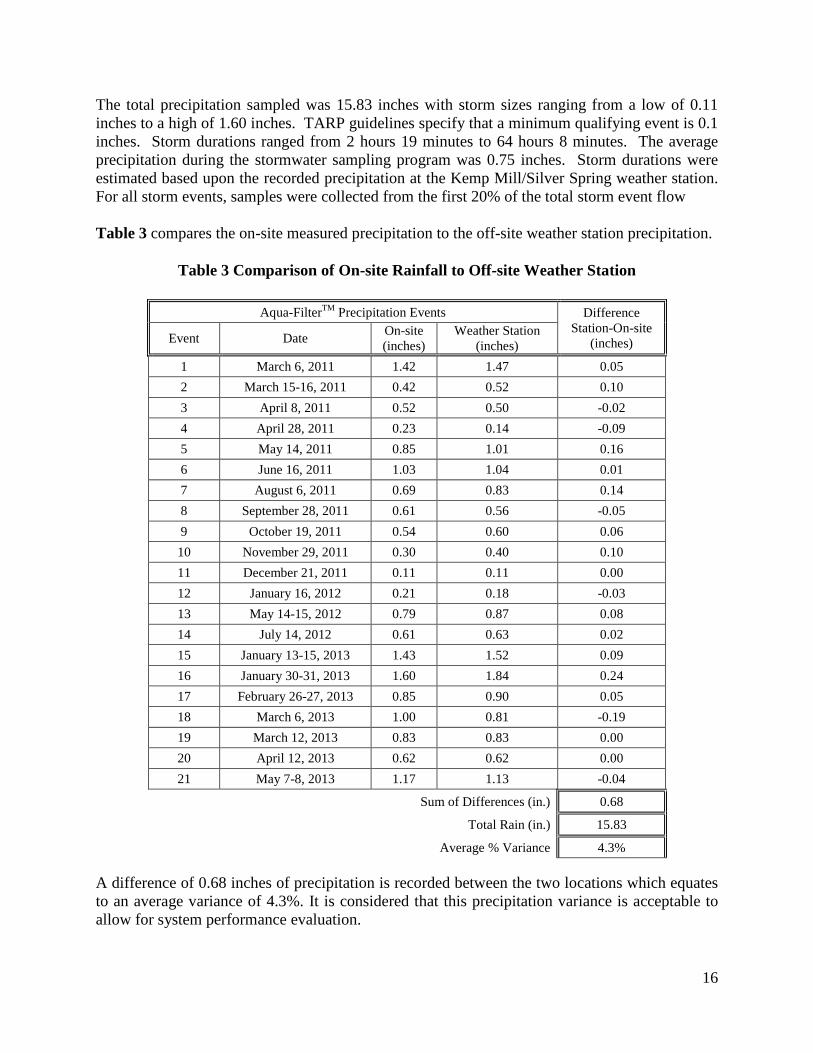
The total precipitation sampled was 15.83 inches with storm sizes ranging from a low of 0.11 inches to a high of 1.60 inches. TARP guidelines specify that a minimum qualifying event is 0.1 inches. Storm durations ranged from 2 hours 19 minutes to 64 hours 8 minutes. The average precipitation during the stormwater sampling program was 0.75 inches. Storm durations were estimated based upon the recorded precipitation at the Kemp Mill/Silver Spring weather station. For all storm events, samples were collected from the first 20% of the total storm event flow Table 3 compares the on-site measured precipitation to the off-site weather station precipitation.
Table 3 Comparison of On-site Rainfall to Off-site Weather Station
Aqua-FilterTM Precipitation Events Difference Station-On-site
(inches) Event Date On-site (inches)
Weather Station (inches)
1 March 6, 2011 1.42 1.47 0.05 2 March 15-16, 2011 0.42 0.52 0.10 3 April 8, 2011 0.52 0.50 -0.02 4 April 28, 2011 0.23 0.14 -0.09 5 May 14, 2011 0.85 1.01 0.16 6 June 16, 2011 1.03 1.04 0.01 7 August 6, 2011 0.69 0.83 0.14 8 September 28, 2011 0.61 0.56 -0.05 9 October 19, 2011 0.54 0.60 0.06 10 November 29, 2011 0.30 0.40 0.10 11 December 21, 2011 0.11 0.11 0.00 12 January 16, 2012 0.21 0.18 -0.03 13 May 14-15, 2012 0.79 0.87 0.08 14 July 14, 2012 0.61 0.63 0.02 15 January 13-15, 2013 1.43 1.52 0.09 16 January 30-31, 2013 1.60 1.84 0.24 17 February 26-27, 2013 0.85 0.90 0.05 18 March 6, 2013 1.00 0.81 -0.19 19 March 12, 2013 0.83 0.83 0.00 20 April 12, 2013 0.62 0.62 0.00 21 May 7-8, 2013 1.17 1.13 -0.04
Sum of Differences (in.) 0.68
Total Rain (in.) 15.83
Average % Variance 4.3% A difference of 0.68 inches of precipitation is recorded between the two locations which equates to an average variance of 4.3%. It is considered that this precipitation variance is acceptable to allow for system performance evaluation.
17
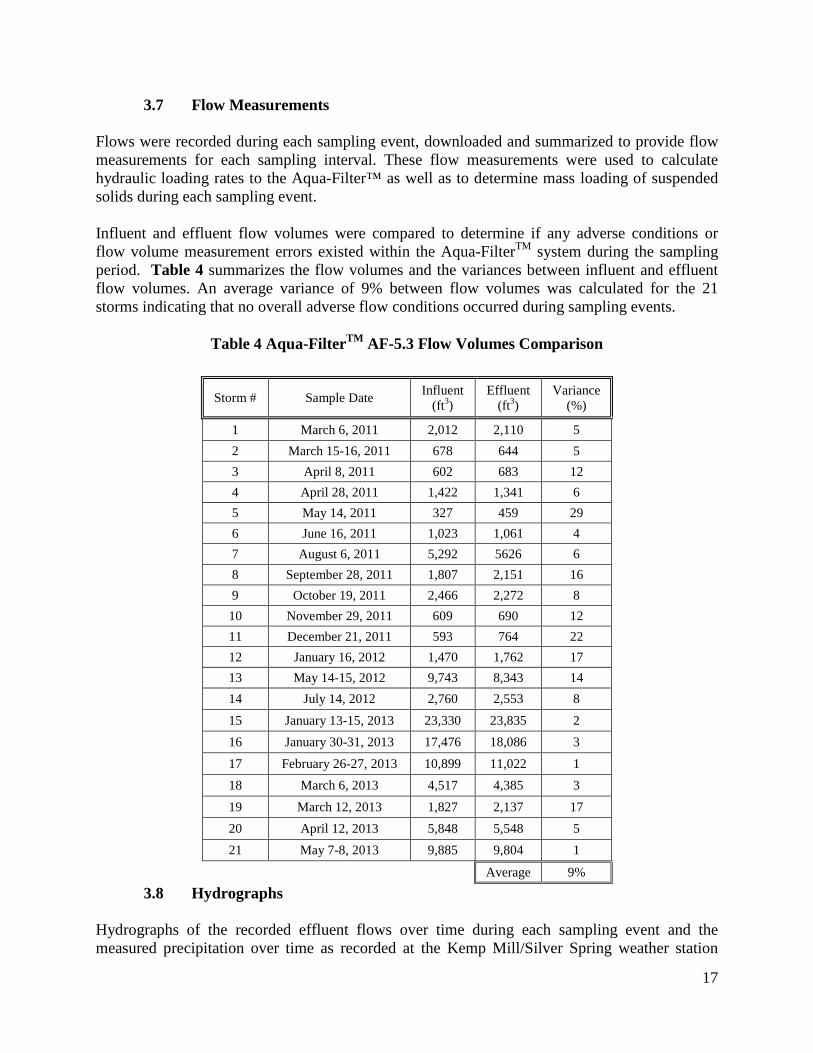
3.7 Flow Measurements Flows were recorded during each sampling event, downloaded and summarized to provide flow measurements for each sampling interval. These flow measurements were used to calculate hydraulic loading rates to the Aqua-Filter™ as well as to determine mass loading of suspended solids during each sampling event. Influent and effluent flow volumes were compared to determine if any adverse conditions or flow volume measurement errors existed within the Aqua-FilterTM system during the sampling period. Table 4 summarizes the flow volumes and the variances between influent and effluent flow volumes. An average variance of 9% between flow volumes was calculated for the 21 storms indicating that no overall adverse flow conditions occurred during sampling events.
Table 4 Aqua-FilterTM AF-5.3 Flow Volumes Comparison
Storm # Sample Date Influent (ft3)
Effluent (ft3)
Variance (%)
1 March 6, 2011 2,012 2,110 5 2 March 15-16, 2011 678 644 5 3 April 8, 2011 602 683 12 4 April 28, 2011 1,422 1,341 6 5 May 14, 2011 327 459 29 6 June 16, 2011 1,023 1,061 4 7 August 6, 2011 5,292 5626 6 8 September 28, 2011 1,807 2,151 16 9 October 19, 2011 2,466 2,272 8 10 November 29, 2011 609 690 12 11 December 21, 2011 593 764 22 12 January 16, 2012 1,470 1,762 17 13 May 14-15, 2012 9,743 8,343 14 14 July 14, 2012 2,760 2,553 8 15 January 13-15, 2013 23,330 23,835 2 16 January 30-31, 2013 17,476 18,086 3 17 February 26-27, 2013 10,899 11,022 1 18 March 6, 2013 4,517 4,385 3 19 March 12, 2013 1,827 2,137 17 20 April 12, 2013 5,848 5,548 5 21 May 7-8, 2013 9,885 9,804 1
Average 9%
3.8 Hydrographs Hydrographs of the recorded effluent flows over time during each sampling event and the measured precipitation over time as recorded at the Kemp Mill/Silver Spring weather station
18
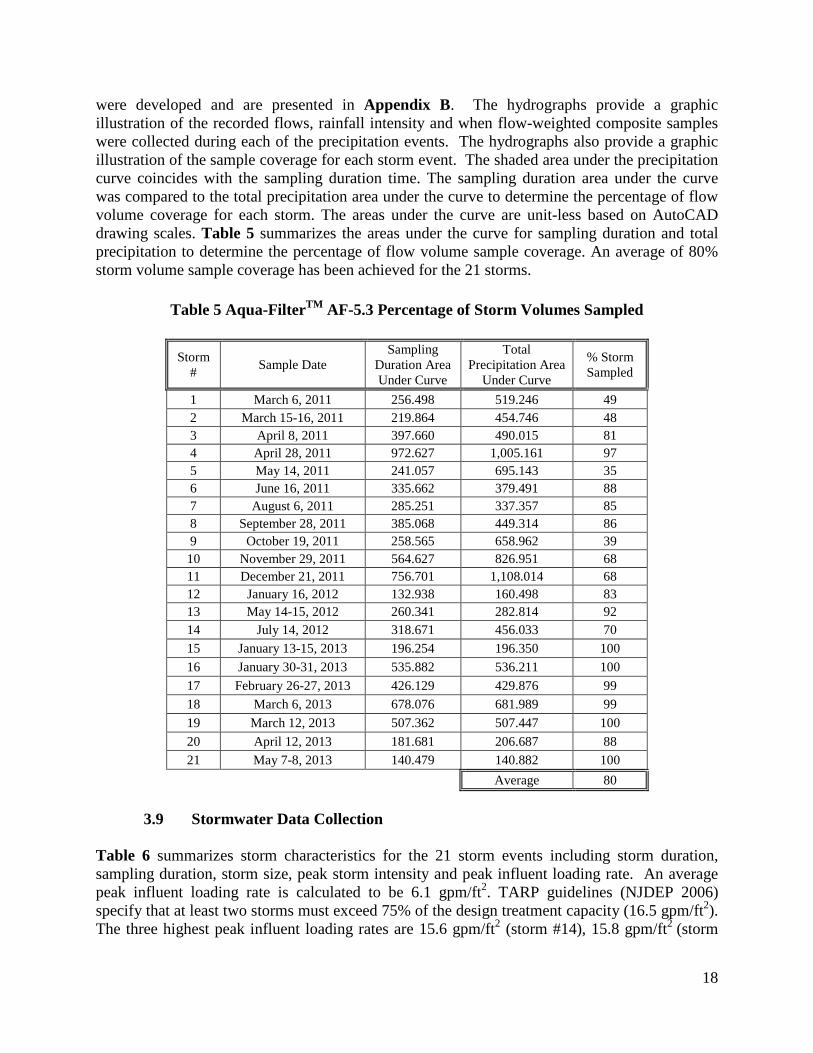
were developed and are presented in Appendix B. The hydrographs provide a graphic illustration of the recorded flows, rainfall intensity and when flow-weighted composite samples were collected during each of the precipitation events. The hydrographs also provide a graphic illustration of the sample coverage for each storm event. The shaded area under the precipitation curve coincides with the sampling duration time. The sampling duration area under the curve was compared to the total precipitation area under the curve to determine the percentage of flow volume coverage for each storm. The areas under the curve are unit-less based on AutoCAD drawing scales. Table 5 summarizes the areas under the curve for sampling duration and total precipitation to determine the percentage of flow volume sample coverage. An average of 80% storm volume sample coverage has been achieved for the 21 storms.
Table 5 Aqua-FilterTM AF-5.3 Percentage of Storm Volumes Sampled
Storm # Sample Date
Sampling Duration Area Under Curve
Total Precipitation Area
Under Curve
% Storm Sampled
1 March 6, 2011 256.498 519.246 49 2 March 15-16, 2011 219.864 454.746 48 3 April 8, 2011 397.660 490.015 81 4 April 28, 2011 972.627 1,005.161 97 5 May 14, 2011 241.057 695.143 35 6 June 16, 2011 335.662 379.491 88 7 August 6, 2011 285.251 337.357 85 8 September 28, 2011 385.068 449.314 86 9 October 19, 2011 258.565 658.962 39 10 November 29, 2011 564.627 826.951 68 11 December 21, 2011 756.701 1,108.014 68 12 January 16, 2012 132.938 160.498 83 13 May 14-15, 2012 260.341 282.814 92 14 July 14, 2012 318.671 456.033 70 15 January 13-15, 2013 196.254 196.350 100 16 January 30-31, 2013 535.882 536.211 100 17 February 26-27, 2013 426.129 429.876 99 18 March 6, 2013 678.076 681.989 99 19 March 12, 2013 507.362 507.447 100 20 April 12, 2013 181.681 206.687 88 21 May 7-8, 2013 140.479 140.882 100
Average 80
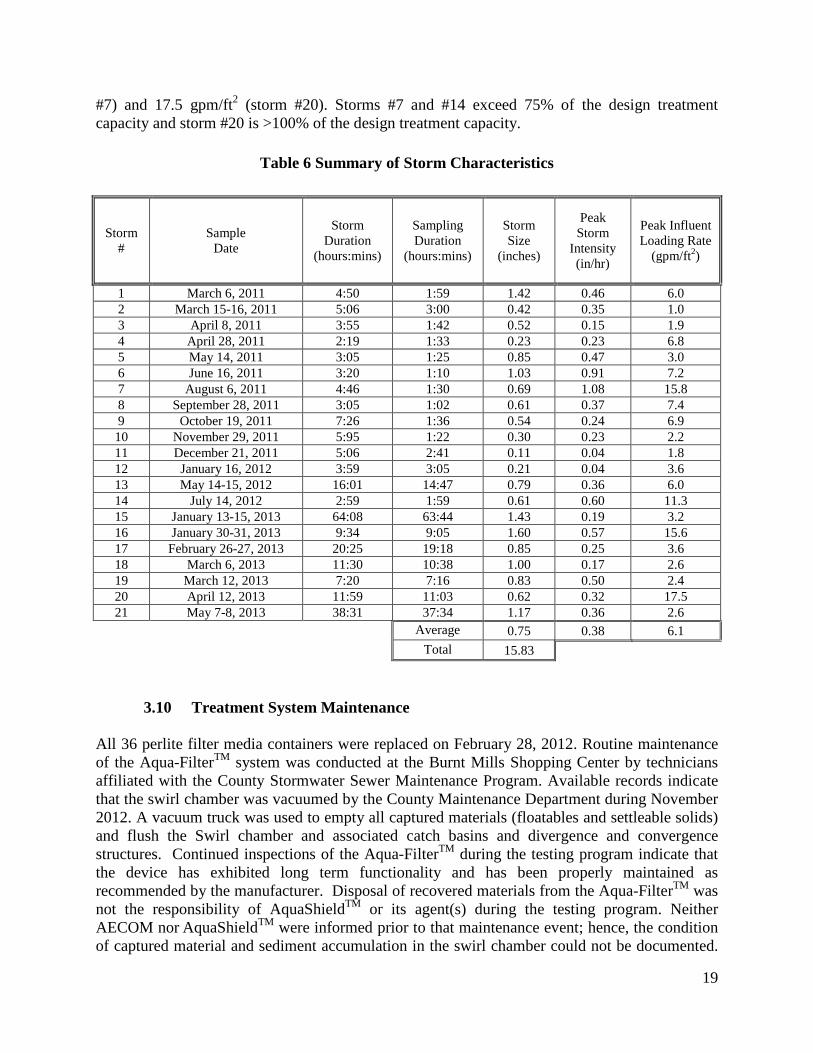
3.9 Stormwater Data Collection Table 6 summarizes storm characteristics for the 21 storm events including storm duration, sampling duration, storm size, peak storm intensity and peak influent loading rate. An average peak influent loading rate is calculated to be 6.1 gpm/ft2. TARP guidelines (NJDEP 2006) specify that at least two storms must exceed 75% of the design treatment capacity (16.5 gpm/ft2). The three highest peak influent loading rates are 15.6 gpm/ft2 (storm #14), 15.8 gpm/ft2 (storm
19
#7) and 17.5 gpm/ft2 (storm #20). Storms #7 and #14 exceed 75% of the design treatment capacity and storm #20 is >100% of the design treatment capacity.
Table 6 Summary of Storm Characteristics
Storm #
Sample Date
Storm Duration
(hours:mins)
Sampling Duration
(hours:mins)
Storm Size
(inches)
Peak Storm
Intensity (in/hr)
Peak Influent Loading Rate
(gpm/ft2)
1 March 6, 2011 4:50 1:59 1.42 0.46 6.0 2 March 15-16, 2011 5:06 3:00 0.42 0.35 1.0 3 April 8, 2011 3:55 1:42 0.52 0.15 1.9 4 April 28, 2011 2:19 1:33 0.23 0.23 6.8 5 May 14, 2011 3:05 1:25 0.85 0.47 3.0 6 June 16, 2011 3:20 1:10 1.03 0.91 7.2 7 August 6, 2011 4:46 1:30 0.69 1.08 15.8 8 September 28, 2011 3:05 1:02 0.61 0.37 7.4 9 October 19, 2011 7:26 1:36 0.54 0.24 6.9 10 November 29, 2011 5:95 1:22 0.30 0.23 2.2 11 December 21, 2011 5:06 2:41 0.11 0.04 1.8 12 January 16, 2012 3:59 3:05 0.21 0.04 3.6 13 May 14-15, 2012 16:01 14:47 0.79 0.36 6.0 14 July 14, 2012 2:59 1:59 0.61 0.60 11.3 15 January 13-15, 2013 64:08 63:44 1.43 0.19 3.2 16 January 30-31, 2013 9:34 9:05 1.60 0.57 15.6 17 February 26-27, 2013 20:25 19:18 0.85 0.25 3.6 18 March 6, 2013 11:30 10:38 1.00 0.17 2.6 19 March 12, 2013 7:20 7:16 0.83 0.50 2.4 20 April 12, 2013 11:59 11:03 0.62 0.32 17.5 21 May 7-8, 2013 38:31 37:34 1.17 0.36 2.6 Average 0.75 0.38 6.1
Total 15.83
3.10 Treatment System Maintenance All 36 perlite filter media containers were replaced on February 28, 2012. Routine maintenance of the Aqua-FilterTM system was conducted at the Burnt Mills Shopping Center by technicians affiliated with the County Stormwater Sewer Maintenance Program. Available records indicate that the swirl chamber was vacuumed by the County Maintenance Department during November 2012. A vacuum truck was used to empty all captured materials (floatables and settleable solids) and flush the Swirl chamber and associated catch basins and divergence and convergence structures. Continued inspections of the Aqua-FilterTM during the testing program indicate that the device has exhibited long term functionality and has been properly maintained as recommended by the manufacturer. Disposal of recovered materials from the Aqua-FilterTM was not the responsibility of AquaShieldTM or its agent(s) during the testing program. Neither AECOM nor
AquaShieldTM were informed prior to that maintenance event; hence, the condition
of captured material and sediment accumulation in the swirl chamber could not be documented.
20
The Aqua-Filter™ Inspection and Maintenance Manual (March 2013) is available for download on the AquaShield™ technical documents website page at: http://www.aquashieldinc.com/downloads.html 4. Technology System Performance
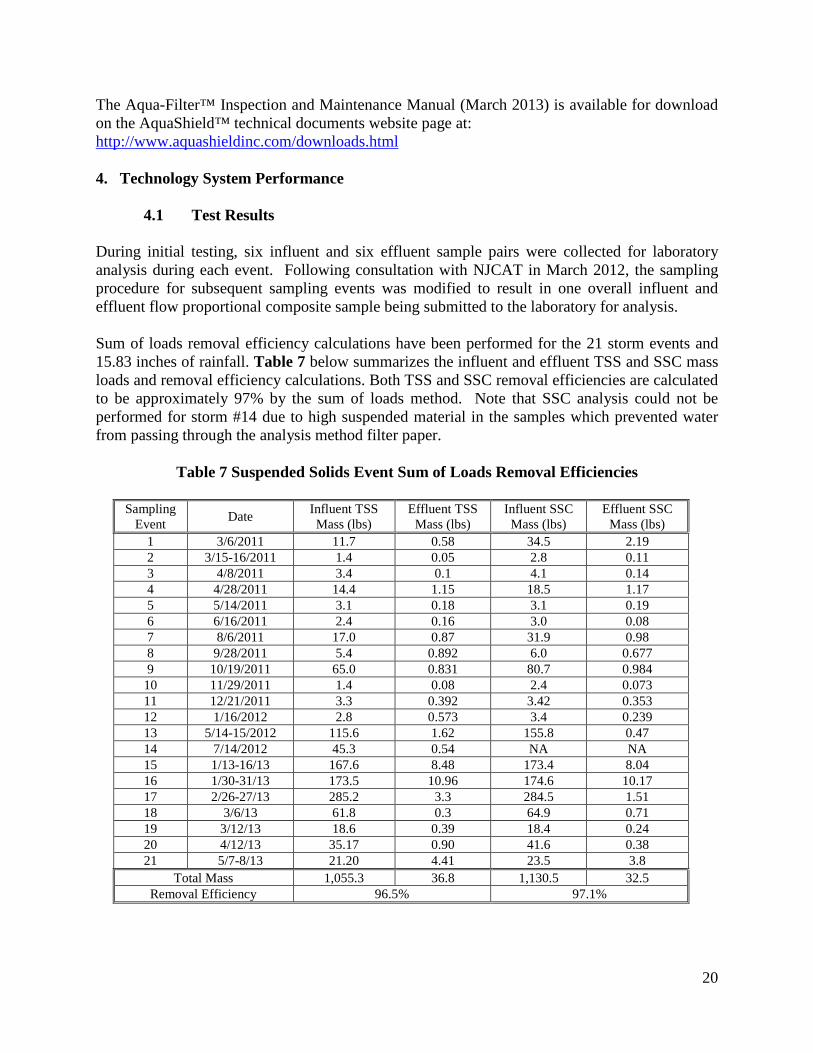
4.1 Test Results During initial testing, six influent and six effluent sample pairs were collected for laboratory analysis during each event. Following consultation with NJCAT in March 2012, the sampling procedure for subsequent sampling events was modified to result in one overall influent and effluent flow proportional composite sample being submitted to the laboratory for analysis. Sum of loads removal efficiency calculations have been performed for the 21 storm events and 15.83 inches of rainfall. Table 7 below summarizes the influent and effluent TSS and SSC mass loads and removal efficiency calculations. Both TSS and SSC removal efficiencies are calculated to be approximately 97% by the sum of loads method. Note that SSC analysis could not be performed for storm #14 due to high suspended material in the samples which prevented water from passing through the analysis method filter paper.
Table 7 Suspended Solids Event Sum of Loads Removal Efficiencies
Sampling Event Date Influent TSS
Mass (lbs) Effluent TSS
Mass (lbs) Influent SSC Mass (lbs)
Effluent SSC Mass (lbs)
1 3/6/2011 11.7 0.58 34.5 2.19 2 3/15-16/2011 1.4 0.05 2.8 0.11 3 4/8/2011 3.4 0.1 4.1 0.14 4 4/28/2011 14.4 1.15 18.5 1.17 5 5/14/2011 3.1 0.18 3.1 0.19 6 6/16/2011 2.4 0.16 3.0 0.08 7 8/6/2011 17.0 0.87 31.9 0.98 8 9/28/2011 5.4 0.892 6.0 0.677 9 10/19/2011 65.0 0.831 80.7 0.984
10 11/29/2011 1.4 0.08 2.4 0.073 11 12/21/2011 3.3 0.392 3.42 0.353 12 1/16/2012 2.8 0.573 3.4 0.239 13 5/14-15/2012 115.6 1.62 155.8 0.47 14 7/14/2012 45.3 0.54 NA NA 15 1/13-16/13 167.6 8.48 173.4 8.04 16 1/30-31/13 173.5 10.96 174.6 10.17 17 2/26-27/13 285.2 3.3 284.5 1.51 18 3/6/13 61.8 0.3 64.9 0.71 19 3/12/13 18.6 0.39 18.4 0.24 20 4/12/13 35.17 0.90 41.6 0.38 21 5/7-8/13 21.20 4.41 23.5 3.8
Total Mass 1,055.3 36.8 1,130.5 32.5 Removal Efficiency 96.5% 97.1%
21
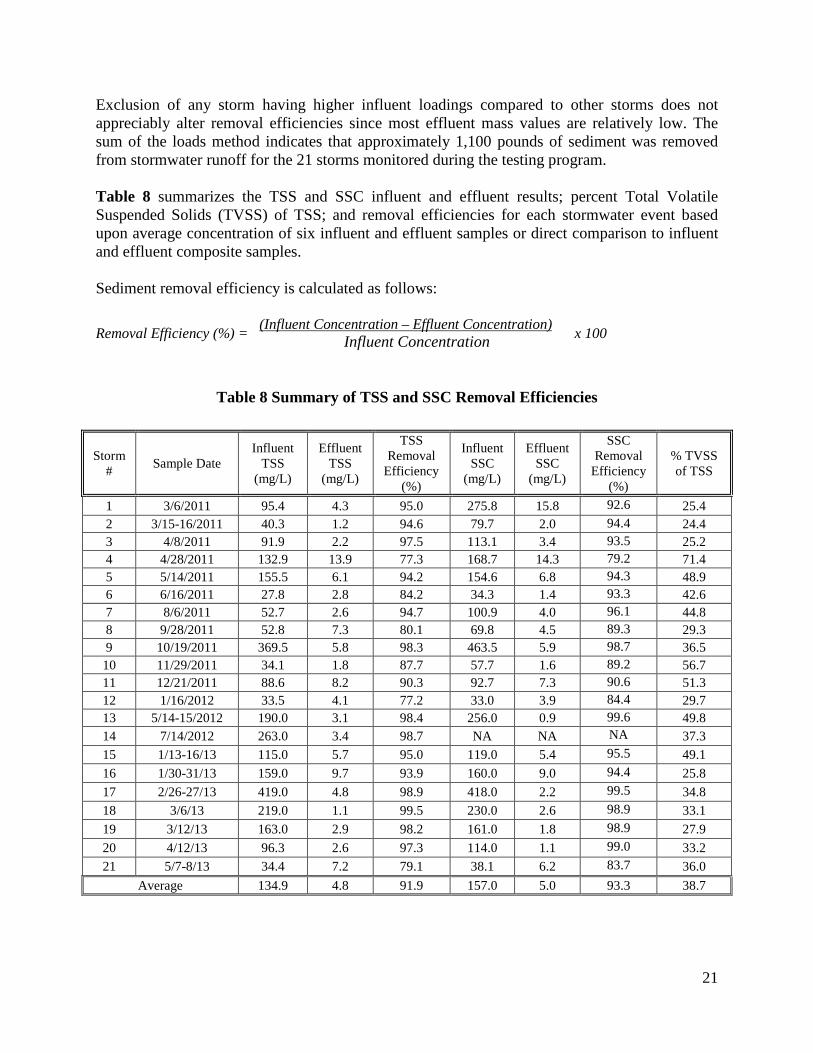
Exclusion of any storm having higher influent loadings compared to other storms does not appreciably alter removal efficiencies since most effluent mass values are relatively low. The sum of the loads method indicates that approximately 1,100 pounds of sediment was removed from stormwater runoff for the 21 storms monitored during the testing program. Table 8 summarizes the TSS and SSC influent and effluent results; percent Total Volatile Suspended Solids (TVSS) of TSS; and removal efficiencies for each stormwater event based upon average concentration of six influent and effluent samples or direct comparison to influent and effluent composite samples. Sediment removal efficiency is calculated as follows:
Removal Efficiency (%) = (Influent Concentration – Effluent Concentration) x 100 Influent Concentration
Table 8 Summary of TSS and SSC Removal Efficiencies
Storm # Sample Date
Influent TSS
(mg/L)
Effluent TSS
(mg/L)
TSS Removal
Efficiency (%)
Influent SSC
(mg/L)
Effluent SSC
(mg/L)
SSC Removal
Efficiency (%)
% TVSS of TSS
1 3/6/2011 95.4 4.3 95.0 275.8 15.8 92.6 25.4 2 3/15-16/2011 40.3 1.2 94.6 79.7 2.0 94.4 24.4 3 4/8/2011 91.9 2.2 97.5 113.1 3.4 93.5 25.2 4 4/28/2011 132.9 13.9 77.3 168.7 14.3 79.2 71.4 5 5/14/2011 155.5 6.1 94.2 154.6 6.8 94.3 48.9 6 6/16/2011 27.8 2.8 84.2 34.3 1.4 93.3 42.6 7 8/6/2011 52.7 2.6 94.7 100.9 4.0 96.1 44.8 8 9/28/2011 52.8 7.3 80.1 69.8 4.5 89.3 29.3 9 10/19/2011 369.5 5.8 98.3 463.5 5.9 98.7 36.5 10 11/29/2011 34.1 1.8 87.7 57.7 1.6 89.2 56.7 11 12/21/2011 88.6 8.2 90.3 92.7 7.3 90.6 51.3 12 1/16/2012 33.5 4.1 77.2 33.0 3.9 84.4 29.7 13 5/14-15/2012 190.0 3.1 98.4 256.0 0.9 99.6 49.8 14 7/14/2012 263.0 3.4 98.7 NA NA NA 37.3 15 1/13-16/13 115.0 5.7 95.0 119.0 5.4 95.5 49.1 16 1/30-31/13 159.0 9.7 93.9 160.0 9.0 94.4 25.8 17 2/26-27/13 419.0 4.8 98.9 418.0 2.2 99.5 34.8 18 3/6/13 219.0 1.1 99.5 230.0 2.6 98.9 33.1 19 3/12/13 163.0 2.9 98.2 161.0 1.8 98.9 27.9 20 4/12/13 96.3 2.6 97.3 114.0 1.1 99.0 33.2 21 5/7-8/13 34.4 7.2 79.1 38.1 6.2 83.7 36.0
Average 134.9 4.8 91.9 157.0 5.0 93.3 38.7
22
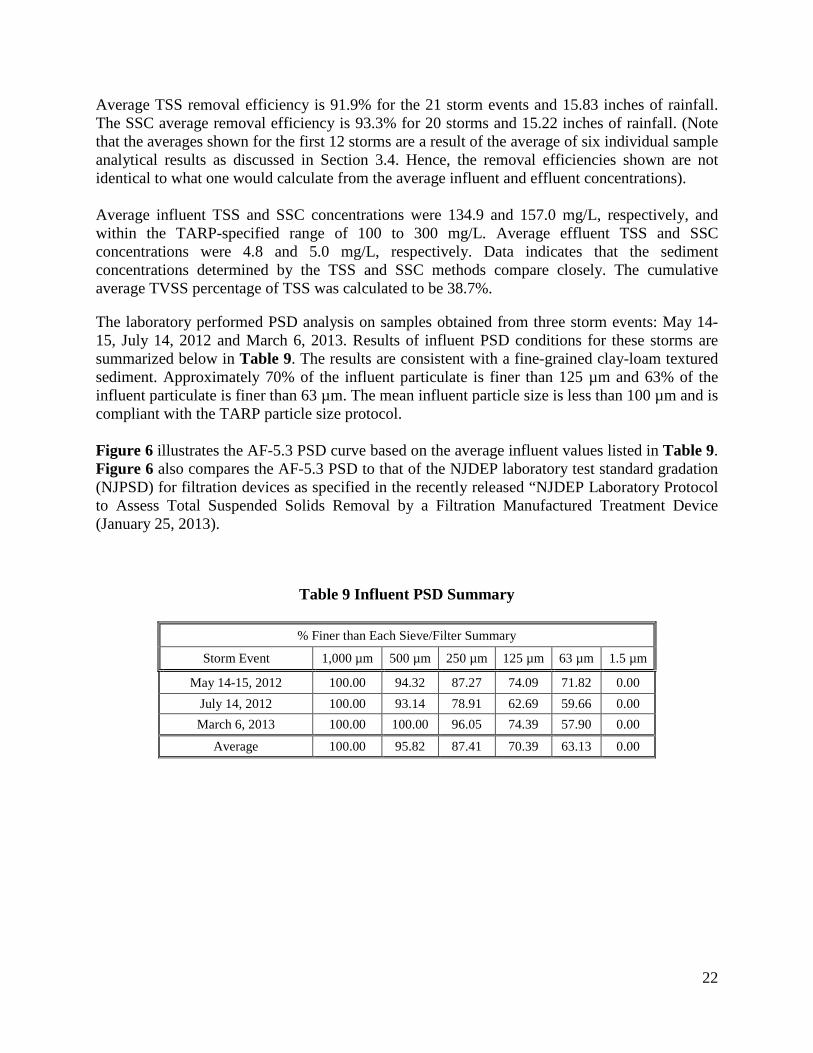
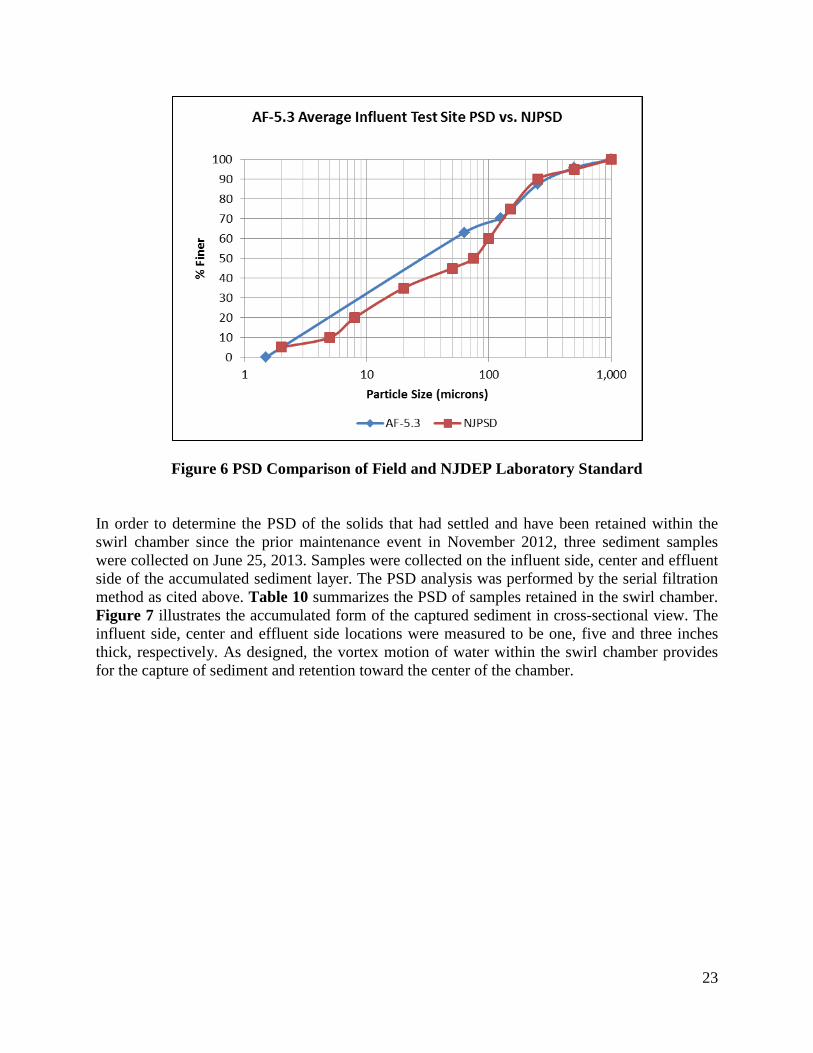
Average TSS removal efficiency is 91.9% for the 21 storm events and 15.83 inches of rainfall. The SSC average removal efficiency is 93.3% for 20 storms and 15.22 inches of rainfall. (Note that the averages shown for the first 12 storms are a result of the average of six individual sample analytical results as discussed in Section 3.4. Hence, the removal efficiencies shown are not identical to what one would calculate from the average influent and effluent concentrations). Average influent TSS and SSC concentrations were 134.9 and 157.0 mg/L, respectively, and within the TARP-specified range of 100 to 300 mg/L. Average effluent TSS and SSC concentrations were 4.8 and 5.0 mg/L, respectively. Data indicates that the sediment concentrations determined by the TSS and SSC methods compare closely. The cumulative average TVSS percentage of TSS was calculated to be 38.7%. The laboratory performed PSD analysis on samples obtained from three storm events: May 14-15, July 14, 2012 and March 6, 2013. Results of influent PSD conditions for these storms are summarized below in Table 9. The results are consistent with a fine-grained clay-loam textured sediment. Approximately 70% of the influent particulate is finer than 125 µm and 63% of the influent particulate is finer than 63 µm. The mean influent particle size is less than 100 µm and is compliant with the TARP particle size protocol. Figure 6 illustrates the AF-5.3 PSD curve based on the average influent values listed in Table 9. Figure 6 also compares the AF-5.3 PSD to that of the NJDEP laboratory test standard gradation (NJPSD) for filtration devices as specified in the recently released “NJDEP Laboratory Protocol to Assess Total Suspended Solids Removal by a Filtration Manufactured Treatment Device (January 25, 2013).
Table 9 Influent PSD Summary
% Finer than Each Sieve/Filter Summary
Storm Event 1,000 µm 500 µm 250 µm 125 µm 63 µm 1.5 µm
May 14-15, 2012 100.00 94.32 87.27 74.09 71.82 0.00 July 14, 2012 100.00 93.14 78.91 62.69 59.66 0.00 March 6, 2013 100.00 100.00 96.05 74.39 57.90 0.00
Average 100.00 95.82 87.41 70.39 63.13 0.00
23
Figure 6 PSD Comparison of Field and NJDEP Laboratory Standard
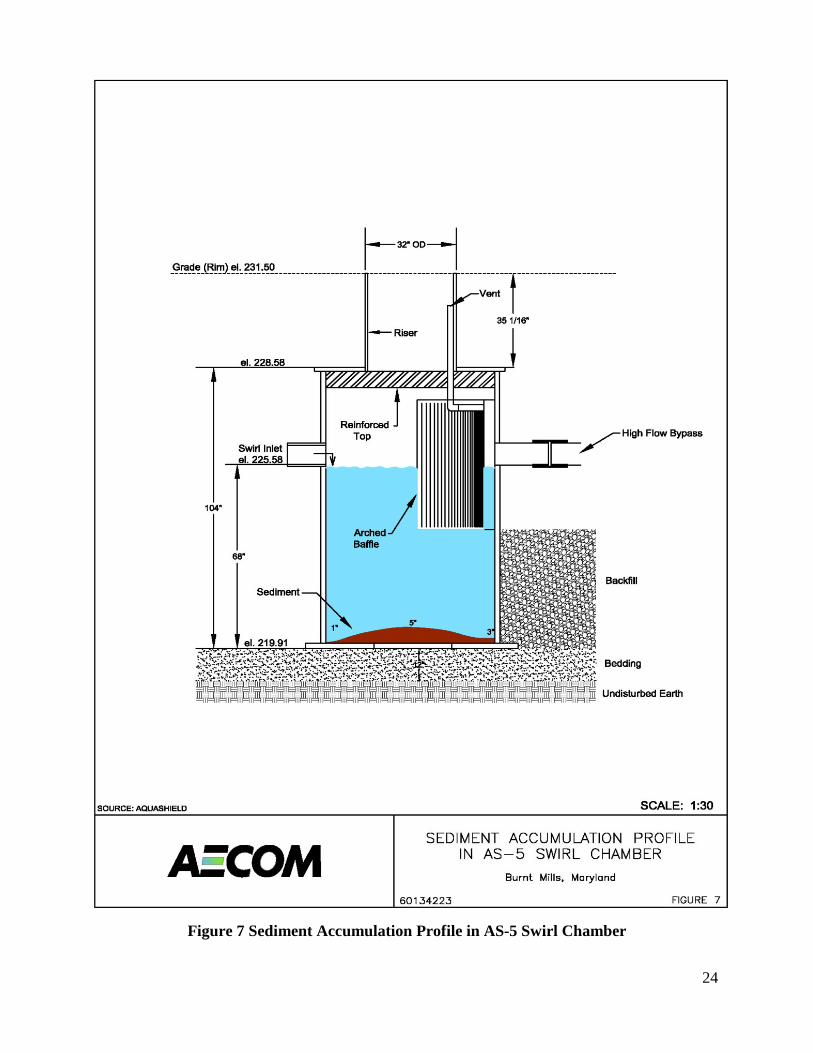
In order to determine the PSD of the solids that had settled and have been retained within the swirl chamber since the prior maintenance event in November 2012, three sediment samples were collected on June 25, 2013. Samples were collected on the influent side, center and effluent side of the accumulated sediment layer. The PSD analysis was performed by the serial filtration method as cited above. Table 10 summarizes the PSD of samples retained in the swirl chamber. Figure 7 illustrates the accumulated form of the captured sediment in cross-sectional view. The influent side, center and effluent side locations were measured to be one, five and three inches thick, respectively. As designed, the vortex motion of water within the swirl chamber provides for the capture of sediment and retention toward the center of the chamber.
24
Figure 7 Sediment Accumulation Profile in AS-5 Swirl Chamber
25
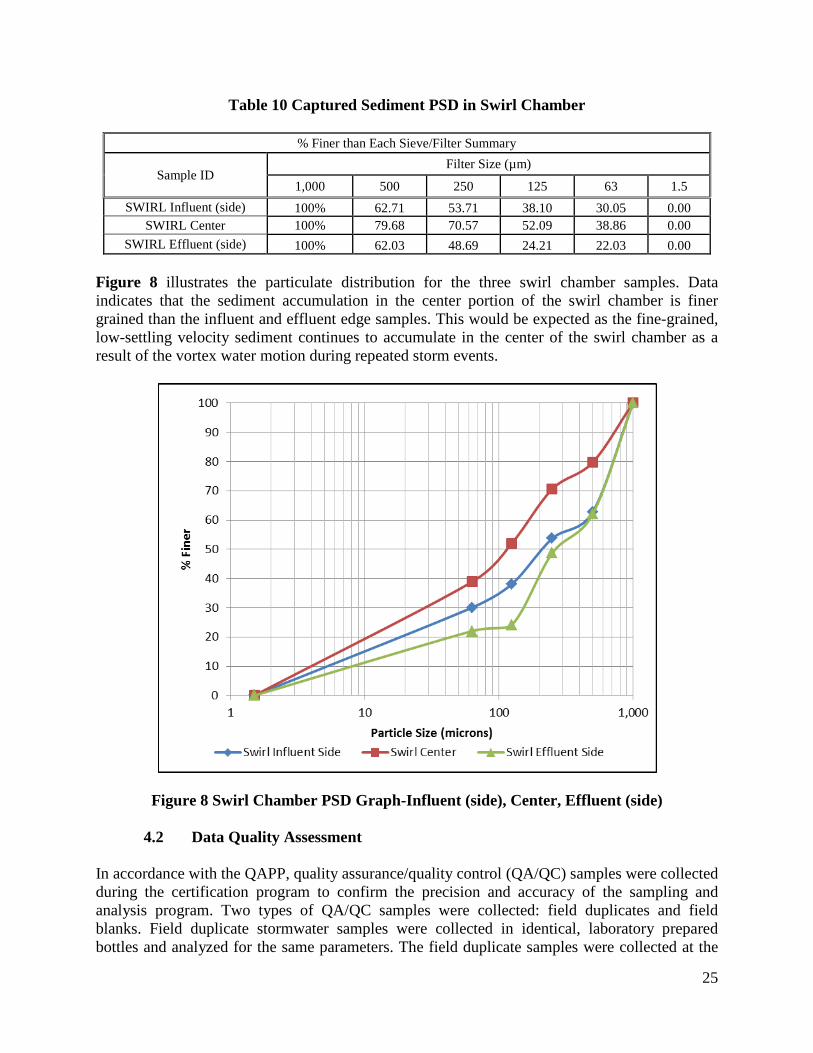
Table 10 Captured Sediment PSD in Swirl Chamber
% Finer than Each Sieve/Filter Summary
Sample ID Filter Size (µm)
1,000 500 250 125 63 1.5 SWIRL Influent (side) 100% 62.71 53.71 38.10 30.05 0.00
SWIRL Center 100% 79.68 70.57 52.09 38.86 0.00 SWIRL Effluent (side) 100% 62.03 48.69 24.21 22.03 0.00
Figure 8 illustrates the particulate distribution for the three swirl chamber samples. Data indicates that the sediment accumulation in the center portion of the swirl chamber is finer grained than the influent and effluent edge samples. This would be expected as the fine-grained, low-settling velocity sediment continues to accumulate in the center of the swirl chamber as a result of the vortex water motion during repeated storm events.
Figure 8 Swirl Chamber PSD Graph-Influent (side), Center, Effluent (side)
4.2 Data Quality Assessment In accordance with the QAPP, quality assurance/quality control (QA/QC) samples were collected during the certification program to confirm the precision and accuracy of the sampling and analysis program. Two types of QA/QC samples were collected: field duplicates and field blanks. Field duplicate stormwater samples were collected in identical, laboratory prepared bottles and analyzed for the same parameters. The field duplicate samples were collected at the
26
same location and from the same sample aliquot as the original samples. One field duplicate stormwater sample was collected for each sampling event, when sufficient sample volume was available. One field blank sample was also collected for each sampling event. The field blank was collected by pouring laboratory provided distilled/deionized water through the cone sample splitter into a decontaminated sample bottle, then into the appropriate sample containers for analysis. Field duplicate analytical results showed acceptable reproducibility of the majority of sampling events. There were isolated events with field duplicate sample results that were outliers; however, the overall relative percent difference (RPD) indicated acceptable reproducibility in sampling results. The overall average RPD was within 30%. If the identified outliers were not included, the average RPD decreased to less than 20% which is the RPD objective identified in the QAPP. The majority of field blank results were below the method detection limits with the exception of two sampling events (April 8, 2012 and May 7-8, 2013) that exhibited low TVSS, TSS and SSC concentrations just above the method detection limit. One low SSC concentration was also detected during the September 28, 2011 event. Field blank results for all other events were not detected. The field blank results confirmed that the decontamination procedures used for the sampling apparatus and the cone splitter were effective at minimizing any cross contamination during sampling and analysis. Review of the overall QA/QC procedures and analytical results have confirmed that the field sampling procedures and analytical methodologies employed produced reliable and representative analytical results.
4.3 Statistical Analysis Statistical analysis was conducted on the sampling program data to ensure that the collected data were reliable, significant and within confidence limits. Initially the removal efficiency for each analytical parameter was evaluated to determine confidence intervals and associated variance. The coefficient of variation (COV) was calculated using the calculated TSS and SSC removal efficiencies for all sampling events. The calculated COV for TSS removal efficiencies was 8.4% and for SSC removal efficiencies was 8.5%. The COVs were within acceptable limits in the TARP protocol. To evaluate the significance of differences between influent and effluent mean concentrations, the Mann-Whitney Rank U Test was used. The Mann-Whitney Rank U Test is a non-parametric statistical hypothesis test for assessing whether two independent samples of observations have equally large values. The null hypothesis concluded that there was a statistically significant difference between influent and effluent mean TSS and SSC concentrations.
27
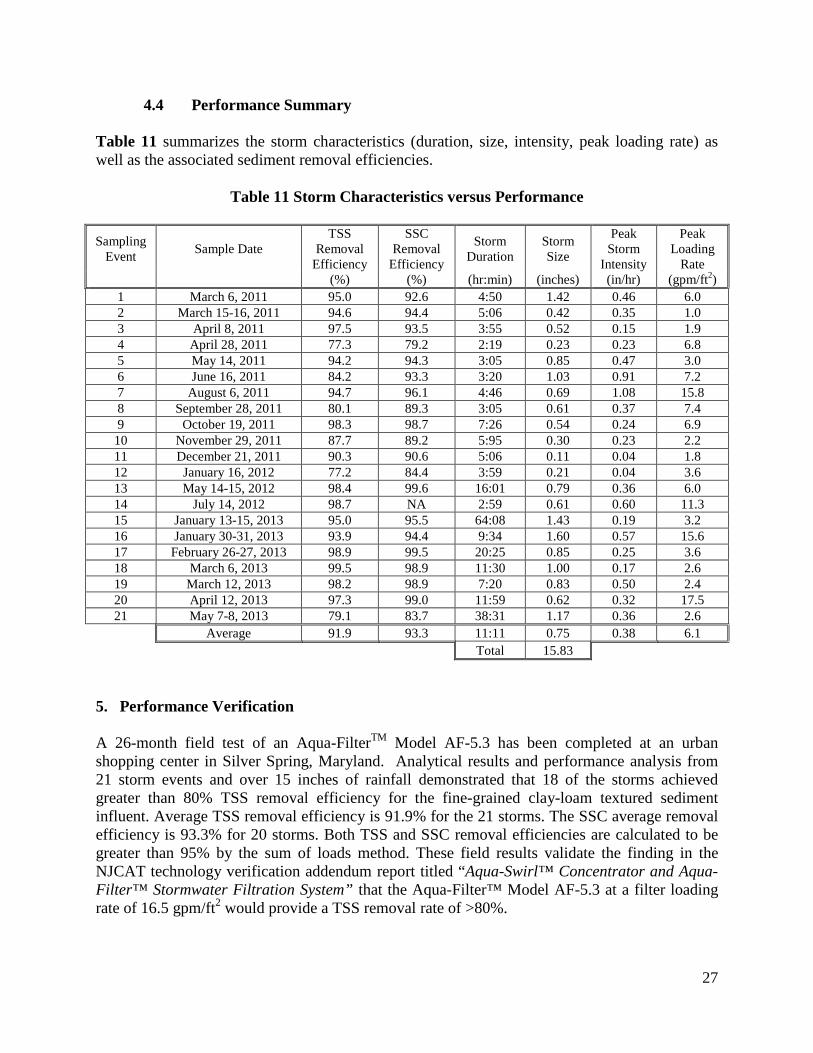
4.4 Performance Summary Table 11 summarizes the storm characteristics (duration, size, intensity, peak loading rate) as well as the associated sediment removal efficiencies.
Table 11 Storm Characteristics versus Performance
Sampling Event Sample Date
TSS Removal
Efficiency
SSC Removal
Efficiency
Storm Duration
Storm Size
Peak Storm
Intensity
Peak Loading
Rate (%) (%) (hr:min) (inches) (in/hr) (gpm/ft2)
1 March 6, 2011 95.0 92.6 4:50 1.42 0.46 6.0 2 March 15-16, 2011 94.6 94.4 5:06 0.42 0.35 1.0 3 April 8, 2011 97.5 93.5 3:55 0.52 0.15 1.9 4 April 28, 2011 77.3 79.2 2:19 0.23 0.23 6.8 5 May 14, 2011 94.2 94.3 3:05 0.85 0.47 3.0 6 June 16, 2011 84.2 93.3 3:20 1.03 0.91 7.2 7 August 6, 2011 94.7 96.1 4:46 0.69 1.08 15.8 8 September 28, 2011 80.1 89.3 3:05 0.61 0.37 7.4 9 October 19, 2011 98.3 98.7 7:26 0.54 0.24 6.9
10 November 29, 2011 87.7 89.2 5:95 0.30 0.23 2.2 11 December 21, 2011 90.3 90.6 5:06 0.11 0.04 1.8 12 January 16, 2012 77.2 84.4 3:59 0.21 0.04 3.6 13 May 14-15, 2012 98.4 99.6 16:01 0.79 0.36 6.0 14 July 14, 2012 98.7 NA 2:59 0.61 0.60 11.3 15 January 13-15, 2013 95.0 95.5 64:08 1.43 0.19 3.2 16 January 30-31, 2013 93.9 94.4 9:34 1.60 0.57 15.6 17 February 26-27, 2013 98.9 99.5 20:25 0.85 0.25 3.6 18 March 6, 2013 99.5 98.9 11:30 1.00 0.17 2.6 19 March 12, 2013 98.2 98.9 7:20 0.83 0.50 2.4 20 April 12, 2013 97.3 99.0 11:59 0.62 0.32 17.5 21 May 7-8, 2013 79.1 83.7 38:31 1.17 0.36 2.6
Average 91.9 93.3 11:11 0.75 0.38 6.1 Total 15.83
5. Performance Verification A 26-month field test of an Aqua-FilterTM Model AF-5.3 has been completed at an urban shopping center in Silver Spring, Maryland. Analytical results and performance analysis from 21 storm events and over 15 inches of rainfall demonstrated that 18 of the storms achieved greater than 80% TSS removal efficiency for the fine-grained clay-loam textured sediment influent. Average TSS removal efficiency is 91.9% for the 21 storms. The SSC average removal efficiency is 93.3% for 20 storms. Both TSS and SSC removal efficiencies are calculated to be greater than 95% by the sum of loads method. These field results validate the finding in the NJCAT technology verification addendum report titled “Aqua-Swirl™ Concentrator and Aqua-Filter™ Stormwater Filtration System” that the Aqua-Filter™ Model AF-5.3 at a filter loading rate of 16.5 gpm/ft2 would provide a TSS removal rate of >80%.
28
The TARP requirement that a minimum of six samples be collected from each storm was interpreted by AECOM during the initial testing period that a minimum of six individual composite samples of the influent and effluent were required to be submitted for laboratory analysis (See Section 3.4). To ensure that sufficient sample volumes were collected for the required analyses, storm durations had to be conservatively predicted which led to varying sampling durations, and consequently event coverage, within the rainfall period, during the first 12 events. The storm duration coverage for these storms fluctuated from 35 to 97 percent, with four (4) storms having less than 60% storm coverage; an average of 80% storm flow coverage for the 21 storms was achieved over the 26-month field testing period. TARP qualifying storms require flow-weighted composite samples be obtained covering a minimum of 60% of the total storm flow. Analysis of the TSS and SSC removal efficiencies for the four events having less than 60% storm coverage indicated slightly higher removal efficiencies than that of the 17 qualifying events, possibly due to the higher impact of the first flush. Consequently, utilizing these four storms for the AF-5.3 performance evaluation resulted in slightly higher average removal efficiencies for TSS (91.9% vs. 91.1%) and SSC (93.3% vs. 92.8%) had these storms not been included. Hence, it is concluded that including the results from all 21 storms does not impact the finding that the Aqua-Filter™ Model AF-5.3 achieved greater than 90% TSS and SSC removal efficiencies during the 26-month field test. The impact of removing these four storms when evaluating the suspended solids event sum of loads removal efficiencies (Table 7) was minimal. Removal efficiency for TSS dropped 0.1%, while removal efficiency for SSC remained unchanged. 6. Net Environmental Benefit The Aqua-FilterTM Model AF-5.3 requires no input of raw material, has no moving parts and therefore uses no water or energy other than that provided by stormwater runoff. For the 21 storm events monitored during the 26-month monitoring period the mass of materials captured and retained by the Aqua-FilterTM Model AF-5.3 would otherwise have been released to the environment. 7. References AECOM (2012). Quality Assurance Project Plan for Field Performance Verification Testing of the Aqua-Filter® Model AF-5.3 Stormwater Treatment System, Burnt Mills Shopping Center, Silver Spring, Maryland. Kennedy, John B. and Neville, Adam M. Basic Statistical Methods for Engineers and Scientists. Second Edition, Pun-Donnelly Publisher, New York. New Jersey Corporation for Advanced Technology (NJCAT). (November 2012). NJCAT Technology Verification Report, Aqua-Swirl® Model AS-5 Stormwater Treatment System. New Jersey Corporation for Advanced Technology (NJCAT). (August 2007). NJCAT Technology Verification Addendum Report, Aqua-Swirl™ Concentrator and Aqua-Filter™ Stormwater Filtration System.
29
New Jersey Department of Environmental Protection (NJDEP). (2006). New Jersey Tier II Stormwater Test Requirements-Amendment to TARP Tier II Protocol. Trenton, New Jersey. Available online: http://water.usgs.gov/osw/pubs/WRIR00-419l.pdf Technology Acceptance and Reciprocity Partnership (TARP). (2003). The Technology Acceptance Reciprocity Partnership for Protocol for Stormwater Best Management Practice Demonstrations. United States Environmental Protection Agency (USEPA). (2006). Data Quality Assessment: A Reviewer’s Guide EPA QA/G-9R.
30
APPENDIX A
AQUA-FILTER™ MODEL AF-5.3 SPECIFICATIONS
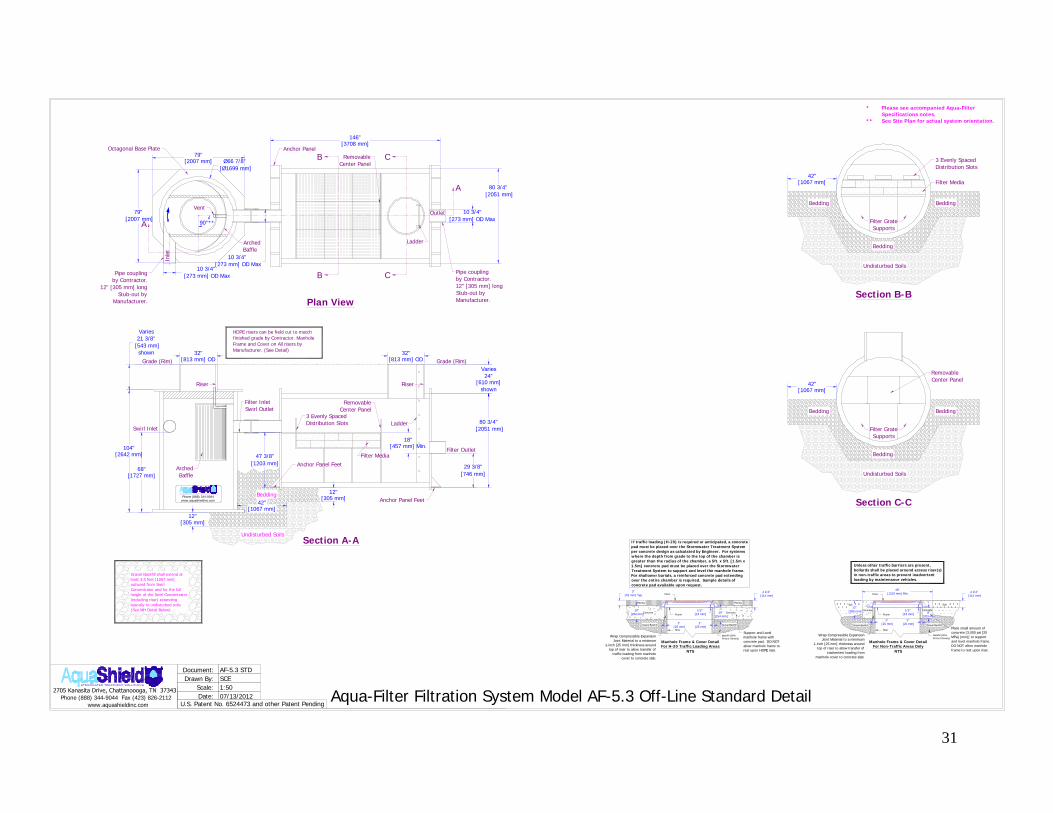
31
Gravel Backfill shall extend atleast 3.5 feet [1067 mm]outward from SwirlConcentrator and for the fullheight of the Swirl Concentrator(including riser) extendinglaterally to undisturbed soils.(See MH Detail Below)
1:50SCEDrawn By:AF-5.3 STDDocument:
07/13/2012Date: Phone (888) 344-9044 Fax (423) 826-2112 www.aquashieldinc.com
Scale:
Aqua-Filter Filtration System Model AF-5.3 Off-Line Standard DetailU.S. Patent No. 6524473 and other Patent Pending
A
146"[3708 mm]
Pipe couplingby Contractor.12" [305 mm] longStub-out byManufacturer.
A
RemovableCenter Panel
B
B
C
C
10 3/4"[273 mm] OD Max
80 3/4" [2051 mm]
Outlet
Ladder
Plan View
10 3/4" [273 mm] OD Max
Anchor Panel
* Please see accompanied Aqua-FilterSpecifications notes.
** See Site Plan for actual system orientation.
Section A-A
RemovableCenter Panel
3 Evenly SpacedDistribution Slots Ladder
Riser
Anchor Panel Feet
Anchor Panel Feet
Filter Outlet
29 3/8"[746 mm]
80 3/4" [2051 mm]
Varies24"
[610 mm]shown
Grade (Rim)32"
[813 mm] OD
Filter Media
18"[457 mm] Min.
47 3/8"[1203 mm]
42"[1067 mm]
Undisturbed Soils
Bedding
HDPE risers can be field cut to matchfinished grade by Contractor. ManholeFrame and Cover on All risers byManufacturer. (See Detail)
12"[305 mm]
Filter Media
Undisturbed Soils
Bedding
BeddingBedding
3 Evenly SpacedDistribution Slots
Filter GrateSupports
42"[1067 mm]
Section B-B
Undisturbed Soils
Bedding
BeddingBedding
42"[1067 mm]
Section C-C
RemovableCenter Panel
Filter GrateSupports
4 1/2" [114 mm]
Gravel Backfill
1/2" [13 mm]
1" [25 mm]
Manhole Frame & Cover Detail
NTSFor H-20 Traffic Loading Areas
Concrete
Paving
1" [25 mm]
Wrap Compressible ExpansionJoint Material to a minimum
1-inch [25 mm] thickness aroundtop of riser to allow transfer of
traffic loading from manholecover to concrete slab.
Backfill (90%Proctor Density)
Support and Levelmanhole frame withconcrete pad. DO NOTallow manhole frame torest upon HDPE riser.
Riser
Frame
Cover
10" [254 mm]
If traffic loading (H-20) is required or anticipated, a concretepad must be placed over the Stormwater Treatment Systemper concrete design as calculated by Engineer. For systemswhere the depth from grade to the top of the chamber isgreater than the radius of the chamber, a 5ft. x 5ft. [1.5m x1.5m] concrete pad must be placed over the StormwaterTreatment System to support and level the manhole frame.For shallower burials, a reinforced concrete pad extendingover the entire chamber is required. Sample details ofconcrete pad available upon request.
10" [254 mm]
Gravel Backfill
Concrete
Paving
3" [76 mm] Typ.
4 1/2" [114 mm]
1/2" [13 mm]
1" [25 mm]
Manhole Frame & Cover Detail
NTSFor Non-Traffic Areas Only
Soil
1" [25 mm]
Unless other traffic barriers are present,bollards shall be placed around access riser(s)in non-traffic areas to prevent inadvertentloading by maintenance vehicles.
Place small amount ofconcrete [3,000 psi [20MPa] (min)] to supportand level manhole frame.DO NOT allow manholeframe to rest upon riser.
Riser
Frame
Cover
48" [1219 mm] Min.
12" [305 mm]
Wrap Compressible ExpansionJoint Material to a minimum
1-inch [25 mm] thickness aroundtop of riser to allow transfer of
inadvertent loading frommanhole cover to concrete slab.
Backfill (90%Proctor Density)
Concrete8"
[203 mm]
Gravel Backfill
Phone (888) 344-9044 www.aquashieldinc.com
Inle
t
90°**
79" [2007 mm]
79"[2007 mm]
10 3/4" [273 mm] OD Max
Ø66 7/8" [Ø1699 mm]
32"[813 mm] OD
Varies21 3/8"
[543 mm]shown
68"[1727 mm]
104"[2642 mm]
Riser
Pipe couplingby Contractor.
12" [305 mm] longStub-out by
Manufacturer.
Octagonal Base Plate
ArchedBaffle
Vent
Swirl Inlet
Grade (Rim)
ArchedBaffle
12"[305 mm]
Filter InletSwirl Outlet

32
APPENDIX B
INDIVIDUAL STORM REPORTS
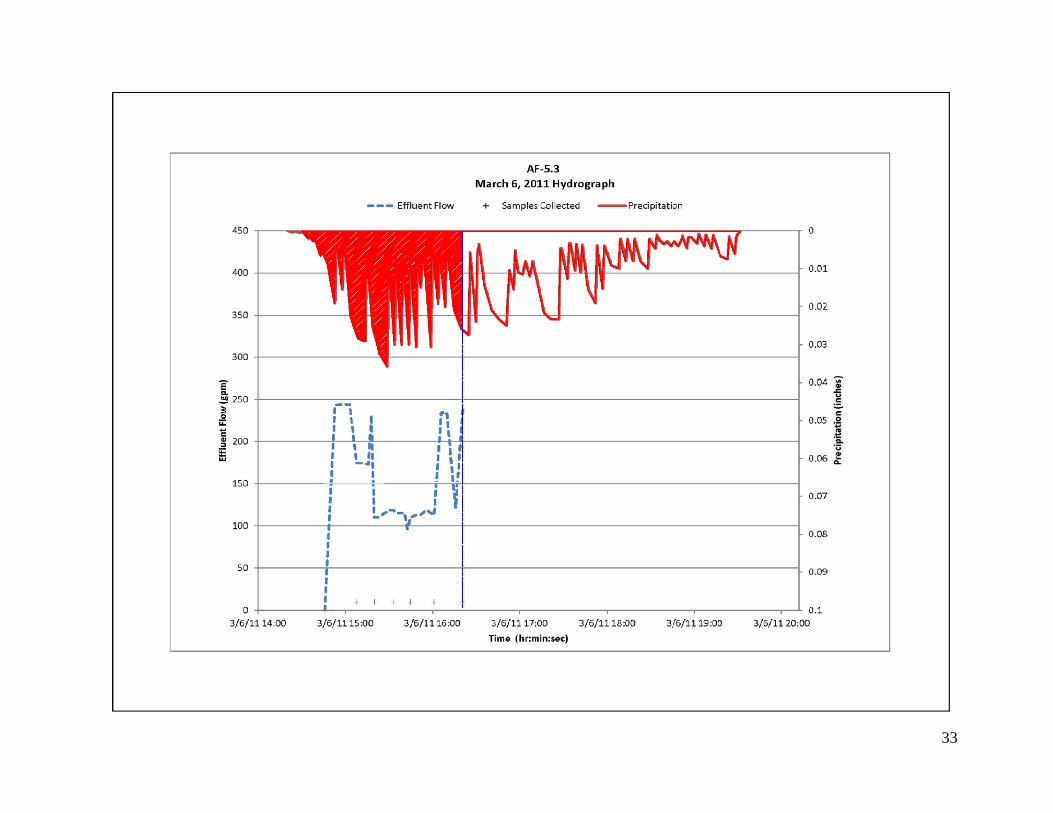
33
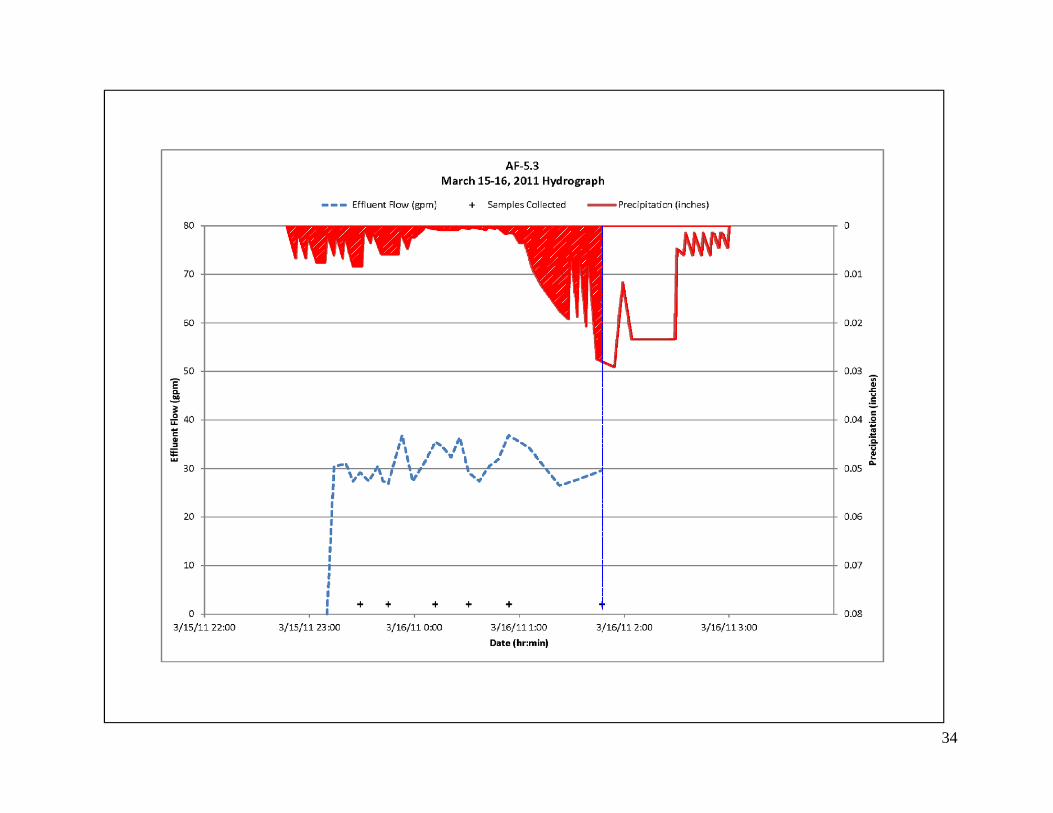
34
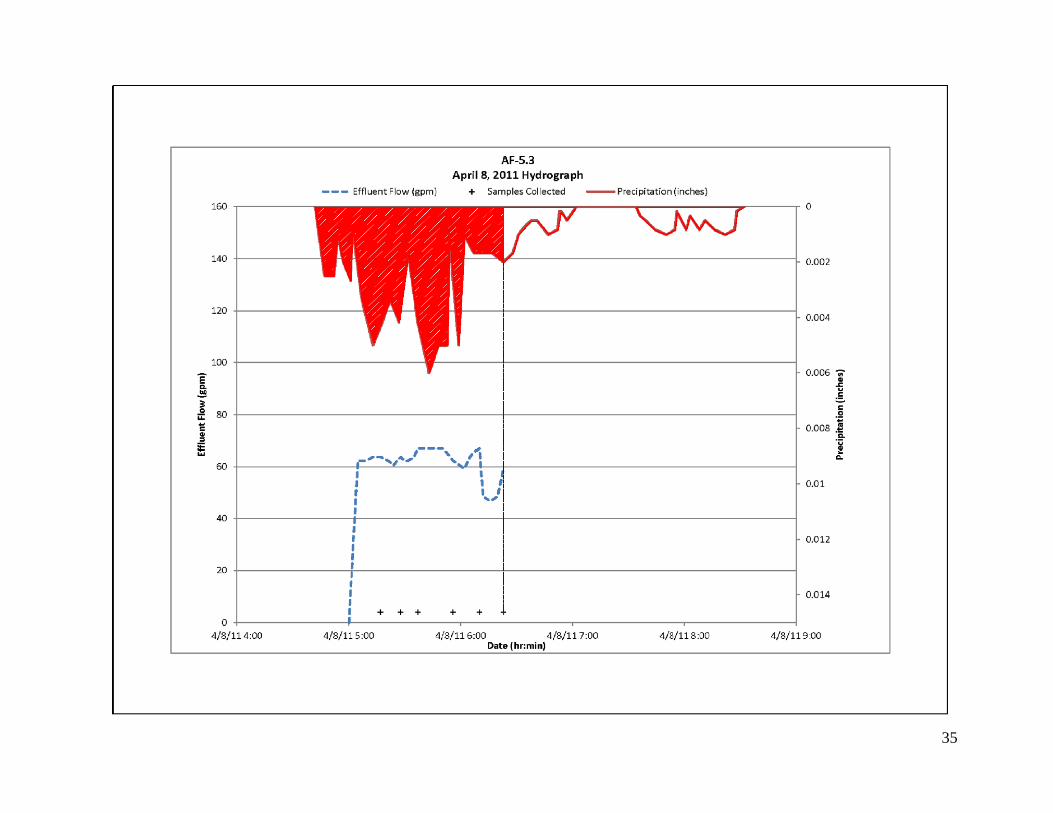
35
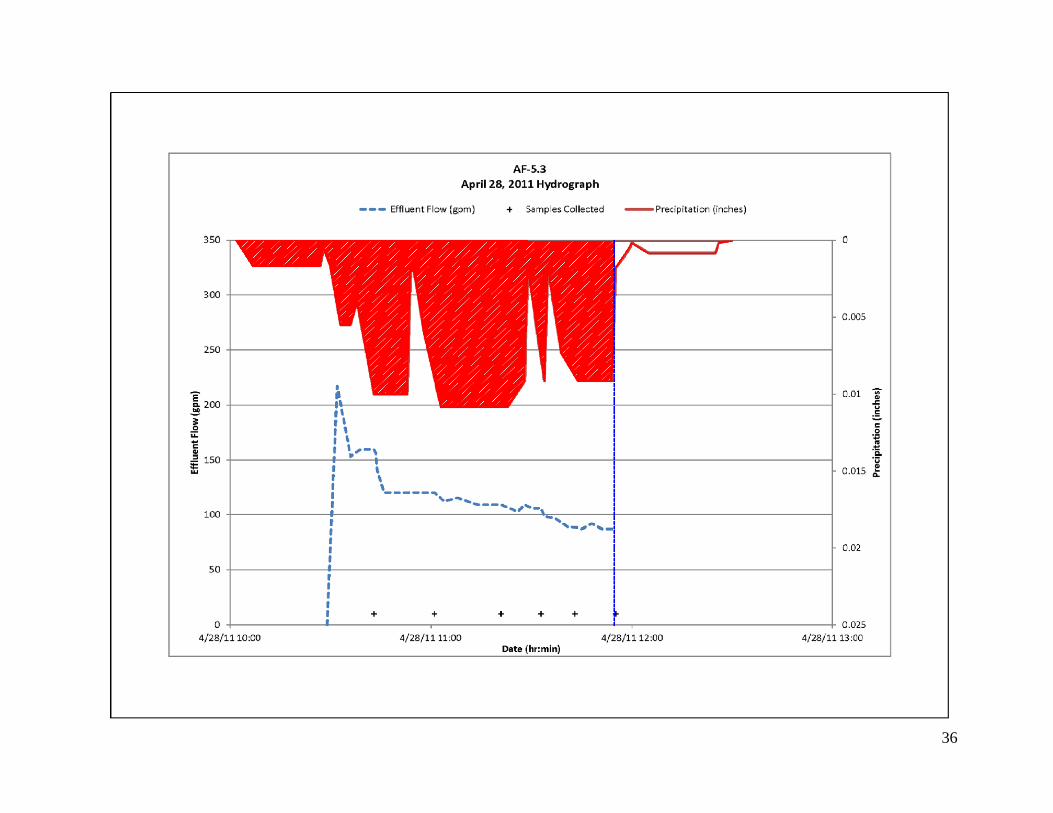
36
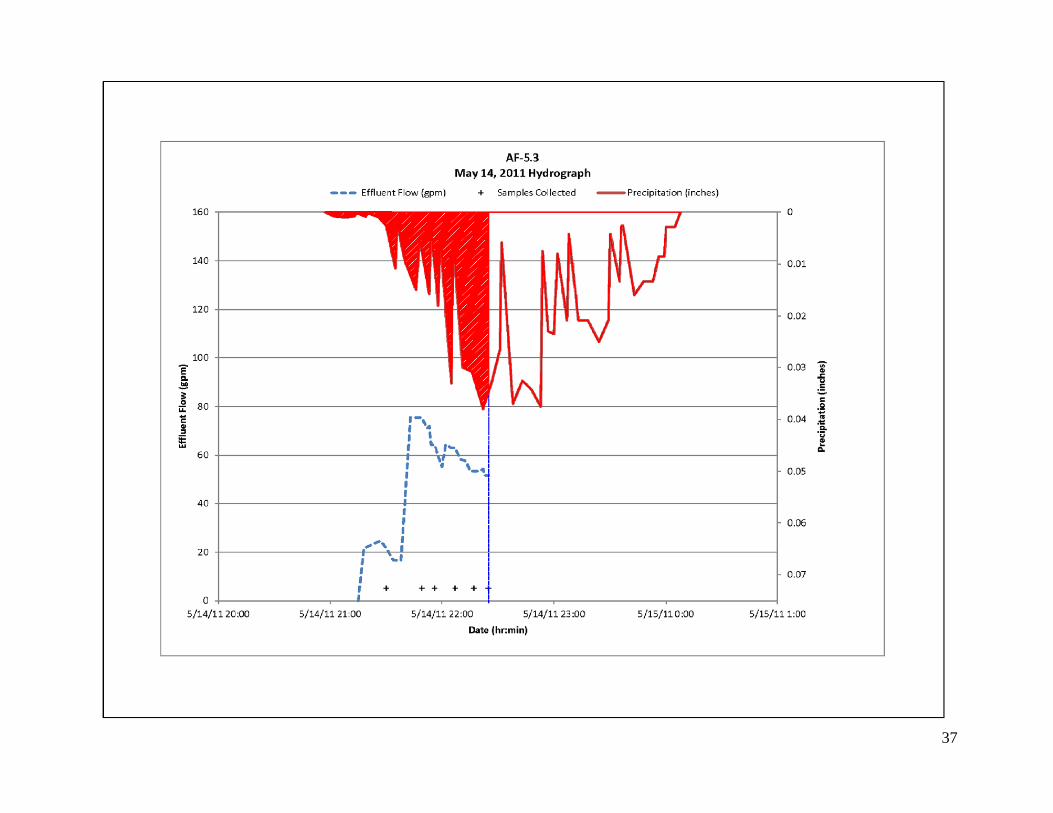
37
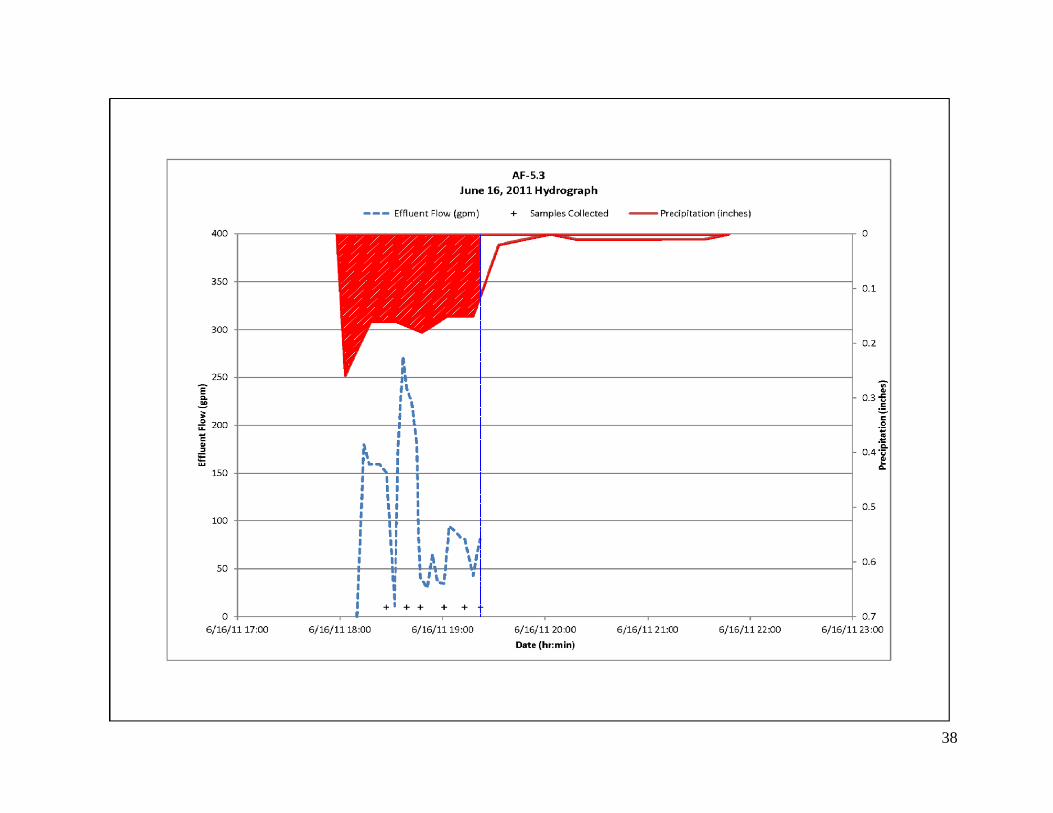
38
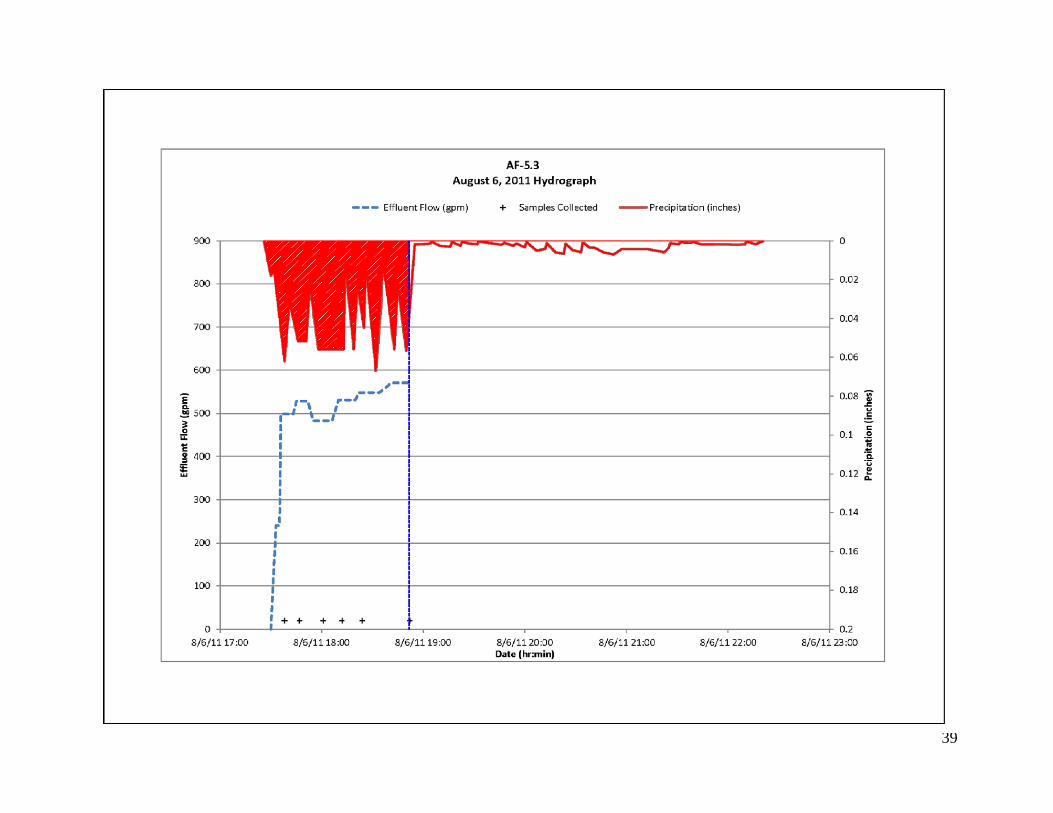
39
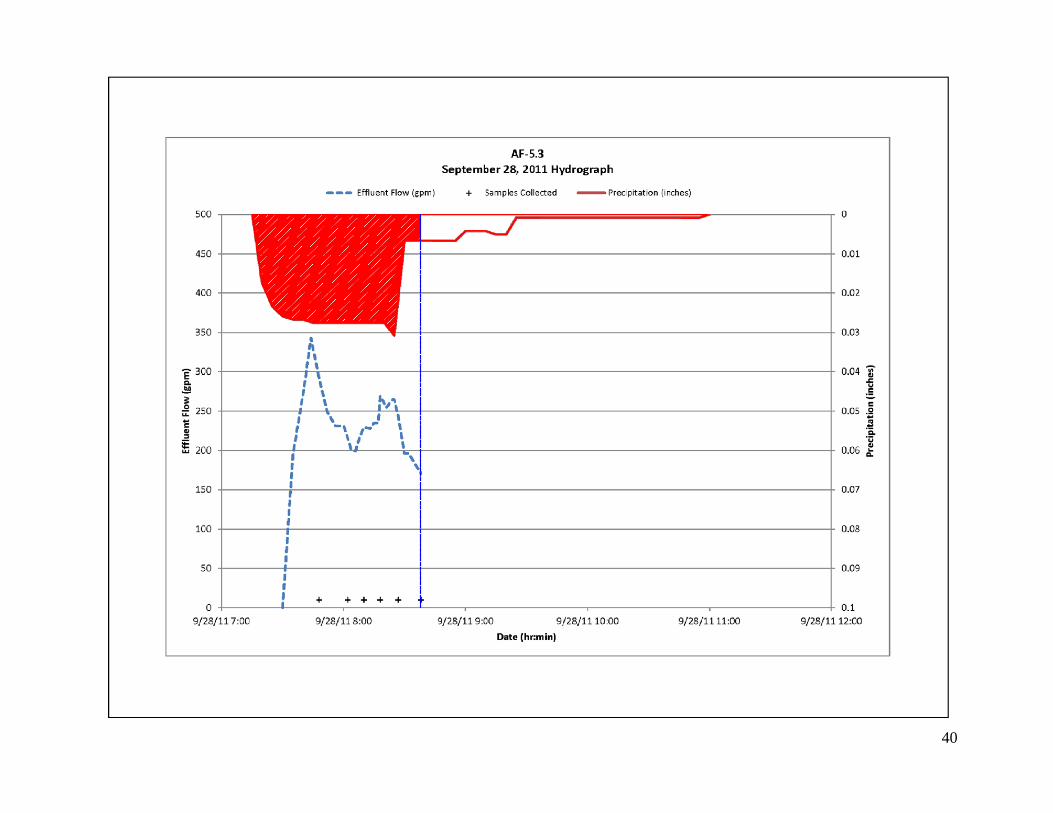
40
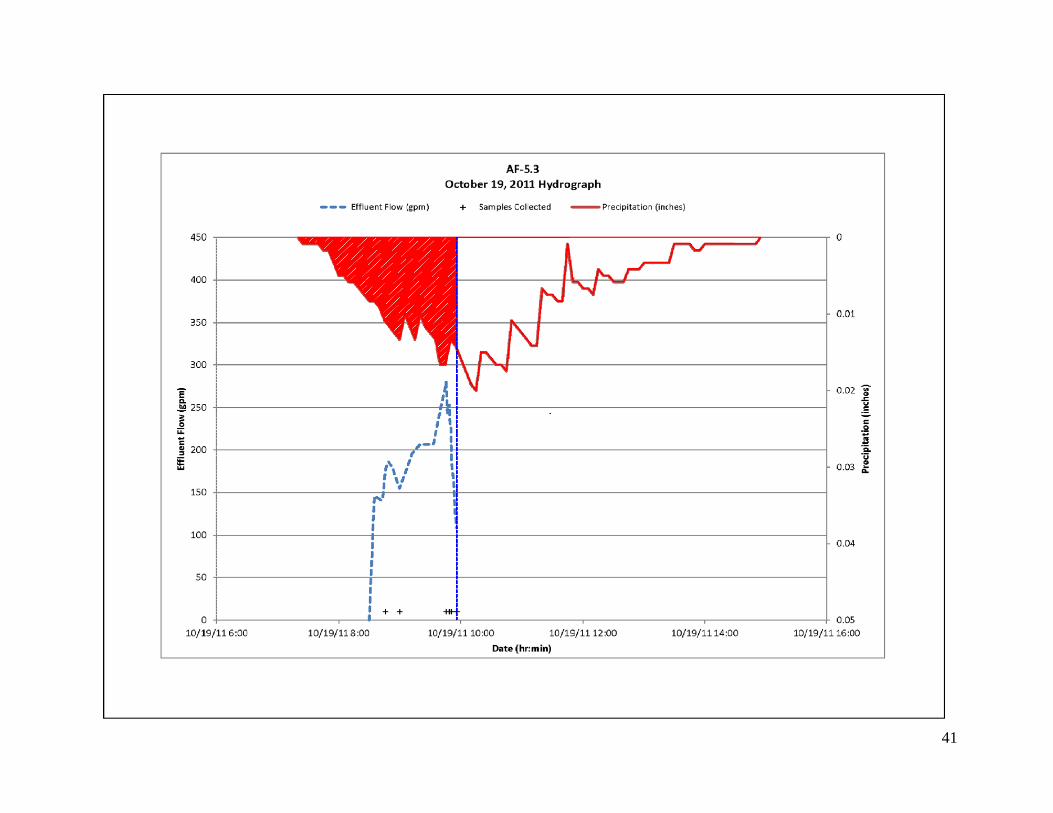
41
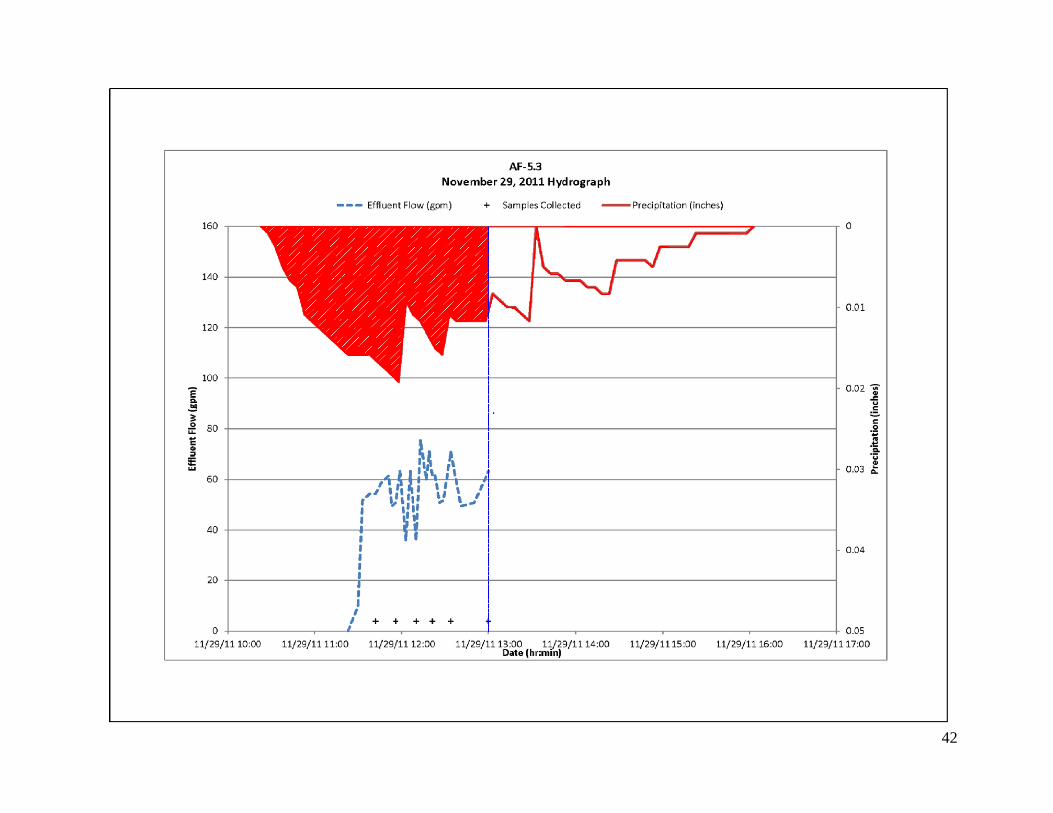
42
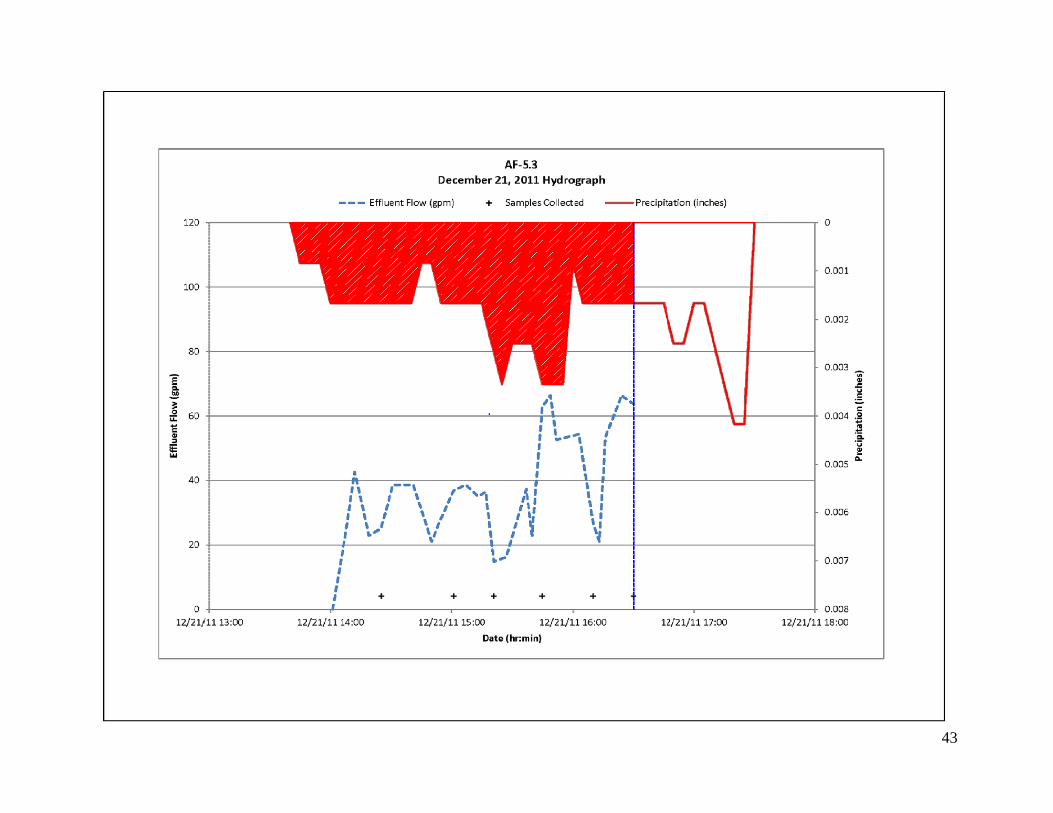
43
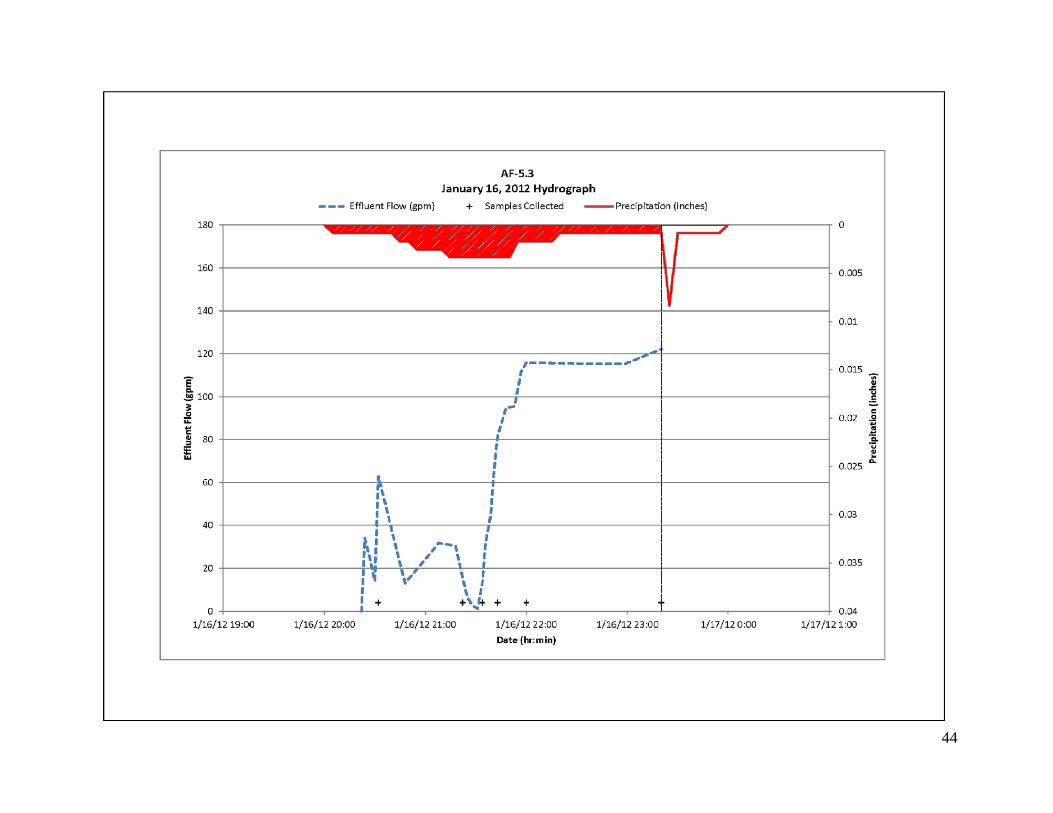
44
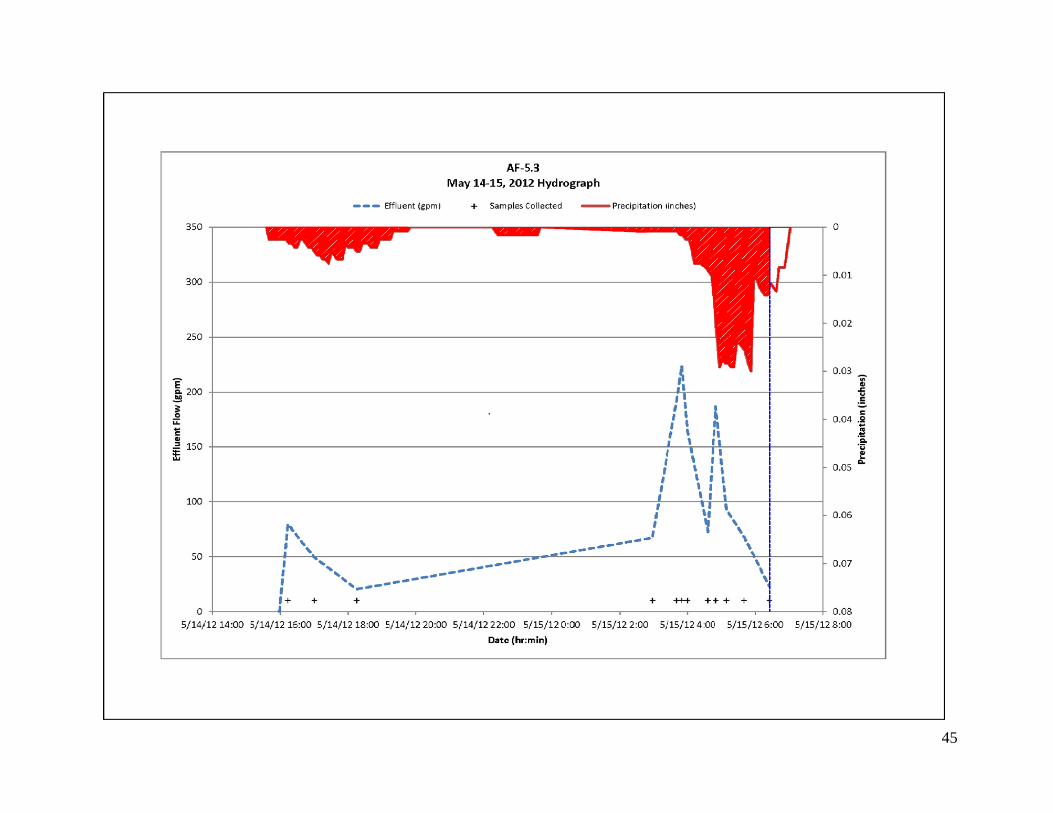
45
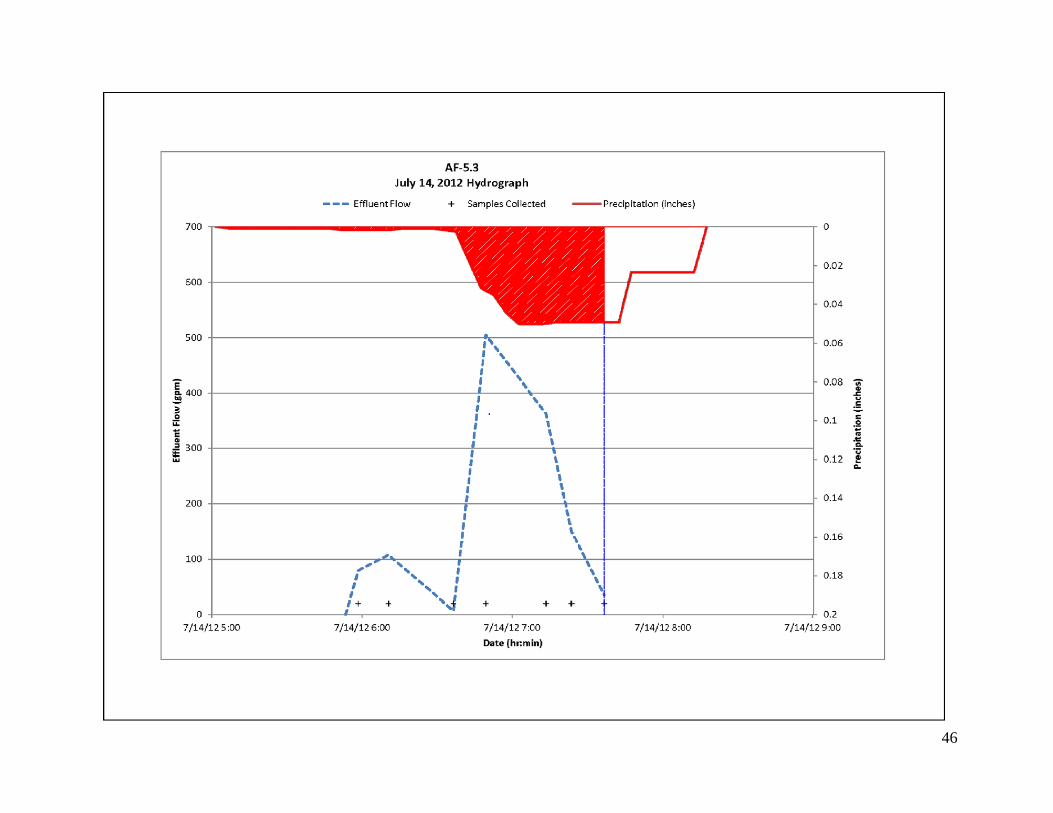
46
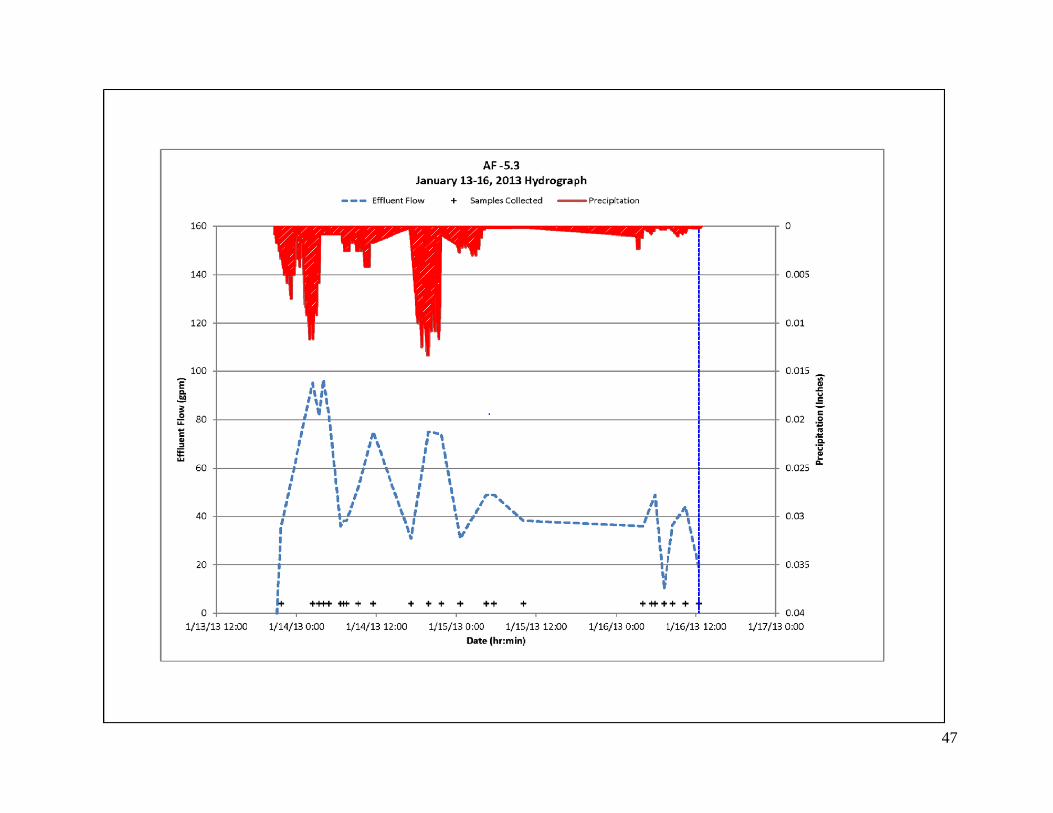
47
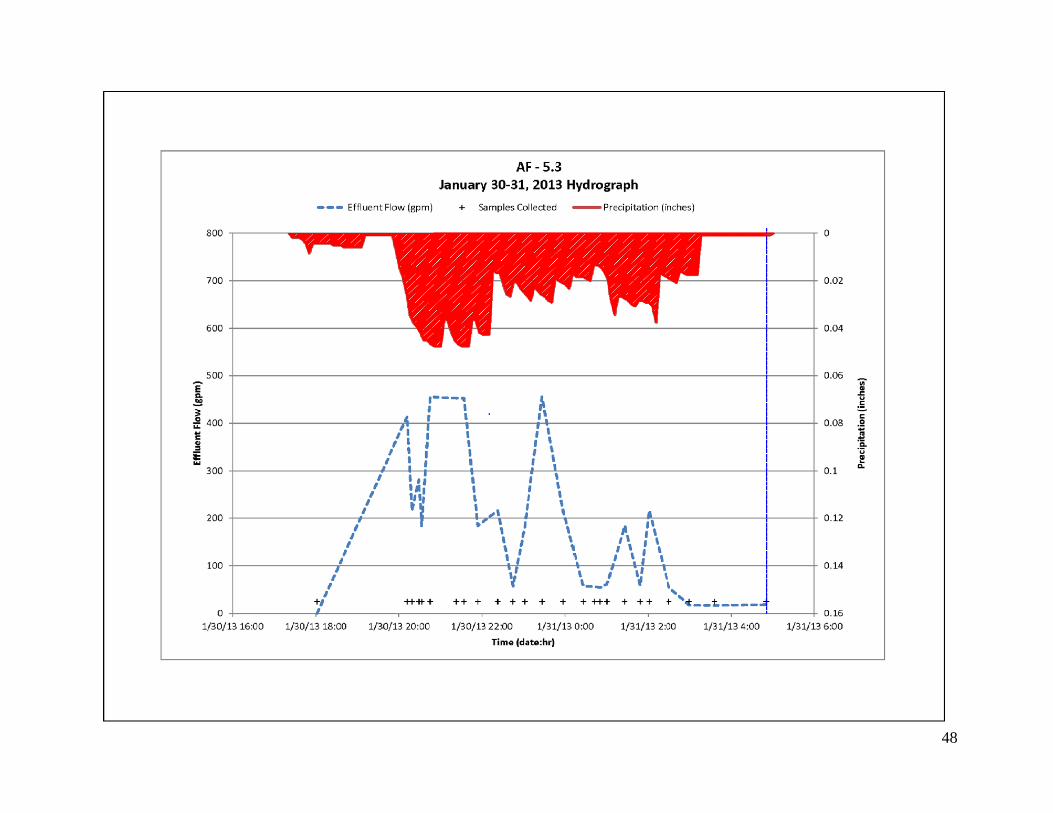
48
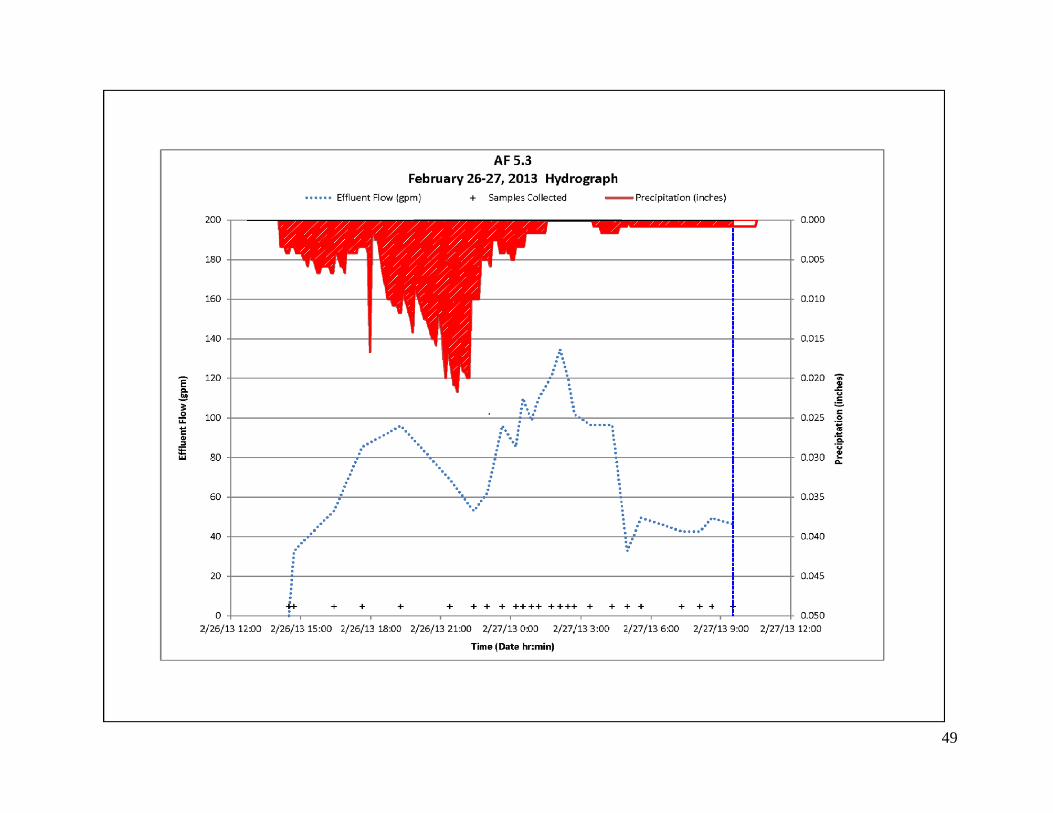
49
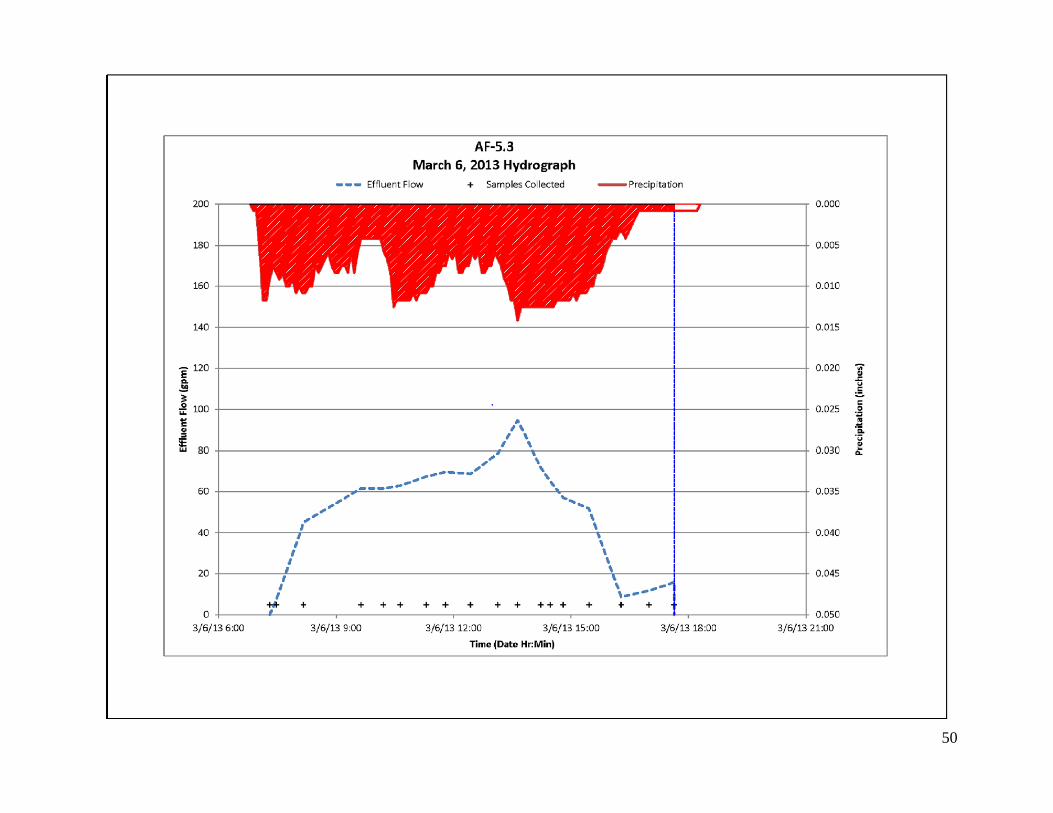
50
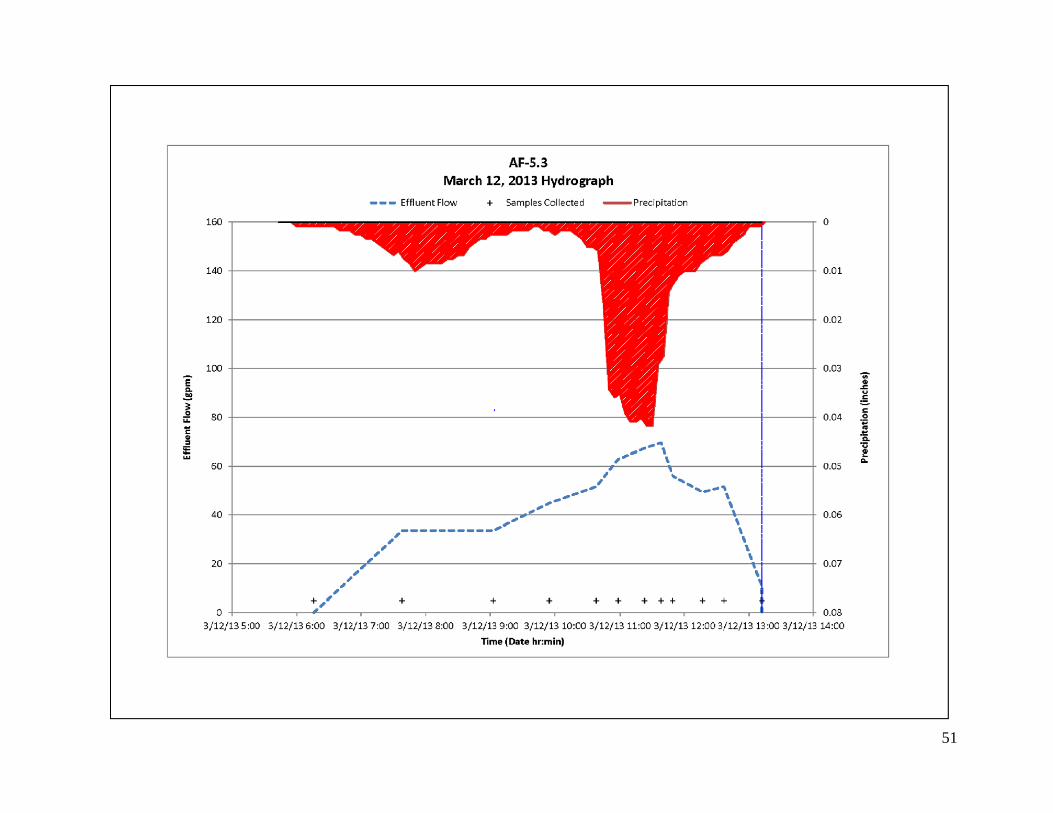
51
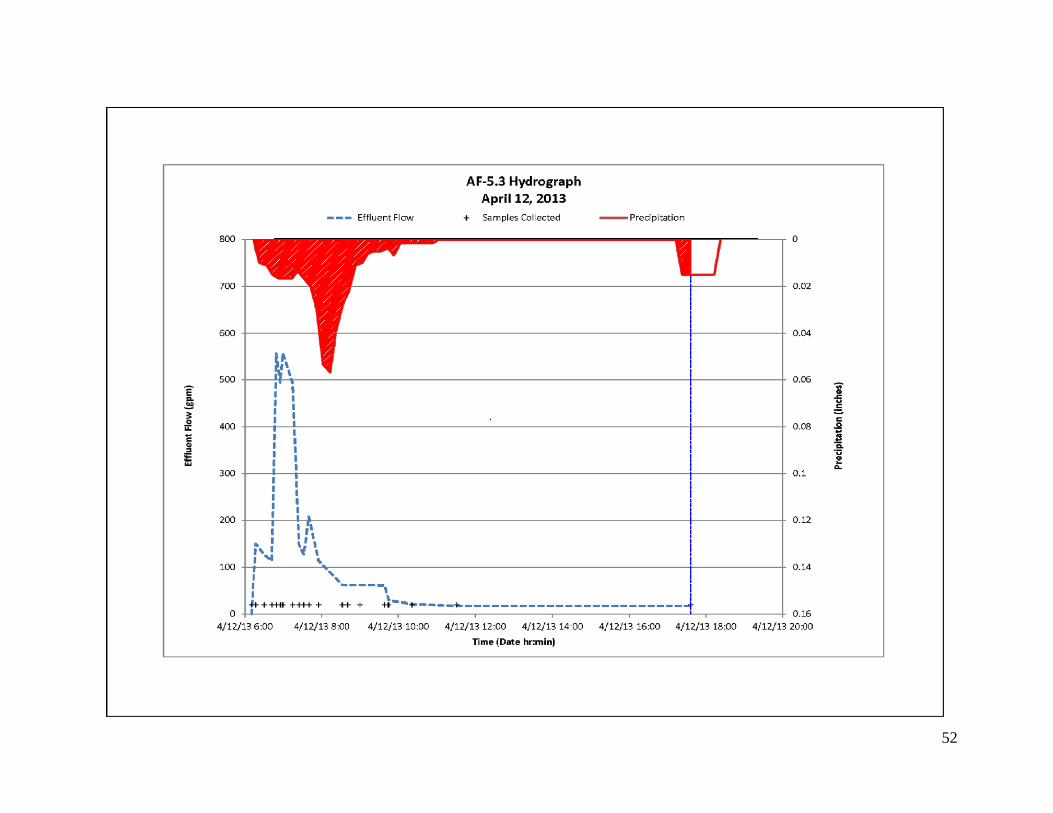
52
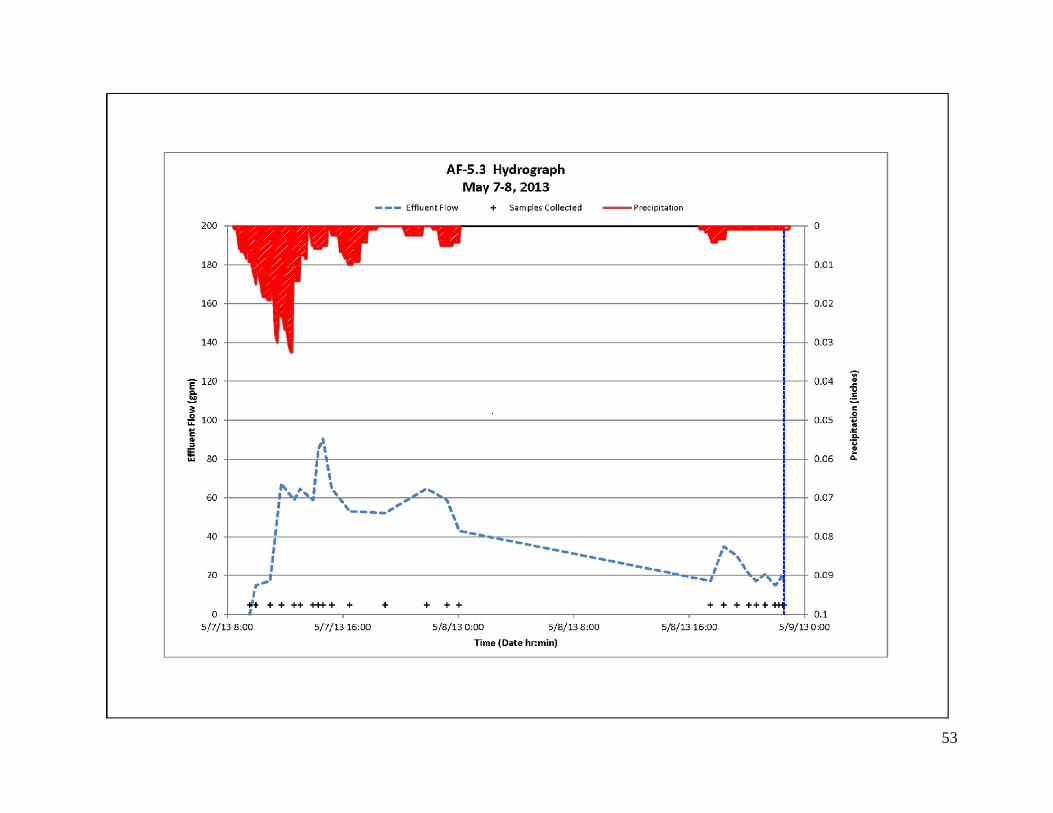
53
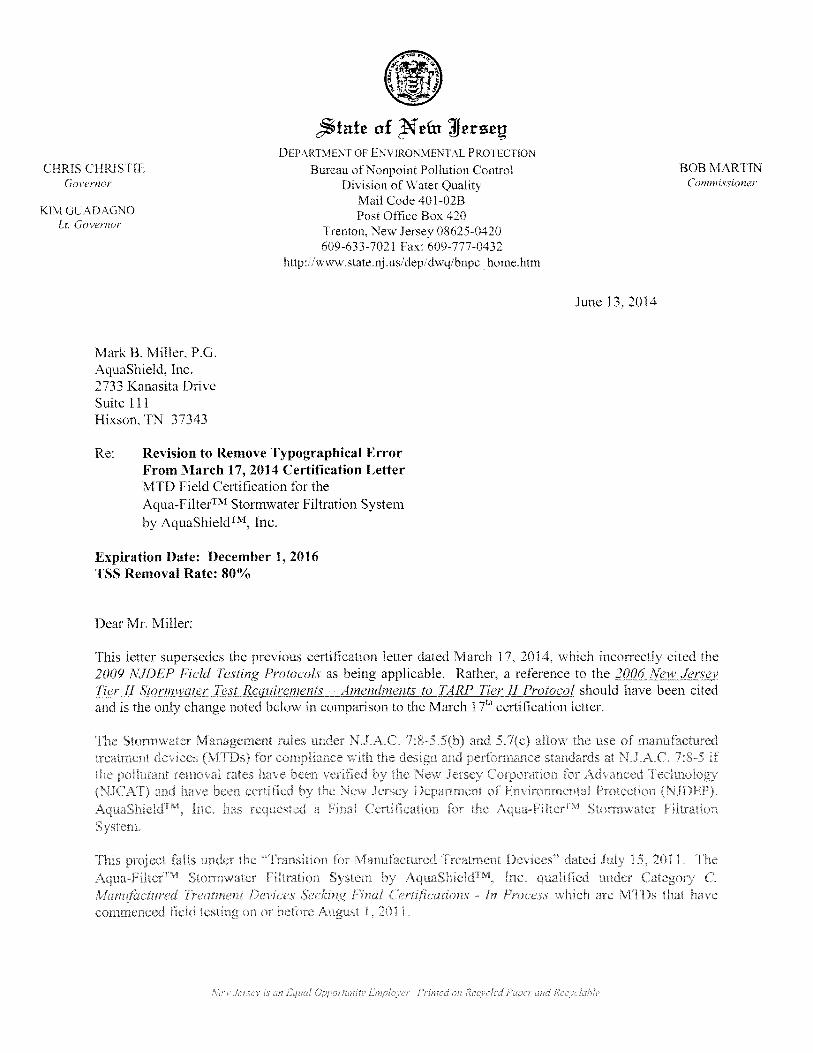
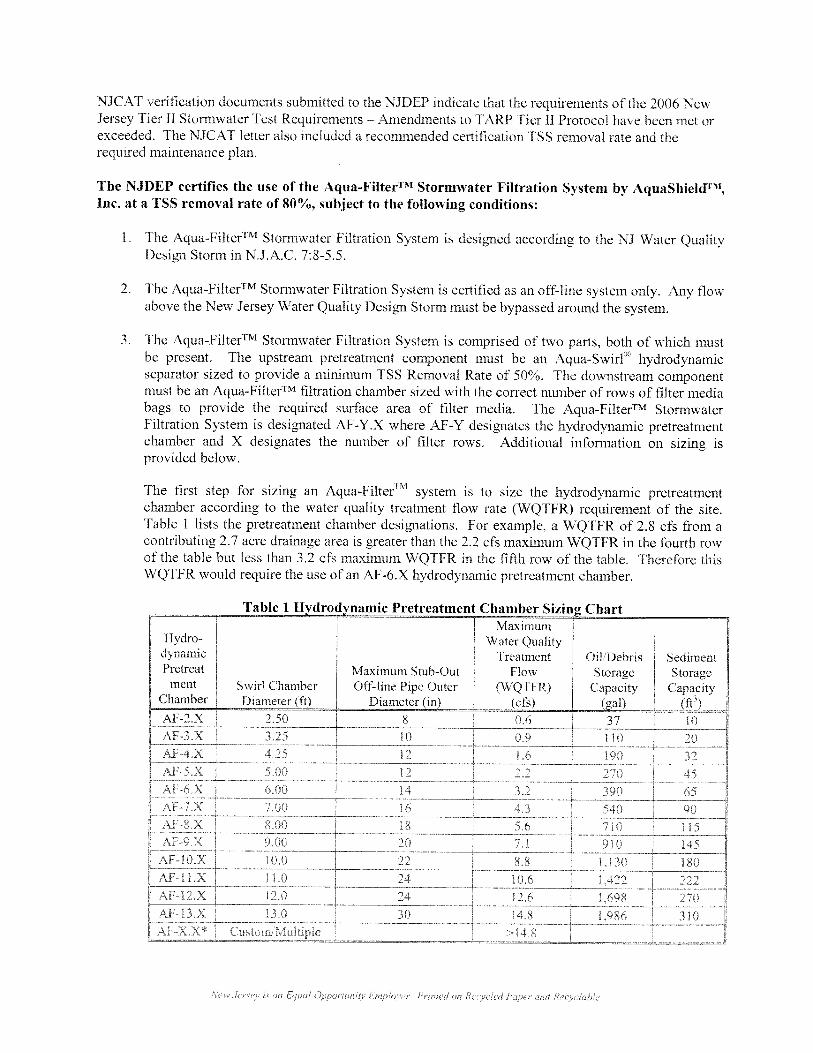
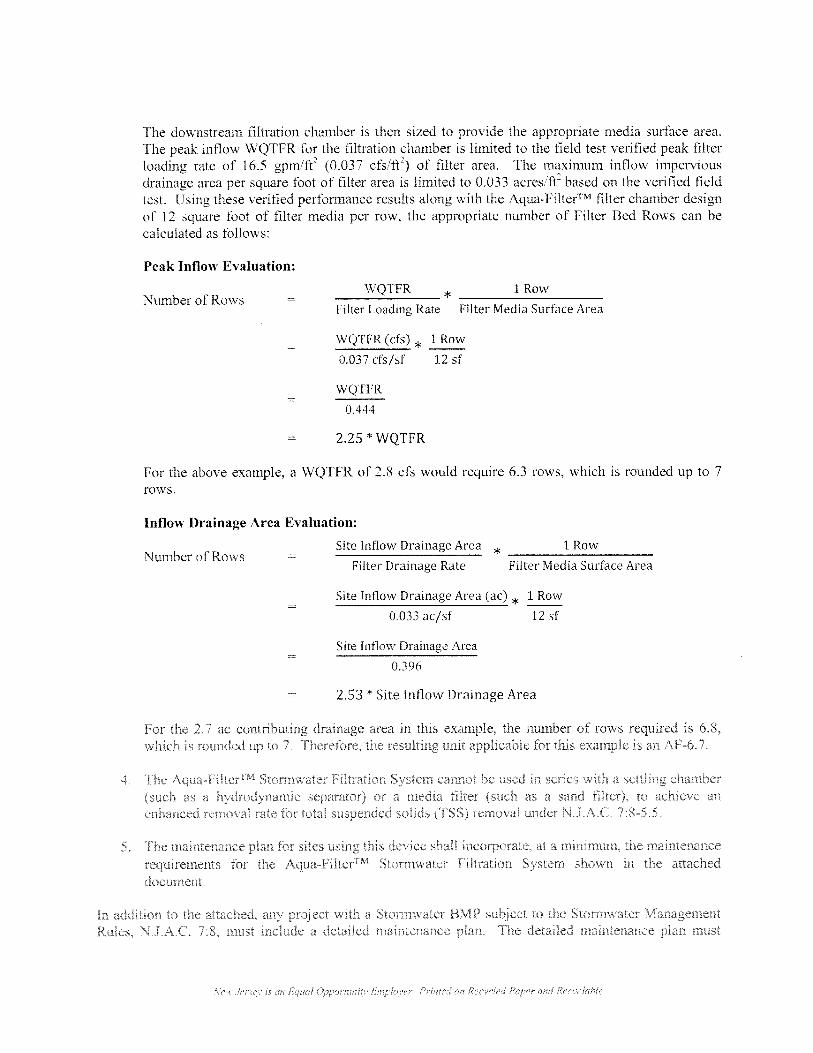
Page 1 of 18
© AquaShieldTM
, Inc. 2014. All rights reserved.
Aqua-Filter™
Stormwater Filtration System
Inspection and Maintenance Manual
AquaShieldTM, Inc. 2733 Kanasita Drive
Suite 111 Chattanooga, TN 37343 Toll free (888) 344-9044 Phone: (423) 870-8888
Fax: (423) 826-2112 Email: [email protected]
www.aquashieldinc.com
March 2014
Page 2 of 18
© AquaShieldTM
, Inc. 2014. All rights reserved.
Table of Contents
Page(s)
AquaShieldTM
Stormwater Treatment Systems 3
Aqua-FilterTM
Stormwater Treatment System 4 – 12
Inspection and Maintenance Worksheets 13 – 17
Aqua-FilterTM
Tabular Maintenance Schedule 18
AquaShieldTM
, Inc.
2733 Kanasita Drive
Suite 111
Chattanooga, Tennessee 37343
Toll free (888) 344-9044
(423) 870-8888
Fax (423) 826-2112
www.aquashieldinc.com
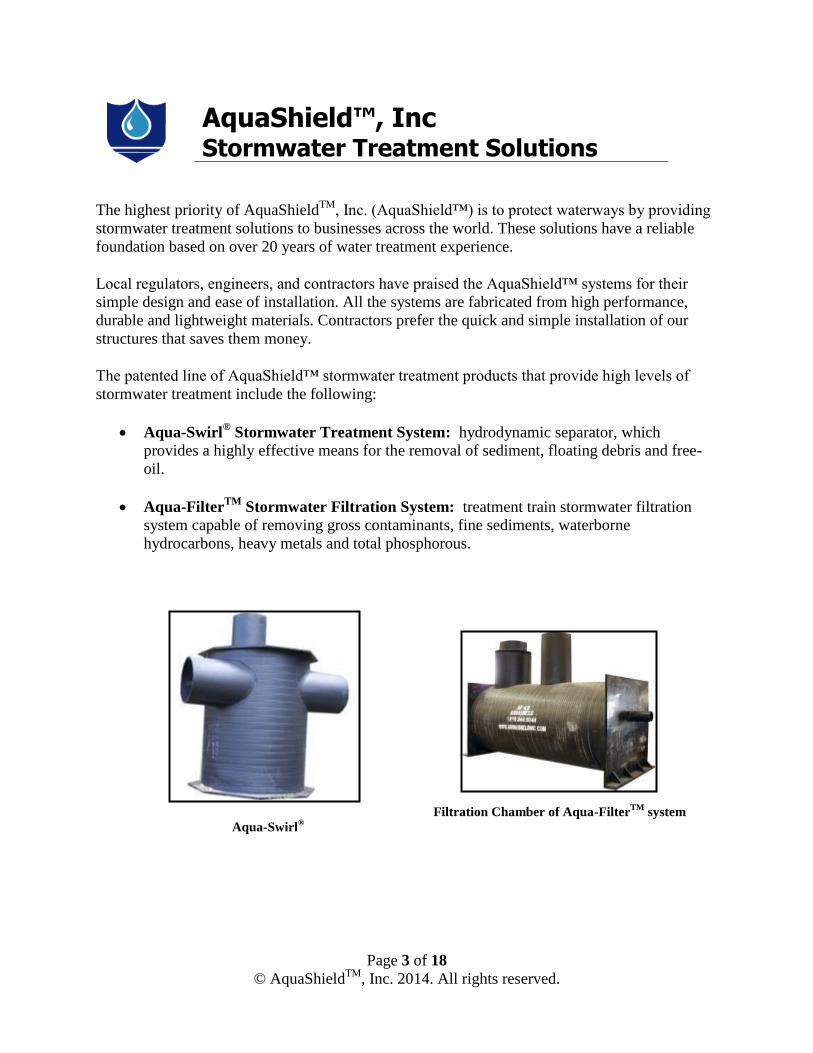
Page 3 of 18
© AquaShieldTM
, Inc. 2014. All rights reserved.
AquaShield™, Inc
Stormwater Treatment Solutions The highest priority of AquaShield
TM, Inc. (AquaShield™) is to protect waterways by providing
stormwater treatment solutions to businesses across the world. These solutions have a reliable
foundation based on over 20 years of water treatment experience.
Local regulators, engineers, and contractors have praised the AquaShield™ systems for their
simple design and ease of installation. All the systems are fabricated from high performance,
durable and lightweight materials. Contractors prefer the quick and simple installation of our
structures that saves them money.
The patented line of AquaShield™ stormwater treatment products that provide high levels of
stormwater treatment include the following:
Aqua-Swirl® Stormwater Treatment System: hydrodynamic separator, which
provides a highly effective means for the removal of sediment, floating debris and free-
oil.
Aqua-FilterTM
Stormwater Filtration System: treatment train stormwater filtration
system capable of removing gross contaminants, fine sediments, waterborne
hydrocarbons, heavy metals and total phosphorous.
Aqua-Swirl®
Filtration Chamber of Aqua-FilterTM
system
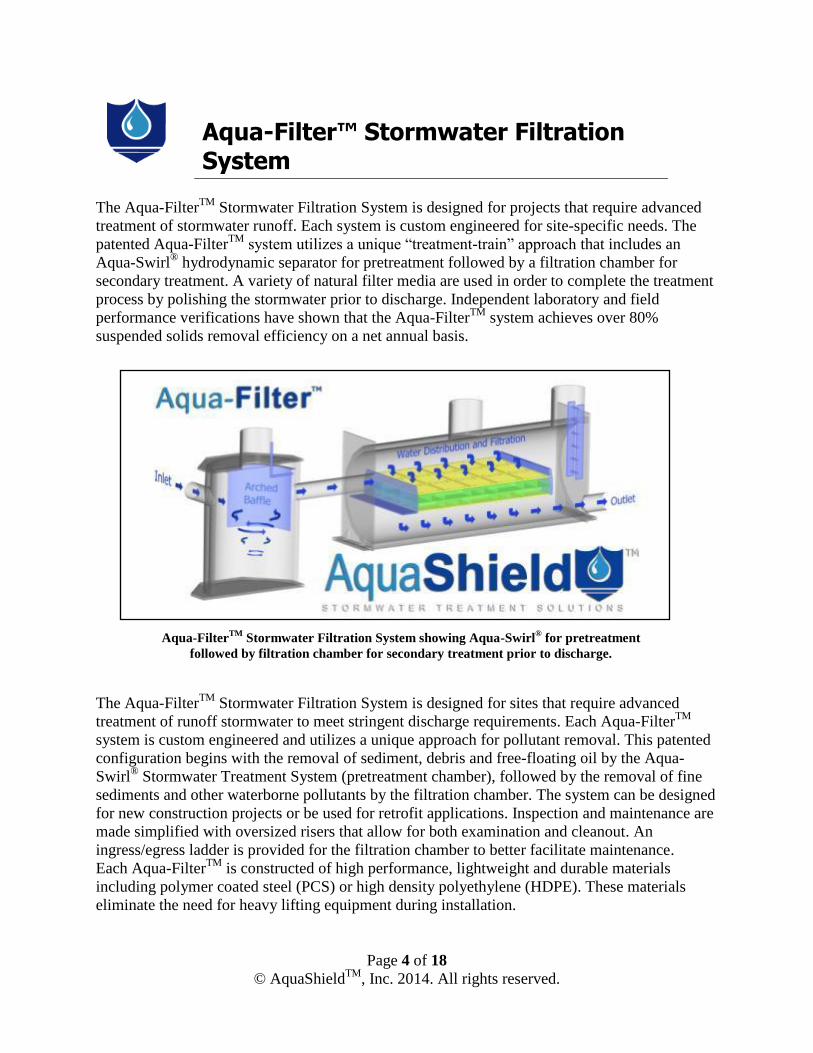
Page 4 of 18
© AquaShieldTM
, Inc. 2014. All rights reserved.
Aqua-Filter™ Stormwater Filtration System
The Aqua-Filter
TM Stormwater Filtration System is designed for projects that require advanced
treatment of stormwater runoff. Each system is custom engineered for site-specific needs. The
patented Aqua-FilterTM
system utilizes a unique “treatment-train” approach that includes an
Aqua-Swirl® hydrodynamic separator for pretreatment followed by a filtration chamber for
secondary treatment. A variety of natural filter media are used in order to complete the treatment
process by polishing the stormwater prior to discharge. Independent laboratory and field
performance verifications have shown that the Aqua-FilterTM
system achieves over 80%
suspended solids removal efficiency on a net annual basis.
The Aqua-FilterTM
Stormwater Filtration System is designed for sites that require advanced
treatment of runoff stormwater to meet stringent discharge requirements. Each Aqua-FilterTM
system is custom engineered and utilizes a unique approach for pollutant removal. This patented
configuration begins with the removal of sediment, debris and free-floating oil by the Aqua-
Swirl® Stormwater Treatment System (pretreatment chamber), followed by the removal of fine
sediments and other waterborne pollutants by the filtration chamber. The system can be designed
for new construction projects or be used for retrofit applications. Inspection and maintenance are
made simplified with oversized risers that allow for both examination and cleanout. An
ingress/egress ladder is provided for the filtration chamber to better facilitate maintenance.
Each Aqua-FilterTM
is constructed of high performance, lightweight and durable materials
including polymer coated steel (PCS) or high density polyethylene (HDPE). These materials
eliminate the need for heavy lifting equipment during installation.
Aqua-FilterTM
Stormwater Filtration System showing Aqua-Swirl® for pretreatment
followed by filtration chamber for secondary treatment prior to discharge.
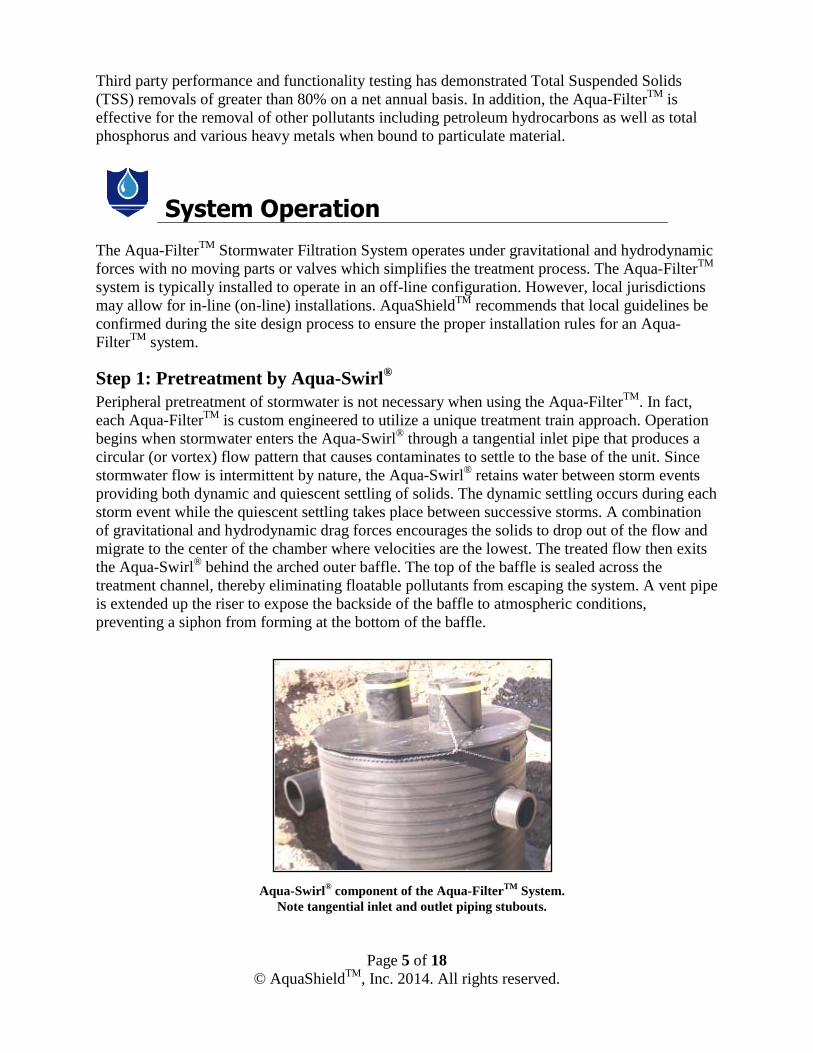
Page 5 of 18
© AquaShieldTM
, Inc. 2014. All rights reserved.
Third party performance and functionality testing has demonstrated Total Suspended Solids
(TSS) removals of greater than 80% on a net annual basis. In addition, the Aqua-FilterTM
is
effective for the removal of other pollutants including petroleum hydrocarbons as well as total
phosphorus and various heavy metals when bound to particulate material.
System Operation
The Aqua-FilterTM
Stormwater Filtration System operates under gravitational and hydrodynamic
forces with no moving parts or valves which simplifies the treatment process. The Aqua-FilterTM
system is typically installed to operate in an off-line configuration. However, local jurisdictions
may allow for in-line (on-line) installations. AquaShieldTM
recommends that local guidelines be
confirmed during the site design process to ensure the proper installation rules for an Aqua-
FilterTM
system.
Step 1: Pretreatment by Aqua-Swirl®
Peripheral pretreatment of stormwater is not necessary when using the Aqua-FilterTM
. In fact,
each Aqua-FilterTM
is custom engineered to utilize a unique treatment train approach. Operation
begins when stormwater enters the Aqua-Swirl® through a tangential inlet pipe that produces a
circular (or vortex) flow pattern that causes contaminates to settle to the base of the unit. Since
stormwater flow is intermittent by nature, the Aqua-Swirl® retains water between storm events
providing both dynamic and quiescent settling of solids. The dynamic settling occurs during each
storm event while the quiescent settling takes place between successive storms. A combination
of gravitational and hydrodynamic drag forces encourages the solids to drop out of the flow and
migrate to the center of the chamber where velocities are the lowest. The treated flow then exits
the Aqua-Swirl® behind the arched outer baffle. The top of the baffle is sealed across the
treatment channel, thereby eliminating floatable pollutants from escaping the system. A vent pipe
is extended up the riser to expose the backside of the baffle to atmospheric conditions,
preventing a siphon from forming at the bottom of the baffle.
Aqua-Swirl® component of the Aqua-Filter
TM System.
Note tangential inlet and outlet piping stubouts.
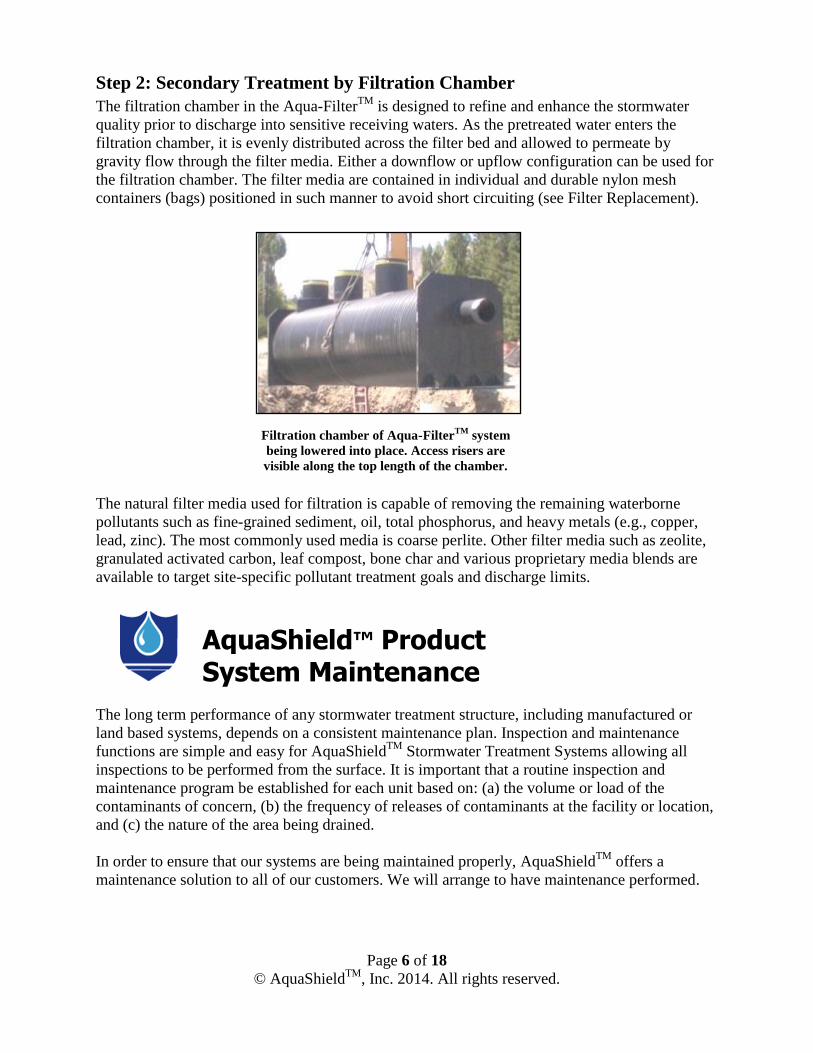
Page 6 of 18
© AquaShieldTM
, Inc. 2014. All rights reserved.
Step 2: Secondary Treatment by Filtration Chamber
The filtration chamber in the Aqua-FilterTM
is designed to refine and enhance the stormwater
quality prior to discharge into sensitive receiving waters. As the pretreated water enters the
filtration chamber, it is evenly distributed across the filter bed and allowed to permeate by
gravity flow through the filter media. Either a downflow or upflow configuration can be used for
the filtration chamber. The filter media are contained in individual and durable nylon mesh
containers (bags) positioned in such manner to avoid short circuiting (see Filter Replacement).
The natural filter media used for filtration is capable of removing the remaining waterborne
pollutants such as fine-grained sediment, oil, total phosphorus, and heavy metals (e.g., copper,
lead, zinc). The most commonly used media is coarse perlite. Other filter media such as zeolite,
granulated activated carbon, leaf compost, bone char and various proprietary media blends are
available to target site-specific pollutant treatment goals and discharge limits.
AquaShield™ Product System Maintenance
The long term performance of any stormwater treatment structure, including manufactured or
land based systems, depends on a consistent maintenance plan. Inspection and maintenance
functions are simple and easy for AquaShieldTM
Stormwater Treatment Systems allowing all
inspections to be performed from the surface. It is important that a routine inspection and
maintenance program be established for each unit based on: (a) the volume or load of the
contaminants of concern, (b) the frequency of releases of contaminants at the facility or location,
and (c) the nature of the area being drained.
In order to ensure that our systems are being maintained properly, AquaShieldTM
offers a
maintenance solution to all of our customers. We will arrange to have maintenance performed.
Filtration chamber of Aqua-FilterTM
system
being lowered into place. Access risers are
visible along the top length of the chamber.
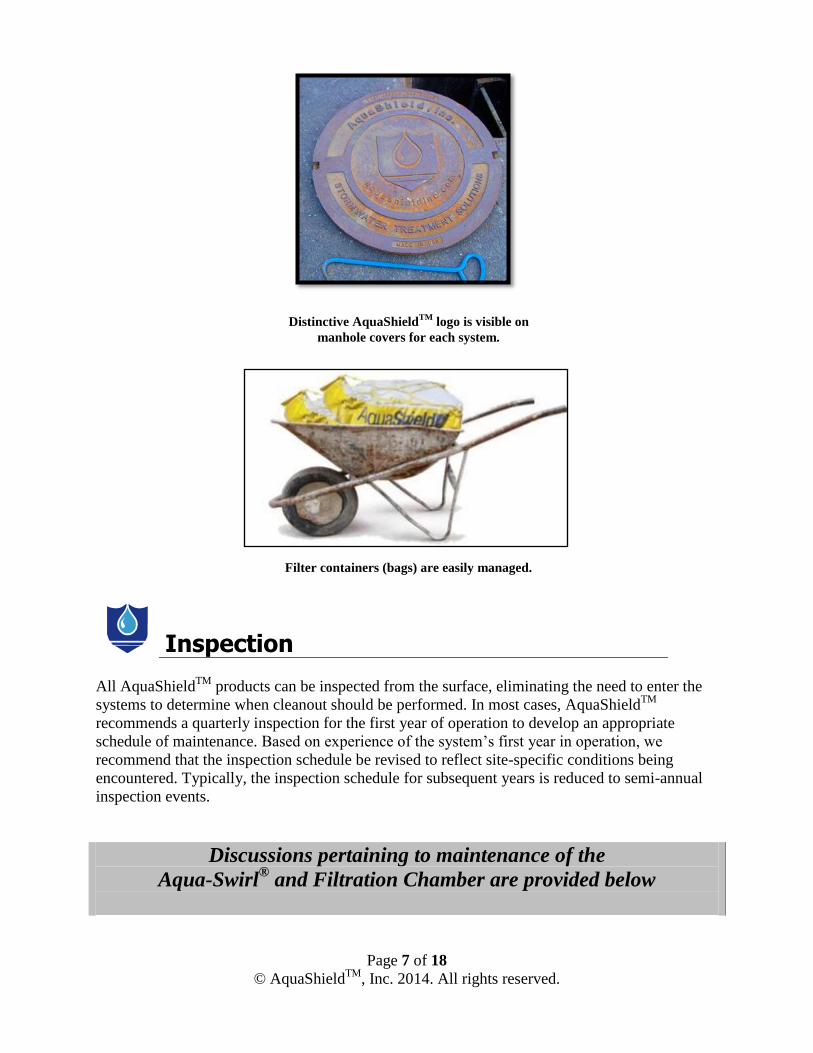
Page 7 of 18
© AquaShieldTM
, Inc. 2014. All rights reserved.
Inspection
All AquaShield
TM products can be inspected from the surface, eliminating the need to enter the
systems to determine when cleanout should be performed. In most cases, AquaShieldTM
recommends a quarterly inspection for the first year of operation to develop an appropriate
schedule of maintenance. Based on experience of the system’s first year in operation, we
recommend that the inspection schedule be revised to reflect site-specific conditions being
encountered. Typically, the inspection schedule for subsequent years is reduced to semi-annual
inspection events.
Discussions pertaining to maintenance of the
Aqua-Swirl® and Filtration Chamber are provided below
Distinctive AquaShieldTM
logo is visible on
manhole covers for each system.
Filter containers (bags) are easily managed.
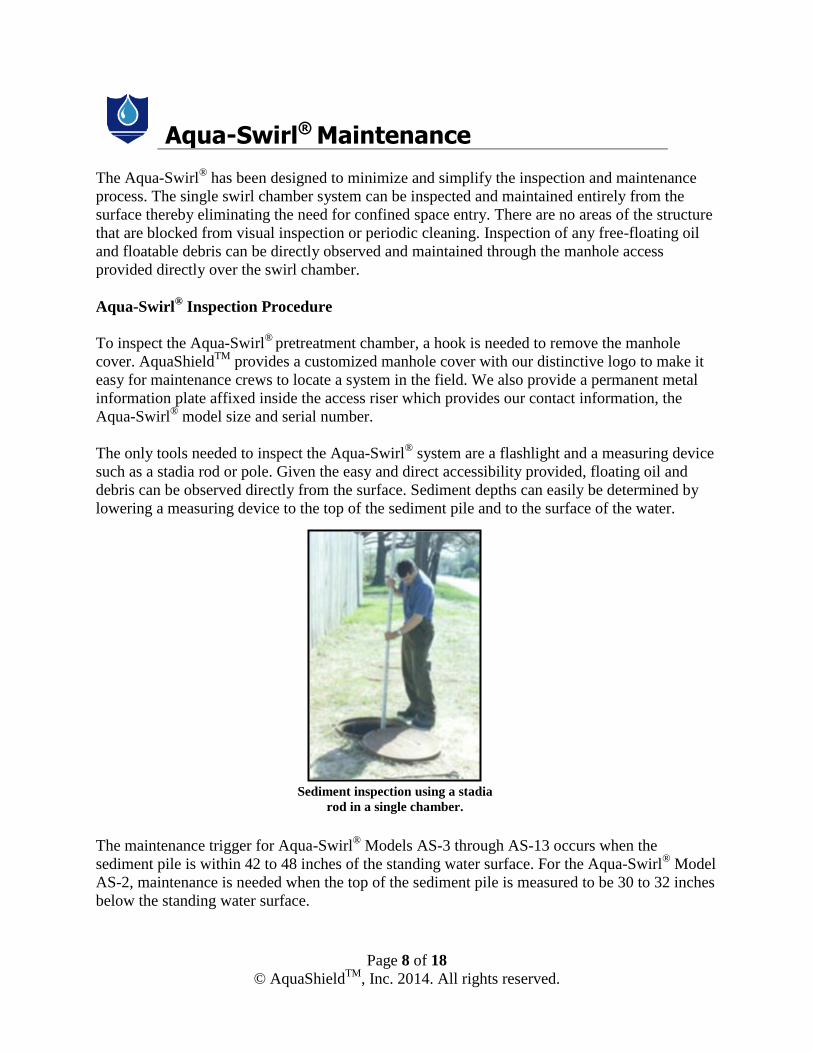
Page 8 of 18
© AquaShieldTM
, Inc. 2014. All rights reserved.
Sediment inspection using a stadia
rod in a single chamber.
Aqua-Swirl® Maintenance
The Aqua-Swirl
® has been designed to minimize and simplify the inspection and maintenance
process. The single swirl chamber system can be inspected and maintained entirely from the
surface thereby eliminating the need for confined space entry. There are no areas of the structure
that are blocked from visual inspection or periodic cleaning. Inspection of any free-floating oil
and floatable debris can be directly observed and maintained through the manhole access
provided directly over the swirl chamber.
Aqua-Swirl® Inspection Procedure
To inspect the Aqua-Swirl®
pretreatment chamber, a hook is needed to remove the manhole
cover. AquaShieldTM
provides a customized manhole cover with our distinctive logo to make it
easy for maintenance crews to locate a system in the field. We also provide a permanent metal
information plate affixed inside the access riser which provides our contact information, the
Aqua-Swirl® model size and serial number.
The only tools needed to inspect the Aqua-Swirl® system are a flashlight and a measuring device
such as a stadia rod or pole. Given the easy and direct accessibility provided, floating oil and
debris can be observed directly from the surface. Sediment depths can easily be determined by
lowering a measuring device to the top of the sediment pile and to the surface of the water.
The maintenance trigger for Aqua-Swirl® Models AS-3 through AS-13 occurs when the
sediment pile is within 42 to 48 inches of the standing water surface. For the Aqua-Swirl® Model
AS-2, maintenance is needed when the top of the sediment pile is measured to be 30 to 32 inches
below the standing water surface.
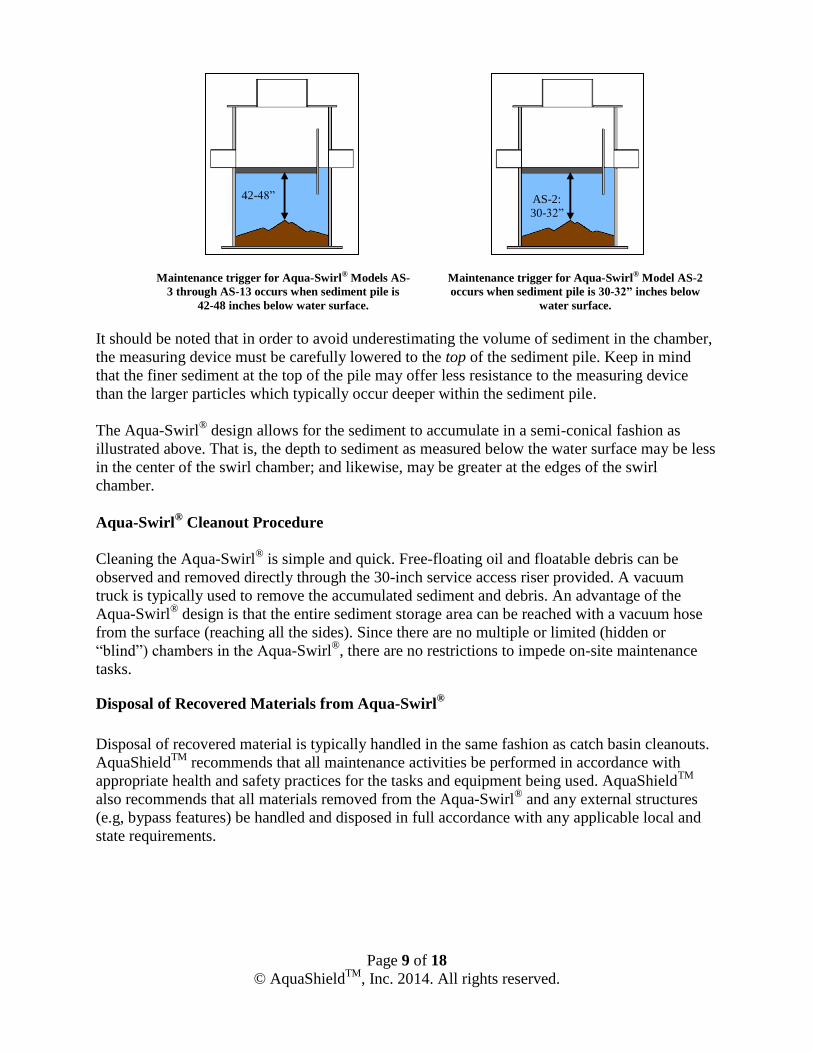
Page 9 of 18
© AquaShieldTM
, Inc. 2014. All rights reserved.
Maintenance trigger for Aqua-Swirl® Models AS-
3 through AS-13 occurs when sediment pile is
42-48 inches below water surface.
Maintenance trigger for Aqua-Swirl® Model AS-2
occurs when sediment pile is 30-32” inches below
water surface.
It should be noted that in order to avoid underestimating the volume of sediment in the chamber,
the measuring device must be carefully lowered to the top of the sediment pile. Keep in mind
that the finer sediment at the top of the pile may offer less resistance to the measuring device
than the larger particles which typically occur deeper within the sediment pile.
The Aqua-Swirl® design allows for the sediment to accumulate in a semi-conical fashion as
illustrated above. That is, the depth to sediment as measured below the water surface may be less
in the center of the swirl chamber; and likewise, may be greater at the edges of the swirl
chamber.
Aqua-Swirl® Cleanout Procedure
Cleaning the Aqua-Swirl® is simple and quick. Free-floating oil and floatable debris can be
observed and removed directly through the 30-inch service access riser provided. A vacuum
truck is typically used to remove the accumulated sediment and debris. An advantage of the
Aqua-Swirl® design is that the entire sediment storage area can be reached with a vacuum hose
from the surface (reaching all the sides). Since there are no multiple or limited (hidden or
“blind”) chambers in the Aqua-Swirl®, there are no restrictions to impede on-site maintenance
tasks.
Disposal of Recovered Materials from Aqua-Swirl®
Disposal of recovered material is typically handled in the same fashion as catch basin cleanouts.
AquaShieldTM
recommends that all maintenance activities be performed in accordance with
appropriate health and safety practices for the tasks and equipment being used. AquaShieldTM
also recommends that all materials removed from the Aqua-Swirl® and any external structures
(e.g, bypass features) be handled and disposed in full accordance with any applicable local and
state requirements.
42-48” AS-2:
30-32”
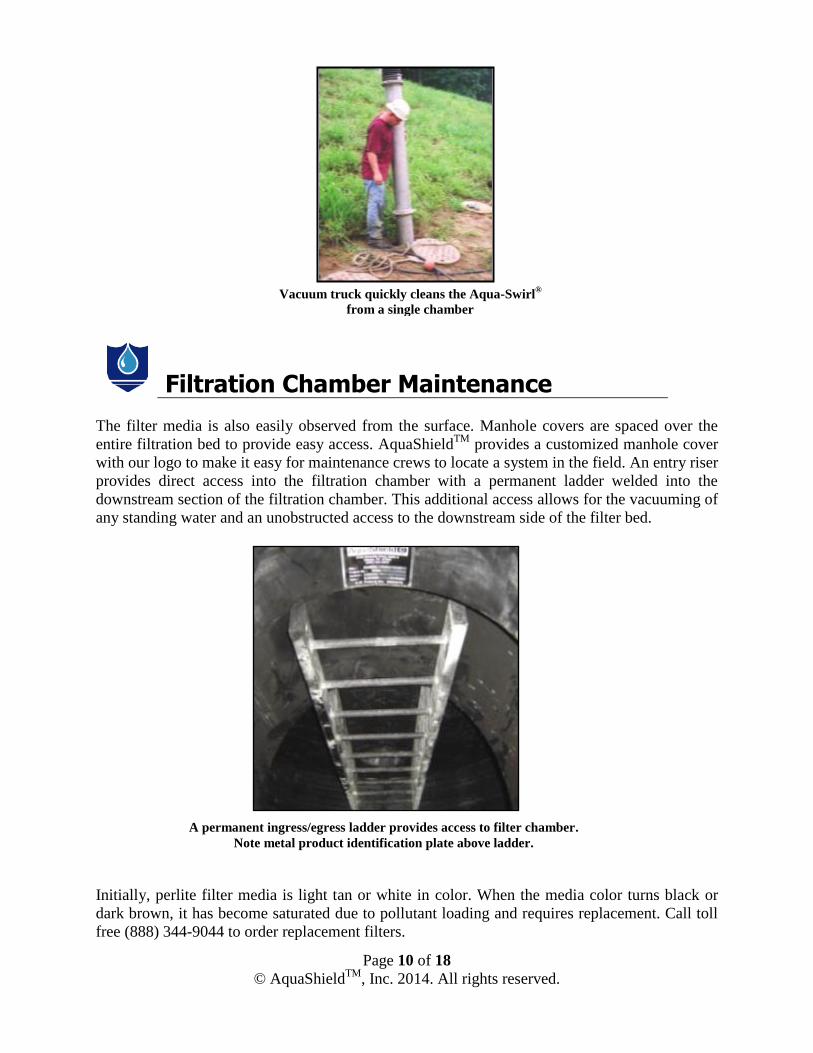
Page 10 of 18
© AquaShieldTM
, Inc. 2014. All rights reserved.
Vacuum truck quickly cleans the Aqua-Swirl®
from a single chamber
A permanent ingress/egress ladder provides access to filter chamber.
Note metal product identification plate above ladder.
Filtration Chamber Maintenance
The filter media is also easily observed from the surface. Manhole covers are spaced over the
entire filtration bed to provide easy access. AquaShieldTM
provides a customized manhole cover
with our logo to make it easy for maintenance crews to locate a system in the field. An entry riser
provides direct access into the filtration chamber with a permanent ladder welded into the
downstream section of the filtration chamber. This additional access allows for the vacuuming of
any standing water and an unobstructed access to the downstream side of the filter bed.
Initially, perlite filter media is light tan or white in color. When the media color turns black or
dark brown, it has become saturated due to pollutant loading and requires replacement. Call toll
free (888) 344-9044 to order replacement filters.

Page 11 of 18
© AquaShieldTM
, Inc. 2014. All rights reserved.
Spent filter media can often be recycled or sent to a
permitted lined landfill. Always check local regulations to
ensure proper disposal of spent filter media.
Replacement of the filtration media typically requires entry into the filtration chamber by one of
a two-member maintenance crew. Confined space entry methods should be followed by the
maintenance crew when removing and replacing the filters. The spent filter containers are
normally retrieved from the filter chamber by a second crewmember at the surface through the
multiple 30-inch risers spaced across the top of the filter bed. In addition, the filter containers can
be accessed directly from within the filtration chamber via a vertical removable panel (bulkhead
door) at the rear of the filter bed and directly across from the ladder.
Filter Media Disposal
Disposal of recovered material is typically handled in the same fashion as catch basin cleanouts.
AquaShieldTM
recommends that all maintenance activities be performed in accordance with
appropriate health and safety practices for the tasks and equipment being used. AquaShieldTM
also recommends that all materials removed from the Aqua-Swirl® and any external structures
(e.g, bypass features) be handled and disposed in full accordance with any applicable local and
state requirements.
Filter Media Replacement
Instructions and photographs are provided on page 12 showing the procedures to follow to install
fresh filter media containers. The bottom of two courses is placed on the fiberglass grates. Cargo
netting is used across the top course of the filter containers to secure them in place.
Cargo Netting Installation
Cargo netting is used to secure filter containers in place after containers are installed in the
appropriate orientation within the filtration chamber. Cargo netting is placed on top of the top
course of filter containers and stretched into place using provided heavy duty cable ties. The
netting is cable tied to anchor blocks and attached to the side walls of the filtration chamber. It is
important to install the netting in such a way as to both cover the entire surface area of the
containers while stretching netting snuggly to minimize container movement under high flow
conditions. Netting installation is complete when all surface area of filter containers are covered
with netting and netting is secured with cable ties to anchor blocks.
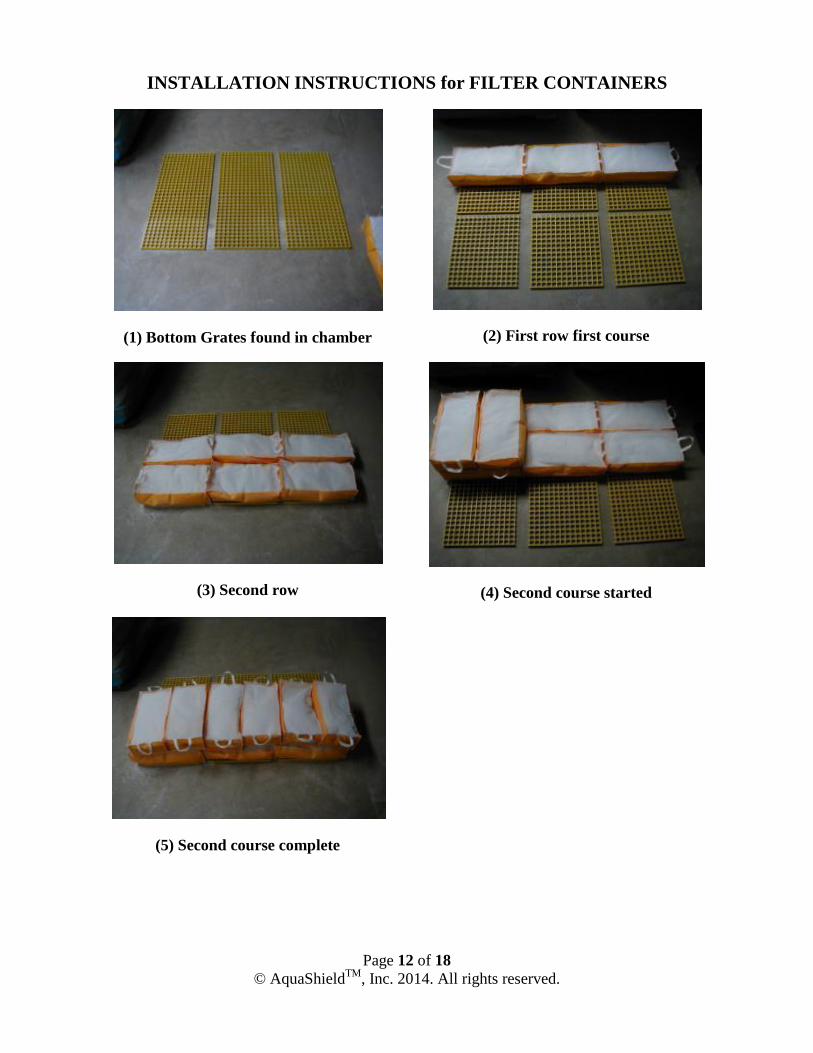
Page 12 of 18
© AquaShieldTM
, Inc. 2014. All rights reserved.
INSTALLATION INSTRUCTIONS for FILTER CONTAINERS
(1) Bottom Grates found in chamber
(2) First row first course
(3) Second row
(4) Second course started
(5) Second course complete

Page 13 of 18
© AquaShieldTM
, Inc. 2014. All rights reserved.
Aqua-FilterTM
Inspection and Maintenance Manual
Work Sheets
SITE and OWNER INFORMATION
Site Name:
Site Location:
Date: Time:
Inspector Name:
Inspector Company: Phone #:
Owner Name:
Owner Address:
Owner Phone #: Emergency Phone #:
INSPECTION Note: Aqua-Filter
TM system is a treatment train including Aqua-Swirl
® pretreatment hydrodynamic
separator and filtration chamber.
I. Floatable Debris and Oil in Aqua-Swirl®
1. Remove manhole lid to expose liquid surface of the Aqua-Swirl®.
2. Remove floatable debris with basket or net if any present.
3. If oil is present, measure its depth. Clean liquids from system if one half (½) inch or more
oil is present.
Note: Water in Aqua-Swirl® can appear black and similar to oil due to the dark body of
the surrounding structure. Oil may appear darker than water in the system and is usually
accompanied by oil stained debris (e.g. Styrofoam, etc.). The depth of oil can be
measured with an oil/water interface probe, a stadia rod with water finding paste, a
coliwasa, or collect a representative sample with a jar attached to a rod.
II. Sediment Accumulation in Aqua-Swirl®
1. Lower measuring device (e.g. stadia rod) into swirl chamber through service access
provided until top of sediment pile is reached
2. Record distance to top of sediment pile from top of standing water: inches
3. For Aqua-Swirl® Models AS-3 through AS-13, schedule cleaning if value in Step #2 is
48 to 42 inches or less.
4. For Aqua-Swirl® Model AS-2, schedule cleaning if value in Step #2 is 32 to 30 inches or
less.
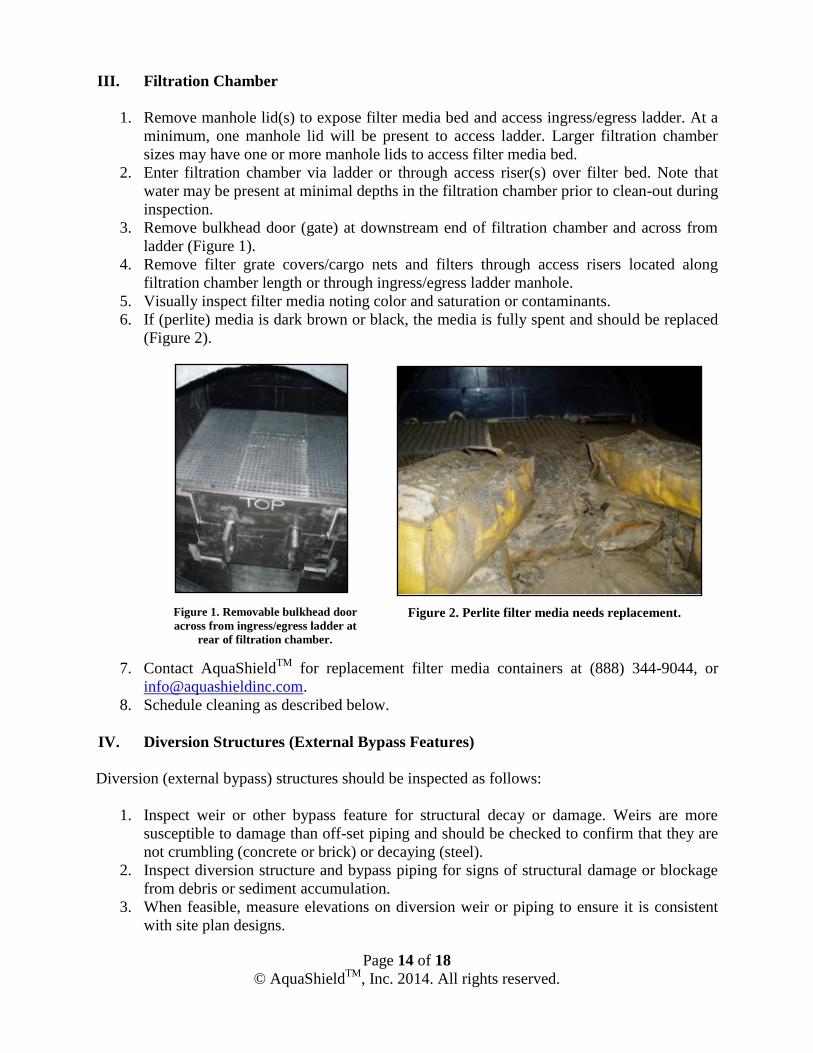
Page 14 of 18
© AquaShieldTM
, Inc. 2014. All rights reserved.
III. Filtration Chamber
1. Remove manhole lid(s) to expose filter media bed and access ingress/egress ladder. At a
minimum, one manhole lid will be present to access ladder. Larger filtration chamber
sizes may have one or more manhole lids to access filter media bed.
2. Enter filtration chamber via ladder or through access riser(s) over filter bed. Note that
water may be present at minimal depths in the filtration chamber prior to clean-out during
inspection.
3. Remove bulkhead door (gate) at downstream end of filtration chamber and across from
ladder (Figure 1).
4. Remove filter grate covers/cargo nets and filters through access risers located along
filtration chamber length or through ingress/egress ladder manhole.
5. Visually inspect filter media noting color and saturation or contaminants.
6. If (perlite) media is dark brown or black, the media is fully spent and should be replaced
(Figure 2).
7. Contact AquaShieldTM
for replacement filter media containers at (888) 344-9044, or
8. Schedule cleaning as described below.
IV. Diversion Structures (External Bypass Features)
Diversion (external bypass) structures should be inspected as follows:
1. Inspect weir or other bypass feature for structural decay or damage. Weirs are more
susceptible to damage than off-set piping and should be checked to confirm that they are
not crumbling (concrete or brick) or decaying (steel).
2. Inspect diversion structure and bypass piping for signs of structural damage or blockage
from debris or sediment accumulation.
3. When feasible, measure elevations on diversion weir or piping to ensure it is consistent
with site plan designs.
Figure 1. Removable bulkhead door
across from ingress/egress ladder at
rear of filtration chamber.
Figure 2. Perlite filter media needs replacement.
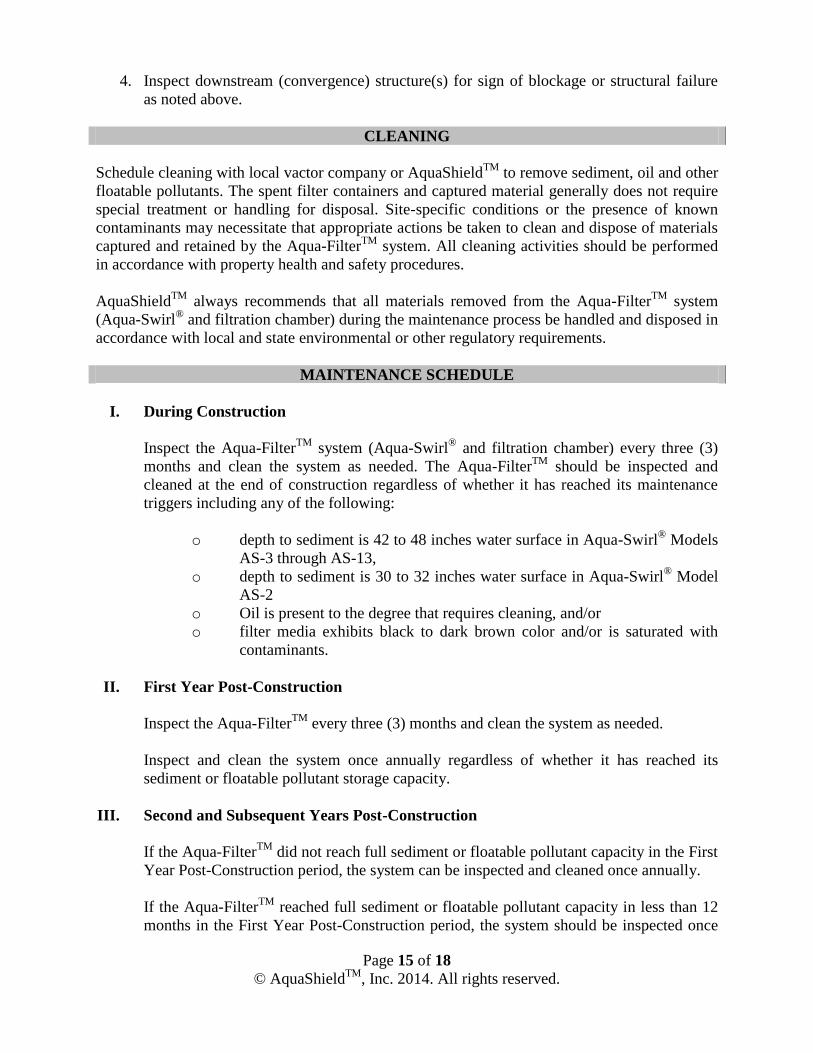
Page 15 of 18
© AquaShieldTM
, Inc. 2014. All rights reserved.
4. Inspect downstream (convergence) structure(s) for sign of blockage or structural failure
as noted above.
CLEANING
Schedule cleaning with local vactor company or AquaShieldTM
to remove sediment, oil and other
floatable pollutants. The spent filter containers and captured material generally does not require
special treatment or handling for disposal. Site-specific conditions or the presence of known
contaminants may necessitate that appropriate actions be taken to clean and dispose of materials
captured and retained by the Aqua-FilterTM
system. All cleaning activities should be performed
in accordance with property health and safety procedures.
AquaShieldTM
always recommends that all materials removed from the Aqua-FilterTM
system
(Aqua-Swirl® and filtration chamber) during the maintenance process be handled and disposed in
accordance with local and state environmental or other regulatory requirements.
MAINTENANCE SCHEDULE
I. During Construction
Inspect the Aqua-FilterTM
system (Aqua-Swirl®
and filtration chamber) every three (3)
months and clean the system as needed. The Aqua-FilterTM
should be inspected and
cleaned at the end of construction regardless of whether it has reached its maintenance
triggers including any of the following:
o depth to sediment is 42 to 48 inches water surface in Aqua-Swirl® Models
AS-3 through AS-13,
o depth to sediment is 30 to 32 inches water surface in Aqua-Swirl® Model
AS-2
o Oil is present to the degree that requires cleaning, and/or
o filter media exhibits black to dark brown color and/or is saturated with
contaminants.
II. First Year Post-Construction
Inspect the Aqua-FilterTM
every three (3) months and clean the system as needed.
Inspect and clean the system once annually regardless of whether it has reached its
sediment or floatable pollutant storage capacity.
III. Second and Subsequent Years Post-Construction
If the Aqua-FilterTM
did not reach full sediment or floatable pollutant capacity in the First
Year Post-Construction period, the system can be inspected and cleaned once annually.
If the Aqua-FilterTM
reached full sediment or floatable pollutant capacity in less than 12
months in the First Year Post-Construction period, the system should be inspected once

Page 16 of 18
© AquaShieldTM
, Inc. 2014. All rights reserved.
every six (6) months and cleaned as needed. The Aqua-FilterTM
should be cleaned
annually regardless of whether it reaches its sediment or floatable pollutant capacity.
IV. Bypass Structures
Bypass structures should be inspected whenever the Aqua-FilterTM
is inspected.
Maintenance should be performed on bypass structures as needed.
MAINTENANCE COMPANY INFORMATION
Company Name:
Street Address:
City: State/Prov.: Zip/Postal Code:
Contact: Title:
Office Phone: Cell Phone:
ACTIVITY LOG
Date of Cleaning: (Next inspection should be 3 months from
this data for first year).
Time of Cleaning: Start: End:
Date of Next Inspection:
Floatable debris present in Aqua-Swirl®: Yes No
Notes:
Oil present in Aqua-Swirl®
: Yes No Oil depth (inches):
Measurement method and notes:
Filter Media Needs Replacement: Yes No
Filter grate / cargo netting needs repair/replacement: Yes No

Page 17 of 18
© AquaShieldTM
, Inc. 2014. All rights reserved.
Number of Filter Containers (bags) needing replacement:
Type of Filter Media: Perlite Other(s):
Other Filtration Chamber Needs and Observations:
STRUCTURAL CONDITIONS and OBSERVATIONS
Structural damage: Yes No Where:
Structural wear: Yes No Where:
Odors present: Yes No Describe:
Clogging: Yes No Describe:
Other Observations:
NOTES
Additional Comments and/or Actions To Be Taken Time Frame
ATTACHMENTS
Attach site plan showing Aqua-FilterTM
location.
Attach detail drawing showing Aqua-FilterTM
dimensions and model number.
Attach details showing basic design and elevations (where feasible) of diversion
configuration.
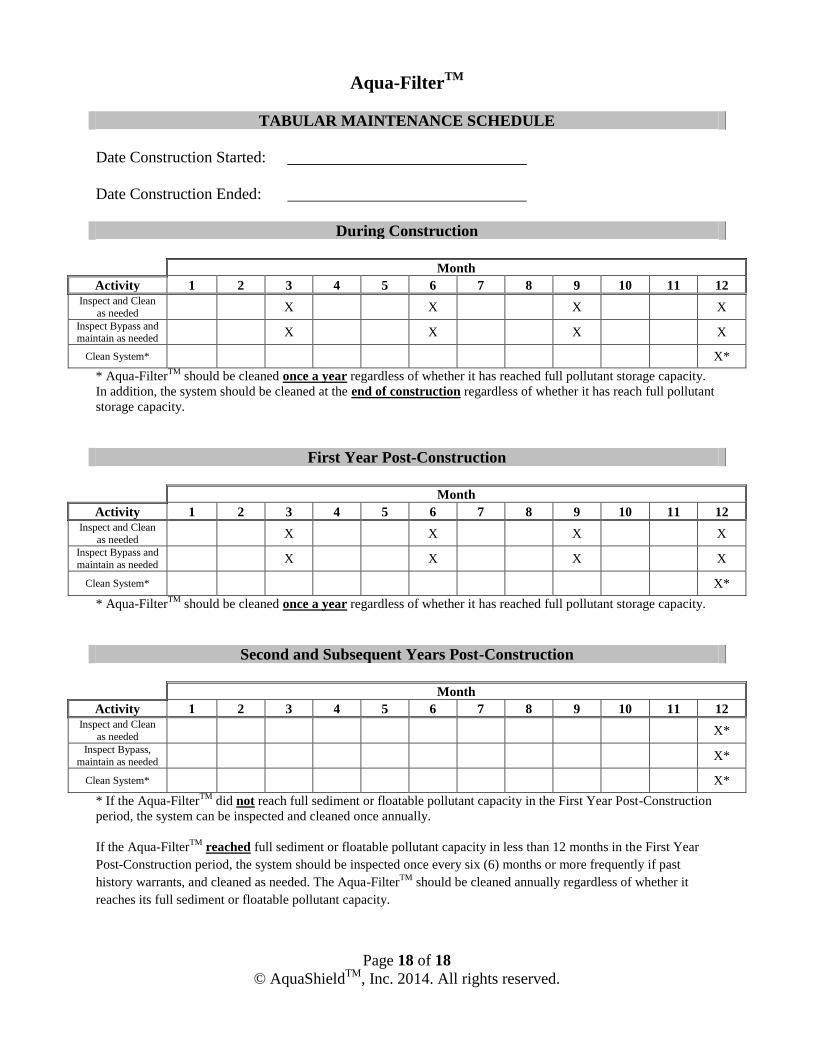
Page 18 of 18
© AquaShieldTM
, Inc. 2014. All rights reserved.
Aqua-FilterTM
TABULAR MAINTENANCE SCHEDULE
Date Construction Started:
Date Construction Ended:
During Construction
Month
Activity 1 2 3 4 5 6 7 8 9 10 11 12 Inspect and Clean
as needed X X X X
Inspect Bypass and maintain as needed X X X X
Clean System* X*
* Aqua-FilterTM
should be cleaned once a year regardless of whether it has reached full pollutant storage capacity.
In addition, the system should be cleaned at the end of construction regardless of whether it has reach full pollutant
storage capacity.
First Year Post-Construction
Month
Activity 1 2 3 4 5 6 7 8 9 10 11 12 Inspect and Clean
as needed X X X X
Inspect Bypass and
maintain as needed X X X X
Clean System* X*
* Aqua-FilterTM
should be cleaned once a year regardless of whether it has reached full pollutant storage capacity.
Second and Subsequent Years Post-Construction
Month
Activity 1 2 3 4 5 6 7 8 9 10 11 12 Inspect and Clean
as needed X*
Inspect Bypass,
maintain as needed X*
Clean System* X*
* If the Aqua-FilterTM
did not reach full sediment or floatable pollutant capacity in the First Year Post-Construction
period, the system can be inspected and cleaned once annually.
If the Aqua-FilterTM
reached full sediment or floatable pollutant capacity in less than 12 months in the First Year
Post-Construction period, the system should be inspected once every six (6) months or more frequently if past
history warrants, and cleaned as needed. The Aqua-FilterTM
should be cleaned annually regardless of whether it
reaches its full sediment or floatable pollutant capacity.
W:\Limited Warranty\AquaShield - Limited Warranty 8-12.docx August 6, 2012
LIMITED WARRANTY
WARRANTY: AquaShield, Inc., warrants its products against failure due to improper
workmanship or defective materials, for a period of twelve (12) months from delivery date;
provided, however, that AquaShield, Inc.’s, liability shall be limited to the least of the following:
(1) the cost to repair such product; (2) the cost to replace the product; or (3) the purchase price of
the product. If the product is replaced, such replacement shall be F.O.B. point of manufacture
with freight allowed. In no case shall the cost of dismantling or installation be covered. In no
event shall AquaShield, Inc., be liable for any other damages, including, but not limited to,
consequential or incidental damages or loss of income. AquaShield, Inc., makes no warranty
express or implied as to the merchantablity or fitness for any particular purpose of the property
sold subject to this Limited Warranty.
Except as expressed in this section, AquaShield, Inc., makes no warranties, express or implied.
AquaShield, Inc.’s liability shall be limited to the warranties expressed herein, and AquaShield,
Inc., shall not be liable for any direct or consequential damages, including loss of use, which
customers may suffer.
This Limited Warranty shall not apply to any products which are abused or misused.
Independent Sales Agent is not and cannot represent itself as an employee of AquaShield, Inc.,
and shall not make any representations or warranties on behalf of AquaShield, Inc. Independent
Sales Agent will not assume or create any obligation on behalf of AquaShield, Inc., other than as
evidenced by this Limited Warranty.
This Limited Warranty shall be construed and interpreted in accordance with the laws of the
State of Tennessee, and any claim or cause of action relating to any of AquaShield’s products or
installations shall be brought in a state of federal court in Hamilton County, Tennessee, and the
parties agree that the exclusive venue for any such action shall be in said courts.
2
705
Ka
na
sita
Dri
ve, • C
ha
ttan
ooga
, T
N 3
73
43
• P
hon
e (4
23
) 870
-88
88
• F
ax
(4
23
) 826
-21
12
• w
ww
.aq
uash
ield
inc.c
om