Embed Size (px)
Citation preview
FINAL REPORT
ATS4 RANGING RECEIVER AND
LBAND EXPERIMENT
VOLUME I
APPLICATIONS TECHNOLOGY SATELLITE PROGRAM CONTRACT N A S 5-21019
SEPTEMBER 1971
PREPARED FOR
NATIONAL AERONAUTICS AND SPACE ADMINISTRATION G O D D A R D SPACE FLIGHT CENTER
GREENBELT, M A R Y L A N D
PREPARED B Y
WESTINGHOUSE ELECTRIC CORPORATION DEFENSE AND SPACE CENTER
BALTIMORE, M A R Y L A N D
https://ntrs.nasa.gov/search.jsp?R=19740003317 2018-07-08T22:17:43+00:00Z
I . Report No.
I 1. T i t l e and Subtitle
FINAL REPORT ATS-5 RANGING RECEIVER AND L-BAND EXPERIMENT VOLUME I
2. Government Accession No.
7. Author(s)
9. Security Classif . (of th is report) 20. Security Classif. (of th is page)
?. Performing Organization Name and Address Westinghouse Electric Corporation Defense and Space Center Baltimore, Maryland 21203
2. Sponsoring Agency Name and Address
NASA/GSFC Greenbelt, Maryland
21. No. of Pages 22. Price.
5. Supplementary Notes
U
3. Recipient's Cotalog No.
U 56
5. Report Date
September 1971 6. Performing Organization Code
8. Performing Organization Report No
10. Work Uni t No.
11. Contract or Grant No.
NAS 5-21019 13. Type of Report and Period Covered
Final
14. Sponsoring Agency Code
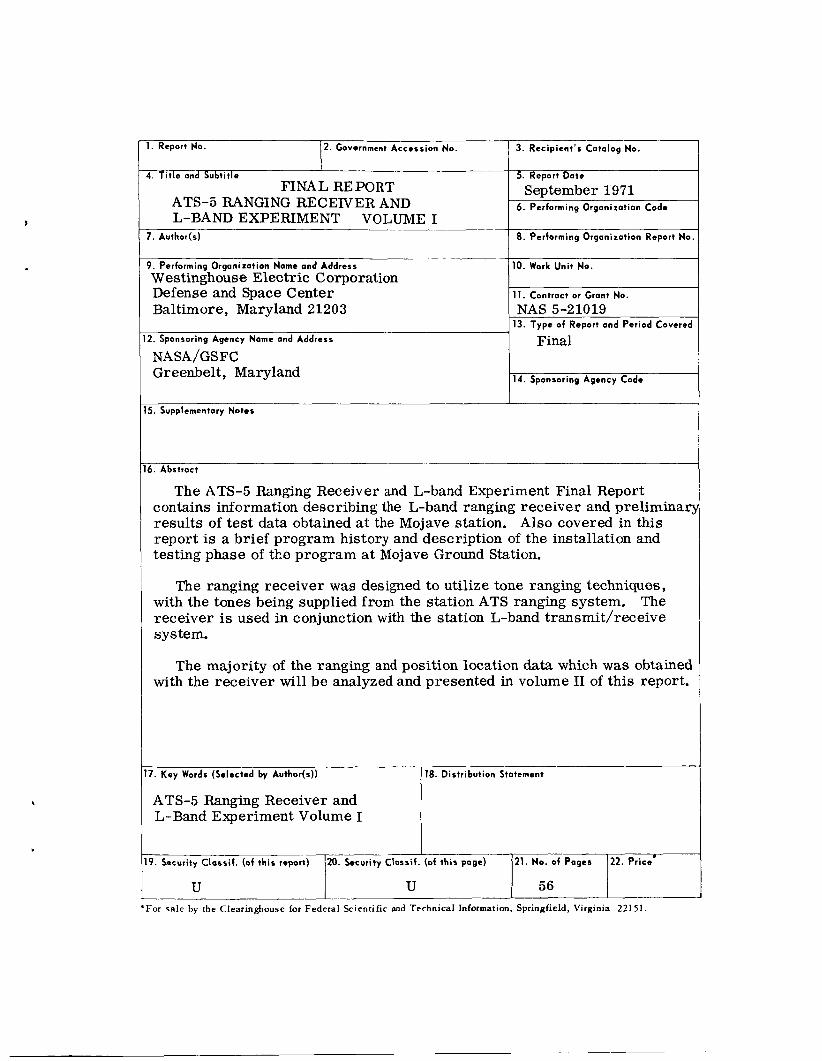
6. Abstract
The ATS-5 Ranging Receiver and L-band Experiment Final Report contains information describing the L-band ranging receiver and preliminar results of test data obtained at the Mojave station. Also covered in this report is a brief program history and description of the installation and testing phase of the program at Mojave Ground Station.
The ranging receiver was designed to utilize tone ranging techniques, with the tones being supplied from the station ATS ranging system. The receiver is used in conjunction with the station L-band transmit/receive s y s tem.
The majority of the ranging and position location data which was obtained with the receiver will be analyzed and presented in volume I1 of this report.
7. Key Words (Selected by Author(s)) 118. Distribution Statement
ATS-5 Ranging Receiver and L-Band Experiment Volume I
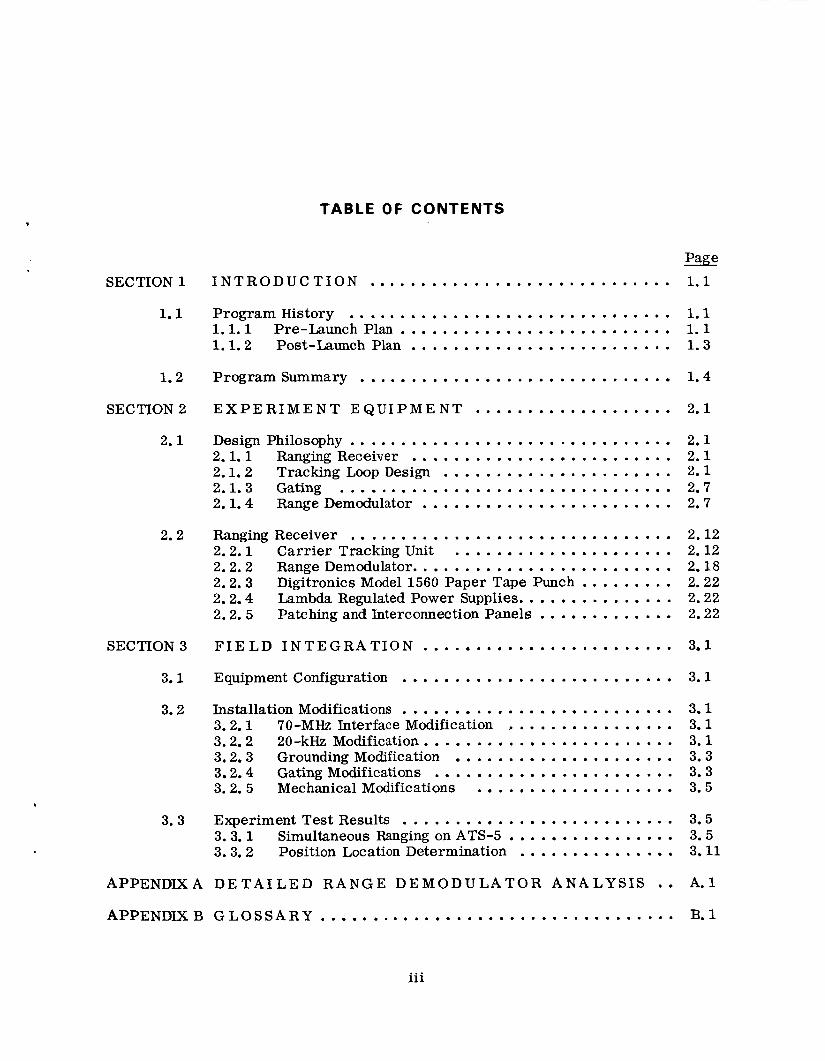
TABLE OF CONTENTS
.
Page SECTION 1 I N T R O D U C T I O N ............................. 1.1
1.1 Program History ............................... 1.1 1.1.1 Pre.LaunchP1a.n .......................... 1.1 1.1.2 Post-Launch Plan ......................... 1.3
1.2 Program Summary .............................. 1.4
SECTION2 E X P E R I M E N T E Q U I P M E N T ................... 2.1
2.1 Design Philosophy ............................... 2.1 2.1.1 Ranging Receiver ......................... 2.1 2.1.2 Tracking Loop Design ...................... 2.1 2.1.3 Gating ................................ 2.7 2.1.4 Range Demodulator ........................ 2.7
2.2 Ranging Receiver ............................... 2.12 2.2.1 Carr ie r Tracking Unit ..................... 2.12 2.2.2 Range Demodulator ......................... 2.18 2.2.3 Digitronics Model 1560 Paper Tape Punch ......... 2.22 2.2.4 Lambda Regulated Power Supplies ............... 2.22 2.2.5 Patching and Interconnection Panels ............. 2.22
SECTION3 F I E L D I N T E G R A T I O N ........................ 3.1
3.1 Equipment Configuration .......................... 3.1
3.2 Installation Modifications .......................... 3.1 3.2.1 70-MHz Interface Modification ................ 3.1 3.2.2 20-kHz Modification ........................ 3.1 3.2.3 Grounding Modification ..................... 3.3 3.2.4 Gating Modifications ....................... 3.3 3.2.5 Mechanical Modifications ................... 3.5
3.3 Experiment Test Results .......................... 3.5 3.3.1 Simultaneous Ranging on ATS-5 ................ 3.5 3.3.2 Position Location Determination ............... 3.11
APPENDIXA D E T A I L E D R A N G E D E M O D U L A T O R A N A L Y S I S . . A.l
APPENDIX B G L O S S A R Y .................................. B.1
iii
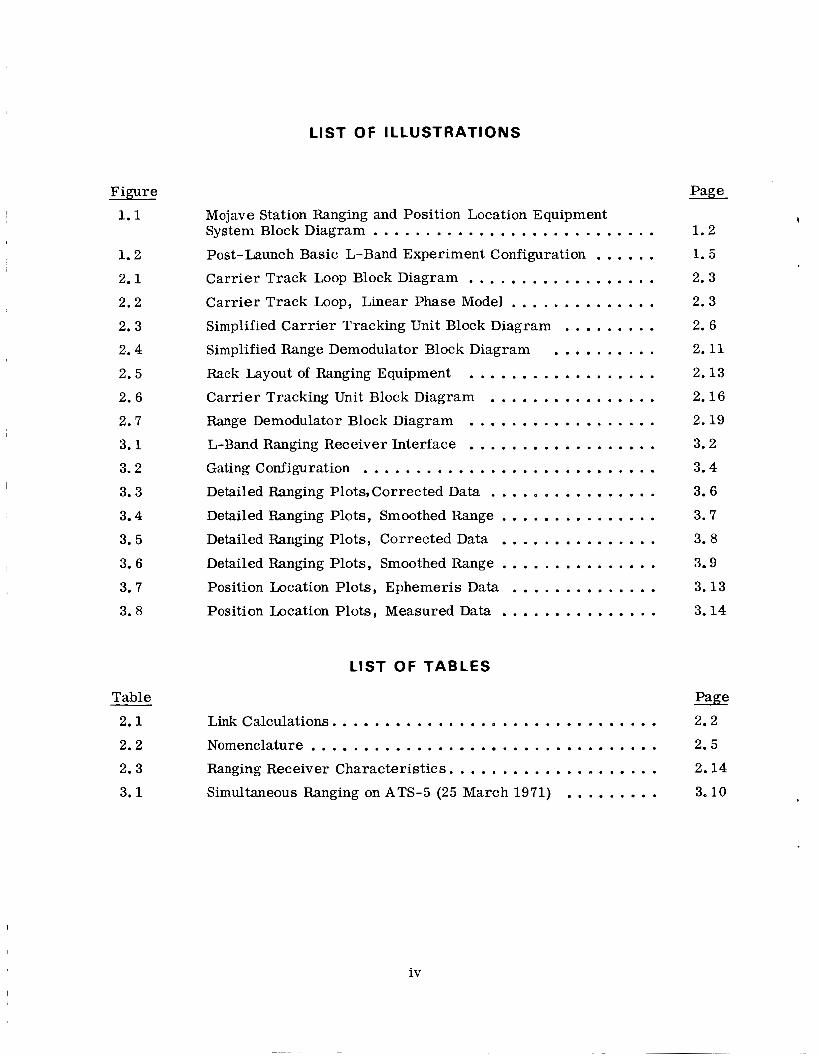
LIST OF ILLUSTRATIONS
Page Figure
1.1
1 . 2
2 . 1
2 . 2
2 . 3
2 . 4
2 . 5
2 . 6
2 . 7
3 . 1
3 .2
3 .3
3 . 4
3 . 5
3 . 6
3.7
3 . 8
Table
2 . 1
2 . 2
2 . 3
3 . 1
Mojave Station Ranging and Position Location Equipment System Block Diagram ........................... Post-Launch Basic L-Band Experiment Configuration
Carrier Track Loop Block Diagram
Carrier Track Loop. Linear Phase Model . . . . . . . . . . . . . . Simplified Carr ier Tracking Unit Block Diagram . . . . . . . . . Simplified Range Demodulator Block Diagram
Rack Layout of Ranging Equipment
Carrier Tracking Unit Block Diagram Range Demodulator Block Diagram . . . . . . . . . . . . . . . . . . L-Band Ranging Receiver Interface .................. Gating Configuration ............................ Detailed Ranging Plots. Corrected Data Detailed Ranging Plots . Smoothed Range . . . . . . . . . . . . . . . Detailed Ranging Plots. Corrected Data Detailed Ranging Plots. Smoothed Range . . . . . . . . . . . . . . . Position Location Plots . Ephemeris Data
Position Location Plots. Measured Data
. . . . . . . . . . . . . . . . . . . . . . . .
. . . . . . . . . . . . . . . . . . . . . . . . . . . .
. . . . . . . . . . . . . . . .
................
...............
. . . . . . . . . . . . . . ...............
1 . 2
1 . 5
2 . 3
2 . 3
2 . 6
2 . 1 1
2 . 1 3
2 . 1 6
2 . 1 9
3 . 2
3 . 4
3 . 6
3 .7
3 . 8
3.9
3 . 1 3
3 .14
LIST OF TABLES
Page Link Calculations ............................... 2 . 2
Ranging Receiver Characteristics .................... Simultaneous Ranging on ATS-5 (25 March 1971)
2 . 5 2 . 1 4
3.10
Nomenclature .................................
.........
iv
SECTION 1
INTRODUCTION
.
1.1 P R O G R A M HISTORY
1.1.1 Pre-Launch Plan Prior to the launch of ATS-5, (ATS-E) investigations were made into
ranging and aircraft tracking at L-band frequencies. An experiment proposal* was prepared and submitted which was designed to evaluate propagation effects at L-band
frequencies on ranging accuracy as well as multiple aircraft ranging and communica-
tions. The major objectives of the experiment were: 1. To evaluate the effects of propagation on tone ranging at L-band
frequencies.
To perform position location experiments from Mojave to an aircraft
and a simulated aircraft.
To perform a preliminary evaluation of the PLACE concept which
provides turnaround ranging and voice communications to multiple
aircraft.
2.
3.
To meet the above objectives a series of experiments were outlined and
the conceptual design of the necessary equipment for the experiment was developed.
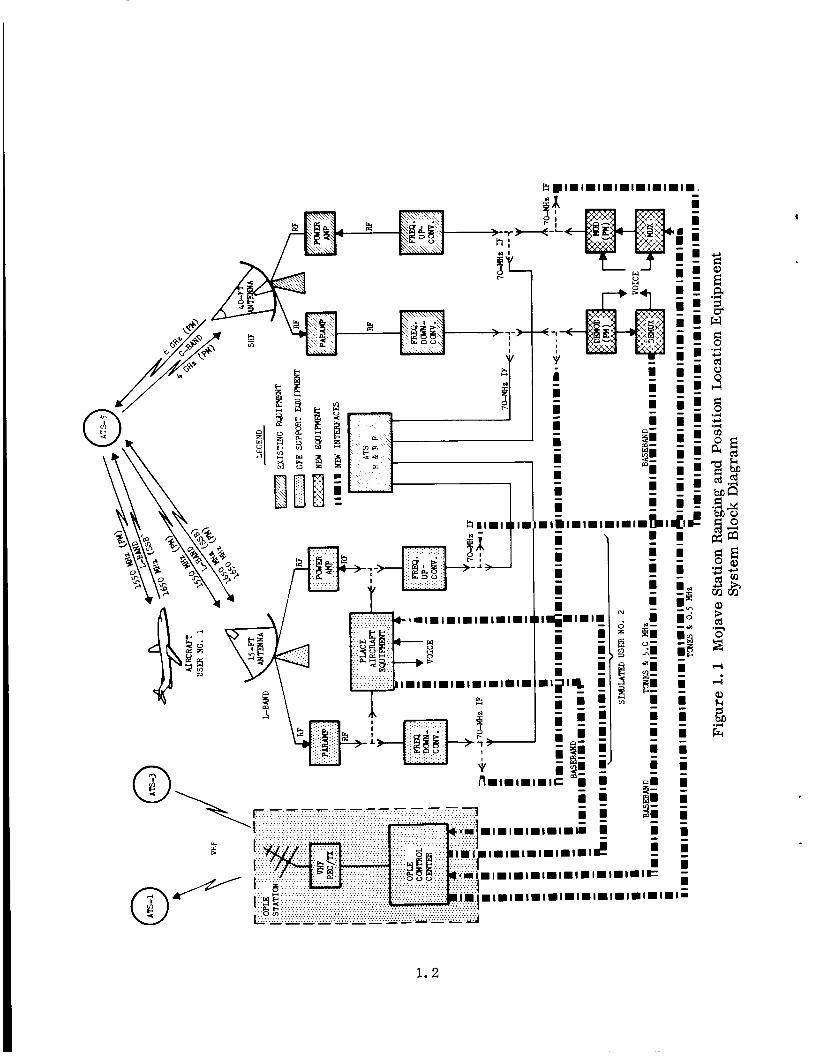
The system block diagram, figure 1.1, illustrates the total experiment configuration and indicates the interfacing between station equipment and experiment equipment.
The following individual experiments were to be performed:
a. Comparisons of simultaneous L-band range measurements and
C -band range measurements with spacecraft ephemeris data for
corresponding time periods. Turnaround ranging to an aircraft using the C- to L-band cross-strap
mode from the ground station to ATS-5 to aircraft link and L- to
C-band cross-strap on the return link.
b.
*"Proposal for L-band Ranging and Position b c a t i o n Experiment, 'I Westinghouse Electric Corporation, 14 July 1969, p. 2-1.
1.1

I .
c. Position location of an aircraft and a simulated aircraft using the
ranging link described in b. above with the ATS Ranging (ATSR)
system for one circle of position and the modified OPLE equipment
and ATS-1 or ATS-3 for the second circle of position.
The equipment which was originally proposed to implement the experiment
plan consisted of a modulator and a demodulator which would interface with the Mojave
station equipment at 70 MHz.
channels and the OPLE ranging tones on a 70-MHz car r ie r which would then interface
with the station equipment for up-conversion to C-band.
The modulator phase modulated four subcarrier voice
This C-band signal was transmitted to ATS-5, where it was translated to
L-band. An aircraft or simulated aircraft received this signal, processed it, and
retransmitted it as a single-sideband L-band signal. by ATS-5, which was in the multiple access L- to C-band cross-strap mode, and
retransmitted to the ground station.
The aircraft signal was received
The demodulator interfaced at 70 MHz with the station C-band down-
converter and carr ier tracked the received signal.
were four channels of coherent subcarrier voice demodulators and an OPLE range tone
extractor. The OPLE range tones were transferred to the modified OPLE equipment, where a range determination was performed.
1 . 1 . 2 Post-Launch Plan
Following the 70-MHz track channel
Soon after the launch of ATS-5, problems were encountered which prevented
extending of the gravity gradient booms to stabilize the spacecraft. Instead, the space-
craft achieved a spin-stabilized orbit which caused the L-band directional antenna to
sweep across the surface of the Earth at a 77-sweep-per-minute rate rather than
providing constant illumination of the Earth's surface, as planned. This produced an
illumination period (between the 3-dB points of the spacecraft antenna) of 60 milliseconds.
Since the proposed equipment for the L-band experiment was intended to operate under steady-state signal conditions, a re-evaluation of the experiment and
hardware was necessary. It was determined that the OPLE equipment could not be
modified to operate under the pulsed signal conditions that existed. Modification of the
ATSR to provide the required ranging data proved to be undesirable.
A study of the program objectives and spacecraft capabilities was made with a view to re-orienting the program to obtain the most useful information under the
funding constraints of the contract. This study disclosed that none of the original
1. 3
objectives could be completely realized, but that objectives 1 and 2 could be partially
realized. It was decided that objectives 1 and 2 would be modified as follows:
1. Evaluate the effects of propagation on tone ranging at L-band frequen-
cies under the limitation imposed upon the data by the spacecraft spin.
Perform a two-satellite position location experiment of a simulated
user, such as the Mojave station, using one-way ranging. 2.
Secondary objectives were also established for the program as follows:
1. Evaluate the effects of multipath interference on tone ranging signals at L-band.
Evaluate the effects of propagation on tone ranging signals at VHF.
Evaluate station-to-station tone ranging using high stability frequency
standards at each station.
2.
3.
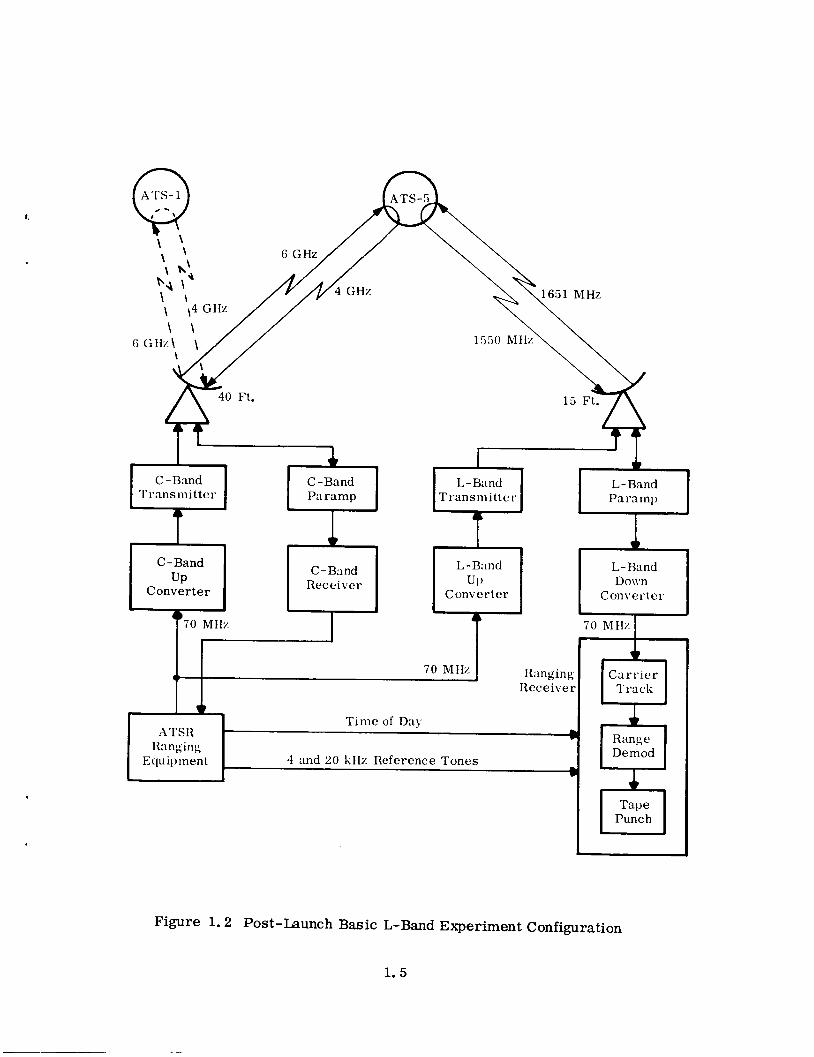
In order to meet the revised objectives a new system configuration was
developed (see figure 1.2) in which the ATSR equipment was used in conjunction with a newly designed ranging receiver. The ATSR ranging equipment supplied a range tone
modulated 70-MHz carrier which interfaced with the station L-band up-converter and
L-band transmitter. The
L-band signal was transmitted a t 1651 MHz to t h e ATS-5 spacecraft, where i t was
translated to 1550 MHz and retransmitted to the earth station.
was received by the station L-band receiver and down-converted to 70 MHz to interface
with the ranging receiver.
The range tone modulation was either 4 kHz or 20 kHz.
The 1550-MHz signal
The ranging receiver consisted of three major components: a car r ie r
track unit, range demodulator, and a paper tape punch unit.
was similar to that originally proposed, but was modified to acquire and track a pulsed
70-MHz carrier. The range demodulator was designed to accept the pulsed range tone
signal from the carrier track unit and process it to provide a useful range measurement.
This range measurement was then recorded along with time of day on punched paper
tape.
1 .2 P R O G R A M SUMMARY
The car r ie r track unit
The ATS-5 L-band ranging and position location experiment as originally conceived could not be implemented due to the failure of ATS-5 to achieve a gravity
gradient stabilized configuration.
experiments and the equipment required to perform the experiments. The equipment changes required were (1) modify the car r ie r track unit design to acquire and track a pulsed down link signal from ATS-5 and (2) design a range demodulator to provide useful
It was necessary to revise both the original
1
1.4
1.
C -Band C -Band L-Band L-Band T r a n s mi t te r Paramp T r a n s in it te r Para m 1,
C -Band C-Band L-Bxnd L- Band UP Receiver U P Do1i.n
Converter Converter C on\.er t er
70 MHz 70 MHz a
I w a b 70 MHz Ranging C a r r i e r
Receiver Track
T i m e of Day A TSH
Ranging Equipment
Demod
Tape Punch
4 and 2 0 kHz Reference Tones
Figure 1.2 Post-Launch Basic L-Band Experiment Configuration
1. 5
range information from this pulsed signal. The range demodulator was required
because neither the OPLE ranging equipment nor the ATSR ranging equipment could
be used with the pulsed signal received from the spacecraft
An experiment plan was prepared to perform the various tests under the
link conditions which existed, using the newly designed ranging equipment. The rang- ing equipment (or ranging receiver as it has been designated) was fabricated and tested
prior to shipment to the Mojave earth station. In early January 1971 the ranging receiver
was shipped to Mojave, installed and acceptance tested. During this period several
interface problems w e r e resolved and minor modifications were made to the ranging
receiver to simplify future testing.
I
The individual tests outlined in the experiment plan were performed and an
operations plan was prepared to provide the site personnel with a procedure to follow
during future testing. Only the initial experiment checkout data results are included in
this report. Data which was acquired after the initial experiment checkout phase will
be covered by the Data Reduction and Analysis effort under another contract.
1 .6
SECTION 2
EXPERIMENT EQUIPMENT
2 . 1 DESIGN P H I L O S O P H Y
2 . 1 . 1 Ranging Receiver
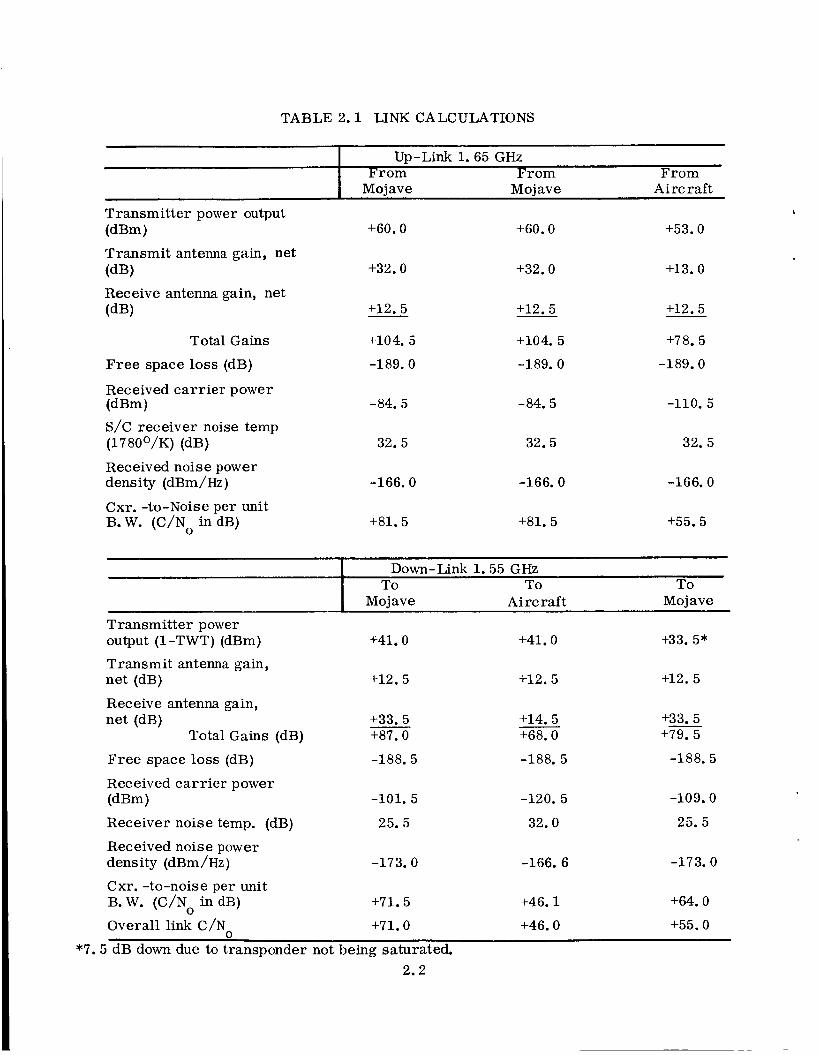
A first step in determining the design parameter requirements for the
ranging receiver was the calculation of the various link configurations which might be
encountered. A tabulation of the links follows (table 2 .1 ) which indicates that the
weakest link, and consequently the one which would establish the equipment design
criterion, is the spacecraft-to-aircraft link. This link, under the given conditions,
would produce an unmodulated carrier signal at the aircraft with a carrier power to
noise per unit bandwidth ratio of 46 dB.
2 . 1 . 2 Tracking Loop Design
Using the aircraft link from table 2 . 1 a s the constraining link and subtract-
ing 3 dB for design margin, a C/No of 43 dB is arrived at. If a peak modulation index
of 1.4 is assumed, car r ie r suppression due to modulation will be in the order of 5 dB.
This means that the C/N available to the tracking loop is in the order of 38 dB. This
is the nominal signal level around which the car r ie r tracking loop was designed. 0
Since an aircraft with a directional antenna was to be used in the experiment,
wide variations in signal level and track loop operation near threshold could be expected
due to aircraft manuevering. Examining the performance characteristics of various
tracking loop designs in light of the expected signal conditions led to the selection of
a Jaffe-Rechtin design. * This design yields near optimum performance over a wide
range of signal and noise levels. Although the loop settling time (for comparable
bandwidths) is not as fast as the Minimum Lead Design, (*) the threshold performance
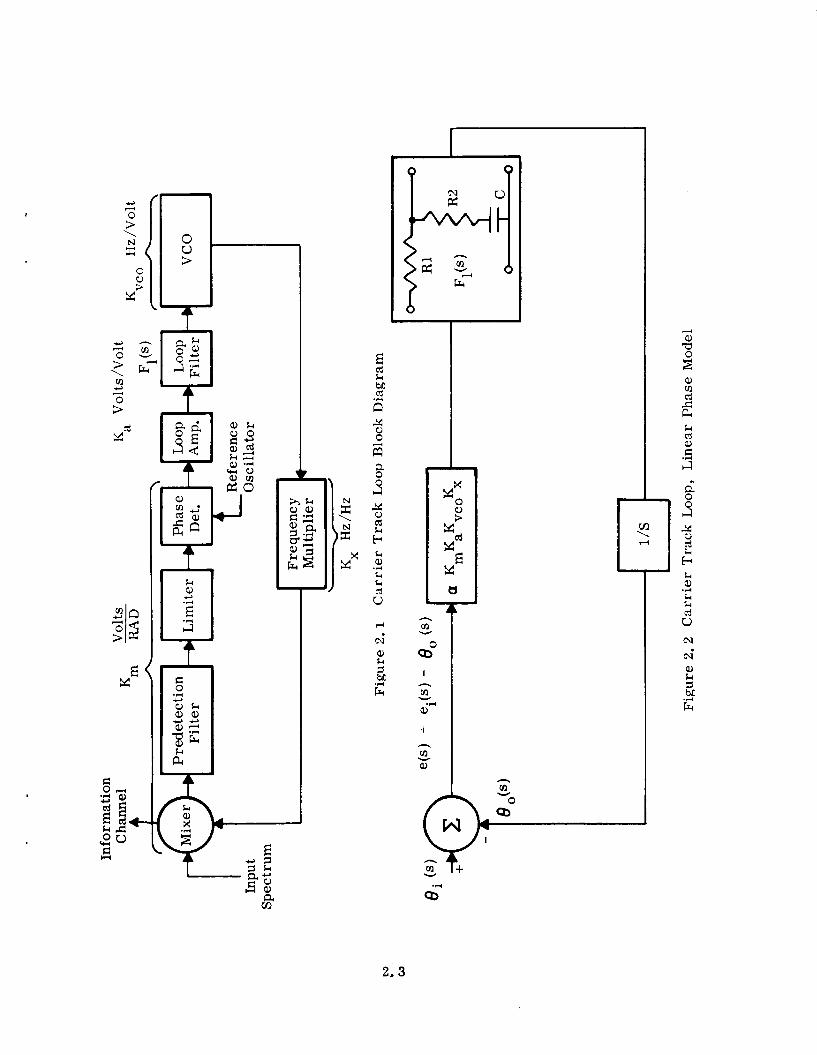
is superior. A simplified diagram of the loop is shown in figure 2.1 .
*Jaffe, L., and E. Rechtin, "Design and Performance of Phase-Lock Loops capable of near Optimum Performance Over a wide range of Input Signal and Noise Levels, 'I Trans. IRE pp. 66-76, March 1955
(*) See Glossary
2 . 1
I TABLE 2.1 LINK CALCULATIONS
Up-Link 1.65 GHz From From From
I Mojave Mojave Aircraft
Transmitter power output (dBm) +60.0
Transmit antenna gain, net (dB) +32.0
I
+60.0
+32.0
+53.0
+13.0
Receive antenna gain, net (dB) +12.5 +12.5 +12.5
Total Gains +104.5 +104. 5 +78.5 Free space loss (dB) -189.0 -189.0 -189.0
Received carrier power
S/C receiver noise temp (1780°/K) (dB) 32.5
(dBm) -84.5
Received noise power I density (dBm /Hz )
-84.5
32.5
-110.5
32. 5
Cxr. -to-Noise per unit B. W. (C/No in dB) +81.5
-166.0 -166.0 -166.0
+81.5 +55.5
Down-Link 1.55 GHz To To To
Mo j ave Aircraft Mojave Transmitter power output (1 -TWT) (dBm) +41.0 +41.0 +33.5*
Transmit antenna gain,
Receive antenna gain,
net (dB) +12.5
net (dB) +33.5 Total Gains (dB) +87.0
+12.5 +12.5
+14.5 +33.5 +68.0 +79.5
Free space loss (dB) -188.5 -188. 5 -188.5
Received carrier power (dBm) -101.5 -120.5 -109.0
Receiver noise temp. (dB) 25. 5 32.0 25.5
Received noise power density (dBm/Hz) -173.0 -166.6 -173.0
Cxr. -to-noise per unit B. W. (C/No in dB) +71.5 +46.1 +64.0 Overall link C/No +71.0 +46.0 +55.0
*7.5 dB down due to transponder not being saturated. 2.2
2 . 3
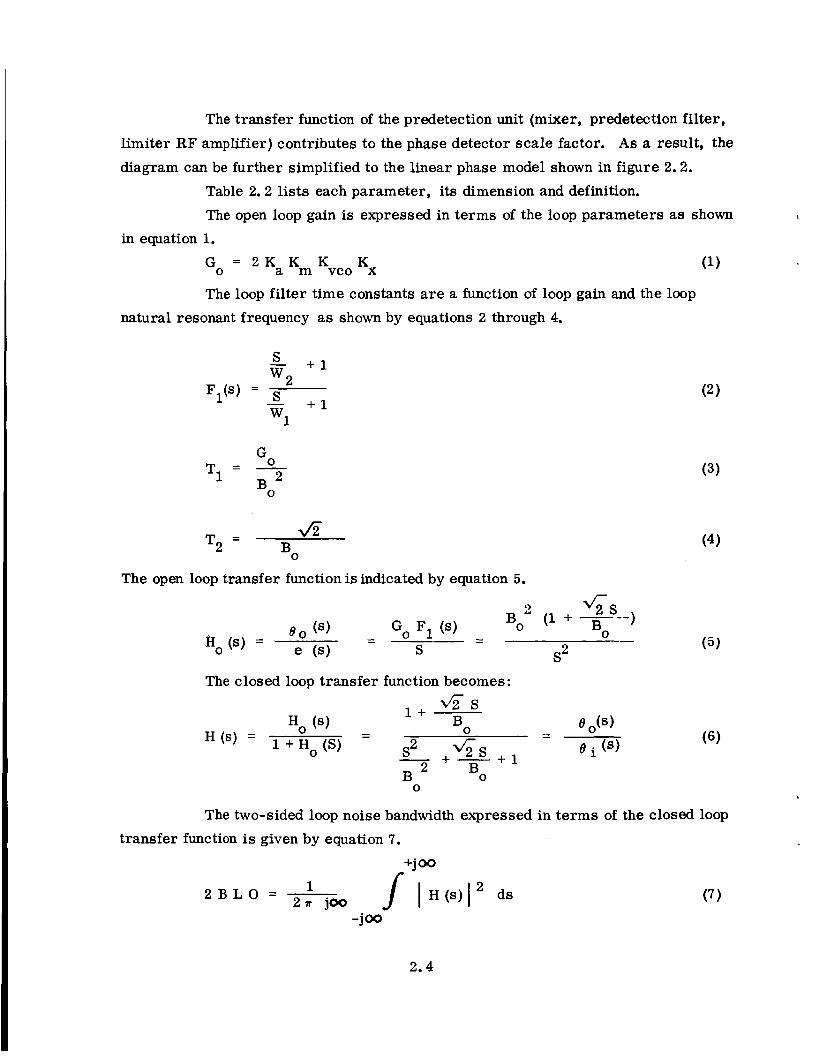
The transfer function of the predetection unit (mixer, predetection filter, limiter RF amplifier) contributes to the phase detector scale factor. A s a result, the
diagram can be further simplified to the linear phase model shown in figure 2.2.
Table 2.2 lists each parameter, its dimension and definition.
The open loop gain is expressed in terms of the loop parameters as shown
in equation 1.
Go = Ka Km Kvco Kx (1)
The loop filter time constants are a function of loop gain and the loop
natural resonant frequency as shown by equations 2 through 4.
- GO T1 =
T2 = Jzc BO
The open loop transfer function is indicated by equation 5.
The closed loop transfer function becomes:
* S e - - 0
'+ B - - Ho (6)
1 + Ho (S) s2 4 s + 1 e (6) H (s) =
- + - B 2 Bo 0
(3)
(4)
The two-sided loop noise bandwidth expressed in terms of the closed loop transfer function is given by equation 7.
2.4
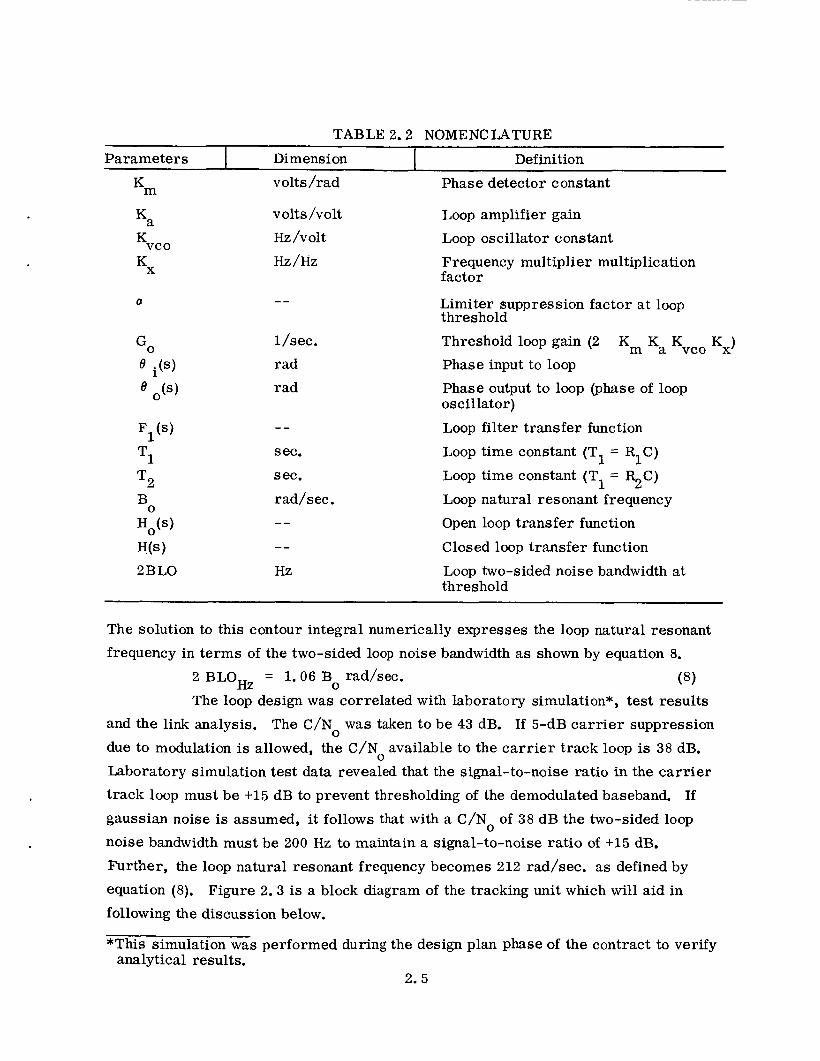
TABLE 2.2 NOMENCLATURE ~
Dimension I Definition Parameters
Km
Ka
volts /rad Phase detector constant
volts /volt Loop amplifier gain
Hz/volt Loop oscillator constant Kvco
K* HZ /HZ Frequency multiplier multiplication factor
a -- Limiter suppression factor at loop threshold
l/sec. Threshold loop gain (2 Km Ka Kvco Kx) GO e i(s) rad Phase input to loop e rad
FIW --
T1
T2
sec.
sec.
Phase output to loop (phase of loop oscillator)
Loop filter transfer function
Loop time constant (T1 = RIC)
Loop time constant (T = R2C) 1 rad/sec. Loop natural resonant frequency
0 B H o w -- Open loop transfer function
H(s) -- Closed loop transfer function
2BL0 Hz Loop two-sided noise bandwidth at threshold
The solution to this contour integral numerically expresses the loop natural resonant
frequency in terms of the two-sided loop noise bandwidth as shown by equation 8.
2 BLOHz = 1.06 Bo rad/sec. (8) The loop design was correlated with laboratory simulation*, test results
and the link analysis. The C/N was taken to be 43 dB. If 5-dB carrier suppression
due to modulation is allowed, the C/N available to the car r ie r track loop is 38 dB.
Laboratory simulation test data revealed that the signal-to-noise ratio in the carrier track loop must be +15 dB to prevent thresholding of the demodulated baseband. If
gaussian noise is assumed, it follows that with a C/No of 38 dB the two-sided loop
noise bandwidth must be 200 Hz to maintain a signal-to-noise ratio of +15 dB. Further, the loop natural resonant frequency becomes 212 rad/sec. as defined by
equation (8).
following the discussion below.
*This simulation was performed during the design plan phase of the contract to verify
2.5
0
0
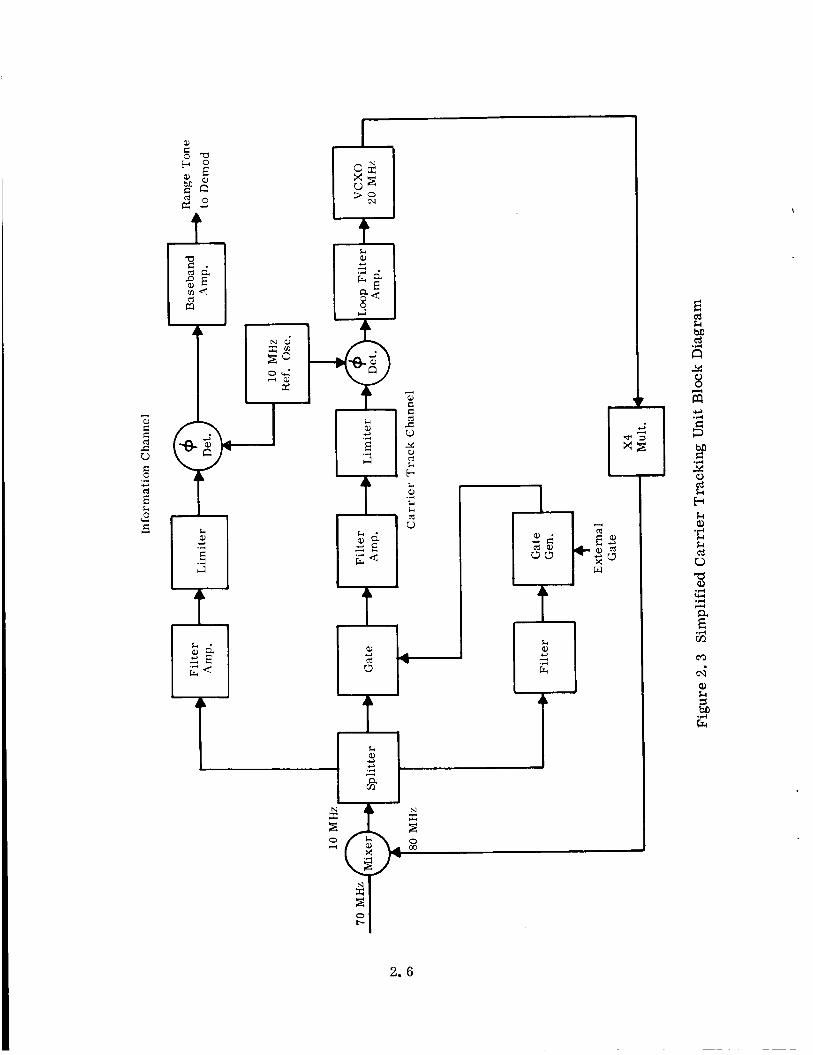
Figure 2.3 is a block diagram of the tracking unit which will aid in
analytical results.
The simulation indicated that the loop pull-in time is greatly enhanced i f
the VCO frequency established at the trailing edge of one burst is "held" by a sample/
hold unit inside the loop or alternatively by making the loop filter time constant, T1, long compared to the time between bursts.
760 Ms. If T is 7. 6 sec. to satisfy the "hold" requirement, then the open-loop gain
becomes 110 dB as defined by equation (3). This is a realistic open-loop gain and
this approach does not require a sample/hold circuit.
only about 3 degrees of phase e r ror when the system is stressed with maximum doppler
frequency shift (3 kHz) attributed to aircraft motion.
The time between bursts is approximately
1
This loop gain will result in
The gain contribution of each loop component as indicated by equation (1) is designed to yield an open-loop gain of 110 dB (at loop threshold). A s shown by equa-
tion (l), the open-loop gain is diminished by the Limiter Suppression** factor, a . The limiter suppression is determined by the signal-to-noise ratio in the predetection
bandwidth. As stated earlier, the two-sided loop noise bandwidth is 200 Hz.
predetection crystal filter noise bandwidth is 2000 Hz. At loop threshold the signal-to-
noise ratio in the loop two-sided noiseband is 0 dB (by definition). Therefore, in the
predetection noise bandwidth the signal-to-noise ratio will be -10 dB. The limiter
suppression ( u ) for -10 dB signal-to-noise ratio is 0.3, o r -10 dB. Therefore, the
open-loop gain must be 120 dB on a strong signal (at the center of the burst) and the
open-loop gain will degrade to 110 dB at loop threshold.
2.1.3 Gating
The
The car r ie r track loop was designed to be gated by the spin scan synchronizer in synchronism with the spin of ATS-5.
was used on previous ATS experiments, was located at Mojave. A receiver gate circuit
was installed (figure 2. 3) in the 10-MHz car r ie r track loop IF which permitted gating the signal through the loop only when the spacecraft was illuminating the ground
station.
oscillator (VCXO) off frequency when no spacecraft signal was available. To permit
more flexibility in using the equipment, this circuit was modified in the field to also
permit self-gating by using the receive signal level to develop the gate pulse.
2.1.4 Range Demodulator
This synchronizer, which
This prevented system noise from driving the voltage controlled crystal
A baseband signal is produced in the carrier track receiver which contains
either 4-kHz o r 20-kHz range tone information.
having an amplitude variation frequency which corresponds to the ATS-5 spin.
** See Glossary
The signal is periodic in nature,
2.7
The range demodulator receives this signal which has a signal-to-noise power density (S/N ) in both sidebands of 48 dB. Again, as in the ca r r i e r track loop,
a 3-dB design margin was used which reduces the S/N available to the range demodulator
to 45 dB. Design of the range demodulator and in particular the digital phase lock loop
was based upon this signal-to-noise ratio and a measurement accuracy goal in the order
of 100 feet (approximately 100 nanoseconds).
0
0
The baseband signal containing range information is filtered and hard
limited and then applied to the phase detector of a digital phase-lock loop. of the loop is to synthesize the received signal with a high degree of resolution over
many cycles of the range tone signal during each signal burst from the spacecraft. synthesized signal is then phase compared to a stable reference signal to provide a measure of the phase delay which results from the transmission path.
The purpose
The
A complete anslysis of the range demodulator requires rather extensive
mathematical manipulation.
this section.
and the addendums. 2.1. 4.1 Analog Filters
For this reason, only a summary analysis is given in
A much more rigorous analysis of this unit is provided in Appendix A
The analog filters serve two purposes : they reduce the aliasing* effects of the digital phase lock loop and they increase the signal-to-noise power ratio in the limiters.
The input signal-to-noise (S/N ) will be greater than 45 dB-Hz. A filter 0
bandwidth of 16 kHz will provide an output S/N greater than 3 dB. minimum value to use into the limiters.
This is a reasonable
A second-order maximally flat bandpass response was selected. The
denominator polynomial of the low-pass maximally flat Butterworth response is given
as :
s 2 + f i s + 1 With a 16-kHz bandwidth and a 20-kHz center frequency, the elementary
low-pass to bandpass transformation replaces "S" by:
s 3 5/4 (S + 1/S)
The response then is:
6.4 w O 2 S2 (3)
G (s)2 2 2 2 (S2 + 0.406 w0 S + 0.56 uo ) (S + 0. 725 uo S + 1.785 uo )
*See Glossary
2. 8
3 where = (2 T ) x 4 x 10 for the 4-kHz tone
and
The input signal level is -3 dBm.
4 w o = (2 T ) x 2 x 10 for the20-kHz tone
0
The limiters are able to handle input
levels 20 dB above this.
specified. 2.1.4.2 Phase-Lock Loop
Therefore, an additional 20-dB gain for the filter was
Functional elements of the phase-lock loop are; phase detector, phase
shifter, phase shifter control, and divide-by-N circuit. The gain for the phase-lock
loops, and the accuracy of each update is determined within the phase detector.
The function of the phase detector is to measure the phase difference
between the tone recovered from the baseband and the phase locked tone, and provide
correction signals for the phase-lock loop.
The only important contribution to measurement uncertainties in the phase-
lock loop is the input signal-to-noise ratio. For 4-kHz ranging, which is used only to
resolve the 50- c1 sec. ambiguities in the 20-kHz range readings, a 45-dB Hz baseband
signal (tone)-to-noise ratio produces a range uncertainty with standard deviation of
about 718 nsec.
a range uncertainty of about 105 nsec.
For 20-kHz tone ranging the 45 dB-Hz signal-to-noise ratio results in
The quantization is 20 nsec. which introduces an e r r o r with standard 2 2 > denotes expected value of A deviation of: ( A
20 - < A 2>1'2 = d ~ = 5.8 nsec. (4)
The e r r o r due to phase uncertainties of the prefilter has a standard devia-
tion claculated to be less than 125 nsec. for 4 -kHz tone ranging and less than 25 nsec.
for 20-kHz tone ranging.
The overall range uncertainties due to all three sources are:
u = d(718f + (5. 8)2 + (125t (5) or
and
or
u 730 nsec. for 4-kHz tone
u = \1(105f + (5. 8f + (25T
hl
u = 117 nsec for 20-kHz tone
2.9
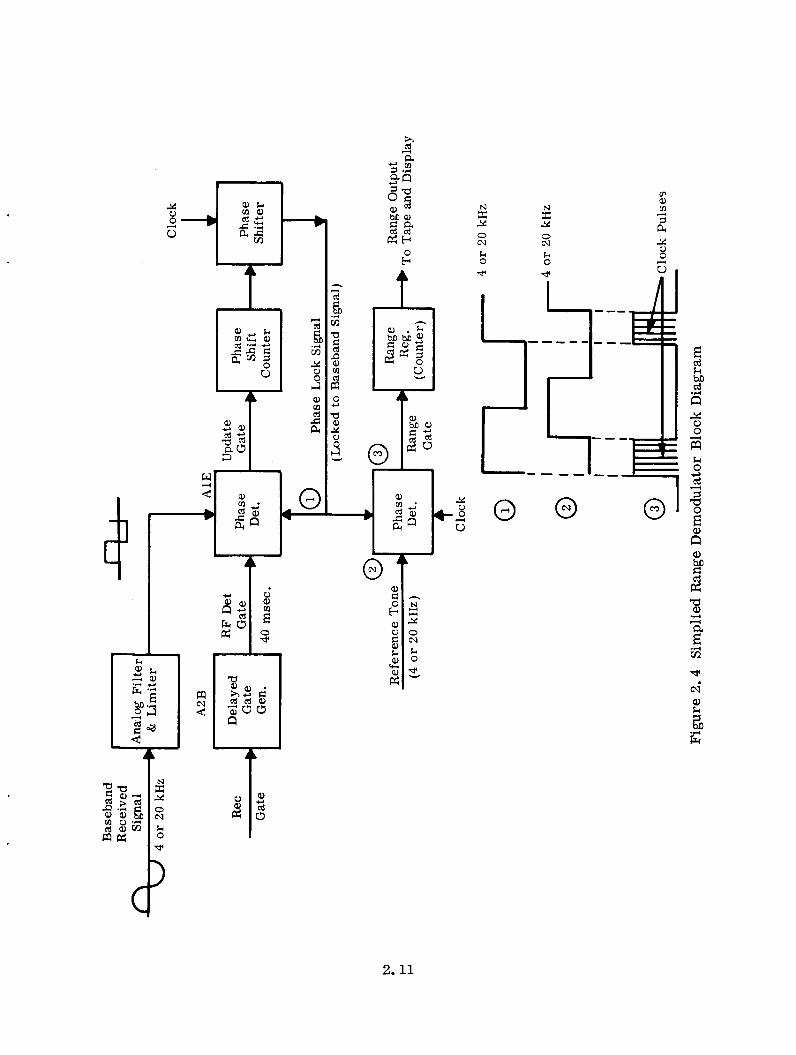
The signal used to synthesize a range tone is received in periodic bursts
due to the spinning of the ATS-5 spacecraft. The best range information occurs near
the end of each burst, a t which time the reading is punched on paper tape and the range display is updated. Thus, the detection and display/punch-out is cycled at the satellite
spin period - about 790 msec. Each phase detection cycle is initiated by the "RF DET GATE" from logic
board A2B (figure 2.4). the spin scan synchronizer or internal gate circuit which is delayed to allow transients in the car r ie r track and prefilter to settle out.
40 msec. , which is sufficient time for 160 cycles of 4 kHz, or 800 cycles of 20 kHz.
An "UPDATE GATE" (AlE) is generated at the end of each cycle of the received signal and is terminated by the phase-locked signal. If the received signal leads the
phase-locked signal, the direction of the update is up,and vice versa.
the update is a function of the phase e r r o r between the received and phase-locked
signals, measured in 20-nsec. increments utilizing a 50-MHz clock and the gain of the phase detector.
The "RF DET GATE" is enabled by the "REC GATE" from
The period of the "RF DET GATE" is
The magnitude of
At the end of the update period, the control counter and the phase shift
The phase shift counter begins to count up or counter are simultaneously enabled.
count down until the control counter becomes saturated and disables the phase shifter
counter.
converted to decimal and used to gate out one of ten 5-MHz signals.
signals are spaced in 20-nsec intervals.
o r 1250 to generate the 20-kHz phase-locked signal o r the 4-kHZ phase-locked signal, respectively.
2.1.4.3 Range Resolving Logic
During the enable period, the BCD count from the phase shift counter is These 5-MHz
The 5-MHz signal is divided by either 250
The function of the range resolving logic is to measure the phase difference between the reference signal and the phase-locked signal and to resolve this difference
into a range measurement.
After the 40-msec. "RF DET GATE, the range gate generator is enabled.
The reference signal, which is shifted to negate any delays in the system, is utilized
to start the "RNG GATE" and the phase-locked signal is utilized to end it. tion of the range gate is proportional to the range as a function of time.
The dura-
The range measurement from the range register will be read out on a visual display and simultaneously will be multiplexed along with the time of day to be punched out on paper tape.
2.10
s Y 0 cv k 0
s 3 0 c\1
k 0
2.11
2.2 R A N G I N G R E C E I V E R
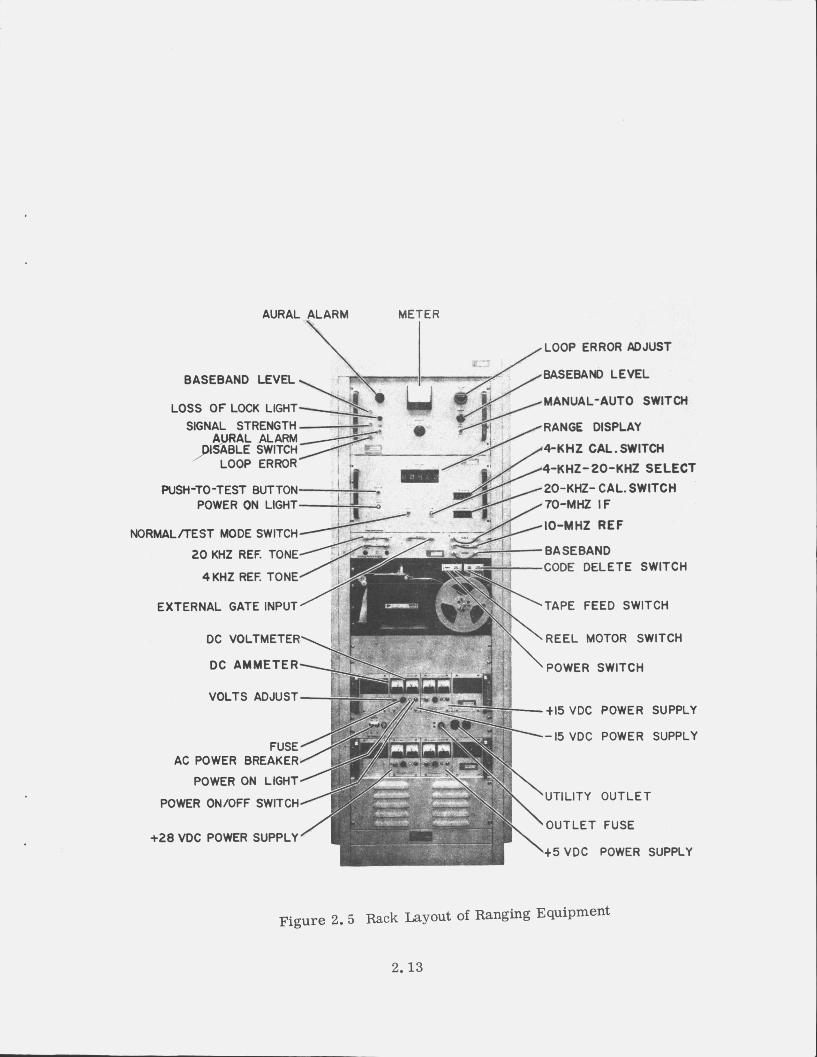
The ranging equipment designed and fabricated on the ATS-5 L-Band
Ranging and Position Location contract is housed in a standard 19-inch equipment rack.
The system, illustrated in figure 2.5, is 6 feet high by 24 inches in depth. Since it is a special experimental unit, it was designed for ready mobility and may be easily set up in a variety of test configurations.
The equipment aS shown in figure 2.5 consists of:
Carrier Tracking Unit
Range Demodulator Paper Tape Punch
Patching and Interconnection Panels
Power Supplies
The system was designed to interface a radio receiver down-converter at an intermediate frequency of 70 MHz, and to carrier-track a pulse-type signal that
has been angle modulated with ranging tones.
the tone in the range demodulator unit, digitized, and recorded by the paper tape
punch unit in an eight-level code* format.
in Table 2.3.
2.2.1 Carrier Tracking Unit
The range information is extracted from
The performance characteristics are listed
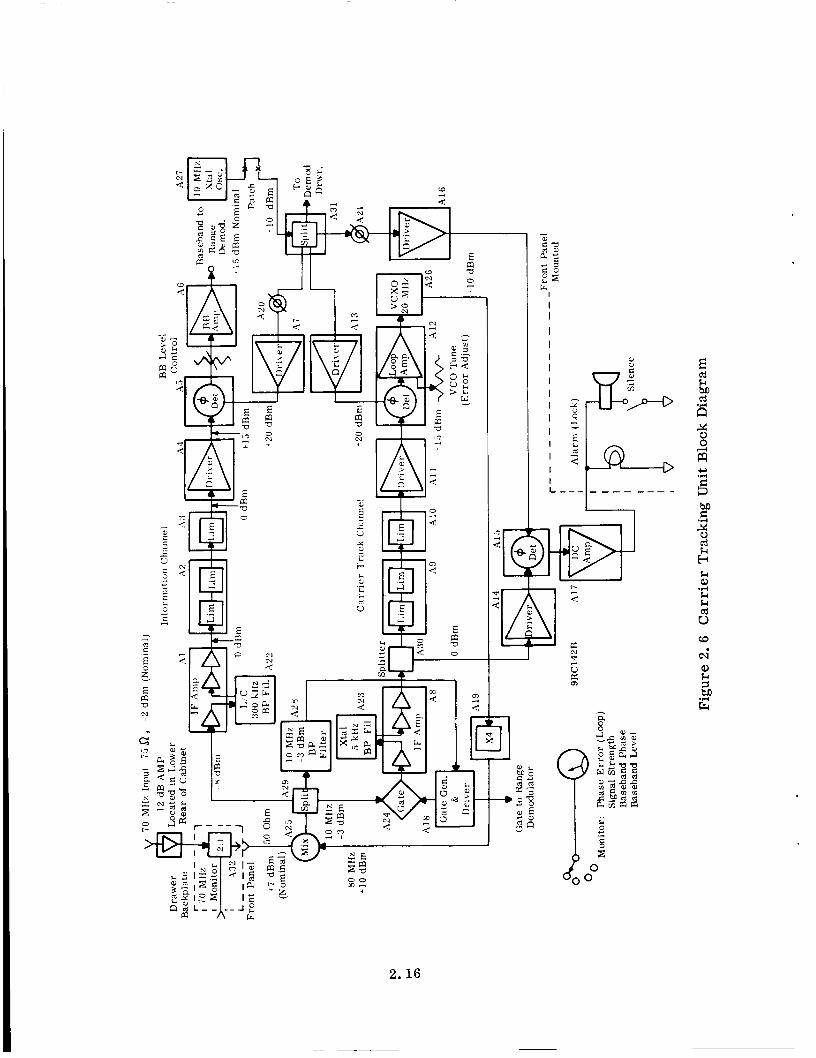
A block diagram of the car r ie r tracking unit is given in figure 2. 6. The
unit phase-locks to a 70-MHz carrier input, and supplies a demodulated baseband
output signal to the ranging demodulator.
car r ie r over a range of at least 22.5 kHz. The input impedance is 50 ohms, and a 70-MHz carrier level of at least 0 dBm is required for optimum performance. An
amplifier capable of 12-dB gain and with an input/output impedance transformation of
75/50 ohms is provided for use with radio down-converters having lower output levels
and different output impedances. A 70-MHz signal splitter is also provided to facilitate
front panel monitoring of the car r ie r tracking unit input signals.
The unit will track the 70-MHz input
The second output froin the splitter is mixed with a nominal 80-MHz signal to produce a carrier tracked difference frequency of 10 MHz. The 10-MHz output
from the mixer (A25) is split three ways by splitter A29. One output port is connected to a 10-MHz filter whose bandwidth is 3 kHz at the 3-dB points. The output of this
filter is used to generate a gating signal synchronous to the spin of the ATS-5 satellite.
*See Glossary
The bandwidth restriction of the filter is utilized to provide maximum level
2.12
AURAL ALARM METER
\ BASEBAND LEVEL
LOSS OF LOCK LIGHT- SIGNAL STRENGTH -
AURAL ALARM- ABL LE SWITCH, LOOP ERROR
PUSH-TO-TEST BUTTON- POWER ON LIGHT-
NORMALATST MODE SWITCH-
~ O K H Z REF. TONE’
4KHZ REF. TONE /
LOOP ERROR ADJUST
BASEBANO LEVEL
MANUAL-AUTO SWITCH
RANGE DISPLAY
4-KHZ CAL. SWITCH
/ / /
/
$+KHZ-zo-KHZ SELECT /20-KHZ- CAL. SWITCH
,IO-MHZ REF
-BASEBAND
/70-MHZ IF
-CODE DELETE SWITCH
EXTERNAL GATE INPUT TAPE FEED SWITCH
DC VOLTMETER REEL MOTOR SWITCH
DC AMMETER POWER SWITCH
VOLTS ADJUST t15VDC POWER SUPPLY
-15 VDC POWER SUPPLY FUSE
AC POWER BREAKER
POWER ON LIGHT
POWER ONIOFF SWITCH UTILITY OUT L E T
OUTLET FUSE
t 5 V D C POWER SUPPLY +28 VDC POWER SUPPLY
Figure 2 . 5 Rack Layout of Ranging Equipment
2.13
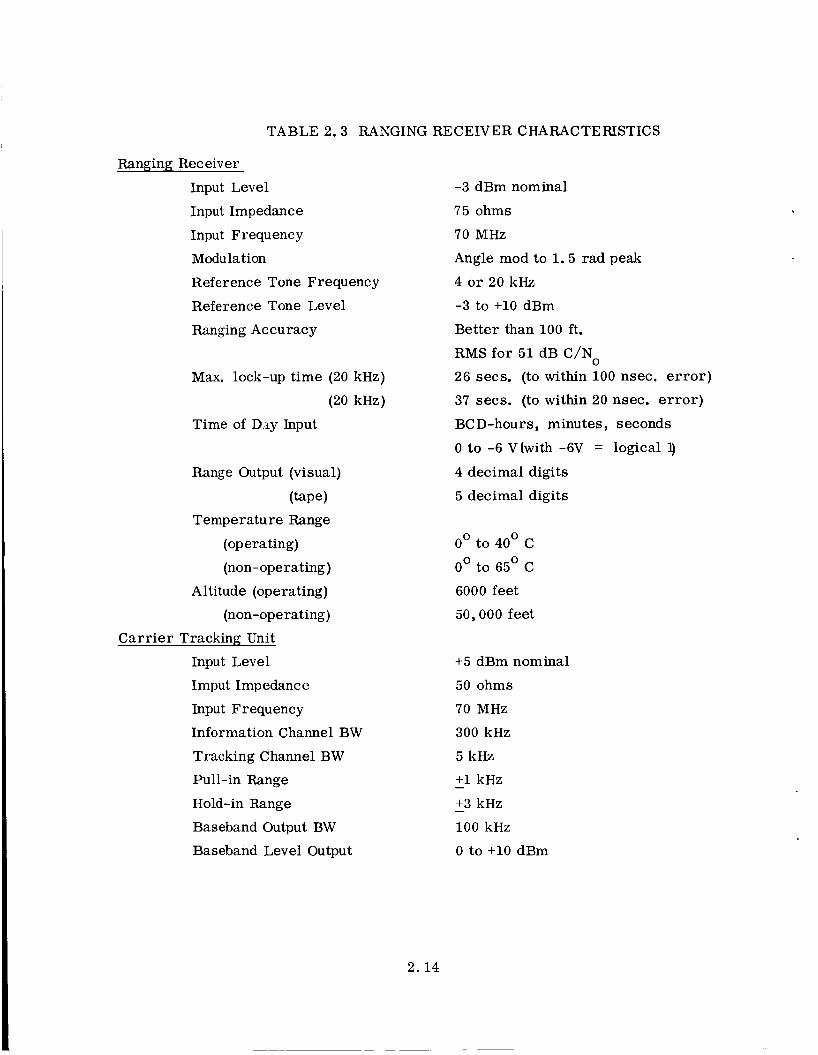
TABLE 2.3 RANGING RECEIVER CHARACTERISTICS
Ranging Receiver Input Level
Input Impedance
Input Frequency
Modulation
Reference Tone Frequency
Reference Tone Level Ranging Accuracy
Max. lock-up time (20 kHz) (20 kHz)
Time of Day Input
Range Output (visual)
(tape) Temperature Range
(operating)
(non-operating )
Altitude (operating)
(non-operating)
Carrier Tracking Unit Input Level
Imput Impedance Input Frequency
Information Channel BW
Tracking Channel BW Pull-in Range
Hold-in Range
Baseband Output BW
Baseband Level Output
-3 dBm nominal
75 ohms
70 MHz
Angle mod to 1 .5 rad peak
4 or 20 kHz -3 to +10 dBm
Better than 100 ft.
RMS for 51 dB C/No
26 secs. (to within 100 nsec. e r r o r ) 37 secs. (to within 20 nsec. e r ror )
BCD-hours, minutes, seconds
0 to -6 V(with -6V = logical 1)
4 decimal digits 5 decimal digits
0' to 40' C
0' to 65' C
6000 feet 50,000 feet
+5 dBm nominal
50 ohms
70 MHz 300 kHz
5kHz +1 kHz
- +3 kHz
100 kHz
0 to +10 dBm
-
2.14
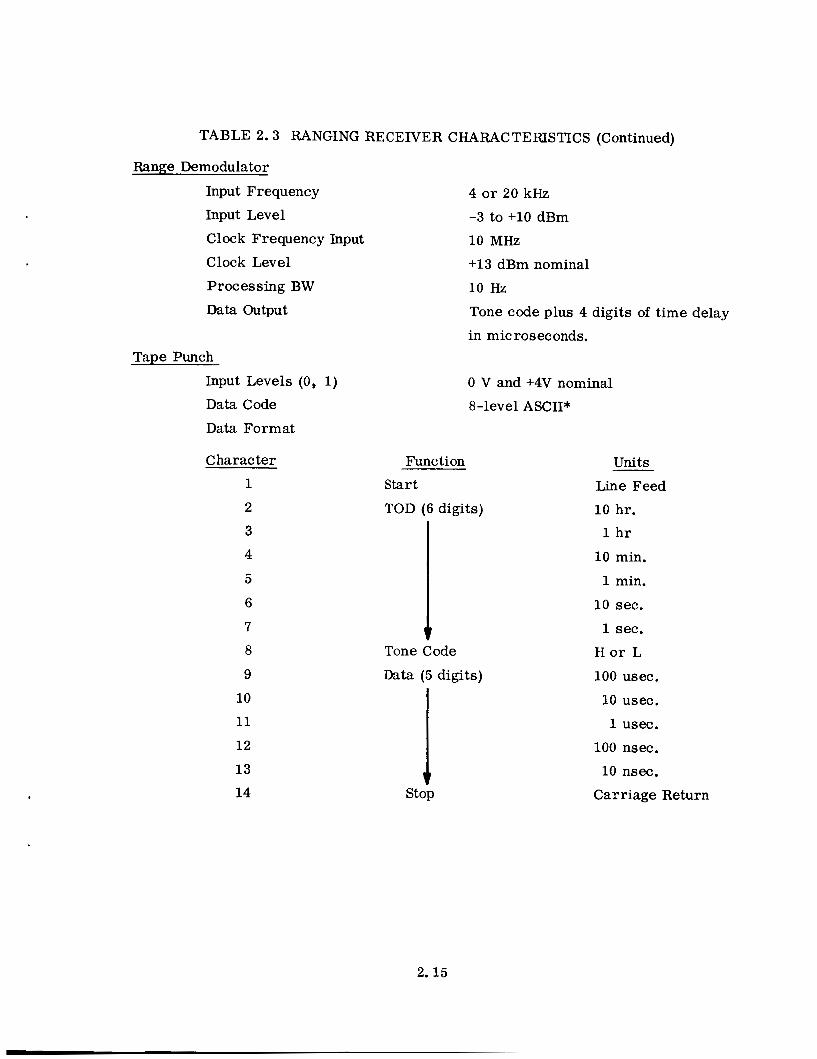
TABLE 2 . 3 RANGING RECEIVER CHARACTERISTICS (Continued)
Range Demodulator
Input Frequency
Input Level
Clock Frequency Input
Clock Level
Processing BW
Data Output
Tape Punch
Input Levels (0, 1)
Data Code Data Format
Character 1
2
3
4
5
6
7 8
9
10
11
12
13
14
4 or 20 kHz
-3 to +10 dBm
10 MHz +13 dBm nominal
10 Hz Tone code plus 4 digits of time delay in microseconds.
0 V and +4V nominal
8-level ASCII*
Function S t a r t
TOD (6 digits)
Tone Code
D a t a (5 digits)
stop I
units Line Feed 10 hr.
1 hr 10 min.
1 min.
1 0 sec.
1 sec.
H o r L
100 usec.
10 usec.
1 usec.
100 nsec.
10 nsec.
Carriage Return
2. 15
J 1 3
E ffi
I E m E
m V D
3 N 3 CJ
E m U
J
1
2.16
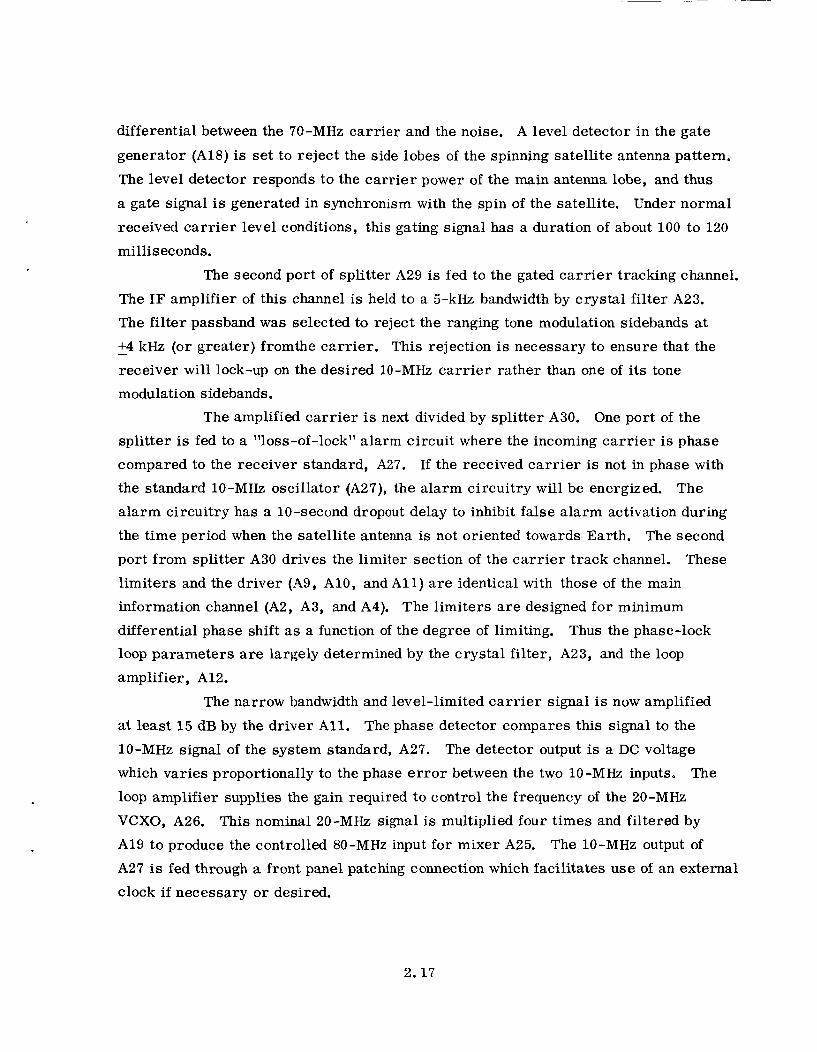
differential between the 70-MHz carrier and the noise. A level detector in the gate
generator (A18) is set to reject the side lobes of the spinning satellite antenna pattern.
The level detector responds to the carrier power of the main antenna lobe, and thus
a gate signal is generated in synchronism with the spin of the satellite. Under normal received carrier level conditions, this gating signal has a duration of about 100 to 120
mi 1 lis ec onds . The second port of splitter A29 is fed to the gated car r ie r tracking channel.
The IF amplifier of this channel is held to a 5-kHz bandwidth by crystal filter A23.
The filter passband was selected to reject the ranging tone modulation sidebands at - +4 kHz (or greater) fromthe czrrrier. This rejection is necessary to ensure that the receiver will lock-up on the desired 10-MHz carr ier rather than one of its tone
modulation sidebands.
The amplified carrier is next divided by splitter A30. One port of the splitter is fed to a "loss-of-lock" alarm circuit where the incoming car r ie r is phase
compared to the receiver standard, A27. If the received car r ie r is not in phase with
the standard 10-MHz oscillator (A27), the alarm circuitry will be energized. The
alarm circuitry has a 10-second dropout delay to inhibit false alarm activation during
the time period when the satellite antenna is not oriented towards Earth. The second
port from splitter A30 drives the limiter section of the carr ier track channel. These
limiters and the driver (A9, A10, and A l l ) are identical with those of the main
information channel (A2, A3, and A4). The limiters a r e designed for minimum
differential phase shift as a function of the degree of limiting. loop parameters are largely determined by the crystal filter, A23, and the loop
amplifier, A12.
Thus the phase-lock
The narrow bandwidth and level-limited car r ie r signal is now amplified
at least 15 dB by the driver A l l . The phase detector compares this signal to the
10-MHz signal of the system standard, A27. The detector output is a DC voltage which varies proportionally to the phase e r r o r between the two 10-MHz inputs.
loop amplifier supplies the gain required to control the frequency of the 20-MHz
VCXO, A26.
A19 to produce the controlled 80-MHz input for mixer A25.
A27 is fed through a front panel patching connection which facilitates use of an external
clock if necessary o r desired.
The
This nominal 20-MHz signal is multiplied four times and filtered by
The 10-MHz output of
2.17
The information channel receives its 10-MHz input from a third output port
of splitter A29. The IF amplifier and driver for this channel is nearly identical to that
of the car r ie r track channel.
bandwidth of 300 kHz. plus its modulation sidebands to be passed through the circuitry.
also useful in that it permits use of modulation other than the 4-kHz o r 20-kHz range
tones. The 10-MHz comparison input to the phase detector, A5, is passed through a phase shifter network, A20. This shift is incorporated to correct for the phase delay
introduced by the tracking loop.
A25. baseband amplifier, A6, to bring the recovered range tone up to the level required for
nominal operation of the range demodulator (+15 dBm).
2.2.2 Range Demodulator
The bandpass filter (A22) provides an information channel
This relatively wide passband is required to allow the car r ie r
The wide bandwidth is
This delay is introduced via the 80-MHz input to mixer
The baseband output from A5 is fed through the baseband level control to the
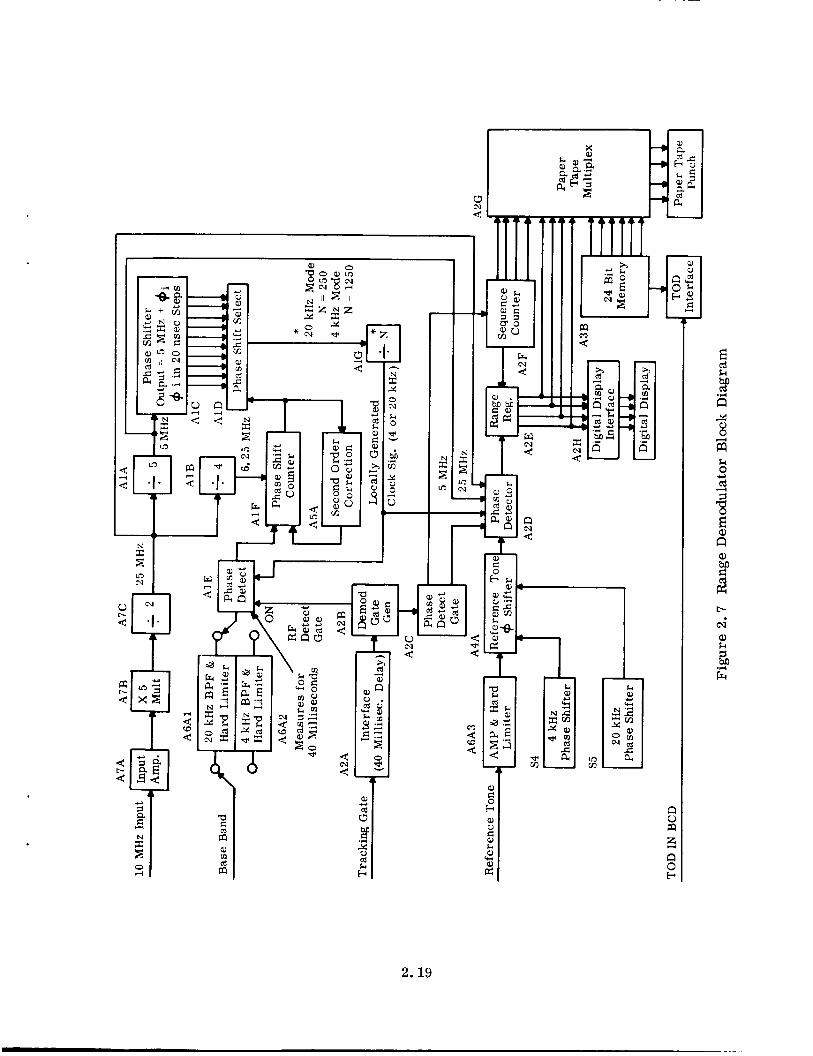
A simplified block diagram of the range demodulator is given in figure 2.7.
This unit accepts the baseband signal and gate signal from the carrier tracking unit; uses the gate signal for timing purposes; compares the baseband tone (4 o r 20 kHz) to
the reference tone; and thus determines the measured range in terms of nanoseconds
of difference between the received and transmitted (reference) range tones.
measurement is ambiguous in that the number of integral cycles of delay is not known
at this point.
The
The ambiguity is resolved during the processing of the recorded data.
The range demodulation process is turned "ON" by the gate signal from the
carrier tracking unit via unit A2B.
interface (A2A) for about 120 milliseconds during each revolution of the ATS-5.
interface circuit (A2A) delays the gate signal approximately 40 milliseconds.
gate signal is then applied to AlE, where the receiver baseband signal is phase com-
pared to a locally generated ranging tone.
This gate is present at the range demodulator
The
The
The locally generated tone is derived fromthe 10-MHz input from the system clock (A27 in the carrier tracking unit drawer).
verted to 25 MHz by units A7A, A7B, and A7C as shown in figure 2.7. Unit A1A generates a 5-MHz clock which is divided into 10 separate signals in the phase shifter,
A1C. Each of the 10 clock signals is delayed 20 nanoseconds so the entire 200-
nanosecond time spectrum for a 5-MHz signal is divided into 10 equal parts. these 10 clock signals is selected by unit AlD, and divided in AlG by a number "N"
such that the output is either 4 kHz or 20 kHz.
The clock input is amplified and con-
One of
2. 18
brn o c - 0
m
c s
2.19
The baseband signal from the car r ie r tracking unit is filtered and hard
limited in A6A1 o r A6A2. This square-wave signal is then phase compared to the
locally generated clock by phase detector, A1E. The phase detector first determines
whether the local clock leads or lags the baseband signal, and enables a gate to the
phase shift counter (AlF) when the first of the two comparison signals is detected. The
latter of the two signals acts to disable the gate and stop counter, A l F .
shift counter measures the time differential between the baseband input signal and the
locally generated clock signal by counting the cycles of 6.25 MHz that occur between
them. The phase shift select circuit, AlD, selects the necessary output from the
phase shifter, AlC, to minimize the phase e r r o r detected by circuit A1E.
The phase
The above-described range measurement is carried out for a 40-millisecond
time period during each satellite revolution.
range tone (or 160 cycles of the 4-kHz tone) are utilized for phase-lock purposes in
in each revolution.
the phase differential changes with time.
this change over the 40-millisecond comparison period. the period is accumulated by A5A and dumped into the A 1 F phase shift counter at the
beginning of the next comparison period. The range tone obtained as a result of the above process is phase-locked to the incoming baseband signal with a maximum
inherent e r r o r (due to equipment design) of - +10 nanoseconds.
as a result of the minimum steps available from phase shifter A1C.
This means that 800 cycles of the 20-kHz
Since the satellite (and possibly the ranging receiver) is moving,
The correction circuit, A5A, acts to monitor The change in count over
This e r r o r is derived
The phase-locked range signal also appears as an input to phase detector
A2D.
tone may be the 4-kHz or 20-kHz signal from the station ATSR equipment, o r it may
be a tone derived from a suitable frequency standard. In any event, the reference
tone must be coherent with the baseband signal applied to the A1E phase detector.
The reference tone signal is amplified and hard limited by A6A3 and phase shifted in
unit A4A (the reason for this phase adjustment will be discussed later). signal is next applied to phase detector, A2D.
The comparison input to this detector is the reference tone. This reference
The tone
Phase detector A2D is normally in operative until a "START" signal is This same start signal causes the sequence counter received from gate unit A2C.
(A2F) to reset the range register (A2E) to zero in preparation to receive the upcoming
range measurement.
seconds of phase comparison in unit A1E.
This start signal is timed to occur at the end of the 40 milli- Phase detector (A2D) then counts the
2.20
number of cycles of 5-MHz or 25-MHz clock signals that occur between the first
negative-going zero crossing of the reference tone and that of the phase-locked base-
band signal from A1G. The 5-MHz count is used with 4-kHz tone ranging, and the
25-MHz count is used with the 20-kHz range tone.
ment e r r o r is 40 nanoseconds with the 20-kHz ranging tone and 200 nanoseconds with
a 4-kHz tone. This e r r o r is in addition to the maximum possible equipment e r r o r of
10 nanoseconds described above.
A2E. At the end of the count period, the output of the range register is fed in a four-
digit parallel format to the digital display interface (AZH) and the paper tape multiplex
unit (A2G).
Thus the maximum inherent equip-
The range count is accumulated in range register
The digital display interface unit is capable of high-speed conversion of
binary coded decimal information into the proper code for driving a four-digit visual
display. The paper tape multiplexing unit performs the logic required to format the range data for proper
output to the paper tape punch. A second series of parallel inputs to the multiplexer
is the time-of-day (TOD) information obtained from the station clock. TOD is inter-
faced into a 24-bit memory. When the sequence counter initiates the printout function,
the TOD is transferred from the memory unit and formatted in the muliplexer for the
punch unit. The next unit of information to be transferred to the punch is a code to
designate whether the machine is in the 4-kHz o r 20-kHz mode of operation. Next,
the range reading is formatted and sent to the punch unit, followed by an end character
that completes the output sequence. The completion of the output sequence completes
one pass through the ranging demodulator. On the next pulse from the receiver gate,
the demodulator sequence is initiated again.
The display consists of four vacuum fluorescent readout tubes.
A s mentionedpreviously, the reference tone is phase-shifted prior to phase
detection. The reference tone (either 4-kHz or 20-kHz) from the ATSR or frequency
standard is amplified and hard limited to produce a clean square wave.
then applied to a reference tone phase shifter, A4A.
for any phase delay introduced by the system hardware.
compensation is manually introduced into the phase shifter by two panel-mounted, four- decade thumbwheel switches (one set for each mode of operation). To set in the
proper phase shift, it is necessary to range to some known location, such as the
collimation tower, and adjust the thumbwheel switches until the proper range readout
is obtained at the digital display unit.
This signal is This phase shifter compensates
The required phase shift
2.21
2.2.3 Digitronics Model 1560 Paper Tape Punch
This paper tape punch is a solenoid-actuated tape perforator with associated
electronics capable of punching 5-, 6-, 7-, o r 8-channel paper tape. operate at a rate up to 60 characters per second.
tape punch mechanisms (one for each of the eight data channels and one sprocket
channel) and a tape transport mechanism.
regulated power supply and the interfacing logic.
multiplexed data from the demodulator and outputs this in a serial manner on eight-
channel paper tape. The entire unit is housed in one drawer of the ranging equipment
assembly (figure 2.5).
2.2.4 Lambda Regulated Power Supplies
The punch will
The mechanical unit consists of nine
The electronics of the unit consists of a The punch unit receives the
These power supplies (there are four separate units) provide +5V, - +15V,
and +28V for the entire cabinet.
capactive filtering, and incorporating series regulation in the output circuitry. The
four power supplies are housed in two drawers of the ranging equipment rack. Each
unit is self-contained and incorporates its own voltage and current metering, over-
load protection, and main power switch. 2.2.5 Patching and Interconnection Panels
They are basically full-wave rectifiers, provided with
The rack contains two separate patch panels. One panel was installed
during the fabrication of the equipment, and the other was installed in the field as more equipment interfaces became necessary. The main patch panel contains jumper cables
for the reference tones, 10-MHz clock, 70-MHz signal, and the baseband signal. It also contains a switch for selecting the spin gate (either an internal one pulse per
second, or a gate derived from the ATS-5 signal). point for the spin gate signal. The unit has been drilled to accept up to three reference
tones if necessary. The smaller of the two patch panels contains three interface
connections between the strip chart recorder and the receiver. It also contains a 70-MHz test point and a received signal strength test point.
The panel also provides a monitor
2.22
SECTION 3
FIELD INTEGRATION
3.1 E Q U I P M E N T C O N F I G U R A T I O N
The L-band ranging receiver arrived at the Mojave STADAN station
15 January 1971 and was immediately installed in accordance with the preliminary
Installation Control Directive (ICD) dated 4 January 1971. During the following equip- ment checkout and acceptance testing phase the interface configuration was changed to
improve performance and simplify the experimental testing effort. These changes w e r e incorporated into the ICD and supplied to the ATS project group at GSFC.
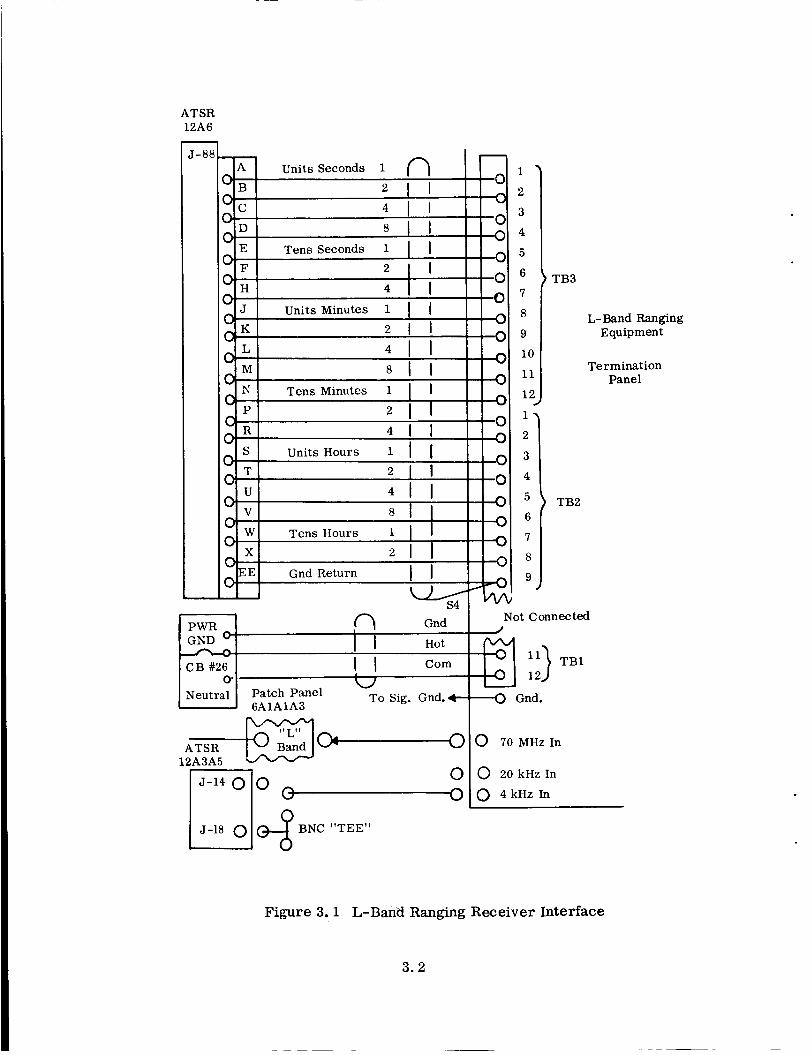
final interface configuration is shown in figure 3.1 Details of various changes are provided in the following paragraphs.
3.2 3.2.1 70-MHz Interface Modification
The
I N S TA L LA T I 0 N M O D 1 F I C A T I 0 N S
The ranging receiver was designed to provide optimum performance with
an input signal level of +5 dBm. An examination of the available 70-MHz signal level
at the ranging receiver input showed this level to be approximately -2 dBm. An
amplifier, which was surplus from a previous L-band experiment, was modified to
provide 12 dB of gain at 70 MHz. The input impedance of the amplifier was 7 0 ohms and the output impedance was set at 50 ohms to match the car r ie r track unit impedance.
This eliminated the need for the 70/50 ohm matching circuit originally incorporated in
the equipment design.
A 2:l power divider was added following the 12-dB amplifier to provide 70-MHz outputs, each at +5 to +7 dBm nominal.
unit input, while the other is brought out to the front panel to provide a 70-MHz signal monitor point.
3.2.2 20-kHz Modification
One output serves as the car r ie r track
The 20-kHz reference tone which is taken from the ATSR ranging equipment
was found to be only 0.3 V, whereas the ranging receiver requires 0.5 V for normal
operation.
attenuator were added. input to the ranging receiver.
To raise this signal to an acceptable- level an H P 461 amplifier and an
These provided a minimum of 1.5 V at the reference tone
3.1
ATSR 12A6 -
1-88 1
2
3
4
5
6
7
8
9
10
11
1 2
1 ,
2
3
4
5
6
7
8
9
n Grid I .Not Conn
TB3
L-Band Ranging Equipment
Termination Panel
ATSR 12A3A5
0
I J-18 014 BNC "TEE"
TB2
0 70 MHz In
0 20 kHz In
0 4 kHz In
lec ted
TB1
Figure 3 .1 L-Band Ranging Receiver Interface
3 .2
3 . 2 . 3 Grounding Modification
To conform to station grounding requirements a ground bus was installed
within the ranging receiver cabinet.
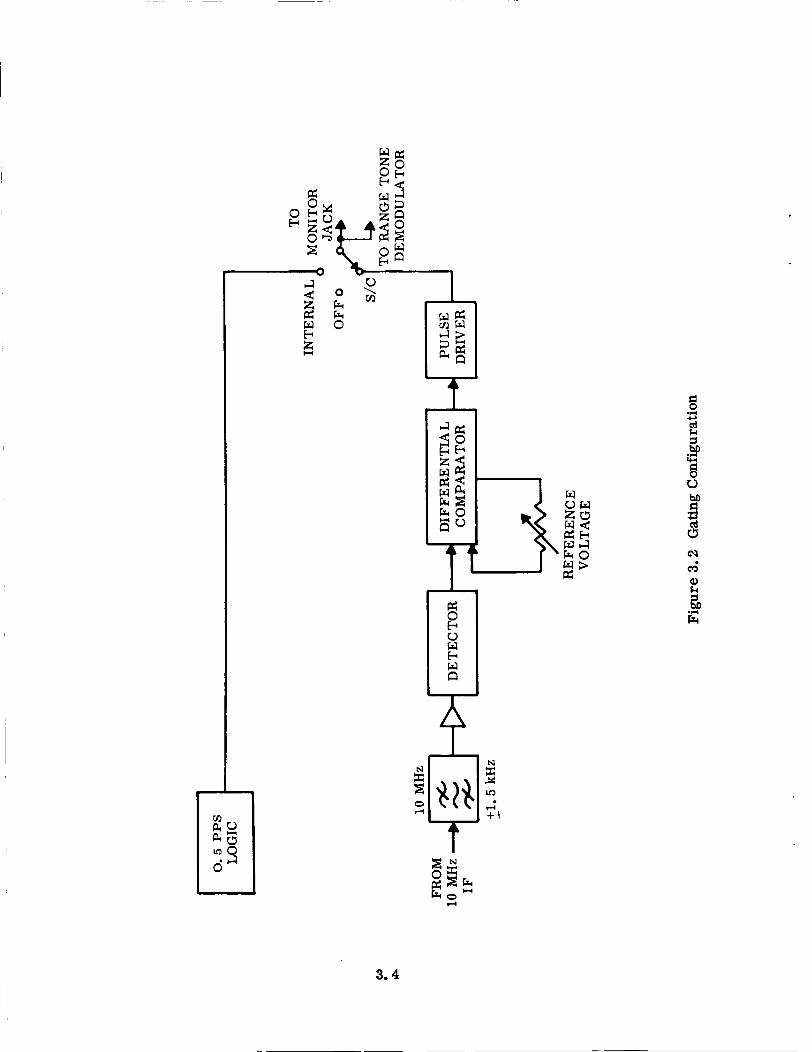
3 . 2 . 4 Gating Modifications
The ranging receiver was originally designed to use the spin scan
synchronizer to gate the ranging receiver in synchronism with the spin of ATS-5.
Under test conditions it proved to be inconvenient to use this configuration. To circum-
vent this situation a gating circuit (detailed below) was added. This circuit gated on the
received signal and did not necessitate using the spin scan synchronizer. The spin scan input was not removed, however. A switch was also added to permit switching from
the new gating circuit in the operational mode to an internally generated 0. 5 PPS gate
for testing and for use with CW signals.
The circuit shown in figure 3 . 2 was added to provide gating from the space-
craft signal.
filters it (3-kHz bandwidth), and adds amplification and detection to produce an output
proportional to carr ier level.
in a differential detector. When the received level exceeds the reference level, the differential detector is turned on.
received signal, is adjusted in width by varying the reference voltage (turn on/turn
off point). The voltage level is set to discriminate against the side-lobe signals of the
revolving satellite antenna by adjusting the "turn on" point high enough s o that only the main-lobe signal level will actuate the differential detector output.
a driver circuit, which in turn supplies a control pulse for the carr ier track unit and
range demodulator.
3 . 2 . 5 Mechanical Modifications
This circuit takes a sample from the 10-MHz phase locked loop IF,
This level is compared to an adjustable reference level
The resulting pulse, centered about the peak of the
The pulse feeds
Several mechanical changes were made to improve the equipment installation:
1. A shelf was added above the tape punch to act as a guide for cables
attached to the carrier track unit. Cables were spiral wrapped for more uniform conformance to
drawer movement when drawers a r e opened.
A dual outlet box was mounted in place of a single outlet box inside
of the rack so that power could be applied to a H P 461 amplifier
mounted inside the rack.
2.
3.
3 . 3
w
3.4
3.3 E X P E R I M E N T T E S T R E S U L T S
Following equipment installation and checkout at Mojave, two variations
of ranging experimentation were initiated:
(a) (b)
Ranging on ATS-5 via simultaneous C-band and L-band
Position location determination via ATS-1 (C -band) and ATS-5
(L-band)
The first experiment compares ranging measurements at each frequency
band against the predicted range obtained from the Goddard Orbit Determination
Program. The second experiment indicates position location capabilities utilizing
two satellites and a knowledge of altitude a t the measuring point. L-band ranging data was collected on an eight-level punched paper tape as described elsewhere in
this report. The C-band data was punched into a five-level tape by the ATSR equip-
ment installed at each of the ATS stations. The paper tapes were returned to
Westinghouse at Baltimore for processing. A computer processing program was developed which includes several calculations and methods of data presentation.
details of this program and the data derived therefrom will be presented in another
report. However, typical ranging data results for each of the above two experiments
are presented below.
3.3.1 Simultaneous Ranging on ATS-5
The
Data for this experiment was collected for several different ground L-band
transmitter power levels to determine the effects of degraded signal-to-noise ratios
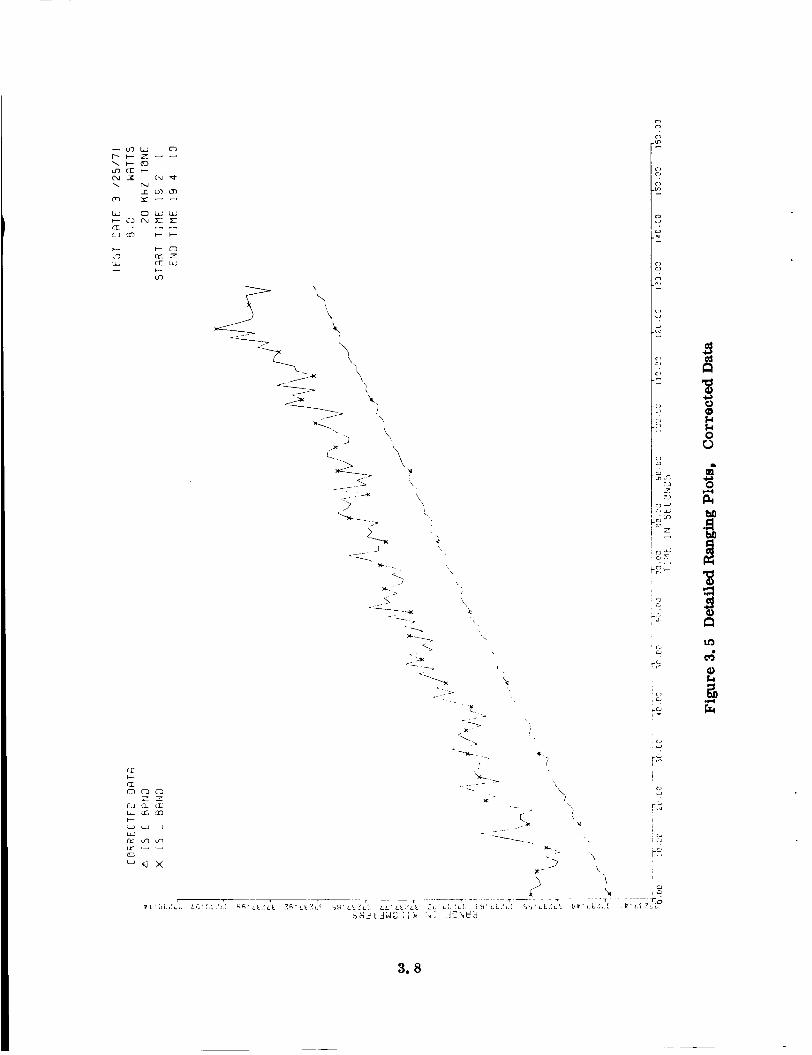
on the L-band ranging accuracy. Each test run was conducted for a 3-minute period to obtain sufficient datapoints to ensure a good analysis. Table 3.1 summarizes the
data obtained on one test day (25 March 1971). The range distances shown in the table
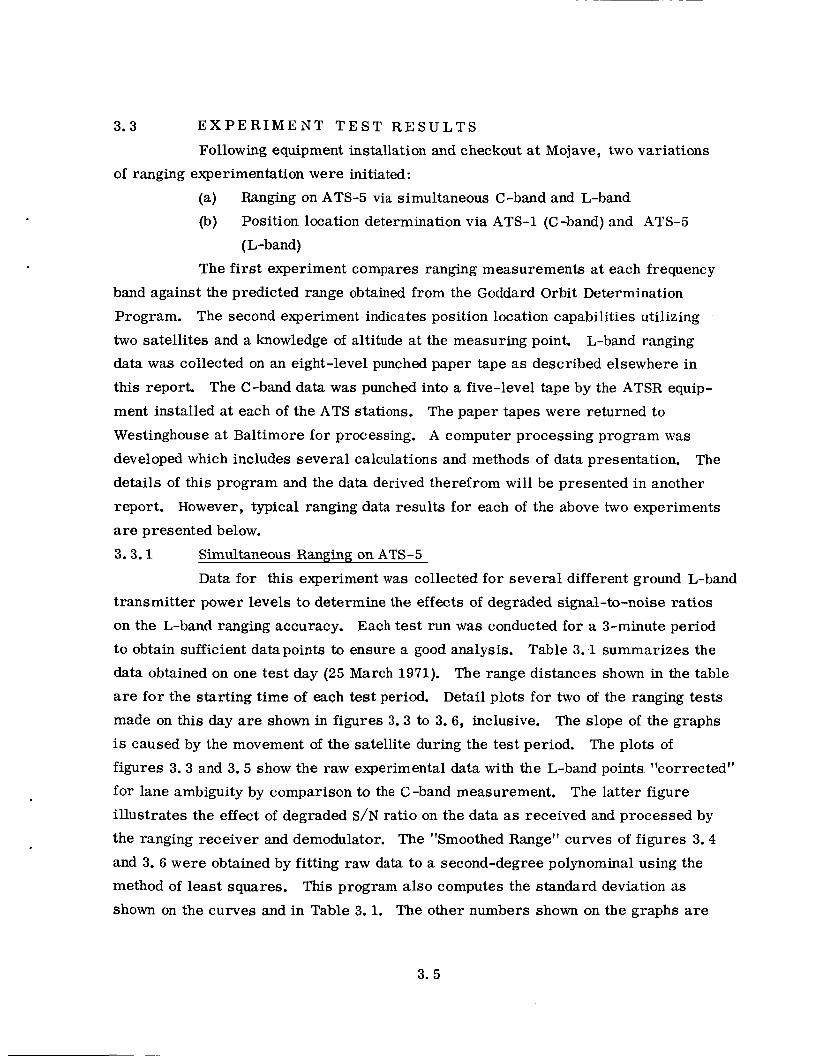
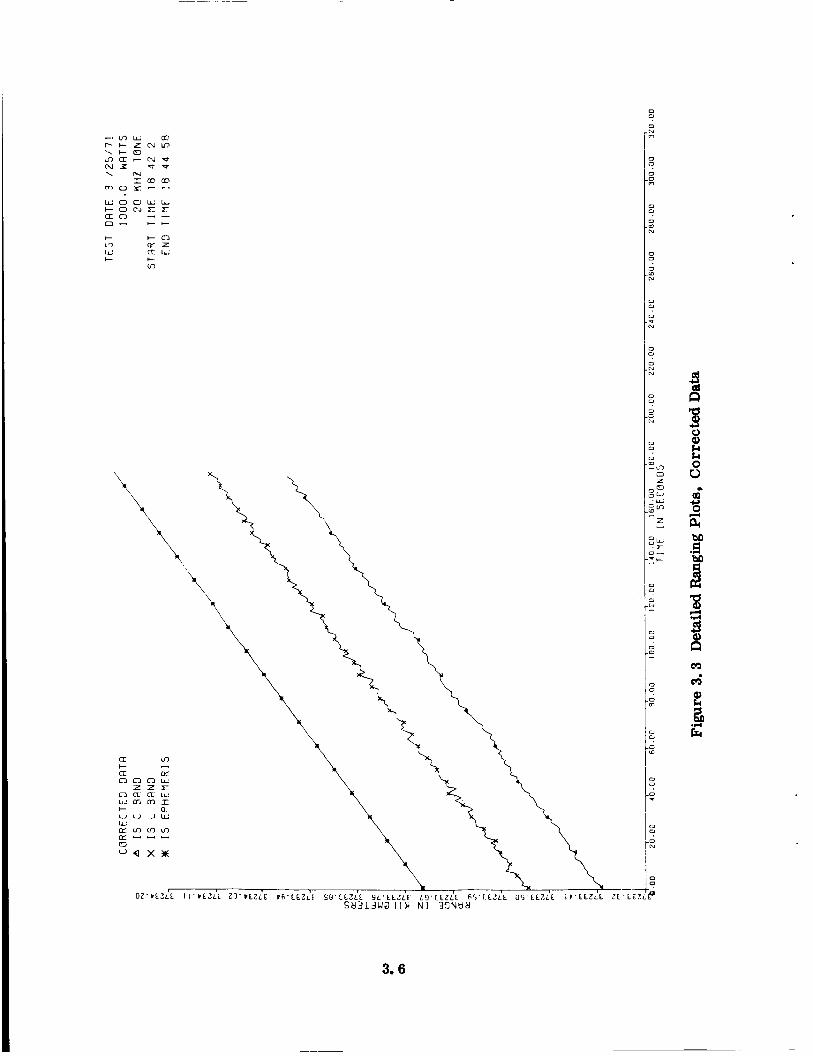
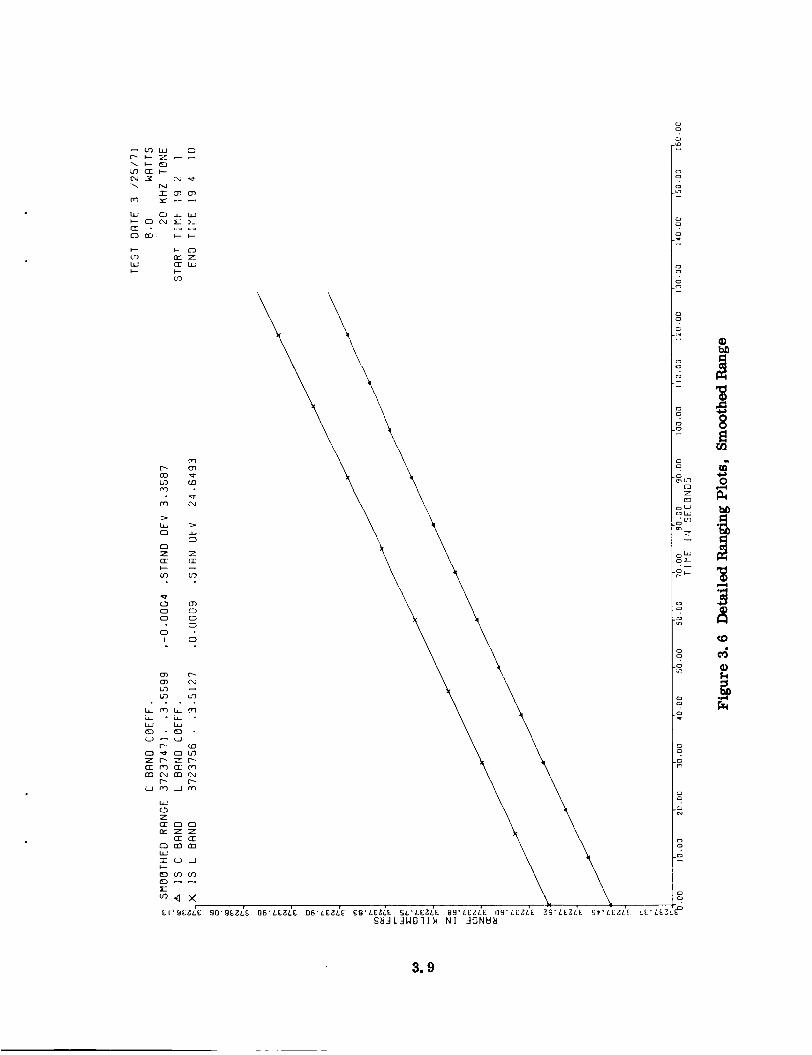
are for the starting time of each test period. Detail plots for two of the ranging tests made on this day are shown in figures 3.3 to 3.6, inclusive. The slope of the graphs
is caused by the movement of the satellite during the test period. The plots of
figures 3.3 and 3.5 show the raw experimental data with the L-band points "corrected" for lane ambiguity by comparison to the C-band measurement.
illustrates the effect of degraded S/N ratio on the data as received and processed by
the ranging receiver and demodulator. The "Smoothed Range" curves of figures 3.4
and 3. 6 were obtained by fitting raw data to a second-degree polynominal using the
method of least squares.
shown on the curves and in Table 3.1. The other numbers shown on the graphs are
The latter figure
This program also computes the standard deviation as
3. 5
0 0
3.6
0
F.
0 0
0
m
0
0 m N
0 0
J m N
0 0
0 -9 N
0 0
- Y
N N
0 u
2 N
3.7
u O W L + i3 N 7.- r c1m I - +
. .- .-
3. 8
P 03 L7 m m
w L a 0 z a I- cn
9 0 0 0
0 I
cn m L? b?
LLm L L - LL: Q * 0 -
0 - Z P E m
P an)
LL: 0 z ,x
0 LL: I c E3 Q E m E l
. .
r.
r n N
a
3.9
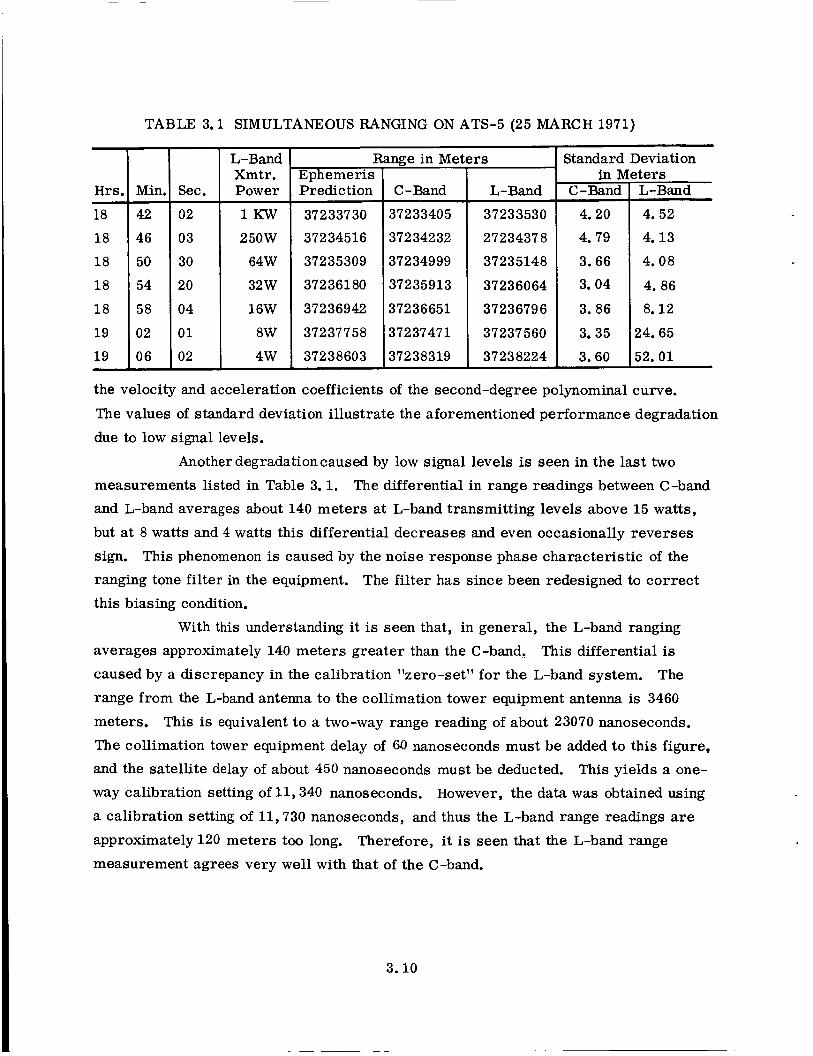
TABLE 3.1 SIMULTANEOUS RANGING ON ATS-5 (25 MARCH 1971)
Sec. I L-Band
Xmtr. Power
02
03
30
20
04
01
02
1 K W
250W
64W
32W
16W
8W
4w
Ephemeris Prediction
4 .20
4. 79
3 .66
3 .04
3. 86
3.35
3 .60
Rawe in Met
4. 52
4 . 1 3
4 . 0 8
4. 86
8.12
24 .65
52 .01
37233730
3 72 345 16
37235309
372 36 1 80
37236942
37237758
37238603
C-Band 37233405
372 342 32
37234999
37235913
37236651
37237471
37238319
rs
L-Band
37233530
27234378
37235148
37236064
37236796
37237560
37238224
Standard Deviation in Meters
C-Band I L-Band
the velocity and acceleration coefficients of the second-degree polynominal curve.
The values of standard deviation illustrate the aforementioned performance degradation
due to low signal levels.
Another degradation caused by low signal levels is seen in the last two measurements listed in Table 3.1 .
and L-band averages about 140 meters at L-band transmitting levels above 15 watts,
but at 8 watts and 4 watts this differential decreases and even occasionally reverses
sign. This phenomenon is caused by the noise response phase characteristic of the
ranging tone filter in the equipment. The filter has since been redesigned to correct
this biasing condition.
The differential in range readings between C-band
With this understanding it is seen that, in general, the L-band ranging
averages approximately 140 meters greater than the C-band. This differential is
caused by a discrepancy in the calibration "zero-set" for the L-band system. The
range from the L-band antenna to the collimation tower equipment antenna is 3460
meters. This is equivalent to a two-way range reading of about 23070 nanoseconds.
The collimation tower equipment delay of 60 nanoseconds must be added to this figure,
and the satellite delay of about 450 nanoseconds must be deducted. This yields a one-
way calibration setting of 11,340 nanoseconds. However, the data was obtained using
a calibration setting of 11,730 nanoseconds, and thus the L-band range readings are approximately120 meters too long. Therefore, it is seen that the L-band range
measurement agrees very wel l with that of the C-band.
3 .10
I .
Comparison of the C -band ranging measurement with the ephemeris pre-
dictions reveals a bias of about 250 to 300 meters.
than the C-band measurement. Inquiry has revealed that the antenna location used for
ephemeris calculations is approximately 1 7 meters north and 89 meters west of that used by the ATS project. If the ephemeris program actually is in e r ror , a very small
amount of the observed differential is explained. However, other constants in the
ephemeris program, such as the value used for Earth radius at Mojave could also be
contributing to the bias. Finally, a differential between Rosman and Mojave range
readings could also be causing the ephemeris determination of S/C location to be displaced sufficiently to cause the 250- to 300-meter discrepancy at Mojave. For
example, averaging the readings from two o r more stations could easily cause the
predicted position of the satellite to be displaced from Mojave's range reading by the observed variance. This discrepancy will be further investigated at a later point in
the program. 3.3.2 Position Location Determination
The ephemeris range is longer
Data for this experiment was collected by r'anging on the ATS-1 satellite
with the ATSR C-band ranging system and on the ATS-5 satellite with the L-band
ranging system. Each test run collected three minutes of concurrent data from each
satellite.
data for the satellite latitude, longitude, geocentric elevation, and slant range for both
ATS-1 and ATS-5 during the test interval. From this and the measured data, position
location scatter plots can be made to locate the measuring point, which in this case is
the Mojave ground station.
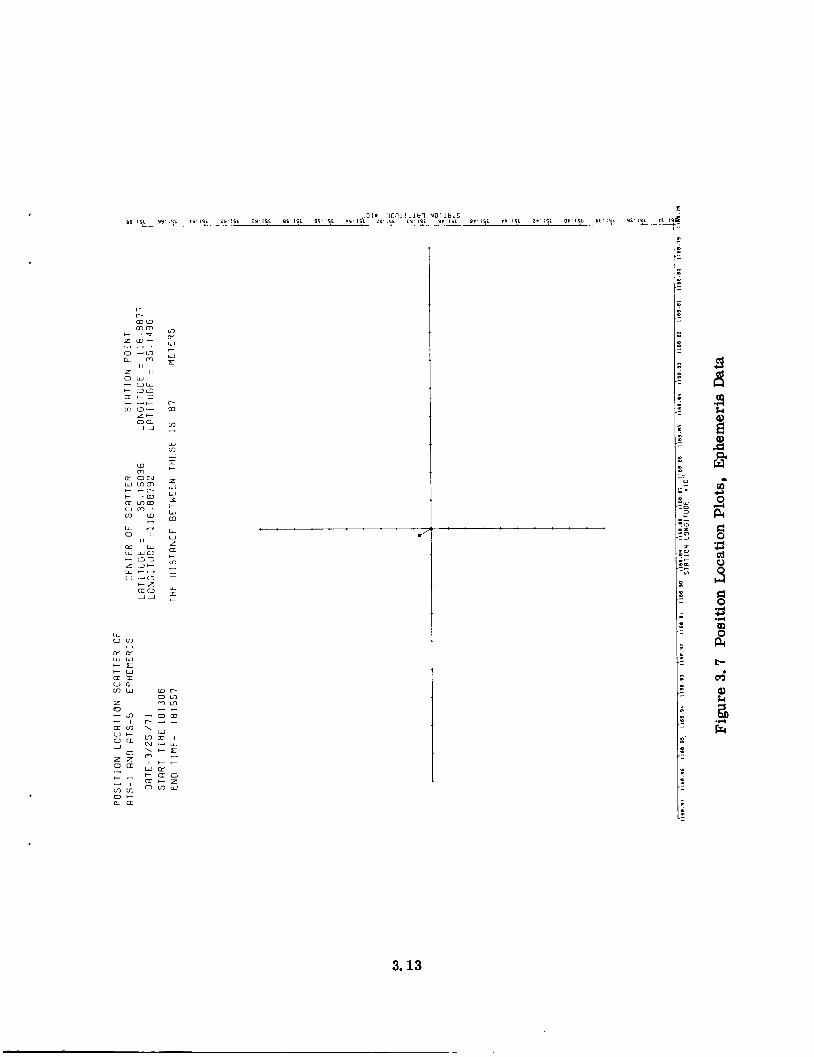
The first step in the reduction of these readings was to obtain the emphemeris
The ephemeris data magnetic tapes had not been received at this time, but For the first position location test several of the ephemeris printouts were available.
run on 25 March 1971 (1813062 - 1815572) three points, one at the beginning, one in
the middle, and one at the end of the test run, were extracted and manually entered
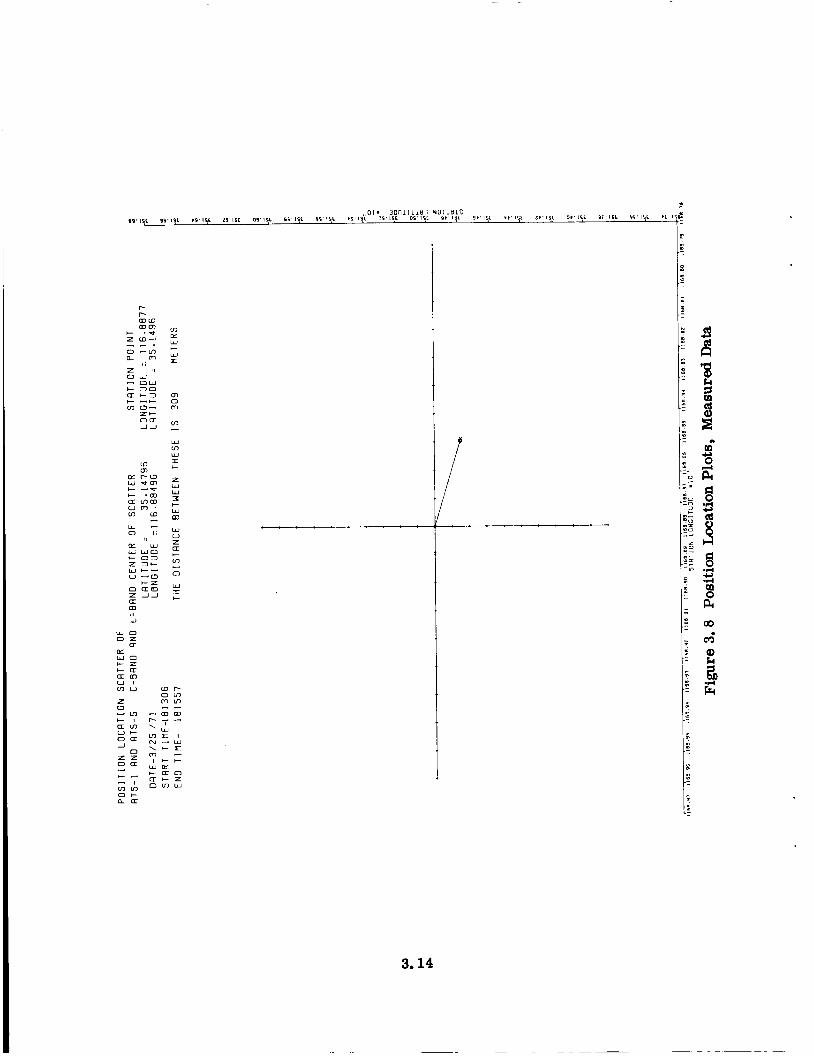
into the position location computer program. and 3.8 were computed.
data and attempts to return to the station, which was the point from which this ephemeris data was calculated.
ments received at these three times and attempts to locate the point from which the
From this, the plots shown in figures 3.7
The first plot (figure 3. 7) takes the slant range ephemeris
The second plot (figure 3.8) substitutes the actual range measure-
range measurements
returned to within 87
meters.
were performed. The results showed that the ephemeris data
meters of the station and the measured data was within 309
3.11
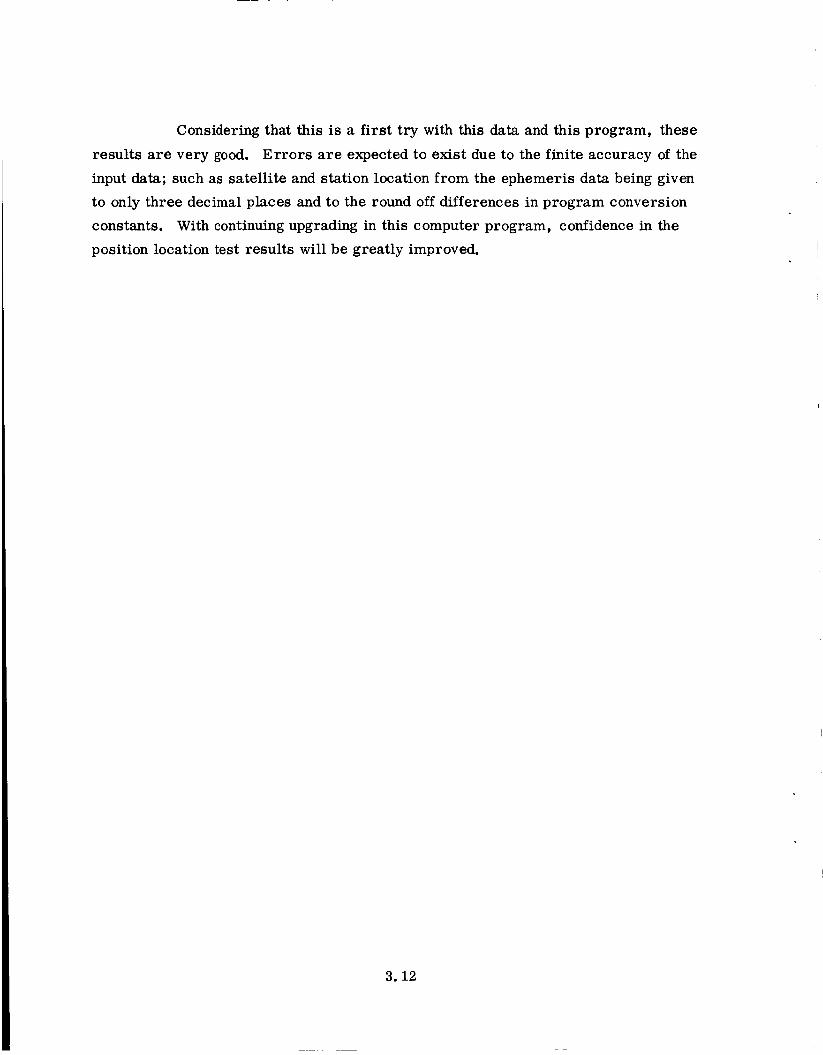
Considering that this is a first try with this data and this program, these
results are very good. E r r o r s are expected to exist due to the finite accuracy of the
input data; such as satellite and station location from the ephemeris data being given
to only three decimal places and to the round off differences in program conversion
constants. With continuing upgrading in this computer program, confidence in the
position location test results will be greatly improved.
3.12
P m w +mz
a , * $
Z W - , - - . 0 -L7 -
w I n L
a = r n t
O t n u
3.13
z ' I o w - o w I- 30
+ - e 0 a c 2 m m m - m zc oa JJ 2
3.14
APPENDIX A
DETAILED RANGE DEMODULATOR ANALYSIS
R A N G E D E M O D U L A T O R The range demodulator utilizes information in the baseband signal (from
the car r ie r track receiver) to reconstruct either the 4-kHz or the 20-BHz propagation-
delayed range tone.
tone is periodically measured to obtain a sequence of estimates of the total propagation
delay. The measurement and display/printout period corresponds to the spin period of
the ATS-5 spacecraft.
The delay between this replica and the corresponding reference
Because of the ATS-5 spin, the range information in the baseband signal
is contained in periodic bursts.
additive, wideband noise and by distortion introduced in the tracking receiver.
distortion is of concern during the initial portion of each burst interval as the tracking receiver attempts to acquire the carrier. This distortion, along with reduced signal
levels, severely restricts the range information available during the initial and final
portions of each tone burst. These portions are therefore discarded, and the recon-
struction of the range tones is based solely on the remaining 40 msec. of each burst,
during which time the baseband signal-to-noise density power ratio is reasonably con-
stant at approximately 48 dB-Hz. This value is based upon the expected satellite-to-
aircraft link conditions as given inthe link calculation table. A s was done for the
car r ie r track loop, a 3-dB margin has been introduced, reducing the minimum input
S/N , for design purposes, to 45 dB-Hz over each 40-msec. viewing interval.
The tones contained in these bursts are corrupted by
This
0 The delay between the reconstructed tone (actually a square wave) and the
baseband signal during each 40 msec. viewing interval is measured by counting the
time in increments of 20 nsec. between the crossover points of the two tones; that is, the time from one signal exceeding its mean value to the other signal exceeding its
mean value.
prior to the delay measurement. One such delay measurement is obtained for each
cycle of the range tone, or once every 50 usec. for the 20-kHz tone and once every 250
usec. for the 4-kHz tone.
The crossover points for the baseband tone are obtained by hard-limiting
A. 1
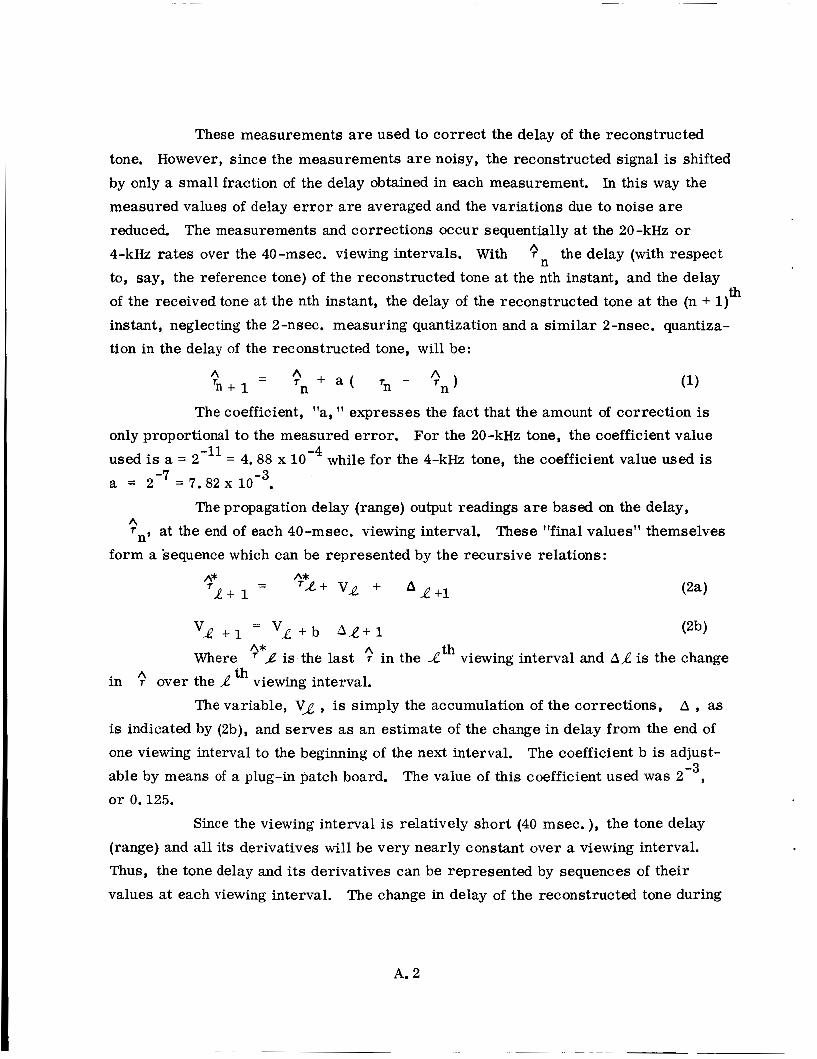
These measurements are used to correct the delay of the reconstructed
tone. However, since the measurements are noisy, the reconstructed signal is shifted
by only a small fraction of the delay obtained in each measurement. In this way the
measured values of delay e r r o r are averaged and the variations due to noise are reduced, 4-kHz rates over the 40-msec. viewing intervals. With 3n the delay (with respect to, say, the reference tone) of the reconstructed tone at the nth instant, and the delay
of the received tone at the nth instant, the delay of the reconstructed tone at the (n + 1)
instant, neglecting the 2-nsec. measuring quantization and a similar 2-nsec. quantiza-
tion in the delay of the reconstructed tone, will be:
The measurements and corrections occur sequentially at the 20-kHz o r
th
(1)
The coefficient, "a, expresses the fact that the amount of correction is For the 20-kHz tone, the coefficient value
while for the 4-kHz tone, the coefficient value used is only proportional to the measured error.
used is a = 2-l1 = 4.88 x a = 2-7 = 7.82 x 1 O - g
The propagation delay (range) output readings are based on the delay, A 7 , at the end of each 40-msec. viewing interval. These "final values" themselves n
form a sequence which can be represented by the recursive relations:
Where ?*J is the last ? in the Rth viewing interval and A,L is the change A th in T over the A! viewing interval.
The variable, VJ , is simply the accumulation of the corrections, A , as is indicated by (2b), and serves as an estimate of the change in delay from the end of
one viewing interval to the beginning of the next interval. The coefficient b is adjust- able by means of a plug-in patch board. o r 0.125.
-3 The value of this coefficient used was 2 ,
Since the viewing interval is relatively short (40 msec. ), the tone delay
(range) and all its derivatives will be very nearly constant over a viewing interval. Thus, the tone delay and its derivatives can be represented by sequences of their
values at each viewing interval. The change in delay of the reconstructed tone during
A. 2
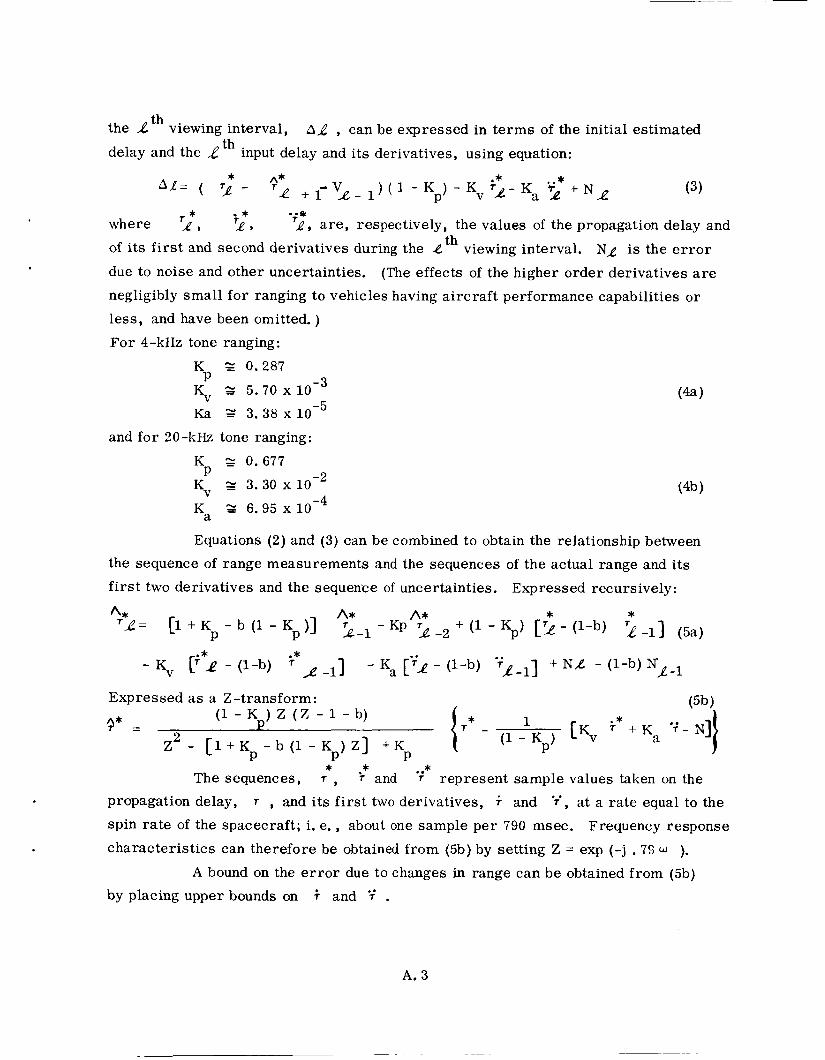
the Rth viewing interval,
delay and the R th input delay and i ts derivatives, using equation: A d , can be expressed in terms of the initial estimated
--PI 7 . * 2 , 1, are , respectively, the values of the propagation delay and I * where 1,
of its first and second derivatives during the 4
due to noise and other uncertainties. negligibly small for ranging to vehicles having aircraft performance capabilities o r
less, and have been omitted. )
For 4-kHz tone ranging: K Z 0.287
Kv 5.70 x 10 Ka 2 3.38 x
and for 20-kHz tone ranging:
P
th viewing interval. NA is the e r r o r
(The effects of the higher order derivatives are
-3 P
K z 0. 677
Kv z 3.30 x 10
Ka Z 6.95 x 10 (4b)
-2
-4
Equations (2) and (3) can be combined to obtain the relationship between
the sequence of range measurements and the sequences of the actual range and its
f i rs t two derivatives and the sequence of uncertainties. Expressed recursively:
(5b) Expressed as a Z-transform:
t .* T + Ka i'- N] 1
(1 - Kp) cKv (1 - K ) Z ( Z - 1 - b) * 3 =
Z 2 - [ 1 + K - b ( l - K p ) Z ] + K P P * ** . .* The sequences, 7 , 7 and T represent sample values taken on the
propagation delay, T , and its first two derivatives, and ' f , at a rate equal to the
spin rate of the spacecraft; i. e., about one sample per 790 msec. Frequency response
characteristics can therefore be obtained from (5b) by setting Z = exp (-j . 79
by placing upper bounds on i and i' .
). A bound on the e r ro r due to changes in range can be obtained from (5b)
A. 3
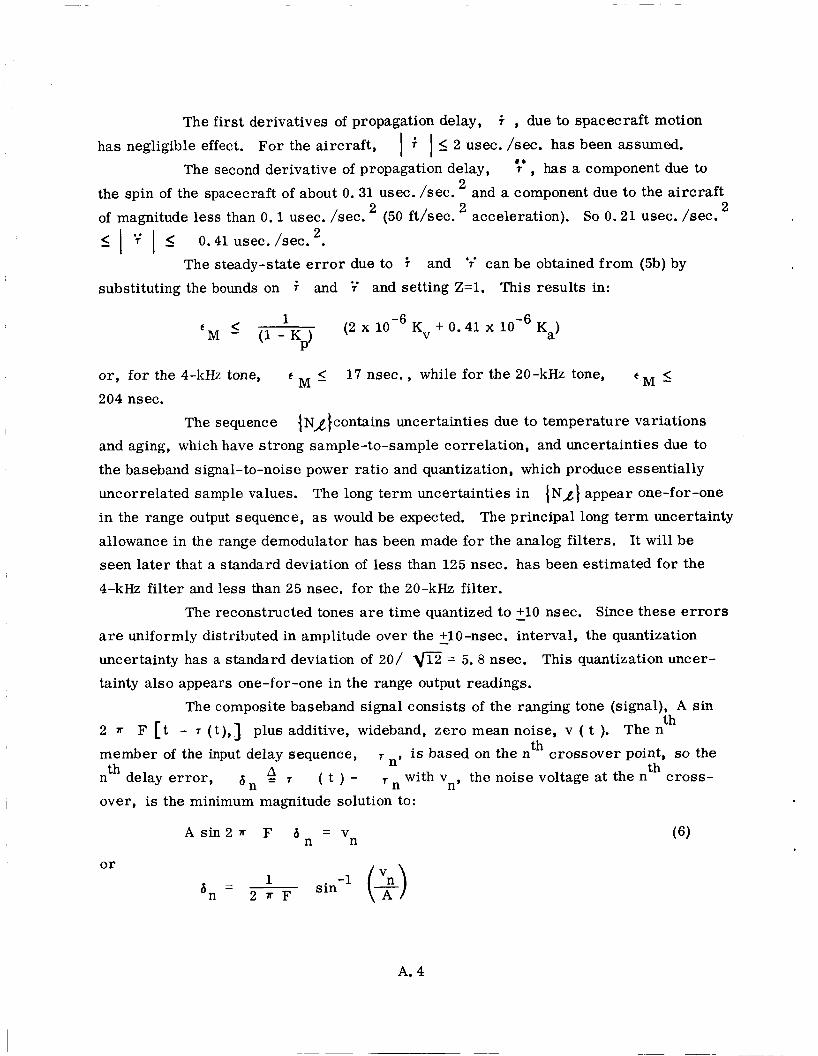
The first derivatives of propagation delay, i , due to spacecraft motion
has negligible effect. For the aircraft,
the spin of the spacecraft of about 0. 31 usec. /sec.
of magnitude less than 0 . 1 usec. /sec. (50 ft/sec. acceleration). So 0 . 2 1 usec. /sec.
I 1 7 I I substituting the bounds on and i' and setting Z=1. This results in:
1 I I 2 usec. /sec. has been assumed. a .
The second derivative of propagation delay, T , has a component due to
and a component due to the aircraft 2
2 0.41 usec. /sec. . The steady-state e r r o r due to i and i' can be obtained from (5b) by
(2 x Kv + 0 . 4 1 x Ka) 1 (1 - Kp' E M I
or, for the 4-kHz tone, c < 17 nsec., while for the 20-kHz tone, c _<
204 nsec. M -
{ NA /contains uncertainties due to temperature variations
and aging, which have strong sample-to-sample correlation, and uncertainties due to
the baseband signal-to-noise power ratio and quantization, which produce essentially
uncorrelated sample values.
in the range output sequence, as would be expected. The principal long term uncertainty allowance in the range demodulator has been made for the analog filters. It will be
seen later that a standard deviation of less than 125 nsec. has been estimated for the
4-kHz filter and less than 25 nsec. for the 20-kHz filter.
The sequence
The long term uncertainties in { N A ~ appear one-for-one
The reconstructed tones are time quantized to 210 nsec. Since these e r r o r s
are uniformly distributed in amplitude over the - +lo-nsec. interval, the quantization
uncertainty has a standard deviation of 20/
tainty also appears one-for-one in the range output readings. = 5. 8 nsec. This quantization uncer-
The composite baseband signal consists of the ranging tone (signal), A sin
2 = F [ t - T ( t ) , ] plus additive, wideband, zero mean noise, v ( t ). The n
member of the input delay sequence, T n, is based on the nth crossover point, so the th th n delay e r ror , 6, - 7 ( t ) - with v the noise voltage at the n cross-
over, is the minimum magnitude solution to:
th
4 n'
A s in 2 k F V n o r
- - 1 sin -1 p) 'n 2 * F
A. 4
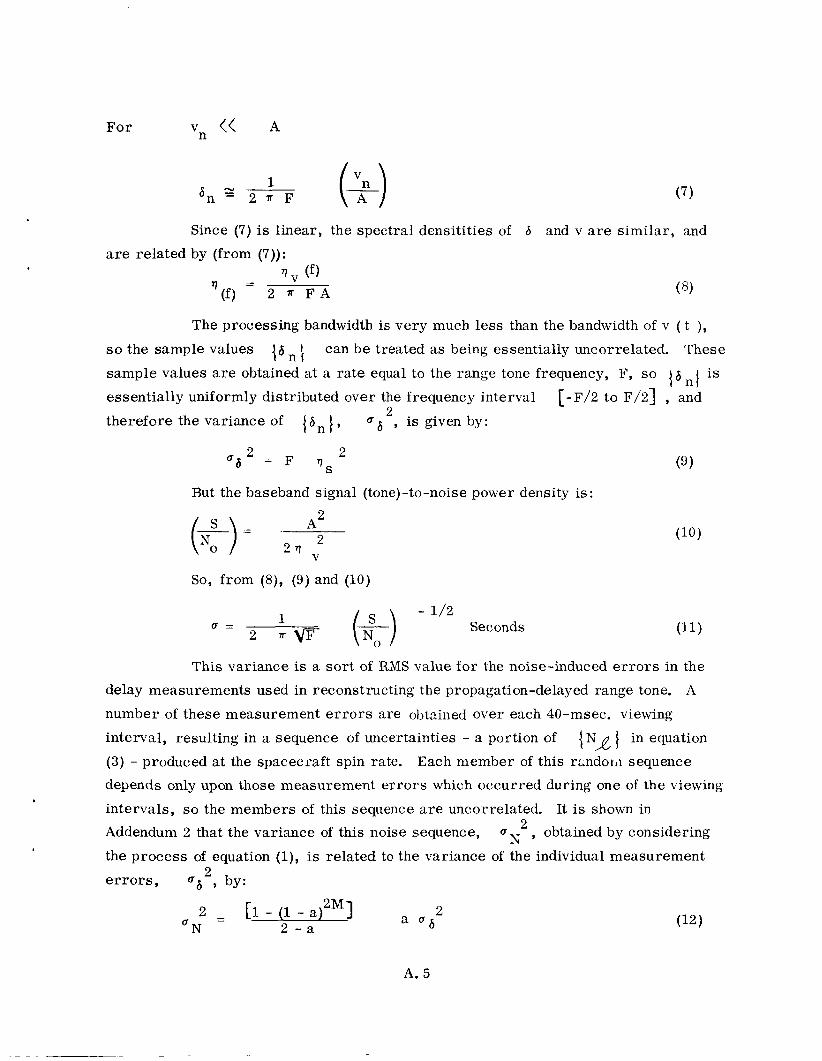
For
are related
v << A n
6, r 2 r F 1 (+) (7)
Since (7) is linear, the spectral densitities of 6 and v are similar, and by (from (7)):
1, (f) ? = (f) 2 = F A
The processing bandwidth is very much less than the bandwidth of v ( t ),
can be treated as being essentially uncorrelated. These 16nt so the sample values
sample values are obtained at a rate equal to the range tone frequency, F, so essentially uniformly distributed over the frequency interval
therefore the variance of { 6 , / ,
{ ' n / is [-F/2 to F/2] , and
2 u s , is given by:
2 2 ? S
o b = F
But the baseband signal (tone)-to-noise power density is:
A2 2
v (e) = 2 1
So, from (8), (9) and
1 u = 2 lrp
This variance is a sor t of RMS value for the noise-induced e r ro r s in the
delay measurements used in reconstructing the propagation-delayed range tone. A
number of these measurement e r r o r s are obtzined over each 40-msec. viewing
interval, resulting in a sequence of uncertainties - a portion of { N x 1 in equation
(3) - produced at the spacecraft spin rate. depends only upon those measurement e r rors which occurred during one of the viewing
intervals, so the members of this sequence a r e uncorrelated. It is shown in
Addendum 2 that the variance of this noise sequence, uN2 , obtained by considering
the process of equation (l), is related to the variance of the individual measurement
Each member of this rLndoili sequence
2 e r r o r s , 06 Y by:
A. 5
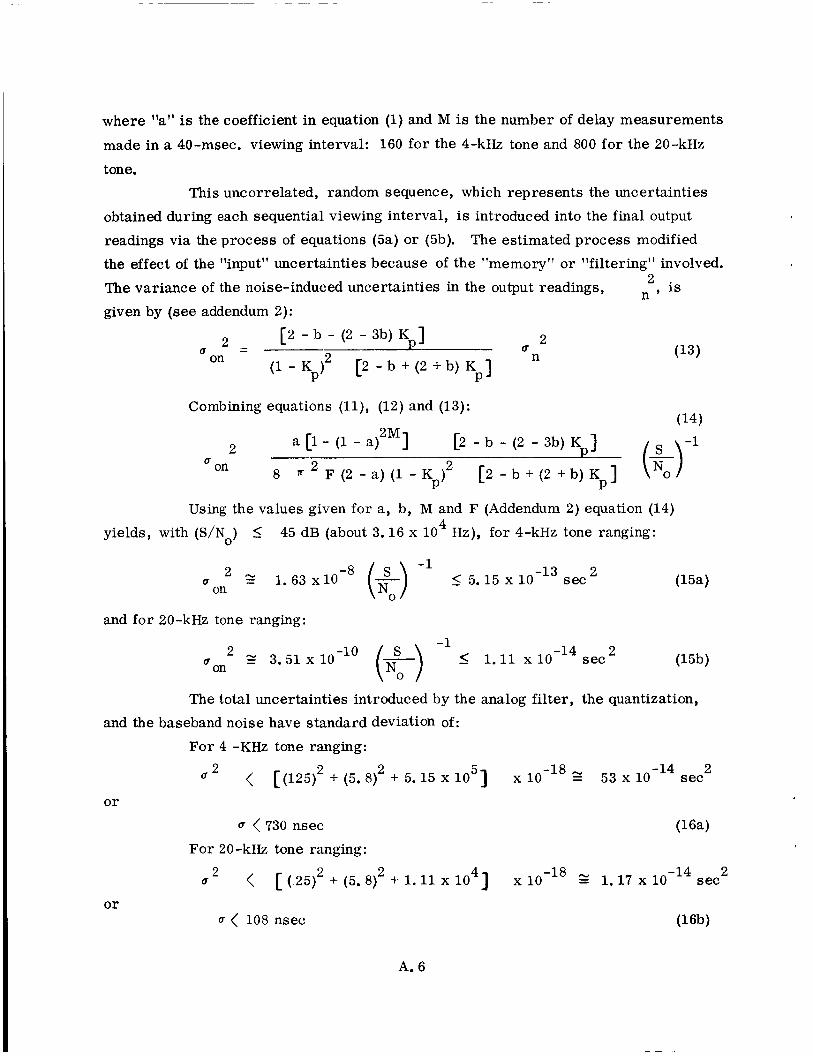
where Irarr is the coefficient in equation (1) and M is the number of delay measurements
made in a 40-msec. viewing interval: 160 for the 4-kHz tone and 800 for the 20-kHz
tone. This uncorrelated, random sequence, which represents the uncertainties
obtained during each sequential viewing interval, is introduced into the final output
readings via the process of equations (5a) or (5b).
the effect of the "input" uncertainties because of the "memory" or "filtering" involved.
The variance of the noise-induced uncertainties in the output readings,
given by (see addendum 2):
The estimated process modified
is n '
[2 - b - (2 - 3b) K 3 2 2 - - U n U
(1 - Kpf [2 - b + (2 + b) K 3 on P
(13)
Combining equations (ll), (12) and (13): (14) , ,
a [I - (1 - a t M ] [2 - b - (2 - 3b) K ] U on 2 8 2 F (2 - a) (1 - Kp)2 [2 - b + (2 + b) Kp] ($
Using the values given for a, b, M and F (Addendum 2) equation (14) 4 yields, with @/No) _< 45 dB (about 3.16 x 10 Hz), for 4-kHz tone ranging:
and for 20-kHz tone ranging:
The total uncertainties introduced by the analog filter, the quantization, and the baseband noise have standard deviation of:
For 4 -KHz tone ranging: 2 2 -14 2 < [(125)2 + (5.8) + 5.15 x lo5] x Z 53 x 10 sec
or < 730 nsec
For 20-kHz tone ranging:
-14 2 - 1.17 x 10 sec 2 2 u < [ (25)2 + (5.8) + 1.11 x lo4] x
or
A. 6
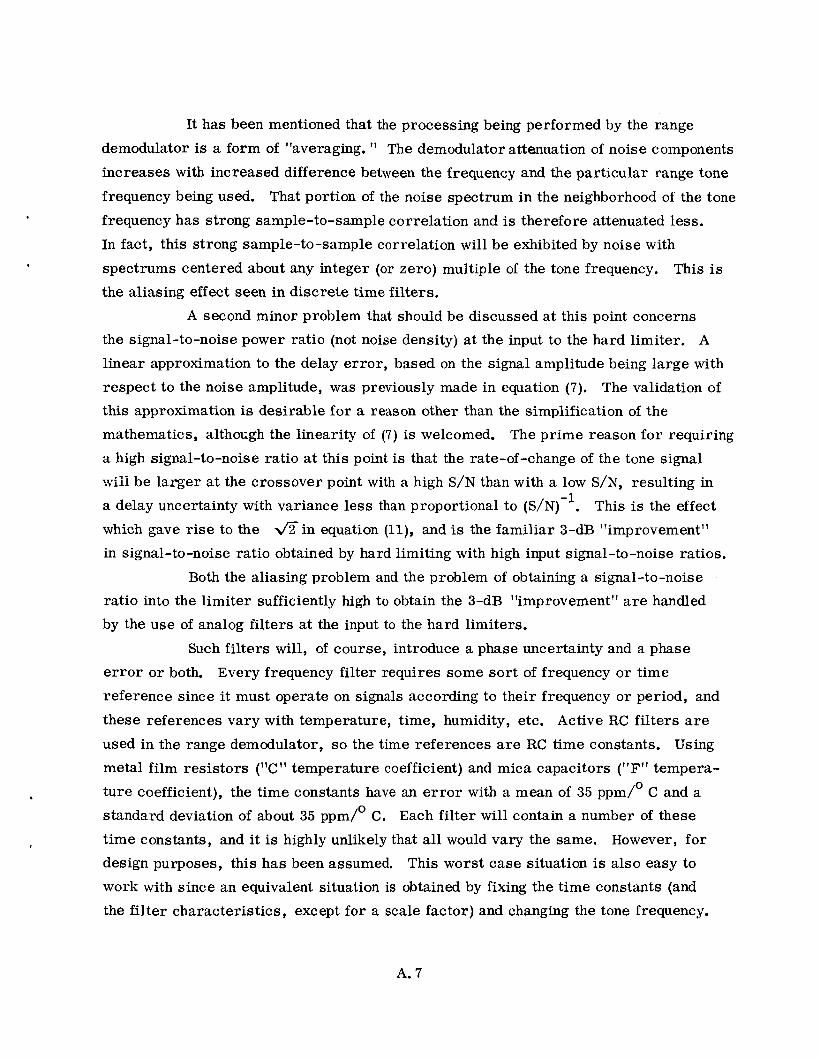
It has been mentioned that the processing being performed by the range
demodulator is a form of "averaging. " The demodulator attenuation of noise components increases with increased difference between the frequency and the particular range tone
frequency being used. That portion of the noise spectrum in the neighborhood of the tone
frequency has strong sample-to-sample correlation and is therefore attenuated less. In fact, this strong sample-to-sample correlation will be exhibited by noise with
spectrums centered about any integer (or zero) multiple of the tone frequency. the aliasing effect seen in discrete time filters.
This is
A second minor problem that should be discussed at this point concerns
the signal-to-noise power ratio (not noise density) at the input to the hard limiter. A
linear approximation to the delay e r ror , based on the signal amplitude being large with
respect to the noise amplitude, was previously made in equation (7). The validation of this approximation is desirable for a reason other than the simplification of the
mathematics, althocgh the linearity of (7) is welcomed.
a high signal-to-noise ratio at this point is that the rate-of-change of the tone signal will be larger at the crossover point with a high S/N than with a low S/N, resulting in
a delay uncertainty with variance less than proportional to (S/N)-'. This is the effect
which gave rise to the d i n equation (ll), and is the familiar 3-dB "improvement" in signal-to-noise ratio obtained by hard limiting with high input signal-to-noise ratios.
The prime reason for requiring
Both the aliasing problem and the problem of obtaining a signal-to-noise
ratio into the limiter sufficiently high to obtain the 3-dB "improvement" are handled
by the use of analog filters at the input to the hard limiters.
Such filters will, of course, introduce a phase uncertainty and a phase
e r r o r or both. Every frequency filter requires some sor t of frequency or time
reference since it must operate on signals according to their frequency o r period, and
these references vary with temperature, time, humidity, etc. Active RC filters are used in the range demodulator, so the time references are RC time constants. Using metal film resistors (tt" temperature coefficient) and mica capacitors ('IF" tempera-
ture coefficient), the time constants have an e r r o r with a mean of 35 ppm/' C and a standard deviation of about 35 ppm/' C. Each filter will contain a number of these
time constants, and it is highly unlikely that all would vary the same.
design purposes, this has been assumed. This worst case situation is also easy to
work with since an equivalent situation is obtained by fixing the time constants (and
the filter characteristics, except for a scale factor) and changing the tone frequency.
However, for
A. 7
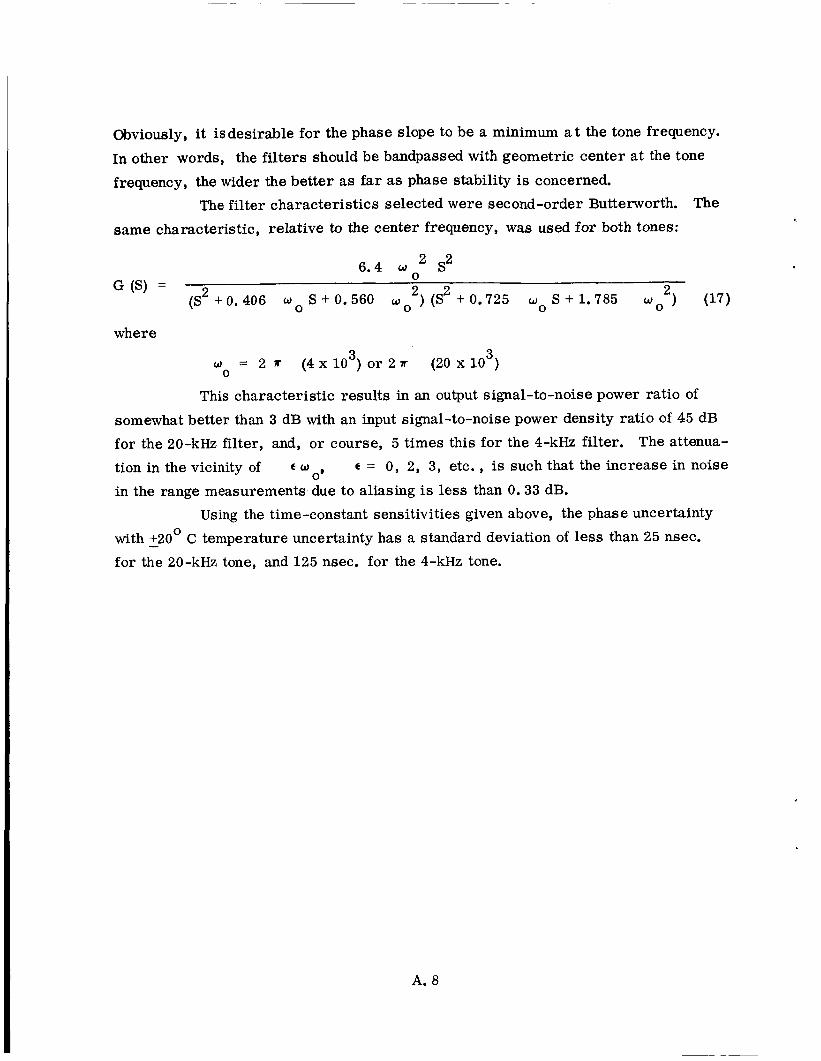
Obviously, it is desirable for the phase slope to be a minimum a t the tone frequency.
In other words, the filters should be bandpassed with geometric center a t the tone
frequency, the wider the better as far as phase stability is concerned. The filter characteristics selected were second-order Butterworth.
same characteristic, relative to the center frequency, was used for both tones:
The
6 . 4 o n2 S2 U
G (S) = 2 2 2 (S2+0.406 w o S + 0 . 5 6 0 w 0 ) ( S +0.725 w 0 S + l . 7 8 5 w 0 ) (17)
where 3 3
w = 2 * ( 4 x l O ) o r 2 * ( 2 0 x 1 0 ) 0
This characteristic results in an output signal-to-noise power ratio of
somewhat better than 3 dB with an input signal-to-noise power density ratio of 45 dB for the 20-kHz filter, and, or course, 5 times this for the 4-kHz filter. The attenua-
t = 0, 2, 3, etc. , is such that the increase in noise tion in the vicinity of
in the range measurements due to aliasing is less than 0.33 dB.
with - +20° C temperature uncertainty has a standard deviation of less than 25 nsec. for the 20-kHz tone, and 125 nsec. for the 4-kHz tone.
0' w
Using the time-constant sensitivities given above, the phase uncertainty
A. 8
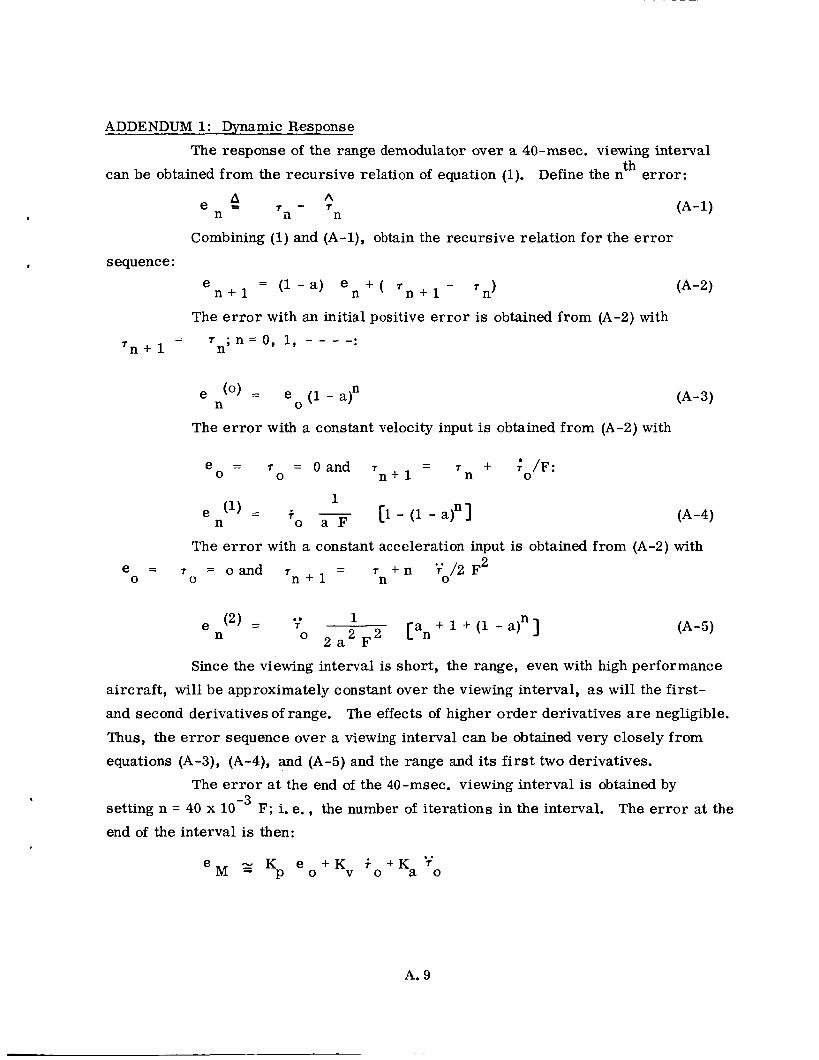
ADDENDUMl: Dyn amic Response
.
The response of the range demodulator over a 40-msec. viewing interval th can be obtained from the recursive relation of equation (1). Define tbe n error :
h T - T
A e = n il n
Combining (1) and (A-1), obtain the recursive relation for the e r r o r
sequence:
e n + l = (1 - a ) e n + ( r n + l - Tn)
The e r r o r with an initial positive e r r o r is obtained from (A-2) with T ~ ; n = 0, 1, - - - -:
The e r r o r with a constant velocity input is obtained from (A-2) with
e = 0
T = 0
0 and - - T n + l
T n t /F:
0
The e r r o r with a constant acceleration input + n ~ / 2 F~ - -
n + l n 0 e = T = o a n d T 0 0
(A-1)
(A-2)
(A-3)
(A-4)
is obtained from (A-2) with
(A-5)
Since the viewing interval is short, the range, even with high performance
aircraft, will be approximately constant over the viewing interval, as will the first-
and second derivatives of range.
Thus, the e r r o r sequence over a viewing interval can be obtained very closely from equations (A-3), (A-4), and (A-5) and the range and its first two derivatives.
The effects of higher order derivatives are negligible.
The e r r o r at the end of the 40-msec. viewing interval is obtained by
F; i. e. , the number of iterations in the interval. The e r r o r at the -3 setting n = 40 x 10
end of the interval is then: ..
e M K e o + K v i O + K a ~ , P
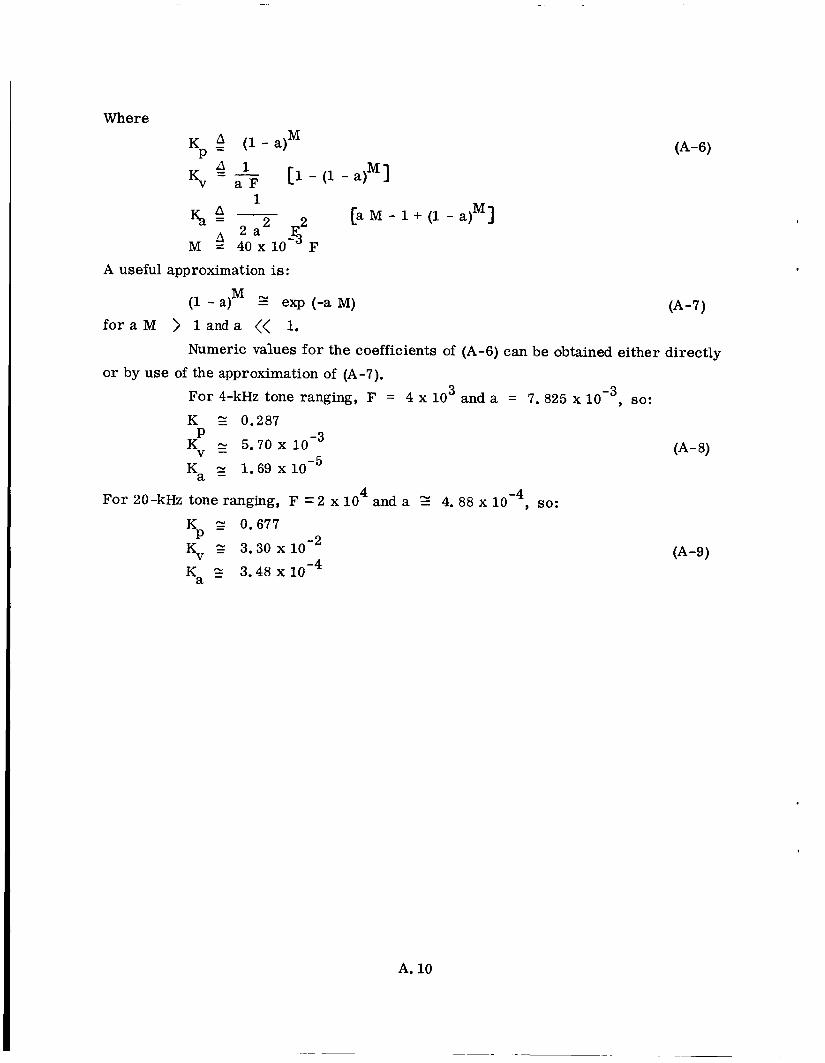
Where
M 1 % 2 - 2 [ a ~ - l + ( l - a ) 3
A useful approximation is:
(1 - alM s exp (-a M)
for a M > 1 anda << 1.
For 20-kHz tone ranging, F = 2 x 10 4 and a Z 4. 88 x 10 -4 , so:
K z 0.677
Kv s 3.30 x K~ r 3.48 x
P
(A-7)
Numeric values for the coefficients of (A-6) can be obtained either directly or by use of the approximation of (A-7).
For 4-kHz tone ranging, F = 4 x 10 3 and a = 7.825 x so:
K Z 0.287 P -3 Kv g 5 . 7 0 ~ 10
Ka 1 .69 x 10 -5 (A-8)
(A-9)
A. 10
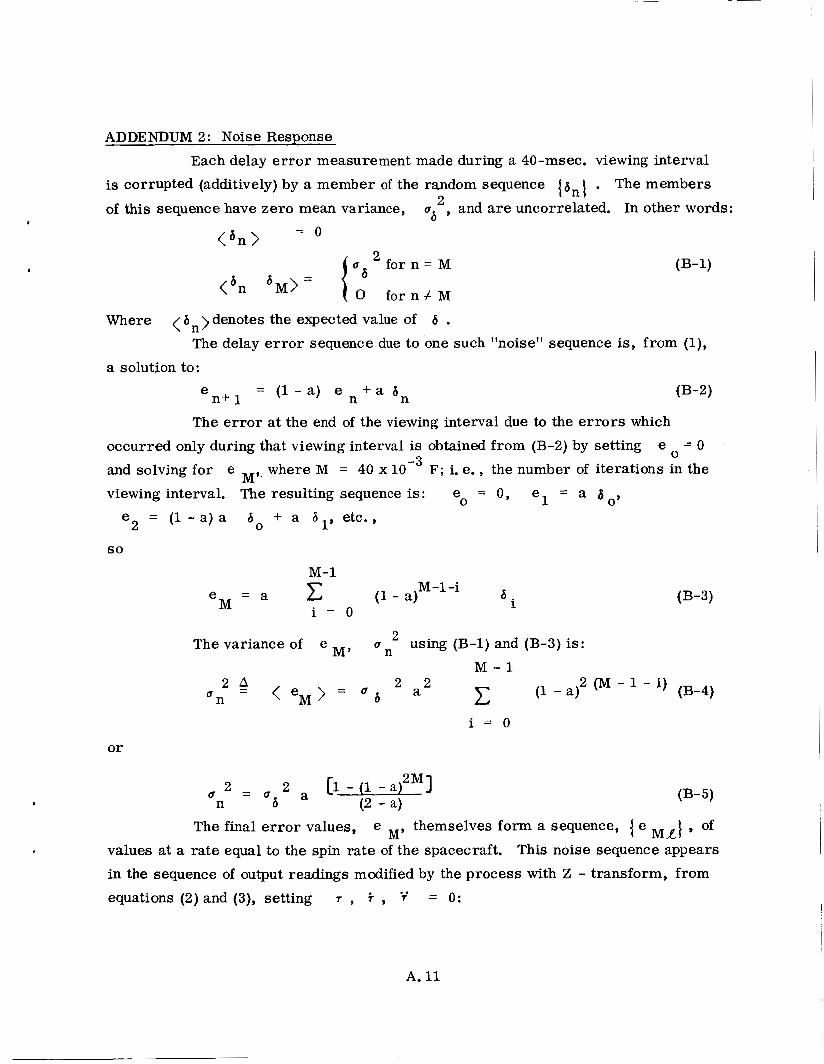
ADDENDUM 2: Noise Response Each delay e r r o r measurement made during a 40-msec. viewing interval
is corrupted (additively) by a member of the random sequence ( b n \ . The members
of this sequence have zero mean variance, 2 , and are uncorrelated. In other words : "6 = o
< b n >
.
Where < h n > denotes the expected value of 6 .
a solution to:
The delay e r r o r sequence due to one such "noise" sequence is, from (l),
e n+ 1 = (1 -a ) e n + a b n (B-2)
The e r r o r at the end of the viewing interval due to the e r r o r s which e occurred only during that viewing interval is obtained from (B-2) by setting = 0
and solving for e where M = 40 x F; i. e., the number of iterations in the
viewing interval. The resulting sequence is: e = 0, e l = a 8 o,
0
M '.
e = ( 1 - a ) a + a d l , etc., 0
2
so
M-1
u using (B-1) and (B-3) is: M' n The variance of e M - 1
(B-4) 2 (M - 1 - i) c (1 - a)
2 A 2 2 u n = < e M > = c 6 a
i = O
or
(B-5)
M R I ' Of values at a rate equal to the spin rate of the spacecraft. This noise sequence appears
in the sequence of output readings modified by the process with Z - transform, from
equations (2) and (3), setting T , i , T = 0:
The final e r r o r values, e M, themselves form a sequence, { e
..
A. 11
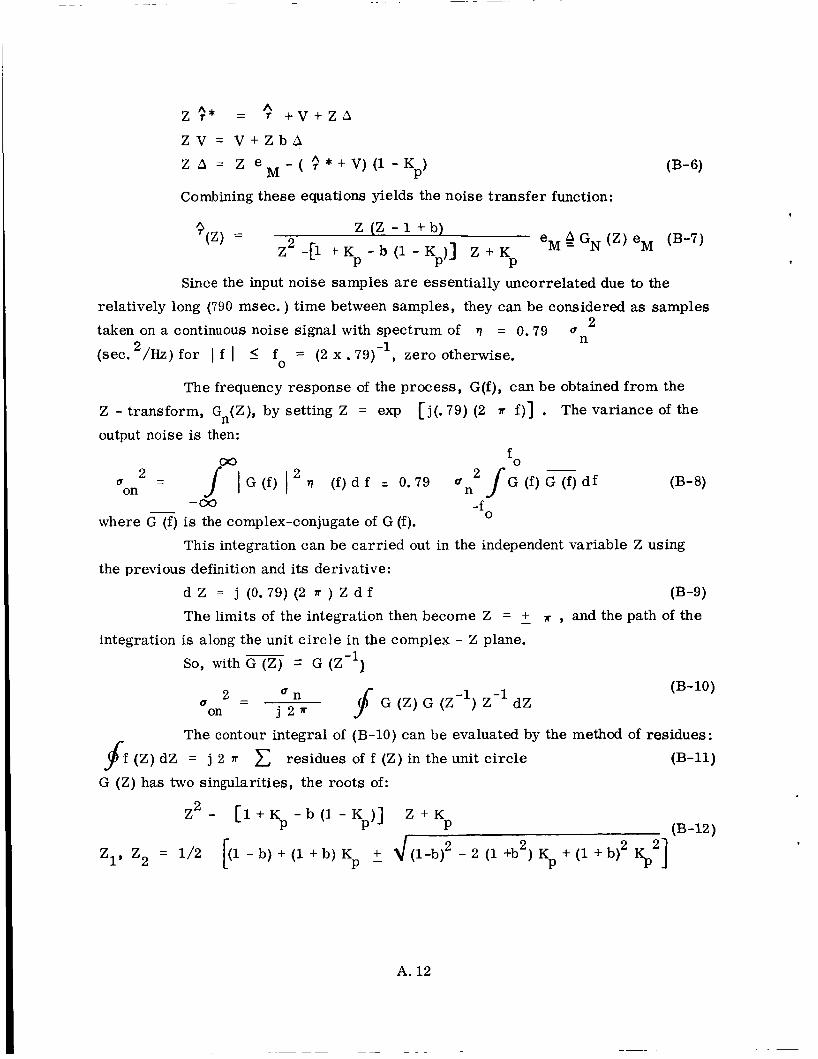
A Z $ * = T + V + Z A
Z V = V + Z b A
KP’ Z A = Z e - ( ? * + V ) ( l - M Combining these equations yields the n ise tran fer functi
Z ( Z - l + b
P P
e 4 GN (Z) eM (€3-7) $(Z) = Z2 -[I + K - b (1 - K))] Z + Kp M
Since the input noise samples are essentially uncorrelated due to the
relatively long (790 msec. ) time between samples, they can be considered as samples
taken on a continuous noise signal with spectrum of r) = 0.79 u
(sec. 2 / H z ) for I f I 5 f = (2 x .79) , zero otherwise.
2 n -1
0
The frequency response of the process, G(f), can be obtained from the
Z - transform, Gn(Z), by setting Z = exp
output noise is then: [ j(. 79) (2 r f ) ] . The variance of the
0 - where G (f) is the complex-conjugate of G (f).
This integration can be carried out in the independent variable Z using
the previous definition and its derivative:
d Z = j (0.79)(2 n ) Z d f (B-9) The limits of the integration then become Z = - + T , and the path of the
So, with G (Z) = G (Z- l )
integration is along the unit circle in the complex - Z plane.
Jf G (Z) G ( Z - l ) Z - l dZ 2 - - Q n on j 2 a
Q
(B-10)
The contour integral of (B-10) can be evaluated by the method of residues:
$f (Z) dZ = j 2 r residues of f (Z) in the unit circle (B-11)
G ( Z ) has two singularities, the roots of:
Z 2 - [ l + K p - b ( 1 - K ) ] Z + K P P (B-12)
- 2 (1 +b2) K + (1 + b)2 s2] P
Z1, Z2 = 1/2 [(l - b) + (1 + b ) Kp
,
A. 12
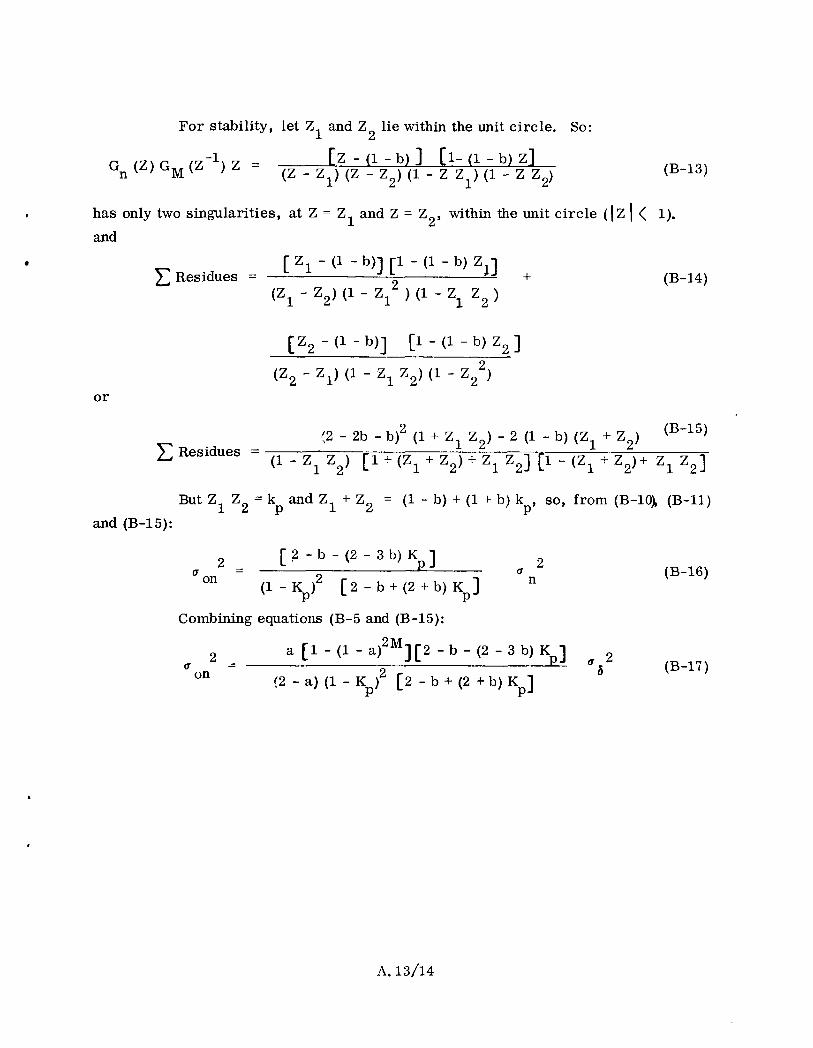
For stability, let Z1 and Z lie within the unit circle. So: 2
[Z - (1 - b) 3 [l- (1 - b ) Z] (Z - Z1) (Z - Z2) (1 - z z ) ( 1 - z Z2) Gn ( Z ) GM ( Z - l ) Z =
1 (B-13)
I has only two singularities, at Z = Z
and
and Z = Z 1 2’ within the unit circle (I Z I < 1).
(B-14)
or
(2 - 2b - b) 2 (1 + Z Z ) - 2 (1 - b) (Z1 + Z2) (B-15) 1 2
(1 - z - z ) [1+ (Z1 + Z2) + z1 Z2] [l - (Z1 + Z2)+ z1 Z2] Residues = 1 2
But Z Z = k and Z1 + Z = (1 - b) + (1 + b) k so, from (B-lOX (B-11) 1 2 P 2 P’
and (B-15):
Combining equations (B-5 and (B-15):
a [l - (1 - afM][2 - b - (2 - 3 b) K 3 2 - a 2
d - 2 U
(2 - a) (1 - K ) [2 - b + (2 + b) Kp] on P
(B-16)
(B-17)
A. 13/14
GLOSSARY
Aliasing - For equally spaced data, the principal part of the aliased spectrum
expresses contributions to the variance in terms of frequencies between zero and the
Nyquist or folding frequency, all contributions from frequencies having the same
principal alias and sign, havingbeen combined by addition. The aliased spectrum
repeats the principal part periodically with period 2fn.
ASCII - American Standard Code for Information Interchange.
Eight-level paper tape - one-inch-wide paper tape which is mechanically punched with up to eight holes per row. Information appears at hole sites where holes may or may not be punched. A character appears as a row of hole sites across the tape. A
hole appears where a bit is a 1. Characters are placed along the length of the tape.
The tape and hence the characters are scanned sequentially. A character row has punched in it a small hole which defines a character row and serves as a means for
driving the tape.
Limiter Suppression - Signal suppression which results in a limiter due to a degraded
signal to noise power ratio at the limiter input.
Minimum Lead Design - Control system utilizing the minimum lead required to
achieve the loop frequency response,
Feedback Control Systems With Minimum Lead Needed to Realize the Specified
Frequency Response, '' a report by George S. Axelby of Westinghouse Electric Corpora- tion.
For additional information see "Synthesis of
OPLE - Omega Position Location Equipment which uses the worldwide Omega VLF
radio signals as a means of establishing position location.
B. 1 / 2