Embed Size (px)
Citation preview

ATP-independent reversal of a membrane protein aggregate by a chloroplast SRP
Peera Jaru-Ampornpan1, Kuang Shen1,3, Vinh Q. Lam1,3, Mona Ali2, Sebastian Doniach2,
Tony Z. Jia1, Shu-ou Shan1
Supplementary information contains:
Supplementary Figures 1-7
Supplementary Table 1
Supplementary Note
Nature Structural & Molecular Biology: doi:10.1038/nsmb.1836

Supplementary Figure 1
cpSRP43 is active at higher ionic strength, but is present as inactive multimeric
forms at lower ionic strength. (a) cpSRP43 runs as a monomer on Superdex 200 in
buffer containing 200 mM NaCl (black trace), but exhibits aberrant mobility in buffer
containing 50 mM NaCl (red trace). (b) The amount of solubilized LHCP (1 µM) at
equilibrium in the presence of 1 µM (black) or 5 µM (gray) cpSRP43 in buffer with
different salt concentrations. (c) List of the Kd values for the LHCP-cpSRP43 interaction,
determined by fluorescence anisotropy, at different salt concentrations.
Nature Structural & Molecular Biology: doi:10.1038/nsmb.1836

Supplementary Figure 2
Kinetic simulations based on the passive mechanism in Figure 4c, which showed that
the rates of disaggregation are independent of cpSRP43 concentration when the rates of
spontaneous disaggregation (k1) were varied over the range of 0.00005 – 0.05 s–1.
Nature Structural & Molecular Biology: doi:10.1038/nsmb.1836

Supplementary Figure 3
cpSRP actively reversed LHCP aggregation. (a) Time courses for disaggregation of
LHCP (1 µM) at varying concentrations (2 – 10 µM) of cpSRP. The black arrow marks
the time of cpSRP addition. (b) Concentration dependence of the forward rate constants
of disaggregation reactions (kf; see text for derivation). The fits to equation 3 in Methods
gave a Hill coefficient of 1.7.
Nature Structural & Molecular Biology: doi:10.1038/nsmb.1836

Supplementary Figure 4
Specific binding interactions between the L18 motif of LHCP and cpSRP are
essential for chaperone activity. (a) The crystal structure of the L18 peptide (green)
bound to the CD1–Ank4 fragment of cpSRP43 (magenta)19. The DPLG motif is
highlighted in pink. The two residues from cpSRP43 that make important contacts to this
motif, R161 and Y204, are shown in sticks. (b) The amount of soluble LHCP (1 µM) or
its mutants, ΔDPLG and L164K, at equilibrium in the presence of 1 µM (black) or 10 µM
(gray) cpSRP. (c) The amount of soluble LHCP (1 µM) at equilibrium in the presence of
1 µM (black) or 10 µM (gray) cpSRP or its mutants, cpSRP-R161A and cpSRP-Y204A.
Nature Structural & Molecular Biology: doi:10.1038/nsmb.1836

Supplementary Figure 5
cpSRP43 deletion mutants, ΔCD2 and ΔCD3, can efficiently reverse LHCP
aggregation. Time courses for disaggregation reactions by 2 µM (cyan), 4 µM (blue)
and 8 µM (magenta) of cpSRP43 ΔCD2 (a) and cpSRP43 ΔCD3 (b).
Nature Structural & Molecular Biology: doi:10.1038/nsmb.1836

Supplementary Figure 6
SAXS analysis of full-length cpSRP43. (a) Experimental SAXS profiles in Kratky’s
representation at cpSRP43 concentrations of 50 µM (red), 100 µM (blue), and 200 µM
(green). The agreement of the three curves indicated that no aggregation or interparticle
interference occurred during the experiment. (b) Comparison of surface maps calculated
from the dummy atom model in Figure 8b (pink shell) and from the docking model in
Figure 8c (gray mesh).
Nature Structural & Molecular Biology: doi:10.1038/nsmb.1836

Supplementary Figure 7
cpSRP43 can reverse heat-denatured LHCP aggregates. (a) Reaction scheme of the
disaggregation assay using LHCP aggregates generated by heating the soluble LHCP–
cpSRP43 complex. (b) Time courses for disaggregation reactions in the absence (black)
and presence (magenta) of fresh cpSRP43 added after heat-induced aggregation of
LHCP.
Nature Structural & Molecular Biology: doi:10.1038/nsmb.1836

Supplementary Table 1 Comparison of disaggregation rate constants obtained from fits
of data and simulation.
[cpSRP43] (µM)
kf from manual fits of data (s-1)
k3 from simulation (s-1)
2 0.0018 0.0023
4 0.0034 0.0041
6 0.0036 0.0050
8 0.0084 0.0084
10 0.0187 0.0180
Nature Structural & Molecular Biology: doi:10.1038/nsmb.1836
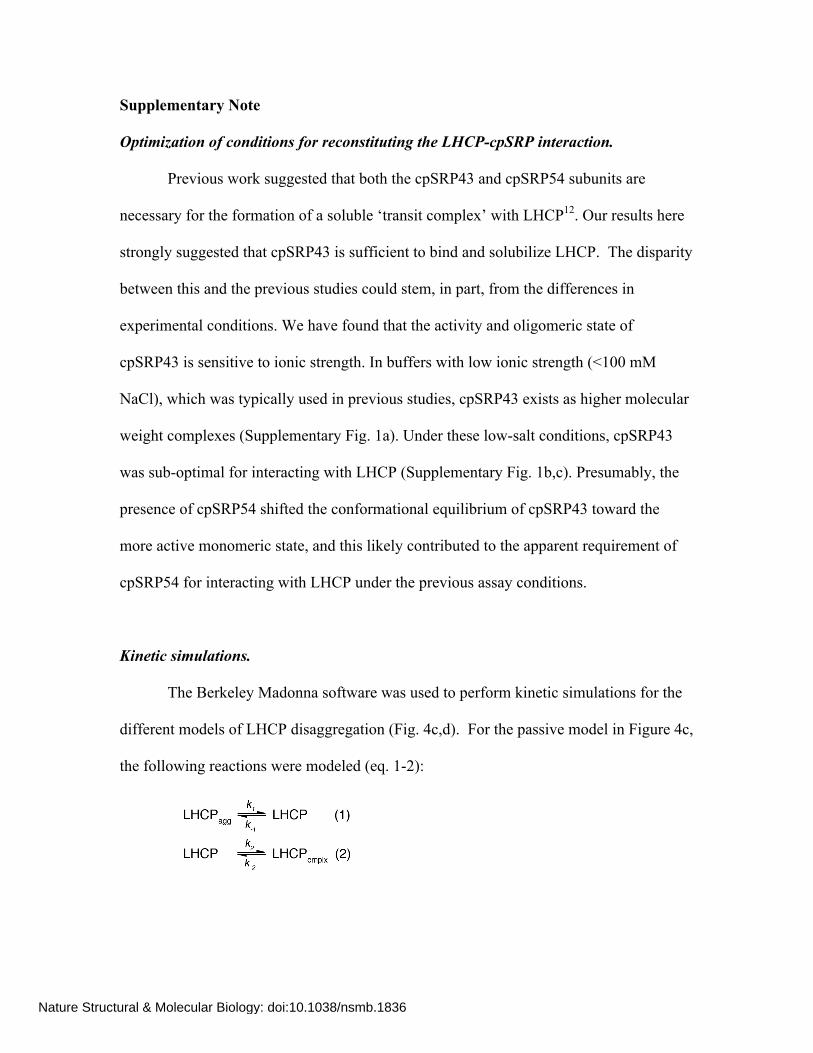
Supplementary Note
Optimization of conditions for reconstituting the LHCP-cpSRP interaction.
Previous work suggested that both the cpSRP43 and cpSRP54 subunits are
necessary for the formation of a soluble ‘transit complex’ with LHCP12. Our results here
strongly suggested that cpSRP43 is sufficient to bind and solubilize LHCP. The disparity
between this and the previous studies could stem, in part, from the differences in
experimental conditions. We have found that the activity and oligomeric state of
cpSRP43 is sensitive to ionic strength. In buffers with low ionic strength (<100 mM
NaCl), which was typically used in previous studies, cpSRP43 exists as higher molecular
weight complexes (Supplementary Fig. 1a). Under these low-salt conditions, cpSRP43
was sub-optimal for interacting with LHCP (Supplementary Fig. 1b,c). Presumably, the
presence of cpSRP54 shifted the conformational equilibrium of cpSRP43 toward the
more active monomeric state, and this likely contributed to the apparent requirement of
cpSRP54 for interacting with LHCP under the previous assay conditions.
Kinetic simulations.
The Berkeley Madonna software was used to perform kinetic simulations for the
different models of LHCP disaggregation (Fig. 4c,d). For the passive model in Figure 4c,
the following reactions were modeled (eq. 1-2):
Nature Structural & Molecular Biology: doi:10.1038/nsmb.1836

For the active mechanism in Figure 4d, the following reactions were modeled (eq. 1-3):
in which LHCPagg denotes the aggregated LHCP molecules, LHCP denotes a soluble
LHCP monomer, LHCPcmplx denotes the cpSRP43-LHCP complex, and the rate constants
are defined in Figs 3c and d. As this software considers only first-order or pseudo-first-
order reactions, the concentration of cpSRP43 was varied by varying the values of k2 and
k3 during the simulation. For the aggregation reaction (eq. 1), the rate constant for LHCP
aggregation (k–1) was estimated to be 0.05 s–1, based on the observation that LHCP
aggregation is 70–80% complete within the first 15–20 seconds of mixing (Fig. 1c, 4e,
and Supplementary Figs. 3, 5). As the light scattering from aggregates was linear with
LHCP concentration starting from 0.5 µM (Fig. 1c) indicating complete aggregate
formation above this concentration, we assumed that the equilibrium favors aggregation
by 100-fold under the experimental conditions. This gave the apparent rate of
spontaneous disaggregation (k1) of 0.0005 s–1; changing the value of k1 from 0.00005 to
0.05 s–1 altered the time courses, but did not affect the conclusion that the disaggregation
rates are independent of cpSRP43 concentrations in the passive mechanism
(Supplementary Fig. 2).
For the binding reaction between LHCP monomer and cpSRP43 (eq. 2), we
assumed an association rate constant (kon) of 1×10⁶ M–1s–1, which is typical for
bimolecular association between proteins. Varying the value of kon from 106 to 108
Nature Structural & Molecular Biology: doi:10.1038/nsmb.1836
M–1s–1 had no effect on the result of simulation (not shown). The value of kon and the
experimentally determined Kd value of ~100 nM (Fig. 2a) were used to calculate the
dissociation rate constant (k–2). The apparent associating rate constants, k2, were
calculated as kon × [cpSRP43].
For the active disaggregation reaction (eq. 3), we allowed the simulation program
to fit the k3 and k-3 values using experimental data. The values obtained from the
simulation are comparable to the rate constants of disaggregation obtained from manual
fitting of data (Supplementary Table 1; see the next section).
Analysis of rate constants for protein disaggregation.
The rate constants of protein disaggregation were obtained using several
independent approaches. (i) The time course of LHCP disaggregation in Figure 4e were
fit to equation 1 in Methods to obtain the observed rate constants to reach equilibrium
(kobsd), which is the sum of forward disaggregation and reverse re-aggregation processes
(kobsd = kf + kr), and the equilibrium of each disaggregation reaction, which is determined
by the relative magnitude of the disaggregation and re-aggregation processes [Kobsd =
kf/(kf + kr)]. Using these relationships, we calculated the net rate constants for the
disaggregation process (kf). (ii) In cases where a substantial amount of disaggregation
was achieved, the rate constants for the forward disaggregation reactions can also be
estimated from the initial rates, since at earlier times the contribution from the reverse re-
aggregation process is negligible. (iii) The Berkeley-Madonna program was used to fit
the data in Figure 4e to the active remodeling mechanism in Figure 4d. The rate
Nature Structural & Molecular Biology: doi:10.1038/nsmb.1836

constants obtained from these different approaches were the same, within experimental
error (Supplementary Table 1).
Nature Structural & Molecular Biology: doi:10.1038/nsmb.1836