Embed Size (px)
Citation preview
1/69 Trusted Partner for your Digital Journey
Amendment to the 2020 Universal
Registration Document (URD)
Including the 2021
half-year financial report
Only the French version of the amendment to the 2020 Universal Registration Document has been
submitted to the Autorité des Marchés Financier (AMF). It is therefore the only version that is legally
binding.
This amendment to the Universal Registration Document was filed on July 30, 2021 with the AMF in its
capacity as the competent authority under Regulation (EU) 2017/1129, without prior approval in
accordance with Article 9 of that Regulation.
The French version of the Universal Registration Document may be used for the purpose of a public
offering of financial securities or the admission of financial securities for trading on a regulated market if
it is supplemented by a securities note and, as the case may be, a summary and all amendments made
to the Universal Registration Document. The resulting set of documents is approved by the AMF in
accordance with Regulation (EU) 2017/1129.
This amendment updates and should be read together with the 2020 Universal Registration Document
filed with the AMF on April 7, 2021 under registration number D.21-0269.
A cross-reference table is included in this amendment to allow readers to locate easily the information
required under Appendices of 1 and 2 of Commision Delegated Regulation (EU) 2019/980 of March 14,
2019, in accordance with the structure of the Universal Registration Document and the information that
has been updated or modified.
The 2020 Universal Registration Document and this amendment are available on the Atos website
(www.atos.net), in the Investors / Regulated Information section, and on the AMF website (www.amf-
france.org).
2/69 Trusted Partner for your Digital Journey
Content
1. ACTIVITY REPORT ................................................................................................ 3 1.1. Atos in the first half of 2021 ...................................................................................................... 3 1.2. Operational review .................................................................................................................... 7
1.2.1. Statutory to constant scope and exchange rates reconciliation ................................................. 7 1.2.2. Performance by Industry ..................................................................................................... 9 1.2.3. Performance by Regional Business Units ............................................................................. 13 1.2.4. Portfolio .......................................................................................................................... 18 1.2.5. Human Resources ............................................................................................................ 19
1.3. 2021 objectives and mid-term targets ..................................................................................... 20 1.4. Risk Factors ............................................................................................................................. 21 1.5. Claims and litigations .............................................................................................................. 21
1.5.1. Tax claims ....................................................................................................................... 22 1.5.2. Commercial claims ........................................................................................................... 22 1.5.3. Labor claims .................................................................................................................... 23 1.5.4. Representation & Warranty claims ...................................................................................... 23 1.5.5. Miscellaneous .................................................................................................................. 23
1.6. Related parties ........................................................................................................................ 23
2. FINANCIAL STATEMENTS .................................................................................... 24 2.1. Financial review ....................................................................................................................... 24
2.1.1. Income statement ............................................................................................................ 24 2.1.2. Cash Flow and net cash .................................................................................................... 27 2.1.3. Bank covenant ................................................................................................................. 29
2.2. Interim condensed consolidated financial statements ............................................................. 30 2.2.1. Interim condensed consolidated income statement ............................................................... 30 2.2.2. Interim condensed consolidated statement of comprehensive income ..................................... 31 2.2.3. Interim condensed consolidated statement of financial position.............................................. 32 2.2.4. Interim condensed consolidated cash flow statement ............................................................ 33 2.2.5. Interim consolidated statement of changes in shareholders’ equity ......................................... 34 2.2.6. Notes to the interim condensed consolidated financial statements .......................................... 35
2.3. Statutory auditors’ Review Report on the half-yearly financial information for the period from
January 1 to June 30, 2021 ...................................................................................................... 52
3. PERSON RESPONSIBLE ....................................................................................... 54 3.1. Person responsible for the amendment to the Universal Registration Document ..................... 54 3.2. Statement of the person responsible for the amendment to the Universal Registration
Document ................................................................................................................................ 54 3.3. For the audit ............................................................................................................................ 54
4. CORPORATE GOVERNANCE AND ADDITIONAL INFORMATION ............................ 55 4.1. Office renewals and composition of the Board of Directors ...................................................... 55 4.2. Annual General Meeting held on May 12, 2021 ........................................................................ 56 4.3. Executive compensation and stock ownership ......................................................................... 57
4.3.1. Performance shares allocation plan decided on July 27, 2021 ................................................ 57 4.3.2. Revision of the performance conditions for the performance share plans 2019 and 2020 ........... 58 4.3.3. Performance shares that have become available since January 1, 2021 for the Executive Officers
– AMF Table 7.................................................................................................................. 58 4.3.4. Subscription or purchase options exercised since January 1, 2021 by Executive Officers – AMF
Table 5 ........................................................................................................................... 58 4.4. Common Stock Evolution ......................................................................................................... 59
4.4.1. Basic data ....................................................................................................................... 59 4.4.2. Dividend ......................................................................................................................... 60 4.4.3. Common stock ................................................................................................................. 60
5. APPENDICES ....................................................................................................... 64 5.1. Contacts ................................................................................................................................... 64 5.2. Financial calendar .................................................................................................................... 64 5.3. Amendment to the 2020 Universal Registration Document cross-reference table.................... 64 5.4. Cross-reference table for the Half-Yearly Financial Report ...................................................... 67 5.5. Full index ................................................................................................................................. 68
3/69 Trusted Partner for your Digital Journey
1. Activity Report
1.1. Atos in the first half of 2021
January
The South Australian Government chose Atos as a strategic partner. The partnership is expected to deliver managed platform services, including data security and cloud migration.
Atos and IBM announced the expansion of a strategic global alliance to help companies accelerate their digital transformation and optimize business processes.
Atos is proud to participate in the development of France’s national strategy on quantum technologies. With unique expertise in Europe and innovative technologies such as the Atos Quantum Learning Machine (QLM), the world's most powerful quantum simulator, Atos is already working closely with national players such as GENCI (Grand Equipement National de Calcul) and the CEA (Commissariat à l'Energie
Atomique), as well as the start-up Pasqal.
Atos and OVHcloud announced that they have joined forces to bring trusted cloud transformation capabilities and services to enterprises and public organizations worldwide. Under this partnership, OVHcloud and Atos are creating a market-leading 100% European multi-cloud solution. This combination
maximizes Atos’ powerful one-stop shop offering — Atos OneCloud — and OVHcloud’s innovative cloud solutions based on sovereign infrastructures.
Atos teamed up with SAP in support of RISE with SAP, a new offering from SAP that helps clients move business-critical elements to the cloud, accelerating their digital transformation and realizing value from their investments in the journey to an intelligent enterprise.
February The UK’s National Employment Savings Trust (Nest) announced that Atos will serve as its future pension
scheme administrator.
Atos, Axione and Siemens were awarded the contract to supply, implement and maintain the multi-service network and video surveillance system for three of the four future Parisian metro lines (15, 16 and 17) which are part of the Grand Paris Express, the largest urban transport project in Europe.
Atos raised its decarbonization ambition to reach net-zero by 2028. With this ambition, Atos is committing to reducing the global carbon emissions under its control and influence by 50% by 2025
(scopes 1, 2, 3), and to offset all its residual emissions by 2028. Atos’s new trajectory is 22 years ahead of the 2050 target set by the Paris Agreement to limit global warming to 2°C by 2050 above pre-industrial levels, and seven years ahead of the target previously set by the Group.
Atos completed the acquisition of Profit4SF, a Dutch technology and management consulting company specializing in Salesforce enterprise implementations for customers across the Netherlands.
Atos was selected by the Spanish State Meteorological Agency (AEMET) to supply and install its
computing and storage technology. Based on the BullSequana supercomputing architecture from Atos, the new supercomputer will provide almost ten times more computing capacity than the current one, which was installed in 2014.
Atos and HDF Energy announced a plan to develop an end-to-end long-term solution to supply data centers with green hydrogen generated by renewable energy. The new solution by Atos and HDF will be the first available on the market for data centers with heavy power consuming workloads, with the goal of demonstrating the first full production center operated using green hydrogen in 2023.
4/69 Trusted Partner for your Digital Journey
March Atos was named a Leader in Technology Business Research Inc.’s (TBR) Market Landscape for Quantum
Computing. Atos was identified as a “Leader” for its ability to advance the exploration and development of quantum algorithms.
Atos was positioned as a global leader in cyber resiliency services by research and advisory firm NelsonHall in its latest NEAT report.
Atos signed a contract with Swansea University to deploy its BullSequana X410 supercomputer, built on the new NVIDIA A100 Tensor Core GPU architecture and NVIDIA Mellanox HDR 200Gb/s InfiniBand
networking, which will enable academics in Swansea and across Wales to drive ground-breaking research based on advanced machine learning and deep learning algorithms.
Atos delivered its Atos Quantum Learning Machine (Atos QLM), the world's highest-performing commercially available quantum simulator, to the Leibniz Supercomputing Centre (LRZ), of the Bavarian Academy of Sciences and Humanities.
Atos will switch all of its nearly 5,500 company cars to electric models by the end of 2024. With this move, Atos aims to reduce the carbon emissions of its global fleet by 50% within three years, in line with its ambition to reach net-zero by 2028.
April Atos signed a long-term agreement to become the official digital partner of European Athletics, the governing body for athletics in Europe, in a deal which extends until 2024.
Atos, Dassault Systèmes, Groupe Renault, STMicroelectronics and Thales joined forces to create the Software République, a new open ecosystem for intelligent and sustainable mobility.
Atos announced a contract with Bureau Veritas, a global leader in testing, inspection and certification, to provide advanced cybersecurity services to protect its 75,000 employees, 1,600 offices and laboratories in 140 countries.
Atos and the Paris 2024 Organizing Committee for the Olympic and Paralympic Games announced their partnership. Atos becomes the exclusive official cybersecurity services and operations supporter for the
event.
Atos announced the revenue of its first quarter of 2021. Q1 2021 revenue was € 2,692 million, down
-1.9% at constant currency. Covid-19 was still impacting Atos business over the quarter despite good resilience in Financial Services & Insurance and in Healthcare & Life Sciences, as well as in Northern Europe, in Growing Markets and in Southern Europe which showed an encouraging recovery. Order entry reached € 2,596 million leading to a book to bill ratio of 96%.
Atos announced it has reached an agreement to acquire Ipsotek, a leading AI-enhanced video analytics software provider.
Atos reached an agreement to acquire Processia, a product lifecycle management (PLM) system integrator and Dassault Systèmes Global Service Partner, headquartered in Canada.
The first EuroHPC supercomputer is now operational. Named “Vega,” the new supercomputer is based on Atos’ BullSequana XH2000 architecture.
Atos inaugurated a new global research and development lab in Les Clayes-sous-Bois, in the greater Paris metropolitan area (Yvelines), France. The new 8,000 square meter lab hosts approximately 350 highly qualified Atos engineers and provides a modern space dedicated to research in quantum computing, high-performance computing, edge, artificial intelligence and cybersecurity.
May Atos and SENAI CIMATEC, one of Brazil’s leading education, research and innovation institutes, announced Brazil’s first Center of Excellence in quantum computing dedicated to the business sector.

5/69 Trusted Partner for your Digital Journey
Atos and the Port of Esbjerg, one of the largest harbors in Scandinavia, announced a joint co-innovation project to create a leading carbon-neutral harbor with a dedicated ambitious decarbonization solution for their customers.
Atos announced that Bulgaria’s new EuroHPC supercomputer, based on Atos’s powerful BullSequana XH2000 architecture, has been fully delivered and assembled at Sofia Tech Park in Bulgaria.
Atos signed a major contract with the Flemish government to become its main digital partner for the next seven years.
Atos was ranked as the #2 global player and top European player in Managed Security Services (MSS) in terms of 2020 revenue, according to the latest Gartner report.
Atos and Thales announced the creation of Athea, a joint venture that will develop a sovereign big data and artificial intelligence platform for public and private sector players in the defense, intelligence and internal state security communities. Athea will draw on the experience gained by both companies from the demonstration phase of the ARTEMIS program, the big data platform of the French Ministry of Armed
Forces.
June
Atos delivered SICS, the command-and-control system for the SCORPION program, to the French Defense Procurement Agency (Direction Générale de l’Armement, DGA). Additionally, the DGA has also entrusted Atos to further develop the system and maintain it in working condition.
Atos was awarded a contract by the University of Edinburgh to deliver the BullSequana XH2000, the most energy-efficient supercomputing system on the market. It becomes the largest system dedicated to GPU computing deployed at a customer site in the UK.
Atos confirmed its position as the leader of secure and decarbonized digital, by providing customers with the most comprehensive, end-to-end decarbonization capabilities on the market to enable and accelerate their journeys to net-zero. This new offering will be driven through and supported by the global net-zero Transformation Center of Excellence, which will be distributed across nine hubs located in Europe, North
America and Asia.
Atos and Huma, the digital health innovator, announced a five-year strategic global partnership to shift
healthcare and clinical trials from hospital to home.
Atos joined AI4Cities, a three-year EU-funded project which aims to help six European cities and regions
accelerate their transition toward carbon neutrality, including Helsinki (Finland), Amsterdam (Netherlands), Copenhagen (Denmark), Paris Region (France), Stavanger (Norway) and Tallin (Estonia).
Atos launched ThinkAI, a secure, scalable, end-to-end offering which enables organizations to successfully design, develop and deliver high-performance AI applications. July Atos was selected by the European Olympic Committees (EOC) as its official digital technology partner for
the 2023 and 2027 editions of the European Games. As part of this partnership, Atos, a long-standing supporter of the Olympic Movement, and EOC, the governing body for Europe’s 50 National Olympic
Committees, will work together to improve fan engagement.
At its annual Atos Technology Days event, Atos launched the Atos Computer Vision Platform — a new, highly-scalable end-to-end AI video and image analytics platform. It is the most comprehensive video and image analytics solution on the market today. Atos also launched a major initiative that positions the Group as a main actor in the growing data economy and outlines its strategic vision for the coming years. The Atos Digital Hub is a one-of-a-kind
solution whose primary objective is to serve as an accelerator for the building of ecosystem platforms.
Eight new start-ups joined Scaler, the Atos Accelerator program, which now includes 20 start-ups.
Pierre Fabre, a pharmaceutical and dermocosmetics group, selected Atos to handle its secure, decarbonized digital transformation. As part of this joint project, Pierre Fabre will initiate a multi-cloud
strategy based on the one-stop shop offered by Atos OneCloud.
6/69 Trusted Partner for your Digital Journey
Atos and IBM announced their plans to collaborate to build a new, highly-advanced digital infrastructure
for the Dutch Ministry of Defense.
Atos announced on July 12, 2021 an adjustement of its Annual Objectives, due to an accelerated decline of legacy infrastructure business in a context of a much stronger demand for post-COVID cloud migration, and the anticipation that this business shift will persist during the second semester. In this context, the Group adjusted its objectives for 2021:
- Revenue growth at constant currency for the full year to stable (vs +3.5% to +4.0% initially); - Operating margin objective to c. 6.0% for the full year (vs 9.4% to 9.8% initially); - Positive Free Cash Flow (vs 550 to 600 million euros initially)
The Group also announced the acceleration of its transformation agenda: - The strategic portfolio review of non-core assets is being finalized; and - The negotiations with social partners regarding the necessary turnaround of the German
infrastructure business have concluded to a restructuring plan of c. 1,300 people, providing an
additional 1% operating margin at Group level mid-term and with a total cost of 180 million euros.
On July 16, 2021, S&P Global Ratings announced having placed Atos “BBB+” rating on watch negative.
Atos will provide a Next-Generation Global Employee Experience to EY. The contract will see Atos personalize and improve the IT experience for more than 300,000 EY people through its Proactive
Experience Center. Atos announced that the Company, with the support of external advisors, has completed the full accounting review of the two U.S legal entities on which there was a qualified opinion in the report of the auditors for the 2020 consolidated financial statements. The work performed, which has been reviewed by the auditors as part of their half-year procedures, did not reveal any material misstatement for the
Group consolidated financial statements. In addition, the Board of Directors, in its meeting held on July 27, 2021, has reviewed and approved the Group half-year consolidated financial statements closed at June 30, 2021. The Statutory Auditors have completed their usual limited review of the half-year condensed consolidated financial statements and an unqualified Auditors’ report is in process to be issued. The remediation and prevention plan was completed and is being rolled-out. The main actions set-up in the plan covered the following topics:
preventive controls, guidelines and documentation, HR review, skilling and organization, and awareness
and training. The aim of the plan is remediation in North America and prevention in all regions. Atos announced its financial results for the first half of the year. Revenue was € 5,424 million, down -1.0% at constant currency. Revenue during the first half was impacted by Cloud acceleration on Legacy Infrastructure business as well as a stronger decrease in Unified Communications & Collaboration business. Operating margin reached 5.6% of revenue representing € 302 million, down -220 basis points compared to last year at constant currency, impacted by the revenue decline in activities with a
low short-term flexibility. Order entry reached € 5,569 million, representing a book to bill ratio of 103%, with a second quarter at 109%. The full backlog at the end of June 2021 amounted to € 23.6 billion, stable compared to the end of December 2020, representing 2.1 years of revenue. The full qualified pipeline was € 7.4 billion, representing 7.9 months of revenue a decrease compared to the beginning of the year due to the evolution of the business. Group free cash flow during the first half of 2021 was €-369 million, compared to €-172 million in the first half of 2020. The variation results mainly
from c. €-141 million less Operating Margin before Depreciation and Amortization (OMDA) and from working capital effects mainly € 200 million lower contribution from customers’ cash in advance.
Atos announced the signature of 3 bolt-on acquisitions in Digital and Cloud:
- Nimbix: a US based leading High Performance Computing (HPC) Cloud platform provider. Nimbix offers HPC-as-a-service providing engineers and scientists access to infrastructure and software to build, compute, scale, and roll-out simulation and Artificial Intelligence applications;
- IDEAL GRP: a Product Lifecycle Management (PLM) integrator and partner of Siemens Digital Industry Software, based in Finland. IDEAL GRP offers consulting, integration, and maintenance services in Manufacturing and Energy sectors. It will add highly skilled team of approximately 100 experts to Atos. This transaction follows the PLM specialist Processia acquisition in June 2021;
- Visual BI: a US based company specialist of Business Intelligence and Analytics in Cloud environment and an Elite Snowflake partner. With this acquisition, Atos will welcome 180 new highly skilled colleagues.
7/69 Trusted Partner for your Digital Journey
1.2. Operational review
1.2.1. Statutory to constant scope and exchange rates
reconciliation
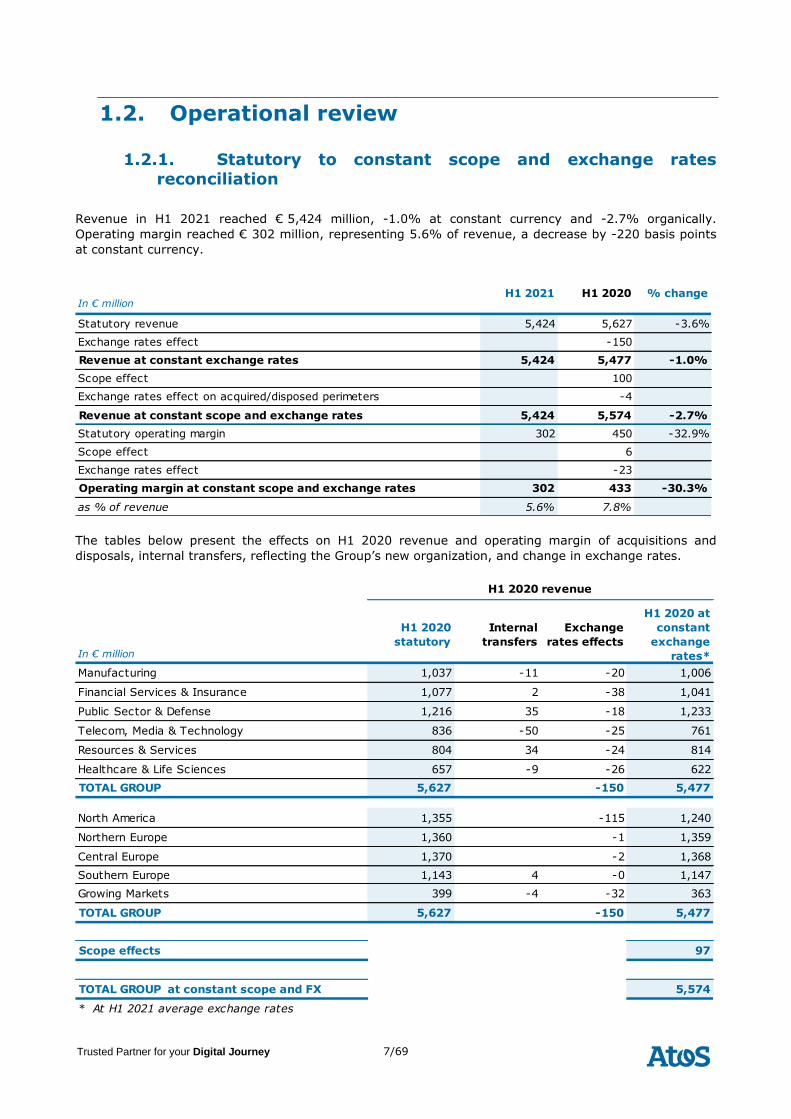
Revenue in H1 2021 reached € 5,424 million, -1.0% at constant currency and -2.7% organically.
Operating margin reached € 302 million, representing 5.6% of revenue, a decrease by -220 basis points
at constant currency.
In € millionH1 2021 H1 2020 % change
Statutory revenue 5,424 5,627 -3.6%
Exchange rates effect -150
Revenue at constant exchange rates 5,424 5,477 -1.0%
Scope effect 100
Exchange rates effect on acquired/disposed perimeters -4
Revenue at constant scope and exchange rates 5,424 5,574 -2.7%
Statutory operating margin 302 450 -32.9%
Scope effect 6
Exchange rates effect -23
Operating margin at constant scope and exchange rates 302 433 -30.3%
as % of revenue 5.6% 7.8%
The tables below present the effects on H1 2020 revenue and operating margin of acquisitions and
disposals, internal transfers, reflecting the Group’s new organization, and change in exchange rates.
In € million
H1 2020
statutory
Internal
transfers
Exchange
rates effects
H1 2020 at
constant
exchange
rates*
Manufacturing 1,037 -11 -20 1,006
Financial Services & Insurance 1,077 2 -38 1,041
Public Sector & Defense 1,216 35 -18 1,233
Telecom, Media & Technology 836 -50 -25 761
Resources & Services 804 34 -24 814
Healthcare & Life Sciences 657 -9 -26 622
TOTAL GROUP 5,627 -150 5,477
North America 1,355 -115 1,240
Northern Europe 1,360 -1 1,359
Central Europe 1,370 -2 1,368
Southern Europe 1,143 4 -0 1,147
Growing Markets 399 -4 -32 363
TOTAL GROUP 5,627 -150 5,477
Scope effects 97
TOTAL GROUP at constant scope and FX 5,574
* At H1 2021 average exchange rates
H1 2020 revenue
8/69 Trusted Partner for your Digital Journey
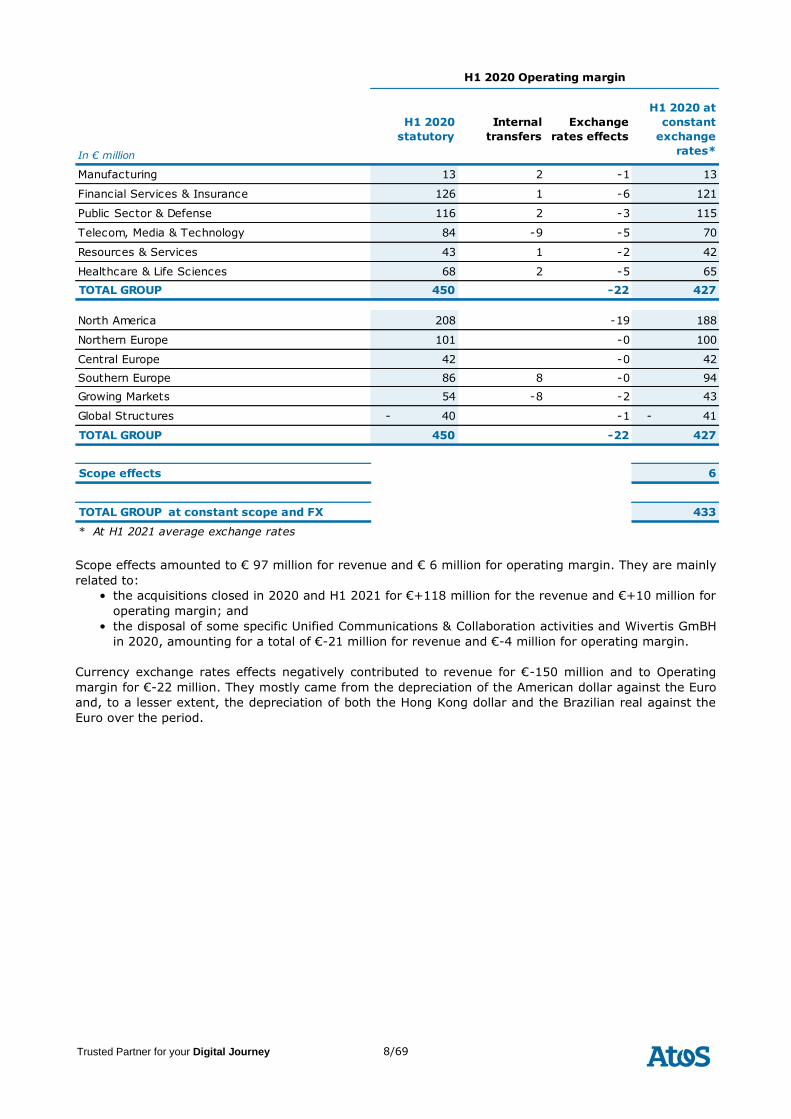
In € million
H1 2020
statutory
Internal
transfers
Exchange
rates effects
H1 2020 at
constant
exchange
rates*
Manufacturing 13 2 -1 13
Financial Services & Insurance 126 1 -6 121
Public Sector & Defense 116 2 -3 115
Telecom, Media & Technology 84 -9 -5 70
Resources & Services 43 1 -2 42
Healthcare & Life Sciences 68 2 -5 65
TOTAL GROUP 450 -22 427
North America 208 -19 188
Northern Europe 101 -0 100
Central Europe 42 -0 42
Southern Europe 86 8 -0 94
Growing Markets 54 -8 -2 43
Global Structures - 40 -1 - 41
TOTAL GROUP 450 -22 427
Scope effects 6
TOTAL GROUP at constant scope and FX 433
* At H1 2021 average exchange rates
H1 2020 Operating margin
Scope effects amounted to € 97 million for revenue and € 6 million for operating margin. They are mainly
related to:
• the acquisitions closed in 2020 and H1 2021 for €+118 million for the revenue and €+10 million for
operating margin; and
• the disposal of some specific Unified Communications & Collaboration activities and Wivertis GmBH
in 2020, amounting for a total of €-21 million for revenue and €-4 million for operating margin.
Currency exchange rates effects negatively contributed to revenue for €-150 million and to Operating
margin for €-22 million. They mostly came from the depreciation of the American dollar against the Euro
and, to a lesser extent, the depreciation of both the Hong Kong dollar and the Brazilian real against the
Euro over the period.
9/69 Trusted Partner for your Digital Journey
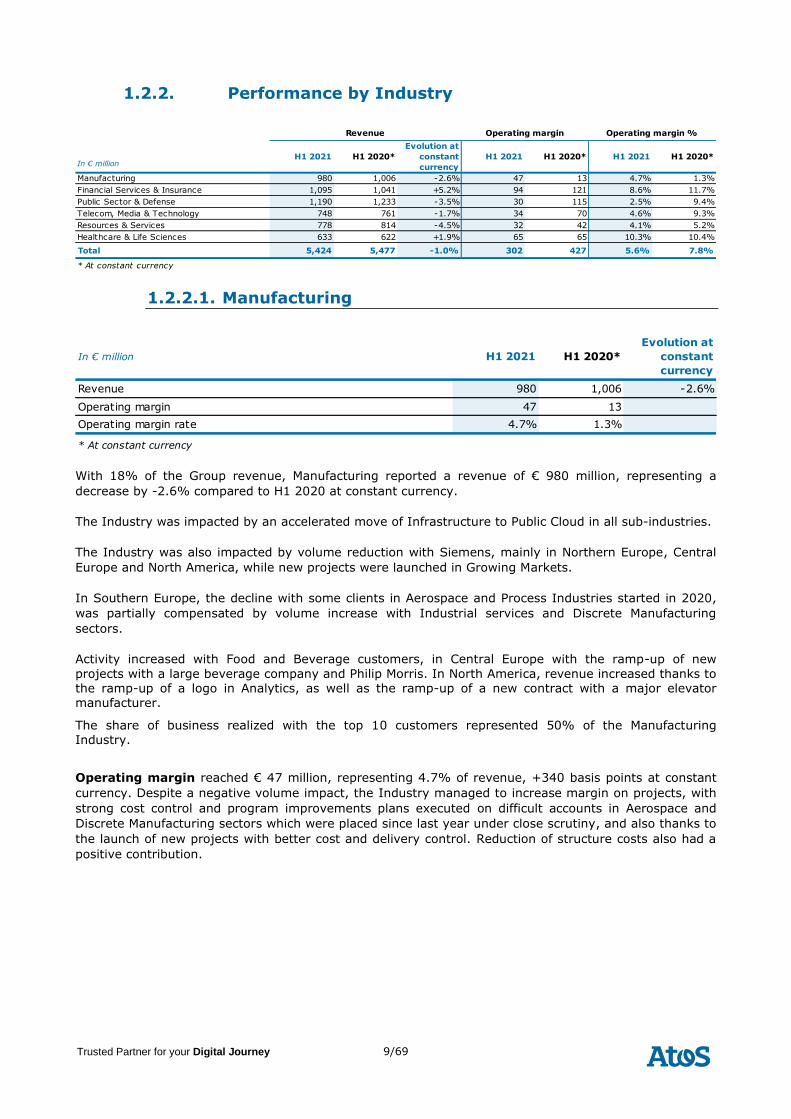
1.2.2. Performance by Industry
In € millionH1 2021 H1 2020*
Evolution at
constant
currency
H1 2021 H1 2020* H1 2021 H1 2020*
Manufacturing 980 1,006 -2.6% 47 13 4.7% 1.3%
Financial Services & Insurance 1,095 1,041 +5.2% 94 121 8.6% 11.7%
Public Sector & Defense 1,190 1,233 -3.5% 30 115 2.5% 9.4%
Telecom, Media & Technology 748 761 -1.7% 34 70 4.6% 9.3%
Resources & Services 778 814 -4.5% 32 42 4.1% 5.2%
Healthcare & Life Sciences 633 622 +1.9% 65 65 10.3% 10.4%
Total 5,424 5,477 -1.0% 302 427 5.6% 7.8%
* At constant currency
Operating margin Operating margin %Revenue
1.2.2.1. Manufacturing
In € million H1 2021 H1 2020*
Evolution at
constant
currency
Revenue 980 1,006 -2.6%
Operating margin 47 13
Operating margin rate 4.7% 1.3%
* At constant currency
With 18% of the Group revenue, Manufacturing reported a revenue of € 980 million, representing a
decrease by -2.6% compared to H1 2020 at constant currency.
The Industry was impacted by an accelerated move of Infrastructure to Public Cloud in all sub-industries.
The Industry was also impacted by volume reduction with Siemens, mainly in Northern Europe, Central
Europe and North America, while new projects were launched in Growing Markets.
In Southern Europe, the decline with some clients in Aerospace and Process Industries started in 2020,
was partially compensated by volume increase with Industrial services and Discrete Manufacturing
sectors.
Activity increased with Food and Beverage customers, in Central Europe with the ramp-up of new
projects with a large beverage company and Philip Morris. In North America, revenue increased thanks to the ramp-up of a logo in Analytics, as well as the ramp-up of a new contract with a major elevator manufacturer.
The share of business realized with the top 10 customers represented 50% of the Manufacturing Industry.
Operating margin reached € 47 million, representing 4.7% of revenue, +340 basis points at constant
currency. Despite a negative volume impact, the Industry managed to increase margin on projects, with
strong cost control and program improvements plans executed on difficult accounts in Aerospace and
Discrete Manufacturing sectors which were placed since last year under close scrutiny, and also thanks to
the launch of new projects with better cost and delivery control. Reduction of structure costs also had a
positive contribution.
10/69 Trusted Partner for your Digital Journey
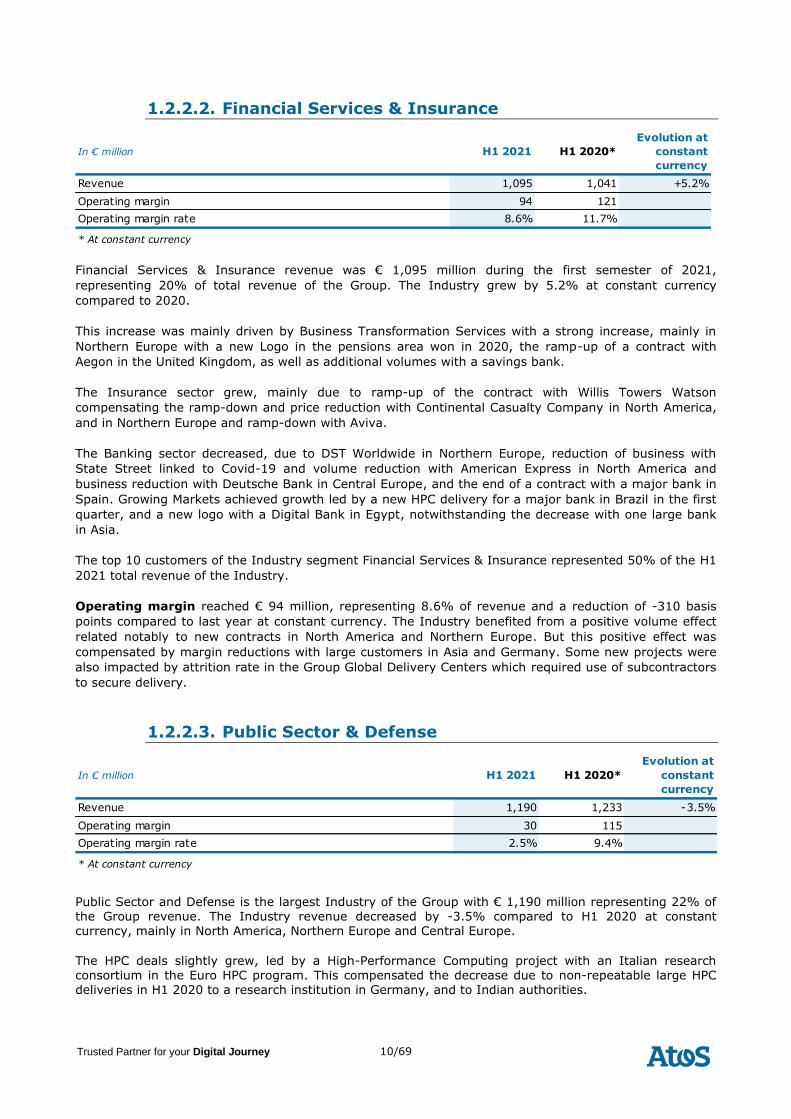
1.2.2.2. Financial Services & Insurance
In € million H1 2021 H1 2020*
Evolution at
constant
currency
Revenue 1,095 1,041 +5.2%
Operating margin 94 121
Operating margin rate 8.6% 11.7%
* At constant currency
Financial Services & Insurance revenue was € 1,095 million during the first semester of 2021,
representing 20% of total revenue of the Group. The Industry grew by 5.2% at constant currency
compared to 2020.
This increase was mainly driven by Business Transformation Services with a strong increase, mainly in
Northern Europe with a new Logo in the pensions area won in 2020, the ramp-up of a contract with
Aegon in the United Kingdom, as well as additional volumes with a savings bank.
The Insurance sector grew, mainly due to ramp-up of the contract with Willis Towers Watson
compensating the ramp-down and price reduction with Continental Casualty Company in North America,
and in Northern Europe and ramp-down with Aviva.
The Banking sector decreased, due to DST Worldwide in Northern Europe, reduction of business with
State Street linked to Covid-19 and volume reduction with American Express in North America and
business reduction with Deutsche Bank in Central Europe, and the end of a contract with a major bank in
Spain. Growing Markets achieved growth led by a new HPC delivery for a major bank in Brazil in the first
quarter, and a new logo with a Digital Bank in Egypt, notwithstanding the decrease with one large bank
in Asia.
The top 10 customers of the Industry segment Financial Services & Insurance represented 50% of the H1
2021 total revenue of the Industry.
Operating margin reached € 94 million, representing 8.6% of revenue and a reduction of -310 basis
points compared to last year at constant currency. The Industry benefited from a positive volume effect
related notably to new contracts in North America and Northern Europe. But this positive effect was
compensated by margin reductions with large customers in Asia and Germany. Some new projects were
also impacted by attrition rate in the Group Global Delivery Centers which required use of subcontractors
to secure delivery.
1.2.2.3. Public Sector & Defense
In € million H1 2021 H1 2020*
Evolution at
constant
currency
Revenue 1,190 1,233 -3.5%
Operating margin 30 115
Operating margin rate 2.5% 9.4%
* At constant currency
Public Sector and Defense is the largest Industry of the Group with € 1,190 million representing 22% of the Group revenue. The Industry revenue decreased by -3.5% compared to H1 2020 at constant currency, mainly in North America, Northern Europe and Central Europe.
The HPC deals slightly grew, led by a High-Performance Computing project with an Italian research consortium in the Euro HPC program. This compensated the decrease due to non-repeatable large HPC deliveries in H1 2020 to a research institution in Germany, and to Indian authorities.
11/69 Trusted Partner for your Digital Journey
The Industry faced volume and price reductions with Texas DIR, as well as projects ramp-down with European Institutions, US Government, National Police in Switzerland and Belgium Authorities. It was also negatively impacted by non-repeatable product sales with the State of New Jersey in 2020, and to
the deconsolidation of Wivertis.
This could not be compensated by increased business with government institutions in the United Kingdom, the new logo State of Oklahoma and the development of NG911 project with the State of California, and the ramp-up of a project with Autobahn in Germany.
37% of the revenue in this Industry was realized with 10 main clients.
Operating margin reached € 30 million, representing 2.5% of revenue. The Industry was first impacted
by the significant decrease in volume which generated less margin on projects and important under-
absorption of structure costs. This volume effect was also augmented by price reduction especially in
North America with Texas DIR and by lower margin on new projects in Southern and Central Europe.
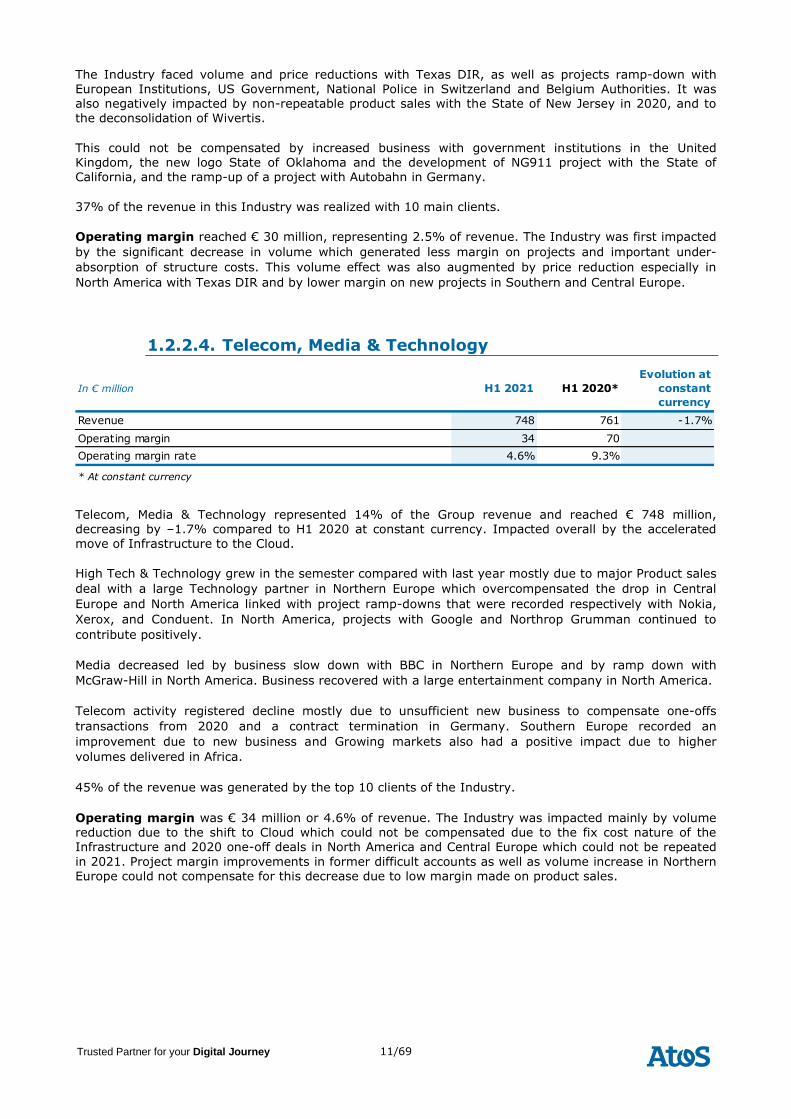
1.2.2.4. Telecom, Media & Technology
In € million H1 2021 H1 2020*
Evolution at
constant
currency
Revenue 748 761 -1.7%
Operating margin 34 70
Operating margin rate 4.6% 9.3%
* At constant currency
Telecom, Media & Technology represented 14% of the Group revenue and reached € 748 million, decreasing by –1.7% compared to H1 2020 at constant currency. Impacted overall by the accelerated move of Infrastructure to the Cloud.
High Tech & Technology grew in the semester compared with last year mostly due to major Product sales
deal with a large Technology partner in Northern Europe which overcompensated the drop in Central
Europe and North America linked with project ramp-downs that were recorded respectively with Nokia,
Xerox, and Conduent. In North America, projects with Google and Northrop Grumman continued to
contribute positively.
Media decreased led by business slow down with BBC in Northern Europe and by ramp down with
McGraw-Hill in North America. Business recovered with a large entertainment company in North America.
Telecom activity registered decline mostly due to unsufficient new business to compensate one-offs
transactions from 2020 and a contract termination in Germany. Southern Europe recorded an
improvement due to new business and Growing markets also had a positive impact due to higher
volumes delivered in Africa.
45% of the revenue was generated by the top 10 clients of the Industry.
Operating margin was € 34 million or 4.6% of revenue. The Industry was impacted mainly by volume reduction due to the shift to Cloud which could not be compensated due to the fix cost nature of the Infrastructure and 2020 one-off deals in North America and Central Europe which could not be repeated
in 2021. Project margin improvements in former difficult accounts as well as volume increase in Northern Europe could not compensate for this decrease due to low margin made on product sales.
12/69 Trusted Partner for your Digital Journey
1.2.2.5. Resources & Services
In € million H1 2021 H1 2020*
Evolution at
constant
currency
Revenue 778 814 -4.5%
Operating margin 32 42
Operating margin rate 4.1% 5.2%
* At constant currency
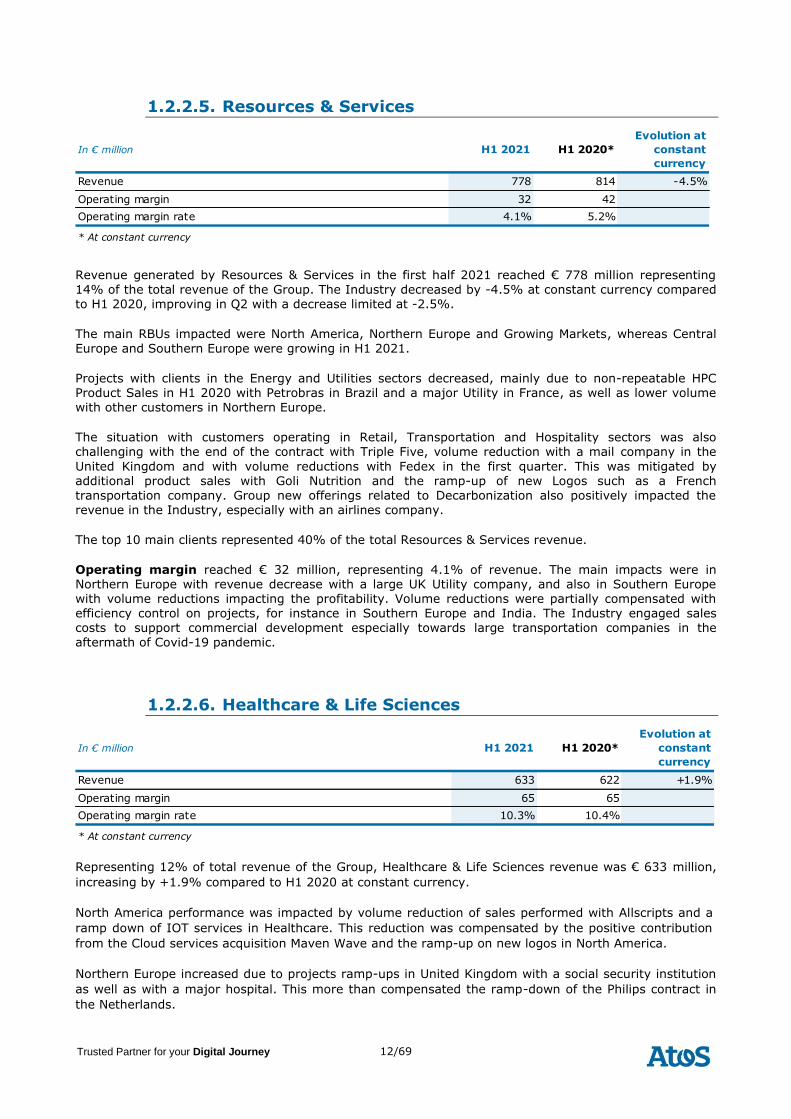
Revenue generated by Resources & Services in the first half 2021 reached € 778 million representing 14% of the total revenue of the Group. The Industry decreased by -4.5% at constant currency compared to H1 2020, improving in Q2 with a decrease limited at -2.5%.
The main RBUs impacted were North America, Northern Europe and Growing Markets, whereas Central
Europe and Southern Europe were growing in H1 2021.
Projects with clients in the Energy and Utilities sectors decreased, mainly due to non-repeatable HPC Product Sales in H1 2020 with Petrobras in Brazil and a major Utility in France, as well as lower volume with other customers in Northern Europe.
The situation with customers operating in Retail, Transportation and Hospitality sectors was also challenging with the end of the contract with Triple Five, volume reduction with a mail company in the
United Kingdom and with volume reductions with Fedex in the first quarter. This was mitigated by additional product sales with Goli Nutrition and the ramp-up of new Logos such as a French transportation company. Group new offerings related to Decarbonization also positively impacted the revenue in the Industry, especially with an airlines company.
The top 10 main clients represented 40% of the total Resources & Services revenue.
Operating margin reached € 32 million, representing 4.1% of revenue. The main impacts were in Northern Europe with revenue decrease with a large UK Utility company, and also in Southern Europe with volume reductions impacting the profitability. Volume reductions were partially compensated with efficiency control on projects, for instance in Southern Europe and India. The Industry engaged sales costs to support commercial development especially towards large transportation companies in the aftermath of Covid-19 pandemic.
1.2.2.6. Healthcare & Life Sciences
In € million H1 2021 H1 2020*
Evolution at
constant
currency
Revenue 633 622 +1.9%
Operating margin 65 65
Operating margin rate 10.3% 10.4%
* At constant currency
Representing 12% of total revenue of the Group, Healthcare & Life Sciences revenue was € 633 million,
increasing by +1.9% compared to H1 2020 at constant currency.
North America performance was impacted by volume reduction of sales performed with Allscripts and a
ramp down of IOT services in Healthcare. This reduction was compensated by the positive contribution
from the Cloud services acquisition Maven Wave and the ramp-up on new logos in North America.
Northern Europe increased due to projects ramp-ups in United Kingdom with a social security institution
as well as with a major hospital. This more than compensated the ramp-down of the Philips contract in
the Netherlands.
13/69 Trusted Partner for your Digital Journey
The Industry was also fueled by the ramp-up of a global contract with Bayer across the geographies, and
by the performance of Growing Markets thanks to a contract with Western Australian Department of
Health.
The top 10 clients represented 57% of the revenue of the Industry.
Operating margin was € 65 million, representing 10.3% of revenue and stable compared to last year.
The Industry benefitted from a positive volume impact which was even augmented by strong profitability
on new projects. This improvement in the project margin allowed the Industry to invest in its commercial
structures.
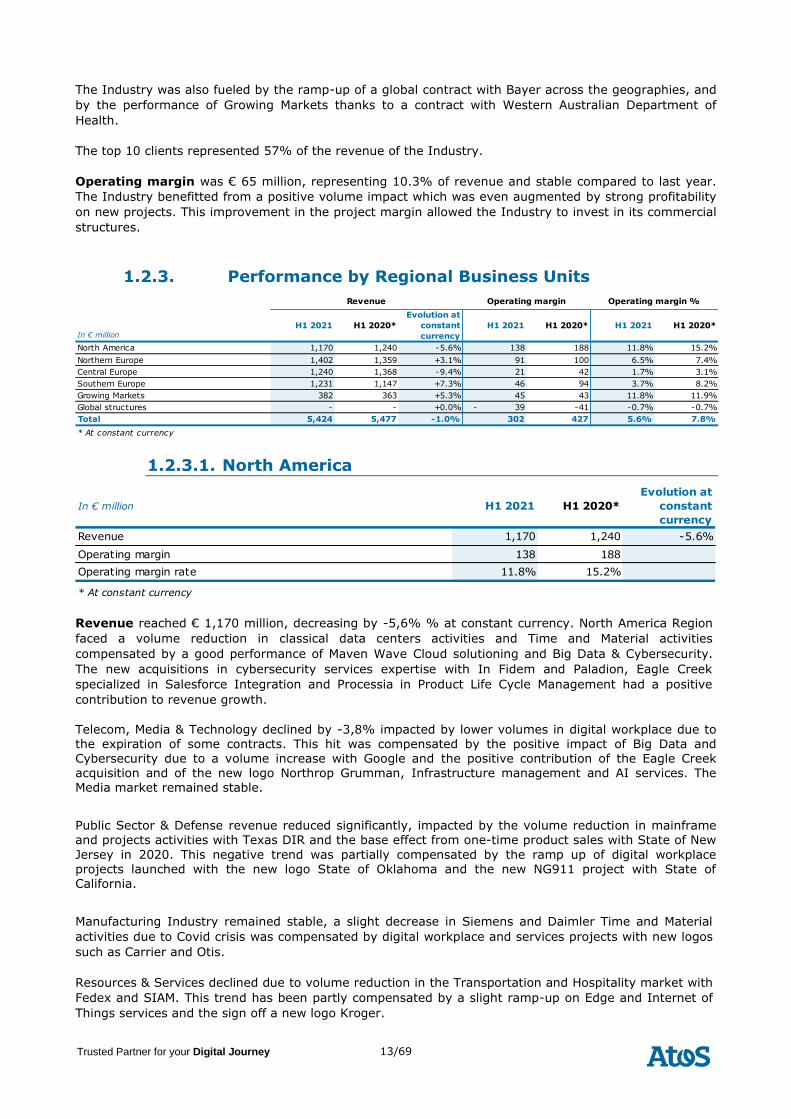
1.2.3. Performance by Regional Business Units
In € million
H1 2021 H1 2020*
Evolution at
constant
currency
H1 2021 H1 2020* H1 2021 H1 2020*
North America 1,170 1,240 -5.6% 138 188 11.8% 15.2%
Northern Europe 1,402 1,359 +3.1% 91 100 6.5% 7.4%
Central Europe 1,240 1,368 -9.4% 21 42 1.7% 3.1%
Southern Europe 1,231 1,147 +7.3% 46 94 3.7% 8.2%
Growing Markets 382 363 +5.3% 45 43 11.8% 11.9%
Global structures - - +0.0% - 39 -41 -0.7% -0.7%
Total 5,424 5,477 -1.0% 302 427 5.6% 7.8%
* At constant currency
Operating marginRevenue Operating margin %
1.2.3.1. North America
In € million H1 2021 H1 2020*
Evolution at
constant
currency
Revenue 1,170 1,240 -5.6%
Operating margin 138 188
Operating margin rate 11.8% 15.2%
* At constant currency
Revenue reached € 1,170 million, decreasing by -5,6% % at constant currency. North America Region
faced a volume reduction in classical data centers activities and Time and Material activities
compensated by a good performance of Maven Wave Cloud solutioning and Big Data & Cybersecurity.
The new acquisitions in cybersecurity services expertise with In Fidem and Paladion, Eagle Creek
specialized in Salesforce Integration and Processia in Product Life Cycle Management had a positive
contribution to revenue growth.
Telecom, Media & Technology declined by -3,8% impacted by lower volumes in digital workplace due to the expiration of some contracts. This hit was compensated by the positive impact of Big Data and Cybersecurity due to a volume increase with Google and the positive contribution of the Eagle Creek acquisition and of the new logo Northrop Grumman, Infrastructure management and AI services. The Media market remained stable.
Public Sector & Defense revenue reduced significantly, impacted by the volume reduction in mainframe and projects activities with Texas DIR and the base effect from one-time product sales with State of New
Jersey in 2020. This negative trend was partially compensated by the ramp up of digital workplace projects launched with the new logo State of Oklahoma and the new NG911 project with State of California.
Manufacturing Industry remained stable, a slight decrease in Siemens and Daimler Time and Material
activities due to Covid crisis was compensated by digital workplace and services projects with new logos
such as Carrier and Otis.
Resources & Services declined due to volume reduction in the Transportation and Hospitality market with
Fedex and SIAM. This trend has been partly compensated by a slight ramp-up on Edge and Internet of
Things services and the sign off a new logo Kroger.
14/69 Trusted Partner for your Digital Journey
Healthcare & Life Sciences decreased at constant currency. It was mainly attributable to the termination
of a contract with McLaren and to volume reduction with Allscripts, as well as to ramp down of Cloud
solutions in Healthcare. This reduction was compensated by the positive contribution from the Cloud
services rendered by Maven Wave and the ramp-up on new logos such as Baylor Scott White Health and
Humana.
Financial Services & Insurance achieved a growth benefitting from the ramp up in volumes of sales with
customers such as Willis Towers Watson and the positive contribution of Eagle Creek acquisition. The
Industry faced also the Covid crisis impact, customers from banking sector decreasing their expenses to
external IT partners such as State Street and American Express.
Operating margin reached € 138 million, representing 11.8% of revenue. The profitability decreased
compared to 2020 mainly due the revenue erosion especially in the Public Sector & Defense sector and in
Telecom, Media & Technology, which generated less margin on projects but also less absorption of
structure costs. The margin reduction mainly related to less non-repeated product sales and advanced
computing in 2021 compared with last year and a volume reduction in mainframe and other
Infrastructure services. New projects launched in 2021 contributed positively but required in some cases
higher level of subcontractors to compensate the attrition rate in the United States and in the Global
Delivery Centers supporting US contracts.
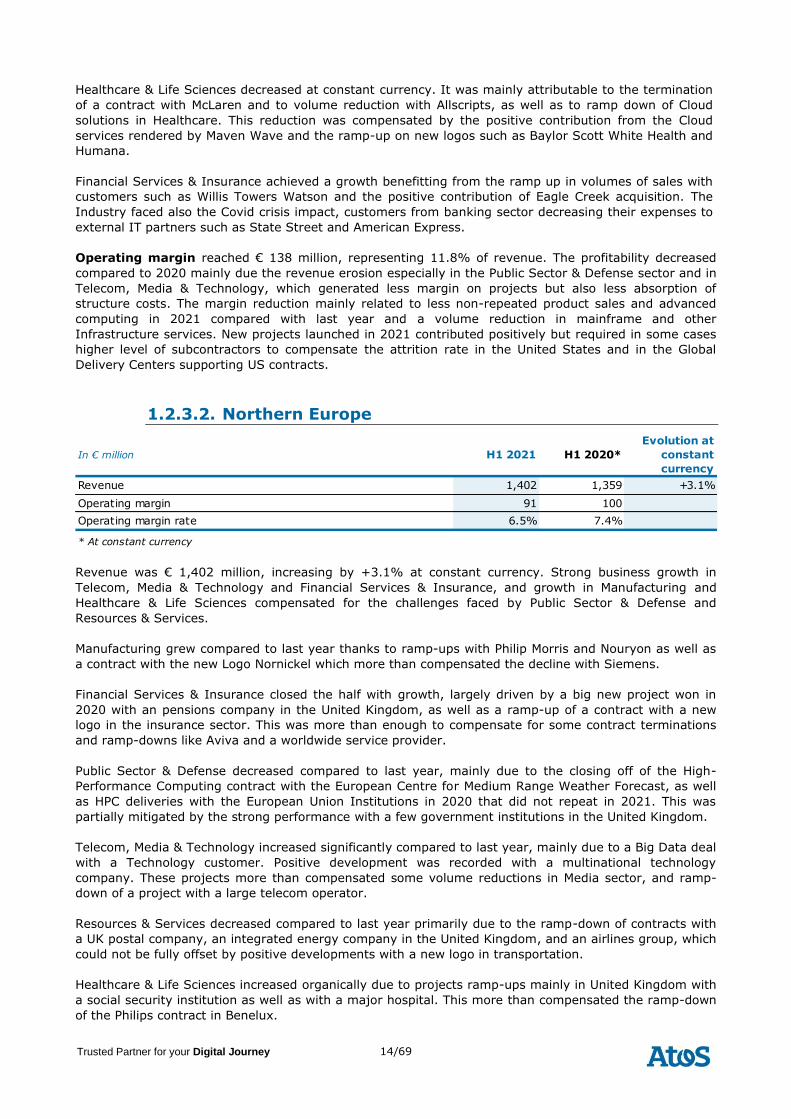
1.2.3.2. Northern Europe
In € million H1 2021 H1 2020*
Evolution at
constant
currency
Revenue 1,402 1,359 +3.1%
Operating margin 91 100
Operating margin rate 6.5% 7.4%
* At constant currency
Revenue was € 1,402 million, increasing by +3.1% at constant currency. Strong business growth in
Telecom, Media & Technology and Financial Services & Insurance, and growth in Manufacturing and
Healthcare & Life Sciences compensated for the challenges faced by Public Sector & Defense and
Resources & Services.
Manufacturing grew compared to last year thanks to ramp-ups with Philip Morris and Nouryon as well as
a contract with the new Logo Nornickel which more than compensated the decline with Siemens.
Financial Services & Insurance closed the half with growth, largely driven by a big new project won in
2020 with an pensions company in the United Kingdom, as well as a ramp-up of a contract with a new
logo in the insurance sector. This was more than enough to compensate for some contract terminations
and ramp-downs like Aviva and a worldwide service provider.
Public Sector & Defense decreased compared to last year, mainly due to the closing off of the High-
Performance Computing contract with the European Centre for Medium Range Weather Forecast, as well
as HPC deliveries with the European Union Institutions in 2020 that did not repeat in 2021. This was
partially mitigated by the strong performance with a few government institutions in the United Kingdom.
Telecom, Media & Technology increased significantly compared to last year, mainly due to a Big Data deal
with a Technology customer. Positive development was recorded with a multinational technology
company. These projects more than compensated some volume reductions in Media sector, and ramp-
down of a project with a large telecom operator.
Resources & Services decreased compared to last year primarily due to the ramp-down of contracts with
a UK postal company, an integrated energy company in the United Kingdom, and an airlines group, which
could not be fully offset by positive developments with a new logo in transportation.
Healthcare & Life Sciences increased organically due to projects ramp-ups mainly in United Kingdom with
a social security institution as well as with a major hospital. This more than compensated the ramp-down
of the Philips contract in Benelux.
15/69 Trusted Partner for your Digital Journey
Operating margin reached € 91 million or 6.5% of revenue, decreasing by -90 basis points compared to
last year at constant currency. Positive volume impact did not compensate for project cost overruns.
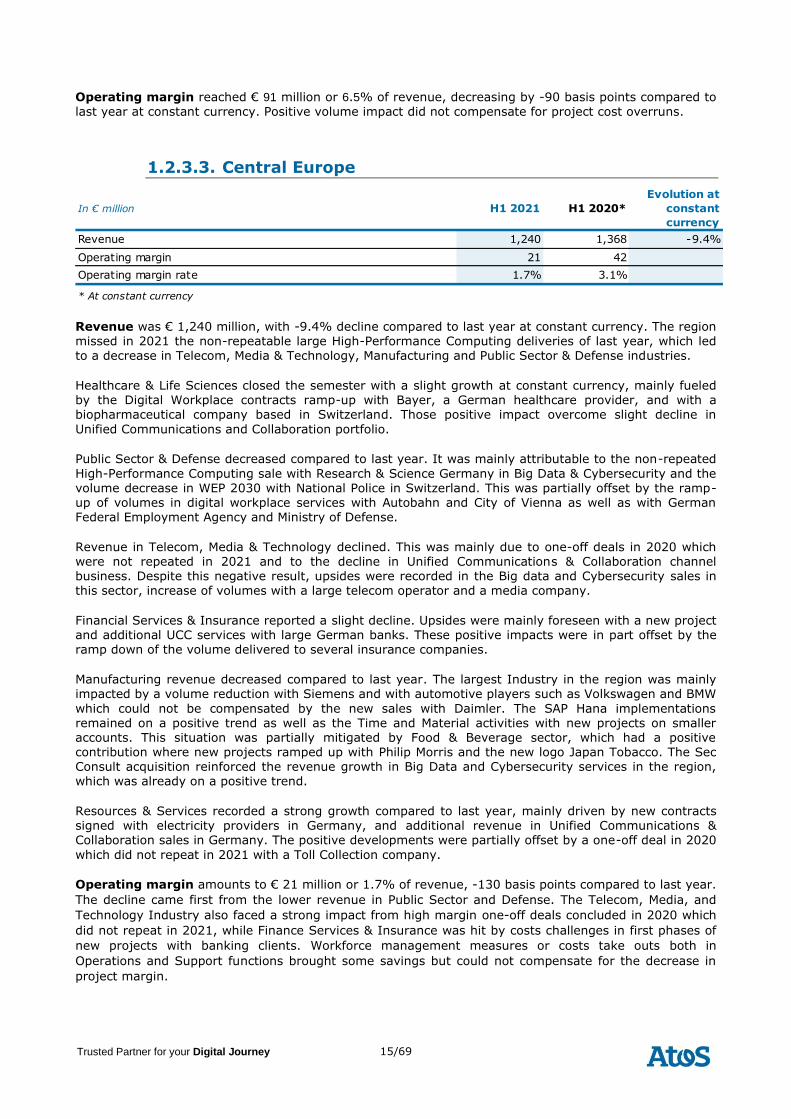
1.2.3.3. Central Europe
In € million H1 2021 H1 2020*
Evolution at
constant
currency
Revenue 1,240 1,368 -9.4%
Operating margin 21 42
Operating margin rate 1.7% 3.1%
* At constant currency
Revenue was € 1,240 million, with -9.4% decline compared to last year at constant currency. The region
missed in 2021 the non-repeatable large High-Performance Computing deliveries of last year, which led to a decrease in Telecom, Media & Technology, Manufacturing and Public Sector & Defense industries.
Healthcare & Life Sciences closed the semester with a slight growth at constant currency, mainly fueled by the Digital Workplace contracts ramp-up with Bayer, a German healthcare provider, and with a biopharmaceutical company based in Switzerland. Those positive impact overcome slight decline in
Unified Communications and Collaboration portfolio.
Public Sector & Defense decreased compared to last year. It was mainly attributable to the non-repeated
High-Performance Computing sale with Research & Science Germany in Big Data & Cybersecurity and the volume decrease in WEP 2030 with National Police in Switzerland. This was partially offset by the ramp-up of volumes in digital workplace services with Autobahn and City of Vienna as well as with German Federal Employment Agency and Ministry of Defense.
Revenue in Telecom, Media & Technology declined. This was mainly due to one-off deals in 2020 which were not repeated in 2021 and to the decline in Unified Communications & Collaboration channel
business. Despite this negative result, upsides were recorded in the Big data and Cybersecurity sales in this sector, increase of volumes with a large telecom operator and a media company.
Financial Services & Insurance reported a slight decline. Upsides were mainly foreseen with a new project and additional UCC services with large German banks. These positive impacts were in part offset by the ramp down of the volume delivered to several insurance companies.
Manufacturing revenue decreased compared to last year. The largest Industry in the region was mainly impacted by a volume reduction with Siemens and with automotive players such as Volkswagen and BMW
which could not be compensated by the new sales with Daimler. The SAP Hana implementations remained on a positive trend as well as the Time and Material activities with new projects on smaller accounts. This situation was partially mitigated by Food & Beverage sector, which had a positive contribution where new projects ramped up with Philip Morris and the new logo Japan Tobacco. The Sec Consult acquisition reinforced the revenue growth in Big Data and Cybersecurity services in the region, which was already on a positive trend.
Resources & Services recorded a strong growth compared to last year, mainly driven by new contracts signed with electricity providers in Germany, and additional revenue in Unified Communications & Collaboration sales in Germany. The positive developments were partially offset by a one-off deal in 2020
which did not repeat in 2021 with a Toll Collection company.
Operating margin amounts to € 21 million or 1.7% of revenue, -130 basis points compared to last year.
The decline came first from the lower revenue in Public Sector and Defense. The Telecom, Media, and
Technology Industry also faced a strong impact from high margin one-off deals concluded in 2020 which
did not repeat in 2021, while Finance Services & Insurance was hit by costs challenges in first phases of
new projects with banking clients. Workforce management measures or costs take outs both in
Operations and Support functions brought some savings but could not compensate for the decrease in
project margin.
16/69 Trusted Partner for your Digital Journey
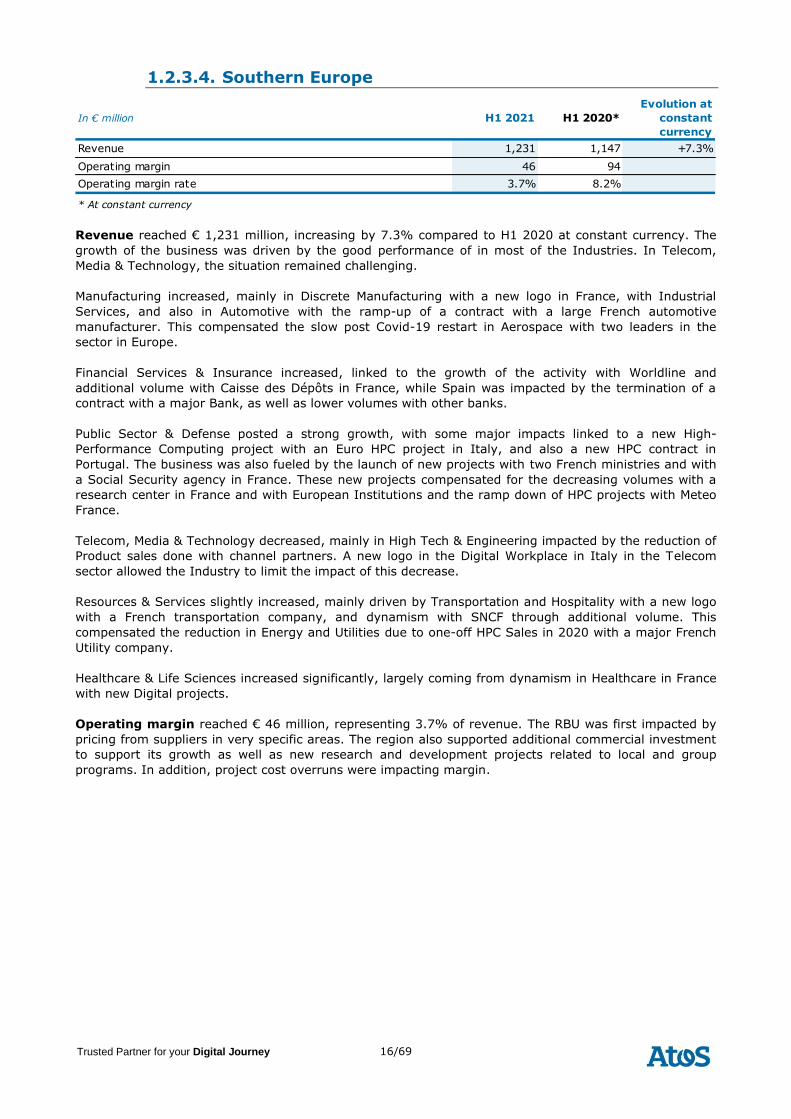
1.2.3.4. Southern Europe
In € million H1 2021 H1 2020*
Evolution at
constant
currency
Revenue 1,231 1,147 +7.3%
Operating margin 46 94
Operating margin rate 3.7% 8.2%
* At constant currency
Revenue reached € 1,231 million, increasing by 7.3% compared to H1 2020 at constant currency. The
growth of the business was driven by the good performance of in most of the Industries. In Telecom,
Media & Technology, the situation remained challenging.
Manufacturing increased, mainly in Discrete Manufacturing with a new logo in France, with Industrial
Services, and also in Automotive with the ramp-up of a contract with a large French automotive
manufacturer. This compensated the slow post Covid-19 restart in Aerospace with two leaders in the
sector in Europe.
Financial Services & Insurance increased, linked to the growth of the activity with Worldline and
additional volume with Caisse des Dépôts in France, while Spain was impacted by the termination of a
contract with a major Bank, as well as lower volumes with other banks.
Public Sector & Defense posted a strong growth, with some major impacts linked to a new High-
Performance Computing project with an Euro HPC project in Italy, and also a new HPC contract in
Portugal. The business was also fueled by the launch of new projects with two French ministries and with
a Social Security agency in France. These new projects compensated for the decreasing volumes with a
research center in France and with European Institutions and the ramp down of HPC projects with Meteo
France.
Telecom, Media & Technology decreased, mainly in High Tech & Engineering impacted by the reduction of
Product sales done with channel partners. A new logo in the Digital Workplace in Italy in the Telecom
sector allowed the Industry to limit the impact of this decrease.
Resources & Services slightly increased, mainly driven by Transportation and Hospitality with a new logo
with a French transportation company, and dynamism with SNCF through additional volume. This
compensated the reduction in Energy and Utilities due to one-off HPC Sales in 2020 with a major French
Utility company.
Healthcare & Life Sciences increased significantly, largely coming from dynamism in Healthcare in France
with new Digital projects.
Operating margin reached € 46 million, representing 3.7% of revenue. The RBU was first impacted by
pricing from suppliers in very specific areas. The region also supported additional commercial investment
to support its growth as well as new research and development projects related to local and group
programs. In addition, project cost overruns were impacting margin.
17/69 Trusted Partner for your Digital Journey
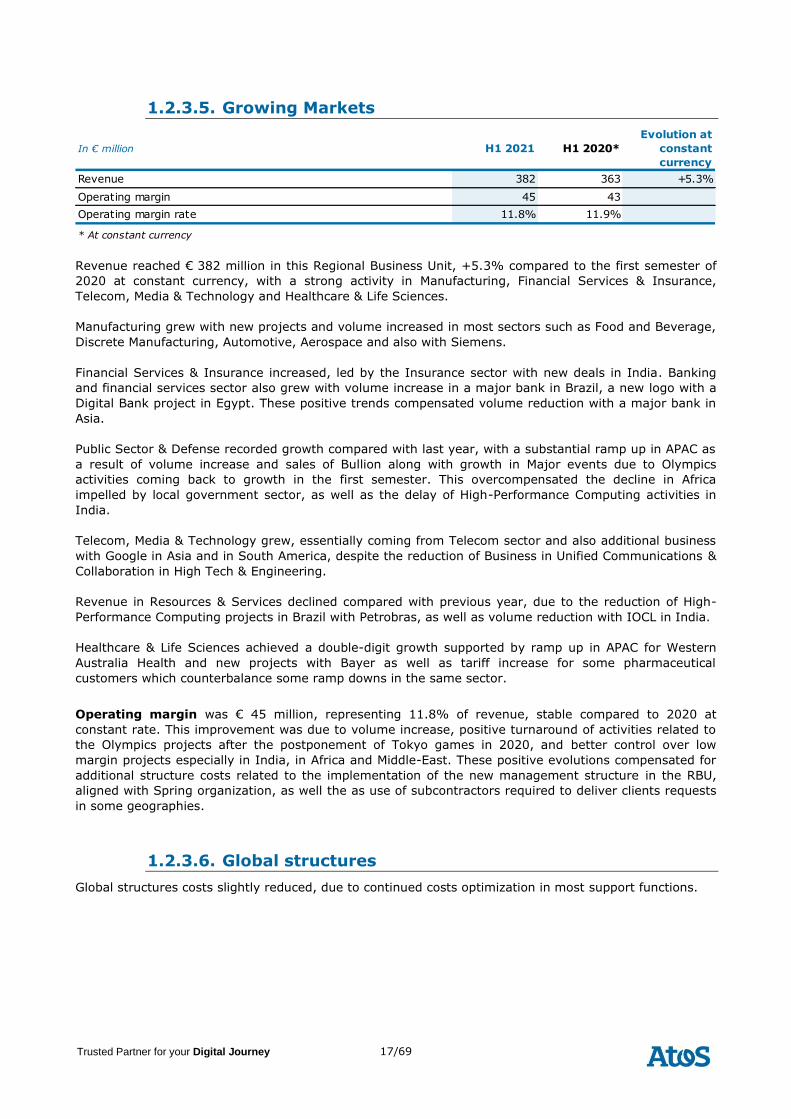
1.2.3.5. Growing Markets
In € million H1 2021 H1 2020*
Evolution at
constant
currency
Revenue 382 363 +5.3%
Operating margin 45 43
Operating margin rate 11.8% 11.9%
* At constant currency
Revenue reached € 382 million in this Regional Business Unit, +5.3% compared to the first semester of
2020 at constant currency, with a strong activity in Manufacturing, Financial Services & Insurance,
Telecom, Media & Technology and Healthcare & Life Sciences.
Manufacturing grew with new projects and volume increased in most sectors such as Food and Beverage,
Discrete Manufacturing, Automotive, Aerospace and also with Siemens.
Financial Services & Insurance increased, led by the Insurance sector with new deals in India. Banking
and financial services sector also grew with volume increase in a major bank in Brazil, a new logo with a
Digital Bank project in Egypt. These positive trends compensated volume reduction with a major bank in
Asia.
Public Sector & Defense recorded growth compared with last year, with a substantial ramp up in APAC as
a result of volume increase and sales of Bullion along with growth in Major events due to Olympics
activities coming back to growth in the first semester. This overcompensated the decline in Africa
impelled by local government sector, as well as the delay of High-Performance Computing activities in
India.
Telecom, Media & Technology grew, essentially coming from Telecom sector and also additional business
with Google in Asia and in South America, despite the reduction of Business in Unified Communications &
Collaboration in High Tech & Engineering.
Revenue in Resources & Services declined compared with previous year, due to the reduction of High-
Performance Computing projects in Brazil with Petrobras, as well as volume reduction with IOCL in India.
Healthcare & Life Sciences achieved a double-digit growth supported by ramp up in APAC for Western
Australia Health and new projects with Bayer as well as tariff increase for some pharmaceutical
customers which counterbalance some ramp downs in the same sector.
Operating margin was € 45 million, representing 11.8% of revenue, stable compared to 2020 at
constant rate. This improvement was due to volume increase, positive turnaround of activities related to
the Olympics projects after the postponement of Tokyo games in 2020, and better control over low
margin projects especially in India, in Africa and Middle-East. These positive evolutions compensated for
additional structure costs related to the implementation of the new management structure in the RBU,
aligned with Spring organization, as well the as use of subcontractors required to deliver clients requests
in some geographies.
1.2.3.6. Global structures
Global structures costs slightly reduced, due to continued costs optimization in most support functions.
18/69 Trusted Partner for your Digital Journey
1.2.4. Portfolio
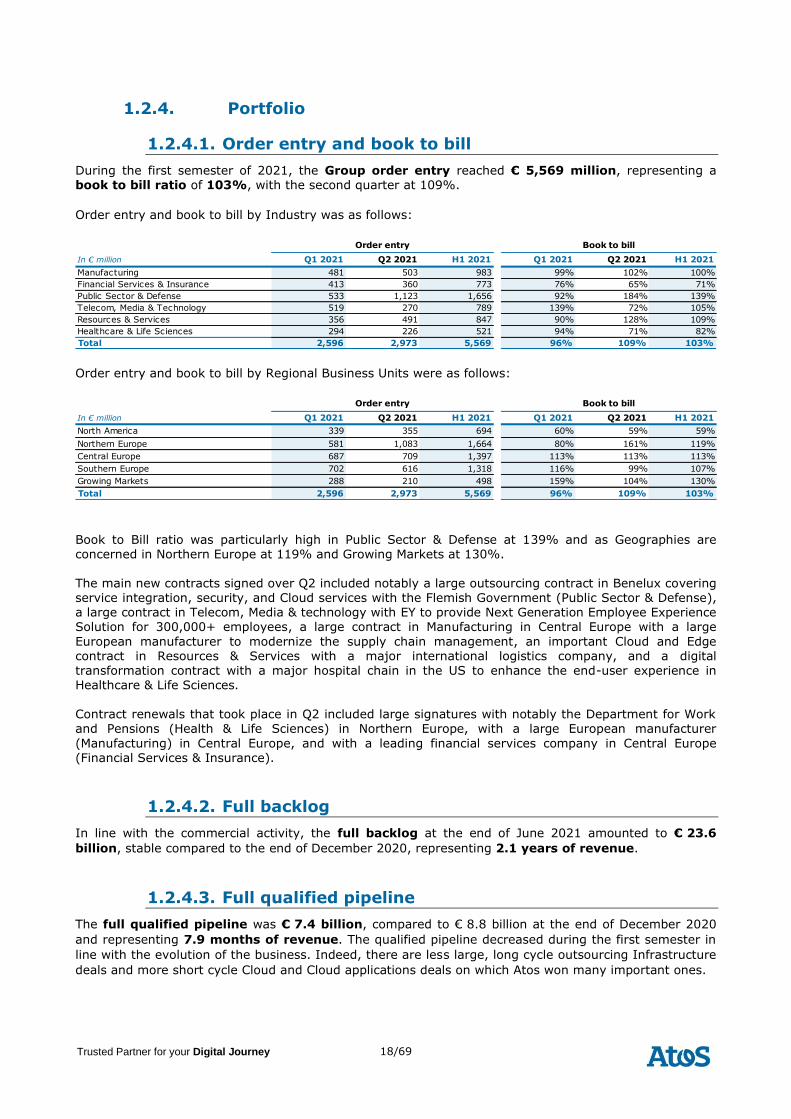
1.2.4.1. Order entry and book to bill
During the first semester of 2021, the Group order entry reached € 5,569 million, representing a book to bill ratio of 103%, with the second quarter at 109%.
Order entry and book to bill by Industry was as follows:
In € million Q1 2021 Q2 2021 H1 2021 Q1 2021 Q2 2021 H1 2021
Manufacturing 481 503 983 99% 102% 100%
Financial Services & Insurance 413 360 773 76% 65% 71%
Public Sector & Defense 533 1,123 1,656 92% 184% 139%
Telecom, Media & Technology 519 270 789 139% 72% 105%
Resources & Services 356 491 847 90% 128% 109%
Healthcare & Life Sciences 294 226 521 94% 71% 82%
Total 2,596 2,973 5,569 96% 109% 103%
Order entry Book to bill
Order entry and book to bill by Regional Business Units were as follows:
In € million Q1 2021 Q2 2021 H1 2021 Q1 2021 Q2 2021 H1 2021
North America 339 355 694 60% 59% 59%
Northern Europe 581 1,083 1,664 80% 161% 119%
Central Europe 687 709 1,397 113% 113% 113%
Southern Europe 702 616 1,318 116% 99% 107%
Growing Markets 288 210 498 159% 104% 130%
Total 2,596 2,973 5,569 96% 109% 103%
Order entry Book to bill
Book to Bill ratio was particularly high in Public Sector & Defense at 139% and as Geographies are concerned in Northern Europe at 119% and Growing Markets at 130%.
The main new contracts signed over Q2 included notably a large outsourcing contract in Benelux covering service integration, security, and Cloud services with the Flemish Government (Public Sector & Defense), a large contract in Telecom, Media & technology with EY to provide Next Generation Employee Experience Solution for 300,000+ employees, a large contract in Manufacturing in Central Europe with a large
European manufacturer to modernize the supply chain management, an important Cloud and Edge contract in Resources & Services with a major international logistics company, and a digital transformation contract with a major hospital chain in the US to enhance the end-user experience in Healthcare & Life Sciences. Contract renewals that took place in Q2 included large signatures with notably the Department for Work and Pensions (Health & Life Sciences) in Northern Europe, with a large European manufacturer
(Manufacturing) in Central Europe, and with a leading financial services company in Central Europe (Financial Services & Insurance).
1.2.4.2. Full backlog
In line with the commercial activity, the full backlog at the end of June 2021 amounted to € 23.6
billion, stable compared to the end of December 2020, representing 2.1 years of revenue.
1.2.4.3. Full qualified pipeline
The full qualified pipeline was € 7.4 billion, compared to € 8.8 billion at the end of December 2020
and representing 7.9 months of revenue. The qualified pipeline decreased during the first semester in
line with the evolution of the business. Indeed, there are less large, long cycle outsourcing Infrastructure
deals and more short cycle Cloud and Cloud applications deals on which Atos won many important ones.
19/69 Trusted Partner for your Digital Journey
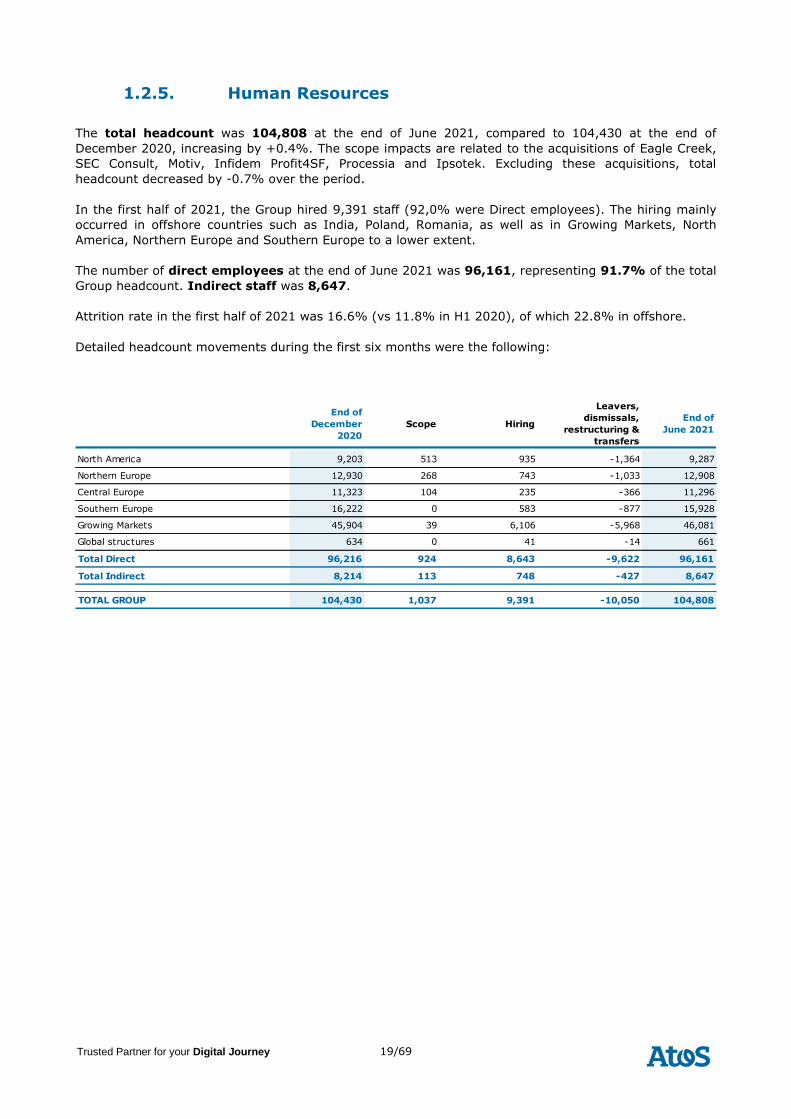
1.2.5. Human Resources
The total headcount was 104,808 at the end of June 2021, compared to 104,430 at the end of
December 2020, increasing by +0.4%. The scope impacts are related to the acquisitions of Eagle Creek,
SEC Consult, Motiv, Infidem Profit4SF, Processia and Ipsotek. Excluding these acquisitions, total
headcount decreased by -0.7% over the period.
In the first half of 2021, the Group hired 9,391 staff (92,0% were Direct employees). The hiring mainly
occurred in offshore countries such as India, Poland, Romania, as well as in Growing Markets, North
America, Northern Europe and Southern Europe to a lower extent.
The number of direct employees at the end of June 2021 was 96,161, representing 91.7% of the total
Group headcount. Indirect staff was 8,647.
Attrition rate in the first half of 2021 was 16.6% (vs 11.8% in H1 2020), of which 22.8% in offshore.
Detailed headcount movements during the first six months were the following:
End of
December
2020
Scope Hiring
Leavers,
dismissals,
restructuring &
transfers
End of
June 2021
North America 9,203 513 935 -1,364 9,287
Northern Europe 12,930 268 743 -1,033 12,908
Central Europe 11,323 104 235 -366 11,296
Southern Europe 16,222 0 583 -877 15,928
Growing Markets 45,904 39 6,106 -5,968 46,081
Global structures 634 0 41 -14 661
Total Direct 96,216 924 8,643 -9,622 96,161
Total Indirect 8,214 113 748 -427 8,647
TOTAL GROUP 104,430 1,037 9,391 -10,050 104,808
20/69 Trusted Partner for your Digital Journey
1.3. 2021 objectives and mid-term targets
The Covid-19 pandemic continued to impact negatively the Group activity, with still a lower demand from
customers in several sectors and more particularly in Aerospace, Car manufacturing, Transportation, Hospitality and non-food Retail. This trend is more pronounced for the classic infrastructure activities that showed in the first semester of this year a larger decline than in the past few years in favor of other activities that benefited from the increasing demand from customers, more specifically the migration to Cloud and Cloud Applications, as well as digital transformation, Cybersecurity, and Big Data.
This drop in the classic infrastructure business resulted in the first half of this year in an unexpected performance of the Group for its three main financial KPIs: revenue growth, operating margin rate, and
free cash flow.
In this context and considering that the trend observed during the first semester of this year should continue during the second semester also, the Group revised the 2021 objectives and issued press release on July 12, 2021.
The acceleration of the digital transformation of the customers benefited to the segments that the Group considers as strategic and will support its growth and profitability agenda. These segments are: Digital, Cloud, Security, and Decarbonization. After 2021, which is a transition year for Atos, the Group expects
to improve on all its KPIs in 2022 and maintains its mid-term targets of revenue growth at constant
currency from +5% to +7%, operating margin rate from 11% to 12% and free cash flow conversion above 60%. This expectation assumes a continued decline of legacy infrastructure business and an increased appetite from customers for digital transformation with trusted partners and is based on the current economic and pandemic environment. The Group also accelerated its transformation agenda that will support pivoting the business mix towards the four key segments mentioned above and increase its
profitability. This transformation is supported by:
• The conclusion of an agreement with social partners in Germany with the objective to turnaround loss making and cash negative areas in Germany on Classic Infrastructure business. The agreement relates to the restructuring of c. 1,300 staff starting this year until the end of 2023. The cost required is c. € 180 million. As part of the agreement signed is the freeze of collective salary increases until the end of 2023 for employees in the scope.
As a result, the objective of the plan is a significant improvement of the operating margin in
Germany representing at Group level +100bps operating margin impact mid-term;
• Bolt-on acquisitions in Digital, Cloud, Security, and Decarbonization of which three announced on
July 28th (see §1.1);
• A strategic portfolio review of non-core assets that will help the Group to focus on growing areas (Digital, Cloud, Security, and Decarbonization) and find partners for other areas and assets to optimize their potential. The Board of Directors in its meeting on July 27, 2021 decided the
following strategic moves: o first, partnering on Datacenter hosting and associated activities to enhance customer service
while improving the utilization of assets; joining forces in a consolidating market will allow these activities to develop further technical expertise and adjacent offerings while conducting required investments in classic infrastructure assets;
o second, the transformation of Atos Unified Communications & Collaboration puts us in the
position to find the right partner with strong software and / or telecommunications expertise; combining technical and go to market capabilities will bring scale and investment that will allow our clients to accelerate their move to Unified Communications-as-a-Service (UCaaS)
Adjusted Objectives
(July 12, 2021)
Initial Objectives
(February 18, 2021)
Revenue growth at constant currency Stable +3.5% to +4.0%
% Operating Margin to revenue c. 6.0% 9.4% to 9.8%
Free Cash Flow Positive €550 to €600 million
21/69 Trusted Partner for your Digital Journey
and Contact Center-as-a-Service (CCaaS), while benefiting from new differentiated services alongside robust private cloud solutions;
o third, partnering with best-in-class digital and specialized players on sub-critical activities to
allow Atos to focus its efforts on its core markets while enhancing the quality of service to customers of those activities.
In total, the Group decided to move forward fast on those tracks, representing a total scope of c. 20% of Group revenue.
1.4. Risk Factors
The main risk factors with which the Group could be confronted are detailed in chapter 7.2 of the 2020 registration document.
No significant changes can be mentioned since the filing date of the 2020 registration document except for the risk factor regarding the audit of the two U.S legal entities on which there was a qualified opinion
in the report of the auditors for the 2020 consolidated financial statements.
Indeed, the Company, with the support of external advisors, has completed the full accounting review of
these entities. The work performed, which has been reviewed by the auditors as part of their half-year procedures, did not reveal any material misstatement for the Group consolidated financial statements. Moreover, the Atos Board of Directors in its meeting held on July 27, 2021, has reviewed the Group half-year consolidated financial statements closed at June 30, 2021. The Statutory Auditors have completed their usual limited review of the half-year condensed consolidated financial statements and an unqualified Auditors’ report was issued.
The remediation and prevention plan was completed and is being rolled-out. The main actions set-up in the plan covered the following topics: preventive controls, guidelines and documentation, HR review, skilling and organization, and awareness and training. The aim of the plan is remediation in North America and prevention in all regions.
1.5. Claims and litigations
The Atos Group is a global business operating in 71 countries. In many of the countries where the Group
operates there are no claims, and in others there are only a very small number of claims or actions
involving the Group. Having regards to the Group’ size and revenue, the level of claims and litigation
remains low.
The low level of claims and litigation is attributable in part to self-insurance incentives and the vigorous
promotion of the quality of the services performed by the Group as well as to the intervention of a fully
dedicated Risk Management department, which effectively monitors contract management from offering
through delivery and provides early warnings on potential issues. All potential and active claims and
disputes are carefully monitored, reported and managed in an appropriate manner and are subject to
legal reviews by the Group Legal Department.
During the first half-year of 2021 the Group has successfully put an end to several significant litigations
through settlements agreements and favorable court decisions.
Group Management considers that sufficient provisions have been made.
The total amount of the provisions for litigation risks, in the consolidated accounts closed as of June 30,
2021 to cover the identified claims and litigations, added up to € 34 million (including tax and commercial
claims but excluding labor claims).
22/69 Trusted Partner for your Digital Journey
1.5.1. Tax claims
The Group is involved in a number of routine tax claims, audits and litigations. Such claims are usually
solved through administrative non-contentious proceedings.
Some of the tax claims are in India and Brazil, where Atos is a defendant in some cases and a plaintiff in
others. Such claims are typical for companies operating in these regions. Proceedings in these countries
usually take a long time to be processed.
Following the decision in a reported test case in the UK, there is substantial ongoing court claim against
the UK tax authorities for a stamp duty re-imbursement. Following a judgment regarding HSBC reached
by the European Justice Court, Atos UK commenced proceedings in 2009 to recover a stamp duty paid in
2000 of an amount over € 10 million. The stamp duty aspect of the claim was won in 2012. Regarding
the statute of limitation, a favorable judgment was obtained in April 2017. Atos UK is now waiting for the
outcome of the HMRC’s request for appeal in similar cases.
The total provision for tax claims, as inscribed in the consolidated accounts closed as at June 30, 2021,
was € 24 million.
1.5.2. Commercial claims
There are a small number of commercial claims across the Group.
Some important contracts that have been monitored by the Risk Management Department have evolved
into litigation. These disputes are managed by the Group's Legal Department.
Significant commercial cases have been closed this semester.
There is a number of significant ongoing commercial cases in various jurisdictions that the Group has
integrated as a result of several acquisitions, notably a litigation inherited from Syntel.
On April 20, 2021, the United States District Court for the Southern District of New York granted in part
the post-trial motion filed by Syntel, now part of Atos, in connection with Syntel’s ongoing litigation with
Cognizant and its subsidiary TriZetto. The Court reduced the jury’s $855 million damages award to $570
million and denied Cognizant and TriZetto’s request for an additional $75 million in pre-judgment
interest.
In October 2020, a jury found Syntel liable for trade secret misappropriation and copyright infringement
and awarded Cognizant and TriZetto approximately $855 million in damages. Throughout the trial and in
its post-trial motion, Syntel maintained that Cognizant and TriZetto had failed to meet their burden to
show trade secret misappropriation and that their damages theories were improper as a matter of law.
In its decision, the Court held that sufficient evidence existed to support the jury’s verdict of trade secret
misappropriation and that the jury’s award of $285 million in compensatory damages was not contrary to
law. However, the Court found that the jury’s $570 million punitive damages award was excessive and
should be reduced to $285 million. TriZetto agreed to this reduction. The Court issued an injunction
prohibiting future use by Syntel of the specific trade secrets at issue in the trial.
While Atos supports the Court’s decision to significantly reduce the punitive damages at issue and
prevent a further windfall to Cognizant and TriZetto in the form of pre-judgment interest, Atos appealed
the portion of the jury’s verdict affirmed by the Court. Among other concerns, Atos continues to consider
the amount of damages grossly out of proportion to the acts complained of, and that the maximum
amount of damages legally available to TriZetto in this case is approximately $8.5 million. The appeal
was filed with the U.S. Court of Appeals for the Second Circuit on May 26, 2021.
The total provision for commercial claim risks, as recorded in the consolidated accounts closed as at June
30, 2021, amounts to € 10,1 million.
23/69 Trusted Partner for your Digital Journey
1.5.3. Labor claims
There are close to 105.000 employees in the Group and relatively few labor claims. In almost every
jurisdiction there are no or very few claims. Latin America is the only area where there is a significant
number of claims, but such claims are often of low value or inflated and typical for companies operating
in this region.
The Group is respondent in a few labor claims of higher value, but in the Group’s opinion most of these
claims have little or no merit and are provisioned appropriately.
All of the claims exceeding €300,000 have been provisioned for an overall amount of € 6,2 million as
recorded in the consolidated financial statements as at June 30, 2021.
1.5.4. Representation & Warranty claims
The Group is a party to a very small number of representation & warranty claims arising out of
acquisitions/disposals.
1.5.5. Miscellaneous
To the knowledge of the Company, there are no other administrative, governmental, judicial, or arbitral
proceedings, pending or potential, likely to have or having had significant consequences over the past
semester on the Company’s and the Group’s financial situation or profitability.
1.6. Related parties
This paragraph is aimed at ensuring transparency in the relationship between the Group and its
Shareholders (and their representatives), as well as in the links between the Group and related
companies that the Group does not exclusively control (i.e. joint ventures or investments in associates).
The related-party transactions are described in the Note 17 – Related party transactions on pages 325
and 326 of the 2020 Universal Registration Document.
24/69 Trusted Partner for your Digital Journey
2. Financial statements
2.1. Financial review
2.1.1. Income statement
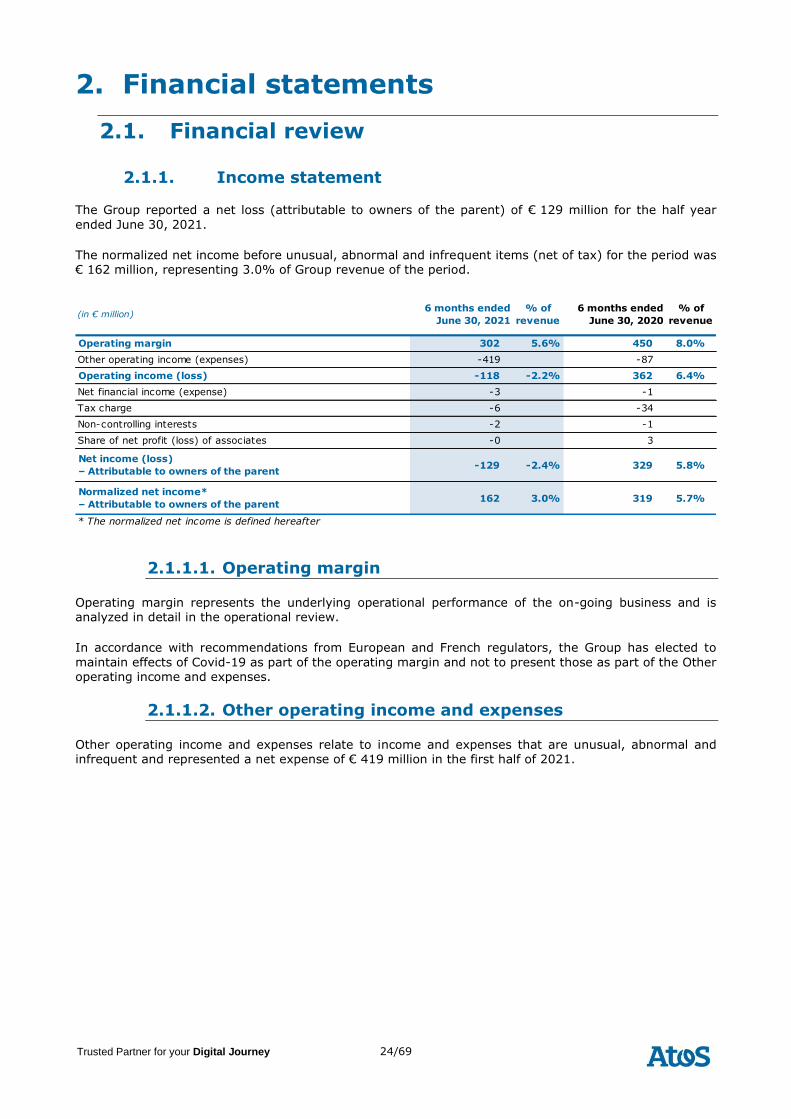
The Group reported a net loss (attributable to owners of the parent) of € 129 million for the half year
ended June 30, 2021.
The normalized net income before unusual, abnormal and infrequent items (net of tax) for the period was € 162 million, representing 3.0% of Group revenue of the period.
(in € million)6 months ended
June 30, 2021
% of
revenue
6 months ended
June 30, 2020
% of
revenue
Operating margin 302 5.6% 450 8.0%
Other operating income (expenses) -419 -87
Operating income (loss) -118 -2.2% 362 6.4%
Net financial income (expense) -3 -1
Tax charge -6 -34
Non-controlling interests -2 -1
Share of net profit (loss) of associates -0 3
Net income (loss)
– Attributable to owners of the parent-129 -2.4% 329 5.8%
Normalized net income*
– Attributable to owners of the parent162 3.0% 319 5.7%
* The normalized net income is defined hereafter
2.1.1.1. Operating margin
Operating margin represents the underlying operational performance of the on-going business and is analyzed in detail in the operational review.
In accordance with recommendations from European and French regulators, the Group has elected to
maintain effects of Covid-19 as part of the operating margin and not to present those as part of the Other operating income and expenses.
2.1.1.2. Other operating income and expenses
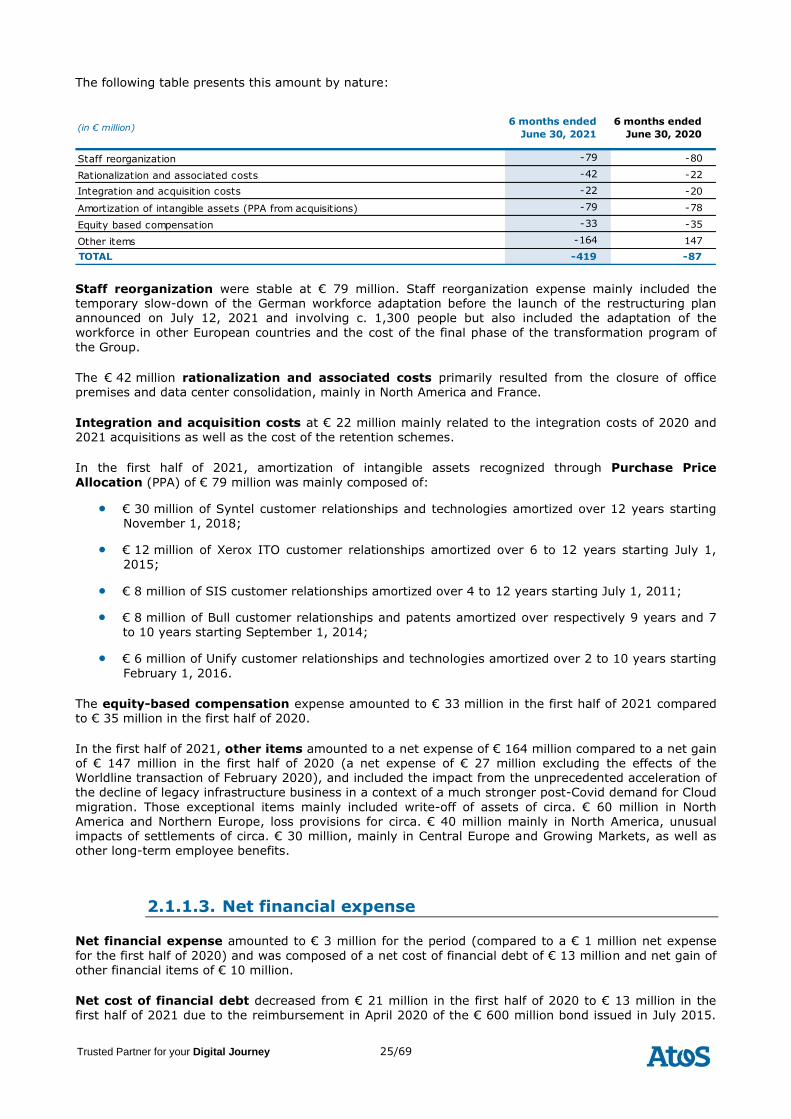
Other operating income and expenses relate to income and expenses that are unusual, abnormal and infrequent and represented a net expense of € 419 million in the first half of 2021.
25/69 Trusted Partner for your Digital Journey
The following table presents this amount by nature:
(in € million)6 months ended
June 30, 2021
6 months ended
June 30, 2020
Staff reorganization -79 -80
Rationalization and associated costs -42 -22
Integration and acquisition costs -22 -20
Amortization of intangible assets (PPA from acquisitions) -79 -78
Equity based compensation -33 -35
Other items -164 147
TOTAL -419 -87
Staff reorganization were stable at € 79 million. Staff reorganization expense mainly included the temporary slow-down of the German workforce adaptation before the launch of the restructuring plan announced on July 12, 2021 and involving c. 1,300 people but also included the adaptation of the
workforce in other European countries and the cost of the final phase of the transformation program of
the Group.
The € 42 million rationalization and associated costs primarily resulted from the closure of office premises and data center consolidation, mainly in North America and France.
Integration and acquisition costs at € 22 million mainly related to the integration costs of 2020 and 2021 acquisitions as well as the cost of the retention schemes.
In the first half of 2021, amortization of intangible assets recognized through Purchase Price
Allocation (PPA) of € 79 million was mainly composed of:
• € 30 million of Syntel customer relationships and technologies amortized over 12 years starting November 1, 2018;
• € 12 million of Xerox ITO customer relationships amortized over 6 to 12 years starting July 1, 2015;
• € 8 million of SIS customer relationships amortized over 4 to 12 years starting July 1, 2011;
• € 8 million of Bull customer relationships and patents amortized over respectively 9 years and 7 to 10 years starting September 1, 2014;
• € 6 million of Unify customer relationships and technologies amortized over 2 to 10 years starting
February 1, 2016.
The equity-based compensation expense amounted to € 33 million in the first half of 2021 compared to € 35 million in the first half of 2020.
In the first half of 2021, other items amounted to a net expense of € 164 million compared to a net gain of € 147 million in the first half of 2020 (a net expense of € 27 million excluding the effects of the Worldline transaction of February 2020), and included the impact from the unprecedented acceleration of the decline of legacy infrastructure business in a context of a much stronger post-Covid demand for Cloud
migration. Those exceptional items mainly included write-off of assets of circa. € 60 million in North America and Northern Europe, loss provisions for circa. € 40 million mainly in North America, unusual impacts of settlements of circa. € 30 million, mainly in Central Europe and Growing Markets, as well as other long-term employee benefits.
2.1.1.3. Net financial expense
Net financial expense amounted to € 3 million for the period (compared to a € 1 million net expense
for the first half of 2020) and was composed of a net cost of financial debt of € 13 million and net gain of other financial items of € 10 million.
Net cost of financial debt decreased from € 21 million in the first half of 2020 to € 13 million in the first half of 2021 due to the reimbursement in April 2020 of the € 600 million bond issued in July 2015.
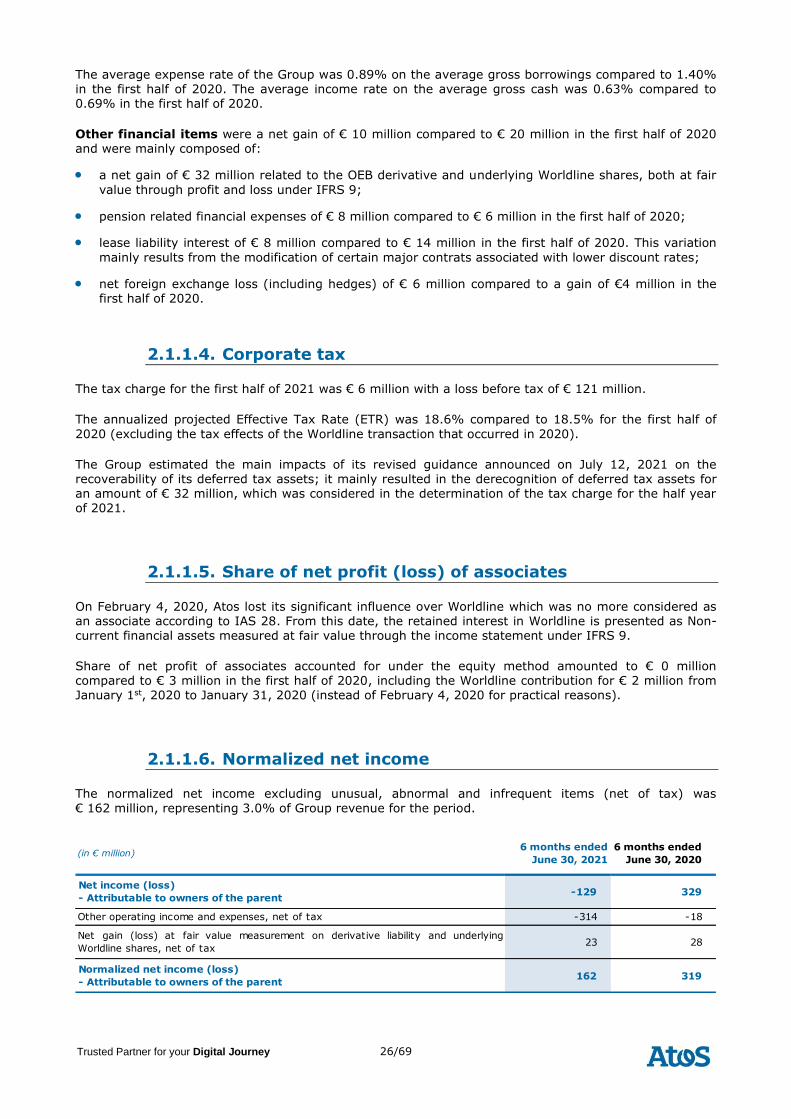
26/69 Trusted Partner for your Digital Journey
The average expense rate of the Group was 0.89% on the average gross borrowings compared to 1.40% in the first half of 2020. The average income rate on the average gross cash was 0.63% compared to 0.69% in the first half of 2020.
Other financial items were a net gain of € 10 million compared to € 20 million in the first half of 2020 and were mainly composed of:
• a net gain of € 32 million related to the OEB derivative and underlying Worldline shares, both at fair
value through profit and loss under IFRS 9;
• pension related financial expenses of € 8 million compared to € 6 million in the first half of 2020;
• lease liability interest of € 8 million compared to € 14 million in the first half of 2020. This variation
mainly results from the modification of certain major contrats associated with lower discount rates;
• net foreign exchange loss (including hedges) of € 6 million compared to a gain of €4 million in the first half of 2020.
2.1.1.4. Corporate tax
The tax charge for the first half of 2021 was € 6 million with a loss before tax of € 121 million.
The annualized projected Effective Tax Rate (ETR) was 18.6% compared to 18.5% for the first half of
2020 (excluding the tax effects of the Worldline transaction that occurred in 2020).
The Group estimated the main impacts of its revised guidance announced on July 12, 2021 on the recoverability of its deferred tax assets; it mainly resulted in the derecognition of deferred tax assets for an amount of € 32 million, which was considered in the determination of the tax charge for the half year of 2021.
2.1.1.5. Share of net profit (loss) of associates
On February 4, 2020, Atos lost its significant influence over Worldline which was no more considered as an associate according to IAS 28. From this date, the retained interest in Worldline is presented as Non-current financial assets measured at fair value through the income statement under IFRS 9.
Share of net profit of associates accounted for under the equity method amounted to € 0 million compared to € 3 million in the first half of 2020, including the Worldline contribution for € 2 million from January 1st, 2020 to January 31, 2020 (instead of February 4, 2020 for practical reasons).
2.1.1.6. Normalized net income
The normalized net income excluding unusual, abnormal and infrequent items (net of tax) was
€ 162 million, representing 3.0% of Group revenue for the period.
(in € million)6 months ended
June 30, 2021
6 months ended
June 30, 2020
Net income (loss)
- Attributable to owners of the parent-129 329
Other operating income and expenses, net of tax -314 -18
Net gain (loss) at fair value measurement on derivative liability and underlying
Worldline shares, net of tax23 28
Normalized net income (loss)
- Attributable to owners of the parent 162 319
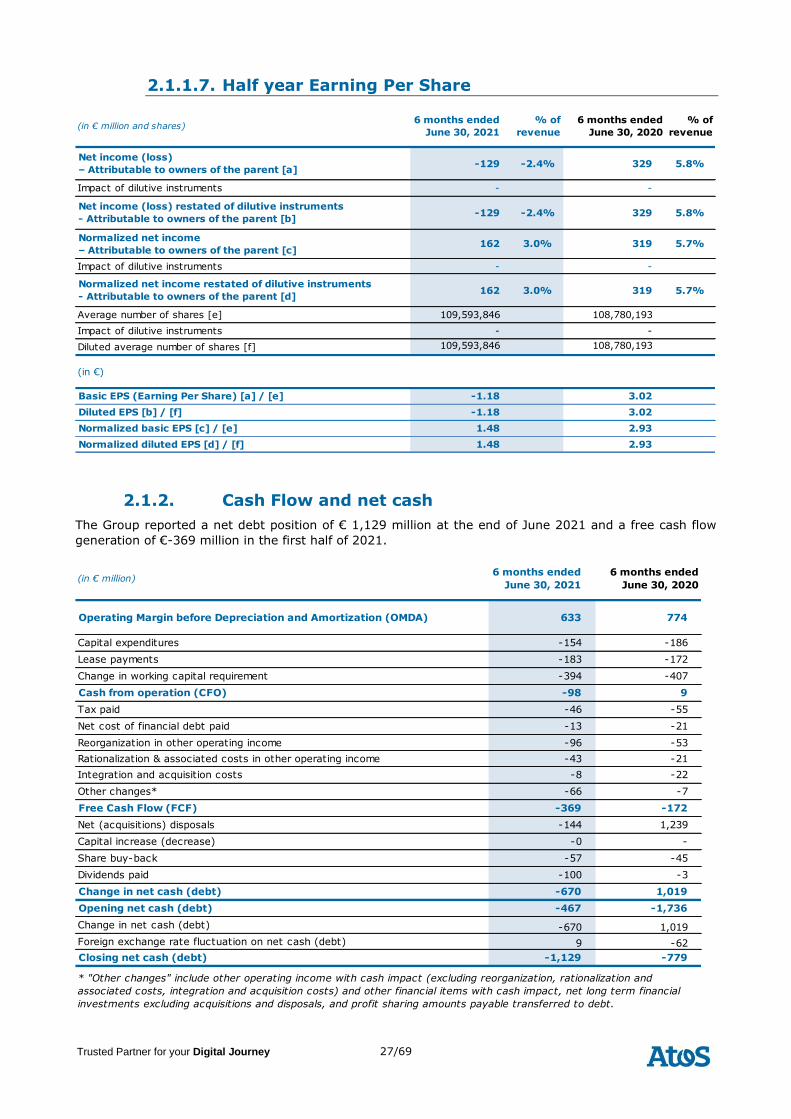
27/69 Trusted Partner for your Digital Journey
2.1.1.7. Half year Earning Per Share
(in € million and shares)6 months ended
June 30, 2021
% of
revenue
6 months ended
June 30, 2020
% of
revenue
Net income (loss)
– Attributable to owners of the parent [a]-129 -2.4% 329 5.8%
Impact of dilutive instruments - -
Net income (loss) restated of dilutive instruments
- Attributable to owners of the parent [b]-129 -2.4% 329 5.8%
Normalized net income
– Attributable to owners of the parent [c]162 3.0% 319 5.7%
Impact of dilutive instruments - -
Normalized net income restated of dilutive instruments
- Attributable to owners of the parent [d]162 3.0% 319 5.7%
Average number of shares [e] 109,593,846 108,780,193
Impact of dilutive instruments - -
Diluted average number of shares [f] 109,593,846 108,780,193
(in €)
Basic EPS (Earning Per Share) [a] / [e] -1.18 3.02
Diluted EPS [b] / [f] -1.18 3.02
Normalized basic EPS [c] / [e] 1.48 2.93
Normalized diluted EPS [d] / [f] 1.48 2.93
2.1.2. Cash Flow and net cash
The Group reported a net debt position of € 1,129 million at the end of June 2021 and a free cash flow
generation of €-369 million in the first half of 2021.
(in € million)6 months ended
June 30, 2021
6 months ended
June 30, 2020
Operating Margin before Depreciation and Amortization (OMDA) 633 774
Capital expenditures -154 -186
Lease payments -183 -172
Change in working capital requirement -394 -407
Cash from operation (CFO) -98 9
Tax paid -46 -55
Net cost of financial debt paid -13 -21
Reorganization in other operating income -96 -53
Rationalization & associated costs in other operating income -43 -21
Integration and acquisition costs -8 -22
Other changes* -66 -7
Free Cash Flow (FCF) -369 -172
Net (acquisitions) disposals -144 1,239
Capital increase (decrease) -0 -
Share buy-back -57 -45
Dividends paid -100 -3
Change in net cash (debt) -670 1,019
Opening net cash (debt) -467 -1,736
Change in net cash (debt) -670 1,019
Foreign exchange rate fluctuation on net cash (debt) 9 -62
Closing net cash (debt) -1,129 -779
* "Other changes" include other operating income with cash impact (excluding reorganization, rationalization and
associated costs, integration and acquisition costs) and other financial items with cash impact, net long term financial
investments excluding acquisitions and disposals, and profit sharing amounts payable transferred to debt.
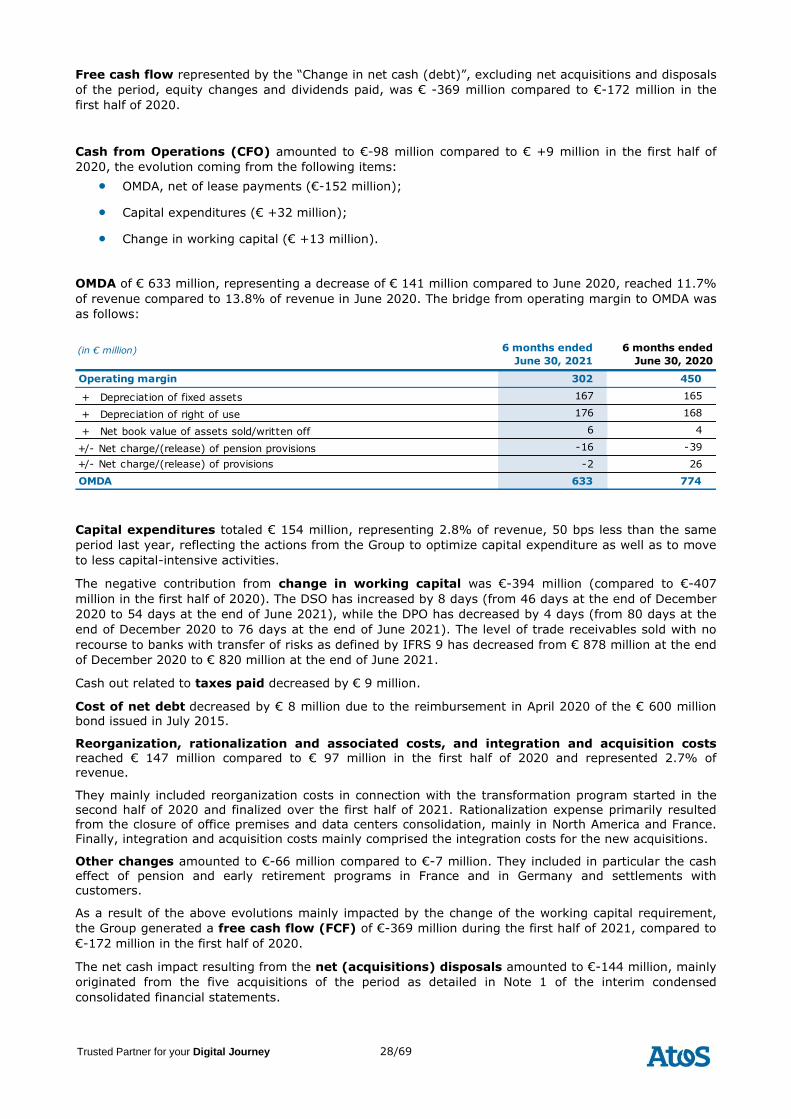
28/69 Trusted Partner for your Digital Journey
Free cash flow represented by the “Change in net cash (debt)”, excluding net acquisitions and disposals
of the period, equity changes and dividends paid, was € -369 million compared to €-172 million in the
first half of 2020.
Cash from Operations (CFO) amounted to €-98 million compared to € +9 million in the first half of
2020, the evolution coming from the following items:
• OMDA, net of lease payments (€-152 million);
• Capital expenditures (€ +32 million);
• Change in working capital (€ +13 million).
OMDA of € 633 million, representing a decrease of € 141 million compared to June 2020, reached 11.7%
of revenue compared to 13.8% of revenue in June 2020. The bridge from operating margin to OMDA was
as follows:
(in € million) 6 months ended
June 30, 2021
6 months ended
June 30, 2020
Operating margin 302 450
+ Depreciation of fixed assets 167 165
+ Depreciation of right of use 176 168
+ Net book value of assets sold/written off 6 4
+/- Net charge/(release) of pension provisions -16 -39
+/- Net charge/(release) of provisions -2 26
OMDA 633 774
Capital expenditures totaled € 154 million, representing 2.8% of revenue, 50 bps less than the same
period last year, reflecting the actions from the Group to optimize capital expenditure as well as to move
to less capital-intensive activities.
The negative contribution from change in working capital was €-394 million (compared to €-407
million in the first half of 2020). The DSO has increased by 8 days (from 46 days at the end of December
2020 to 54 days at the end of June 2021), while the DPO has decreased by 4 days (from 80 days at the
end of December 2020 to 76 days at the end of June 2021). The level of trade receivables sold with no
recourse to banks with transfer of risks as defined by IFRS 9 has decreased from € 878 million at the end
of December 2020 to € 820 million at the end of June 2021.
Cash out related to taxes paid decreased by € 9 million.
Cost of net debt decreased by € 8 million due to the reimbursement in April 2020 of the € 600 million bond issued in July 2015.
Reorganization, rationalization and associated costs, and integration and acquisition costs reached € 147 million compared to € 97 million in the first half of 2020 and represented 2.7% of revenue.
They mainly included reorganization costs in connection with the transformation program started in the
second half of 2020 and finalized over the first half of 2021. Rationalization expense primarily resulted from the closure of office premises and data centers consolidation, mainly in North America and France. Finally, integration and acquisition costs mainly comprised the integration costs for the new acquisitions.
Other changes amounted to €-66 million compared to €-7 million. They included in particular the cash effect of pension and early retirement programs in France and in Germany and settlements with customers.
As a result of the above evolutions mainly impacted by the change of the working capital requirement,
the Group generated a free cash flow (FCF) of €-369 million during the first half of 2021, compared to
€-172 million in the first half of 2020.
The net cash impact resulting from the net (acquisitions) disposals amounted to €-144 million, mainly
originated from the five acquisitions of the period as detailed in Note 1 of the interim condensed
consolidated financial statements.
29/69 Trusted Partner for your Digital Journey
There was no capital increase in either of the first half of 2021 and 2020.
Share buy-back reached € 57 million during the first half of 2021 compared to € 45 million in the first
half of 2020. These share buy-back programs are related to managers performance shares delivery and
aim at avoiding a dilution effect for the shareholders.
In the first half of 2021, dividends paid by Atos SE amounted to € 98 million while no dividends were
paid in 2020 as a consequence of the Covid-19 economic impact.
Foreign exchange rate fluctuation determined on debt or cash exposure by country represented a
decrease in net debt of € 9 million mainly coming from the exchange rates of the US Dollar, Indian Rupee
and British Pound against the Euro.
As a result, the Group net debt position as of June 31, 2021 was € 1,129 million, compared to € 467
million as of December 31, 2020. As a reminder, assuming the full conversion of the Optional
Exchangeable Bonds, net debt would be € 629 million at the end of June 2021.
2.1.3. Bank covenant
The Group achieved its borrowing covenant (leverage ratio) applicable to the multi-currency revolving
credit facility, with a leverage ratio (net debt divided by OMDA) of 0.99 at the end of June 2021.
According to the credit documentation of the multi-currency revolving credit facility, the leverage ratio is
calculated excluding IFRS 16 impacts since 2019 and takes into account 12 months rolling of OMDA.
The leverage ratio must not be greater than 2.5 times under the terms of the multi-currency revolving
credit facility.
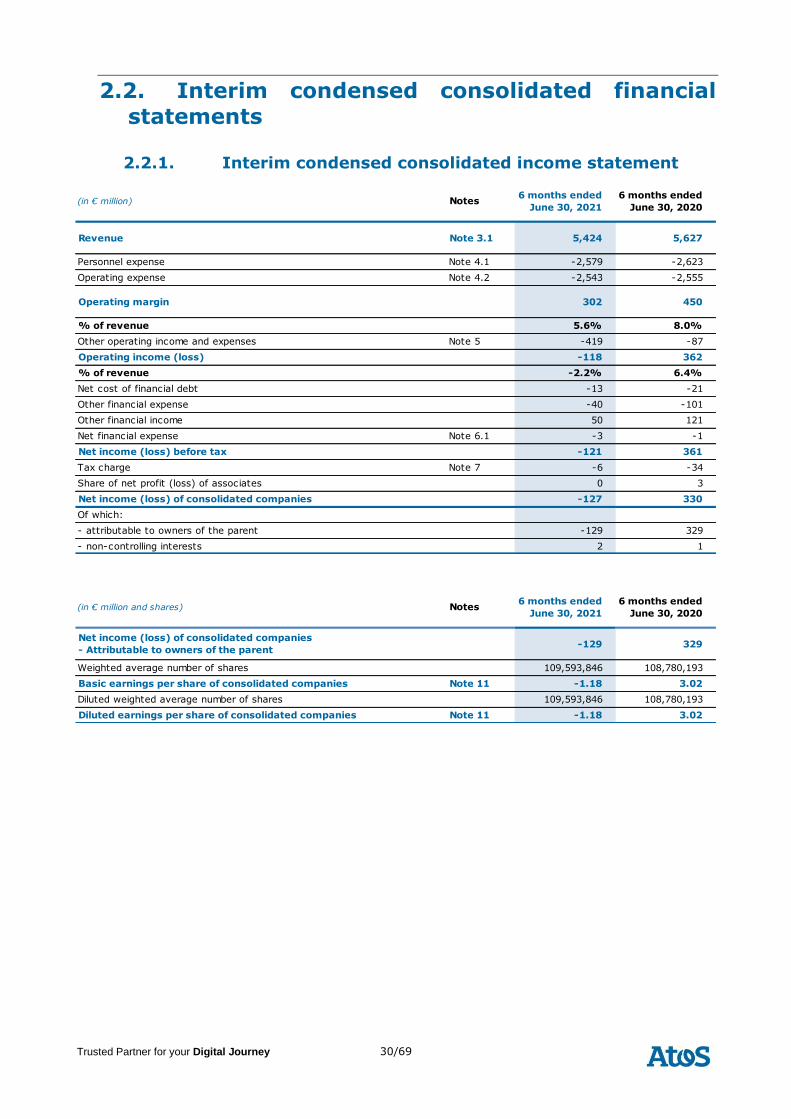
30/69 Trusted Partner for your Digital Journey
2.2. Interim condensed consolidated financial
statements
2.2.1. Interim condensed consolidated income statement
(in € million) Notes6 months ended
June 30, 2021
6 months ended
June 30, 2020
Revenue Note 3.1 5,424 5,627
Personnel expense Note 4.1 -2,579 -2,623
Operating expense Note 4.2 -2,543 -2,555
Operating margin 302 450
% of revenue 5.6% 8.0%
Other operating income and expenses Note 5 -419 -87
Operating income (loss) -118 362
% of revenue -2.2% 6.4%
Net cost of financial debt -13 -21
Other financial expense -40 -101
Other financial income 50 121
Net financial expense Note 6.1 -3 -1
Net income (loss) before tax -121 361
Tax charge Note 7 -6 -34
Share of net profit (loss) of associates 0 3
Net income (loss) of consolidated companies -127 330
Of which:
- attributable to owners of the parent -129 329
- non-controlling interests 2 1
(in € million and shares) Notes6 months ended
June 30, 2021
6 months ended
June 30, 2020
Net income (loss) of consolidated companies
- Attributable to owners of the parent-129 329
Weighted average number of shares 109,593,846 108,780,193
Basic earnings per share of consolidated companies Note 11 -1.18 3.02
Diluted weighted average number of shares 109,593,846 108,780,193
Diluted earnings per share of consolidated companies Note 11 -1.18 3.02
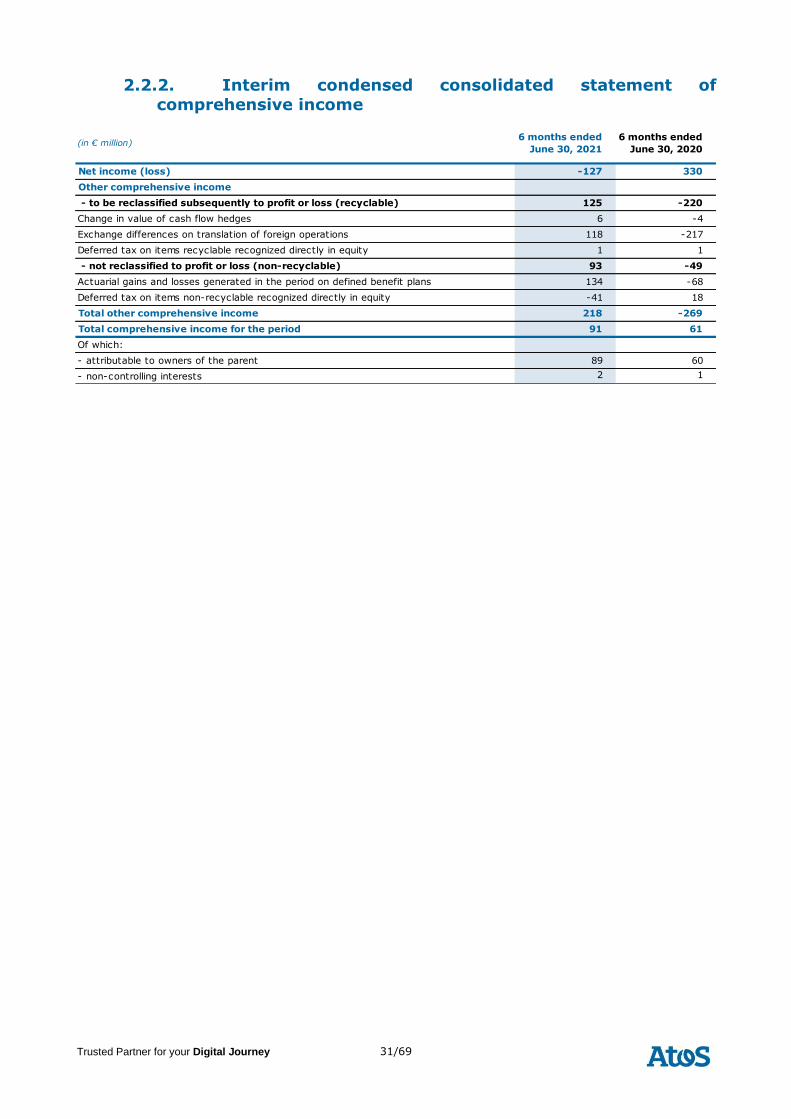
31/69 Trusted Partner for your Digital Journey
2.2.2. Interim condensed consolidated statement of
comprehensive income
(in € million)6 months ended
June 30, 2021
6 months ended
June 30, 2020
Net income (loss) -127 330
Other comprehensive income
125 -220
Change in value of cash flow hedges 6 -4
Exchange differences on translation of foreign operations 118 -217
Deferred tax on items recyclable recognized directly in equity 1 1
93 -49
134 -68
Deferred tax on items non-recyclable recognized directly in equity -41 18
Total other comprehensive income 218 -269
Total comprehensive income for the period 91 61
Of which:
- attributable to owners of the parent 89 60
- non-controlling interests 2 1
Actuarial gains and losses generated in the period on defined benefit plans
- to be reclassified subsequently to profit or loss (recyclable)
- not reclassified to profit or loss (non-recyclable)
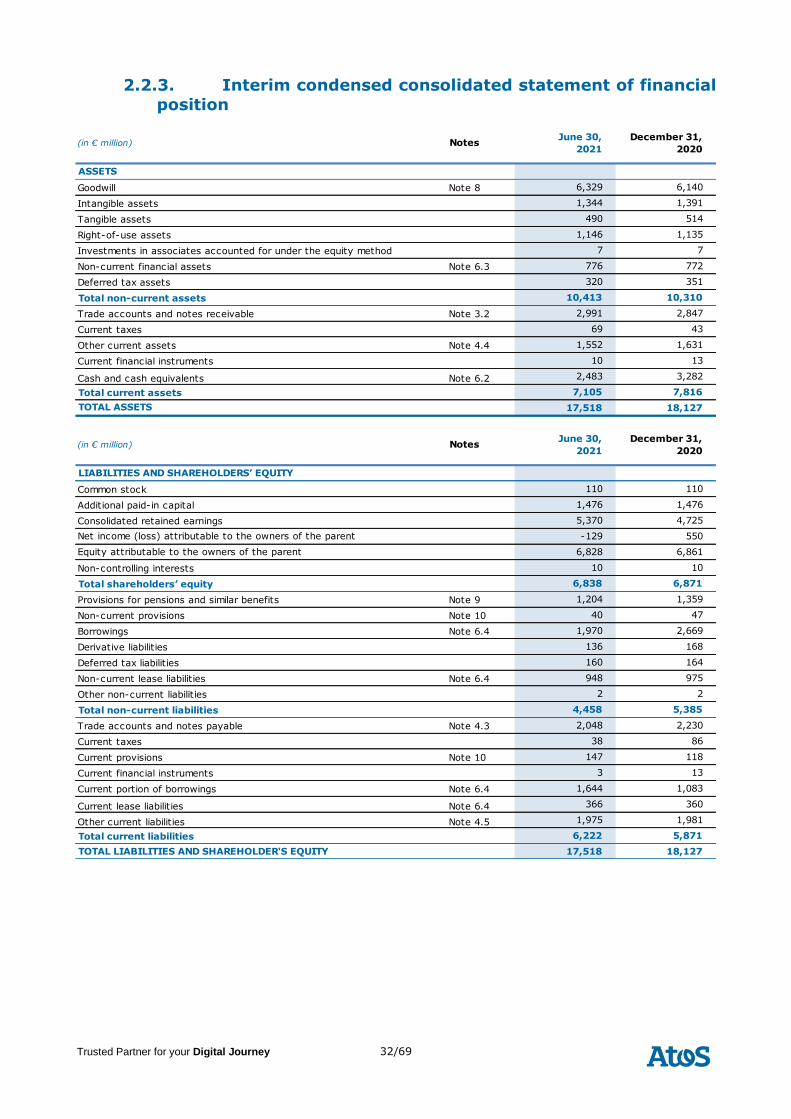
32/69 Trusted Partner for your Digital Journey
2.2.3. Interim condensed consolidated statement of financial
position
(in € million) NotesJune 30,
2021
December 31,
2020
ASSETS
Goodwill Note 8 6,329 6,140
Intangible assets 1,344 1,391
Tangible assets 490 514
Right-of-use assets 1,146 1,135
Investments in associates accounted for under the equity method 7 7
Non-current financial assets Note 6.3 776 772
Deferred tax assets 320 351
Total non-current assets 10,413 10,310
Trade accounts and notes receivable Note 3.2 2,991 2,847
Current taxes 69 43
Other current assets Note 4.4 1,552 1,631
Current financial instruments 10 13
Cash and cash equivalents Note 6.2 2,483 3,282
Total current assets 7,105 7,816
TOTAL ASSETS 17,518 18,127
(in € million) NotesJune 30,
2021
December 31,
2020
LIABILITIES AND SHAREHOLDERS’ EQUITY
Common stock 110 110
Additional paid-in capital 1,476 1,476
Consolidated retained earnings 5,370 4,725
Net income (loss) attributable to the owners of the parent -129 550
Equity attributable to the owners of the parent 6,828 6,861
Non-controlling interests 10 10
Total shareholders’ equity 6,838 6,871
Provisions for pensions and similar benefits Note 9 1,204 1,359
Non-current provisions Note 10 40 47
Borrowings Note 6.4 1,970 2,669
Derivative liabilities 136 168
Deferred tax liabilities 160 164
Non-current lease liabilities Note 6.4 948 975
Other non-current liabilities 2 2
Total non-current liabilities 4,458 5,385
Trade accounts and notes payable Note 4.3 2,048 2,230
Current taxes 38 86
Current provisions Note 10 147 118
Current financial instruments 3 13
Current portion of borrowings Note 6.4 1,644 1,083
Current lease liabilities Note 6.4 366 360
Other current liabilities Note 4.5 1,975 1,981
Total current liabilities 6,222 5,871
TOTAL LIABILITIES AND SHAREHOLDER'S EQUITY 17,518 18,127
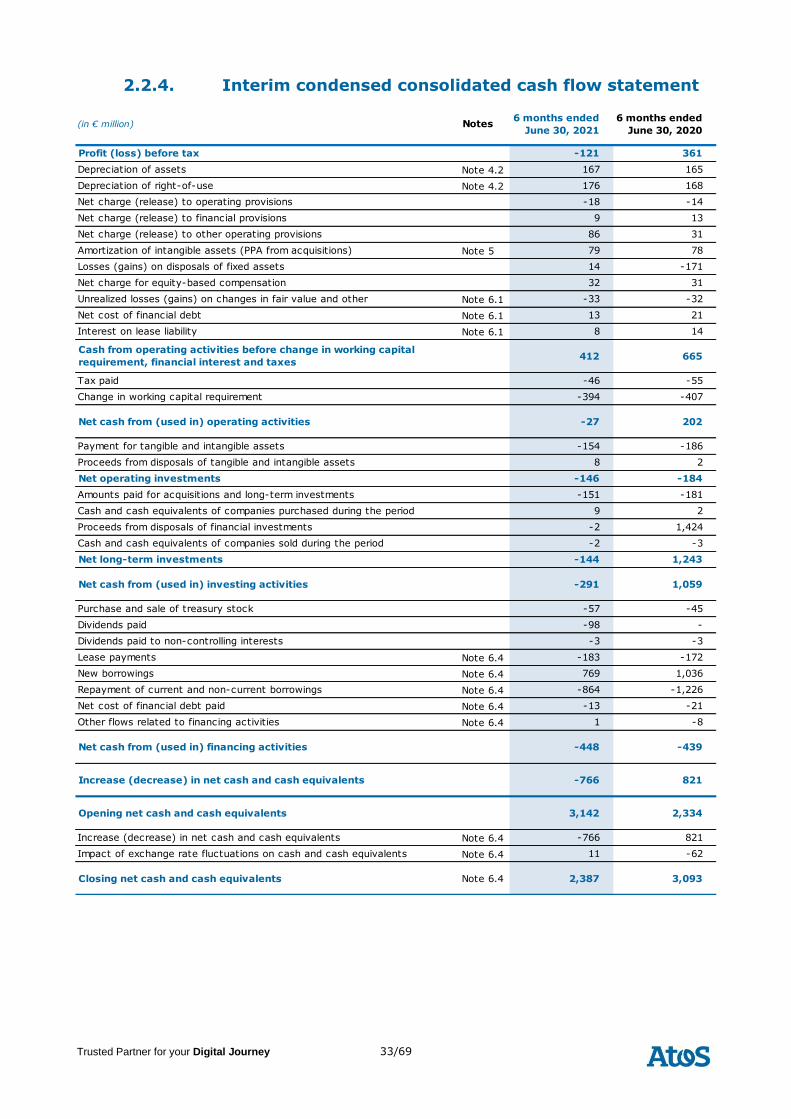
33/69 Trusted Partner for your Digital Journey
2.2.4. Interim condensed consolidated cash flow statement
(in € million) Notes6 months ended
June 30, 2021
6 months ended
June 30, 2020
Profit (loss) before tax -121 361
Depreciation of assets Note 4.2 167 165
Depreciation of right-of-use Note 4.2 176 168
Net charge (release) to operating provisions -18 -14
Net charge (release) to financial provisions 9 13
Net charge (release) to other operating provisions 86 31
Amortization of intangible assets (PPA from acquisitions) Note 5 79 78
Losses (gains) on disposals of fixed assets 14 -171
Net charge for equity-based compensation 32 31
Unrealized losses (gains) on changes in fair value and other Note 6.1 -33 -32
Net cost of financial debt Note 6.1 13 21
Interest on lease liability Note 6.1 8 14
Cash from operating activities before change in working capital
requirement, financial interest and taxes412 665
Tax paid -46 -55
Change in working capital requirement -394 -407
Net cash from (used in) operating activities -27 202
Payment for tangible and intangible assets -154 -186
Proceeds from disposals of tangible and intangible assets 8 2
Net operating investments -146 -184
Amounts paid for acquisitions and long-term investments -151 -181
Cash and cash equivalents of companies purchased during the period 9 2
Proceeds from disposals of financial investments -2 1,424
Cash and cash equivalents of companies sold during the period -2 -3
Net long-term investments -144 1,243
Net cash from (used in) investing activities -291 1,059
Purchase and sale of treasury stock -57 -45
Dividends paid -98 -
Dividends paid to non-controlling interests -3 -3
Lease payments Note 6.4 -183 -172
New borrowings Note 6.4 769 1,036
Repayment of current and non-current borrowings Note 6.4 -864 -1,226
Net cost of financial debt paid Note 6.4 -13 -21
Other flows related to financing activities Note 6.4 1 -8
Net cash from (used in) financing activities -448 -439
Increase (decrease) in net cash and cash equivalents -766 821
Opening net cash and cash equivalents 3,142 2,334
Increase (decrease) in net cash and cash equivalents Note 6.4 -766 821
Impact of exchange rate fluctuations on cash and cash equivalents Note 6.4 11 -62
Closing net cash and cash equivalents Note 6.4 2,387 3,093
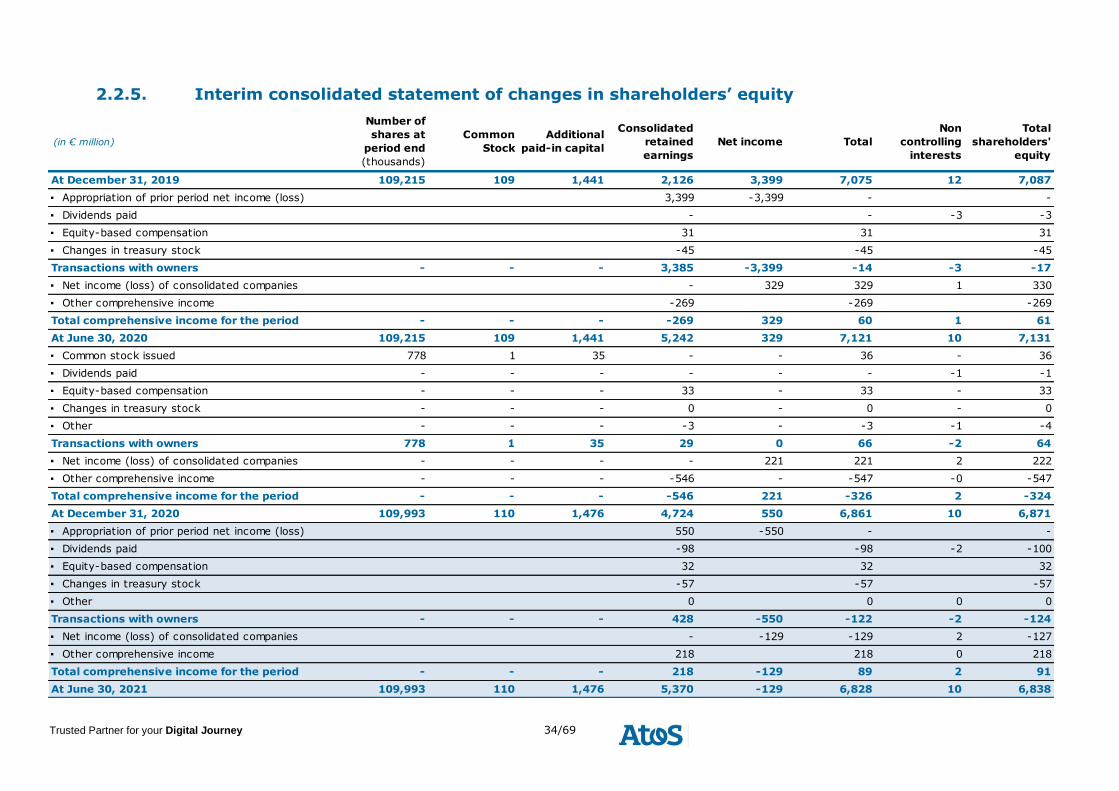
34/69 Trusted Partner for your Digital Journey
2.2.5. Interim consolidated statement of changes in shareholders’ equity
(in € million)
Number of
shares at
period end
(thousands)
Common
Stock
Additional
paid-in capital
Consolidated
retained
earnings
Net income Total
Non
controlling
interests
Total
shareholders'
equity
At December 31, 2019 109,215 109 1,441 2,126 3,399 7,075 12 7,087
▪ Appropriation of prior period net income (loss) 3,399 -3,399 - -
▪ Dividends paid - - -3 -3
▪ Equity-based compensation 31 31 31
▪ Changes in treasury stock -45 -45 -45
Transactions with owners - - - 3,385 -3,399 -14 -3 -17
▪ Net income (loss) of consolidated companies - 329 329 1 330
▪ Other comprehensive income -269 -269 -269
Total comprehensive income for the period - - - -269 329 60 1 61
At June 30, 2020 109,215 109 1,441 5,242 329 7,121 10 7,131
▪ Common stock issued 778 1 35 - - 36 - 36
▪ Dividends paid - - - - - - -1 -1
▪ Equity-based compensation - - - 33 - 33 - 33
▪ Changes in treasury stock - - - 0 - 0 - 0
▪ Other - - - -3 - -3 -1 -4
Transactions with owners 778 1 35 29 0 66 -2 64
▪ Net income (loss) of consolidated companies - - - - 221 221 2 222
▪ Other comprehensive income - - - -546 - -547 -0 -547
Total comprehensive income for the period - - - -546 221 -326 2 -324
At December 31, 2020 109,993 110 1,476 4,724 550 6,861 10 6,871
▪ Appropriation of prior period net income (loss) 550 -550 - -
▪ Dividends paid -98 -98 -2 -100
▪ Equity-based compensation 32 32 32
▪ Changes in treasury stock -57 -57 -57
▪ Other 0 0 0 0
Transactions with owners - - - 428 -550 -122 -2 -124
▪ Net income (loss) of consolidated companies - -129 -129 2 -127
▪ Other comprehensive income 218 218 0 218
Total comprehensive income for the period - - - 218 -129 89 2 91
At June 30, 2021 109,993 110 1,476 5,370 -129 6,828 10 6,838
35/69 Trusted Partner for your Digital Journey
2.2.6. Notes to the interim condensed consolidated financial
statements
These interim condensed consolidated financial statements were approved by the Board of Directors on July
27, 2021.
2.2.6.1. Basis of preparation
All amounts are presented in millions of euros unless otherwise indicated. Certain totals may have rounding
differences.
Basis of preparation
Atos (“the Group”) interim condensed consolidated financial statements for the six months period ended
June 30, 2021, have been prepared in accordance with the applicable international accounting standards, as
endorsed by the European Union and of mandatory application as at January 1, 2021.
The international standards comprise the International Financial Reporting Standards (IFRS) as issued by
the International Accounting Standards Board (IASB), the International Accounting Standards (IAS), the
interpretations of the Standing Interpretations Committee (SIC) and the International Financial Reporting
Interpretations Committee (IFRIC).
The Group interim condensed consolidated financial statements for the six months period ended June 30,
2021, have been prepared in accordance with IAS 34 - Interim Financial Reporting.
This standard provides that interim condensed financial statements do not include all the information
required under IFRS for the preparation of annual consolidated financial statements. These interim
condensed consolidated financial statements must therefore be read in conjunction with the Group’s
consolidated financial statements as at and for the year ended December 31, 2020. However selected
explanatory notes are included to explain events and transactions that are significant to understand of the
changes in the Group’s financial position and performance since the latest annual consolidated financial
statements.
The accounting policies and measurement methods used to prepare these interim condensed consolidated
financial statements are identical to those applied by the Group at December 31, 2020 and described in the
notes to the consolidated financial statements for the year ended December 2020, except:
• new standards and interpretations mandatorily applicable presented in the paragraph below;
• the specific measurement methods of IAS 34 presented in the paragraph below.
New standards and interpretations applicable from January 1, 2021
The following new standards, interpretations or amendments whose application was mandatory for the
Group for the fiscal year beginning January 1, 2021 had no material impact on the interim condensed
consolidated financial statements:
• Amendments to IFRS 9, IAS 39, IFRS 7 and IFRS 16 – Interest Rate Benchmark Reform (Phase 2).
Other standards
The Group has not early adopted any other standard, interpretation or amendment applicable to financial
years starting after January 1, 2021, regardless of whether they were adopted by the European Union.
The potential impacts of these new pronouncements are currently being analyzed.
Accounting estimates and judgments
The preparation of interim condensed consolidated financial statements requires management to make
judgments, estimates and assumptions that affect the reported amounts of assets and liabilities, income and
expense in the financial statements and disclosures of contingent assets and liabilities at the closing date.
Material judgments made by the management on accounting principles applied, as well as the main sources
of uncertainty related to the estimates used to elaborate the interim condensed consolidated financial
statements remain identical to those described in the latest annual report, except the specific measurement
methods of IAS 34 regarding estimate of income tax expense (as described in Note 7), goodwill valuations
(as described in Note 8) and pension plans and other long-term benefits valuations (as described in Note 9).
36/69 Trusted Partner for your Digital Journey
2.2.6.2. Impact of the pandemic crisis on the interim condensed
consolidated financial statements
As of the date of issue of the interim condensed consolidated financial statements, unforeseen events
related to the pandemic have not led to any contract termination, dispute with customers or suppliers, or
material concessions made by Atos.
The events linked to Covid-19 led the Group to take into consideration the current market conditions in the
judgments made and assumptions taken when preparing these interim condensed consolidated financial
statements
Estimates on long-term contracts have been reviewed taking into consideration potential loss-making
situations or risks of recoverability on contract assets and contract costs. The expected credit loss valuation
has also been reviewed to consider potential increased bankruptcy risk of customers.
In accordance with recommendations from European and French regulators, the Group has elected to
maintain effects of the pandemic crisis as part of the operating margin and to not present them as part of
Other operating income and expense.
2.2.6.3. Alternative Performance measures
The alternative performance measures monitored by the Group are identical to those monitored by the
Group at December 31, 2020 and described in the notes to the consolidated financial statements for the
year ended December 2020.
37/69 Trusted Partner for your Digital Journey
2.2.6.4. Notes to the interim condensed consolidated financial
statements
Note 1 – Changes in the scope of consolidation 38
Note 2 – Segment information 39
Note 3 – Revenue, trade receivables, contract assets and contract costs 41
Note 4 – Operating items 41
Note 5 – Other operating income and expenses 43
Note 6 – Financial assets, liabilities and financial result 45
Note 7 – Income tax 48
Note 8 – Goodwill 48
Note 9 – Pensions plans and other long-term benefits 49
Note 10 – Provisions 50
Note 11 - Shareholders’ equity 50
Note 12 – Litigations 51
Note 13 – Subsequent events 51
38/69 Trusted Partner for your Digital Journey
Note 1 Changes in the scope of consolidation
Acquisition of Motiv
On February 15, 2021, Atos acquired Motiv ICT Security, the largest independent Managed Security Services
(MSS) provider in the Netherlands.
This acquistion reinforces Atos’s position as the third worldwide Managed Security Services provider by
strengthening the Group’s local capabilities and bringing its recent investment in the Managed Detection and
Response (MDR) platform, AIsaac, to Dutch customers. In addition, Motiv’s sovereign Security Operations
Center (SOC), independently certified at the highest levels of maturity, further expands Atos’ extensive
network of global SOCs, a pivotal component of the Atos Prescriptive Security approach. Motiv is mainly
reported in the RBU Northern Europe.
The consideration transferred was € 63 million leading to the recognition of a preliminary goodwill of € 51
million.
Had the acquisition of Motiv ICT Security occurred on January 1, 2021, the six-month revenue and operating
margin for 2021 would have been € 19 million and € 1 million, respectively.
Other acquisitions
Other acquisitions completed during the first half of 2021 included:
In Fidem
On January 19, 2021, Atos acquired In Fidem, a Canada-based specialized cybersecurity consulting firm,
with expertise in cloud security, digital identity, risk management, security operations, digital forensics and
cyber breach response. In Fidem is reported in the RBU North America.
Profit4SF
On February 17, 2021, Atos acquired Profit4SF, a Dutch-based technology and management consulting
company specializing in salesforce enterprise implementations for its customers across the Netherlands.
Profit4SF is reported in the RBU Northern Europe.
Ipsotek
On May 28, 2021, Atos acquired Ipsotek, a leading AI enhanced video analytics software provider. Ipsotek is
reported in the RBU Northern Europe.
Processia
On June 1, 2021, Atos acquired Processia, a Product Lifecycle Management (PLM) system integrator and
Dassault Systèmes Global Service Partner. Processia is reported in the RBU North America.
Total consideration transferred for these acquisitions was € 97 million leading to the recognition of a
preliminary goodwill of € 92 million.
Had these acquisitions occurred on January 1, 2021, the six-month revenue and operating margin for 2021
would have been € 23 million and € 4 million, respectively.
39/69 Trusted Partner for your Digital Journey
Note 2 Segment information
According to IFRS 8, reported operating segment profits are based on internal management reporting
information that is regularly reviewed by the chief operating decision maker, and is reconciled to Group
profit or loss. The chief operating decision maker assesses segments profit or loss using a measure of
operating profit. The chief operating decision maker, who is responsible for allocating resources and
assessing performance of the operating segments, has been identified as the Company CEO who makes
strategic decisions.
The internal management reporting is built around two axes: Regional Business Units (North America,
Northern Europe, Central Europe, Southern Europe and Growing Markets) and Industries (Manufacturing,
Financial Services & Insurance, Public Sector & Defense, Telecom, Media & Technology, Resources &
Services, and Healthcare & Life Sciences). Regional Business Units have been determined by the Group as
key components reviewed by the chief operating decision maker. As a result, and for IFRS 8 requirements,
the Group discloses Regional Business Units as operating segments.
Regional segments (RBU) are made of the following countries:
North America
Manufacturing, Financial Services & Insurance, Public Sector & Defense, Telecom, Media &
Technology, Resources & Services, in addition to Healthcare & Life Sciences in Canada, Guatemala,
Mexico and the United States of America.
Northern Europe
Manufacturing, Financial Services & Insurance, Public Sector & Defense, Telecom, Media &
Technology, Resources & Services, in addition to Healthcare & Life Sciences in Belarus, Belgium,
Denmark, Estonia, Finland, Ireland, Lithuania, Luxembourg, Poland, Russia, Sweden, The
Netherlands and the United Kingdom.
Central Europe
Manufacturing, Financial Services & Insurance, Public Sector & Defense, Telecom, Media &
Technology, Resources & Services, in addition to Healthcare & Life Sciences in Austria, Bosnia and
Herzegovina, Bulgaria, Croatia, Czech Republic, Germany, Greece, Hungary, Israel, Romania,
Serbia, Slovakia, Slovenia, Switzerland.
Southern Europe
Manufacturing, Financial Services & Insurance, Public Sector & Defense, Telecom, Media &
Technology, Resources & Services, in addition to Healthcare & Life Sciences in Andorra, France,
Italy, Morocco offshore delivery Center, Portugal and Spain.
Growing markets
Manufacturing, Financial Services & Insurance, Public Sector & Defense, Telecom, Media &
Technology, Resources & Services, in addition to Healthcare & Life Sciences in AbuDhabi, Algeria,
Argentina, Australia, Brazil, Chile, China, Colombia, Egypt, Gabon, Hong-Kong, India, Ivory
Coast, Japan, Lebanon, Malaysia, Madagascar, Mauritius, Morocco, Namibia, New-Zealand,
Peru, Philippines, Qatar, Saudi-Arabia, Senegal, Singapore, South-Africa, South Korea,
Taiwan, Thailand, Tunisia, Turkey, UAE, Uruguay and also Major Events activities, Global Delivery
Centers.
Operating segments
All Industries are represented in each RBU.
Inter-segment transfers or transactions are entered into under the normal commercial terms and conditions
that would also be available to unrelated third parties. The revenue from each external contract amounted
to less than 10% of the Group’s revenue.
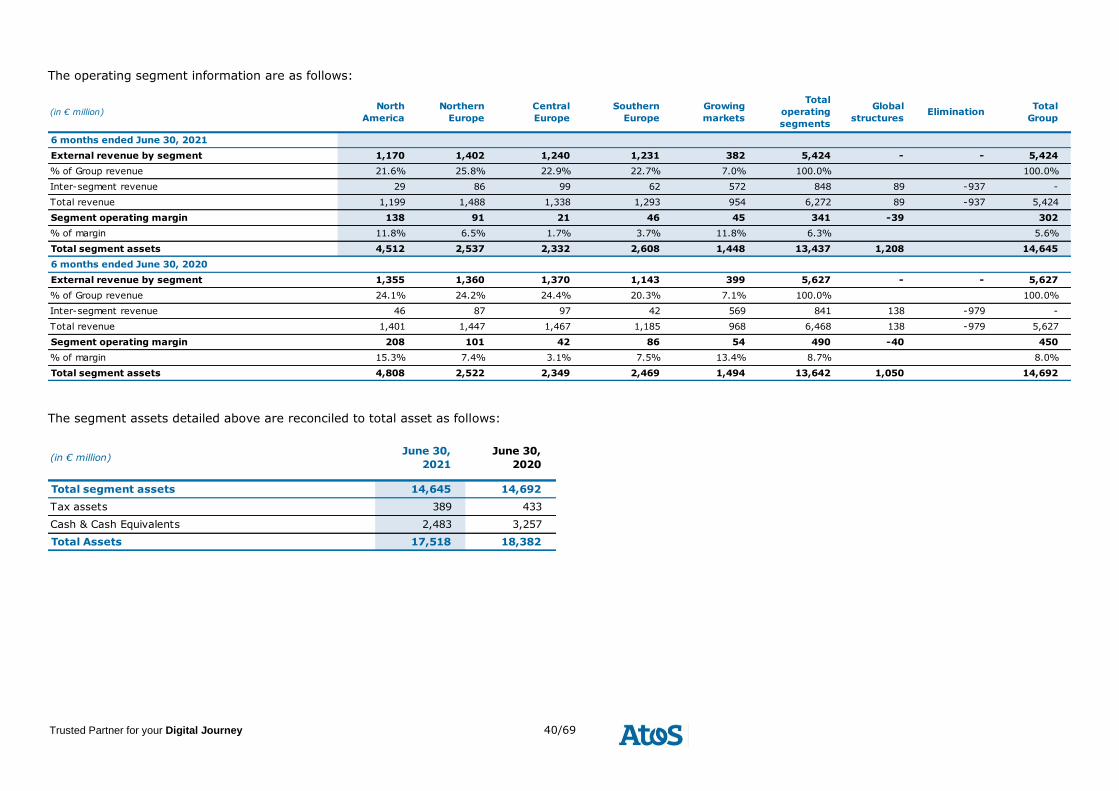
40/69 Trusted Partner for your Digital Journey
The operating segment information are as follows:
(in € million)North
America
Northern
Europe
Central
Europe
Southern
Europe
Growing
markets
Total
operating
segments
Global
structures Elimination
Total
Group
6 months ended June 30, 2021
External revenue by segment 1,170 1,402 1,240 1,231 382 5,424 - - 5,424
% of Group revenue 21.6% 25.8% 22.9% 22.7% 7.0% 100.0% 100.0%
Inter-segment revenue 29 86 99 62 572 848 89 -937 -
Total revenue 1,199 1,488 1,338 1,293 954 6,272 89 -937 5,424
Segment operating margin 138 91 21 46 45 341 -39 302
% of margin 11.8% 6.5% 1.7% 3.7% 11.8% 6.3% 5.6%
Total segment assets 4,512 2,537 2,332 2,608 1,448 13,437 1,208 14,645
6 months ended June 30, 2020
External revenue by segment 1,355 1,360 1,370 1,143 399 5,627 - - 5,627
% of Group revenue 24.1% 24.2% 24.4% 20.3% 7.1% 100.0% 100.0%
Inter-segment revenue 46 87 97 42 569 841 138 -979 -
Total revenue 1,401 1,447 1,467 1,185 968 6,468 138 -979 5,627
Segment operating margin 208 101 42 86 54 490 -40 450
% of margin 15.3% 7.4% 3.1% 7.5% 13.4% 8.7% 8.0%
Total segment assets 4,808 2,522 2,349 2,469 1,494 13,642 1,050 14,692
The segment assets detailed above are reconciled to total asset as follows:
(in € million)June 30,
2021
June 30,
2020
Total segment assets 14,645 14,692
Tax assets 389 433
Cash & Cash Equivalents 2,483 3,257
Total Assets 17,518 18,382

41/69 Trusted Partner for your Digital Journey
Note 3 Revenue, trade receivables, contract assets and contract costs
3.1 – Disaggregation of revenue from contracts with customers
The Group revenue can be broken down by Industry as follows:
(in € million)Manufac-
turing
Financial
Services &
Insurance
Public Sector
& Defense
Telecom,
Media &
Technology
Ressources &
Services
Healthcare &
Life Sciences
Total
Group
6 months ended June 30, 2021
External revenue by Industry 980 1,095 1,190 748 778 633 5,424
% of Group revenue 18.1% 20.2% 21.9% 13.8% 14.3% 11.7% 100.0%
6 months ended June 30, 2020
External revenue by Industry 1,037 1,077 1,216 836 804 657 5,627
% of Group revenue 18.4% 19.1% 21.6% 14.9% 14.3% 11.7% 100.0%
3.2 – Trade accounts and notes receivables, and contract liabilities
(in € million)June 30,
2021
December 31,
2020
Contract assets 1,729 1,686
Trade receivables 1,257 1,140
Contract costs 144 130
Expected credit loss allowance -140 -109
Trade accounts and notes receivable 2,991 2,847
Contract liabilities -812 -773
Net accounts receivable 2,179 2,074
Number of days’ sales outstanding (DSO) 54 46
Contract assets, net of contract liabilities were stable compared to the positions at the end of December
2020. The DSO ratio increased from 46 days to 54 days at June 30, 2021.
As of June 30, 2021, € 820 million of trade receivables were transferred to third parties with conditions of
the transfers meeting IFRS 9 requirements, meaning transfer of contractual cash flows and transfer of
substantially all risks and rewards are achieved (€ 878 million at the end of December 31, 2020). Those
trade receivables were therefore derecognized in the statement of financial position as of June 30, 2021.
The € 820 million included € 73 million in the US where Atos only sells 95% of the right to cash flows and
then derecognizes 95% of the receivables.
Note 4 Operating items
4.1 – Personnel expenses
(in € million)6 months ended
June 30, 2021
%
Revenue
6 months ended
June 30, 2020
%
Revenue
Wages and salaries -2,075 38.3% -2,128 37.8%
Social security charges -487 9.0% -501 8.9%
Tax, training, profit-sharing -35 0.6% -33 0.6%
Net (charge)/release to provisions for staff expenses 2 0.0% 1 0.0%
Net (charge)/release of pension provisions 16 -0.3% 39 -0.7%
TOTAL -2,579 -47.5% -2,623 46.6%
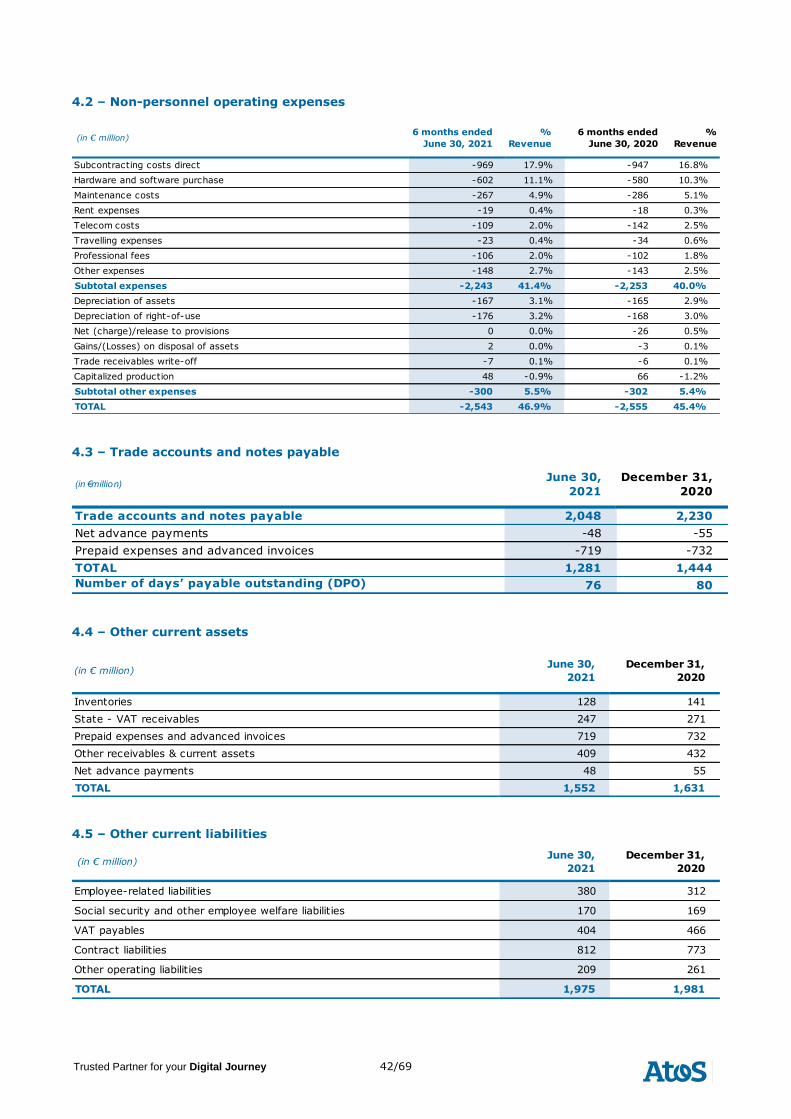
42/69 Trusted Partner for your Digital Journey
4.2 – Non-personnel operating expenses
(in € million)6 months ended
June 30, 2021
%
Revenue
6 months ended
June 30, 2020
%
Revenue
Subcontracting costs direct -969 17.9% -947 16.8%
Hardware and software purchase -602 11.1% -580 10.3%
Maintenance costs -267 4.9% -286 5.1%
Rent expenses -19 0.4% -18 0.3%
Telecom costs -109 2.0% -142 2.5%
Travelling expenses -23 0.4% -34 0.6%
Professional fees -106 2.0% -102 1.8%
Other expenses -148 2.7% -143 2.5%
Subtotal expenses -2,243 41.4% -2,253 40.0%
Depreciation of assets -167 3.1% -165 2.9%
Depreciation of right-of-use -176 3.2% -168 3.0%
Net (charge)/release to provisions 0 0.0% -26 0.5%
Gains/(Losses) on disposal of assets 2 0.0% -3 0.1%
Trade receivables write-off -7 0.1% -6 0.1%
Capitalized production 48 -0.9% 66 -1.2%
Subtotal other expenses -300 5.5% -302 5.4%
TOTAL -2,543 46.9% -2,555 45.4%
4.3 – Trade accounts and notes payable
(in € million)June 30,
2021
December 31,
2020
Trade accounts and notes payable 2,048 2,230
Net advance payments -48 -55
Prepaid expenses and advanced invoices -719 -732
TOTAL 1,281 1,444
Number of days’ payable outstanding (DPO) 76 80
4.4 – Other current assets
(in € million)June 30,
2021
December 31,
2020
Inventories 128 141
State - VAT receivables 247 271
Prepaid expenses and advanced invoices 719 732
Other receivables & current assets 409 432
Net advance payments 48 55
TOTAL 1,552 1,631
4.5 – Other current liabilities
(in € million)June 30,
2021
December 31,
2020
Employee-related liabilities 380 312
Social security and other employee welfare liabilities 170 169
VAT payables 404 466
Contract liabilities 812 773
Other operating liabilities 209 261
TOTAL 1,975 1,981
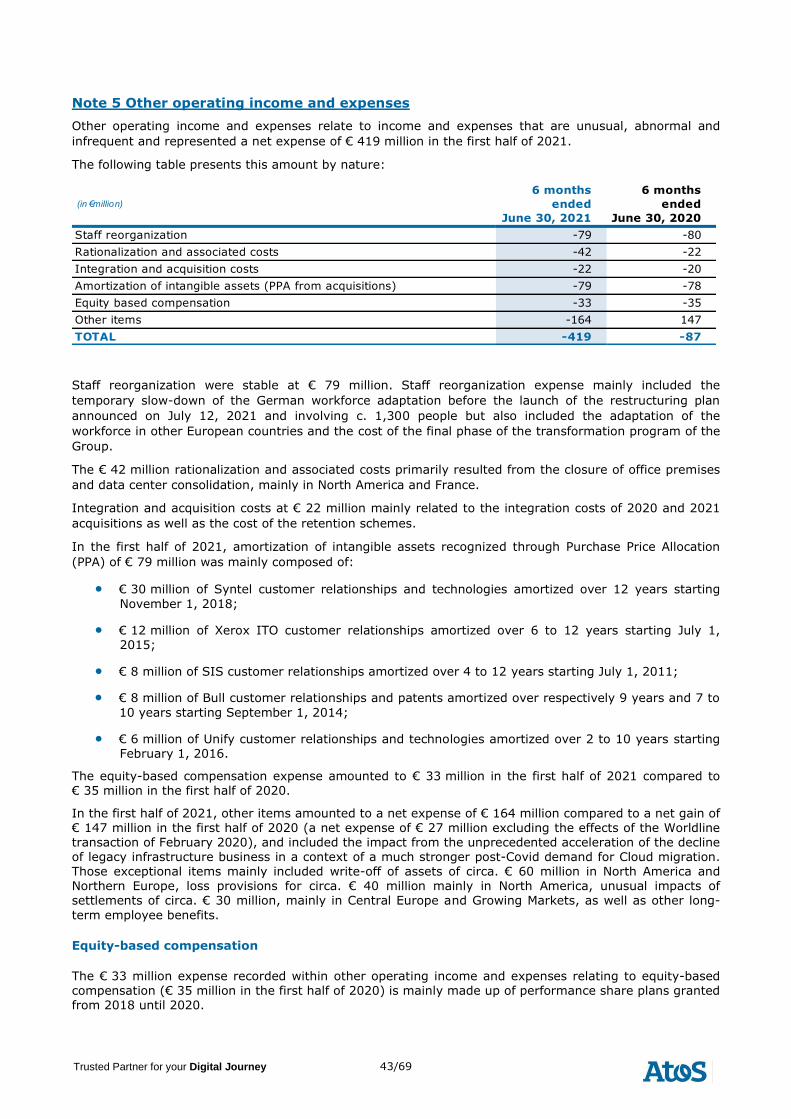
43/69 Trusted Partner for your Digital Journey
Note 5 Other operating income and expenses
Other operating income and expenses relate to income and expenses that are unusual, abnormal and
infrequent and represented a net expense of € 419 million in the first half of 2021.
The following table presents this amount by nature:
(in € million)
6 months
ended
June 30, 2021
6 months
ended
June 30, 2020
Staff reorganization -79 -80
Rationalization and associated costs -42 -22
Integration and acquisition costs -22 -20
Amortization of intangible assets (PPA from acquisitions) -79 -78
Equity based compensation -33 -35
Other items -164 147
TOTAL -419 -87
Staff reorganization were stable at € 79 million. Staff reorganization expense mainly included the
temporary slow-down of the German workforce adaptation before the launch of the restructuring plan
announced on July 12, 2021 and involving c. 1,300 people but also included the adaptation of the
workforce in other European countries and the cost of the final phase of the transformation program of the
Group.
The € 42 million rationalization and associated costs primarily resulted from the closure of office premises
and data center consolidation, mainly in North America and France.
Integration and acquisition costs at € 22 million mainly related to the integration costs of 2020 and 2021
acquisitions as well as the cost of the retention schemes.
In the first half of 2021, amortization of intangible assets recognized through Purchase Price Allocation
(PPA) of € 79 million was mainly composed of:
• € 30 million of Syntel customer relationships and technologies amortized over 12 years starting
November 1, 2018;
• € 12 million of Xerox ITO customer relationships amortized over 6 to 12 years starting July 1, 2015;
• € 8 million of SIS customer relationships amortized over 4 to 12 years starting July 1, 2011;
• € 8 million of Bull customer relationships and patents amortized over respectively 9 years and 7 to
10 years starting September 1, 2014;
• € 6 million of Unify customer relationships and technologies amortized over 2 to 10 years starting February 1, 2016.
The equity-based compensation expense amounted to € 33 million in the first half of 2021 compared to € 35 million in the first half of 2020.
In the first half of 2021, other items amounted to a net expense of € 164 million compared to a net gain of € 147 million in the first half of 2020 (a net expense of € 27 million excluding the effects of the Worldline transaction of February 2020), and included the impact from the unprecedented acceleration of the decline of legacy infrastructure business in a context of a much stronger post-Covid demand for Cloud migration. Those exceptional items mainly included write-off of assets of circa. € 60 million in North America and Northern Europe, loss provisions for circa. € 40 million mainly in North America, unusual impacts of settlements of circa. € 30 million, mainly in Central Europe and Growing Markets, as well as other long-
term employee benefits.
Equity-based compensation
The € 33 million expense recorded within other operating income and expenses relating to equity-based compensation (€ 35 million in the first half of 2020) is mainly made up of performance share plans granted from 2018 until 2020.

44/69 Trusted Partner for your Digital Journey
The equity-based compensation plans are detailed by year and by nature as follows:
(in € million)6 months ended
June 30, 2021
6 months ended
June 30, 2020
By years :
Plans 2020 15 7
Plans 2019 10 7
Plans 2018 7 7
Plans 2017 - 13
Plans 2016 - -
Plans 2015 - 1
Total 33 35
By category of plans :
Performance share plans 33 33
Stock option plan 0 0
Employee share purchase plan - 2
Total 33 35
Performance share plans
Main plans presented in “other operating income and expenses” during the semester was the following:
Atos
Grant Date July 24, 2020
Number of shares granted 870 630
Share price at grant date (€) 75.00
Vesting date July 24, 2023
Expected life (years) 3
Expected dividend yield (%) 2.07%
Fair value of the instrument (€) 68.74
112021 expense recognized (in € million)
Atos Atos
Grant Date October 23, 2019 July 24, 2019
Number of shares granted 12 000 907 500
Share price at grant date (€) 63.60 69.75
Vesting date October 23, 2022 July 24, 2022
Expected life (years) 3 3
Expected dividend yield (%) 2.07% 2.07%
Fair value of the instrument (€) 59.77 65.55
0 102021 expense recognized (in € million)
Atos AtosGrant Date March 27, 2018 July 22, 2018
Number of shares granted 8 550 891 175
Share price at grant date (€) 90.0 90.0
Vesting date March 27, 2021 July 30, 2021
Expected life (years) 3 3
Expected dividend yield (%) 1.20% 1.20%
Fair value of the instrument (€) 87.08 87.08
0 62021 expense recognized (in € million)
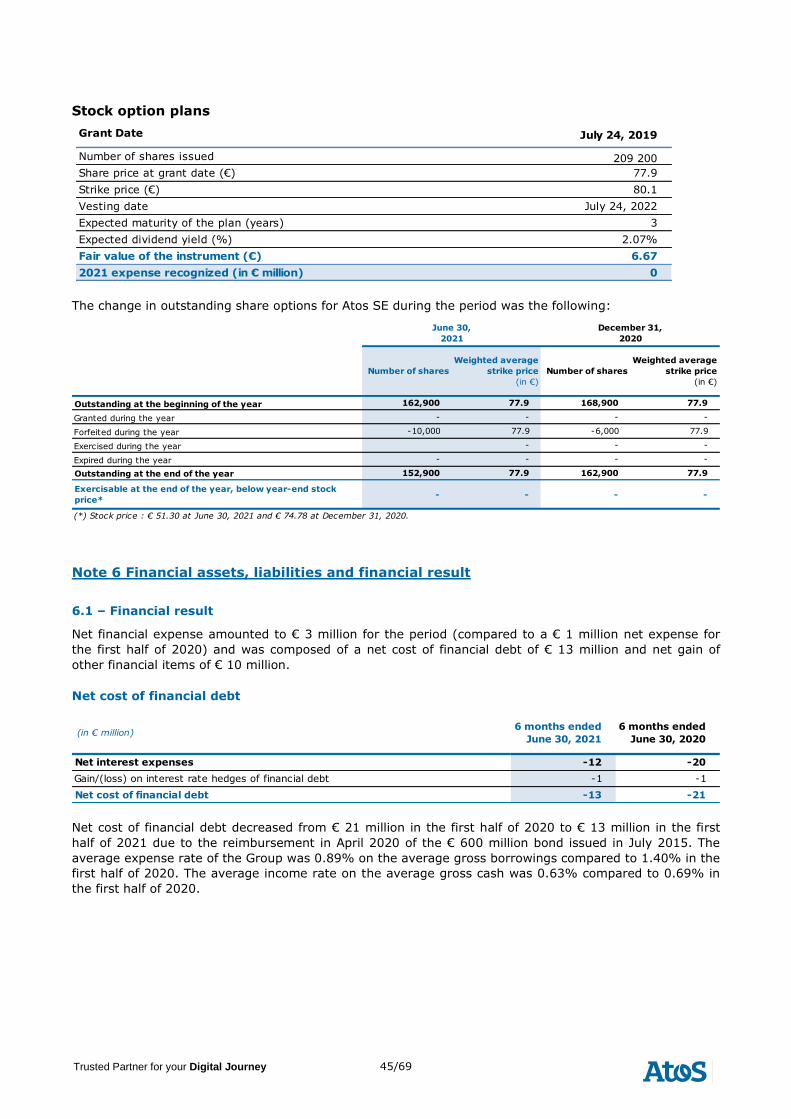
45/69 Trusted Partner for your Digital Journey
Stock option plans
Grant Date July 24, 2019
Number of shares issued 209 200
Share price at grant date (€) 77.9
Strike price (€) 80.1
Vesting date July 24, 2022
Expected maturity of the plan (years) 3
Expected dividend yield (%) 2.07%
Fair value of the instrument (€) 6.67
02021 expense recognized (in € million)
The change in outstanding share options for Atos SE during the period was the following:
Number of shares
Weighted average
strike price
(in €)
Number of shares
Weighted average
strike price
(in €)
Outstanding at the beginning of the year 162,900 77.9 168,900 77.9
Granted during the year - - - -
Forfeited during the year -10,000 77.9 -6,000 77.9
Exercised during the year - - -
Expired during the year - - - -
Outstanding at the end of the year 152,900 77.9 162,900 77.9
Exercisable at the end of the year, below year-end stock
price*- - - -
June 30,
2021
December 31,
2020
(*) Stock price : € 51.30 at June 30, 2021 and € 74.78 at December 31, 2020.
Note 6 Financial assets, liabilities and financial result
6.1 – Financial result
Net financial expense amounted to € 3 million for the period (compared to a € 1 million net expense for
the first half of 2020) and was composed of a net cost of financial debt of € 13 million and net gain of
other financial items of € 10 million.
Net cost of financial debt
(in € million)6 months ended
June 30, 2021
6 months ended
June 30, 2020
Net interest expenses -12 -20
Gain/(loss) on interest rate hedges of financial debt -1 -1
Net cost of financial debt -13 -21
Net cost of financial debt decreased from € 21 million in the first half of 2020 to € 13 million in the first
half of 2021 due to the reimbursement in April 2020 of the € 600 million bond issued in July 2015. The
average expense rate of the Group was 0.89% on the average gross borrowings compared to 1.40% in the
first half of 2020. The average income rate on the average gross cash was 0.63% compared to 0.69% in
the first half of 2020.
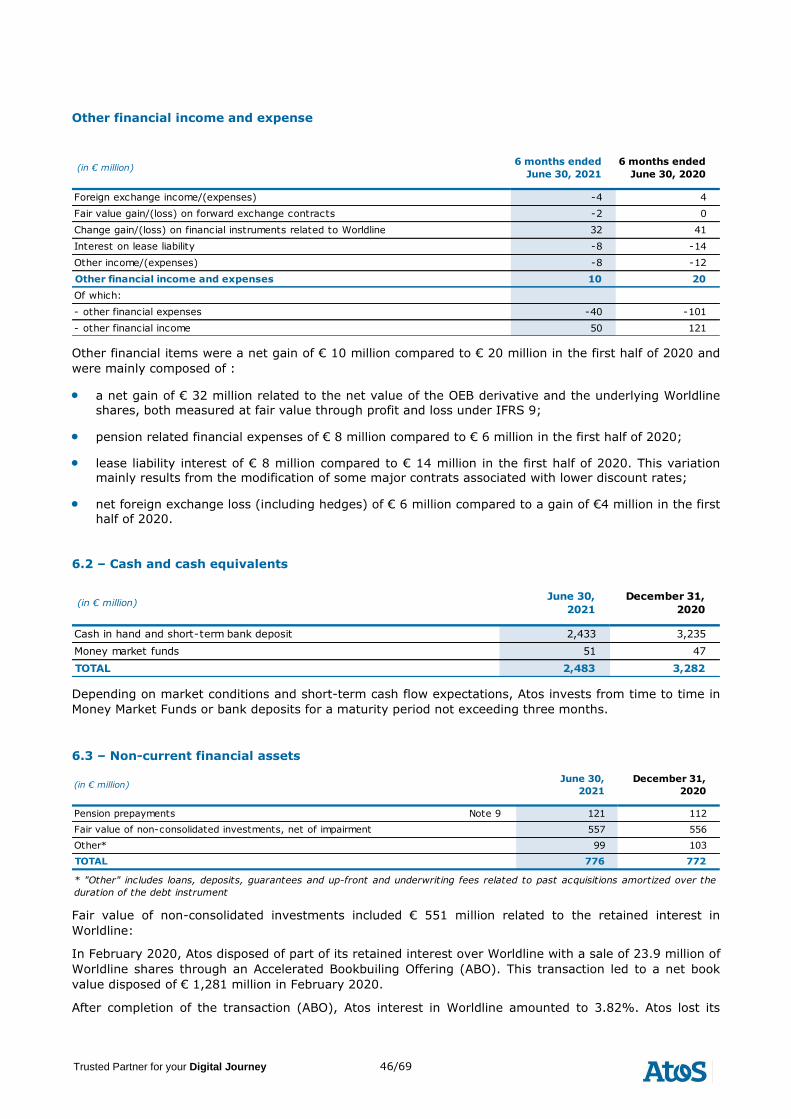
46/69 Trusted Partner for your Digital Journey
Other financial income and expense
(in € million)6 months ended
June 30, 2021
6 months ended
June 30, 2020
Foreign exchange income/(expenses) -4 4
Fair value gain/(loss) on forward exchange contracts -2 0
Change gain/(loss) on financial instruments related to Worldline 32 41
Interest on lease liability -8 -14
Other income/(expenses) -8 -12
Other financial income and expenses 10 20
Of which:
- other financial expenses -40 -101
- other financial income 50 121
Other financial items were a net gain of € 10 million compared to € 20 million in the first half of 2020 and
were mainly composed of :
• a net gain of € 32 million related to the net value of the OEB derivative and the underlying Worldline
shares, both measured at fair value through profit and loss under IFRS 9;
• pension related financial expenses of € 8 million compared to € 6 million in the first half of 2020;
• lease liability interest of € 8 million compared to € 14 million in the first half of 2020. This variation mainly results from the modification of some major contrats associated with lower discount rates;
• net foreign exchange loss (including hedges) of € 6 million compared to a gain of €4 million in the first
half of 2020.
6.2 – Cash and cash equivalents
(in € million)June 30,
2021
December 31,
2020
Cash in hand and short-term bank deposit 2,433 3,235
Money market funds 51 47
TOTAL 2,483 3,282
Depending on market conditions and short-term cash flow expectations, Atos invests from time to time in
Money Market Funds or bank deposits for a maturity period not exceeding three months.
6.3 – Non-current financial assets
(in € million)June 30,
2021
December 31,
2020
Pension prepayments Note 9 121 112
Fair value of non-consolidated investments, net of impairment 557 556
Other* 99 103
TOTAL 776 772
* "Other" includes loans, deposits, guarantees and up-front and underwriting fees related to past acquisitions amortized over the
duration of the debt instrument
Fair value of non-consolidated investments included € 551 million related to the retained interest in
Worldline:
In February 2020, Atos disposed of part of its retained interest over Worldline with a sale of 23.9 million of
Worldline shares through an Accelerated Bookbuiling Offering (ABO). This transaction led to a net book
value disposed of € 1,281 million in February 2020.
After completion of the transaction (ABO), Atos interest in Worldline amounted to 3.82%. Atos lost its
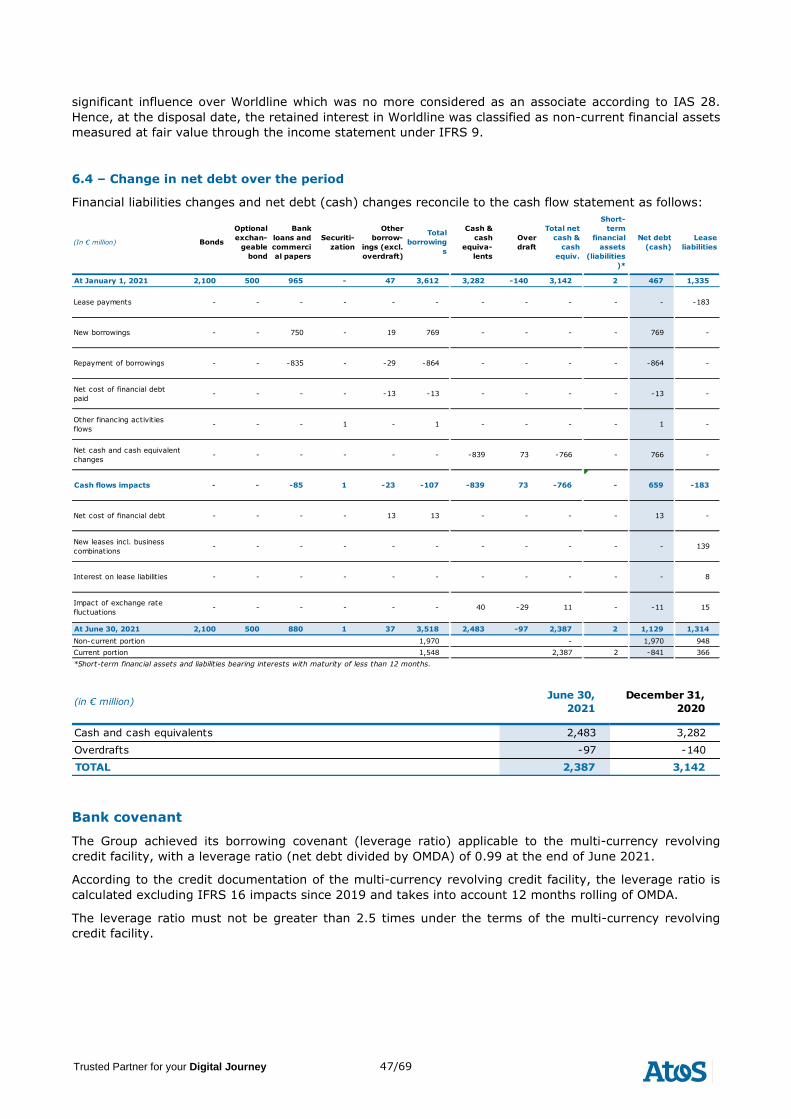
47/69 Trusted Partner for your Digital Journey
significant influence over Worldline which was no more considered as an associate according to IAS 28.
Hence, at the disposal date, the retained interest in Worldline was classified as non-current financial assets
measured at fair value through the income statement under IFRS 9.
6.4 – Change in net debt over the period
Financial liabilities changes and net debt (cash) changes reconcile to the cash flow statement as follows:
(In € million) Bonds
Optional
exchan-
geable
bond
Bank
loans and
commerci
al papers
Securiti-
zation
Other
borrow-
ings (excl.
overdraft)
Total
borrowing
s
Cash &
cash
equiva-
lents
Over
draft
Total net
cash &
cash
equiv.
Short-
term
financial
assets
(liabilities
)*
Net debt
(cash)
Lease
liabilities
At January 1, 2021 2,100 500 965 - 47 3,612 3,282 -140 3,142 2 467 1,335
Lease payments - - - - - - - - - - - -183
New borrowings - - 750 - 19 769 - - - - 769 -
Repayment of borrowings - - -835 - -29 -864 - - - - -864 -
Net cost of financial debt
paid- - - - -13 -13 - - - - -13 -
Other financing activities
flows- - - 1 - 1 - - - - 1 -
Net cash and cash equivalent
changes- - - - - - -839 73 -766 - 766 -
Cash flows impacts - - -85 1 -23 -107 -839 73 -766 - 659 -183
Net cost of financial debt - - - - 13 13 - - - - 13 -
New leases incl. business
combinations- - - - - - - - - - - 139
Interest on lease liabilities - - - - - - - - - - - 8
Impact of exchange rate
fluctuations - - - - - - 40 -29 11 - -11 15
At June 30, 2021 2,100 500 880 1 37 3,518 2,483 -97 2,387 2 1,129 1,314
Non-current portion 1,970 - 1,970 948
Current portion 1,548 2,387 2 -841 366
*Short-term financial assets and liabilities bearing interests with maturity of less than 12 months.
(in € million)June 30,
2021
December 31,
2020
Cash and cash equivalents 2,483 3,282
Overdrafts -97 -140
TOTAL 2,387 3,142
Bank covenant
The Group achieved its borrowing covenant (leverage ratio) applicable to the multi-currency revolving
credit facility, with a leverage ratio (net debt divided by OMDA) of 0.99 at the end of June 2021.
According to the credit documentation of the multi-currency revolving credit facility, the leverage ratio is
calculated excluding IFRS 16 impacts since 2019 and takes into account 12 months rolling of OMDA.
The leverage ratio must not be greater than 2.5 times under the terms of the multi-currency revolving
credit facility.
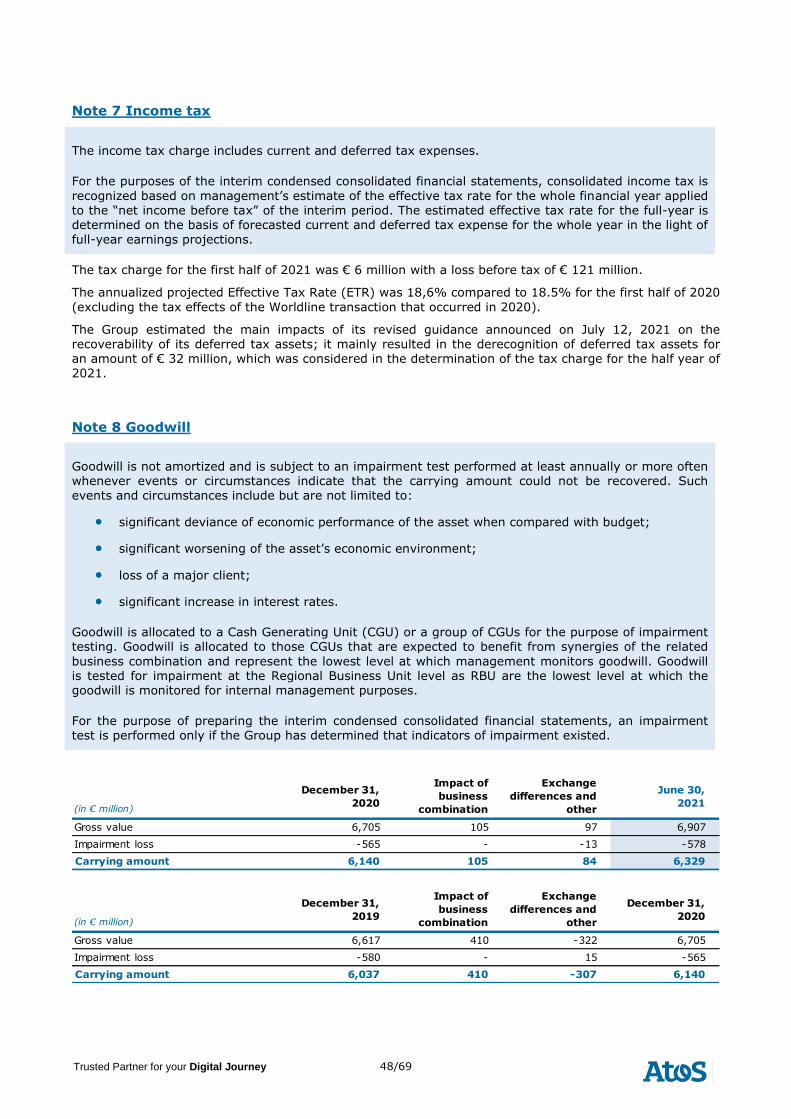
48/69 Trusted Partner for your Digital Journey
Note 7 Income tax
The income tax charge includes current and deferred tax expenses.
For the purposes of the interim condensed consolidated financial statements, consolidated income tax is
recognized based on management’s estimate of the effective tax rate for the whole financial year applied to the “net income before tax” of the interim period. The estimated effective tax rate for the full-year is determined on the basis of forecasted current and deferred tax expense for the whole year in the light of full-year earnings projections.
The tax charge for the first half of 2021 was € 6 million with a loss before tax of € 121 million.
The annualized projected Effective Tax Rate (ETR) was 18,6% compared to 18.5% for the first half of 2020
(excluding the tax effects of the Worldline transaction that occurred in 2020).
The Group estimated the main impacts of its revised guidance announced on July 12, 2021 on the
recoverability of its deferred tax assets; it mainly resulted in the derecognition of deferred tax assets for an amount of € 32 million, which was considered in the determination of the tax charge for the half year of 2021.
Note 8 Goodwill
Goodwill is not amortized and is subject to an impairment test performed at least annually or more often whenever events or circumstances indicate that the carrying amount could not be recovered. Such events and circumstances include but are not limited to:
• significant deviance of economic performance of the asset when compared with budget;
• significant worsening of the asset’s economic environment;
• loss of a major client;
• significant increase in interest rates.
Goodwill is allocated to a Cash Generating Unit (CGU) or a group of CGUs for the purpose of impairment testing. Goodwill is allocated to those CGUs that are expected to benefit from synergies of the related
business combination and represent the lowest level at which management monitors goodwill. Goodwill is tested for impairment at the Regional Business Unit level as RBU are the lowest level at which the goodwill is monitored for internal management purposes.
For the purpose of preparing the interim condensed consolidated financial statements, an impairment test is performed only if the Group has determined that indicators of impairment existed.
(in € million)
December 31,
2020
Impact of
business
combination
Exchange
differences and
other
June 30,
2021
Gross value 6,705 105 97 6,907
Impairment loss -565 - -13 -578
Carrying amount 6,140 105 84 6,329
(in € million)
December 31,
2019
Impact of
business
combination
Exchange
differences and
other
December 31,
2020
Gross value 6,617 410 -322 6,705
Impairment loss -580 - 15 -565
Carrying amount 6,037 410 -307 6,140
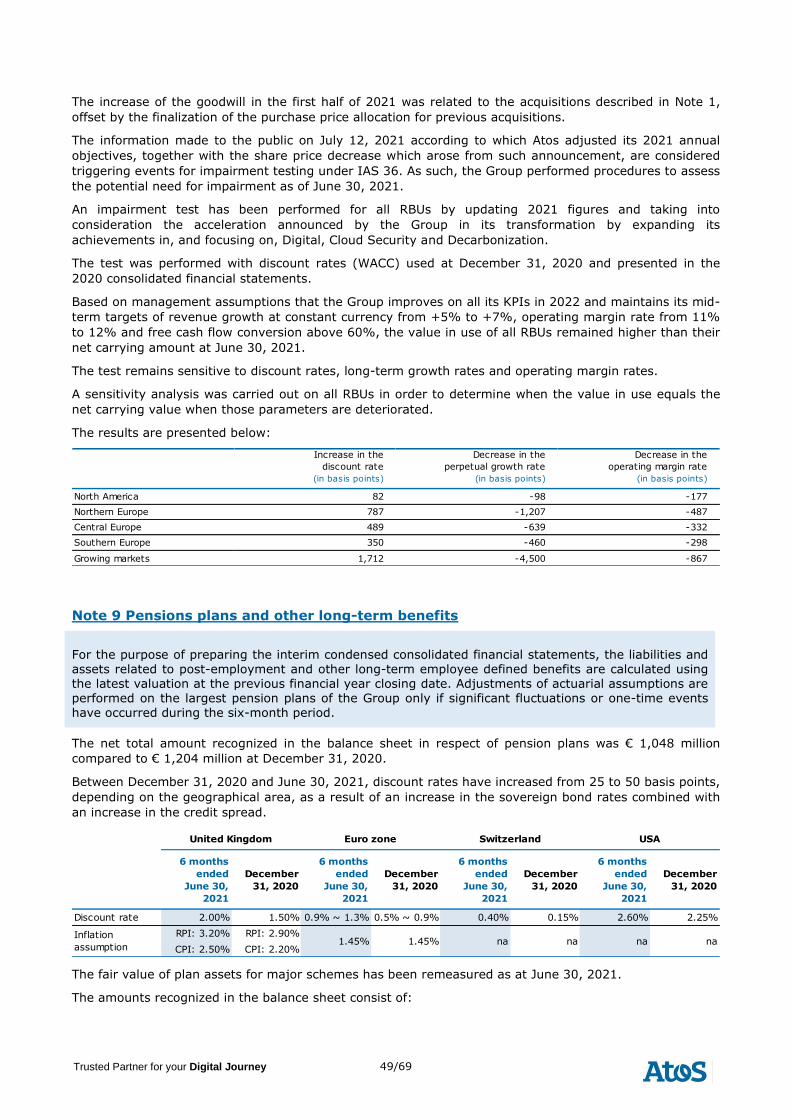
49/69 Trusted Partner for your Digital Journey
The increase of the goodwill in the first half of 2021 was related to the acquisitions described in Note 1,
offset by the finalization of the purchase price allocation for previous acquisitions.
The information made to the public on July 12, 2021 according to which Atos adjusted its 2021 annual
objectives, together with the share price decrease which arose from such announcement, are considered
triggering events for impairment testing under IAS 36. As such, the Group performed procedures to assess
the potential need for impairment as of June 30, 2021.
An impairment test has been performed for all RBUs by updating 2021 figures and taking into
consideration the acceleration announced by the Group in its transformation by expanding its
achievements in, and focusing on, Digital, Cloud Security and Decarbonization.
The test was performed with discount rates (WACC) used at December 31, 2020 and presented in the
2020 consolidated financial statements.
Based on management assumptions that the Group improves on all its KPIs in 2022 and maintains its mid-
term targets of revenue growth at constant currency from +5% to +7%, operating margin rate from 11%
to 12% and free cash flow conversion above 60%, the value in use of all RBUs remained higher than their
net carrying amount at June 30, 2021.
The test remains sensitive to discount rates, long-term growth rates and operating margin rates.
A sensitivity analysis was carried out on all RBUs in order to determine when the value in use equals the
net carrying value when those parameters are deteriorated.
The results are presented below:
Increase in the
discount rate
Decrease in the
perpetual growth rate
Decrease in the
operating margin rate
(in basis points) (in basis points) (in basis points)
North America 82 -98 -177
Northern Europe 787 -1,207 -487
Central Europe 489 -639 -332
Southern Europe 350 -460 -298
Growing markets 1,712 -4,500 -867
Note 9 Pensions plans and other long-term benefits
For the purpose of preparing the interim condensed consolidated financial statements, the liabilities and assets related to post-employment and other long-term employee defined benefits are calculated using the latest valuation at the previous financial year closing date. Adjustments of actuarial assumptions are performed on the largest pension plans of the Group only if significant fluctuations or one-time events have occurred during the six-month period.
The net total amount recognized in the balance sheet in respect of pension plans was € 1,048 million
compared to € 1,204 million at December 31, 2020.
Between December 31, 2020 and June 30, 2021, discount rates have increased from 25 to 50 basis points,
depending on the geographical area, as a result of an increase in the sovereign bond rates combined with
an increase in the credit spread.
6 months
ended
June 30,
2021
December
31, 2020
6 months
ended
June 30,
2021
December
31, 2020
6 months
ended
June 30,
2021
December
31, 2020
6 months
ended
June 30,
2021
December
31, 2020
Discount rate 2.00% 1.50% 0.9% ~ 1.3% 0.5% ~ 0.9% 0.40% 0.15% 2.60% 2.25%
RPI: 3.20% RPI: 2.90%
CPI: 2.50% CPI: 2.20%
USA
na naInflation
assumption
United Kingdom Euro zone
1.45%1.45%
Switzerland
na na
The fair value of plan assets for major schemes has been remeasured as at June 30, 2021.
The amounts recognized in the balance sheet consist of:
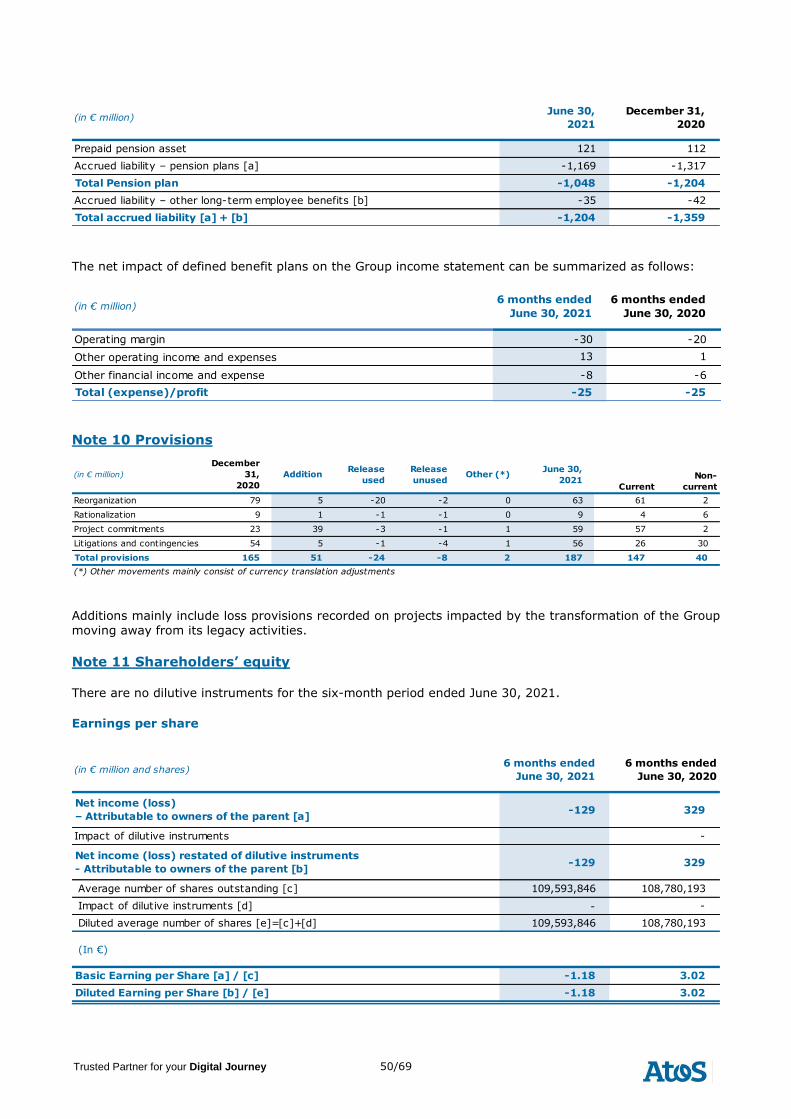
50/69 Trusted Partner for your Digital Journey
(in € million)June 30,
2021
December 31,
2020
Prepaid pension asset 121 112
Accrued liability – pension plans [a] -1,169 -1,317
Total Pension plan -1,048 -1,204
Accrued liability – other long-term employee benefits [b] -35 -42
Total accrued liability [a] + [b] -1,204 -1,359
The net impact of defined benefit plans on the Group income statement can be summarized as follows:
(in € million)6 months ended
June 30, 2021
6 months ended
June 30, 2020
Operating margin -30 -20
Other operating income and expenses 13 1
Other financial income and expense -8 -6
Total (expense)/profit -25 -25
Note 10 Provisions
(in € million)
December
31,
2020
AdditionRelease
used
Release
unusedOther (*)
June 30,
2021Current
Non-
current
Reorganization 79 5 -20 -2 0 63 61 2
Rationalization 9 1 -1 -1 0 9 4 6
Project commitments 23 39 -3 -1 1 59 57 2
Litigations and contingencies 54 5 -1 -4 1 56 26 30
Total provisions 165 51 -24 -8 2 187 147 40
(*) Other movements mainly consist of currency translation adjustments
Additions mainly include loss provisions recorded on projects impacted by the transformation of the Group
moving away from its legacy activities.
Note 11 Shareholders’ equity
There are no dilutive instruments for the six-month period ended June 30, 2021.
Earnings per share
(in € million and shares)6 months ended
June 30, 2021
6 months ended
June 30, 2020
Net income (loss)
– Attributable to owners of the parent [a]-129 329
Impact of dilutive instruments -
Net income (loss) restated of dilutive instruments
- Attributable to owners of the parent [b]-129 329
Average number of shares outstanding [c] 109,593,846 108,780,193
Impact of dilutive instruments [d] - -
Diluted average number of shares [e]=[c]+[d] 109,593,846 108,780,193
(In €)
Basic Earning per Share [a] / [c] -1.18 3.02
Diluted Earning per Share [b] / [e] -1.18 3.02

51/69 Trusted Partner for your Digital Journey
Note 12 Litigations
TriZetto/Cognizant case
In 2015, Syntel initiated a lawsuit against the TriZetto Group and Cognizant Technology Solutions, stating
claims for breach of contract, intentional interference with contractual relations and misappropriation of confidential information. In response to the complaint, TriZetto and Cognizant asserted various counterclaims, including claims against Syntel for copyright infringement and trade secret misappropriation.
On October 27, 2020, a jury in the United States District Court for the Southern District of New York found Syntel, which was acquired by Atos in 2018, liable for trade secret misappropriation and copyright infringement and specified approximately $855 million in damages in favor of Cognizant and TriZetto, of
which $570 million of punitive damages.
On April 20, 2021, the United States District Court for the Southern District of New York granted in part
the post-trial motion filed by Syntel. The Court reduced the jury’s $855 million damages award to $570 million and denied Cognizant and TriZetto’s request for an additional $75 million in pre-judgment interest.
In its decision, the Court held that sufficient evidence existed to support the jury’s verdict of trade secret misappropriation and that the jury’s award of $285 million in compensatory damages was not contrary to
law. However, the Court found that the jury’s $570 million punitive damages award was excessive and should be reduced to $285 million. Trizetto agreed to this reduction. The Court also issued an injunction prohibiting future use by Syntel of the specific trade secrets at issue in the trial.
While the Company supports the Court’s decision to significantly reduce the punitive damages at issue and prevent a further windfall to Cognizant and TriZetto in the form of pre-judgment interest, Syntel appealed the portion of the jury’s verdict affirmed by the Court. Among other concerns, the Company continues to consider the amount of damages grossly out of proportion to the acts complained of, and that the
maximum amount of damages legally available to TriZetto in this case is approximately $8.5 million. The appeal was filed with the U.S. Court of Appeals for the Second Circuit on May 26, 2021.
The appeal process typically takes 18 months or more. No payment of damages will have to be made before the appeal decision but Syntel was required to post a supersedeas bond for approximately the remaining damages amount at the time the appeal was filed.
Note 13 Subsequent events
German infrastructure business restructuring
On July 12, 2021, Atos announced that negotiations with social partners regarding the necessary
turnaround of the German infrastructure business have concluded to a restructuring plan of c. 1,300 people. The plan will be detailed on July 28, 2021.
Except for the above event, there is no significant subsequent event to be mentioned.

52/69 Trusted Partner for your Digital Journey
2.3. Statutory auditors’ Review Report on the
half-yearly financial information for the period
from January 1 to June 30, 2021
This is a free translation into English of the statutory auditors’ review report on the half-yearly financial information issued in French and is provided solely for the convenience of English-speaking users. This report includes information relating to the specific verification of information given in the Group’s half-yearly management report. This report should be read in conjunction with, and construed in accordance with, French law and professional standards applicable in France.
To the Shareholders,
In compliance with the assignment entrusted to us by the General Meetings and in accordance with the
requirements of article L. 451-1-2-III of the French Monetary and Financial Code ("Code monétaire et
financier"), we hereby report to you on:
▪ the review of the accompanying interim condensed consolidated financial statements of Atos S.E.,
for the period from January 1 to June 30, 2021,
▪ the verification of the information presented in the interim management report.
The worldwide crisis linked to the Covid-19 pandemic has created special conditions for the preparation
and limited review of the condensed interim consolidated financial statements. Indeed, this crisis and the
exceptional measures taken in the context of the state of health emergency have had multiple
consequences for companies, particularly on their activity and financing, as well as increased uncertainties
on their future prospects. Some of these measures, such as travel restrictions and remote work, have also
had an impact on the internal organization of companies and on the way in which our work is carried out.
These interim condensed consolidated financial statements were prepared under the responsibility of the
Board of Directors. Our role is to express a conclusion on these financial statements based on our review.
I- Conclusion on the financial statements
We conducted our review in accordance with professional standards applicable in France. A review of
interim financial information consists of making inquiries, primarily of persons responsible for financial and
accounting matters, and applying analytical and other review procedures. A review is substantially less in
scope than an audit conducted in accordance with professional standards applicable in France and
consequently does not enable us to obtain assurance that we would become aware of all significant
matters that might be identified in an audit. Accordingly, we do not express an audit opinion.
Based on our review, nothing has come to our attention that causes us to believe that the accompanying
interim condensed consolidated financial statements are not prepared, in all material respects, in
accordance with IAS 34 - standard of the IFRSs as adopted by the European Union applicable to interim
financial information.
II- Specific verification
We have also verified the information presented in the interim management report on the interim
condensed consolidated financial statements subject to our review.
We have no matters to report as to its fair presentation and consistency with the interim condensed
consolidated financial statements.
53/69 Trusted Partner for your Digital Journey
Paris-La Défense and Neuilly-sur-Seine, July 30, 2021
The Statutory Auditors
French original signed by
Deloitte & Associés
Jean-François Viat
Grant Thornton
Membre français de Grant Thornton International
Virginie Palethorpe
54/69 Trusted Partner for your Digital Journey
3. Person responsible
3.1. Person responsible for the amendment to the
Universal Registration Document
Elie Girard
Chief Executive Officer
3.2. Statement of the person responsible for the
amendment to the Universal Registration
Document
I hereby declare that the information contained in the amendment to the Universal Registration Document,
to the best of my knowledge, in accordance with the facts and contains no omission likely to affect its
import.
I hereby declare that, to the best of my knowledge, the half-year condensed financial statements have
been prepared in accordance with the applicable accounting standards and give a true and fair view of the
assets, liabilities, financial position and results of the Company and all the other companies included in the
scope of consolidation, and that the half-year management report here attached presents a fair picture of
significant events occurring during the first six months of the year, their impact on the financial
statements, the main transactions between related parties as well as a description of the main risks and
uncertainties for the remaining six months of the year.
Bezons, July 30, 2021
Elie Girard
Chief Executive Officer
3.3. For the audit
Appointment and term of offices
Statutory auditors
Grant Thornton - Virginie Palethorpe
Appointed on: October 31, 1990, then renewed in October 24, 1995, on May 30, 2002, on June 12, 2008, on May 17,
2014, and on June 16, 2020
Term of office expires: at the end of the AGM voting on the 2025 financial statements
Deloitte & Associés – Jean-François Viat
Appointed on: December 16, 1993, renewed on February 24, 2000, on May 23, 2006, on May 30, 2012, and on May 23,
2018
Term of office expires: at the end of the AGM voting on the 2023 financial statements
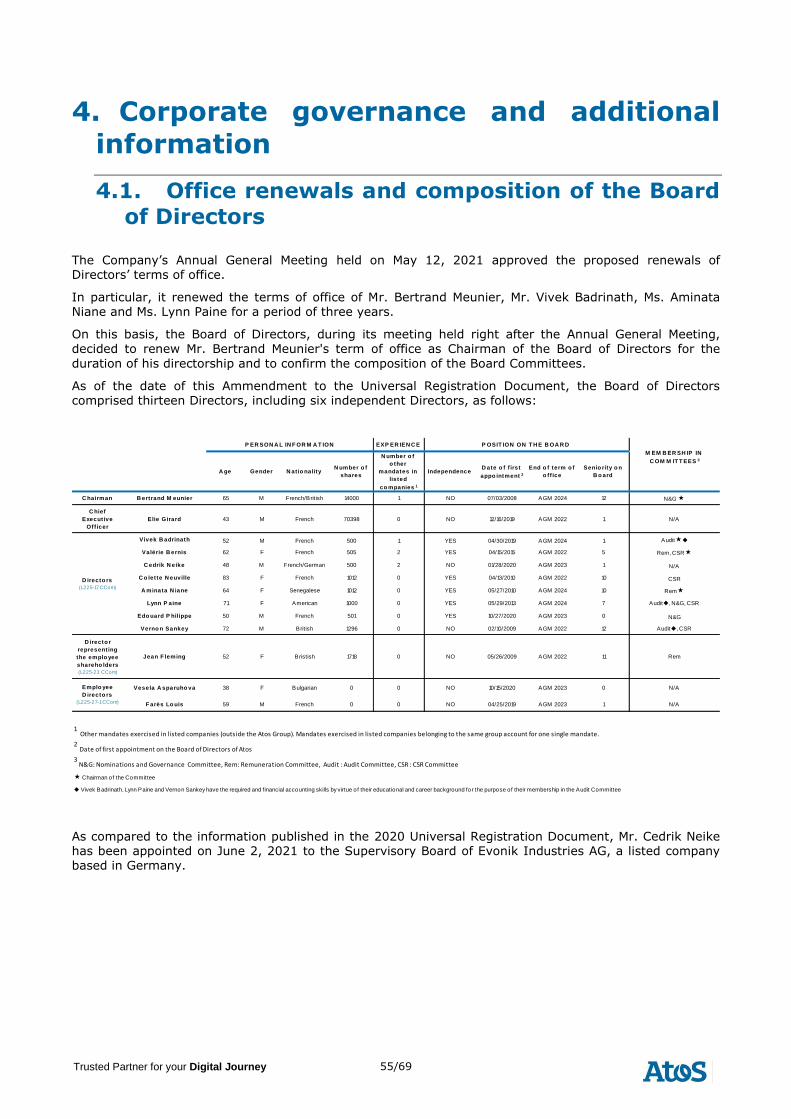
55/69 Trusted Partner for your Digital Journey
4. Corporate governance and additional
information
4.1. Office renewals and composition of the Board
of Directors
The Company’s Annual General Meeting held on May 12, 2021 approved the proposed renewals of Directors’ terms of office.
In particular, it renewed the terms of office of Mr. Bertrand Meunier, Mr. Vivek Badrinath, Ms. Aminata Niane and Ms. Lynn Paine for a period of three years.
On this basis, the Board of Directors, during its meeting held right after the Annual General Meeting,
decided to renew Mr. Bertrand Meunier's term of office as Chairman of the Board of Directors for the
duration of his directorship and to confirm the composition of the Board Committees.
As of the date of this Ammendment to the Universal Registration Document, the Board of Directors comprised thirteen Directors, including six independent Directors, as follows:
EXP ER IEN C E
A ge Gender N atio nalityN umber o f
shares
N umber o f
o ther
mandates in
listed
co mpanies 1
IndependenceD ate o f f irst
appo intment 2
End o f term o f
o ff ice
Senio rity o n
B o ard
C hairman B ertrand M eunier 65 M French/British 14000 1 NO 07/03/2008 AGM 2024 12 N&G
C hief
Executive
Off icer
Elie Girard 43 M French 70398 0 NO 12/16/2019 AGM 2022 1 N/A
Vivek B adrinath 52 M French 500 1 YES 04/30/2019 AGM 2024 1 Auditu
Valérie B ernis 62 F French 505 2 YES 04/15/2015 AGM 2022 5 Rem, CSR
C edrik N eike 48 M French/German 500 2 NO 01/28/2020 AGM 2023 1 N/A
C o lette N euville 83 F French 1012 0 YES 04/13/2010 AGM 2022 10 CSR
A minata N iane 64 F Senegalese 1012 0 YES 05/27/2010 AGM 2024 10 Rem
Lynn P aine 71 F American 1000 0 YES 05/29/2013 AGM 2024 7 Auditu, N&G, CSR
Edo uard P hilippe 50 M French 501 0 YES 10/27/2020 AGM 2023 0 N&G
Verno n Sankey 72 M British 1296 0 NO 02/10/2009 AGM 2022 12 Auditu, CSR
D irecto r
representing
the emplo yee
shareho lders
(L225-23 CCom)
Jean F leming 52 F Bristish 1718 0 NO 05/26/2009 AGM 2022 11 Rem
Vesela A sparuho va 38 F Bulgarian 0 0 NO 10/15/2020 AGM 2023 0 N/A
F arès Lo uis 59 M French 0 0 NO 04/25/2019 AGM 2023 1 N/A
1 Other mandates exercised in listed companies (outside the Atos Group). Mandates exercised in listed companies belonging to the same group account for one single mandate.
2 Date of first appointment on the Board of Directors of Atos
3 N&G: Nominations and Governance Committee, Rem: Remuneration Committee, Audit : Audit Committee, CSR : CSR Committee
Chairman of the Committee
u Vivek Badrinath, Lynn Paine and Vernon Sankey have the required and financial accounting skills by virtue of their educational and career background for the purpose of their membership in the Audit Committee
Emplo yee
D irecto rs
(L225-27-1 CCom)
P ER SON A L IN F OR M A T ION P OSIT ION ON T H E B OA R D
M EM B ER SH IP IN
C OM M IT T EES 3
D irecto rs
(L225-17 CCom)
As compared to the information published in the 2020 Universal Registration Document, Mr. Cedrik Neike has been appointed on June 2, 2021 to the Supervisory Board of Evonik Industries AG, a listed company based in Germany.
56/69 Trusted Partner for your Digital Journey
4.2. Annual General Meeting held on May 12, 2021
The Annual General Meeting held on May 12, 2021 in a closed session with a live video broadcast, due to
health constraints related to the Covid-19 epidemic.
The Annual General Meeting approved the financial statements for the fiscal year 2020 and the payment of
an ordinary dividend of €0.90 per share for that year, which was paid as of May 18, 2021.
The Board of Directors took note of the negative vote on the second resolution regarding the approval of
the consolidated financial statements for the year ending December 31, 2020 (see above §1.1 & §1.4 for
the most recent developments regarding the audit of the two U.S legal entities on which there was a
qualified opinion in the report of the auditors for the 2020 consolidated financial statements and the
remediation and prevention plan).
The Annual General Meeting then approved the compensation and benefits paid or awarded for the year
2020 to Mr. Bertrand Meunier, Chairman of the Board of Directors, and to Mr. Elie Girard, Chief Executive
Officer.
The Annual General Meeting approved the 2021 compensation policies applicable to the Directors, the
Chairman of the Board of Directors and the Chief Executive Officer.
Atos shareholders adopted, by a very large majority, a "Say On Climate" resolution on the Group's
environmental policy regarding decarbonization, confirming its position among the most advanced
technology companies in the fight against climate change.
The results of the votes at the Annual General Meeting together with the documentation on the adopted resolutions are available on the Company’s website (www.atos.net), Investors section.
57/69 Trusted Partner for your Digital Journey
4.3. Executive compensation and stock ownership
4.3.1. Performance shares allocation plan decided on July 27,
2021
Pursuant to the authorization granted by the Annual General Meeting of May 12, 2021 under the 20th
resolution, the Board of Directors of the Company decided, during its meeting held on July 27, 2021, and upon the recommendation of the Remuneration Committee, to grant 862,100 performance shares in favor of the Group Management Committee and selected Executives and key employees.
The Chief Executive Officer decided to waive his eligibility to a performance shares grant in 2021. The
Remuneration Committee and the Board of Directors took note of this request from the Chief Executive Officer. Accordingly, the Board confirmed that no performance shares will be granted to Mr. Élie Girard for
the year 2021. Besides, the Group Chief Financial Officer also waived the 2021 grant. Finally, the Board of Directors decided a discount of 10% vs the initially planned award in shares in favor of the Group Management Committee members.
The main features and conditions of the performance shares plan are as follows:
Presence condition: subject to certain exceptions provided in the plan such as death, disability or
retirement of the beneficiary, the grant of performance shares is conditioned on the beneficiary’s remaining within Atos’ Group as an employee or corporate officer during the vesting period.
Performance condition: the vesting of all or part of the performance shares shall be subject to the achievement over a three-year period of three internal financial performance indicators and two performance conditions, one external and one internal, related to the corporate social responsibility (“CSR”), referring to the Dow Jones Sustainability Index (“DJSI”) (World or Europe) and the reduction of the CO2 emissions, respectively.
The four internal performance indicators chosen are directly connected to key success factors for the achievement of the Group’s ambitions and include three financial indicators and one CSR indicator:
(i) External revenue growth rate conditioning 30% of the grant;
(ii) Operating Margin rate conditioning 25% of the grant;
(iii) Conversion rate of Operating Margin into Free Cash Flow conditioning 25% of the grant, and
(iv) The decrease in CO2 emissions conditioning 10% of the grant.
The financial indicators will be calculated on a consolidated basis, taking into account potential scope variations and changes in the foreign exchange rates.
The Board of Directors has decided upon the recommendation of the Nomination Committee to align the performance targets of the 2021 performance share plan with the revised objectives disclosed to the
market on July 12, 2021 and with a progressive improvement of the indicators towards the mid-term of
the Group which were confirmed the same day.
The external performance condition linked to CSR, referring to the Dow Jones Sustainability Index (“DJSI”) (World or Europe) conditions 10% of the grant. The target achievement is based on the average of the scores achieved by the Atos Group during the vesting period, based on the average percentile ranking achieved by the Company resulting from the comparison with the other companies included in the DJSI index in relation to the three years.
Elasticity curves accelerate upwards and downwards the percentage of the grant related to each
performance indicator according to its level of achievement over the 3-year period. The final number of vested performance shares shall not under any circumstances exceed the number initially granted.
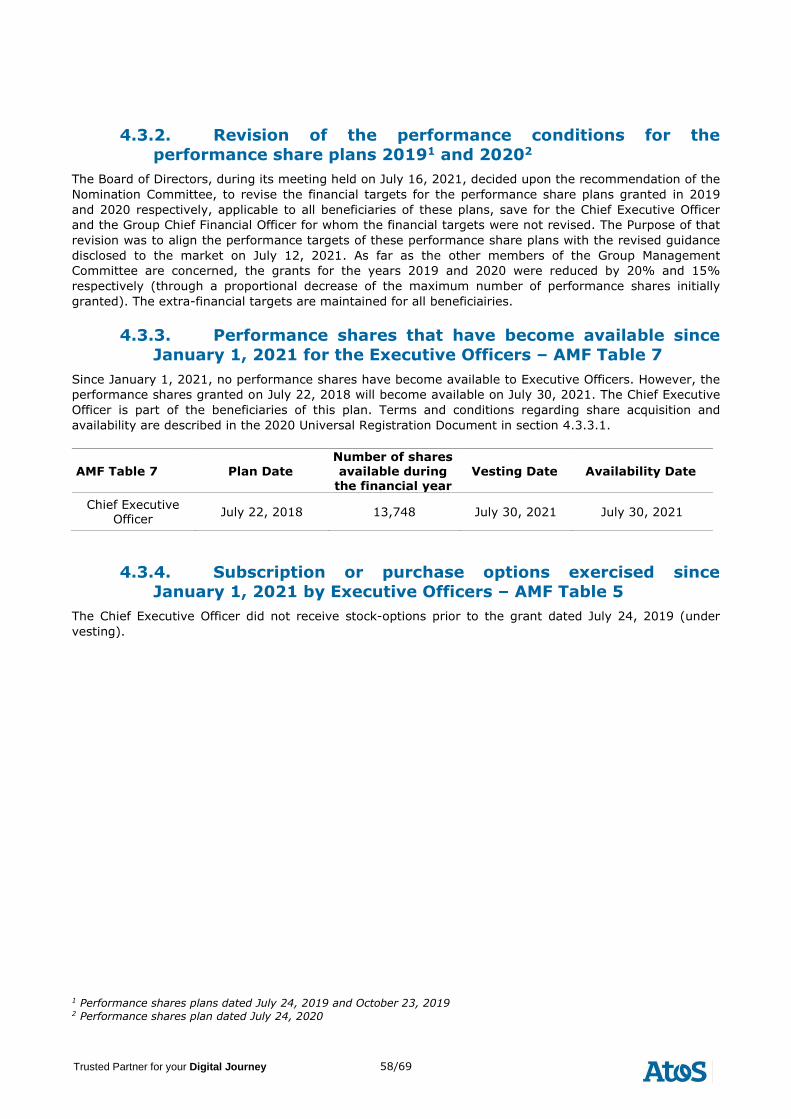
58/69 Trusted Partner for your Digital Journey
4.3.2. Revision of the performance conditions for the
performance share plans 20191 and 20202
The Board of Directors, during its meeting held on July 16, 2021, decided upon the recommendation of the
Nomination Committee, to revise the financial targets for the performance share plans granted in 2019
and 2020 respectively, applicable to all beneficiaries of these plans, save for the Chief Executive Officer
and the Group Chief Financial Officer for whom the financial targets were not revised. The Purpose of that
revision was to align the performance targets of these performance share plans with the revised guidance
disclosed to the market on July 12, 2021. As far as the other members of the Group Management
Committee are concerned, the grants for the years 2019 and 2020 were reduced by 20% and 15%
respectively (through a proportional decrease of the maximum number of performance shares initially
granted). The extra-financial targets are maintained for all beneficiairies.
4.3.3. Performance shares that have become available since
January 1, 2021 for the Executive Officers – AMF Table 7
Since January 1, 2021, no performance shares have become available to Executive Officers. However, the
performance shares granted on July 22, 2018 will become available on July 30, 2021. The Chief Executive
Officer is part of the beneficiaries of this plan. Terms and conditions regarding share acquisition and
availability are described in the 2020 Universal Registration Document in section 4.3.3.1.
AMF Table 7 Plan Date Number of shares available during
the financial year Vesting Date Availability Date
Chief Executive Officer
July 22, 2018 13,748 July 30, 2021 July 30, 2021
4.3.4. Subscription or purchase options exercised since
January 1, 2021 by Executive Officers – AMF Table 5
The Chief Executive Officer did not receive stock-options prior to the grant dated July 24, 2019 (under
vesting).
1 Performance shares plans dated July 24, 2019 and October 23, 2019 2 Performance shares plan dated July 24, 2020
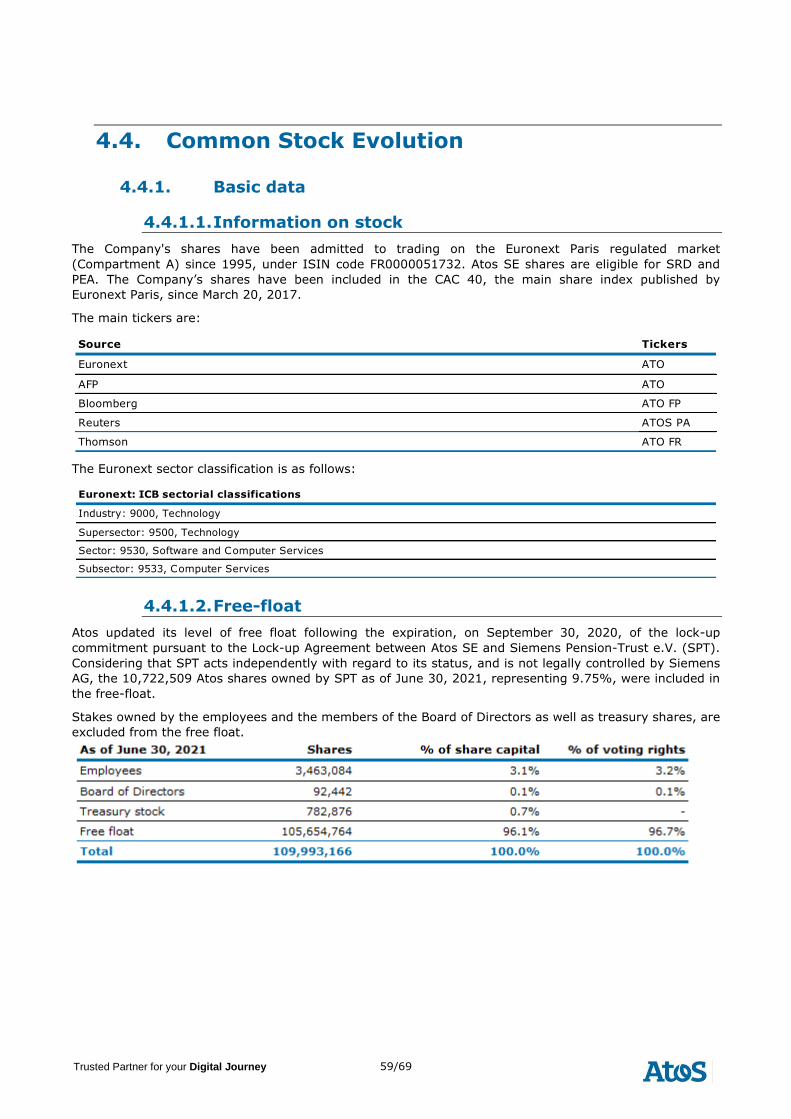
59/69 Trusted Partner for your Digital Journey
4.4. Common Stock Evolution
4.4.1. Basic data
4.4.1.1. Information on stock
The Company's shares have been admitted to trading on the Euronext Paris regulated market
(Compartment A) since 1995, under ISIN code FR0000051732. Atos SE shares are eligible for SRD and
PEA. The Company’s shares have been included in the CAC 40, the main share index published by
Euronext Paris, since March 20, 2017.
The main tickers are:
Source Tickers
Euronext ATO
AFP ATO
Bloomberg ATO FP
Reuters ATOS PA
Thomson ATO FR
The Euronext sector classification is as follows:
Euronext: ICB sectorial classifications
Industry: 9000, Technology
Supersector: 9500, Technology
Sector: 9530, Software and Computer Services
Subsector: 9533, Computer Services
4.4.1.2. Free-float
Atos updated its level of free float following the expiration, on September 30, 2020, of the lock-up
commitment pursuant to the Lock-up Agreement between Atos SE and Siemens Pension-Trust e.V. (SPT).
Considering that SPT acts independently with regard to its status, and is not legally controlled by Siemens
AG, the 10,722,509 Atos shares owned by SPT as of June 30, 2021, representing 9.75%, were included in
the free-float.
Stakes owned by the employees and the members of the Board of Directors as well as treasury shares, are
excluded from the free float.
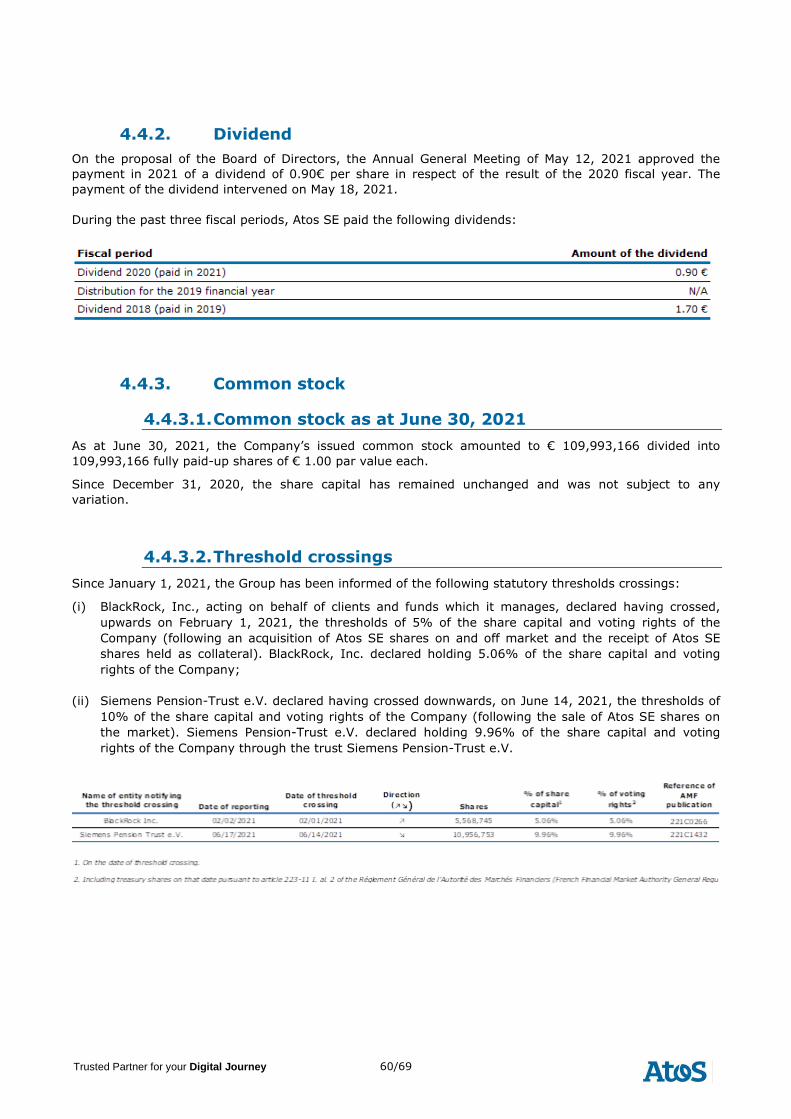
60/69 Trusted Partner for your Digital Journey
4.4.2. Dividend
On the proposal of the Board of Directors, the Annual General Meeting of May 12, 2021 approved the
payment in 2021 of a dividend of 0.90€ per share in respect of the result of the 2020 fiscal year. The
payment of the dividend intervened on May 18, 2021.
During the past three fiscal periods, Atos SE paid the following dividends:
4.4.3. Common stock
4.4.3.1. Common stock as at June 30, 2021
As at June 30, 2021, the Company’s issued common stock amounted to € 109,993,166 divided into
109,993,166 fully paid-up shares of € 1.00 par value each.
Since December 31, 2020, the share capital has remained unchanged and was not subject to any
variation.
4.4.3.2. Threshold crossings
Since January 1, 2021, the Group has been informed of the following statutory thresholds crossings:
(i) BlackRock, Inc., acting on behalf of clients and funds which it manages, declared having crossed,
upwards on February 1, 2021, the thresholds of 5% of the share capital and voting rights of the
Company (following an acquisition of Atos SE shares on and off market and the receipt of Atos SE
shares held as collateral). BlackRock, Inc. declared holding 5.06% of the share capital and voting
rights of the Company;
(ii) Siemens Pension-Trust e.V. declared having crossed downwards, on June 14, 2021, the thresholds of
10% of the share capital and voting rights of the Company (following the sale of Atos SE shares on
the market). Siemens Pension-Trust e.V. declared holding 9.96% of the share capital and voting
rights of the Company through the trust Siemens Pension-Trust e.V.
61/69 Trusted Partner for your Digital Journey
4.4.3.3. Treasury stock
Legal Framework
The 16th resolution of the Annual General Meeting of May 12, 2021 renewed in favor of the Board of
Directors, the authorization to trade in the Group’s shares, in connection with the implementation of a
share buyback program.
These purchases may be carried out:
• to ensure liquidity and an active market of the Company’s shares through an investment services provider acting independently in the context of a liquidity contract, in accordance with the professional conduct charter accepted by the AMF;
• to attribute or sell these shares to the executive officers and Directors or to the employees of the
Company and/or to the current or future affiliated companies, under the conditions and according
to the terms set or accepted by applicable legal and regulatory provisions in particular in
connection with (i) profit-sharing plans, (ii) the share purchase option regime laid down under
articles L. 22-10-56 et seq. of the Commercial Code, and (iii) free awards of shares in particular
under the framework set by articles L. 22-10-59, L. 22-10-60 et L. 225-197-1 et seq. of the
Commercial Code and (iv) French or foreign law shareholding plans, in particular in the context of
a company savings plan, as well as to carry out all hedging operations relating to these operations,
under the terms and conditions set by market authorities and at such times as the Board of
Directors or the person acting upon its delegation so decides;
• to remit the shares acquired upon the exercise of the rights attached to securities giving the right,
whether immediate or deferred, by reimbursement, conversion, exchange, presentation of a
warrant or any other way, to the attribution of shares of the Company, as well as to carry out all
hedging operations relating to the issuance of such securities, under the conditions set by market
authorities and at such times as the Board of Directors or the person acting upon its delegation so
decides;
• to keep them and subsequently use them in payment or exchange or other in the context of
potential external growth operations; or
• to cancel them as a whole or in part through a reduction of the share capital authorized by the
General Meeting, in particular pursuant to the 17th resolution of the Annual General Meeting held
on May 12, 2021.
This authorization shall be used at any time except during public offers on the shares of the Company.
This authorization will also enable the Company to trade in its own shares for any other purpose in
accordance with the regulations in force or which would be presumed to be legitimate by the applicable
legal and regulatory provisions or which would be recognized as a market practice by the AMF. In such a
case, the Company would inform its shareholders by way of a press release.
The purchase of shares shall not exceed, at any time, a maximum number of shares representing 10% of
the share capital of the Company, at any time, this percentage being applied to a share capital figure
adjusted to reflect transactions affecting the share capital subsequent to the Annual General Meeting held
on May 12, 2021, it being specified that where the shares are repurchased in the context of a liquidity
contract, the number of shares taken into account in calculating the 10% limit will be the number of
shares purchased minus the number of shares resold during the period of the authorization.
Acquisitions, sales and transfers or exchange of shares may be made by any means, subject to the limits
authorized by the laws and regulations in force, on one or several occasion, on a regulated market or via a
multilateral trading facility or a systematic internalizer or over the counter, including by public tender
offering or by block purchases or sales (with no limit on the portion of the share repurchase program), and
where required, by derivative financial instrument (traded on a regulated market or a multilateral trading
facility via a systematic internalizer or over the counter) or by warrants or securities giving access to
Company shares, or the implementation of optional strategies such as purchases or sales of purchase or
sale options, or by the issuance of securities giving access to the Company’s capital by conversion,
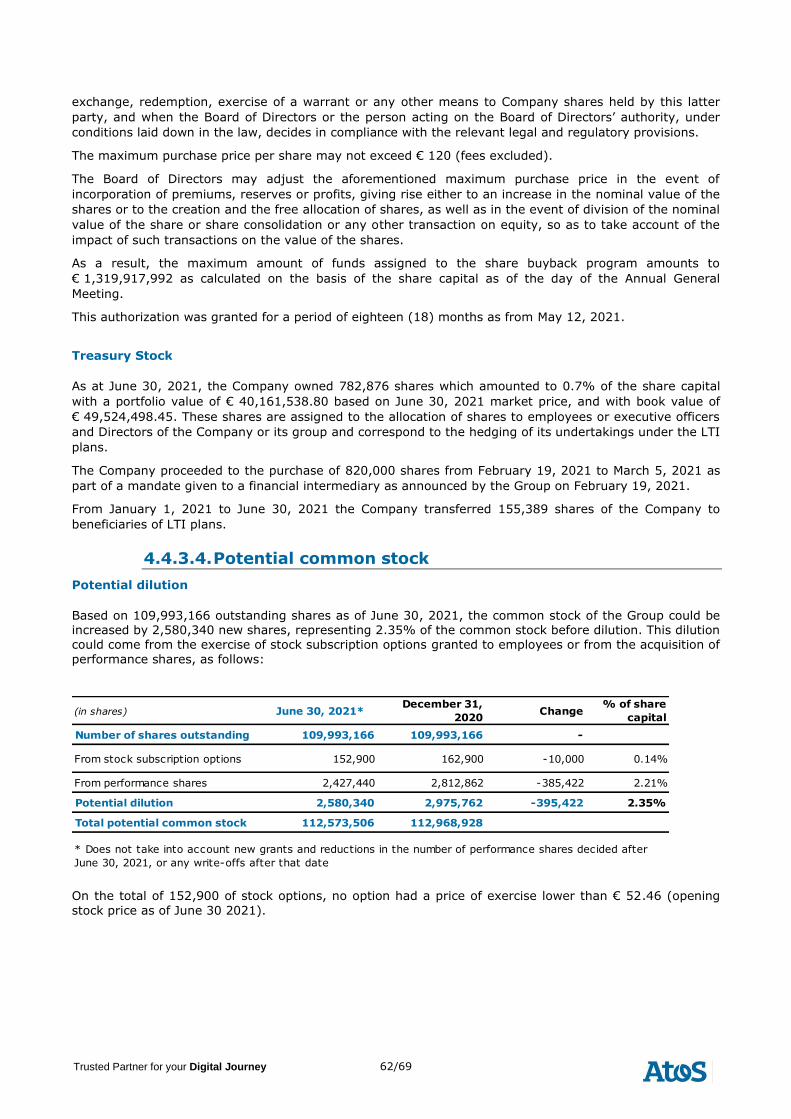
62/69 Trusted Partner for your Digital Journey
exchange, redemption, exercise of a warrant or any other means to Company shares held by this latter
party, and when the Board of Directors or the person acting on the Board of Directors’ authority, under
conditions laid down in the law, decides in compliance with the relevant legal and regulatory provisions.
The maximum purchase price per share may not exceed € 120 (fees excluded).
The Board of Directors may adjust the aforementioned maximum purchase price in the event of
incorporation of premiums, reserves or profits, giving rise either to an increase in the nominal value of the
shares or to the creation and the free allocation of shares, as well as in the event of division of the nominal
value of the share or share consolidation or any other transaction on equity, so as to take account of the
impact of such transactions on the value of the shares.
As a result, the maximum amount of funds assigned to the share buyback program amounts to
€ 1,319,917,992 as calculated on the basis of the share capital as of the day of the Annual General
Meeting.
This authorization was granted for a period of eighteen (18) months as from May 12, 2021.
Treasury Stock
As at June 30, 2021, the Company owned 782,876 shares which amounted to 0.7% of the share capital
with a portfolio value of € 40,161,538.80 based on June 30, 2021 market price, and with book value of
€ 49,524,498.45. These shares are assigned to the allocation of shares to employees or executive officers
and Directors of the Company or its group and correspond to the hedging of its undertakings under the LTI
plans.
The Company proceeded to the purchase of 820,000 shares from February 19, 2021 to March 5, 2021 as
part of a mandate given to a financial intermediary as announced by the Group on February 19, 2021.
From January 1, 2021 to June 30, 2021 the Company transferred 155,389 shares of the Company to
beneficiaries of LTI plans.
4.4.3.4. Potential common stock
Potential dilution
Based on 109,993,166 outstanding shares as of June 30, 2021, the common stock of the Group could be increased by 2,580,340 new shares, representing 2.35% of the common stock before dilution. This dilution could come from the exercise of stock subscription options granted to employees or from the acquisition of
performance shares, as follows:
(in shares) June 30, 2021*December 31,
2020Change
% of share
capital
Number of shares outstanding 109,993,166 109,993,166 -
From stock subscription options 152,900 162,900 -10,000 0.14%
From performance shares 2,427,440 2,812,862 -385,422 2.21%
Potential dilution 2,580,340 2,975,762 -395,422 2.35%
Total potential common stock 112,573,506 112,968,928
* Does not take into account new grants and reductions in the number of performance shares decided after
June 30, 2021, or any write-offs after that date
On the total of 152,900 of stock options, no option had a price of exercise lower than € 52.46 (opening
stock price as of June 30 2021).
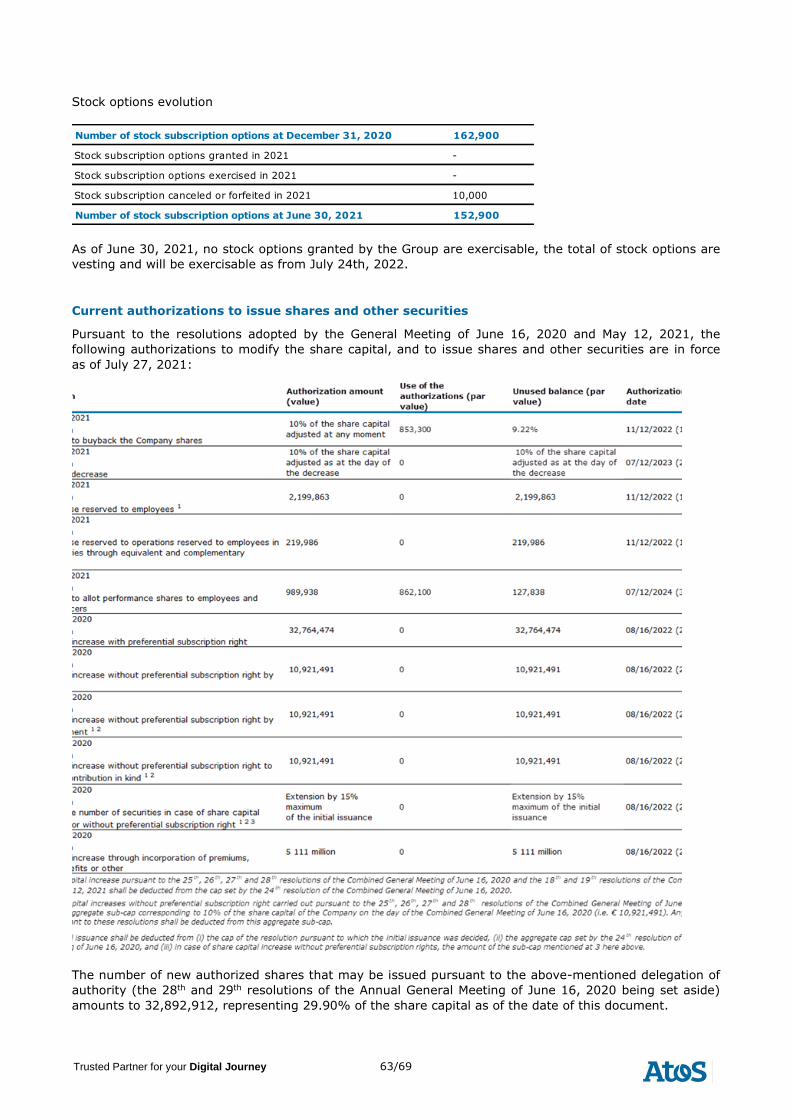
63/69 Trusted Partner for your Digital Journey
Stock options evolution
Number of stock subscription options at December 31, 2020 162,900
Stock subscription options granted in 2021 -
Stock subscription options exercised in 2021 -
Stock subscription canceled or forfeited in 2021 10,000
Number of stock subscription options at June 30, 2021 152,900
As of June 30, 2021, no stock options granted by the Group are exercisable, the total of stock options are
vesting and will be exercisable as from July 24th, 2022.
Current authorizations to issue shares and other securities
Pursuant to the resolutions adopted by the General Meeting of June 16, 2020 and May 12, 2021, the
following authorizations to modify the share capital, and to issue shares and other securities are in force
as of July 27, 2021:
The number of new authorized shares that may be issued pursuant to the above-mentioned delegation of
authority (the 28th and 29th resolutions of the Annual General Meeting of June 16, 2020 being set aside)
amounts to 32,892,912, representing 29.90% of the share capital as of the date of this document.
64/69 Trusted Partner for your Digital Journey
5. Appendices
5.1. Contacts
Institutional investors, financial analysts and individual shareholders may obtain information from:
Gilles Arditti
Executive Vice-President Investor Relations and Internal Audit
Tel +33 (0) 1 73 26 00 66
Mohamed Taghia
Investor Relations Manager
Tel +33 (0) 6 75 08 37 75
Requests for information can also be sent by email to [email protected]
5.2. Financial calendar
October 21, 2021 (Before Market Opening) Third quarter 2021 revenue
February 28, 2022 (After Market Close) Full Year 2021 results
April 27, 2022 (Before Market Opening) First Quarter 2022 revenue
May 18, 2022 Annual General Meeting
July 27, 2022 (Before Market Opening) First semester 2022 results
5.3. Amendment to the 2020 Universal
Registration Document cross-reference table
The cross-reference table below identifies the information required by appendices 1 and 2 of the
Commission Delegated Regulation (EU) 2019/980 of March 14, 2019 in accordance with the structure of
the Universal Registration Document which are mentioned in the sections of the 2020 Universal
Registration Document as updated and/or modified by this Amendment to the 2020 Universal Registration
Document. Both documents must be read together.
The information on the websites mentioned by the following hyperlink www.atos.net and www.amf-
france.org pages 1 and 56 of this amendment to the 2020 Universal Registration Document are not part of
the amendment.
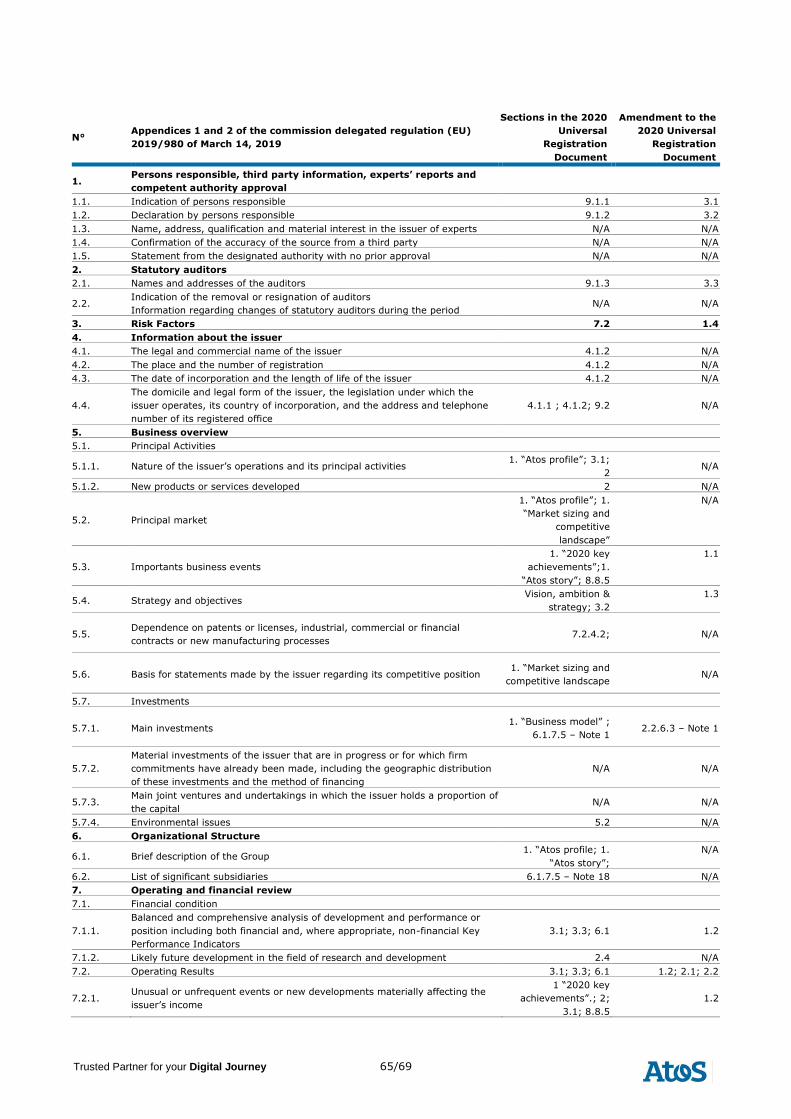
65/69 Trusted Partner for your Digital Journey
N° Appendices 1 and 2 of the commission delegated regulation (EU)
2019/980 of March 14, 2019
Sections in the 2020
Universal
Registration
Document
Amendment to the
2020 Universal
Registration
Document
1. Persons responsible, third party information, experts’ reports and
competent authority approval
1.1. Indication of persons responsible 9.1.1 3.1
1.2. Declaration by persons responsible 9.1.2 3.2
1.3. Name, address, qualification and material interest in the issuer of experts N/A N/A
1.4. Confirmation of the accuracy of the source from a third party N/A N/A
1.5. Statement from the designated authority with no prior approval N/A N/A
2. Statutory auditors
2.1. Names and addresses of the auditors 9.1.3 3.3
2.2. Indication of the removal or resignation of auditors
Information regarding changes of statutory auditors during the period N/A N/A
3. Risk Factors 7.2 1.4
4. Information about the issuer
4.1. The legal and commercial name of the issuer 4.1.2 N/A
4.2. The place and the number of registration 4.1.2 N/A
4.3. The date of incorporation and the length of life of the issuer 4.1.2 N/A
4.4.
The domicile and legal form of the issuer, the legislation under which the
issuer operates, its country of incorporation, and the address and telephone
number of its registered office
4.1.1 ; 4.1.2; 9.2
N/A
5. Business overview
5.1. Principal Activities
5.1.1. Nature of the issuer’s operations and its principal activities 1. “Atos profile”; 3.1;
2 N/A
5.1.2. New products or services developed 2 N/A
5.2. Principal market
1. “Atos profile”; 1.
“Market sizing and
competitive
landscape”
N/A
5.3. Importants business events
1. “2020 key
achievements”;1.
“Atos story”; 8.8.5
1.1
5.4. Strategy and objectives Vision, ambition &
strategy; 3.2
1.3
5.5. Dependence on patents or licenses, industrial, commercial or financial
contracts or new manufacturing processes 7.2.4.2;
N/A
5.6. Basis for statements made by the issuer regarding its competitive position 1. “Market sizing and
competitive landscape
N/A
5.7. Investments
5.7.1. Main investments 1. “Business model” ;
6.1.7.5 – Note 1
2.2.6.3 – Note 1
5.7.2.
Material investments of the issuer that are in progress or for which firm
commitments have already been made, including the geographic distribution
of these investments and the method of financing
N/A
N/A
5.7.3. Main joint ventures and undertakings in which the issuer holds a proportion of
the capital N/A N/A
5.7.4. Environmental issues 5.2 N/A
6. Organizational Structure
6.1. Brief description of the Group 1. “Atos profile; 1.
“Atos story”;
N/A
6.2. List of significant subsidiaries 6.1.7.5 – Note 18 N/A
7. Operating and financial review
7.1. Financial condition
7.1.1.
Balanced and comprehensive analysis of development and performance or
position including both financial and, where appropriate, non-financial Key
Performance Indicators
3.1; 3.3; 6.1
1.2
7.1.2. Likely future development in the field of research and development 2.4 N/A
7.2. Operating Results 3.1; 3.3; 6.1 1.2; 2.1; 2.2
7.2.1. Unusual or unfrequent events or new developments materially affecting the
issuer’s income
1 “2020 key
achievements”.; 2;
3.1; 8.8.5
1.2
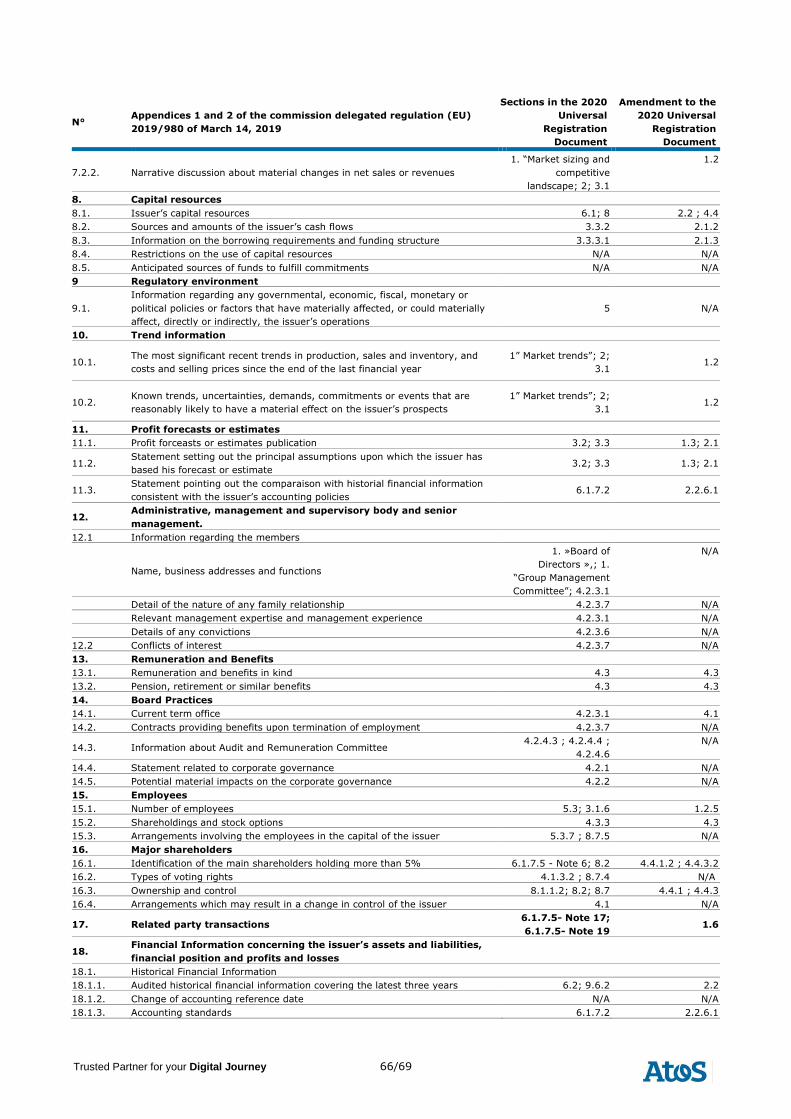
66/69 Trusted Partner for your Digital Journey
N° Appendices 1 and 2 of the commission delegated regulation (EU)
2019/980 of March 14, 2019
Sections in the 2020
Universal
Registration
Document
Amendment to the
2020 Universal
Registration
Document
7.2.2. Narrative discussion about material changes in net sales or revenues
1. “Market sizing and
competitive
landscape; 2; 3.1
1.2
8. Capital resources
8.1. Issuer’s capital resources 6.1; 8 2.2 ; 4.4
8.2. Sources and amounts of the issuer’s cash flows 3.3.2 2.1.2
8.3. Information on the borrowing requirements and funding structure 3.3.3.1 2.1.3
8.4. Restrictions on the use of capital resources N/A N/A
8.5. Anticipated sources of funds to fulfill commitments N/A N/A
9 Regulatory environment
9.1.
Information regarding any governmental, economic, fiscal, monetary or
political policies or factors that have materially affected, or could materially
affect, directly or indirectly, the issuer’s operations
5
N/A
10. Trend information
10.1. The most significant recent trends in production, sales and inventory, and
costs and selling prices since the end of the last financial year
1” Market trends”; 2;
3.1
1.2
10.2. Known trends, uncertainties, demands, commitments or events that are
reasonably likely to have a material effect on the issuer’s prospects
1” Market trends”; 2;
3.1
1.2
11. Profit forecasts or estimates
11.1. Profit forceasts or estimates publication 3.2; 3.3 1.3; 2.1
11.2. Statement setting out the principal assumptions upon which the issuer has
based his forecast or estimate 3.2; 3.3 1.3; 2.1
11.3. Statement pointing out the comparaison with historial financial information
consistent with the issuer’s accounting policies 6.1.7.2 2.2.6.1
12. Administrative, management and supervisory body and senior
management.
12.1 Information regarding the members
Name, business addresses and functions
1. »Board of
Directors »,; 1.
“Group Management
Committee”; 4.2.3.1
N/A
Detail of the nature of any family relationship 4.2.3.7 N/A
Relevant management expertise and management experience 4.2.3.1 N/A
Details of any convictions 4.2.3.6 N/A
12.2 Conflicts of interest 4.2.3.7 N/A
13. Remuneration and Benefits
13.1. Remuneration and benefits in kind 4.3 4.3
13.2. Pension, retirement or similar benefits 4.3 4.3
14. Board Practices
14.1. Current term office 4.2.3.1 4.1
14.2. Contracts providing benefits upon termination of employment 4.2.3.7 N/A
14.3. Information about Audit and Remuneration Committee 4.2.4.3 ; 4.2.4.4 ;
4.2.4.6
N/A
14.4. Statement related to corporate governance 4.2.1 N/A
14.5. Potential material impacts on the corporate governance 4.2.2 N/A
15. Employees
15.1. Number of employees 5.3; 3.1.6 1.2.5
15.2. Shareholdings and stock options 4.3.3 4.3
15.3. Arrangements involving the employees in the capital of the issuer 5.3.7 ; 8.7.5 N/A
16. Major shareholders
16.1. Identification of the main shareholders holding more than 5% 6.1.7.5 - Note 6; 8.2 4.4.1.2 ; 4.4.3.2
16.2. Types of voting rights 4.1.3.2 ; 8.7.4 N/A
16.3. Ownership and control 8.1.1.2; 8.2; 8.7 4.4.1 ; 4.4.3
16.4. Arrangements which may result in a change in control of the issuer 4.1 N/A
17. Related party transactions 6.1.7.5- Note 17;
6.1.7.5- Note 19 1.6
18. Financial Information concerning the issuer’s assets and liabilities,
financial position and profits and losses
18.1. Historical Financial Information
18.1.1. Audited historical financial information covering the latest three years 6.2; 9.6.2 2.2
18.1.2. Change of accounting reference date N/A N/A
18.1.3. Accounting standards 6.1.7.2 2.2.6.1
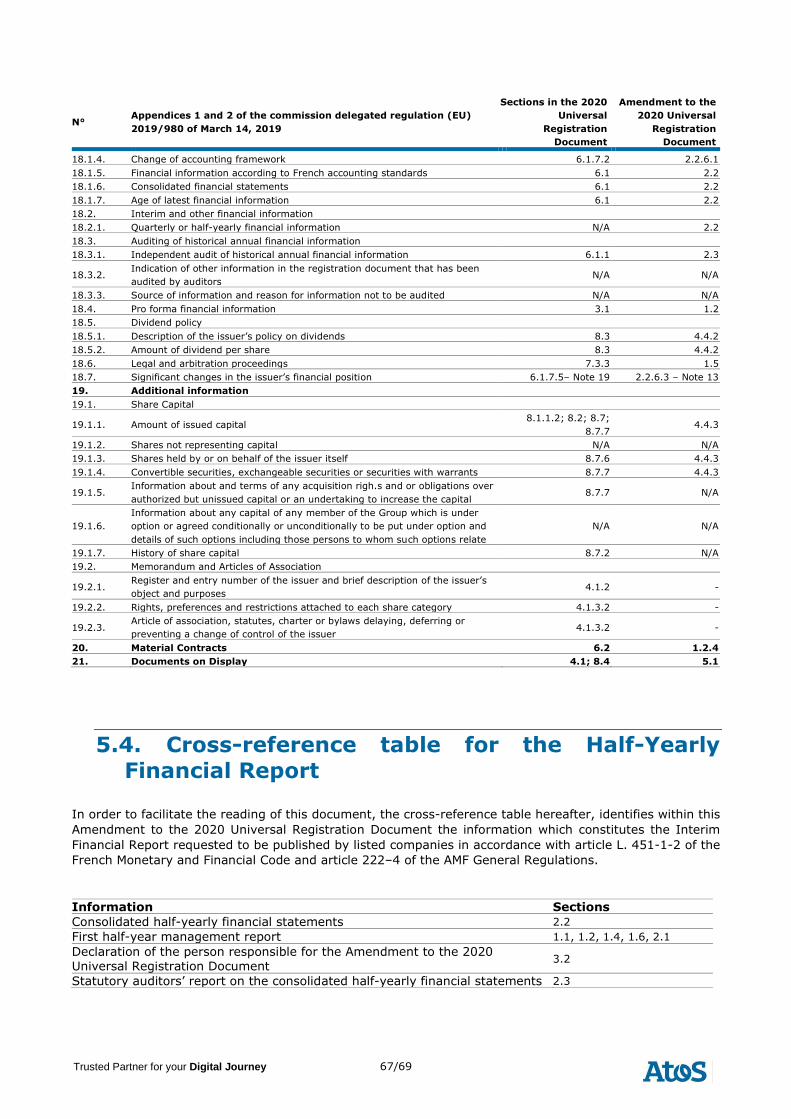
67/69 Trusted Partner for your Digital Journey
N° Appendices 1 and 2 of the commission delegated regulation (EU)
2019/980 of March 14, 2019
Sections in the 2020
Universal
Registration
Document
Amendment to the
2020 Universal
Registration
Document
18.1.4. Change of accounting framework 6.1.7.2 2.2.6.1
18.1.5. Financial information according to French accounting standards 6.1 2.2
18.1.6. Consolidated financial statements 6.1 2.2
18.1.7. Age of latest financial information 6.1 2.2
18.2. Interim and other financial information
18.2.1. Quarterly or half-yearly financial information N/A 2.2
18.3. Auditing of historical annual financial information
18.3.1. Independent audit of historical annual financial information 6.1.1 2.3
18.3.2. Indication of other information in the registration document that has been
audited by auditors N/A N/A
18.3.3. Source of information and reason for information not to be audited N/A N/A
18.4. Pro forma financial information 3.1 1.2
18.5. Dividend policy
18.5.1. Description of the issuer’s policy on dividends 8.3 4.4.2
18.5.2. Amount of dividend per share 8.3 4.4.2
18.6. Legal and arbitration proceedings 7.3.3 1.5
18.7. Significant changes in the issuer’s financial position 6.1.7.5– Note 19 2.2.6.3 – Note 13
19. Additional information
19.1. Share Capital
19.1.1. Amount of issued capital 8.1.1.2; 8.2; 8.7;
8.7.7 4.4.3
19.1.2. Shares not representing capital N/A N/A
19.1.3. Shares held by or on behalf of the issuer itself 8.7.6 4.4.3
19.1.4. Convertible securities, exchangeable securities or securities with warrants 8.7.7 4.4.3
19.1.5. Information about and terms of any acquisition righ.s and or obligations over
authorized but unissued capital or an undertaking to increase the capital 8.7.7 N/A
19.1.6.
Information about any capital of any member of the Group which is under
option or agreed conditionally or unconditionally to be put under option and
details of such options including those persons to whom such options relate
N/A N/A
19.1.7. History of share capital 8.7.2 N/A
19.2. Memorandum and Articles of Association
19.2.1. Register and entry number of the issuer and brief description of the issuer’s
object and purposes 4.1.2 -
19.2.2. Rights, preferences and restrictions attached to each share category 4.1.3.2 -
19.2.3. Article of association, statutes, charter or bylaws delaying, deferring or
preventing a change of control of the issuer 4.1.3.2 -
20. Material Contracts 6.2 1.2.4
21. Documents on Display 4.1; 8.4 5.1
5.4. Cross-reference table for the Half-Yearly
Financial Report
In order to facilitate the reading of this document, the cross-reference table hereafter, identifies within this
Amendment to the 2020 Universal Registration Document the information which constitutes the Interim
Financial Report requested to be published by listed companies in accordance with article L. 451-1-2 of the
French Monetary and Financial Code and article 222–4 of the AMF General Regulations.
Information Sections
Consolidated half-yearly financial statements 2.2
First half-year management report 1.1, 1.2, 1.4, 1.6, 2.1
Declaration of the person responsible for the Amendment to the 2020 Universal Registration Document
3.2
Statutory auditors’ report on the consolidated half-yearly financial statements 2.3
68/69 Trusted Partner for your Digital Journey
5.5. Full index
1. ACTIVITY REPORT ................................................................................................ 3 1.1. Atos in the first half of 2021 ...................................................................................................... 3 1.2. Operational review .................................................................................................................... 7
1.2.1. Statutory to constant scope and exchange rates reconciliation ................................................. 7 1.2.2. Performance by Industry ..................................................................................................... 9
1.2.2.1. Manufacturing .......................................................................................................................... 9 1.2.2.2. Financial Services & Insurance ................................................................................................... 10 1.2.2.3. Public Sector & Defense ............................................................................................................ 10 1.2.2.4. Telecom, Media & Technology .................................................................................................... 11 1.2.2.5. Resources & Services ............................................................................................................... 12 1.2.2.6. Healthcare & Life Sciences ........................................................................................................ 12
1.2.3. Performance by Regional Business Units ............................................................................. 13 1.2.3.1. North America ......................................................................................................................... 13 1.2.3.2. Northern Europe ...................................................................................................................... 14 1.2.3.3. Central Europe ........................................................................................................................ 15 1.2.3.4. Southern Europe ...................................................................................................................... 16 1.2.3.5. Growing Markets ...................................................................................................................... 17 1.2.3.6. Global structures ..................................................................................................................... 17
1.2.4. Portfolio .......................................................................................................................... 18 1.2.4.1. Order entry and book to bill ...................................................................................................... 18 1.2.4.2. Full backlog ............................................................................................................................. 18 1.2.4.3. Full qualified pipeline ................................................................................................................ 18
1.2.5. Human Resources ............................................................................................................ 19 1.3. 2021 objectives and mid-term targets ..................................................................................... 20 1.4. Risk Factors ............................................................................................................................. 21 1.5. Claims and litigations .............................................................................................................. 21
1.5.1. Tax claims ...................................................................................................................... 22 1.5.2. Commercial claims ........................................................................................................... 22 1.5.3. Labor claims .................................................................................................................... 23 1.5.4. Representation & Warranty claims ..................................................................................... 23 1.5.5. Miscellaneous .................................................................................................................. 23
1.6. Related parties ........................................................................................................................ 23
2. FINANCIAL STATEMENTS ................................................................................... 24 2.1. Financial review ....................................................................................................................... 24
2.1.1. Income statement ............................................................................................................ 24 2.1.1.1. Operating margin ..................................................................................................................... 24 2.1.1.2. Other operating income and expenses ........................................................................................ 24 2.1.1.3. Net financial expense ............................................................................................................... 25 2.1.1.4. Corporate tax .......................................................................................................................... 26 2.1.1.5. Share of net profit (loss) of associates ........................................................................................ 26 2.1.1.6. Normalized net income ............................................................................................................. 26 2.1.1.7. Half year Earning Per Share ...................................................................................................... 27
2.1.2. Cash Flow and net cash .................................................................................................... 27 2.1.3. Bank covenant ................................................................................................................. 29
2.2. Interim condensed consolidated financial statements ............................................................. 30 2.2.1. Interim condensed consolidated income statement ............................................................... 30 2.2.2. Interim condensed consolidated statement of comprehensive income ..................................... 31 2.2.3. Interim condensed consolidated statement of financial position ............................................. 32 2.2.4. Interim condensed consolidated cash flow statement ............................................................ 33 2.2.5. Interim consolidated statement of changes in shareholders’ equity......................................... 34 2.2.6. Notes to the interim condensed consolidated financial statements .......................................... 35
2.2.6.1. Basis of preparation ................................................................................................................. 35 2.2.6.2. Impact of the pandemic crisis on the interim condensed consolidated financial statements ................ 36 2.2.6.3. Alternative Performance measures ............................................................................................. 36 2.2.6.4. Notes to the interim condensed consolidated financial statements .................................................. 37
2.3. Statutory auditors’ Review Report on the half-yearly financial information for the period from
January 1 to June 30, 2021 ...................................................................................................... 52
3. PERSON RESPONSIBLE ....................................................................................... 54 3.1. Person responsible for the amendment to the Universal Registration Document ..................... 54
69/69 Trusted Partner for your Digital Journey
3.2. Statement of the person responsible for the amendment to the Universal Registration
Document ................................................................................................................................ 54 3.3. For the audit ............................................................................................................................ 54
4. CORPORATE GOVERNANCE AND ADDITIONAL INFORMATION ............................ 55 4.1. Office renewals and composition of the Board of Directors ...................................................... 55 4.2. Annual General Meeting held on May 12, 2021 ........................................................................ 56 4.3. Executive compensation and stock ownership ......................................................................... 57
4.3.1. Performance shares allocation plan decided on July 27, 2021 ................................................ 57 4.3.2. Revision of the performance conditions for the performance share plans 2019 and 2020 ........... 58 4.3.3. Performance shares that have become available since January 1, 2021 for the Executive Officers
– AMF Table 7 ................................................................................................................. 58 4.3.4. Subscription or purchase options exercised since January 1, 2021 by Executive Officers – AMF
Table 5 ........................................................................................................................... 58 4.4. Common Stock Evolution ......................................................................................................... 59
4.4.1. Basic data ....................................................................................................................... 59 4.4.1.1. Information on stock ................................................................................................................ 59 4.4.1.2. Free-float ................................................................................................................................ 59
4.4.2. Dividend ......................................................................................................................... 60 4.4.3. Common stock................................................................................................................. 60
4.4.3.1. Common stock as at June 30, 2021 ............................................................................................ 60 4.4.3.2. Threshold crossings .................................................................................................................. 60 4.4.3.3. Treasury stock ......................................................................................................................... 61 4.4.3.4. Potential common stock ............................................................................................................ 62
5. APPENDICES ...................................................................................................... 64 5.1. Contacts................................................................................................................................... 64 5.2. Financial calendar .................................................................................................................... 64 5.3. Amendment to the 2020 Universal Registration Document cross-reference table ................... 64 5.4. Cross-reference table for the Half-Yearly Financial Report ...................................................... 67 5.5. Full index ................................................................................................................................. 68