Embed Size (px)
Citation preview
2016 financial report
This document is a full free translation of the original French text. In case of discrepancies, the French
version shall prevail.
2/108
CONTENTS
Contents ................................................................................................................................................ 2
A Group overview ............................................................................................................................... 3
A.1 Revenue profile ....................................................................................................................... 3
A.2 Business profile ....................................................................................................................... 4
A.3 2016 key achievements ........................................................................................................... 7
B Financials ...................................................................................................................................... 11
B.1 Operational review ................................................................................................................ 11
B.2 2017 objectives ..................................................................................................................... 26
B.3 Financial review..................................................................................................................... 27
B.4 Consolidated financial statements .......................................................................................... 36
C Contacts and locations ................................................................................................................. 105
D Full index .................................................................................................................................... 107
3/108
A GROUP OVERVIEW
A.1 Revenue profile
A.1.1 By Division
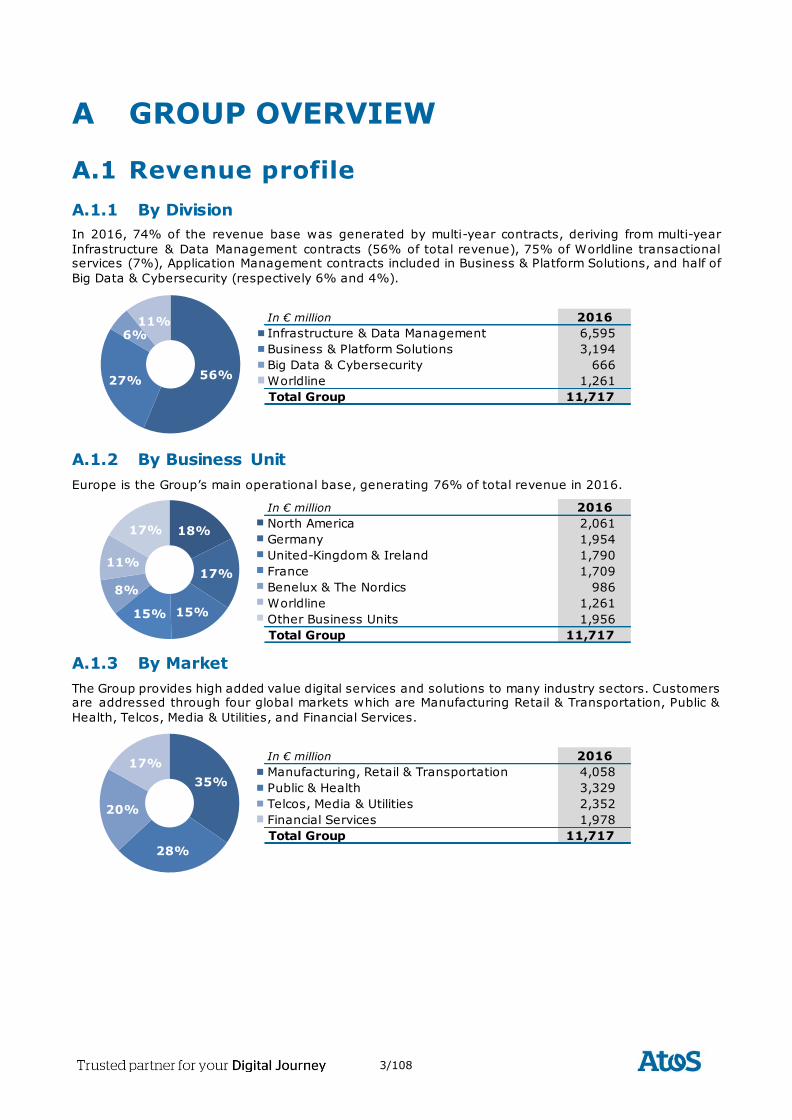
In 2016, 74% of the revenue base was generated by multi-year contracts, deriving from multi-year
Infrastructure & Data Management contracts (56% of total revenue), 75% of Worldline transactional services (7%), Application Management contracts included in Business & Platform Solutions, and half of
Big Data & Cybersecurity (respectively 6% and 4%).
A.1.2 By Business Unit
Europe is the Group’s main operational base, generating 76% of total revenue in 2016.
A.1.3 By Market
The Group provides high added value digital services and solutions to many industry sectors. Customers are addressed through four global markets which are Manufacturing Retail & Transportation, Public &
Health, Telcos, Media & Utilities, and Financial Services.
In € million 2016
Infrastructure & Data Management 6,595
Business & Platform Solutions 3,194
Big Data & Cybersecurity 666
Worldline 1,261
Total Group 11,717
56%27%
6%11%
In € million 2016
North America 2,061
Germany 1,954
United-Kingdom & Ireland 1,790
France 1,709
Benelux & The Nordics 986
Worldline 1,261
Other Business Units 1,956
Total Group 11,717
18%
17%
15%15%
8%
11%
17%
In € million 2016
Manufacturing, Retail & Transportation 4,058
Public & Health 3,329
Telcos, Media & Utilities 2,352
Financial Services 1,978
Total Group 11,717
35%
28%
20%
17%
4/108
A.2 Business profile
Atos SE (Societas Europaea) is a leader in digital transformation with circa 100,000 employees in 72
countries and pro forma annual revenue of circa € 12 billion. Serving a global client base, the Group is the European leader in Big Data, Cybersecurity, Digital Workplace and provides Cloud services, Infrastructure
& Data Management, Business & Platform solutions, as well as transactional services through Worldline,
the European leader in the payment industry. With its cutting edge technology expertise and industry knowledge, the Group supports the digital transformation of its clients across different business sectors:
Defense, Financial Services, Health, Manufacturing, Media, Utilities, Public sector, Retail, Telecommunications, and Transportation. The Group is the Worldwide Information Technology Partner for
the Olympic & Paralympic Games and is listed on the Euronext Paris market. Atos operates under the brands Atos, Atos Consulting, Atos Worldgrid, Bull, Canopy, Unify and Worldline.
Atos’ objective is to empower its clients on their digital journey by applying its in-depth market knowledge
and extensive portfolio of services. Pursuing this objective, Atos identified four key challenges that its customers face, whatever their industry sector and whatever their geography: Business Reinvention,
Customer Experience, Operational Excellence, Trust & Compliance:
Reinvent business model: how to move from traditional business models to new, agile digital
networks, enhancing your company from the inside out?
Improve the customer experience: how can you ensure clients satisfaction, predict desires and respond to them in such a way that every customer will promote itself your company?
Ensure trust and compliance: how to ensure your infrastructures, personnel, and customers are secure and compliant? How can you make security and the trust it fosters a primary lever for
innovation and growth?
Reinforce operational excellence: how to ensure agile, flexible, and scalable operations, to
compete successfully in the digital age?
Atos has the resources, the scale and the expertise to help its customers meet all the challenges of their transformation.
Atos Digital Transformation Factory
In order to answer the holistic need of large organizations in their digital transformation, the Group
designed a Digital Transformation Factory based on four end-to-end offers relying on the joint skills and capabilities of all the Group divisions and the consistent sales organization focusing on its top clients.
With Atos Canopy Orchestrated Hybrid Cloud, Atos leverages all the Group strengths and the expertise of its unique and powerful ecosystem of partners. It proposes an industrial end-to-end
approach to transform customer applications and infrastructures and to migrate them to a common framework managing and orchestrating the bi-modal landscape of legacy and multi-
sources of cloud.
Leveraging 32 years of experience with SAP 12,000+ professionals in 40+ countries, the Group provides a unique end-to-end SAP HANA value proposition with a recognized set of tools and
accelerators, flexible SAP HANA hosting and cloud Services, and the Leading SAP HANA appliance, the Bullion. With SAP HANA by Atos end-to-end approach from Consulting &
Integration to Digital & Analytics, Atos accelerates innovation and transformation by simplifying
and optimizing its clients IT costs with the combination of both classical SAP and new SAP HANA.
In a context of consumerization redefining the way we work and business requirements of the
end user, the Atos Digital Workplace end-to-end offering is answering its clients’ needs of productivity of employees, security, and costs. The Atos solution encompasses automated help &
interaction centers, cloud & mobile solutions, unified communication and collaboration tools such as Circuit from Unify.
Atos Codex is a suite of business-driven analytics and IOT solutions and services which
accelerates client´s Digital Transformation. It supports public and private sector organizations to transform data into actionable business insight using cognitive capabilities. In this field, the Atos
difference relies on an open innovation model to collect the world’s intelligence and make it work for its clients, made to measure platforms to perfectly fit to the unique business context of its
clients, in a fully secured environment.
5/108
Atos expertise covers a wide range of specialties and always accompanying its
customers for new opportunities and innovations
Infrastructure & Data Management (IDM): transforming today’s IT landscapes to future hybrid
IT environments
Atos is at the forefront of transforming its client’s IT infrastructures to the new world of hybrid IT landscapes. This is built on Atos’ expertise in delivering IT outsourcing for many years, strengthened by
the Atos’ Canopy Hybrid Cloud. Atos has been recognized several times by independent analysts as the most visionary workplace services provider in Europe thanks to its Digital Workplace offering, and as a
leader in European and APAC Datacenter Outsourcing and Infrastructure Utility Services as well a s global leader in outsourcing services globally. Finally, Atos delivers Business Process Outsourcing (BPO) services
in Medical and Financial areas.
Business & Platform Solutions: transforming business through innovative business technologies
In order to better answer to market needs, Business & Platform Solutions (B&PS) has fundamentally
changed the way it conducts its business. The organization focuses on global delivery with strengthened management for strategic accounts and offering development to ensure high quality standards, improve
customer satisfaction and drive operational performance.
Business & Platform Solutions contributes to the Group Digital Transformation Factory and proposes an industrial end-to-end approach to transform customer applications and to migrate them in the scope of
Atos Canopy cloud solutions. Through SAP HANA, it delivers innovation for key customer business processes with an innovative platform and a consulting approach based on design thinking. As part of the
Atos Digital Workplace offering, Business & Platform Solutions delivers solutions for mobile apps and
devices as well as SaaS integration. And finally, with Atos Codex, an analytics, cognitive & IoT solution allowing enterprises across all industries to minimize their time to value, B&PS delivers fast track solutions
to identify and accelerate development of new use cases and scenarios that can scale massively on an open, industrial analytic platform fabric.
The Atos Consulting practice is part of the Business & Platform Solutions division and aims to transform business through innovative Business Technologies. As such, Atos helps its clients to deliver innovation to
their customers, reduce costs, and improve effectiveness by leveraging business technologies. Much more
than just a product implementation, Atos Consulting’s comprehensive Digital Transformation solutions enable organizations to connect and collaborate both within and outside the organization, much more
effectively.
Big Data & Cybersecurity: Big Data as a business differentiator empowering digital
transformation
Atos works with organizations in the private and public sectors, including manufacturing, telecommunications, financial services and defense to generate value from their growing volumes of data,
with the highest levels of security. Through its technologies brought by Bull, Atos develops high performance computing platforms, security solutions, software appliances and services allowing its
customers to monetize and protect their information assets.
Worldline: ePayment Services
Worldline [Euronext: WLN] is the European leader in the payments and transactional services industry.
Worldline delivers new-generation services, enabling its customers to offer smooth and innovative solutions to the end consumer. Key player for B2B2C industries, with over 40 years of experience,
Worldline supports and contributes to the success of all businesses and administrative services in a perpetually evolving market. Worldline offers a unique and flexible business model built around a global
and growing portfolio, thus enabling end-to-end support. Worldline activities are organized around three
axes: Merchant Services & Terminals, Mobility & e-Transactional Services, Financial Processing & Software Licensing. Worldline employs more than 8,600 people worldwide, with estimated revenue of circa 1.5
billion euros on a yearly basis. Worldline is an Atos company.
6/108
Atos industry expertise
Atos forges long-term partnerships with both large groups and multinational and small and medium size
companies. Its high technological expertise and industry knowledge allow the Group to work with clients in the following sectors:
Manufacturing, Retail & Transportation
Atos helps enterprises to transform and optimize their business processes and IT infrastructures. In the manufacturing sector, Atos designs, builds, and runs solutions covering the entire value chain. Atos's
solutions include strong focus on Enterprise Resource Planning (ERP) and Manufacturing Execution Systems (MES) and drive improvements in Product Lifecycle Management (PLM) and Customer
Relationship Management (CRM). Atos enables its Retail customers to meet the challenges presented by the increasingly empowered consumer. Atos's ubiquitous commerce and payment solutions help its clients
to understand and address their customers via all available channels (Online, Store, Call Desk) in the most
efficient manner. Across the Manufacturing, Retail & Services sectors, Atos offers the entire solution portfolio as a Cloud service and enable the mobile users with enterprise mobility services.
Public & Health
Atos is an active partner in business improvement and technology for governments, defense, healthcare,
and education. Citizen and patient-centric services, cognitive and analytics platforms, effective application
modernization, shared services and securing systems have become pivotal as cultural changes and new streamlined processes become the norm. In a rapidly transforming word, Atos helps its clients invent the
public and health digital platforms of the future.
As an expert in powerful, secured and mission-critical systems, infrastructures and applications, Atos'
products and commercial solutions under the Bull brand help defense and homeland security authorities and organizations to take current risks into account. From services (engineering and integration of
complex hardware/software systems) to solutions, Atos helps nations and industrial players build the new
defense systems and technologies of tomorrow. The Group has been involved in projects as diverse as the largest European supercomputers for nuclear simulations, countrywide border control, battlefield and
warship information systems, mobile tactical communications, intelligence and reconnaissance systems.
Telcos, Media & Utilities
Across telecommunications, media, energy and utilities sectors, operators face the challenges of increased
competition, deregulation, consolidation and disruptive technologies. Within this context, the pressure is on to establish new business models to maintain leading market positions or increase market share. Using
IT to transform its clients’ operations and customer relations, Atos helps them to increase their agility while reducing their costs. Atos powers progress for its clients by accelerating and securing the adoption of
transformational technologies, such as data-centric approaches in telecommunications, multi-channel and interactive media delivery, and smart grid systems for energy and utilities.
Financial Services
Atos supports the world’s leading Financial Services organizations globally by offering solutions to improve their operational performance and IT agility on the long term. It enables them to manage risks and
ensuring compliancy with changing regulations across multiple geographies. In the world of the connected customer, Atos provide the banking and insurance sectors with end-to-end smart solutions to attract and
engage customers across multiple channels and to understand them more intimately and respond quicker
to their needs thereby building stronger loyalty rate.
7/108
A.3 2016 key achievements
January
On January 20, Atos announced having completed the acquisition from Gores Group and Siemens of
Unify, the world number three in integrated communication solutions generating €1.2 billion annual
revenue. The acquisition creates a unique integrated proposition for unified communications improving the social collaboration, digital transformation and business performance of its clients.
On January 25, Orange Cyberdefense and Atos announced having signed a strategic partnership to jointly take on the secure mobile terminal communications market. This partnership completes Orange
Cyberdefense range of communications security solutions. Under the agreement, Orange Cyberdefense will be selling Hoox, the most secure smartphone on the market, to its customers. Orange Cyberdefense will
be Atos privileged partner to sell solutions and provide secure communication services based on Hoox. The
distribution contract will cover Europe, the Middle East and Africa (the EMEA zone).
February
On February 24, Atos announced its 2015 annual results. The Group achieved all its financial
commitments and reinforced its position as an international leader in digital services with all the required
technologies and skills to be the trusted partner for the digital transformation of large organizations. Revenue was € 10,686 million, up +18% year-on-year and +0.4% organically. Operating margin was
€ 883.7 million, representing 8.3% of revenue, compared to 7.1% in 2014 at constant scope and exchange rates. The Group reported a record order entry at € 11.2 billion leading to a book to bill ratio of
105%. Full backlog increased by €+2.9 billion to € 19.1 billion, representing 1.7 year of revenue. Net ca sh
position was € 593 million at the end of 2015. Free cash flow was € 450 million in 2015 compared to € 367 million in 2014. Net income was € 437 million, up +55% year-on-year and net income Group share was €
406 million, up +53% compared to 2014. The Board of Directors decided to propose at the next Annual General Meeting of Shareholders a dividend in 2016 on the 2015 results of €1.10per share, up +38%
compared to prior year.
April
Atos revealed before industry executives and researchers on April 12, Bull sequana, the first exascale-class supercomputer offering a thousand times more performance than current petaflops -scale systems.
Taking the compute performance to a whole new level, Bull sequana will reach exascale level by 2020, processing a billion billion operations per second. Compared to existing systems for a given performance
level, Bull sequana is 10 times more energy-efficient and 10 times denser, to fully optimize our
sustainability targets and space-efficiency.
Numerous institutions and private companies throughout the world use Bull supercomputers to accelerate
research and innovation and maximize their competitiveness. Real-time security, personalized medicine, precision agriculture or meteorology ― just to name a few industries ― demand except ional levels of data
processing abilities that Bull sequana generation computers will provide. With greater computational power, meteorology services for instance will be able to provide extremely precise forecasts, predicting fog
patches and storms near and around airports.
Atos supercomputers’ high-data volume processing capabilities are also maximized within Atos’ Big Data services such as “Atos Codex”, an integrated end-to-end analytics solution including predictive computing
and cognitive analytics. Atos already offers its clients data processing and analytics end-to-end along the complete IT value chain.
On April 21, Atos announced its 2016 first quarter revenue. Revenue was € 2,757 million, up +1.6%
organically and +15.0% at constant exchange rates. Order entry was € 2,794 million leading to a book to bill ratio of 101%. Following the first quarter, Atos was confident in the achievement of all its 2016
objectives, driving profitable growth through high value technologies and innovative solutions.”
May
On May 23, Atos announced the certification of its Cloud Foundry multi-cloud platform by the Cloud Foundry Foundation which ensures application and skill portability across any cloud service, or on-
premises software based on Cloud Foundry. Atos actively participates in the industry's only certification program designed to establish reliable portability across platforms in a multi-vendor, multi-cloud
environment. Thanks to this certification, Atos joins a prestigious list of providers certified by the Cloud Foundry Foundation to deliver the leading multi-cloud platform. The Cloud Foundry Certified mark is only
8/108
awarded to products and services that meet the strict technical requirements outlined by the Foundation's
technical governing body. Products called “Cloud Foundry” can only use that designation after meeting Cloud Foundry Certification standards.
Atos SE held its 2016 Annual General Meeting on May 26. At this occasion, all resolutions submitted by the Board of Directors were approved. In particular, the General Meeting approved the annual and
consolidated accounts for the financial year ending December 31, 2015 and the dividend paymen t of €1.10
per share in either shares or cash. The General Meeting also renewed the terms of office of Directors of Ms. Aminata Niane, Ms. Lynn Paine, and Mr. Vernon Sankey.
Atos published on May 30, its 2015 Corporate Responsibility Integrated Report in accordance with the most demanding recommendations from the Global Reporting Initiative G4 comprehensive option and the
International Integrated Reporting Framework. With this approach, Atos demonstrates that its extra financial performance disclosures are accurate and exhaustive. All the information has been assured by an
external auditor and is gathered in two documents: the 2015 Corporate Responsibility Report and the
2015 Registration Document.
June
Atos launched on June 14, the Bull Battle Management System (BMS). Bull BMS is a complete solution
that optimizes real-time information sharing for land and air-land combat, throughout entire battalions (at
HQ, inside vehicles and for the dismounted soldiers) and for all mission types. A single system within battalions for all levels of the chain of command and all roles allows rapid creation of combined arms battle
groups, which can share information about the mission effectively, even in degraded network conditions.
July
On July 12, Atos and Xerox launched a new cloud-based “Business Process as a Service” (BPaaS) offering for clients streamlining their finance and accounting functions. The new service offers “Source -to-Pay”,
“Order-to-Cash”, and “Record-to-Report” and can be scaled to meet fluctuating demand and workloads. Complete with industry leading intelligence products to ensure internal controls, this ‘out-of-the-box’
service drives efficiency and up to 30 percent in cost savings. The service combines the strength of Xerox’s global finance and accounting capability with Atos technology and digital skills in systems integration to
provide a pay-as-you-go cloud-based service. The ready-to-go solution offers low upfront costs and no
requirement for additional infrastructure, meaning that clients can be using the service in a matter of weeks. The fully configured technology platform leverages the advanced functionality of Oracle Enterprise
Resource Planning Cloud to drive productivity, lower costs, and improve controls in the finance function.
Atos announced its financial results for the first half of 2016 on July 26. During the first half of the year,
Atos delivered very strong financial results materializing its strategy to leverage its leading position in
Infrastructure & Data Management in order to cross-sell the skills and expertise of all its divisions. Revenue was € 5,697 million, up +17.9% at constant exchange rates and +1.7% at constant scope and
exchange rates. Organic growth at +1.8% during the second quarter of 2016 reflected the sustainability of the revenue momentum. Order entry totaled € 6,309 million during the first half of 2016, up +24.0%
year-on-year and representing a book to bill ratio of 111%. Commercial activity remained strong in Q2 with a book to bill ratio of 120%. Operating margin was € 444.4 million, up +23.1% compared to H1 2015
operating margin and representing 7.8% of revenue, an improvement by +60 basis points at constant
scope and exchange rates. Net income was € 234 million including € 51 million for Worldline share in Visa Europe sold to Visa Inc.. Net income Group share reached € 205 million (including € 36 million Group
share for Visa), up +66.9% compared to H1 2015. Free cash flow totaled € 181 million during the first half of 2016, +74.2% compared to H1 2015 free cash flow. Further to free cash flow generation, payment of
Unify acquisition, dividend paid on 2015 results, and proceeds received from Visa Inc., Group net cash
position was € 412 million at the end of June 2016. Considering all of this, the Group raised all its objectives for 2016.
9/108
September
On September 12, Atos announced further strengthening its digital health services portfolio in the fast-
growing US healthcare market by having signed a share purchase agreement to acquire Anthelio Healthcare Solutions (Anthelio), the largest independent provider of healthcare technology solutions in
North America, for an enterprise value of US$275 million (8.5xEBIT post-synergies in 2017). This
acquisition, fully financed by cash, uniquely positions Atos to reach a broader customer base in the U.S. healthcare market by strengthening the scale and scope of its services. The combined organization will
support Atos customers’ need to better optimize financial performance, improve the patient care experience, engage patients through state-of-the-art applications and address the increasing demands of
security, risk and compliance.
Atos announced on September 26, having been ranked n°1 as the most sustainable company in its
industry group in the Dow Jones Sustainability Index (DJSI) World and Europe, on the occasion of the
publication of the results 2016 compiled by RobecoSAM. Atos ranked first in the IT Software & Services Group, which includes about 200 companies worldwide. Atos got the very high total score of 84 points out
of a maximum of 100 points with an increased note in most of the factors under economic, environmental and social categories. This is the fifth consecutive year that Atos has been selected as a member of the
Dow Jones Sustainability Indices.
Still on September 26, Atos announced the opening of a new Security Operations Center (SOC) in Romania, further expanding its current global footprint to proactively respond to an increasing market
need in cybersecurity. Security needs are growing steadily due to the data deluge and mobility. Customers require continuous access to security expertise and need a partner that is capable of catering to their
growing and fast-changing security needs as driven by their digital transformation. The opening of the Security Operations Center in Timisoara, Romania, supports significantly the rapid growth of Atos global
customer base. The new SOC already provides protection, detection, and response security services to
over 20 global customers, completing furthermore assistance to Atos’ worldwide clients in their secure digital transformation.
Atos announced on September 29, the placement with European institutional investors of a Euro private placement bond for a total amount of €300 million, maturing in October 2023 (7 years) and with 1.444%
fixed interest rate. There is no financial covenant related to this issue. Atos and the bonds are unrated.
Atos decided to seize current favorable European private placement market conditions and to use the proceeds from the issue for general corporate purposes.
On September 30, after the successful completion of the regulatory approval processes in the Netherlands and in Belgium during the summer, Worldline announced the completion of the transaction
that was presented on November 3, 2015 with Equens Group, a prominent European payment services provider, headquartered in Utrecht, Netherlands, building an industrial Pan-European champion in
payment services. The successful completion of the merger of Equens and Paysquare within Worldline was
a major development for Atos to better serve both the banking and merchant communities and is fully in line with the strategy to consolidate the European payment market. Through the transaction, Worldline
benefits from a highly comprehensive Pan-European footprint and has increased its revenue size by c.+65% in Financial Processing and by c.+25% in Commercial Acquiring.
October
On October 5, Atos unveiled its new product Evidian Identity Governance and Administration. It becomes
the Atos solution for the Identity and Access Governance Market. Designed for medium and large organizations, the solution offers customers worldwide modern User and Rights lifecycle management
processes, as well as Risk and Governance tools to reduce operational risks and adhere to compliance
requirements. End users and managers are empowered with a richer interface; having access from a central cockpit to all the actions related to identity, rights and processes monitoring.
Atos announced its revenue for the third quarter of 2016 October 20. During the third quarter, the Group continued to grow organically in all of its businesses with in particular a solid performance in the UK post
Brexit and in North America, as well as in Continental Europe. Atos continued to experience dynamic commercial activity delivering a high level of new bookings, in particular with strong momentum in
defense and security. Revenue was € 2,777 million, up +1.8% organically and +6.3% at constant
exchange rates. Order entry was € 2,845 million leading to a record book to bill ratio for a Q3 at 102%. Over the first nine months of the year, revenue growth reached +1.7% organically and +13.8% at
constant exchange rates.
10/108
November
Atos launched on November 6, "Atos Quantum", an ambitious quantum computing industry program to
develop quantum computing solutions that offer unprecedented computing power, while enhancing its cyber security products to face with these new technologies. The program was reviewed and launched in
the presence of world-renowned quantum physicists and mathematicians. Atos Quantum targets notably
the development of a quantum simulation platform to enable researchers to test, as of now, algorithms and software for future quantum computers. Atos Quantum fits into Atos’ rich technological ecosystem.
The Group already has 15 R&D centres and has created a new quantum research and development laboratory in France, near Paris, with a dedicated quantum team. Atos Quantum also benefits from the
dynamics of the Group in supercomputing, numerical simulation and cyber security. To simulate quantum computing, Atos Quantum can already rely on the computing power of the Bull sequana supercomputer,
launched in April 2016, and its program to achieve exaflop performance - 1 billion billion operations per
second. Quantum computation is expected in the next decades to confront the explosion of data generated by the Big Data and the Internet of Things revolution. It should also generate significant advances in deep
learning and artificial intelligence. To move forward on these critical issues, Atos intends to set up several partnerships with research centers and universities worldwide.
During the Investor Day held in its Headquarters in Bezons (France) on November 8, Atos presented to
the financial community its new 3-year plan “2019 Ambition”. This Strategic plan aims at accompanying the Group’s customers in their digital transformation within a secured cyberspace, to consolidate Atos’
leadership in Infrastructure & Data Management and capitalize on the Group’s unique offers in Big data, Cybersecurity, payments and Business & Platform Solutions, to support a solid growth for the next 3
years.
Atos and Siemens announced on November 17, having decided to further strengthen their strategic
alliance. The companies will further increase the funding of their joint innovation investment program by
an additional €80 million to €230 million. On the fifth anniversary of the Atos -Siemens Alliance in late October, the Alliance Board expressed their satisfaction about the performance of the business
collaboration, which continues over-achieving the expectations by far. Leveraging on the increased funding the two companies have the ambition to further accelerate their joint business until 2020. The new funding
will be focused to explore further opportunities for joint collaborations in the fields of Industrial Security,
Industrial Data Analytics, Machine Intelligence, Service Enhancing Technologies and Internet of Things.
December
Atos announced on December 7, that bullion, its high-end enterprise x86 server, is now certified for
operating the SAP HANA® platform up to 16TB. The modular and ultra-flexible architecture helps simplify
operations and improve business productivity and IT efficiency. Clients can easily upscale and personalize their in-memory needs over time with this scalable server that can handle up to 16 TeraBytes (TB) of
memory. Today Atos is one of the only two players worldwide delivering a certified platform over 8TB.
11/108
B FINANCIALS
B.1 Operational review
B.1.1 Executive summary
Revenue in 2016 reached € 11,717 million, +9.7% compared to 2015 on a statutory basis (+12.8% at
constant exchange rates) and +1.8% organically. The Group reached a +1.8% organic growth in the second semester of 2016 with a fourth quarter hitting +1.9%, continuing the positive trend observed in
the first semester. In addition to the organic growth which strongly improved compared to last year, the
year-on-year growth benefitted from the contribution of Xerox ITO acquired in July 2015, Unify since February 2016, of which only the Communication & Collaboration Services (CCS) business has been
transferred to Atos continuing operations, more specifically to Infrastructure & Data Management (IDM), and is included in the figures presented hereafter. The Group also benefitted from the acquisitions
completed at the end of Q3, in North America with Anthelio, and Equens, Paysquare and Kormercni
Smartpay by Worldline. The Unify Software and Platforms (S&P) business has been accounted for as discontinued operations from the date of acquisition and is therefore not consolidated in the figures
presented in the operational review. Currency exchange rates negatively contributed to revenue for a total of €-299 million, mainly coming from the British pound depreciating versus the Euro while American dollar
had almost no effect on a full year basis.
Operating margin reached € 1,104 million in 2016, up +24.9% year-on-year mainly thanks to
productivity gains from industrialization programs, the effect of recent acquisitions and related costs
synergies, notably Bull, Xerox ITO and Unify CCS which impacted positively IDM, as well as the organic growth acceleration. Profitability reached 9.4% of revenue, +110 bps compared to 8.3% in 2015 at
constant scope and exchange rates. The improvement even increased to +140bps excluding pension one-offs, as the amount recorded in the second semester of 2016 was comparable to that recorded in the
second half of the prior year, and over the full year that amount was close to half of the amount recorded
over the full year 2015, as planned.
Representing 56% of the Group activity, Infrastructure & Data Management (IDM) revenue reached
€ 6,595 million, up +16.6% year-on-year. At constant scope and exchange rates, revenue grew by +0.9% in 2016 (vs +0.4% in 2015) with an accelerated growth of +1.1% in the second half (vs +0.6% in the first
semester). The Division continued the transformation of classic infrastructure to cloud based environment. Revenue significantly increased in transitional and transformation services as well as new services such as
cloud orchestration. These additional services together with volume increases and market share gains
largely offset unit price decreases from hybrid cloud transformation. This trend materialized particularly in North America with a strong commercial dynamism fueled by increased volumes in cloud with several long
standing but also new large customers within Public & Health and Telecom, Media & Utilities sectors . Germany confirmed the healthy trend recorded in the first semester within all markets. Asia Pacific also
contributed to growth mostly thanks to higher volumes in Financial Services and in the Telco, Media &
Utilities. In the UK, after a first semester where growth was affected by an unfavorable comparison basis (NS&I outstanding volumes in 2015), the Business Unit generated a +4.5% revenue organic growth in the
second half thanks to the increasing activity in the public sector with large ministries. The situation was more challenging for Benelux & The Nordics, notably due to ending contracts mainly in Financial Services,
and to a lesser extent in France and Central & Eastern Europe.
Operating margin in Infrastructure & Data management was €682.9 million, representing 10.4% of
revenue. This strong improvement of +190 basis points compared to 2015 came from the top line
improvement as well as continued significant savings throughout all geographies. In particular, the successful migration to the Cloud of several customers’ infrastructure generated significant unit cost
reductions. The Division also benefitted from the successful execution of the large Unify restructuring program which enhanced the operating margin of the IDM CCS activities.
Representing 27% of the Group’s activity, Business & Platform Solutions (B&PS) revenue was € 3,194
million in 2016, up +0.8% organically at constant scope and exchange rates. The Division even increased its revenue by +1.2% in the fourth quarter. The improvements mainly came from Germany and France
growing in all markets. “Other Business Units” faced the base effect of one major contract delivered in 2015 in the Public sector in Turkey. The business acceleration was fueled by new contracts in Digital
Transformation with several large clients such as Aegon, University College London Hospital and Western Australian Governement.
12/108
Operating margin was € 206.1 million, representing 6.5% of revenue. The improvement of +20 basis
points compared to last year at constant scope and exchange rates (+40 basis points excluding pension effects) was mainly attributable to the successful workforce improvement actions in most of the large
European geographies. The Division continued to increase its competitiveness through Global delivery and offshoring mainly with international private companies on both large projects and Application
Management. Besides, Germany strongly increased its operating margin thanks to its recovery on top line
(compared to prior year) and from the strong improvement in productivity. Overall, this first step of profitability turnaround of the Division was achieved while investing in innovation and new offerings to
enhance the planned operating margin catch up.
Revenue in Big Data & Cybersecurity (BDS) was € 666 million in 2016, up +12.8% organically,
representing 5.7% of the Group’s revenues. Initially based in France and to a lesser extent in Germany, the business was expended to most of the geographies with an increasing contribution from the private
sector. The demand for High Performance Computing remained very strong in order to support the
growing Big Data processing needs of customers, as well as the classic offerings in encryption, identity and access management, and intrusion testing solutions. The demand increased for security operating centers
protecting customers on a worldwide basis and 24 hours a day.
Operating margin was € 111.9 million, representing 16.8% of revenue. The Division managed to keep this
high level of operational profitability while focusing on top line in order to benefit from the growing market
demand.
Worldline’s contribution to the Group’s revenue in 2016 was € 1,261 million, growing organically by €
45.5 million or +3.7%. Merchant Services & Terminals grew by +7.4%, thanks to a double digit growth in Commercial Acquiring in Benelux and also in India and Central Europe and to the dynamic of payment
terminals. Revenue in Financial Processing & Software Licensing grew by +4.8%, driven by more transaction volumes and customer projects. Lastly, revenue in Mobility and e -Transactional Services
declined by -2.3%; while revenue was impacted by the termination of two historical contracts, the
Business Line managed to successfully sell its offerings in e-Ticketing, in contact and connectivity solutions and in services with governments.
Operating margin was €196.9 million, up +130bp. This improvement was recorded mainly in the Merchant Services & Terminals Business Line, thanks to growing volumes and a favorable pricing mix mainly in
Belgium, as well as a margin improvement in the UK on private label cards contracts. Increasing volumes
in card processing supported the operating margin of Financial Processing & Software Licensing while the Business Line continued to invest in security infrastructure. Mobility & e-Transactional Services new
business almost offsetting the two terminated contracts was generated with a lower operating margin.
In 2016, Germany, North America, Worldline, France and “Other Business Units” contributed to the Group
revenue organic growth:
Germany confirmed its recovery with +5.3% organic growth, turning back to healthy growth in
all Divisions, with a strong organic growth, notably thanks to new major deals won in
Infrastructure & Data Management and strong actions undertaken in Business & Platform Solutions by the new management;
North America was up +4.5%, benefitting from a solid trend maintained all over the year, notably with the sales dynamic in migration to Orchestrated Hybrid Cloud and the full effect of
Xerox ITO sales synergies program;
Worldline continued to contribute to the Group organic growth with +3.7% over the period, the sustained dynamic of its core payment businesses compensating for the effect of the two
contracts terminated last year;
France reached a solid +2.3% organic growth rate, fueled in particular by the strong demand for
Big Data & Cybersecurity solutions;
“Other Business Units” also positively contributed to the Group revenue growth, thanks to
double digit growth in Asia Pacific, Middle East & Africa, and South America.
UK & Ireland was almost stable. The high growth during the second half of the year (+4.5%) offset the first half base effect thanks to a strong activity in the Public sector with contract ramp-ups and increased
volumes and projects.
The situation remained challenging for Benelux & The Nordics. 2016 was impacted by the ramp-down of
contracts not renewed in 2015 in the Infrastructure & Data Management business, mainly in Financial
Services. The new management team appointed in the Summer actively focused on the Business Unit recovery.
13/108
In 2016, the Group continued to execute the Tier One Program through industrialization, global delivery
from offshore locations, and continuous optimization of SG&A. In addition, the Group benefitted from the full impact of costs synergies following the integration of Bull and Xerox ITO, coupled with the effect of the
Unify restructuring plan on the CCS activities profitability. The margin improvement was particularly visible in large Business Units such as Germany, North America, the UK and also France, while Benelux & the
Nordics faced decreasing margins coming from a lower level of activity across most Divisions.
Global structures costs for IT Services as a percentage of revenue increased by +20 basis points compared to 2015 at constant scope and exchange rates, mostly due the positive effect recorded in H1 2015 for
pension plan optimization.
In 2016, the Group continued to execute its pension schemes optimization plan which resulted in a € 41
million one-off gain (recorded in H2 in the UK), compared to € 74 million in 2015.
Globally, the Group improved its operating margin rate by +110 basis points in 2016. The improvement
was +140 basis points excluding pension schemes optimization one-offs both in 2015 and in 2016.
In 2016, the Group order entry totaled € 13,027 million, up +16.2% year-on-year, representing a book to bill ratio of 111%, consistent between the first and second semesters, and notably 119% in
the fourth quarter.
The main new contracts signed over the period were in Infrastructure & Data Management (reaching a
book to bill at 109%), with notably Rheinmetall, Siemens and Nokia (spread over the different Group’s
Divisions) in Germany, Aegon and the University College London Hospital in the UK, and Monsanto and Ashland in North America. Business & Platform Solutions (with a book to bill at 114%) signed new
contracts notably with T-Mobile in the Benelux & The Nordics, La Poste in France, Deutsche Bank in the UK and with Polimeks in Central & Eastern Europe. Big Data & Cybersecurity continued its sales momentum
reaching a healthy 130% book to bill ratio in 2016, while Worldline managed to achieve 106% over the period, with new contracts in the Public sector and in Financial Services mainly.
Renewals of the year included large contracts in Infrastructure & Data Management such as the extensions
of the PIP contract with the Department for Work and Pensions in the UK, the Texas Department of Information Resources and McDonald’s in the US, and Siemens in Germany. Worldline sales dynamic was
also strong in particular with the renewal of several Issuing Processing contracts mainly in Germany.
In line with this positive evolution of Atos commercia l activity, the full backlog at the end of December
2016 increased by € 2.8 billion compared to December 2015 including the integration of the acquisitions,
and amounted to € 21.4 billion, representing 1.8 year of revenue compared to 1.7 year of revenue at the end of 2015. The full qualified pipeline was € 6.5 billion at the end of 2016 including the integration of
the acquisitions, up +4.9% compared to the end of December 2015.
The total headcount was 100,096 at the end of December 2016. The increase of +9.6% of the Group
workforce compared to 91,322 at the end of December 2015 was mainly due to the staff who joined the Group from Unify (both CCS and S&P) on February 1, 2016, and from Equens, PaySquare, KB Smartpay
and Anthelio on October 1, 2016.
Attrition was 12.3% at Group level of which 19.1% in offshore countries.
The number of direct employees at the end of 2016 was 92,785, representing 92.7% of the total Group
headcount, compared to 93.7% at the end of 2015. Indirect staff increased by +26.8% during the period; adjusted from the scope effect from Unify mainly, indirect staff decreased by -5.8%, in line with
the continuous optimization of the indirect workforce.
14/108
B.1.2 Statutory to constant scope and exchange rates reconciliation
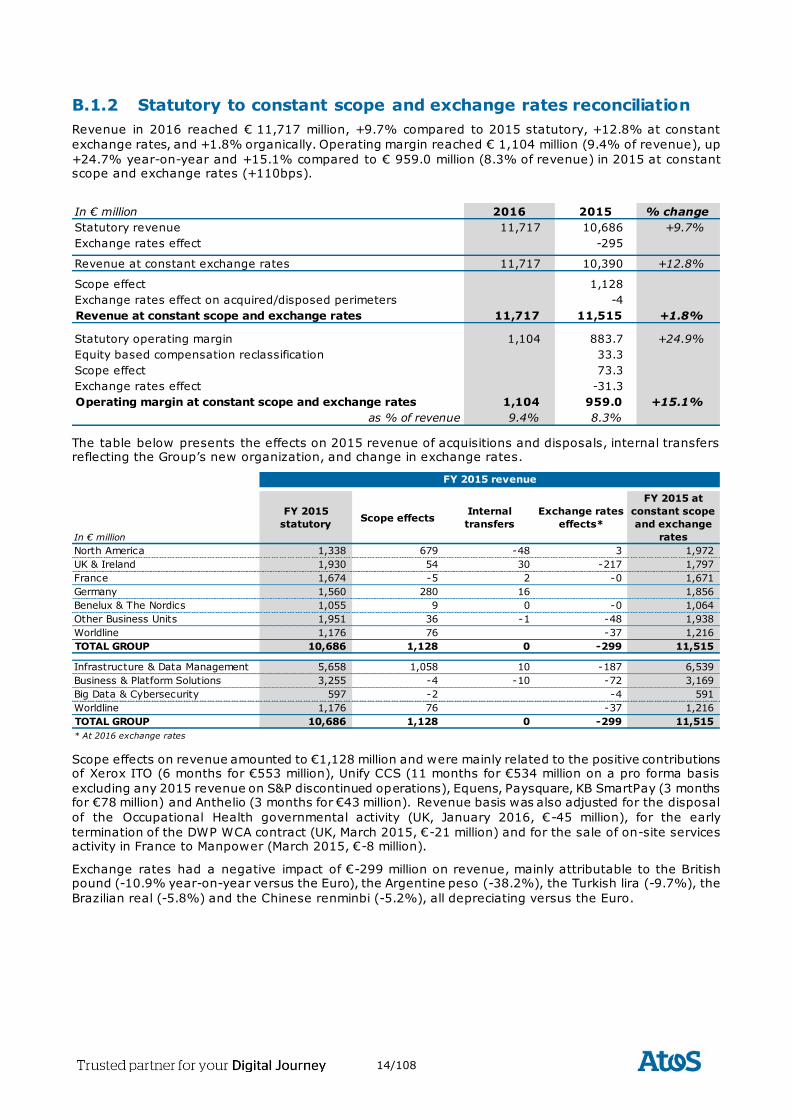
Revenue in 2016 reached € 11,717 million, +9.7% compared to 2015 statutory, +12.8% at constant
exchange rates, and +1.8% organically. Operating margin reached € 1,104 million (9.4% of revenue), up
+24.7% year-on-year and +15.1% compared to € 959.0 million (8.3% of revenue) in 2015 at constant scope and exchange rates (+110bps).
The table below presents the effects on 2015 revenue of acquisitions and disposals, internal transfers reflecting the Group’s new organization, and change in exchange rates.
Scope effects on revenue amounted to €1,128 million and were mainly related to the positive contributions of Xerox ITO (6 months for €553 million), Unify CCS (11 months for €534 million on a pro forma basis
excluding any 2015 revenue on S&P discontinued operations), Equens, Paysquare, KB SmartPay (3 months for €78 million) and Anthelio (3 months for €43 million). Revenue basis was also adjusted for the disposal
of the Occupational Health governmental activity (UK, January 2016, €-45 million), for the early
termination of the DWP WCA contract (UK, March 2015, €-21 million) and for the sale of on-site services activity in France to Manpower (March 2015, €-8 million).
Exchange rates had a negative impact of €-299 million on revenue, mainly attributable to the British pound (-10.9% year-on-year versus the Euro), the Argentine peso (-38.2%), the Turkish lira (-9.7%), the
Brazilian real (-5.8%) and the Chinese renminbi (-5.2%), all depreciating versus the Euro.
In € million 2016 2015 % change
Statutory revenue 11,717 10,686 +9.7%
Exchange rates effect -295
Revenue at constant exchange rates 11,717 10,390 +12.8%
Scope effect 1,128
Exchange rates effect on acquired/disposed perimeters -4
Revenue at constant scope and exchange rates 11,717 11,515 +1.8%
Statutory operating margin 1,104 883.7 +24.9%
Equity based compensation reclassification 33.3
Scope effect 73.3
Exchange rates effect -31.3
Operating margin at constant scope and exchange rates 1,104 959.0 +15.1%
as % of revenue 9.4% 8.3%
In € million
FY 2015
statutoryScope effects
Internal
transfers
Exchange rates
effects*
FY 2015 at
constant scope
and exchange
rates
North America 1,338 679 -48 3 1,972
UK & Ireland 1,930 54 30 -217 1,797
France 1,674 -5 2 -0 1,671
Germany 1,560 280 16 1,856
Benelux & The Nordics 1,055 9 0 -0 1,064
Other Business Units 1,951 36 -1 -48 1,938
Worldline 1,176 76 -37 1,216
TOTAL GROUP 10,686 1,128 0 -299 11,515
Infrastructure & Data Management 5,658 1,058 10 -187 6,539
Business & Platform Solutions 3,255 -4 -10 -72 3,169
Big Data & Cybersecurity 597 -2 -4 591
Worldline 1,176 76 -37 1,216
TOTAL GROUP 10,686 1,128 0 -299 11,515
* At 2016 exchange rates
FY 2015 revenue
15/108
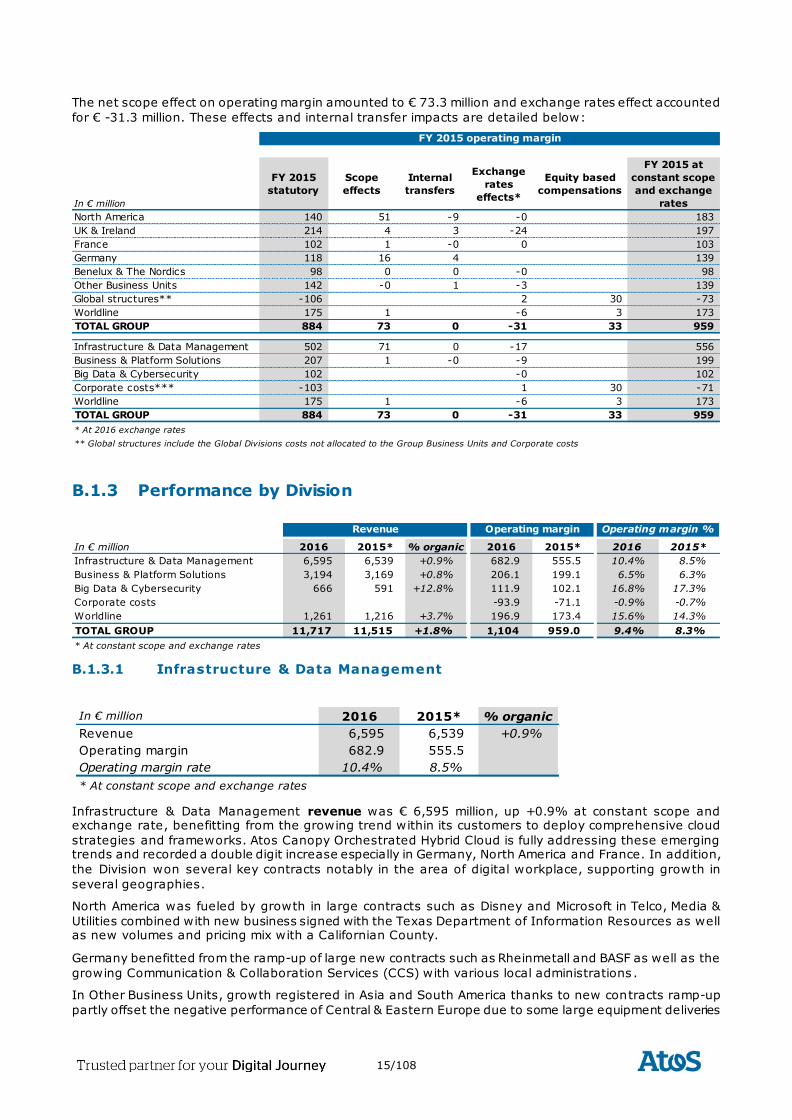
The net scope effect on operating margin amounted to € 73.3 million and exchange rates effect accounted
for € -31.3 million. These effects and internal transfer impacts are detailed below:
B.1.3 Performance by Division
B.1.3.1 Infrastructure & Data Management
Infrastructure & Data Management revenue was € 6,595 million, up +0.9% at constant scope and exchange rate, benefitting from the growing trend within its customers to deploy comprehensive cloud
strategies and frameworks. Atos Canopy Orchestrated Hybrid Cloud is fully addressing these emerging trends and recorded a double digit increase especially in Germany, North America and France. In addition,
the Division won several key contracts notably in the area of digital workplace, supporting growth in
several geographies.
North America was fueled by growth in large contracts such as Disney and Microsoft in Telco, Media &
Utilities combined with new business signed with the Texas Department of Information Resources as well as new volumes and pricing mix with a Californian County.
Germany benefitted from the ramp-up of large new contracts such as Rheinmetall and BASF as well as the
growing Communication & Collaboration Services (CCS) with various local administrations .
In Other Business Units, growth registered in Asia and South America thanks to new contracts ramp-up
partly offset the negative performance of Central & Eastern Europe due to some large equipment deliveries
In € million
FY 2015
statutory
Scope
effects
Internal
transfers
Exchange
rates
effects*
Equity based
compensations
FY 2015 at
constant scope
and exchange
rates
North America 140 51 -9 -0 183
UK & Ireland 214 4 3 -24 197
France 102 1 -0 0 103
Germany 118 16 4 139
Benelux & The Nordics 98 0 0 -0 98
Other Business Units 142 -0 1 -3 139
Global structures** -106 2 30 -73
Worldline 175 1 -6 3 173
TOTAL GROUP 884 73 0 -31 33 959
Infrastructure & Data Management 502 71 0 -17 556
Business & Platform Solutions 207 1 -0 -9 199
Big Data & Cybersecurity 102 -0 102
Corporate costs*** -103 1 30 -71
Worldline 175 1 -6 3 173
TOTAL GROUP 884 73 0 -31 33 959
* At 2016 exchange rates
** Global structures include the Global Divisions costs not allocated to the Group Business Units and Corporate costs
FY 2015 operating margin
In € million 2016 2015* % organic 2016 2015* 2016 2015*
Infrastructure & Data Management 6,595 6,539 +0.9% 682.9 555.5 10.4% 8.5%
Business & Platform Solutions 3,194 3,169 +0.8% 206.1 199.1 6.5% 6.3%
Big Data & Cybersecurity 666 591 +12.8% 111.9 102.1 16.8% 17.3%
Corporate costs -93.9 -71.1 -0.9% -0.7%
Worldline 1,261 1,216 +3.7% 196.9 173.4 15.6% 14.3%
TOTAL GROUP 11,717 11,515 +1.8% 1,104 959.0 9.4% 8.3%
* At constant scope and exchange rates
Revenue Operating margin Operating margin %
In € million 2016 2015* % organic
Revenue 6,595 6,539 +0.9%
Operating margin 682.9 555.5
Operating margin rate 10.4% 8.5%
* At constant scope and exchange rates
16/108
recorded in the prior year in the public sector in Slovakia. In the UK, ramp-up in new contracts and
additional volumes with existing clients did not fully compensate for the base effect in the first half of 2015 related to outstanding sales and high volumes with NS&I and BBC.
Finally, France almost achieved to stabilize its revenue, and Benelux & the Nordics was still facing difficulties, notably in Financial Services.
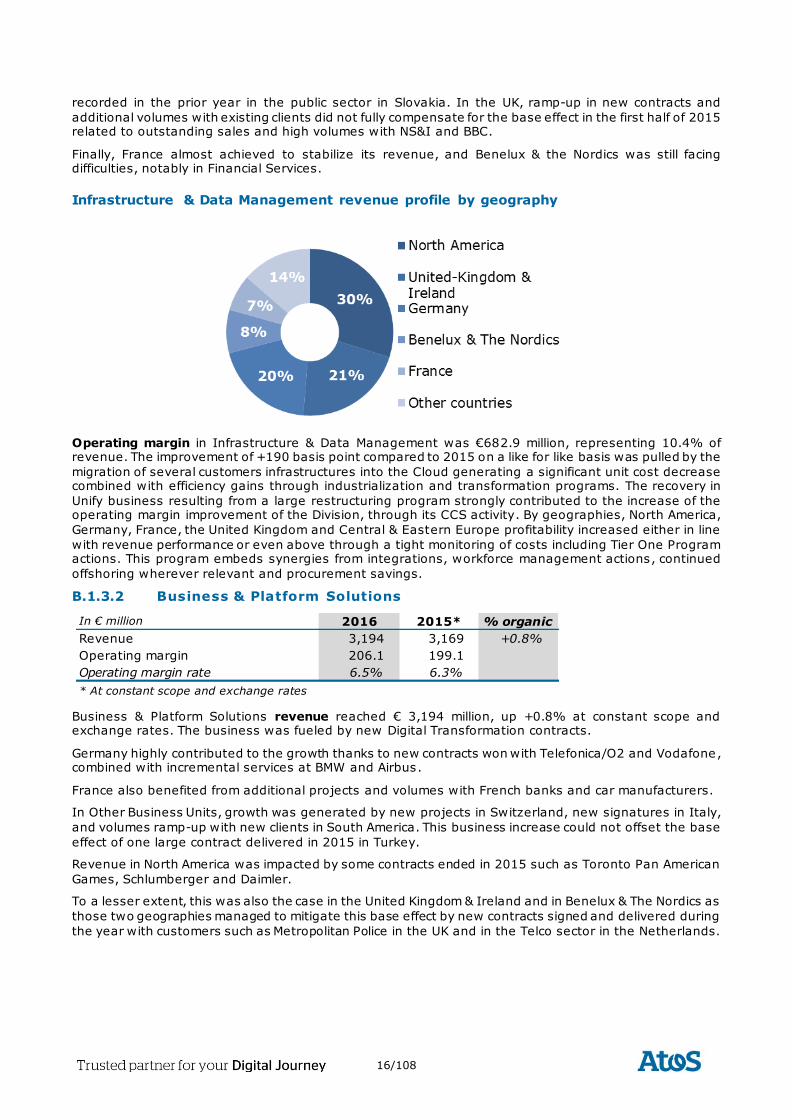
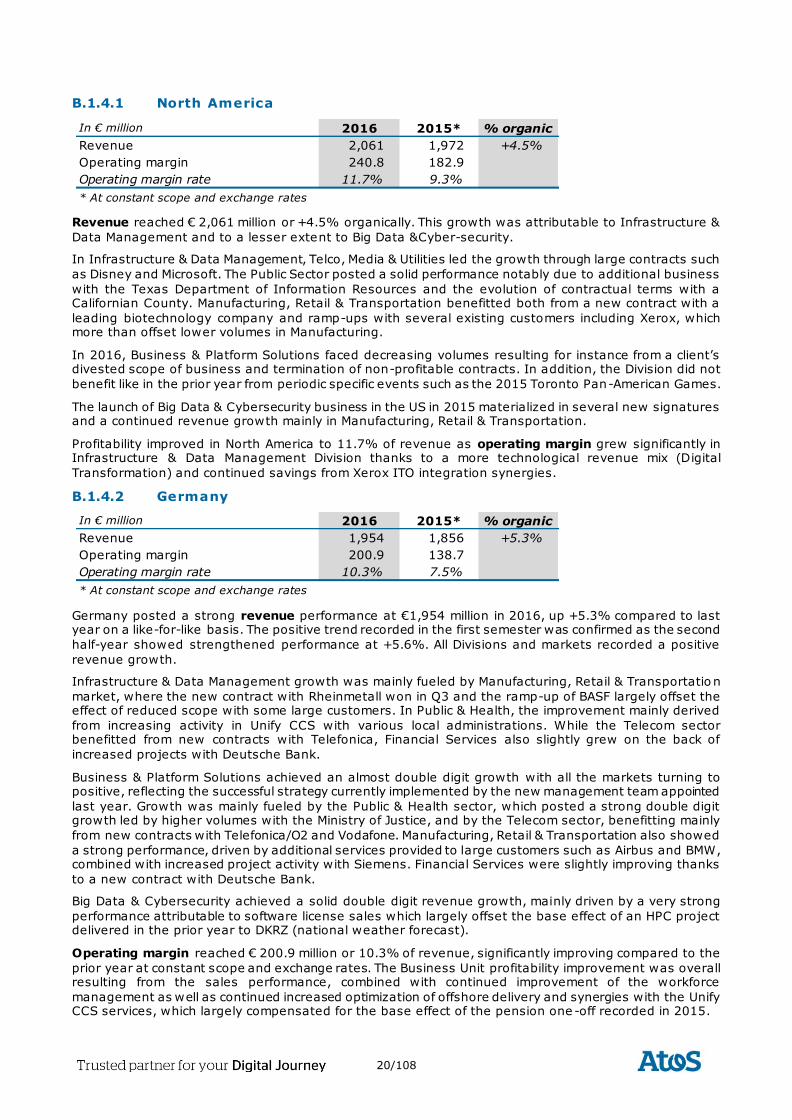
Infrastructure & Data Management revenue profile by geography
Operating margin in Infrastructure & Data Management was €682.9 million, representing 10.4% of revenue. The improvement of +190 basis point compared to 2015 on a like for like basis was pulled by the
migration of several customers infrastructures into the Cloud generating a significant unit cost decrease combined with efficiency gains through industrialization and transformation programs. The recovery in
Unify business resulting from a large restructuring program strongly contributed to the increase of the operating margin improvement of the Division, through its CCS activity. By geographies, North America,
Germany, France, the United Kingdom and Central & Eastern Europe profitability increased either in line
with revenue performance or even above through a tight monitoring of costs including Tier One Program actions. This program embeds synergies from integrations, workforce management actions, continued
offshoring wherever relevant and procurement savings.
B.1.3.2 Business & Platform Solutions
Business & Platform Solutions revenue reached € 3,194 million, up +0.8% at constant scope and exchange rates. The business was fueled by new Digital Transformation contracts.
Germany highly contributed to the growth thanks to new contracts won with Telefonica/O2 and Vodafone, combined with incremental services at BMW and Airbus.
France also benefited from additional projects and volumes with French banks and car manufacturers.
In Other Business Units, growth was generated by new projects in Switzerland, new signatures in Italy,
and volumes ramp-up with new clients in South America. This business increase could not offset the base
effect of one large contract delivered in 2015 in Turkey.
Revenue in North America was impacted by some contracts ended in 2015 such as Toronto Pan American
Games, Schlumberger and Daimler.
To a lesser extent, this was also the case in the United Kingdom & Ireland and in Benelux & The Nordics as
those two geographies managed to mitigate this base effect by new contracts signed and delivered during
the year with customers such as Metropolitan Police in the UK and in the Telco sector in the Netherlands.
In € million 2016 2015* % organic
Revenue 3,194 3,169 +0.8%
Operating margin 206.1 199.1
Operating margin rate 6.5% 6.3%
* At constant scope and exchange rates
17/108
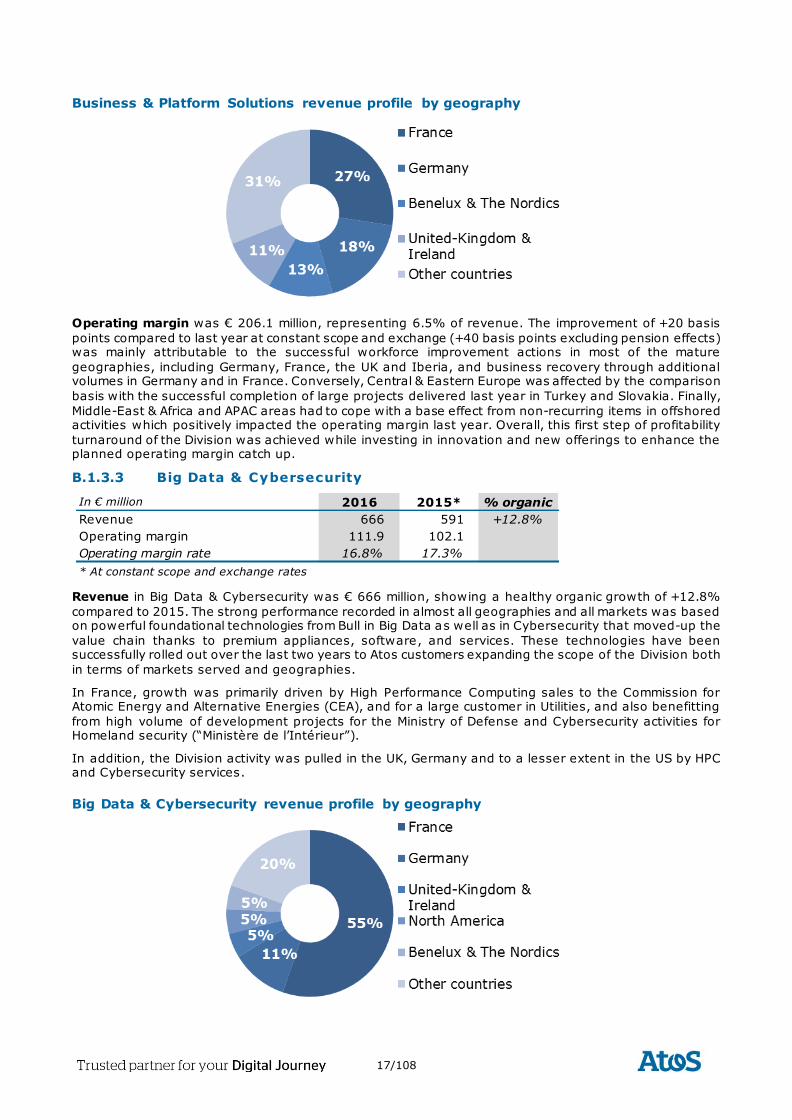
Business & Platform Solutions revenue profile by geography
Operating margin was € 206.1 million, representing 6.5% of revenue. The improvement of +20 basis
points compared to last year at constant scope and exchange (+40 basis points excluding pension effects) was mainly attributable to the successful workforce improvement actions in most of the mature
geographies, including Germany, France, the UK and Iberia, and business recovery through additional volumes in Germany and in France. Conversely, Central & Eastern Europe was affected by the comparison
basis with the successful completion of large projects delivered last year in Turkey and Slovakia. Finally,
Middle-East & Africa and APAC areas had to cope with a base effect from non-recurring items in offshored activities which positively impacted the operating margin last year. Overall, this first step of profitability
turnaround of the Division was achieved while investing in innovation and new offerings to enhance the planned operating margin catch up.
B.1.3.3 Big Data & Cybersecurity
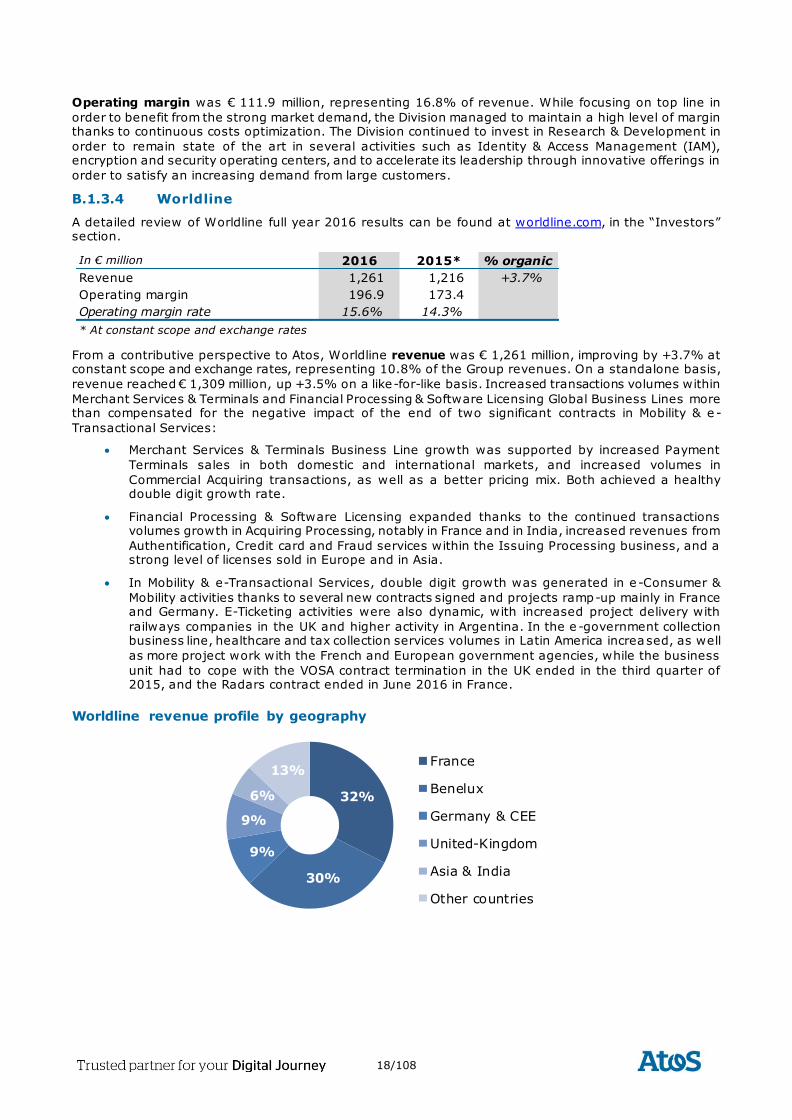
Revenue in Big Data & Cybersecurity was € 666 million, showing a healthy organic growth of +12.8%
compared to 2015. The strong performance recorded in almost all geographies and all markets was based on powerful foundational technologies from Bull in Big Data as well as in Cybersecurity that moved-up the
value chain thanks to premium appliances, software, and services. These technologies have been successfully rolled out over the last two years to Atos customers expanding the scope of the Division both
in terms of markets served and geographies.
In France, growth was primarily driven by High Performance Computing sales to the Commission for Atomic Energy and Alternative Energies (CEA), and for a large customer in Utilities, and also benefitting
from high volume of development projects for the Ministry of Defense and Cybersecurity activities for Homeland security (“Ministère de l’Intérieur”).
In addition, the Division activity was pulled in the UK, Germany and to a lesser extent in the US by HPC and Cybersecurity services.
Big Data & Cybersecurity revenue profile by geography
In € million 2016 2015* % organic
Revenue 666 591 +12.8%
Operating margin 111.9 102.1
Operating margin rate 16.8% 17.3%
* At constant scope and exchange rates
18/108
Operating margin was € 111.9 million, representing 16.8% of revenue. While focusing on top line in
order to benefit from the strong market demand, the Division managed to maintain a high level of margin thanks to continuous costs optimization. The Division continued to invest in Research & Development in
order to remain state of the art in several activities such as Identity & Access Management (IAM), encryption and security operating centers, and to accelerate its leadership through innovative offerings in
order to satisfy an increasing demand from large customers.
B.1.3.4 Worldline
A detailed review of Worldline full year 2016 results can be found at worldline.com, in the “Investors” section.
From a contributive perspective to Atos, Worldline revenue was € 1,261 million, improving by +3.7% at constant scope and exchange rates, representing 10.8% of the Group revenues. On a standalone basis,
revenue reached € 1,309 million, up +3.5% on a like-for-like basis. Increased transactions volumes within
Merchant Services & Terminals and Financial Processing & Software Licensing Global Business Lines more than compensated for the negative impact of the end of two significant contracts in Mobility & e -
Transactional Services:
Merchant Services & Terminals Business Line growth was supported by increased Payment
Terminals sales in both domestic and international markets, and increased volumes in
Commercial Acquiring transactions, as well as a better pricing mix. Both achieved a healthy double digit growth rate.
Financial Processing & Software Licensing expanded thanks to the continued transactions volumes growth in Acquiring Processing, notably in France and in India, increased revenues from
Authentification, Credit card and Fraud services within the Issuing Processing business, and a strong level of licenses sold in Europe and in Asia.
In Mobility & e-Transactional Services, double digit growth was generated in e-Consumer &
Mobility activities thanks to several new contracts signed and projects ramp-up mainly in France and Germany. E-Ticketing activities were also dynamic, with increased project delivery with
railways companies in the UK and higher activity in Argentina. In the e -government collection business line, healthcare and tax collection services volumes in Latin America increased, as well
as more project work with the French and European government agencies, while the business
unit had to cope with the VOSA contract termination in the UK ended in the third quarter of 2015, and the Radars contract ended in June 2016 in France.
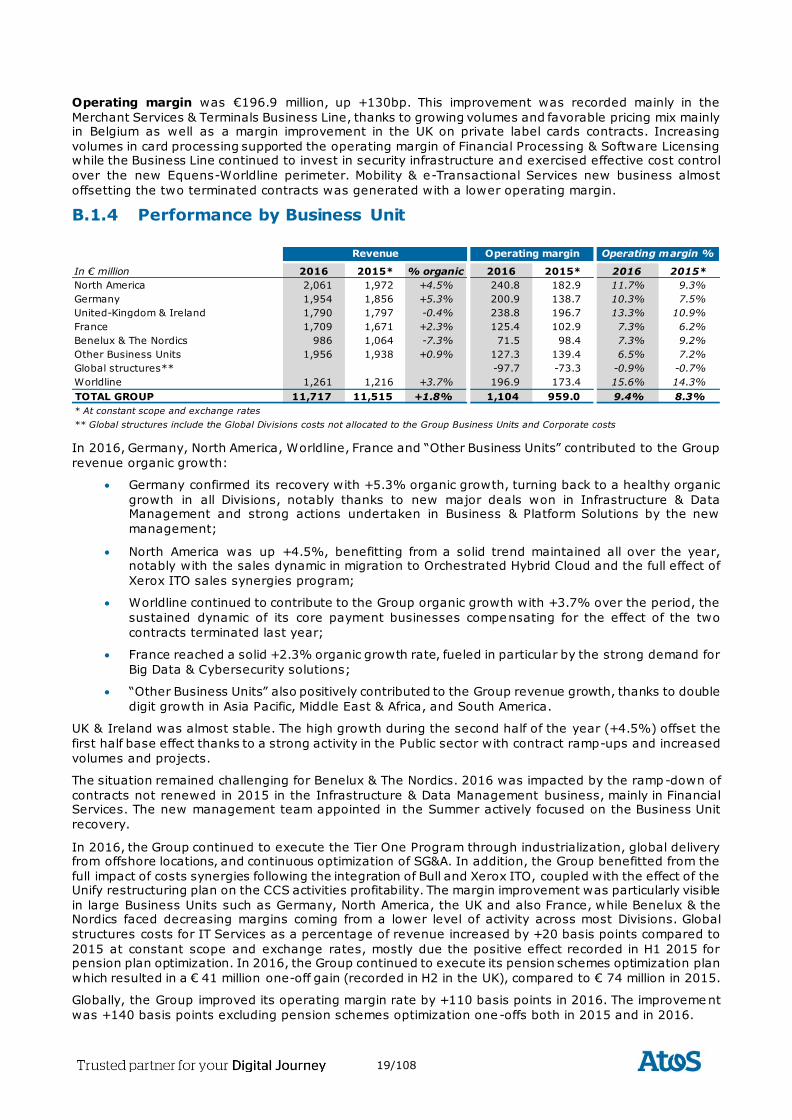
Worldline revenue profile by geography
In € million 2016 2015* % organic
Revenue 1,261 1,216 +3.7%
Operating margin 196.9 173.4
Operating margin rate 15.6% 14.3%
* At constant scope and exchange rates
32%
30%
9%
9%
6%
13% France
Benelux
Germany & CEE
United-Kingdom
Asia & India
Other countries
19/108
Operating margin was €196.9 million, up +130bp. This improvement was recorded mainly in the
Merchant Services & Terminals Business Line, thanks to growing volumes and favorable pricing mix mainly in Belgium as well as a margin improvement in the UK on private label cards contracts. Increasing
volumes in card processing supported the operating margin of Financial Processing & Software Licensing while the Business Line continued to invest in security infrastructure and exercised effective cost control
over the new Equens-Worldline perimeter. Mobility & e-Transactional Services new business almost
offsetting the two terminated contracts was generated with a lower operating margin.
B.1.4 Performance by Business Unit
In 2016, Germany, North America, Worldline, France and “Other Business Units” contributed to the Group
revenue organic growth:
Germany confirmed its recovery with +5.3% organic growth, turning back to a healthy organic
growth in all Divisions, notably thanks to new major deals won in Infrastructure & Data Management and strong actions undertaken in Business & Platform Solutions by the new
management;
North America was up +4.5%, benefitting from a solid trend maintained all over the year, notably with the sales dynamic in migration to Orchestrated Hybrid Cloud and the full effect of
Xerox ITO sales synergies program;
Worldline continued to contribute to the Group organic growth with +3.7% over the period, the
sustained dynamic of its core payment businesses compensating for the effect of the two
contracts terminated last year;
France reached a solid +2.3% organic growth rate, fueled in particular by the strong demand for
Big Data & Cybersecurity solutions;
“Other Business Units” also positively contributed to the Group revenue growth, thanks to double
digit growth in Asia Pacific, Middle East & Africa, and South America.
UK & Ireland was almost stable. The high growth during the second half of the year (+4.5%) offset the
first half base effect thanks to a strong activity in the Public sector with contract ramp-ups and increased
volumes and projects.
The situation remained challenging for Benelux & The Nordics. 2016 was impacted by the ramp-down of
contracts not renewed in 2015 in the Infrastructure & Data Management business, mainly in Financial Services. The new management team appointed in the Summer actively focused on the Business Unit
recovery.
In 2016, the Group continued to execute the Tier One Program through industrialization, global delivery from offshore locations, and continuous optimization of SG&A. In addition, the Group benefitted from the
full impact of costs synergies following the integration of Bull and Xerox ITO, coupled with the effect of the Unify restructuring plan on the CCS activities profitability. The margin improvement was particularly visible
in large Business Units such as Germany, North America, the UK and also France, while Benelux & the Nordics faced decreasing margins coming from a lower level of activity across most Divisions. Global
structures costs for IT Services as a percentage of revenue increased by +20 basis points compared to
2015 at constant scope and exchange rates, mostly due the positive effect recorded in H1 2015 for pension plan optimization. In 2016, the Group continued to execute its pension schemes optimization plan
which resulted in a € 41 million one-off gain (recorded in H2 in the UK), compared to € 74 million in 2015.
Globally, the Group improved its operating margin rate by +110 basis points in 2016. The improveme nt
was +140 basis points excluding pension schemes optimization one-offs both in 2015 and in 2016.
In € million 2016 2015* % organic 2016 2015* 2016 2015*
North America 2,061 1,972 +4.5% 240.8 182.9 11.7% 9.3%
Germany 1,954 1,856 +5.3% 200.9 138.7 10.3% 7.5%
United-Kingdom & Ireland 1,790 1,797 -0.4% 238.8 196.7 13.3% 10.9%
France 1,709 1,671 +2.3% 125.4 102.9 7.3% 6.2%
Benelux & The Nordics 986 1,064 -7.3% 71.5 98.4 7.3% 9.2%
Other Business Units 1,956 1,938 +0.9% 127.3 139.4 6.5% 7.2%
Global structures** -97.7 -73.3 -0.9% -0.7%
Worldline 1,261 1,216 +3.7% 196.9 173.4 15.6% 14.3%
TOTAL GROUP 11,717 11,515 +1.8% 1,104 959.0 9.4% 8.3%
* At constant scope and exchange rates
** Global structures include the Global Divisions costs not allocated to the Group Business Units and Corporate costs
Revenue Operating margin Operating margin %
20/108
B.1.4.1 North America
Revenue reached € 2,061 million or +4.5% organically. This growth was attributable to Infrastructure &
Data Management and to a lesser extent to Big Data &Cyber-security.
In Infrastructure & Data Management, Telco, Media & Utilities led the growth through large contracts such
as Disney and Microsoft. The Public Sector posted a solid performance notably due to additional business
with the Texas Department of Information Resources and the evolution of contractual terms with a Californian County. Manufacturing, Retail & Transportation benefitted both from a new contract with a
leading biotechnology company and ramp-ups with several existing customers including Xerox, which more than offset lower volumes in Manufacturing.
In 2016, Business & Platform Solutions faced decreasing volumes resulting for instance from a client’s divested scope of business and termination of non-profitable contracts. In addition, the Division did not
benefit like in the prior year from periodic specific events such as the 2015 Toronto Pan-American Games.
The launch of Big Data & Cybersecurity business in the US in 2015 materialized in several new signatures and a continued revenue growth mainly in Manufacturing, Retail & Transportation.
Profitability improved in North America to 11.7% of revenue as operating margin grew significantly in Infrastructure & Data Management Division thanks to a more technological revenue mix (Digital
Transformation) and continued savings from Xerox ITO integration synergies.
B.1.4.2 Germany
Germany posted a strong revenue performance at €1,954 million in 2016, up +5.3% compared to last year on a like-for-like basis. The positive trend recorded in the first semester was confirmed as the second
half-year showed strengthened performance at +5.6%. All Divisions and markets recorded a positive
revenue growth.
Infrastructure & Data Management growth was mainly fueled by Manufacturing, Retail & Transportatio n
market, where the new contract with Rheinmetall won in Q3 and the ramp-up of BASF largely offset the effect of reduced scope with some large customers. In Public & Health, the improvement mainly derived
from increasing activity in Unify CCS with various local administrations. While the Telecom sector benefitted from new contracts with Telefonica, Financial Services also slightly grew on the back of
increased projects with Deutsche Bank.
Business & Platform Solutions achieved an almost double digit growth with all the markets turning to positive, reflecting the successful strategy currently implemented by the new management team appointed
last year. Growth was mainly fueled by the Public & Health sector, which posted a strong double digit growth led by higher volumes with the Ministry of Justice, and by the Telecom sector, benefitting mainly
from new contracts with Telefonica/O2 and Vodafone. Manufacturing, Retail & Transportation also showed
a strong performance, driven by additional services provided to large customers such as Airbus and BMW, combined with increased project activity with Siemens. Financial Services were slightly improving thanks
to a new contract with Deutsche Bank.
Big Data & Cybersecurity achieved a solid double digit revenue growth, mainly driven by a very strong
performance attributable to software license sales which largely offset the base effect of an HPC project delivered in the prior year to DKRZ (national weather forecast).
Operating margin reached € 200.9 million or 10.3% of revenue, significantly improving compared to the
prior year at constant scope and exchange rates. The Business Unit profitability improvement was overall resulting from the sales performance, combined with continued improvement of the workforce
management as well as continued increased optimization of offshore delivery and synergies with the Unify CCS services, which largely compensated for the base effect of the pension one -off recorded in 2015.
In € million 2016 2015* % organic
Revenue 2,061 1,972 +4.5%
Operating margin 240.8 182.9
Operating margin rate 11.7% 9.3%
* At constant scope and exchange rates
In € million 2016 2015* % organic
Revenue 1,954 1,856 +5.3%
Operating margin 200.9 138.7
Operating margin rate 10.3% 7.5%
* At constant scope and exchange rates
21/108
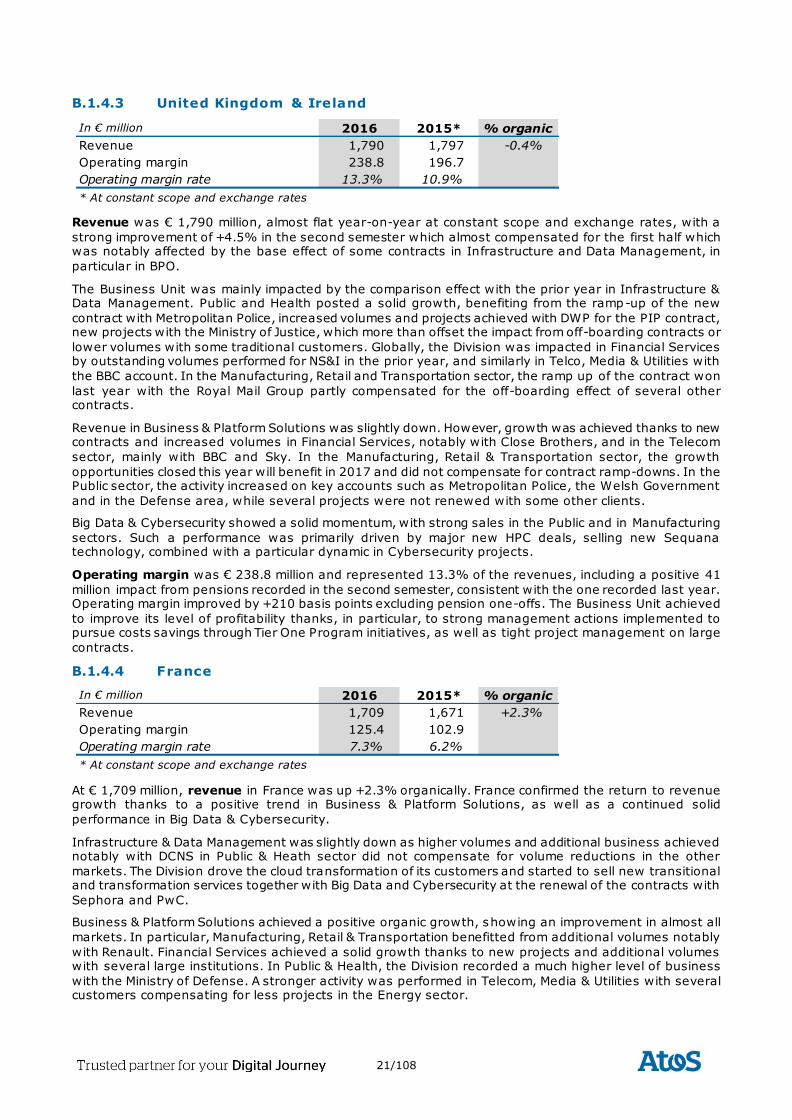
B.1.4.3 United Kingdom & Ireland
Revenue was € 1,790 million, almost flat year-on-year at constant scope and exchange rates, with a
strong improvement of +4.5% in the second semester which almost compensated for the first half which was notably affected by the base effect of some contracts in Infrastructure and Data Management, in
particular in BPO.
The Business Unit was mainly impacted by the comparison effect with the prior year in Infrastructure & Data Management. Public and Health posted a solid growth, benefiting from the ramp-up of the new
contract with Metropolitan Police, increased volumes and projects achieved with DWP for the PIP contract, new projects with the Ministry of Justice, which more than offset the impact from off-boarding contracts or
lower volumes with some traditional customers. Globally, the Division was impacted in Financial Services by outstanding volumes performed for NS&I in the prior year, and similarly in Telco, Media & Utilities with
the BBC account. In the Manufacturing, Retail and Transportation sector, the ramp up of the contract won
last year with the Royal Mail Group partly compensated for the off-boarding effect of several other contracts.
Revenue in Business & Platform Solutions was slightly down. However, growth was achieved thanks to new contracts and increased volumes in Financial Services, notably with Close Brothers, and in the Telecom
sector, mainly with BBC and Sky. In the Manufacturing, Retail & Transportation sector, the growth
opportunities closed this year will benefit in 2017 and did not compensate for contract ramp-downs. In the Public sector, the activity increased on key accounts such as Metropolitan Police, the Welsh Government
and in the Defense area, while several projects were not renewed with some other clients.
Big Data & Cybersecurity showed a solid momentum, with strong sales in the Public and in Manufacturing
sectors. Such a performance was primarily driven by major new HPC deals, selling new Sequana technology, combined with a particular dynamic in Cybersecurity projects.
Operating margin was € 238.8 million and represented 13.3% of the revenues, including a positive 41
million impact from pensions recorded in the second semester, consistent with the one recorded last year. Operating margin improved by +210 basis points excluding pension one-offs. The Business Unit achieved
to improve its level of profitability thanks, in particular, to strong management actions implemented to pursue costs savings through Tier One Program initiatives, as well as tight project management on large
contracts.
B.1.4.4 France
At € 1,709 million, revenue in France was up +2.3% organically. France confirmed the return to revenue growth thanks to a positive trend in Business & Platform Solutions, as well as a continued solid
performance in Big Data & Cybersecurity.
Infrastructure & Data Management was slightly down as higher volumes and additional business achieved notably with DCNS in Public & Heath sector did not compensate for volume reductions in the other
markets. The Division drove the cloud transformation of its customers and started to sell new transitional and transformation services together with Big Data and Cybersecurity at the renewal of the contracts with
Sephora and PwC.
Business & Platform Solutions achieved a positive organic growth, showing an improvement in almost all
markets. In particular, Manufacturing, Retail & Transportation benefitted from additional volumes notably
with Renault. Financial Services achieved a solid growth thanks to new projects and additional volumes with several large institutions. In Public & Health, the Division recorded a much higher level of business
with the Ministry of Defense. A stronger activity was performed in Telecom, Media & Utilities with several customers compensating for less projects in the Energy sector.
In € million 2016 2015* % organic
Revenue 1,790 1,797 -0.4%
Operating margin 238.8 196.7
Operating margin rate 13.3% 10.9%
* At constant scope and exchange rates
In € million 2016 2015* % organic
Revenue 1,709 1,671 +2.3%
Operating margin 125.4 102.9
Operating margin rate 7.3% 6.2%
* At constant scope and exchange rates
22/108
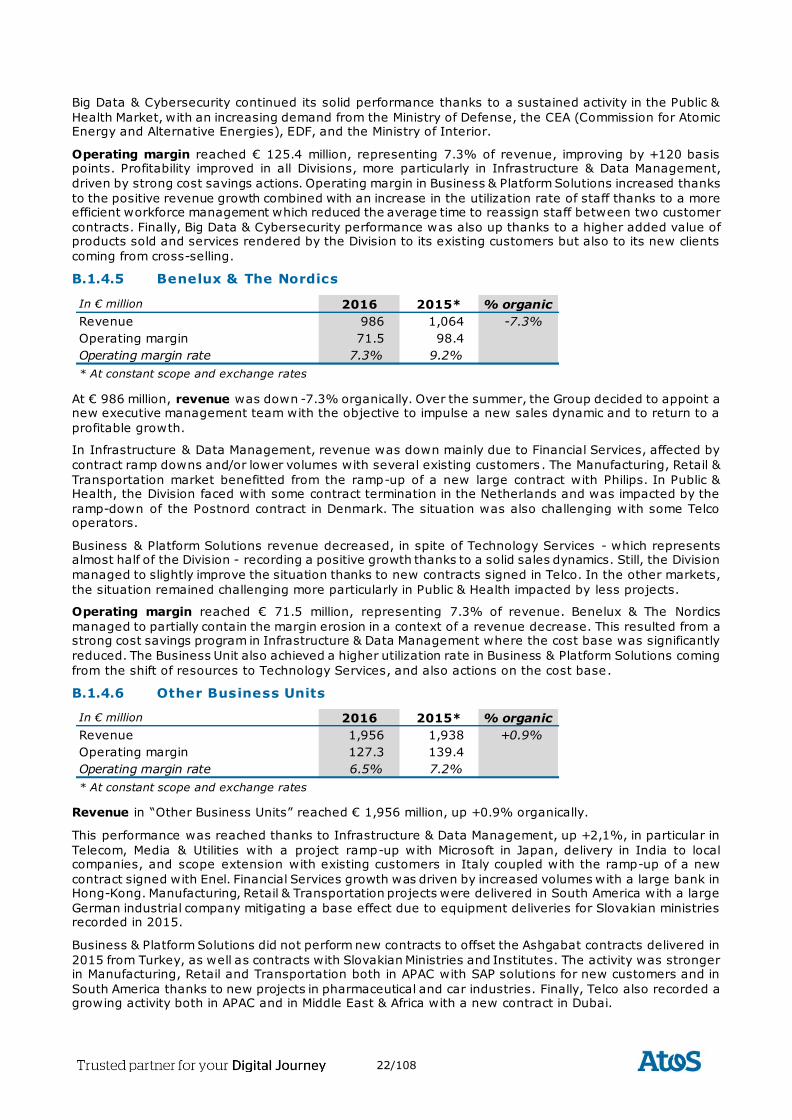
Big Data & Cybersecurity continued its solid performance thanks to a sustained activity in the Public &
Health Market, with an increasing demand from the Ministry of Defense, the CEA (Commission for Atomic Energy and Alternative Energies), EDF, and the Ministry of Interior.
Operating margin reached € 125.4 million, representing 7.3% of revenue, improving by +120 basis points. Profitability improved in all Divisions, more particularly in Infrastructure & Data Management,
driven by strong cost savings actions. Operating margin in Business & Platform Solutions increased thanks
to the positive revenue growth combined with an increase in the utilization rate of staff thanks to a more efficient workforce management which reduced the average time to reassign staff between two customer
contracts. Finally, Big Data & Cybersecurity performance was also up thanks to a higher added value of products sold and services rendered by the Division to its existing customers but also to its new clients
coming from cross-selling.
B.1.4.5 Benelux & The Nordics
At € 986 million, revenue was down -7.3% organically. Over the summer, the Group decided to appoint a new executive management team with the objective to impulse a new sales dynamic and to return to a
profitable growth.
In Infrastructure & Data Management, revenue was down mainly due to Financial Services, affected by
contract ramp downs and/or lower volumes with several existing customers . The Manufacturing, Retail &
Transportation market benefitted from the ramp-up of a new large contract with Philips. In Public & Health, the Division faced with some contract termination in the Netherlands and was impacted by the
ramp-down of the Postnord contract in Denmark. The situation was also challenging with some Telco operators.
Business & Platform Solutions revenue decreased, in spite of Technology Services - which represents almost half of the Division - recording a positive growth thanks to a solid sales dynamics. Still, the Division
managed to slightly improve the situation thanks to new contracts signed in Telco. In the other markets,
the situation remained challenging more particularly in Public & Health impacted by less projects.
Operating margin reached € 71.5 million, representing 7.3% of revenue. Benelux & The Nordics
managed to partially contain the margin erosion in a context of a revenue decrease. This resulted from a strong cost savings program in Infrastructure & Data Management where the cost base was significantly
reduced. The Business Unit also achieved a higher utilization rate in Business & Platform Solutions coming
from the shift of resources to Technology Services, and also actions on the cost base.
B.1.4.6 Other Business Units
Revenue in “Other Business Units” reached € 1,956 million, up +0.9% organically.
This performance was reached thanks to Infrastructure & Data Management, up +2,1%, in particular in
Telecom, Media & Utilities with a project ramp-up with Microsoft in Japan, delivery in India to local companies, and scope extension with existing customers in Italy coupled with the ramp-up of a new
contract signed with Enel. Financial Services growth was driven by increased volumes with a large bank in Hong-Kong. Manufacturing, Retail & Transportation projects were delivered in South America with a large
German industrial company mitigating a base effect due to equipment deliveries for Slovakian ministries recorded in 2015.
Business & Platform Solutions did not perform new contracts to offset the Ashgabat contracts delivered in
2015 from Turkey, as well as contracts with Slovakian Ministries and Institutes. The activity was stronger in Manufacturing, Retail and Transportation both in APAC with SAP solutions for new customers and in
South America thanks to new projects in pharmaceutical and car industries. Finally, Telco also recorded a growing activity both in APAC and in Middle East & Africa with a new contract in Dubai.
In € million 2016 2015* % organic
Revenue 986 1,064 -7.3%
Operating margin 71.5 98.4
Operating margin rate 7.3% 9.2%
* At constant scope and exchange rates
In € million 2016 2015* % organic
Revenue 1,956 1,938 +0.9%
Operating margin 127.3 139.4
Operating margin rate 6.5% 7.2%
* At constant scope and exchange rates
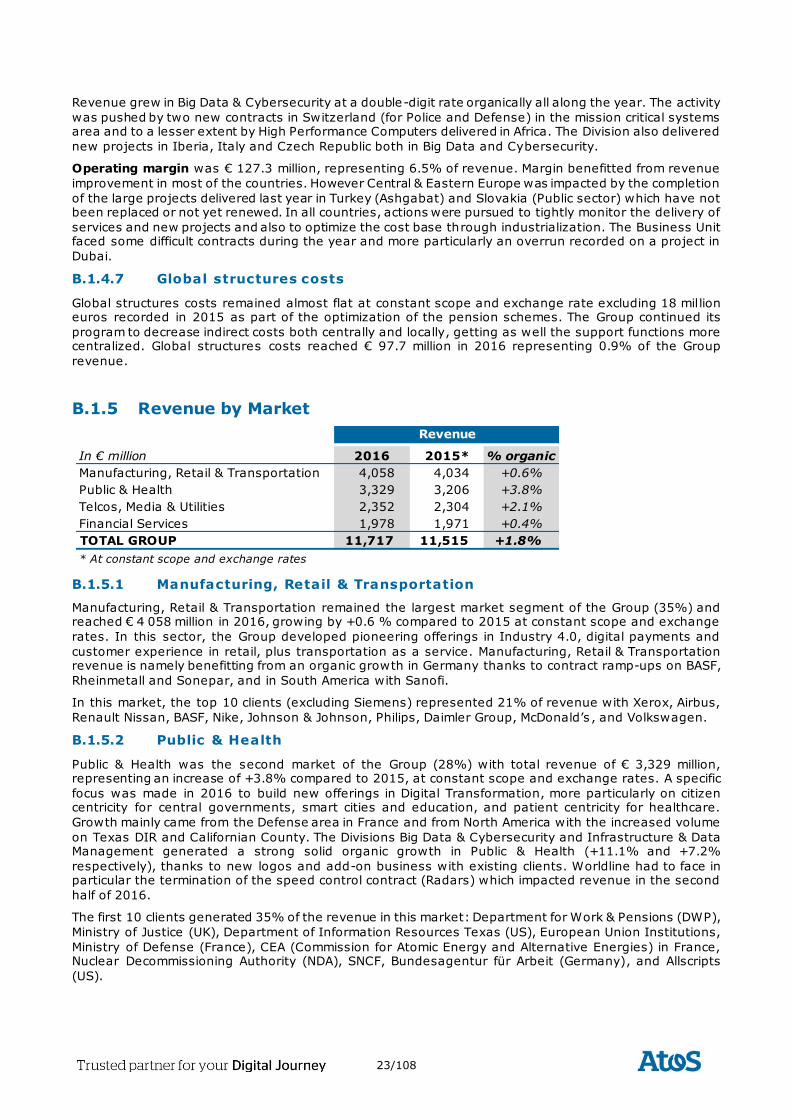
23/108
Revenue grew in Big Data & Cybersecurity at a double-digit rate organically all along the year. The activity
was pushed by two new contracts in Switzerland (for Police and Defense) in the mission critical systems area and to a lesser extent by High Performance Computers delivered in Africa. The Division also delivered
new projects in Iberia, Italy and Czech Republic both in Big Data and Cybersecurity.
Operating margin was € 127.3 million, representing 6.5% of revenue. Margin benefitted from revenue
improvement in most of the countries. However Central & Eastern Europe was impacted by the completion
of the large projects delivered last year in Turkey (Ashgabat) and Slovakia (Public sector) which have not been replaced or not yet renewed. In all countries, actions were pursued to tightly monitor the delivery of
services and new projects and also to optimize the cost base through industrialization. The Business Unit faced some difficult contracts during the year and more particularly an overrun recorded on a project in
Dubai.
B.1.4.7 Global structures costs
Global structures costs remained almost flat at constant scope and exchange rate excluding 18 million euros recorded in 2015 as part of the optimization of the pension schemes. The Group continued its
program to decrease indirect costs both centrally and locally, getting as well the support functions more centralized. Global structures costs reached € 97.7 million in 2016 representing 0.9% of the Group
revenue.
B.1.5 Revenue by Market
B.1.5.1 Manufacturing, Retail & Transportation
Manufacturing, Retail & Transportation remained the largest market segment of the Group (35%) and reached € 4 058 million in 2016, growing by +0.6 % compared to 2015 at constant scope and exchange
rates. In this sector, the Group developed pioneering offerings in Industry 4.0, digital payments and
customer experience in retail, plus transportation as a service. Manufacturing, Retail & Transportation revenue is namely benefitting from an organic growth in Germany thanks to contract ramp-ups on BASF,
Rheinmetall and Sonepar, and in South America with Sanofi.
In this market, the top 10 clients (excluding Siemens) represented 21% of revenue with Xerox, Airbus,
Renault Nissan, BASF, Nike, Johnson & Johnson, Philips, Daimler Group, McDonald’s , and Volkswagen.
B.1.5.2 Public & Health
Public & Health was the second market of the Group (28%) with total revenue of € 3,329 million, representing an increase of +3.8% compared to 2015, at constant scope and exchange rates. A specific
focus was made in 2016 to build new offerings in Digital Transformation, more particularly on citizen centricity for central governments, smart cities and education, and patient centricity for healthcare.
Growth mainly came from the Defense area in France and from North America with the increased volume
on Texas DIR and Californian County. The Divisions Big Data & Cybersecurity and Infrastructure & Data Management generated a strong solid organic growth in Public & Health (+11.1% and +7.2%
respectively), thanks to new logos and add-on business with existing clients. Worldline had to face in particular the termination of the speed control contract (Radars) which impacted revenue in the second
half of 2016.
The first 10 clients generated 35% of the revenue in this market: Department for Work & Pensions (DWP),
Ministry of Justice (UK), Department of Information Resources Texas (US), European Union Institutions,
Ministry of Defense (France), CEA (Commission for Atomic Energy and Alternative Energies) in France, Nuclear Decommissioning Authority (NDA), SNCF, Bundesagentur für Arbeit (Germany), and Allscripts
(US).
In € million 2016 2015* % organic
Manufacturing, Retail & Transportation 4,058 4,034 +0.6%
Public & Health 3,329 3,206 +3.8%
Telcos, Media & Utilities 2,352 2,304 +2.1%
Financial Services 1,978 1,971 +0.4%
TOTAL GROUP 11,717 11,515 +1.8%
* At constant scope and exchange rates
Revenue
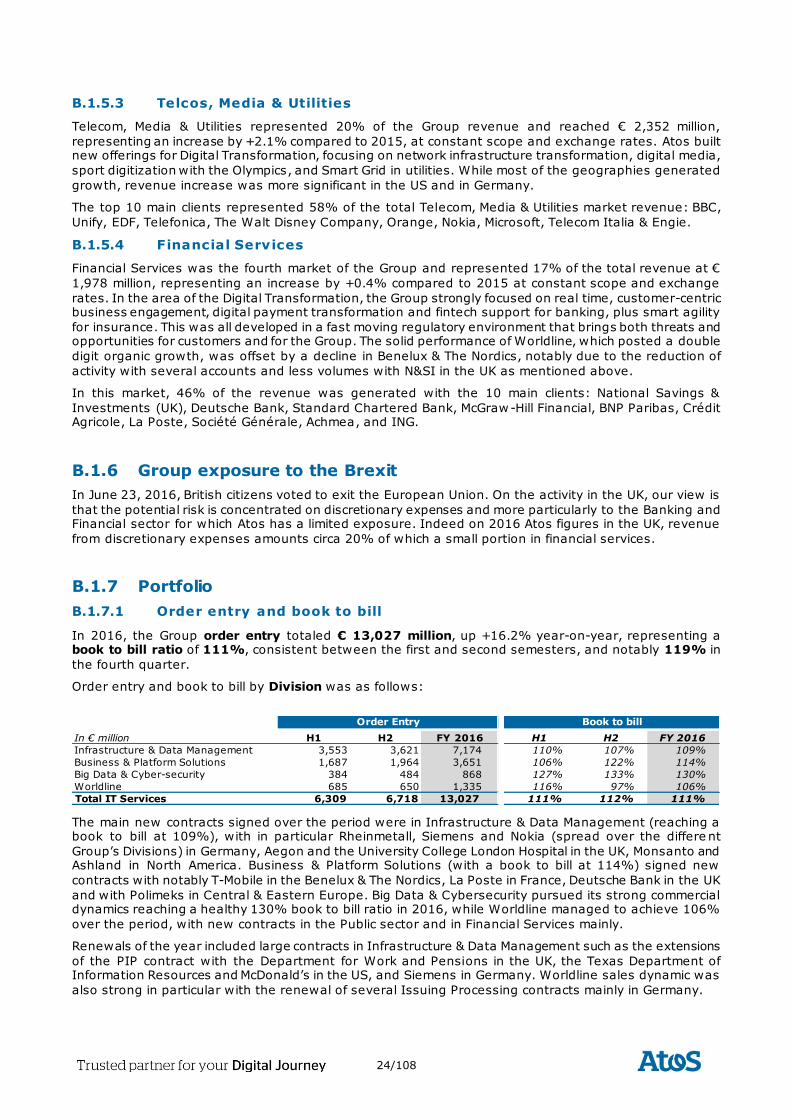
24/108
B.1.5.3 Telcos, Media & Utilities
Telecom, Media & Utilities represented 20% of the Group revenue and reached € 2,352 million,
representing an increase by +2.1% compared to 2015, at constant scope and exchange rates. Atos built new offerings for Digital Transformation, focusing on network infrastructure transformation, digital media,
sport digitization with the Olympics, and Smart Grid in utilities. While most of the geographies generated
growth, revenue increase was more significant in the US and in Germany.
The top 10 main clients represented 58% of the total Telecom, Media & Utilities market revenue: BBC,
Unify, EDF, Telefonica, The Walt Disney Company, Orange, Nokia, Microsoft, Telecom Italia & Engie.
B.1.5.4 Financial Services
Financial Services was the fourth market of the Group and represented 17% of the total revenue at €
1,978 million, representing an increase by +0.4% compared to 2015 at constant scope and exchange
rates. In the area of the Digital Transformation, the Group strongly focused on real time, customer-centric business engagement, digital payment transformation and fintech support for banking, plus smart agility
for insurance. This was all developed in a fast moving regulatory environment that brings both threats and opportunities for customers and for the Group. The solid performance of Worldline, which posted a double
digit organic growth, was offset by a decline in Benelux & The Nordics, notably due to the reduction of
activity with several accounts and less volumes with N&SI in the UK as mentioned above.
In this market, 46% of the revenue was generated with the 10 main clients: National Savings &
Investments (UK), Deutsche Bank, Standard Chartered Bank, McGraw-Hill Financial, BNP Paribas, Crédit Agricole, La Poste, Société Générale, Achmea, and ING.
B.1.6 Group exposure to the Brexit
In June 23, 2016, British citizens voted to exit the European Union. On the activity in the UK, our view is
that the potential risk is concentrated on discretionary expenses and more particularly to the Banking and Financial sector for which Atos has a limited exposure. Indeed on 2016 Atos figures in the UK, revenue
from discretionary expenses amounts circa 20% of which a small portion in financial services.
B.1.7 Portfolio
B.1.7.1 Order entry and book to bill
In 2016, the Group order entry totaled € 13,027 million, up +16.2% year-on-year, representing a book to bill ratio of 111%, consistent between the first and second semesters, and notably 119% in
the fourth quarter.
Order entry and book to bill by Division was as follows:
The main new contracts signed over the period were in Infrastructure & Data Management (reaching a book to bill at 109%), with in particular Rheinmetall, Siemens and Nokia (spread over the differe nt
Group’s Divisions) in Germany, Aegon and the University College London Hospital in the UK, Monsanto and Ashland in North America. Business & Platform Solutions (with a book to bill at 114%) signed new
contracts with notably T-Mobile in the Benelux & The Nordics, La Poste in France, Deutsche Bank in the UK
and with Polimeks in Central & Eastern Europe. Big Data & Cybersecurity pursued its strong commercial dynamics reaching a healthy 130% book to bill ratio in 2016, while Worldline managed to achieve 106%
over the period, with new contracts in the Public sector and in Financial Services mainly.
Renewals of the year included large contracts in Infrastructure & Data Management such as the extensions
of the PIP contract with the Department for Work and Pensions in the UK, the Texas Department of Information Resources and McDonald’s in the US, and Siemens in Germany. Worldline sales dynamic was
also strong in particular with the renewal of several Issuing Processing contracts mainly in Germany.
In € million H1 H2 FY 2016 H1 H2 FY 2016
Infrastructure & Data Management 3,553 3,621 7,174 110% 107% 109%
Business & Platform Solutions 1,687 1,964 3,651 106% 122% 114%
Big Data & Cyber-security 384 484 868 127% 133% 130%
Worldline 685 650 1,335 116% 97% 106%
Total IT Services 6,309 6,718 13,027 111% 112% 111%
Order Entry Book to bill
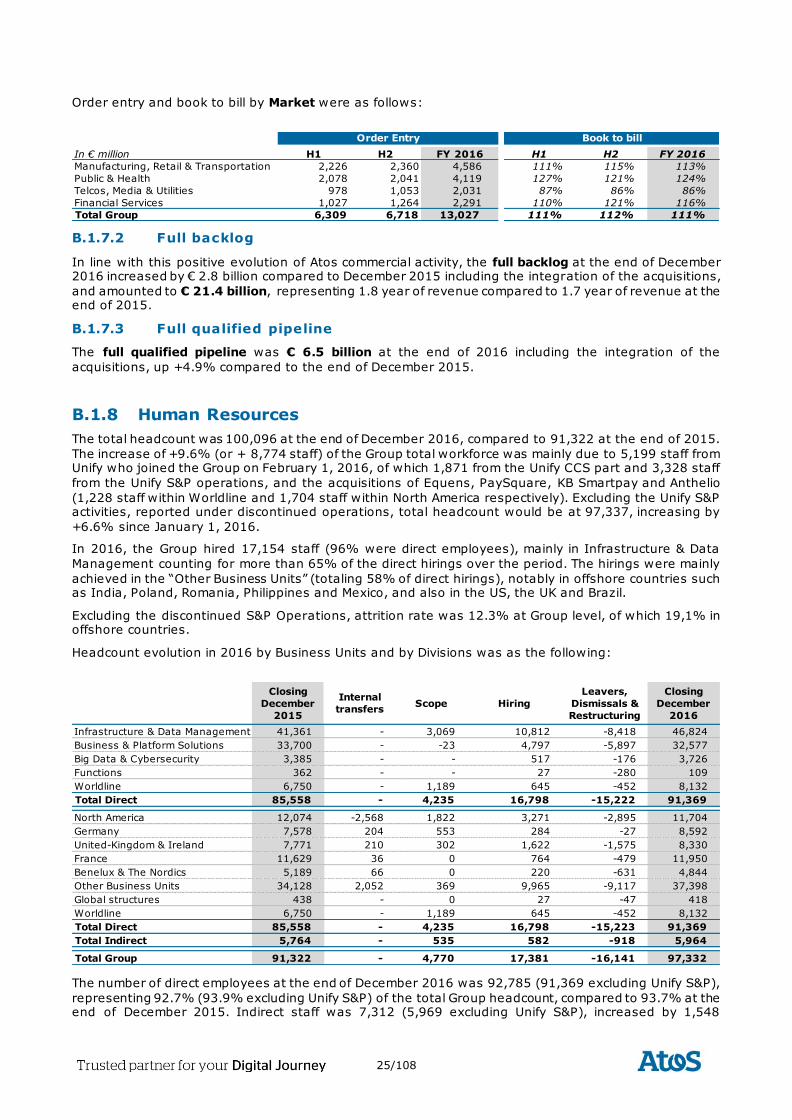
25/108
Order entry and book to bill by Market were as follows:
B.1.7.2 Full backlog
In line with this positive evolution of Atos commercial activity, the full backlog at the end of December 2016 increased by € 2.8 billion compared to December 2015 including the integration of the acquisitions,
and amounted to € 21.4 billion, representing 1.8 year of revenue compared to 1.7 year of revenue at the end of 2015.
B.1.7.3 Full qualified pipeline
The full qualified pipeline was € 6.5 billion at the end of 2016 including the integration of the
acquisitions, up +4.9% compared to the end of December 2015.
B.1.8 Human Resources
The total headcount was 100,096 at the end of December 2016, compared to 91,322 at the end of 2015.
The increase of +9.6% (or + 8,774 staff) of the Group total workforce was mainly due to 5,199 staff from Unify who joined the Group on February 1, 2016, of which 1,871 from the Unify CCS part and 3,328 staff
from the Unify S&P operations, and the acquisitions of Equens, PaySquare, KB Smartpay and Anthelio
(1,228 staff within Worldline and 1,704 staff within North America respectively). Excluding the Unify S&P activities, reported under discontinued operations, total headcount would be at 97,337, increasing by
+6.6% since January 1, 2016.
In 2016, the Group hired 17,154 staff (96% were direct employees), mainly in Infrastructure & Data
Management counting for more than 65% of the direct hirings over the period. The hirings were mainly
achieved in the “Other Business Units” (totaling 58% of direct hirings), notably in offshore countries such as India, Poland, Romania, Philippines and Mexico, and also in the US, the UK and Brazil.
Excluding the discontinued S&P Operations, attrition rate was 12.3% at Group level, of which 19,1% in offshore countries.
Headcount evolution in 2016 by Business Units and by Divisions was as the following:
The number of direct employees at the end of December 2016 was 92,785 (91,369 excluding Unify S&P),
representing 92.7% (93.9% excluding Unify S&P) of the total Group headcount, compared to 93.7% at the end of December 2015. Indirect staff was 7,312 (5,969 excluding Unify S&P), increased by 1,548
In € million H1 H2 FY 2016 H1 H2 FY 2016
Manufacturing, Retail & Transportation 2,226 2,360 4,586 111% 115% 113%
Public & Health 2,078 2,041 4,119 127% 121% 124%
Telcos, Media & Utilities 978 1,053 2,031 87% 86% 86%
Financial Services 1,027 1,264 2,291 110% 121% 116%
Total Group 6,309 6,718 13,027 111% 112% 111%
Order Entry Book to bill
Closing
December
2015
Internal
transfersScope Hiring
Leavers,
Dismissals &
Restructuring
Closing
December
2016
Infrastructure & Data Management 41,361 - 3,069 10,812 -8,418 46,824
Business & Platform Solutions 33,700 - -23 4,797 -5,897 32,577
Big Data & Cybersecurity 3,385 - - 517 -176 3,726
Functions 362 - - 27 -280 109
Worldline 6,750 - 1,189 645 -452 8,132
Total Direct 85,558 - 4,235 16,798 -15,222 91,369
North America 12,074 -2,568 1,822 3,271 -2,895 11,704
Germany 7,578 204 553 284 -27 8,592
United-Kingdom & Ireland 7,771 210 302 1,622 -1,575 8,330
France 11,629 36 0 764 -479 11,950
Benelux & The Nordics 5,189 66 0 220 -631 4,844
Other Business Units 34,128 2,052 369 9,965 -9,117 37,398
Global structures 438 - 0 27 -47 418
Worldline 6,750 - 1,189 645 -452 8,132
Total Direct 85,558 - 4,235 16,798 -15,223 91,369
Total Indirect 5,764 - 535 582 -918 5,964
Total Group 91,322 - 4,770 17,381 -16,141 97,332
26/108
employees compared to the end of December 2015, largely due to the scope effect from the Unify
acquisition. Excluding the Unify acquisition, Indirect staff would be at 5,424, meaning a -5.8% year-on-year decrease.
The number of restructured or dismissed employees over the period was 3,403 (of which 2,986 Direct staff).
B.2 2017 objectives
Revenue growth: Circa +6% at constant exchange rates, above +2% organically.
Operating margin: Between 9.5% and 10.0% of revenue.
Free cash flow: Operating margin conversion rate to free cash flow between 55% and 58%.
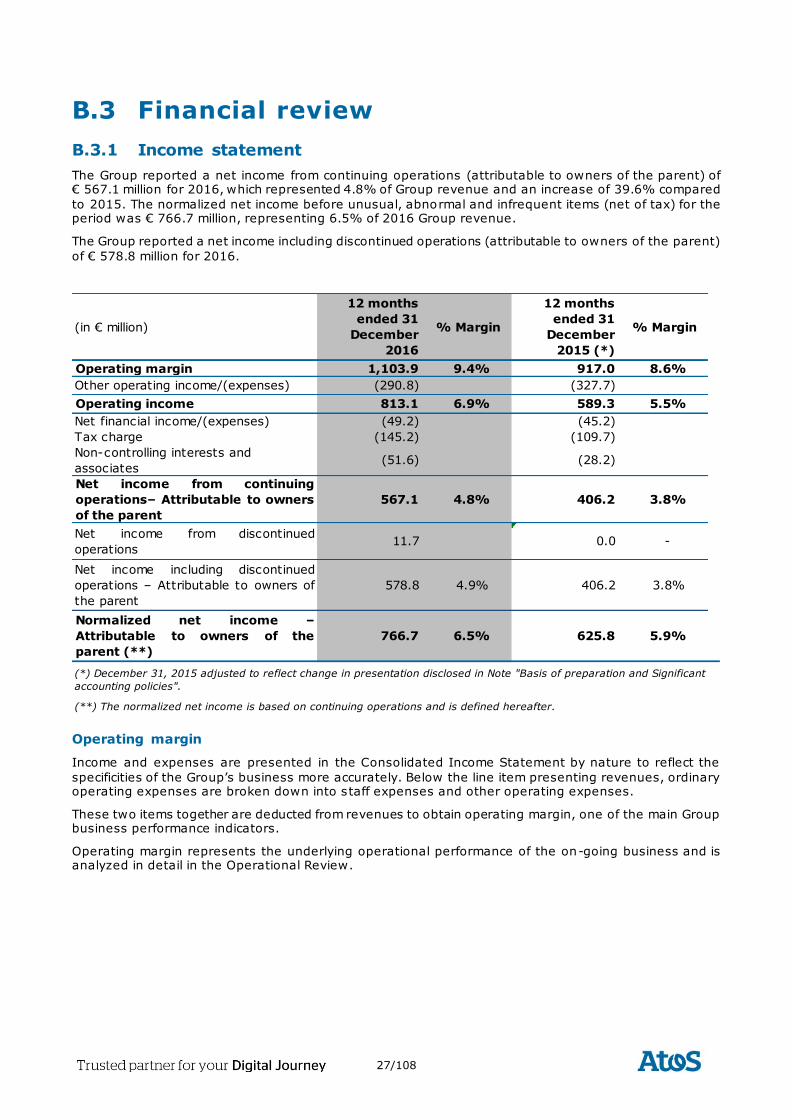
27/108
B.3 Financial review
B.3.1 Income statement
The Group reported a net income from continuing operations (attributable to owners of the parent) of € 567.1 million for 2016, which represented 4.8% of Group revenue and an increase of 39.6% compared
to 2015. The normalized net income before unusual, abnormal and infrequent items (net of tax) for the period was € 766.7 million, representing 6.5% of 2016 Group revenue.
The Group reported a net income including discontinued operations (attributable to owners of the parent)
of € 578.8 million for 2016.
Operating margin
Income and expenses are presented in the Consolidated Income Statement by nature to reflect the
specificities of the Group’s business more accurately. Below the line item presenting revenues, ordinary operating expenses are broken down into staff expenses and other operating expenses.
These two items together are deducted from revenues to obtain operating margin, one of the main Group business performance indicators.
Operating margin represents the underlying operational performance of the on-going business and is analyzed in detail in the Operational Review.
(in € million)
12 months
ended 31
December
2016
% Margin
12 months
ended 31
December
2015 (*)
% Margin
Operating margin 1,103.9 9.4% 917.0 8.6%
Other operating income/(expenses) (290.8) (327.7)
Net financial income/(expenses) (49.2) (45.2)
Tax charge (145.2) (109.7)
Non-controlling interests and
associates(51.6) (28.2)
Net income from continuing
operations– Attributable to owners
of the parent
567.1 4.8% 406.2 3.8%
Net income from discontinued
operations11.7 0.0 -
Net income including discontinued
operations – Attributable to owners of
the parent
578.8 4.9% 406.2 3.8%
Normalized net income –
Attributable to owners of the
parent (**)
766.7 6.5% 625.8 5.9%
(**) The normalized net income is based on continuing operations and is defined hereafter.
5.5%Operating income 813.1 6.9% 589.3
(*) December 31, 2015 adjusted to reflect change in presentation disclosed in Note "Basis of preparation and Significant
accounting policies".
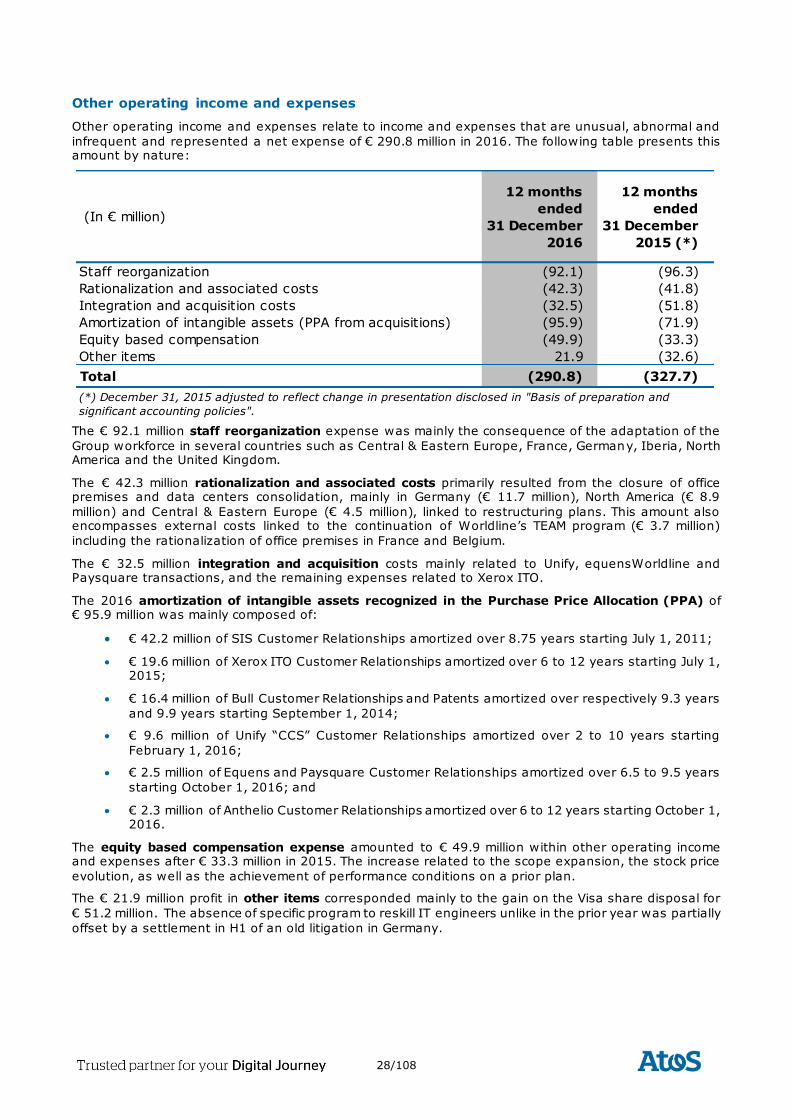
28/108
Other operating income and expenses
Other operating income and expenses relate to income and expenses that are unusual, abnormal and
infrequent and represented a net expense of € 290.8 million in 2016. The following table presents this amount by nature:
The € 92.1 million staff reorganization expense was mainly the consequence of the adaptation of the
Group workforce in several countries such as Central & Eastern Europe, France, Germany, Iberia, North America and the United Kingdom.
The € 42.3 million rationalization and associated costs primarily resulted from the closure of office premises and data centers consolidation, mainly in Germany (€ 11.7 million), North America (€ 8.9
million) and Central & Eastern Europe (€ 4.5 million), linked to restructuring plans. This amount also encompasses external costs linked to the continuation of Worldline’s TEAM program (€ 3.7 million)
including the rationalization of office premises in France and Belgium.
The € 32.5 million integration and acquisition costs mainly related to Unify, equensWorldline and Paysquare transactions, and the remaining expenses related to Xerox ITO.
The 2016 amortization of intangible assets recognized in the Purchase Price Allocation (PPA) of € 95.9 million was mainly composed of:
€ 42.2 million of SIS Customer Relationships amortized over 8.75 years starting July 1, 2011;
€ 19.6 million of Xerox ITO Customer Relationships amortized over 6 to 12 years starting July 1, 2015;
€ 16.4 million of Bull Customer Relationships and Patents amortized over respectively 9.3 years
and 9.9 years starting September 1, 2014;
€ 9.6 million of Unify “CCS” Customer Relationships amortized over 2 to 10 years starting
February 1, 2016;
€ 2.5 million of Equens and Paysquare Customer Relationships amortized over 6.5 to 9.5 years
starting October 1, 2016; and
€ 2.3 million of Anthelio Customer Relationships amortized over 6 to 12 years starting October 1, 2016.
The equity based compensation expense amounted to € 49.9 million within other operating income and expenses after € 33.3 million in 2015. The increase related to the scope expansion, the stock price
evolution, as well as the achievement of performance conditions on a prior plan.
The € 21.9 million profit in other items corresponded mainly to the gain on the Visa share disposal for
€ 51.2 million. The absence of specific program to reskill IT engineers unlike in the prior year was partially
offset by a settlement in H1 of an old litigation in Germany.
(In € million)
12 months
ended
31 December
2016
12 months
ended
31 December
2015 (*)
Staff reorganization (92.1) (96.3)
Rationalization and associated costs (42.3) (41.8)
Integration and acquisition costs (32.5) (51.8)
Amortization of intangible assets (PPA from acquisitions) (95.9) (71.9)
Equity based compensation (49.9) (33.3)
Other items 21.9 (32.6)
Total (290.8) (327.7)
(*) December 31, 2015 adjusted to reflect change in presentation disclosed in "Basis of preparation and
significant accounting policies".
29/108
Net financial expense
Net financial expense amounted to € 49.2 million for the period (compared to € 45.2 million prior year)
and was composed of a net cost of financial debt of € 18.1 million and non-operational financial costs of € 31.1 million.
Net cost of financial debt was € 18.1 million (compared to € 17.4 million in 2015) and resulted from the
following elements:
The average gross borrowing of € 2,014.1 million compared to € 1,185.5 million in 2015 bearing
an average expense rate of 1.60% compared to 2.32% last year. The average gross borrowing expenses were mainly explained by:
o The used portion of the syndicated loan for an average of € 1,058.6 million (compared to an average of € 687.2 million in 2015) bearing an effective interest rate of 0.48%;
o A € 600.0 million bond issue in July 2015 bearing a coupon rate of 2.375%;
o A € 300.0 million bond issue end of September 2016, with a yearly average impact on the total gross borrowings of € 90.0 million bearing a coupon rate of 1.444%;
o Other sources of financing, including securitization, for an average of € 260.7 million, bearing an effective interest rate of 4.03 %.
The average gross cash increased from € 1,105.3 million in 2015 to € 1,418.3 million in 2016
bearing an average income rate of 1.00% compared to 0.91% in 2015.
Non-operational financial costs amounted to € 31.1 million compared to € 27.8 million in 2015 and were
mainly composed of pension related interest (€ 28.9 million compared to € 29.3 million expense in 2015) and a net foreign exchange gain of € 9.0 million versus a net foreign exchange gain of € 6.2 million in
2015. The pension financial cost represented the difference between interest costs on pension obligations and interest income on plan assets.
Corporate tax
The Group effective tax rate was 19.0% including the French CVAE tax corresponding to the tax charge of
€ 145.2 million with a profit before tax of € 763.9 million.
Please refer to Note 7 Income tax for further explanations.
Non-controlling interests
Non-controlling interests included shareholdings held by joint venture partners and other associates of the
Group. Non-controlling interests amounted to € 53.0 million in December 2016 (compared to € 30.8 million in December 2015). The increase is mostly related to the non-controlling interests in Worldline,
including the impact from the Visa share on the net income of Worldline, as well as the minorities into
equens Worldline following the transaction that occurred on September 30, 2016.
Normalized net income
The normalized net income excluding unusual, abnormal, and infrequent items (net of tax) was
€ 766.7 million, increasing by 22.5% in comparison with the previous year.
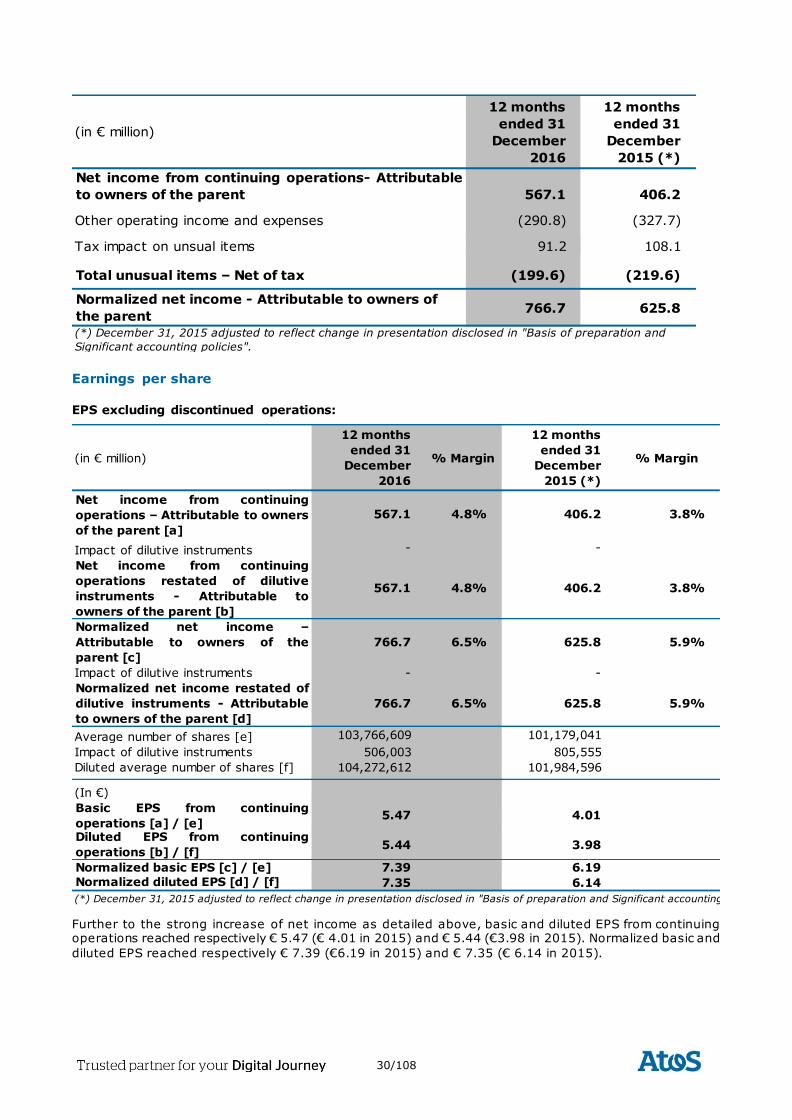
30/108
Earnings per share
EPS excluding discontinued operations:
Further to the strong increase of net income as detailed above, basic and diluted EPS from continuing operations reached respectively € 5.47 (€ 4.01 in 2015) and € 5.44 (€3.98 in 2015). Normalized basic and
diluted EPS reached respectively € 7.39 (€6.19 in 2015) and € 7.35 (€ 6.14 in 2015).
(in € million)
12 months
ended 31
December
2016
12 months
ended 31
December
2015 (*)
Net income from continuing operations- Attributable
to owners of the parent 567.1 406.2
Other operating income and expenses (290.8) (327.7)
Tax impact on unsual items 91.2 108.1
Total unusual items – Net of tax (199.6) (219.6)
Normalized net income - Attributable to owners of
the parent 766.7 625.8
(*) December 31, 2015 adjusted to reflect change in presentation disclosed in "Basis of preparation and
Significant accounting policies".
(in € million)
12 months
ended 31
December
2016
% Margin
12 months
ended 31
December
2015 (*)
% Margin
Net income from continuing
operations – Attributable to owners
of the parent [a]
567.1 4.8% 406.2 3.8%
Impact of dilutive instruments - -
Net income from continuing
operations restated of dilutive
instruments - Attributable to
owners of the parent [b]
567.1 4.8% 406.2 3.8%
Normalized net income –
Attributable to owners of the
parent [c]
766.7 6.5% 625.8 5.9%
Impact of dilutive instruments - -
Normalized net income restated of
dilutive instruments - Attributable
to owners of the parent [d]
766.7 6.5% 625.8 5.9%
Average number of shares [e] 103,766,609 101,179,041
Impact of dilutive instruments 506,003 805,555
Diluted average number of shares [f] 104,272,612 101,984,596
(In €)
Basic EPS from continuing
operations [a] / [e]5.47 4.01
Diluted EPS from continuing
operations [b] / [f]5.44 3.98
Normalized basic EPS [c] / [e] 7.39 6.19
Normalized diluted EPS [d] / [f] 7.35 6.14
(*) December 31, 2015 adjusted to reflect change in presentation disclosed in "Basis of preparation and Significant accounting policies".
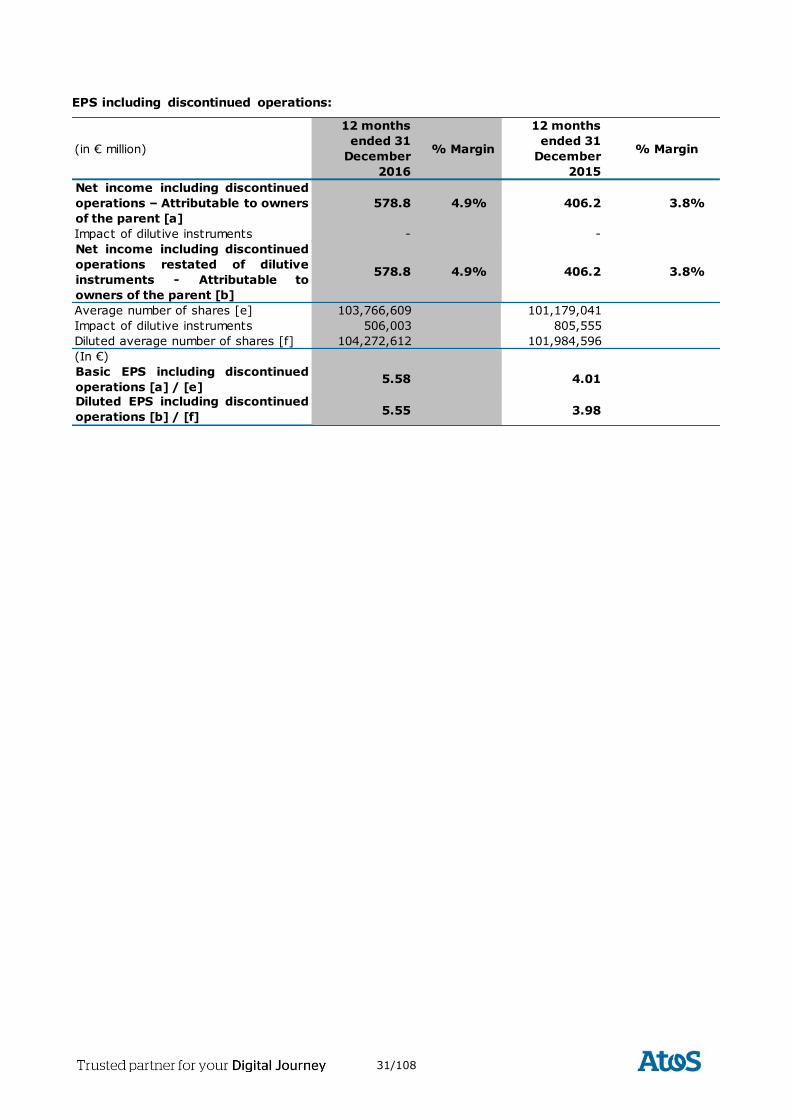
31/108
EPS including discontinued operations:
(in € million)
12 months
ended 31
December
2016
% Margin
12 months
ended 31
December
2015
% Margin
Net income including discontinued
operations – Attributable to owners
of the parent [a]
578.8 4.9% 406.2 3.8%
Impact of dilutive instruments - -
Net income including discontinued
operations restated of dilutive
instruments - Attributable to
owners of the parent [b]
578.8 4.9% 406.2 3.8%
Average number of shares [e] 103,766,609 101,179,041
Impact of dilutive instruments 506,003 805,555
Diluted average number of shares [f] 104,272,612 101,984,596
(In €)
Basic EPS including discontinued
operations [a] / [e]5.58 4.01
Diluted EPS including discontinued
operations [b] / [f]5.55 3.98
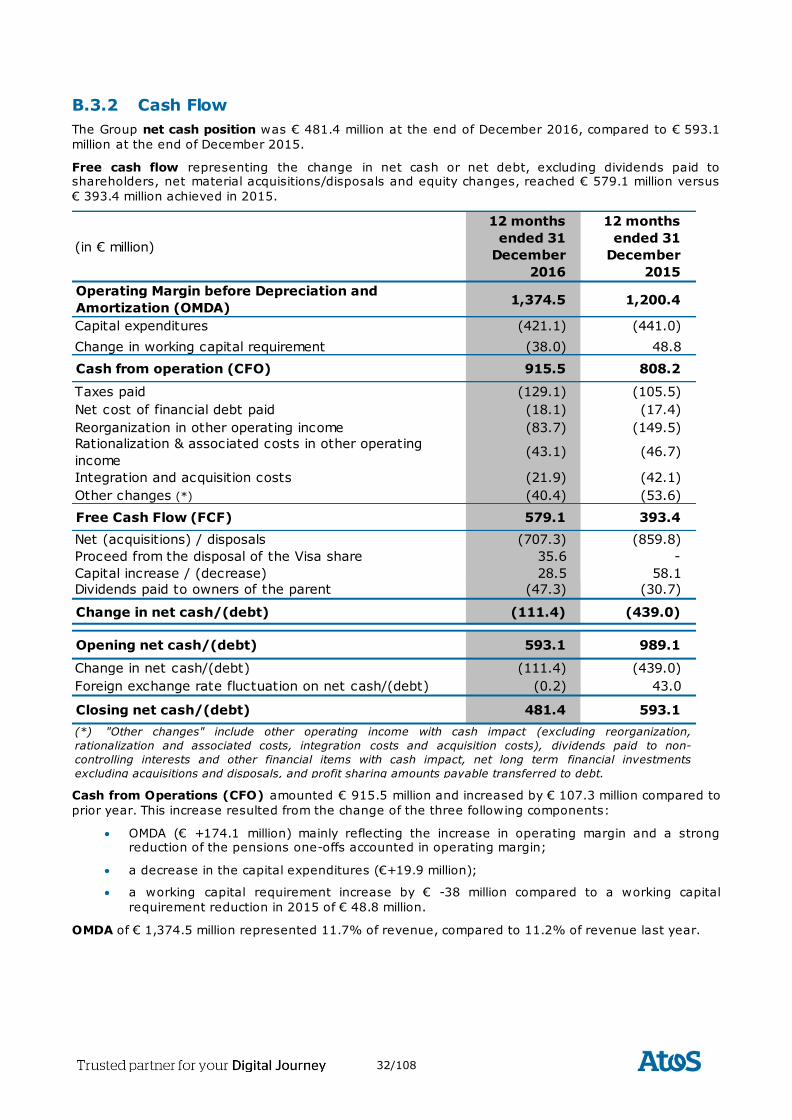
32/108
B.3.2 Cash Flow
The Group net cash position was € 481.4 million at the end of December 2016, compared to € 593.1
million at the end of December 2015.
Free cash flow representing the change in net cash or net debt, excluding dividends paid to shareholders, net material acquisitions/disposals and equity changes, reached € 579.1 million versus
€ 393.4 million achieved in 2015.
Cash from Operations (CFO) amounted € 915.5 million and increased by € 107.3 million compared to
prior year. This increase resulted from the change of the three following components:
OMDA (€ +174.1 million) mainly reflecting the increase in operating margin and a strong reduction of the pensions one-offs accounted in operating margin;
a decrease in the capital expenditures (€+19.9 million);
a working capital requirement increase by € -38 million compared to a working capital
requirement reduction in 2015 of € 48.8 million.
OMDA of € 1,374.5 million represented 11.7% of revenue, compared to 11.2% of revenue last year.
(in € million)
12 months
ended 31
December
2016
12 months
ended 31
December
2015
Operating Margin before Depreciation and
Amortization (OMDA)1,374.5 1,200.4
Capital expenditures (421.1) (441.0)
Change in working capital requirement (38.0) 48.8
Cash from operation (CFO) 915.5 808.2
Taxes paid (129.1) (105.5)
Net cost of financial debt paid (18.1) (17.4)
Reorganization in other operating income (83.7) (149.5)
Rationalization & associated costs in other operating
income (43.1) (46.7)
Integration and acquisition costs (21.9) (42.1)
Other changes (*) (40.4) (53.6)
Free Cash Flow (FCF) 579.1 393.4
Net (acquisitions) / disposals (707.3) (859.8)
Proceed from the disposal of the Visa share 35.6 -
Capital increase / (decrease) 28.5 58.1
Dividends paid to owners of the parent (47.3) (30.7)
Change in net cash/(debt) (111.4) (439.0)
Opening net cash/(debt) 593.1 989.1
Change in net cash/(debt) (111.4) (439.0)
Foreign exchange rate fluctuation on net cash/(debt) (0.2) 43.0
Closing net cash/(debt) 481.4 593.1
(*) "Other changes" include other operating income with cash impact (excluding reorganization,
rationalization and associated costs, integration costs and acquisition costs), dividends paid to non-
controlling interests and other financial items with cash impact, net long term financial investments
excluding acquisitions and disposals, and profit sharing amounts payable transferred to debt.
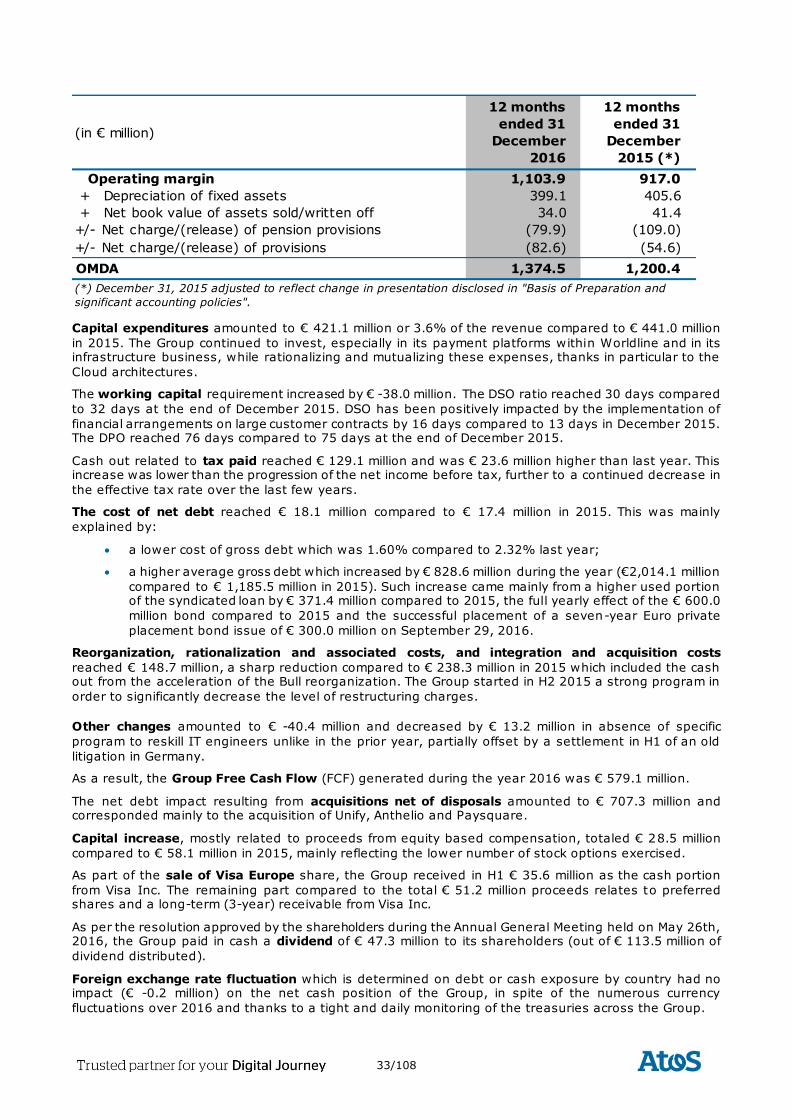
33/108
Capital expenditures amounted to € 421.1 million or 3.6% of the revenue compared to € 441.0 million
in 2015. The Group continued to invest, especially in its payment platforms within Worldline and in its infrastructure business, while rationalizing and mutualizing these expenses, thanks in particular to the
Cloud architectures.
The working capital requirement increased by € -38.0 million. The DSO ratio reached 30 days compared
to 32 days at the end of December 2015. DSO has been positively impacted by the implementation of
financial arrangements on large customer contracts by 16 days compared to 13 days in December 2015. The DPO reached 76 days compared to 75 days at the end of December 2015.
Cash out related to tax paid reached € 129.1 million and was € 23.6 million higher than last year. This increase was lower than the progression of the net income before tax, further to a continued decrease in
the effective tax rate over the last few years.
The cost of net debt reached € 18.1 million compared to € 17.4 million in 2015. This was mainly
explained by:
a lower cost of gross debt which was 1.60% compared to 2.32% last year;
a higher average gross debt which increased by € 828.6 million during the year (€2,014.1 million
compared to € 1,185.5 million in 2015). Such increase came mainly from a higher used portion of the syndicated loan by € 371.4 million compared to 2015, the full yearly effect of the € 600.0
million bond compared to 2015 and the successful placement of a seven-year Euro private
placement bond issue of € 300.0 million on September 29, 2016.
Reorganization, rationalization and associated costs, and integration and acquisition costs
reached € 148.7 million, a sharp reduction compared to € 238.3 million in 2015 which included the cash out from the acceleration of the Bull reorganization. The Group started in H2 2015 a strong program in
order to significantly decrease the level of restructuring charges.
Other changes amounted to € -40.4 million and decreased by € 13.2 million in absence of specific
program to reskill IT engineers unlike in the prior year, partially offset by a settlement in H1 of an old
litigation in Germany.
As a result, the Group Free Cash Flow (FCF) generated during the year 2016 was € 579.1 million.
The net debt impact resulting from acquisitions net of disposals amounted to € 707.3 million and corresponded mainly to the acquisition of Unify, Anthelio and Paysquare.
Capital increase, mostly related to proceeds from equity based compensation, totaled € 28.5 million
compared to € 58.1 million in 2015, mainly reflecting the lower number of stock options exercised.
As part of the sale of Visa Europe share, the Group received in H1 € 35.6 million as the cash portion
from Visa Inc. The remaining part compared to the total € 51.2 million proceeds relates to preferred shares and a long-term (3-year) receivable from Visa Inc.
As per the resolution approved by the shareholders during the Annual General Meeting held on May 26th, 2016, the Group paid in cash a dividend of € 47.3 million to its shareholders (out of € 113.5 million of
dividend distributed).
Foreign exchange rate fluctuation which is determined on debt or cash exposure by country had no impact (€ -0.2 million) on the net cash position of the Group, in spite of the numerous currency
fluctuations over 2016 and thanks to a tight and daily monitoring of the treasuries across the Group.
(in € million)
12 months
ended 31
December
2016
12 months
ended 31
December
2015 (*)
Operating margin 1,103.9 917.0
+ Depreciation of fixed assets 399.1 405.6
+ Net book value of assets sold/written off 34.0 41.4
+/- Net charge/(release) of pension provisions (79.9) (109.0)
+/- Net charge/(release) of provisions (82.6) (54.6)
OMDA 1,374.5 1,200.4
(*) December 31, 2015 adjusted to reflect change in presentation disclosed in "Basis of Preparation and
significant accounting policies".
34/108
B.3.3 Financing policy
Atos has implemented a strict financing policy which is reviewed by the Group Audit Committee, with the
objective to secure and optimize the Group’s liqu idity management. Each decision regarding external
financing is approved by the Board of Directors. Under this policy, all Group treasury activities, including cash management, short-term investments, hedging and foreign exchange transactions, as well as o ff-
balance sheet financing through operating leases, are centrally managed through the Group Treasury department. Following a cautious short term financial policy, the Group did not make any short term cash
investment in risky assets.
B.3.3.1 Financing structure
Atos’ policy is to fully cover its expected liquidity requirements by long-term committed loans or other appropriate long-term financial instruments. Terms and conditions of these loans include maturity and
covenants leaving sufficient flexibility for the Group to finance its operations and expected developments.
On September 29, 2016, Atos issued a Euro private placement bond of € 300.0 million with a seven-year
maturity and with a 1.444% fixed interest rate. Atos and the bonds are unrated. There are no financial
covenants.
On July 2, 2015 Atos issued a bond of € 600.0 million with a 5-year maturity. The coupon rate is
2.375%. Atos and the bonds are unrated. There are no financial covenants.
On November 6, 2014, Atos signed with a number of major financia l institutions a five-year € 1.8 billion
credit facility maturing in November 2019 with an option for Atos to request the extension of the Facility
maturity date until November 2021. The first option of extension for one year was exercised in 2015 and the second option of extension for one year has been exercised in 2016. Therefore the new maturity of the
€ 1.8 billion credit facility is November 2021. The facility is available for general corporate purposes and replaced the existing € 1.2 billion facility signed in April 2011.
The revolving credit facility includes one financial covenant which under the terms is the consolidated leverage ratio (net debt divided by operating margin before depreciation and amortization) which may not
be greater than 2.5 times.
Atos securitization program of trade receivables has been renewed for 5 years on June 18th, 2013 with a maximum amount of receivables sold of € 500.0 million and a maximum amount of financing of € 200.0
million.
The program is structured with two compartments, called ON and OFF:
Compartment “ON” is similar to the previous program (i.e. the receivables are maintained in the
Group balance sheet) which remains by default the compartment in which the receivables are sold. This compartment was used at its lower level;
Compartment “OFF” is designed so the credit risk (insolvency and overdue) of the debtors eligible to this compartment of the program is fully transferred to the purchasing entity of a third party
financial institution.
As of December 31, 2016, the Group has sold:
In the compartment “ON” € 257.5 million receivables for which € 9.8 million were received in
cash. The sale is with recourse, thus re-consolidated in the balance sheet;
In the compartment “OFF” € 41.5 million receivables which qualify for de-recognition as
substantially all risks and rewards associated with the receivables were transferred.
Financial covenants of the Atos securitization program are the consolidated leverage ratio (net debt
divided by Operating Margin before Depreciation and Amortization) which may not be greater than 2.5
times and the consolidated interest cover ratio (Operating Margin divided by the net cost of financial debt) which may not be less than 4 times.
B.3.3.2 Bank covenants
The Group was well within its borrowing covenant for the multi-currency revolving credit facility, with a
consolidated leverage ratio (net debt divided by OMDA) of -0.35 at the end of December 2016 (the ratio is negative due to the net cash position of the Group at the end of December 2016). The consolidated
leverage ratio must not be greater than 2.5 times under the terms of the multi-currency revolving credit facility.
35/108
The Group was also well within the limit of the consolidated interest cover ratio which apply only to the
Atos securitization program of trade receivables. The consolidated interest cover was 60.99 (Operating Margin divided by the net cost of financial debt which may not be less than 4 times).
B.3.3.3 Investment policy
Atos has a policy to lease its office space and data processing centers. Some fixed assets such as IT
equipment and company cars may be financed through leases. The Group Treasury department evaluates and approves the type of financing for each new investment.
B.3.3.4 Hedging policy
Atos’ objective is also to protect the Group against fluctuations in interest rates by swapping to fixed rate a portion of the existing floating-rate financial debt. Authorized derivative instruments used to hedge the
debt are swap contracts, entered into with leading financial institutions and centrally managed by the
Group Treasury department.
At the end of 2016, the Group did not have any interest hedging contract.
36/108
B.4 Consolidated financial statements
B.4.1 Statutory Auditors’ report on the consolidated financial
statements for the year ended December 31, 2016
Atos consolidated and statutory financial statements for the year ended December 31, 2016, were
approved by the Board of Directors on February 21, 2017. Audit procedures on these financial statements
have been performed by the statutory auditors and their audit reports will be issued after the completion
of the specific verifications required by French law and of procedures for the purposes of the Registration
Document filing.
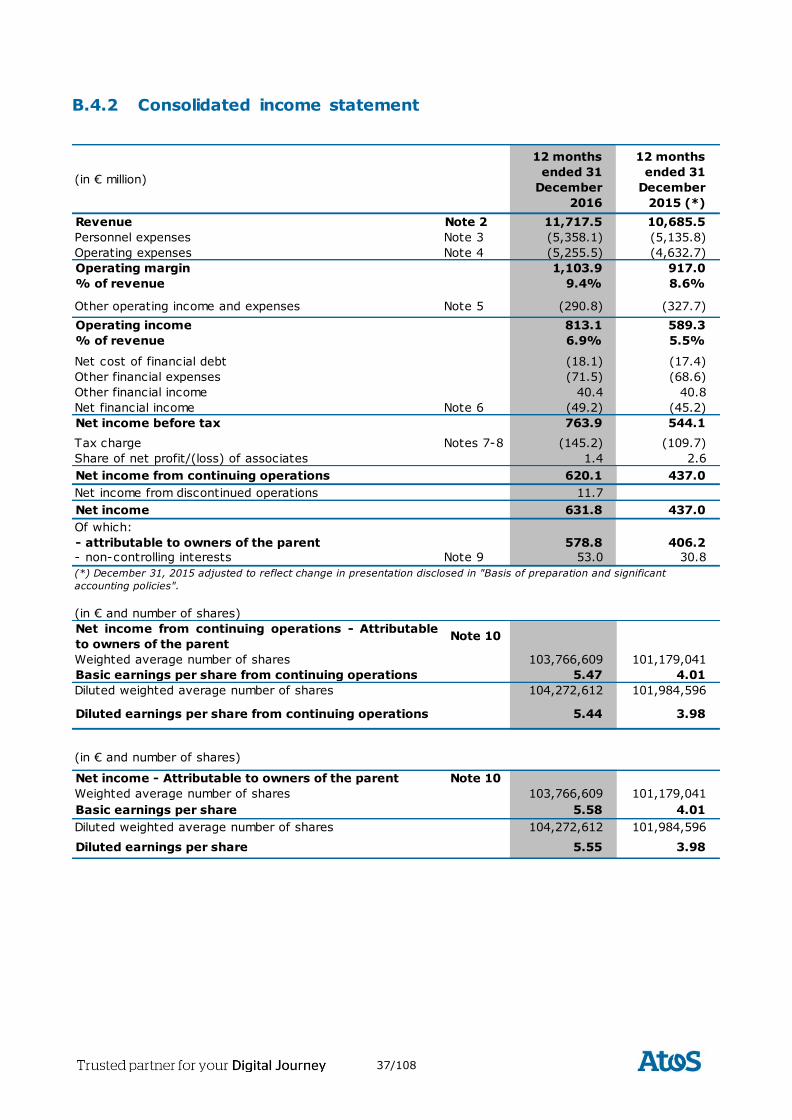
37/108
B.4.2 Consolidated income statement
(in € million)
12 months
ended 31
December
2016
12 months
ended 31
December
2015 (*)
Revenue Note 2 11,717.5 10,685.5
Personnel expenses Note 3 (5,358.1) (5,135.8)
Operating expenses Note 4 (5,255.5) (4,632.7)
Operating margin 1,103.9 917.0
% of revenue 9.4% 8.6%
Other operating income and expenses Note 5 (290.8) (327.7)
Operating income 813.1 589.3
% of revenue 6.9% 5.5%
Net cost of financial debt (18.1) (17.4)
Other financial expenses (71.5) (68.6)
Other financial income 40.4 40.8
Net financial income Note 6 (49.2) (45.2)
Net income before tax 763.9 544.1
Tax charge Notes 7-8 (145.2) (109.7)
Share of net profit/(loss) of associates 1.4 2.6
Net income from continuing operations 620.1 437.0
Net income from discontinued operations 11.7
Net income 631.8 437.0
Of which:
- attributable to owners of the parent 578.8 406.2
- non-controlling interests Note 9 53.0 30.8
(in € and number of shares)
Net income from continuing operations - Attributable
to owners of the parentNote 10
Weighted average number of shares 103,766,609 101,179,041
Basic earnings per share from continuing operations 5.47 4.01
Diluted weighted average number of shares 104,272,612 101,984,596
Diluted earnings per share from continuing operations 5.44 3.98
(in € and number of shares)
Net income - Attributable to owners of the parent Note 10
Weighted average number of shares 103,766,609 101,179,041
Basic earnings per share 5.58 4.01
Diluted weighted average number of shares 104,272,612 101,984,596
Diluted earnings per share 5.55 3.98
(*) December 31, 2015 adjusted to reflect change in presentation disclosed in "Basis of preparation and significant
accounting policies".
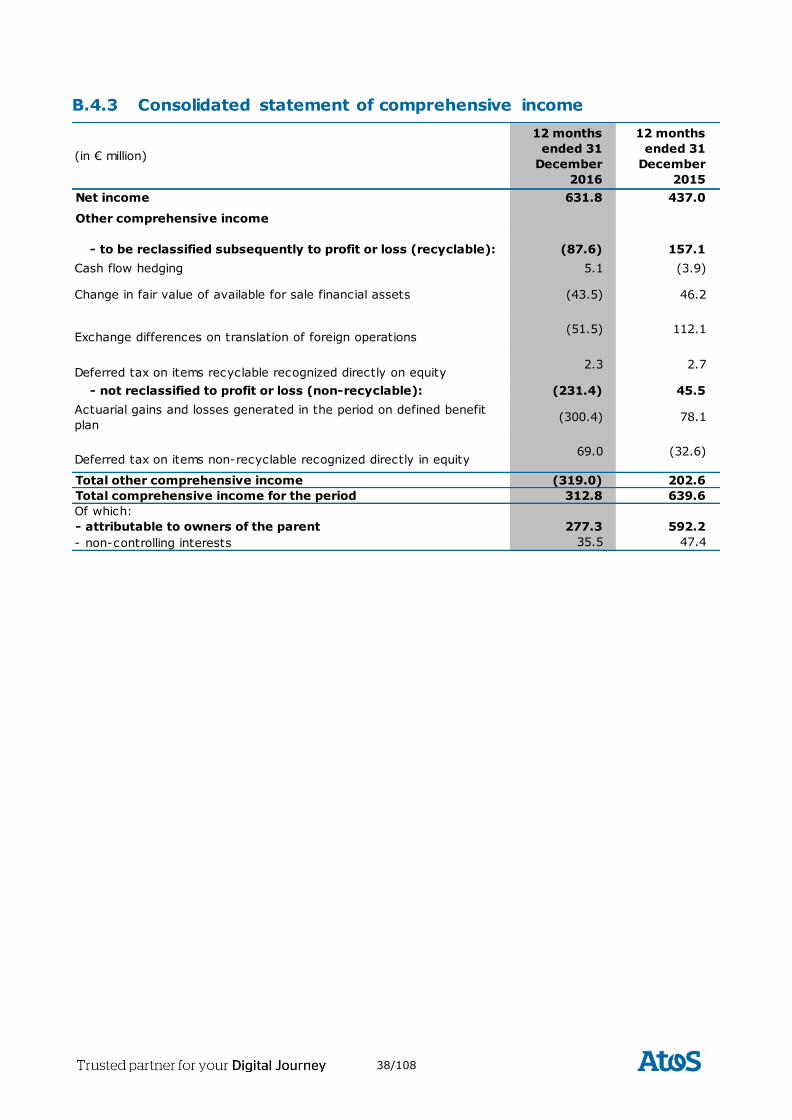
38/108
B.4.3 Consolidated statement of comprehensive income
(in € million)
12 months
ended 31
December
2016
12 months
ended 31
December
2015
Net income 631.8 437.0
Other comprehensive income
(87.6) 157.1
Cash flow hedging 5.1 (3.9)
Change in fair value of available for sale financial assets (43.5) 46.2
(51.5) 112.1
2.3 2.7
(231.4) 45.5
(300.4) 78.1
69.0 (32.6)
Total other comprehensive income (319.0) 202.6
Total comprehensive income for the period 312.8 639.6
Of which:
- attributable to owners of the parent 277.3 592.2
- non-controlling interests 35.5 47.4
Actuarial gains and losses generated in the period on defined benefit
plan
- to be reclassified subsequently to profit or loss (recyclable):
Exchange differences on translation of foreign operations
Deferred tax on items recyclable recognized directly on equity
- not reclassified to profit or loss (non-recyclable):
Deferred tax on items non-recyclable recognized directly in equity
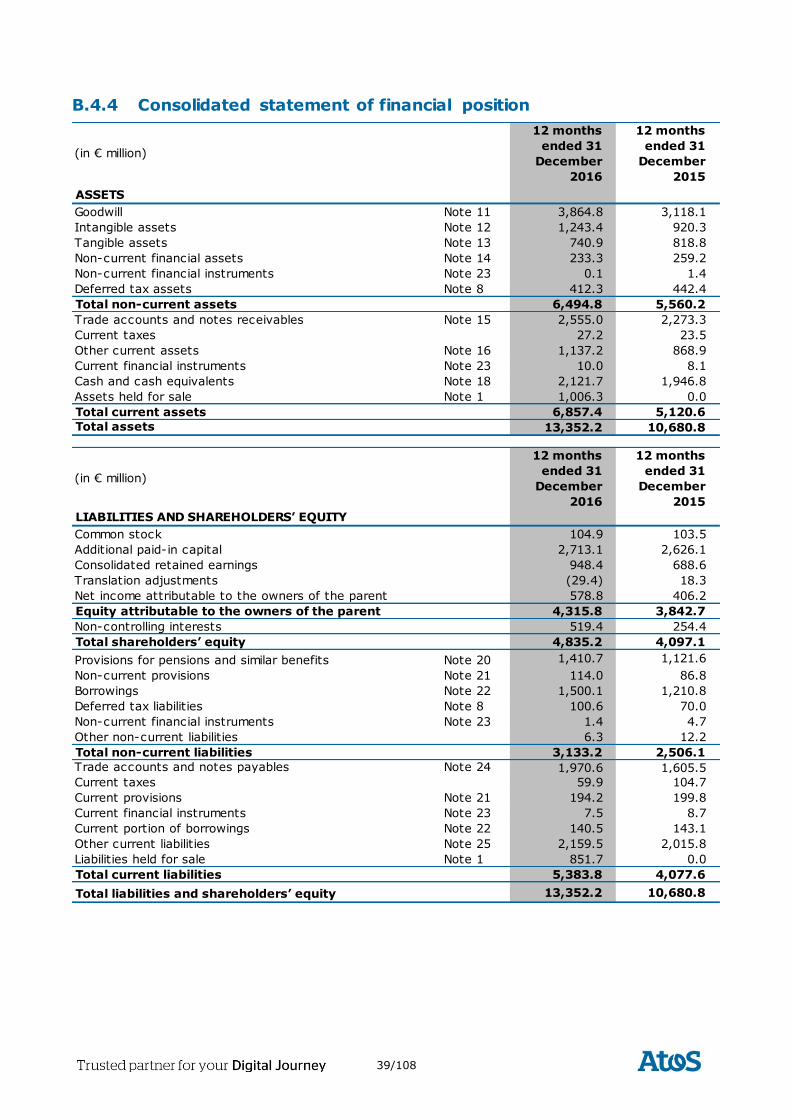
39/108
B.4.4 Consolidated statement of financial position
(in € million)
12 months
ended 31
December
2016
12 months
ended 31
December
2015
ASSETS
Goodwill Note 11 3,864.8 3,118.1
Intangible assets Note 12 1,243.4 920.3
Tangible assets Note 13 740.9 818.8
Non-current financial assets Note 14 233.3 259.2
Non-current financial instruments Note 23 0.1 1.4
Deferred tax assets Note 8 412.3 442.4
Total non-current assets 6,494.8 5,560.2
Trade accounts and notes receivables Note 15 2,555.0 2,273.3
Current taxes 27.2 23.5
Other current assets Note 16 1,137.2 868.9
Current financial instruments Note 23 10.0 8.1
Cash and cash equivalents Note 18 2,121.7 1,946.8
Assets held for sale Note 1 1,006.3 0.0
Total current assets 6,857.4 5,120.6
Total assets 13,352.2 10,680.8
(in € million)
12 months
ended 31
December
2016
12 months
ended 31
December
2015
LIABILITIES AND SHAREHOLDERS’ EQUITY
Common stock 104.9 103.5
Additional paid-in capital 2,713.1 2,626.1
Consolidated retained earnings 948.4 688.6
Translation adjustments (29.4) 18.3
Net income attributable to the owners of the parent 578.8 406.2
Equity attributable to the owners of the parent 4,315.8 3,842.7
Non-controlling interests 519.4 254.4
Total shareholders’ equity 4,835.2 4,097.1
Provisions for pensions and similar benefits Note 20 1,410.7 1,121.6
Non-current provisions Note 21 114.0 86.8
Borrowings Note 22 1,500.1 1,210.8
Deferred tax liabilities Note 8 100.6 70.0
Non-current financial instruments Note 23 1.4 4.7
Other non-current liabilities 6.3 12.2
Total non-current liabilities 3,133.2 2,506.1
Trade accounts and notes payables Note 24 1,970.6 1,605.5
Current taxes 59.9 104.7
Current provisions Note 21 194.2 199.8
Current financial instruments Note 23 7.5 8.7
Current portion of borrowings Note 22 140.5 143.1
Other current liabilities Note 25 2,159.5 2,015.8
Liabilities held for sale Note 1 851.7 0.0
Total current liabilities 5,383.8 4,077.6
Total liabilities and shareholders’ equity 13,352.2 10,680.8
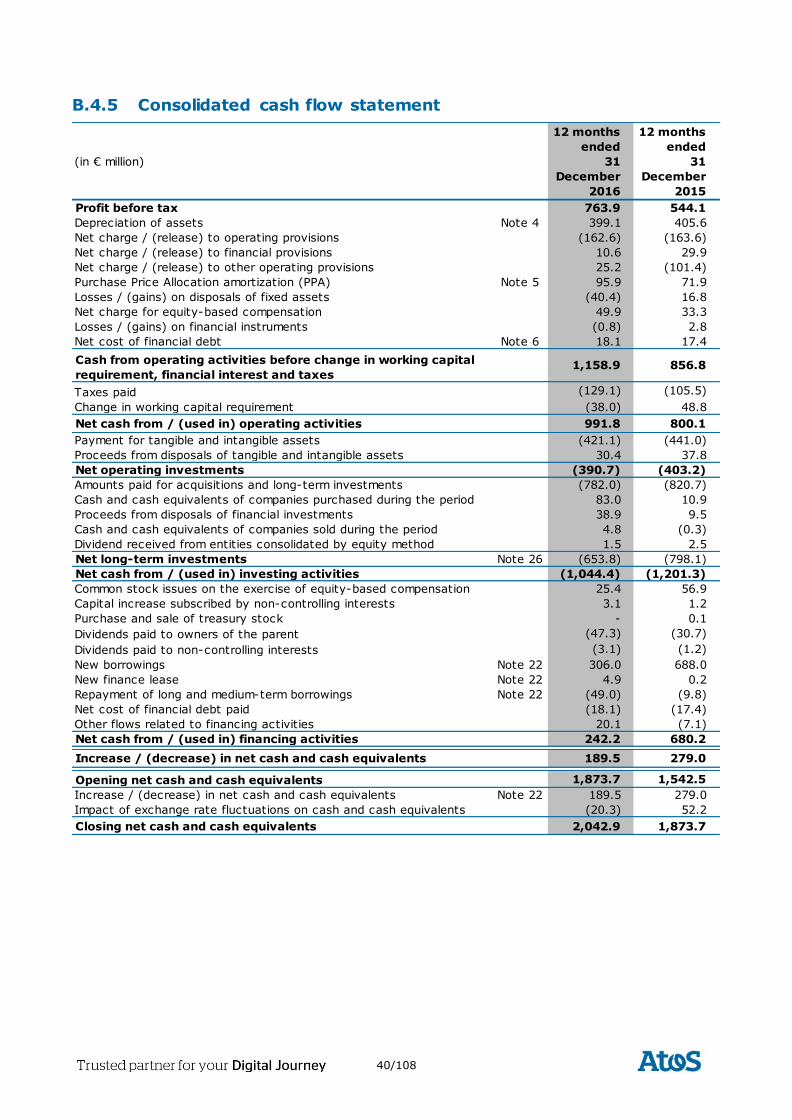
40/108
B.4.5 Consolidated cash flow statement
(in € million)
12 months
ended
31
December
2016
12 months
ended
31
December
2015
Profit before tax 763.9 544.1
Depreciation of assets Note 4 399.1 405.6
Net charge / (release) to operating provisions (162.6) (163.6)
Net charge / (release) to financial provisions 10.6 29.9
Net charge / (release) to other operating provisions 25.2 (101.4)
Purchase Price Allocation amortization (PPA) Note 5 95.9 71.9
Losses / (gains) on disposals of fixed assets (40.4) 16.8
Net charge for equity-based compensation 49.9 33.3
Losses / (gains) on financial instruments (0.8) 2.8
Net cost of financial debt Note 6 18.1 17.4
Cash from operating activities before change in working capital
requirement, financial interest and taxes1,158.9 856.8
Taxes paid (129.1) (105.5)
Change in working capital requirement (38.0) 48.8
Net cash from / (used in) operating activities 991.8 800.1
Payment for tangible and intangible assets (421.1) (441.0)
Proceeds from disposals of tangible and intangible assets 30.4 37.8
Net operating investments (390.7) (403.2)
Amounts paid for acquisitions and long-term investments (782.0) (820.7)
Cash and cash equivalents of companies purchased during the period 83.0 10.9
Proceeds from disposals of financial investments 38.9 9.5
Cash and cash equivalents of companies sold during the period 4.8 (0.3)
Dividend received from entities consolidated by equity method 1.5 2.5
Net long-term investments Note 26 (653.8) (798.1)
Net cash from / (used in) investing activities (1,044.4) (1,201.3)
Common stock issues on the exercise of equity-based compensation 25.4 56.9
Capital increase subscribed by non-controlling interests 3.1 1.2
Purchase and sale of treasury stock - 0.1
Dividends paid to owners of the parent (47.3) (30.7)
Dividends paid to non-controlling interests (3.1) (1.2)
New borrowings Note 22 306.0 688.0
New finance lease Note 22 4.9 0.2
Repayment of long and medium-term borrowings Note 22 (49.0) (9.8)
Net cost of financial debt paid (18.1) (17.4)
Other flows related to financing activities 20.1 (7.1)
Net cash from / (used in) financing activities 242.2 680.2
Increase / (decrease) in net cash and cash equivalents 189.5 279.0
Opening net cash and cash equivalents 1,873.7 1,542.5
Increase / (decrease) in net cash and cash equivalents Note 22 189.5 279.0
Impact of exchange rate fluctuations on cash and cash equivalents (20.3) 52.2
Closing net cash and cash equivalents 2,042.9 1,873.7
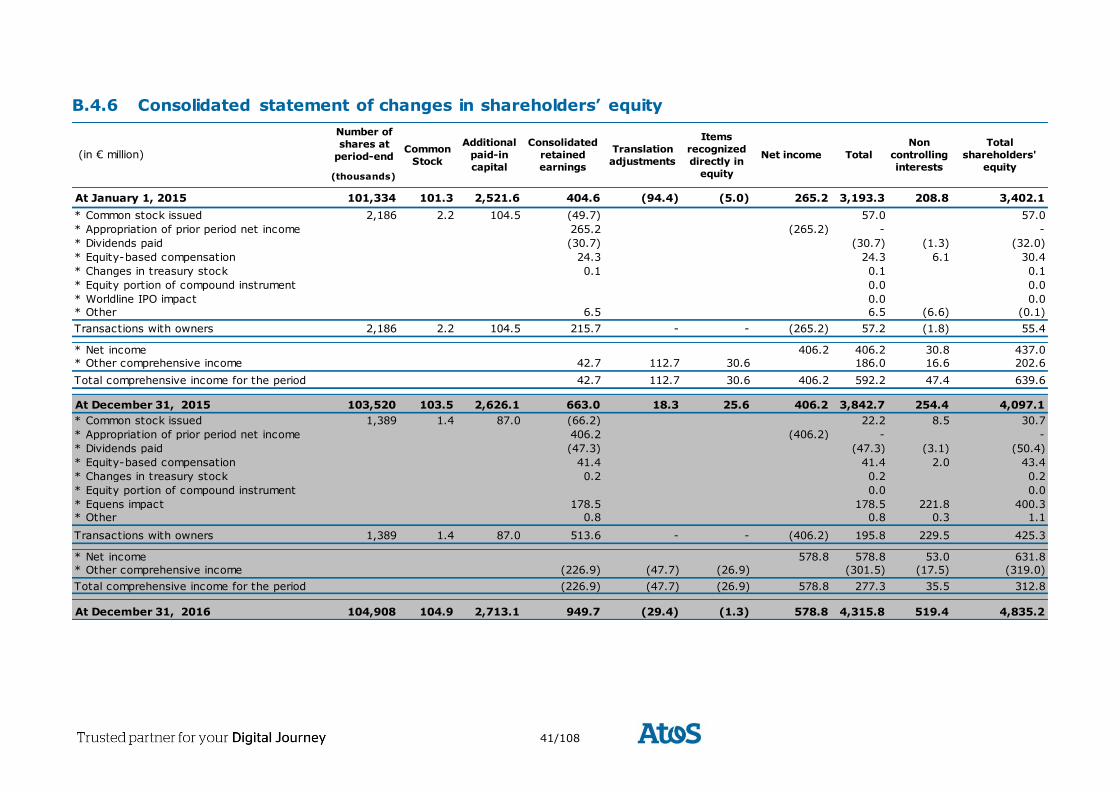
41/108
B.4.6 Consolidated statement of changes in shareholders’ equity
Number of
shares at
period-end
(thousands)
At January 1, 2015 101,334 101.3 2,521.6 404.6 (94.4) (5.0) 265.2 3,193.3 208.8 3,402.1
* Common stock issued 2,186 2.2 104.5 (49.7) 57.0 57.0
* Appropriation of prior period net income 265.2 (265.2) - -
* Dividends paid (30.7) (30.7) (1.3) (32.0)
* Equity-based compensation 24.3 24.3 6.1 30.4
* Changes in treasury stock 0.1 0.1 0.1
* Equity portion of compound instrument 0.0 0.0
* Worldline IPO impact 0.0 0.0
* Other 6.5 6.5 (6.6) (0.1)
Transactions with owners 2,186 2.2 104.5 215.7 - - (265.2) 57.2 (1.8) 55.4
* Net income 406.2 406.2 30.8 437.0
* Other comprehensive income 42.7 112.7 30.6 186.0 16.6 202.6
Total comprehensive income for the period 42.7 112.7 30.6 406.2 592.2 47.4 639.6
At December 31, 2015 103,520 103.5 2,626.1 663.0 18.3 25.6 406.2 3,842.7 254.4 4,097.1
* Common stock issued 1,389 1.4 87.0 (66.2) 22.2 8.5 30.7
* Appropriation of prior period net income 406.2 (406.2) - -
* Dividends paid (47.3) (47.3) (3.1) (50.4)
* Equity-based compensation 41.4 41.4 2.0 43.4
* Changes in treasury stock 0.2 0.2 0.2
* Equity portion of compound instrument 0.0 0.0
* Equens impact 178.5 178.5 221.8 400.3
* Other 0.8 0.8 0.3 1.1
Transactions with owners 1,389 1.4 87.0 513.6 - - (406.2) 195.8 229.5 425.3
* Net income 578.8 578.8 53.0 631.8
* Other comprehensive income (226.9) (47.7) (26.9) (301.5) (17.5) (319.0)
Total comprehensive income for the period (226.9) (47.7) (26.9) 578.8 277.3 35.5 312.8
At December 31, 2016 104,908 104.9 2,713.1 949.7 (29.4) (1.3) 578.8 4,315.8 519.4 4,835.2
Total
shareholders'
equity
Items
recognized
directly in
equity
Net income Total
Non
controlling
interests
(in € million)Additional
paid-in
capital
Consolidated
retained
earnings
Translation
adjustments
Common
Stock
42/108
B.4.7 Notes to the consolidated financial statements
B.4.7.1 General information
Atos SE, the Group's parent company, is a société européenne (public limited company) incorporated
under French law, whose registered office is located at 80, Quai Voltaire, 95870 Bezons, France. It is registered with the Registry of Commerce and Companies of Pontoise under the reference 323 623 603.
Atos SE shares are traded on the NYSE Euronext Paris market under ISIN code FR0000051732. The
shares are not listed on any other stock exchange. The Company is administrated by a Board of Directors.
The consolidated financial statements of the Group for the twelve months ended December 31, 2016 comprise the Group and its subsidiaries (together referred to as the “Group”) and the Group’s interests in
associates and jointly controlled entities.
These consolidated financial statements were approved by the Board of Directors on February 21, 2017.
The consolidated financial statements will then be submitted to the approval of the General Meeting of
Shareholders scheduled to take place on May 24, 2017.
B.4.7.2 Basis of preparation and significant accounting policies
Basis of preparation
Pursuant to European Regulation No. 1606/2002 of July 19, 2002, the consolidated financial statements for the twelve months ended December 31, 2016 have been prepared in accordance with the applicable
international accounting standards, as endorsed by the European Union as at December 31, 2016. The international standards comprise the International Financial Reporting Standards (IFRS) as issued by the
International Accounting Standards Board (IASB), the International Accounting Standards (IAS), the
interpretations of the Standing Interpretations Committee (SIC) and the International Financial Reporting Interpretations Committee (IFRIC).
Accounting policies applied by the Group comply with those standards and interpretations, which can be found at: http://ec.europa.eu/internal_market/accounting/ias/index_en.htm
As of December 31, 2016 the accounting standards and interpretations endorsed by the European Union
are similar to the compulsory standards and interpretations published by the International Accounting Standards Board (IASB). Consequently, the Group’s consolidated financial statements are prepared in
accordance with the IFRS standards and interpretations, as published by the IASB.
The new standards, interpretations or amendments whose application was mandatory for the Group
effective for the fiscal year beginning January 1, 2016 had no material impact on the consolidated financial statements:
Amendments to IFRS 10, IFRS 12 and IAS 28 Investments Entities : Applying the Consolidation
Exception;
Amendment to IFRS 11 Accounting for Acquisitions of Interests in Joint Operations;
Amendment to IAS 1 Disclosure Initiative;
Amendment to IAS 16 and IAS 38 Clarification of Acceptable Methods of Depreciation and
Amortization;
Amendments to IAS 27 Equity Method in Separate Financial Statements;
Amendments to IFRSs Annual Improvements to IFRSs 2012-2014 Cycle.
A number of new standards and amendments to standards published in 2016 are effective for annual periods beginning after January 1, 2017 and earlier application is permitted. However, the Atos Group
has not early applied the following new or amended standards in preparing these consolidated statements.
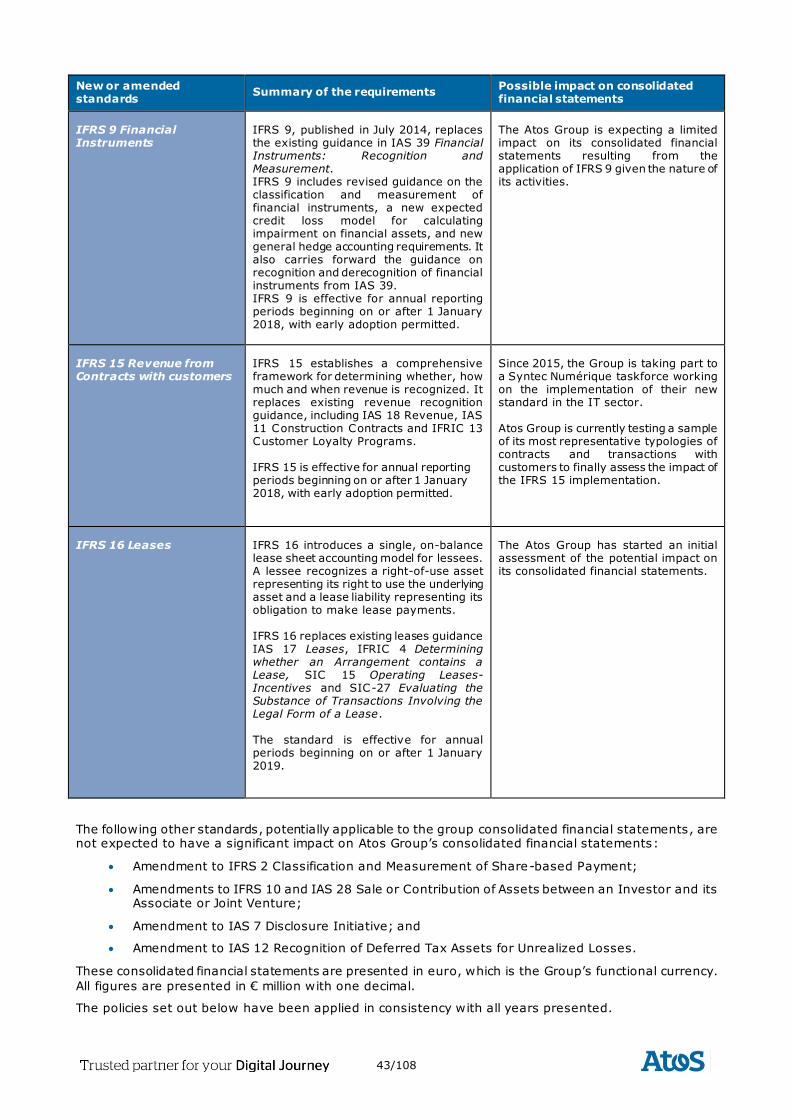
43/108
New or amended standards
Summary of the requirements Possible impact on consolidated financial statements
IFRS 9 Financial Instruments
IFRS 9, published in July 2014, replaces the existing guidance in IAS 39 Financial Instruments: Recognition and Measurement. IFRS 9 includes revised guidance on the classification and measurement of financial instruments, a new expected credit loss model for calculating impairment on financial assets, and new general hedge accounting requirements. It also carries forward the guidance on recognition and derecognition of financial instruments from IAS 39. IFRS 9 is effective for annual reporting periods beginning on or after 1 January 2018, with early adoption permitted.
The Atos Group is expecting a limited impact on its consolidated financial statements resulting from the application of IFRS 9 given the nature of its activities.
IFRS 15 Revenue from Contracts with customers
IFRS 15 establishes a comprehensive framework for determining whether, how much and when revenue is recognized. It replaces existing revenue recognition guidance, including IAS 18 Revenue, IAS 11 Construction Contracts and IFRIC 13 Customer Loyalty Programs. IFRS 15 is effective for annual reporting periods beginning on or after 1 January 2018, with early adoption permitted.
Since 2015, the Group is taking part to a Syntec Numérique taskforce working on the implementation of their new standard in the IT sector.
Atos Group is currently testing a sample of its most representative typologies of contracts and transactions with customers to finally assess the impact of the IFRS 15 implementation.
IFRS 16 Leases
IFRS 16 introduces a single, on-balance lease sheet accounting model for lessees. A lessee recognizes a right-of-use asset representing its right to use the underlying asset and a lease liability representing its obligation to make lease payments. IFRS 16 replaces existing leases guidance IAS 17 Leases, IFRIC 4 Determining whether an Arrangement contains a Lease, SIC 15 Operating Leases-Incentives and SIC-27 Evaluating the Substance of Transactions Involving the Legal Form of a Lease. The standard is effective for annual periods beginning on or after 1 January 2019.
The Atos Group has started an initial assessment of the potential impact on its consolidated financial statements.
The following other standards, potentially applicable to the group consolidated financial statements, are not expected to have a significant impact on Atos Group’s consolidated financial statements:
Amendment to IFRS 2 Classification and Measurement of Share-based Payment;
Amendments to IFRS 10 and IAS 28 Sale or Contribution of Assets between an Investor and its Associate or Joint Venture;
Amendment to IAS 7 Disclosure Initiative; and
Amendment to IAS 12 Recognition of Deferred Tax Assets for Unrealized Losses.
These consolidated financial statements are presented in euro, which is the Group’s functional currency.
All figures are presented in € million with one decimal.
The policies set out below have been applied in consistency with all years presented.
44/108
Accounting estimates and judgments
The preparation of consolidated financial statements requires management to make judgments, estimates and assumptions that affect the reported amounts of assets and liabilities, income and expense
in the financial statements and disclosures of contingent assets and liabilities at the closing date. The
estimates, assumptions and judgments that may result in a significant adjustment to the carrying amounts of assets and liabilities are essentially related to:
Goodwill impairment tests
The Group tests at least annually whether goodwill has suffered any impairment, in accordance with the
accounting policies stated below. The recoverable amounts of cash generating units are determined based on value-in-use calculations or on their fair value reduced by the costs of sales. These calculations
require the use of estimates as described in Note 11 Goodwill.
Measurement of recognized tax loss carry-forwards
Deferred tax assets are recognized on tax loss carry-forwards when it is probable that taxable profit will
be available against which the tax loss carry-forwards can be utilized. Estimates of taxable profits and utilizations of tax loss carry-forwards were prepared on the basis of profit and loss forecasts as included
in the 3-year business plans (other durations may apply due to local specificities).
Revenue recognition and associated costs on long-term contracts
Revenue recognition and associated costs, including forecast losses on completion are measured
according to policies stated below. Total projected contract costs are based on various opera tional assumptions such as forecast volume or variance in the delivery costs that have a direct influence on the
level of revenue and possible forecast losses on completion that are recognized.
Pensions
The Group uses actuarial assumptions and methods to measure pension costs and provisions. The value
of plan assets is determined based on valuations provided by the external custodians of pension funds and following complementary investigations carried-out when appropriate. The estimation of pension
liabilities, as well as valuations of plan assets requires the use of estimates and assumptions.
Customer relationships
An intangible asset related to the customer relationships and backlog brought during a business
combination is recognized as Customer Relationships. The value of this asset is based on assumptions of renewal conditions of contract and on the discounted flows of these contracts. This asset is amortized on
an estimation of its average life.
Consolidation methods
Subsidiaries
Subsidiaries are entities controlled directly or indirectly by the Group. Control is defined by the ability to
govern the financial and operating policies generally, but not systematically, combined with a shareholding of more than 50 percent of the voting rights. The existence and effect of potential voting
rights that are currently exercisable or convertible, the power to appoint the majority of the members of the governing bodies and the existence of veto rights are considered when assessing whether the Group
controls another entity. Subsidiaries are fully consolidated from the date on which control is transferred
to the Group. They are de-consolidated from the date on which control ceases.
Segment reporting
According to IFRS 8, reported operating segments profits are based on internal management reporting
information that is regularly reviewed by the chief operating decision maker, and is reconciled to Group
profit or loss. The chief operating decision maker assesses segments profit or loss using a measure of operating profit. The chief operating decision maker, who is responsible for allocating resources and
assessing performance of the operating segments, has been identified as the company CEO and chairman of the Board of Directors who makes strategic decisions.
The internal management reporting is built on two axes: Global Business Units and Divisions (Business & Platform Solutions (B&PS), Infrastructure & Data Management (IDM), Big Data & Cybersecurity (BDS)).
Global Business Units have been determined by the Group as key indicators by the Chief operating
decision maker. As a result and for IFRS 8 requirements, the Group discloses Global Business Units as operating segments.
45/108
A Business Unit is defined as a geographical area or the aggregation of several geographical areas - except for the Worldline activities which contains one or several countries, without taking into
consideration the activities exercised within each country. Each Business Unit is managed by dedicated members of the Executive Committee.
The measurement policies that the Group uses for segmental reporting under IFRS 8 are the same as
those used in its financial statements. Corporate entities are not presented as an operating segment. Therefore, their financial statements are used as a reconciling item (refer Note 2 of the financial
statements). Corporate assets which are not directly attributable to the business activities of any operating segments are not allocated to a segment, which primarily applies to the Group’s headquarters.
Shared assets such as the European mainframe are allocated to the Business Unit where they are physically located even though they are used by several Business Units.
Presentation rules
Current and non-current assets and liabilities
Assets and liabilities classified as current are expected to be realized, used or settled during the normal cycle of operations, which can extend beyond 12 months following period-end. All other assets and
liabilities are classified as non-current. Current assets and liabilities, excluding the current portion of
borrowings, financial receivables and provisions represent the Group’s working capital requirement.
Assets and liabilities held for sale or discontinued operations
Should there be assets and liabilities held for sale or discontinued operations, they would be presented on separate lines in the Group’s balance sheet, without restatements for previous periods. They are
measured at the lower of their carrying amount and fair value less costs to sell. Non-current assets and liabilities are classified as held for sale if their carrying amount will be recovered principally through a
sale transaction rather than through continuing use. This condition is regarded as met only w hen the sale
is highly probable and the assets and liabilities are available for immediate sale in their present condition.
Should these assets and liabilities represent either a complete business line or a Business Unit, the profit
or loss from these activities are presented on a separate line of the income statement, and is restated in the cash flow statement and the income statement.
Change in free cash flow and operating margin definition
The Group decided to change the “free cash flow” and “operating margin” definitions by excluding equity based compensation effects from the calculation of financial performance, in line with sector practice.
As such, Group free cash flow excludes proceeds from equity based compensation and the amortization cost of equity based compensation plans is excluded from the “operating margin” and presented in “other
operating income and expenses”.
This change in presentation has been applied retroactively to the period presented and as a consequence
of this reclassification, the full year 2015 “operating margin” have been increased by € 33.3 million and
the full year 2015 Group free cash flow decreased by € 57 million.
Translation of financial statements denominated in foreign currencies
The balance sheets of companies based outside the euro zone are translated at closing exchange rates.
Income statement items are translated based on average exchange rates for the period. Balance sheet
and income statement translation adjustments arising from a change in exchange rates are recognized as a separate component of equity under “Translation adjustments”.
Goodwill and fair value adjustments arising on the acquisition of a foreign entity have been treated as assets and liabilities of that foreign entity and translated into euro at the closing date.
The Group does not consolidate any entity operating in a hyperinflationary economy.
Translation of transactions denominated in foreign currencies
Foreign currency transactions are translated into the functional currency using the exchange ra te prevailing at the dates of the transactions. Foreign exchange gains and losses resulting from the
settlement of such transactions and from the translation at year-end exchange rates of monetary assets and liabilities denominated in foreign currencies are recognized in the income statement under the
heading “Other financial income and expenses”, except where hedging accounting is applied as explained
in the paragraph “Financial assets – Derivative financial instruments”.
46/108
Business combination and goodwill
A business combination may involve the purchase of another entity, the purchase of all the net assets of another entity or the purchase of some of the net assets of another entity that together form one or more
businesses.
Major services contracts involving staff and asset transfers that enable the Group to develop or significantly improve its competitive position within a business or a geographical sector are accounted for
as business combinations.
Valuation of assets acquired and liabilities assumed of newly acquired subsidiaries
Business combinations are accounted for according to the acquisition method. The consideration transferred in exchange for control of the acquired entity is measured at fair value, which is calculated as
the sum of the acquisition-date fair values of the assets transferred by the Group, liabilities incurred by
the Group to the former owners of the acquiree and the equity interests issued by the Group in exchange for control of the acquiree.
Direct transaction costs related to a business combination are charged to the income statement when incurred.
Non-controlling interests may, on the acquisition date, be measured either at fair value or based on their
stake in the fair value of the identifiable assets and liabilities of the acquired entity. The choice of measurement basis is made on a transaction-by-transaction basis.
During the first consolidation, all the assets, liabilities and contingent liabilities of the subsidiary acquired are measured at their fair value.
In step acquisitions, any equity interest held previously by the Group is remeasured at fair value at the acquisition date (i.e. the date when the Group obtains control) and the resulting gain or loss is recognized
in net income.
Purchase of non-controlling interests and sale of interests in a controlled subsidiary
Purchase of non-controlling interests and sale transactions of interests in a controlled subsidiary that do
not change the status of control are recorded through shareholders’ equity (including direct acquisition costs).
If control in a subsidiary is lost, any gain or loss is recognized in net income. Furthermore, if an
investment in the entity is retained by the Group, it is re-measured to its fair value and any gain or loss is also recognized in net income.
Goodwill
Goodwill is measured as the excess of the sum of the consideration transferred, the amount of any non-
controlling interests in the acquiree, and the fair value of the acquirer's previously held equity interest in the acquiree (if any) over the net of the acquisition-date amounts of the identifiable assets acquired and
the liabilities assumed. If, after reassessment, the net of the acquisition-date amounts of the identifiable
assets acquired and liabilities assumed exceeds the sum of the consideration transferred, of the amount of any non-controlling interests in the acquiree and of the fair value of the acquirer's previously held
interest in the acquiree (if any), the excess is recognized immediately in profit or loss as a bargain purchase gain.
Goodwill is allocated to Cash Generating Units (CGU) for the purpose of impairment testing. Goodwill is
allocated to those CGUs that are expected to benefit from synergies of the related business combination and represent the lowest level within the Group at which management monitors goodwill.
A CGU is defined as the smallest identifiable group of assets that generates cash inflows that are largely independent of the cash inflows from other assets or group of assets. CGUs correspond to geographical
areas where the Group has operations – except for the Worldline activities.
The recoverable value of a CGU is based on the higher of its fair value less costs to sell and its value in
use determined using the discounted cash-flows method. When this value is less than its carrying
amount, an impairment loss is recognized in the operating income.
The impairment loss is first recorded as an adjustment of the carrying amount of the goodwill allocated to
the CGU and the remainder of the loss, if any, is allocated pro rata to the other long term assets of the unit.
The Cash Generating Units used for the impairment test are not larger than operating segments
determined in accordance with IFRS 8 Operating segments.
Goodwill is not amortized and is subject to an impairment test performed at least annually by comparing
47/108
its carrying amount to its recoverable amount at the closing date based on December actuals and latest 3 year plan, or more often whenever events or circumstances indicate that the carrying amount could not
be recoverable.
Such events and circumstances include but are not limited to:
significant deviance of economic performance of the asset when compared with budget;
significant worsening of the asset’s economic environment;
loss of a major client;
significant increase in interest rates.
Intangible assets other than goodwill
Intangible assets other than goodwill consist primarily of software and user rights acquired directly by the
Group, software and customer relationships acquired as part of a business combination as well as
internally developed IT solutions.
To assess whether an internally generated intangible asset meets the criteria for recognition, the Group
classifies the generation of the asset into:
a research phase, and
a development phase.
Under IAS 38, no intangible asset arising from research (or from the research phase of an internal project) shall be recognized. Such expenditure is therefore recognized as an expense when it is incurred.
An intangible asset arising from development (or from the development phase of an internal project) shall be recognized if, and only if, an entity can demonstrate all of the following:
the technical feasibility of completing the intangible asset so that it will be available for use or sale,
its intention to complete the intangible asset and to use or sell it,
its ability to use or sell the intangible asset,
how the intangible asset will generate probable future economic benefits,
the availability of adequate technical, financial and other resources to complete the development and to use or sell the intangible asset, and
its ability to measure reliably the expenditure attributable to the intangible asset during its
development.
Development expenditure refers to IT solutions developed for the group’s own use, to specific
implementation projects for specific customers or innovative technical solutions made available to a group of customers. Development projects are analyzed on a case-by-case basis and the only costs which
are capitalized are those attributable to the creation, production and preparation of the asset to be capable of operating in the manner intended by management.
Capitalized development expenditure is accounted for at cost less accumulated depreciation and any
impairment losses. It is amortized on a straight-line basis over a useful life between 3 and 12 years, for which two categories can be identified:
For internal software development with fast technology serving activities with a shorter business cycle and contract duration, the period of amortization will be between 3 and 7 years, the
standard scenario being set at 5 years in line with the standard contract duration;
For internal software development with slow technology obsolescence serving activities with a long business cycle and contract duration, the period of amortization will be between 5 and 12
years with a standard scenario of 7 years. It is typically the case for large mutualized payment platforms.
Customer relationships are valued as per the multi-period excess earning method that consists in summing future operating margins attributable to contracts, after tax and capital employed.
Intangible assets are amortized on a straight-line basis over their expected useful life, generally not
exceeding 5 to 7 years for internally developed IT solutions in operating margin. Customer relationships, patents and trademarks acquired as part of a business combination are amortized on a straight-line basis
over their expected useful life, generally not exceeding 12 years; any related depreciation is recorded in other operating expenses.
48/108
Tangible assets
Tangible assets are recorded at acquisition cost. They are depreciated on a straight-line basis over the following expected useful lives:
Buildings 20 years
Fixtures and fittings 5 to 10 years
Computer hardware 3 to 5 years
Vehicles 4 years
Office furniture and equipment 5 to 10 years
Although some outsourcing contracts may involve the transfer of computing equipment to Atos, control of the asset usually remains with the customer as they generally retain the asset. When ownership of the
computing equipment is transferred to the Group a payment generally occurs at the beginning of the
contract. Therefore IFRIC 18 does not have a significant impact on the Group accounts.
Leases
Asset leases where the Group has substantially all the risks and rewards of ownership are classified as
finance leases. Finance leases are capitalized at the lease’s inception at the lower of the fair value of the
leased asset and the present value of the minimum lease payments. Assets acquired under finance lease are depreciated over the shorter of the assets’ useful life and the lease term.
Leases where the lessor retains substantially all the risks and rewards of ownership are classified as operating leases.
Impairment of assets other than goodwill
Assets that are subject to amortization are tested for impairment whenever events or circumstances
indicate that the carrying amount may not be recoverable. An impairment loss is recognized for the amount by which the asset’s carrying value exceeds its recoverable value.
Financial assets
Financial assets are accounted for at trade date.
Investments in non-consolidated companies
The Group holds shares in companies without exercising significant influence or control. Investments in
non-consolidated companies are treated as assets available for sale and recognized at their fair value. For listed shares, fair value corresponds to the share price at the closing date. In the absence of an active
market for the shares, investments in non-consolidated companies are carried at historical cost. An
impairment charge is recognized when there is objective evidence of a permanent or significant loss of value. The most common financial criteria used to determine fair value are equity and earnings outlooks.
Gains and losses arising from variations in the fair value of available for sale assets are recognized as “items recognized directly in equity”. If there is evidence that an asset is permanently impaired, the
cumulative loss is written off in the income statement under “other financial income and expense”.
Available-for-sale financial assets
Available-for-sale financial assets include equity investments in non-consolidated entities. They are
measured at fair value, with changes in fair value recognized in other comprehensive income. When an available-for-sale financial asset is sold or impaired; the cumulative fair value adjustment recognized in
other comprehensive income is transferred to the income statement. For securitie s listed on an active market, fair value is considered to equal market value. If no active market exists, fair value is generally
determined based on appropriate financial criteria for the specific security. If the fair value of an
available-for-sale financial asset cannot be reliably measured, it is recognized at cost.
Loans, trade accounts and notes receivable
Loans are part of non-current financial assets. Loans, trade accounts and notes receivable are recorded initially at their fair value and subsequently at their amortized value. The nominal value represents
usually the initial fair value for trade accounts and notes receivable. In case of deferred payment over
one year, where the effect is significant on fair value, trade accounts and notes receivable s are discounted. Where appropriate, a provision is raised on an individual basis to take likely recovery
problems into account.
Certain service arrangements might qualify for treatment as lease contracts if they convey a right to use
49/108
an asset in return for payments included in the overall contract remuneration. If service arrangements contain a lease, the Group is considered to be the lessor regarding its customers. Where the lease
transfers the risks and rewards of ownership of the asset to its customers, the Group recognizes assets held under finance lease and presents them as “Trade accounts and notes receivable” for the amount that
will be settled within 12 months, and “Non-current financial assets” for the amount to be settled beyond
12 months.
Assets securitization
Assets securitization programs, in which the Group retains substantially all the risks and rewards of ownership of the transferred assets, do not qualify for de-recognition. A financial liability for the
consideration received is recognized. The transferred assets and the financial liability are valued at their amortized costs.
Derivative financial instruments
Derivative instruments are recognized as financial assets or liabilities at their fair value. Any change in the fair value of these derivatives is recorded in the income statement as a financial income or expense,
except when they are eligible for hedge accounting, whereupon:
For fair value hedging of existing assets or liabilities, the hedged portion of an instrument is
measured on the balance sheet at its fair value. Any change in fair value is recorded as a
corresponding entry in the income statement, where it is offset simultaneously against changes in the fair value of hedging instruments;
For cash flow hedging, the effective portion of the change in fair value of the hedging instrument is directly offset in shareholders’ equity as “items recognized directly in equity”. The
change in value of the ineffective portion is recognized in “Other financial income and expenses”. Amounts deferred in equity are taken to the income statement at the same time as
the related cash flow.
Cash and cash equivalents
Cash and cash equivalents include cash at bank and financial instruments such as money market
securities. Such financial instruments are readily convertible to a known amount of cash and are subject to an insignificant risk of change in value. They are held for the purpose of meeting short-term cash
commitments and have a short maturity, in general three months or less from the date of acquisition.
Some instruments, such as term deposits, that have at inception a longer maturity but provide for early withdrawal and a capital guarantee may also be classified as cash equivalents under certain
circumstances. Money market securities are recognized at their fair value. Changes in fair value are recorded in the income statement under “Other financial income and expenses”.
Cash and cash equivalents are measured at their fair value through profit and loss.
For entities having subscribed to the Group cash pooling agreement, the cash/debt balance sheet
positions which are linked to this agreement are mutualized and only the net position is presented in the
consolidated balance sheet.
Treasury stock
Atos shares held by the parent company are recorded at their acquired cost as a deduction from
consolidated shareholders’ equity. In the event of a disposal, the gain or loss and the related tax impacts
are recorded as a change in consolidated shareholders’ equity.
Pensions and similar benefits
Employee benefits are granted by the Group through defined contribution and defined benefit plans.
Costs relating to defined contribution costs are recognized in the income statement based on
contributions paid or due in respect of the accounting period when the related services have been provided by beneficiaries.
The valuation of Group defined benefit obligations is based on a single actuarial method known as the “projected unit credit method”. This method relies in particular on projections of future benefits to be
paid to Group employees, by anticipating the effects of future salary increases. Its implementation further includes the formulation of specific assumptions, detailed in Note 20, which are periodically
updated, in close liaison with external actuaries used by the Group.
Plan assets usually held in separate legal entities are measured at their fair value, determined at closing.
The fair value of plan assets is determined based on valuations provided by the external custodians of
pension funds and following complementary investigations carried-out when appropriate.
50/108
From one accounting period to the other, any difference between the projected and actual pension plan obligation and their related assets is combined at each benefit plan’s level to form actuarial differences.
These actuarial differences may result either from changes in actuarial assumptions used, or from experience adjustments generated by actual developments differing, in the accounting period, from
assumptions determined at the end of the previous accounting period. All actuarial gains and losses on
post-employment benefit plans generated in the period are recognized in “other comprehensive income”.
Benefit plan costs are recognized in the Group’s operating income, except for interest costs on
obligations, net of expected returns on plans assets, which are recognized in “other financial income and expenses”.
Provisions
Provisions are recognized when:
The Group has a present legal, regulatory, contractual or constructive obligation as a result of past events,
It is probable that an outflow of resources embodying economic benefits will be required to settle the obligation, and
The amount has been reliably quantified.
Provisions are discounted when the time value effect is material. Changes in discounting effects at each accounting period are recognized in financial expenses.
Borrowings
Borrowings are recognized initially at fair value, net of debt issuance costs. Borrowings are subsequently
stated at amortized costs. The calculation of the effective interest rate takes into account interest payments and the amortization of the debt issuance costs.
Debt issuance costs are amortized in financial expenses over the life of the loan. The residual value of issuance costs for loans repaid in advance is expensed in the year of repayment.
Bank overdrafts are recorded in the current portion of borrowings.
Non-controlling interests purchase commitments
Firm or conditional commitments under certain conditions to purchase non-controlling interests are similar to a purchase of shares and are recorded in borrowings with an offsetting reduction of non-
controlling interests.
For puts granted after January 1, 2010, when the cost of the purchase exceeds the amount of non-
controlling interests, the Group chooses to recognize the balance in equity (attributable to owners of the
parent). Any further change in the fair value of the non-controlling interests purchase commitment will also be recorded in equity (attributable to owners of the parent).
Revenue Recognition
The Group provides Information Technology (IT) and Business Process Outsourcing (BPO) services.
Depending on the structure of the contract, revenue is recognized according to the following principles:
Variable vs fixed price contracts
Revenue based on variable IT work units is recognized as the services are rendered.
Where the outcome of fixed price contracts can be estimated reliably, revenue is recognized using the
percentage-of-completion (POC) method. Under the POC method, revenue is recognized based on the costs incurred to date as a percentage of the total estimated costs to fulfil the contract. Revenue relating
to these contracts is recorded in the consolidated balance sheet under “Trade accounts and notes
receivable” for services rendered in excess of billing, and billing exceeding services rendered is recorded as deferred income under “Other current liabilities”. Where the outcome of a fixed price contract cannot
be estimated reliably, contract revenue is recognized to the extent of contracts costs incurred that are likely to be recoverable.
Revenue with a long-term fixed price is recognized when services are rendered.
If circumstances arise that change the original estimates of revenues, costs, or the degree of progress toward completion, then revisions to the estimates are made. The Group performs ongoing profitability
analyses of its services contracts in order to determine whether the latest estimates of revenue, costs and profits, require updating. If at any time these estimates indicate that the contract will be
51/108
unprofitable, the entire estimated loss for the remainder of the contract is recorded immediately through a provision for estimated losses on completion.
Principal vs agent
Revenue is reported net of supplier costs when the Group is acting as an agent between the client and
the supplier. Factors generally considered to determine whether the Group is a principal or an agent, are
most notably whether it is the primary obligor to the client, it assumes credit and delivery risks, or it adds meaningful value to the supplier’s product or service.
Multiple-element arrangements
The Group may enter into multiple-element arrangements, which may include combinations of different
services. Revenue is recognized for the separate elements when these elements are separately identifiable. A group of contracts is combined and treated as a single contract when that group of
contracts is negotiated as a single package and the contracts are so closely interrelated that they are, in
effect, part of a single project with an overall profit margin, and the contracts are performed concurrently or in a continuous sequence.
Upfront payments
Upfront payments to clients made at the inception of a contract are recorded in “Other current assets”
and spread as a reduction of revenue over the length of the contract. Upfront payments received from
clients at the inception of a contract are recorded in “Other current liabilities” and spread as an increase in revenue over the term of the contract.
Transition costs
Transition costs are either expensed as incurred or recognized in revenue on a POC basis over the transition phase. In the rare event that services rendered during the transition phase cannot be
separately identified, costs can be deferred and expensed over the contract term if it can be
demonstrated that there are recoverable. Capitalized transition costs are classified in “Trade accounts and notes receivable” in the consolidated balance sheet and amortization expenses are recorded in
“Operating expenses” in the consolidated income statement.
In the event the contract turns out to be loss-making, capitalized transition costs are impaired for an
amount equal to the related forecast loss, before recognizing an additional provision for estimated losses
on completion when necessary.
Operating margin
The underlying operating performance of ongoing activities is presented within operating margin, while
unusual operating income/expenses are separately identified and presented below operating margin, in
line with the CNC’s (Conseil National de la Comptabilité) recommendation n°2009-R-03 (issued on July 2nd, 2009) regarding the presentation of financial statements.
Other operating income and expenses
“Other operating income and expenses” covers income or expense items that are unusual, abnormal and infrequent. They are presented below operating margin.
Charges to (or releases from) restructuring and rationalization plans and associated costs are classified in
the income statement according to the nature of the plan:
Plans directly related to operations are classified within Operating margin;
Plans relating to business combinations or qualified as unusual, infrequent and abnormal are classified in Operating income;
If a restructuring plan qualifies for Operating income, the related real estate rationalization &
associated costs regarding premises are also presented in Operating income.
When accounting for business combinations, the Group may record provisions for risks, litigations, etc. in
the opening balance sheet for a period of 12 months beyond the business combination date. After the 12-month period, unused provisions arising from changes in circumstances are released through the income
statement under “Other operating income and expenses”.
“Other operating income and expenses” also include major litigations, and non-recurrent capital gains
and losses on the disposal of tangible and intangible assets, significant impairment losses on assets other
than financial assets, the amortization of Customer Relationships and Trademarks, amortization of equity based compensation and any other item that is deemed infrequent, unusual or abnormal.
52/108
Equity-based compensation
Stock options are granted to management and certain employees at regular intervals. These equity-based compensations are measured at fair value at the grant date using the binomial option-pricing
model. Changes in the fair value of options after the grant date have no impact on the initial valuation.
The fair value of share options is recognized in “other operating income and expense” on a straight-line basis over the period during which those rights vest, using the straight-line method, with the offsetting
credit recognized directly in equity.
In some tax jurisdictions, Group entities receive a tax deduction when stock options are exercised, based
on the Group share price at the date of exercise. In those instances, a deferred tax asset is recorded for the difference between the tax base of the employee services received to date (being the future tax
deduction allowed by local tax authorities) and the current carrying amount of this deduction, being nil by
definition. Deferred tax assets are estimated based on the Group’s share price at each closing date, and are recorded in income tax provided that the amount of tax deduction does not exceed the amount of the
related cumulative stock option expenses to date. The excess, if any, is recorded directly in the equity.
Employee Share Purchase Plans offer employees the opportunity to invest in Group’s shares at a
discounted price. Shares are subject to a five-year lock-up period restriction. Fair values of such plans
are measured taking into account:
The exercise price based on the average opening share prices quoted over the 20 trading days
preceding the date of grant;
The 20 percent discount granted to employees;
The consideration of the five-year lock-up restriction to the extent it affects the price that a knowledgeable, willing market participant would pay for that share; and
The grant date: the date on which the plan and its term and conditions, including the exercise
price, is announced to employees.
Fair values of such plans are fully recognized in “Other operating income and expenses” at the end of the
subscription period.
The Group has also granted to management and certain employees free share plans. The fair value of
those plans corresponds to the value of the shares at the grant date and takes into account employee
turnover during the vesting period as well as the value of the lock-up period restriction when applicable. Free share plans result in the recognition of a personnel expense spread over the vesting period.
Corporate income tax
The income tax charge includes current and deferred tax expenses. Deferred tax is calculated wherever
temporary differences occur between the tax base and the consolidated base of assets and liabilities, using the liability method. Deferred tax is valued using the enacted tax rate at the closing date that will
be in force when the temporary differences reverse.
In case of a change in tax rate, the deferred tax assets and liabilities are adjusted through the income
statement except if those changes relate to items recognized in other comprehensive income or in equity.
Deferred tax assets and liabilities are netted off at the taxable entity level, when there is a legal right to
offset. Deferred tax assets corresponding to temporary differences and tax losses carried forward are
recognized when they are considered to be recoverable during their validity period, based on historical and forecast information.
Deferred tax liabilities for taxable temporary differences relating to goodwill are recognized to the extent they do not arise from the initial recognition of goodwill.
Deferred tax assets are tested for impairment at least annually at the closing date based on December
actuals, business plans and impairment test data.
Earnings per share
Basic earnings per share is calculated by dividing the net income (attributable to owners of the parent)
by the weighted average number of ordinary shares outstanding during the period. Treasury shares deducted from consolidated equity are not taken into account in the calculation of basic or diluted
earnings per share.
Diluted earnings per share is calculated by dividing the net income attributable to owners of the parent, adjusted for the financial cost net of tax of dilutive debt instruments, by the weighted average number of
ordinary shares outstanding during the period, plus the average number of shares which, according to the share buyback method, would have been outstanding had all the issued dilutive instruments been
converted (stock options and convertible debt).
53/108
The dilutive impact of each convertible instrument is determined in order to maximize the dilution of basic earnings per share. The dilutive impact of stock options is assessed based on the average price of
Atos shares over the period.
Related party transactions
Related party transactions include in particular transactions with:
Persons or a close member of that person’s family if that person is a key member of Group
management, defined as persons who have the authority and responsibility for planning, directing and controlling the activities of the Group, including members of the Board of
Directors, Supervisory Board and Management Board, as well as the Executive Senior Vice Presidents.
Entities, if one of the following conditions apply:
The entity is a member of the Group;
The entity is a joint venture in which the Group is participating;
The entity is a post-employment benefit plan for the benefit of employees of the Group;
The entity is controlled or jointly controlled by a person belonging to the key
management.
B.4.7.3 Financial risk management
The Group’s activities expose it to a variety of financial risks including liquidity risk, interest rate risk,
credit risk and currency risk. Financial risk management is carried out by the Group Treasury Department and involves minimizing potential adverse effects on the Group’s financial performance.
Liquidity risk
Liquidity risk management involves maintaining sufficient cash and marketable securities and the availability of funding through an adequate amount of committed credit facilities.
Atos’ policy is to cover in full its expected liquidity requirements by long-term committed loans or other
appropriate long-term financial instruments. Terms and conditions of these loans include maturity and covenants leaving sufficient flexibility for the Group to finance its operations and expected developments.
Credit facilities are subject to financial covenants that are carefully followed by the Group Treasury Department.
An analysis of the maturity of financial liabilities is disclosed in Note 22.
Interest rate risk
Interest rate risk arises mainly on borrowings. The management of exposure to interest rate risk encompasses two types:
A price risk on fixed-rate financial assets and liabilities. For example, by contracting a fixed-rate
liability, the Group is exposed to potential opportunity losses should interest rates fall. A change in interest rates would impact the market value of fixed-rate financial assets and liabilities.
However, this loss of opportunity would not impact financial income and expenses as reported in the consolidated income statement and, as such, future net income of the Group up to maturity
of these assets.
A risk on floating-rate financial assets and liabilities should interest rates increase.
The main objective of managing overall interest rate risk on the Group’s debt is to minimize the cost of
debt and to protect the Group against fluctuations in interest rates by swapping to fixed rate a portion of the floating-rate financial debt. Authorized derivative instruments used to hedge the debt are swap
contracts entered with leading financial institutions.
Credit risk
The Group has no significant concentrations of credit risk. The client selection process and related credit risk analysis is fully integrated within the global risk assessment project conducted throughout the life
cycle of a project. Derivative counterparties and cash transactions are limited to high-credit quality financial institutions.
54/108
Currency risk
The Group’s financial performance is not materially influenced by fluctuations in exchange rate since a significant portion of the business takes place within the Eurozone and costs and revenues are generally
denominated in the same currency.
The Group has established a policy for managing foreign exchange positions resulting from commercial and financial transactions denominated in currencies different from the local currency of the relevant
entity. According to this policy, any material exposure must be hedged as soon as it occurs. In order to hedge its foreign exchange rate exposure, the Group uses a variety of financial instruments, mainly
forward contracts and foreign currency swaps.
Price risk
The Group has no material exposure to the price of equity securities, nor is it exposed to commodity price risks.
B.4.7.4 Notes to the consolidated financial statements
Note 1 Changes in the scope of consolidation
Unify acquisition
On January 20, 2016, Atos completed the acquisition of Unify, a leader in integrated communication
solutions, which was announced in November 2015.
The final cash consideration transferred to acquire 100% of Unify amounts to € 346.5 million after price
adjustment.
Software & Platforms discontinued operations
The Services activities of Unify have been integrated in the Atos Division “Infrastructure & Data
Management” from February 1, 2016 and the software and platforms activities have been accounted for as discontinued operations.
Atos Group decided, as early as the acquisition date, to put up for sale the Software & Platforms business (S&P). The S&P business has been treated as discontinued operations from February 1, 2016 in
accordance with IFRS 3 and IFRS 5 requirements. As of December 31, 2016, Atos is still engaged in an active process to sell S&P business and is in negotiation with a potential buyer. As such, the discontinued
treatment has been maintained.
The flows relating to the services rendered by the continuing operations to S&P have been eliminated at the S&P level. As a result, the External Revenue of the Group includes revenues related to such flows.
In the consolidated statement of financial position, the net assets allocated to the S&P business have been presented on the line “Assets held for sale” and net liabilities on the line “Liabilities held for sale”.
The net income of the S&P business from February 1 to December 31, 2016 has been presented under
the “net income from discontinued operations” caption of the consolidated income statement.
55/108
Identifiable assets acquired and liabilities assumed at the date of acquisition for the continuing operations
The valuation of assets acquired and liabilities assumed for the continuing operations resulted in the recognition of customer relationships and backlog for an amount of € 87.5 million determined by an
independent expert. These intangible assets will be amortized over a period from 2 to 10 years. The
impact of the amortization of the customer relationships and backlog is € 9.6 million as of December 31, 2016.
Preliminary Goodwill allocated to the Unify continuing operations
Goodwill was recognized on continuing operations as follows:
If new information is obtained within one year from the acquisition date about facts and circumstances that existed at the acquisition date that would lead to adjustments to the above amounts, then the
acquisition accounting will be revised at that time.
The goodwill arising from this acquisition is not tax deductible.
Acquisition-related costs
The Group incurred in 2016 € 4.1 million of legal fees and due diligence costs. These costs have been recognized in “other operating income and expenses” in the Group’s consolidated income statement.
(in € million)
Initial assets
acquired and
liability assumed
Intangible assets 87.5
Tangible assets 1.7
Non-current financial assets 0.1
Total non-current assets 89.4
Trade accounts and notes receivables 109.8
Current taxes 0.3
Other current assets 134.3
Cash and cash equivalents 32.0
Total current assets 276.4
Total assets (A) 365.7
Provisions for pensions and similar benefits 51.0
Non-current provisions 96.4
Borrowings 10.6
Deferred tax liabilities 11.9
Total non-current liabilities 169.9
Trade accounts and notes payables 44.0
Other current liabilities 106.7
Total current liabilities 150.7
Total Liabilities (B) 320.6
Fair value of acquisition (A) - (B) 45.1
(in € million) December 2016
Preliminary allocation of the consideration paid to continuing operations 242.3
Fair value of identifiable net assets 45.1
Preliminary Goodwill 197.2
56/108
equensWorldline & Paysquare acquisition
After the completion of the regulatory processes in the Netherlands and in Belgium, the transactions with Equens, Paysquare were finalized on September 30, 2016.
Equens & Paysquare
The business combination was made up of two components:
equensWordline
The merger of the Financial Services Business of Worldline with Equens resulted in the creation of equensWordline held at 63.6% by Wordline and 36.4% by Equens’ previous shareholders.
equensWordline is held at 44.6% by Atos Group.
In accordance with IFRS 3, this operation has been treated as a bus iness combination with the takeover
of equensWordline by the Group and the sale to the previous shareholders of Equens of a non-controlling
interest in the Financial Services Business.
As the transaction is non cash, the consideration transferred by the Group to the previous shareholders of
Equens corresponds to 36.4% of the fair value of the Financial Services Business (on the basis of a valuation of € 700 million by an independent expert for the full business) and to the counterpart received
by the Group of 63.6% of the fair value of Equens (on the basis of a valuation of € 400.3 million by an
independent expert for the full business).
The net assets and liabilities acquired from Equens have been booked at fair value in the Group
consolidated financial statements. The net assets and liabilities of the Financial Services Business are kept at their net book value before business combination as well as the part transferred to the previous
Equens’ Shareholders for € 5.5 million.
The impacts of the Business combination in the equity of the group are as follows:
Paysquare
On September 30, 2016, Worldline acquired from Equens 100% of its commercial acquiring subsidiary
Paysquare for a cash consideration paid of € 113.2 million. Paysquare is fully consolidated in Atos Group since October 1, 2016. Paysquare is held at 70.1% by Atos Group.
The fair value of Equens and Paysquare net assets acquired are set out in the table below:
(in € million)
Financial Services
Business transferred to
non controlling
interests
Consideration
transferred for the
takeover of Equens
Total
Group share (5.5) 178.5 173.0
Non controlling interests 5.5 221.8 227.3
Total shareholder's equity 0.0 400.3 400.3
(in € million)
Assets acquired
and liabilty
assumed
Fixed assets 202.3
Net debt 36.6
Provisions (54.4)
Other net assets (36.6)
Fair value of acquisition 147.8
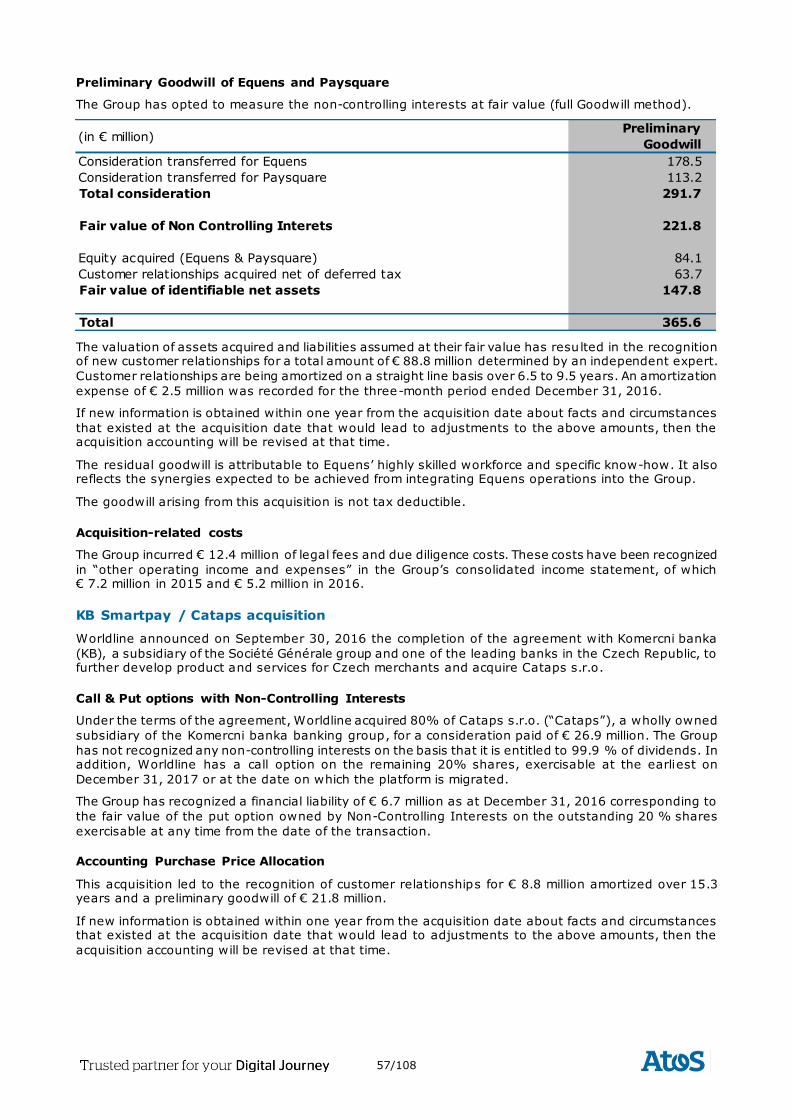
57/108
Preliminary Goodwill of Equens and Paysquare
The Group has opted to measure the non-controlling interests at fair value (full Goodwill method).
The valuation of assets acquired and liabilities assumed at their fair value has resulted in the recognition of new customer relationships for a total amount of € 88.8 million determined by an independent expert.
Customer relationships are being amortized on a straight line basis over 6.5 to 9.5 years. An amortization
expense of € 2.5 million was recorded for the three-month period ended December 31, 2016.
If new information is obtained within one year from the acquisition date about facts and circumstances
that existed at the acquisition date that would lead to adjustments to the above amounts, then the acquisition accounting will be revised at that time.
The residual goodwill is attributable to Equens’ highly skilled workforce and specific know-how. It also reflects the synergies expected to be achieved from integrating Equens operations into the Group.
The goodwill arising from this acquisition is not tax deductible.
Acquisition-related costs
The Group incurred € 12.4 million of legal fees and due diligence costs. These costs have been recognized
in “other operating income and expenses” in the Group’s consolidated income statement, of which € 7.2 million in 2015 and € 5.2 million in 2016.
KB Smartpay / Cataps acquisition
Worldline announced on September 30, 2016 the completion of the agreement with Komercni banka
(KB), a subsidiary of the Société Générale group and one of the leading banks in the Czech Republic, to further develop product and services for Czech merchants and acquire Cataps s.r.o.
Call & Put options with Non-Controlling Interests
Under the terms of the agreement, Worldline acquired 80% of Cataps s.r.o. (“Cataps”), a wholly owned
subsidiary of the Komercni banka banking group, for a consideration paid of € 26.9 million. The Group
has not recognized any non-controlling interests on the basis that it is entitled to 99.9 % of dividends. In addition, Worldline has a call option on the remaining 20% shares, exercisable at the earliest on
December 31, 2017 or at the date on which the platform is migrated.
The Group has recognized a financial liability of € 6.7 million as at December 31, 2016 corresponding to
the fair value of the put option owned by Non-Controlling Interests on the outstanding 20 % shares
exercisable at any time from the date of the transaction.
Accounting Purchase Price Allocation
This acquisition led to the recognition of customer relationships for € 8.8 million amortized over 15.3 years and a preliminary goodwill of € 21.8 million.
If new information is obtained within one year from the acquisition date about facts and circumstances that existed at the acquisition date that would lead to adjustments to the above amounts, then the
acquisition accounting will be revised at that time.
(in € million)Preliminary
Goodwill
Consideration transferred for Equens 178.5
Consideration transferred for Paysquare 113.2
Total consideration 291.7
Fair value of Non Controlling Interets 221.8
Equity acquired (Equens & Paysquare) 84.1
Customer relationships acquired net of deferred tax 63.7
Fair value of identifiable net assets 147.8
Total 365.6
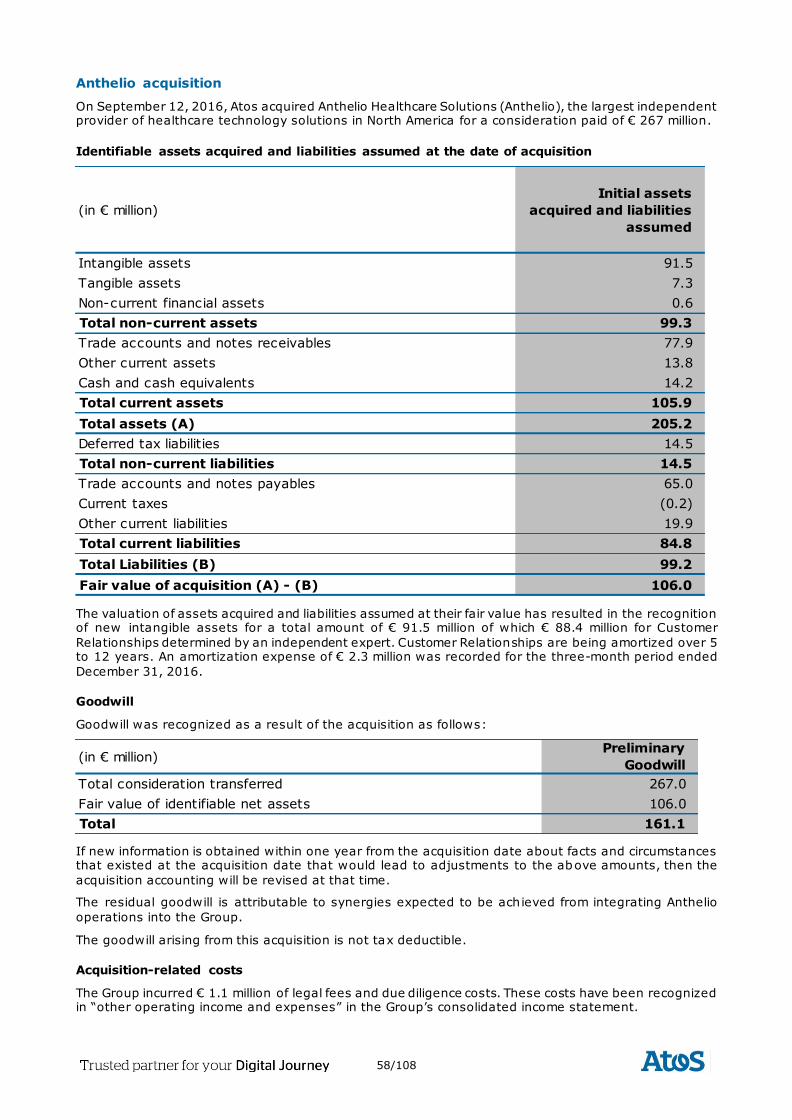
58/108
Anthelio acquisition
On September 12, 2016, Atos acquired Anthelio Healthcare Solutions (Anthelio), the largest independent provider of healthcare technology solutions in North America for a consideration paid of € 267 million.
Identifiable assets acquired and liabilities assumed at the date of acquisition
The valuation of assets acquired and liabilities assumed at their fair value has resulted in the recognition of new intangible assets for a total amount of € 91.5 million of which € 88.4 million for Customer
Relationships determined by an independent expert. Customer Relationships are being amortized over 5 to 12 years. An amortization expense of € 2.3 million was recorded for the three-month period ended
December 31, 2016.
Goodwill
Goodwill was recognized as a result of the acquisition as follows:
If new information is obtained within one year from the acquisition date about facts and circumstances that existed at the acquisition date that would lead to adjustments to the above amounts, then the
acquisition accounting will be revised at that time.
The residual goodwill is attributable to synergies expected to be achieved from integrating Anthelio
operations into the Group.
The goodwill arising from this acquisition is not tax deductible.
Acquisition-related costs
The Group incurred € 1.1 million of legal fees and due diligence costs. These costs have been recognized in “other operating income and expenses” in the Group’s consolidated income statement.
(in € million)
Initial assets
acquired and liabilities
assumed
Intangible assets 91.5
Tangible assets 7.3
Non-current financial assets 0.6
Total non-current assets 99.3
Trade accounts and notes receivables 77.9
Other current assets 13.8
Cash and cash equivalents 14.2
Total current assets 105.9
Total assets (A) 205.2
Deferred tax liabilities 14.5
Total non-current liabilities 14.5
Trade accounts and notes payables 65.0
Current taxes (0.2)
Other current liabilities 19.9
Total current liabilities 84.8
Total Liabilities (B) 99.2
Fair value of acquisition (A) - (B) 106.0
(in € million)Preliminary
Goodwill
Total consideration transferred 267.0
Fair value of identifiable net assets 106.0
Total 161.1
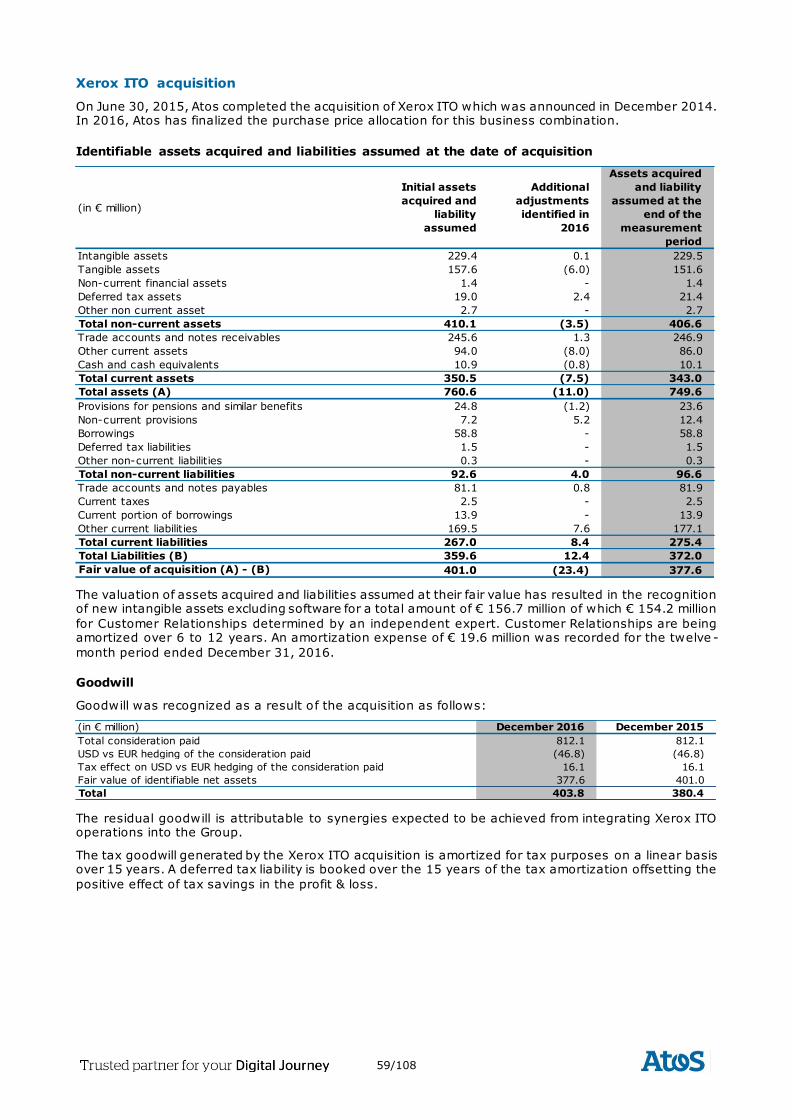
59/108
Xerox ITO acquisition
On June 30, 2015, Atos completed the acquisition of Xerox ITO which was announced in December 2014. In 2016, Atos has finalized the purchase price allocation for this business combination.
Identifiable assets acquired and liabilities assumed at the date of acquisition
The valuation of assets acquired and liabilities assumed at their fair value has resulted in the recognition of new intangible assets excluding software for a total amount of € 156.7 million of which € 154.2 million
for Customer Relationships determined by an independent expert. Customer Relationships are being amortized over 6 to 12 years. An amortization expense of € 19.6 million was recorded for the twelve -
month period ended December 31, 2016.
Goodwill
Goodwill was recognized as a result of the acquisition as follows:
The residual goodwill is attributable to synergies expected to be achieved from integrating Xerox ITO operations into the Group.
The tax goodwill generated by the Xerox ITO acquisition is amortized for tax purposes on a linear basis over 15 years. A deferred tax liability is booked over the 15 years of the tax amortization offsetting the
positive effect of tax savings in the profit & loss.
(in € million)
Initial assets
acquired and
liability
assumed
Additional
adjustments
identified in
2016
Assets acquired
and liability
assumed at the
end of the
measurement
period
Intangible assets 229.4 0.1 229.5
Tangible assets 157.6 (6.0) 151.6
Non-current financial assets 1.4 - 1.4
Deferred tax assets 19.0 2.4 21.4
Other non current asset 2.7 - 2.7
Total non-current assets 410.1 (3.5) 406.6
Trade accounts and notes receivables 245.6 1.3 246.9
Other current assets 94.0 (8.0) 86.0
Cash and cash equivalents 10.9 (0.8) 10.1
Total current assets 350.5 (7.5) 343.0
Total assets (A) 760.6 (11.0) 749.6
Provisions for pensions and similar benefits 24.8 (1.2) 23.6
Non-current provisions 7.2 5.2 12.4
Borrowings 58.8 - 58.8
Deferred tax liabilities 1.5 - 1.5
Other non-current liabilities 0.3 - 0.3
Total non-current liabilities 92.6 4.0 96.6
Trade accounts and notes payables 81.1 0.8 81.9
Current taxes 2.5 - 2.5
Current portion of borrowings 13.9 - 13.9
Other current liabilities 169.5 7.6 177.1
Total current liabilities 267.0 8.4 275.4
Total Liabilities (B) 359.6 12.4 372.0
Fair value of acquisition (A) - (B) 401.0 (23.4) 377.6
(in € million) December 2016 December 2015
Total consideration paid 812.1 812.1
USD vs EUR hedging of the consideration paid (46.8) (46.8)
Tax effect on USD vs EUR hedging of the consideration paid 16.1 16.1
Fair value of identifiable net assets 377.6 401.0
Total 403.8 380.4
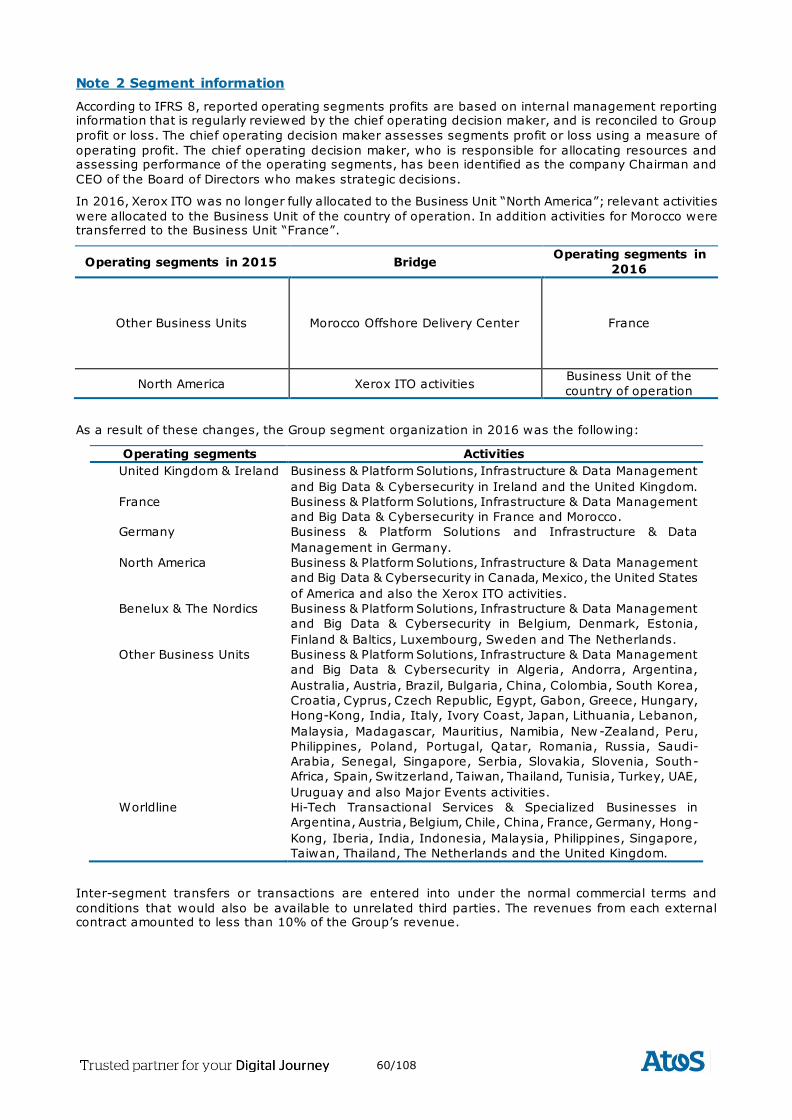
60/108
Note 2 Segment information
According to IFRS 8, reported operating segments profits are based on internal management reporting information that is regularly reviewed by the chief operating decision maker, and is reconciled to Group
profit or loss. The chief operating decision maker assesses segments profit or loss using a measure of
operating profit. The chief operating decision maker, who is responsible for allocating resources and assessing performance of the operating segments, has been identified as the company Chairman and
CEO of the Board of Directors who makes strategic decisions.
In 2016, Xerox ITO was no longer fully allocated to the Business Unit “North America”; relevant activities
were allocated to the Business Unit of the country of operation. In addition activities for Morocco were transferred to the Business Unit “France”.
Operating segments in 2015 Bridge Operating segments in
2016
Other Business Units Morocco Offshore Delivery Center France
North America Xerox ITO activities Business Unit of the
country of operation
As a result of these changes, the Group segment organization in 2016 was the following:
Operating segments Activities
United Kingdom & Ireland Business & Platform Solutions, Infrastructure & Data Management
and Big Data & Cybersecurity in Ireland and the United Kingdom.
France Business & Platform Solutions, Infrastructure & Data Management
and Big Data & Cybersecurity in France and Morocco.
Germany Business & Platform Solutions and Infrastructure & Data
Management in Germany.
North America Business & Platform Solutions, Infrastructure & Data Management
and Big Data & Cybersecurity in Canada, Mexico, the United States
of America and also the Xerox ITO activities.
Benelux & The Nordics Business & Platform Solutions, Infrastructure & Data Management
and Big Data & Cybersecurity in Belgium, Denmark, Estonia,
Finland & Baltics, Luxembourg, Sweden and The Netherlands.
Other Business Units Business & Platform Solutions, Infrastructure & Data Management
and Big Data & Cybersecurity in Algeria, Andorra, Argentina,
Australia, Austria, Brazil, Bulgaria, China, Colombia, South Korea,
Croatia, Cyprus, Czech Republic, Egypt, Gabon, Greece, Hungary,
Hong-Kong, India, Italy, Ivory Coast, Japan, Lithuania, Lebanon,
Malaysia, Madagascar, Mauritius, Namibia, New-Zealand, Peru,
Philippines, Poland, Portugal, Qatar, Romania, Russia, Saudi-
Arabia, Senegal, Singapore, Serbia, Slovakia, Slovenia, South-
Africa, Spain, Switzerland, Taiwan, Thailand, Tunisia, Turkey, UAE,
Uruguay and also Major Events activities.
Worldline Hi-Tech Transactional Services & Specialized Businesses in
Argentina, Austria, Belgium, Chile, China, France, Germany, Hong-
Kong, Iberia, India, Indonesia, Malaysia, Philippines, Singapore,
Taiwan, Thailand, The Netherlands and the United Kingdom.
Inter-segment transfers or transactions are entered into under the normal commercial terms and
conditions that would also be available to unrelated third parties. The revenues from each external contract amounted to less than 10% of the Group’s revenue.
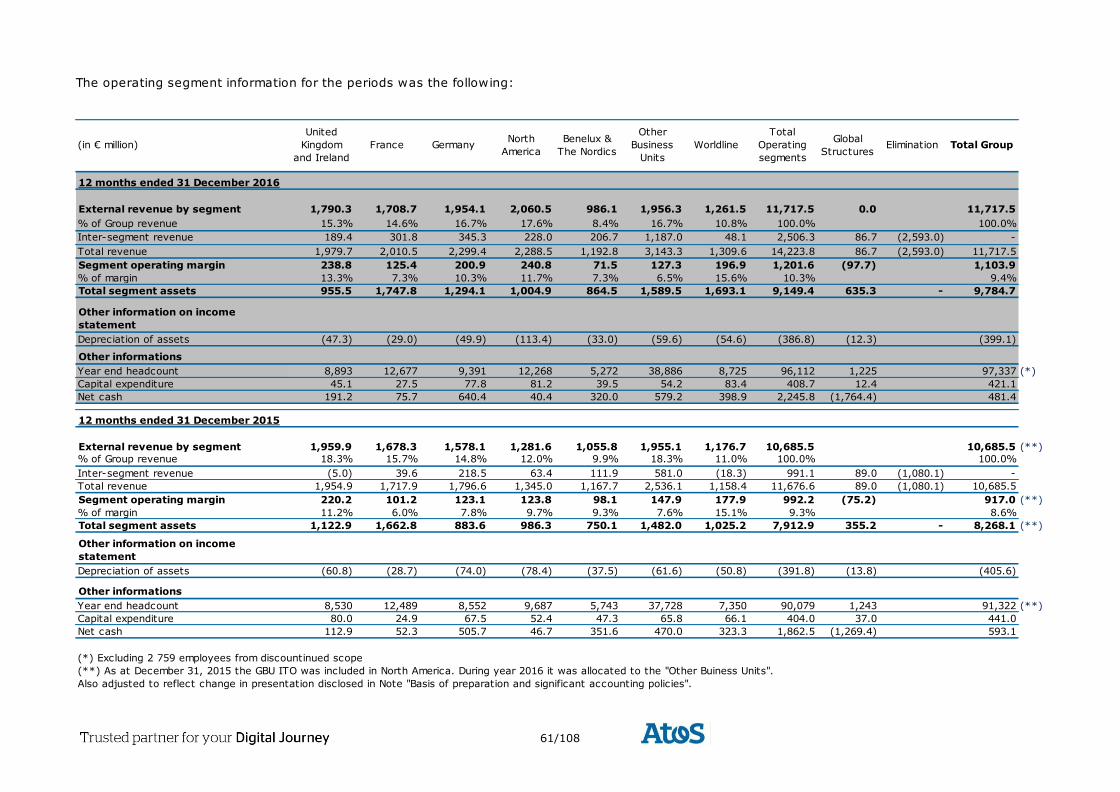
61/108
The operating segment information for the periods was the following:
(in € million)
United
Kingdom
and Ireland
France GermanyNorth
America
Benelux &
The Nordics
Other
Business
Units
Worldline
Total
Operating
segments
Global
StructuresElimination Total Group
12 months ended 31 December 2016
External revenue by segment 1,790.3 1,708.7 1,954.1 2,060.5 986.1 1,956.3 1,261.5 11,717.5 0.0 11,717.5
% of Group revenue 15.3% 14.6% 16.7% 17.6% 8.4% 16.7% 10.8% 100.0% 100.0%
Inter-segment revenue 189.4 301.8 345.3 228.0 206.7 1,187.0 48.1 2,506.3 86.7 (2,593.0) -
Total revenue 1,979.7 2,010.5 2,299.4 2,288.5 1,192.8 3,143.3 1,309.6 14,223.8 86.7 (2,593.0) 11,717.5
Segment operating margin 238.8 125.4 200.9 240.8 71.5 127.3 196.9 1,201.6 (97.7) 1,103.9
% of margin 13.3% 7.3% 10.3% 11.7% 7.3% 6.5% 15.6% 10.3% 9.4%
Total segment assets 955.5 1,747.8 1,294.1 1,004.9 864.5 1,589.5 1,693.1 9,149.4 635.3 - 9,784.7
Other information on income
statement
Depreciation of assets (47.3) (29.0) (49.9) (113.4) (33.0) (59.6) (54.6) (386.8) (12.3) (399.1)
Other informations
Year end headcount 8,893 12,677 9,391 12,268 5,272 38,886 8,725 96,112 1,225 97,337 (*)
Capital expenditure 45.1 27.5 77.8 81.2 39.5 54.2 83.4 408.7 12.4 421.1
Net cash 191.2 75.7 640.4 40.4 320.0 579.2 398.9 2,245.8 (1,764.4) 481.4
12 months ended 31 December 2015
External revenue by segment 1,959.9 1,678.3 1,578.1 1,281.6 1,055.8 1,955.1 1,176.7 10,685.5 10,685.5 (**)
% of Group revenue 18.3% 15.7% 14.8% 12.0% 9.9% 18.3% 11.0% 100.0% 100.0%
Inter-segment revenue (5.0) 39.6 218.5 63.4 111.9 581.0 (18.3) 991.1 89.0 (1,080.1) -
Total revenue 1,954.9 1,717.9 1,796.6 1,345.0 1,167.7 2,536.1 1,158.4 11,676.6 89.0 (1,080.1) 10,685.5
Segment operating margin 220.2 101.2 123.1 123.8 98.1 147.9 177.9 992.2 (75.2) 917.0 (**)
% of margin 11.2% 6.0% 7.8% 9.7% 9.3% 7.6% 15.1% 9.3% 8.6%
Total segment assets 1,122.9 1,662.8 883.6 986.3 750.1 1,482.0 1,025.2 7,912.9 355.2 - 8,268.1 (**)
Other information on income
statement
Depreciation of assets (60.8) (28.7) (74.0) (78.4) (37.5) (61.6) (50.8) (391.8) (13.8) (405.6)
Other informations
Year end headcount 8,530 12,489 8,552 9,687 5,743 37,728 7,350 90,079 1,243 91,322 (**)
Capital expenditure 80.0 24.9 67.5 52.4 47.3 65.8 66.1 404.0 37.0 441.0
Net cash 112.9 52.3 505.7 46.7 351.6 470.0 323.3 1,862.5 (1,269.4) 593.1
(*) Excluding 2 759 employees from discountinued scope
(**) As at December 31, 2015 the GBU ITO was included in North America. During year 2016 it was allocated to the "Other Buiness Units".
Also adjusted to reflect change in presentation disclosed in Note "Basis of preparation and significant accounting policies".
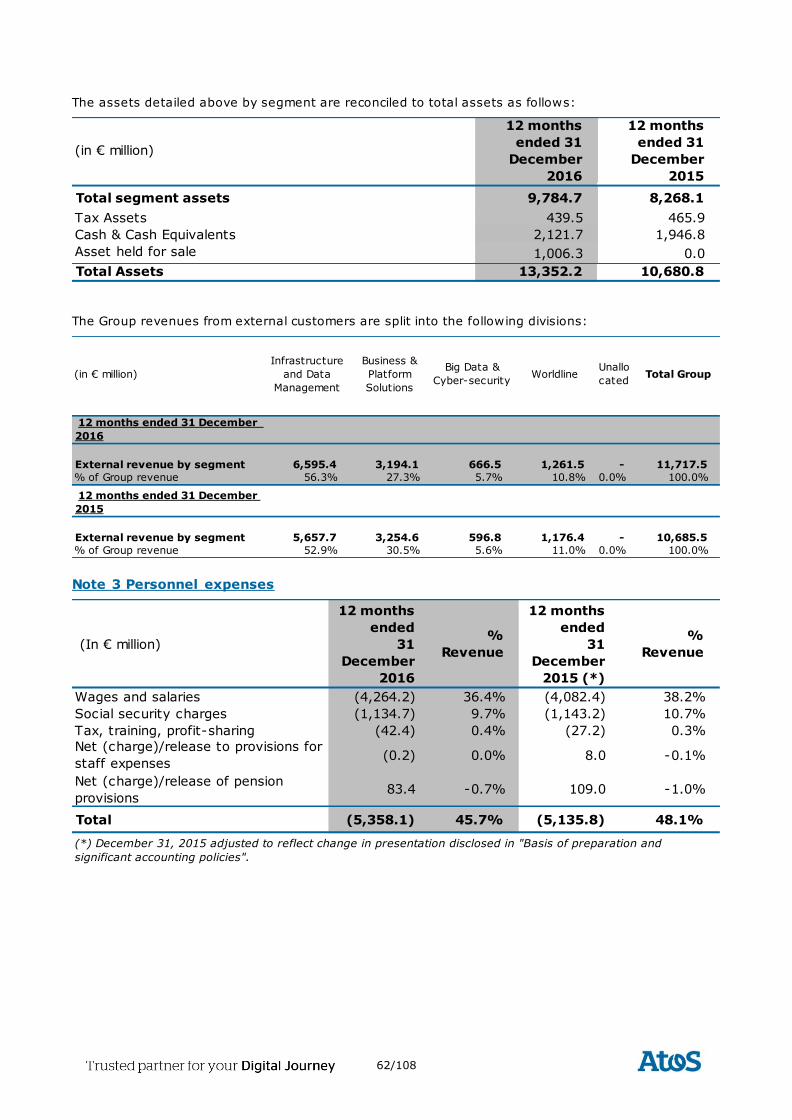
62/108
The assets detailed above by segment are reconciled to total assets as follows:
The Group revenues from external customers are split into the following divisions:
Note 3 Personnel expenses
(in € million)
12 months
ended 31
December
2016
12 months
ended 31
December
2015
Total segment assets 9,784.7 8,268.1
Tax Assets 439.5 465.9
Cash & Cash Equivalents 2,121.7 1,946.8
Asset held for sale 1,006.3 0.0
Total Assets 13,352.2 10,680.8
(in € million)
Infrastructure
and Data
Management
Business &
Platform
Solutions
Big Data &
Cyber-securityWorldline
Unallo
catedTotal Group
12 months ended 31 December
2016
External revenue by segment 6,595.4 3,194.1 666.5 1,261.5 - 11,717.5
% of Group revenue 56.3% 27.3% 5.7% 10.8% 0.0% 100.0%
12 months ended 31 December
2015
External revenue by segment 5,657.7 3,254.6 596.8 1,176.4 - 10,685.5
% of Group revenue 52.9% 30.5% 5.6% 11.0% 0.0% 100.0%
(In € million)
12 months
ended
31
December
2016
%
Revenue
12 months
ended
31
December
2015 (*)
%
Revenue
Wages and salaries (4,264.2) 36.4% (4,082.4) 38.2%
Social security charges (1,134.7) 9.7% (1,143.2) 10.7%
Tax, training, profit-sharing (42.4) 0.4% (27.2) 0.3%
Net (charge)/release to provisions for
staff expenses(0.2) 0.0% 8.0 -0.1%
Net (charge)/release of pension
provisions83.4 -0.7% 109.0 -1.0%
Total (5,358.1) 45.7% (5,135.8) 48.1%
(*) December 31, 2015 adjusted to reflect change in presentation disclosed in "Basis of preparation and
significant accounting policies".
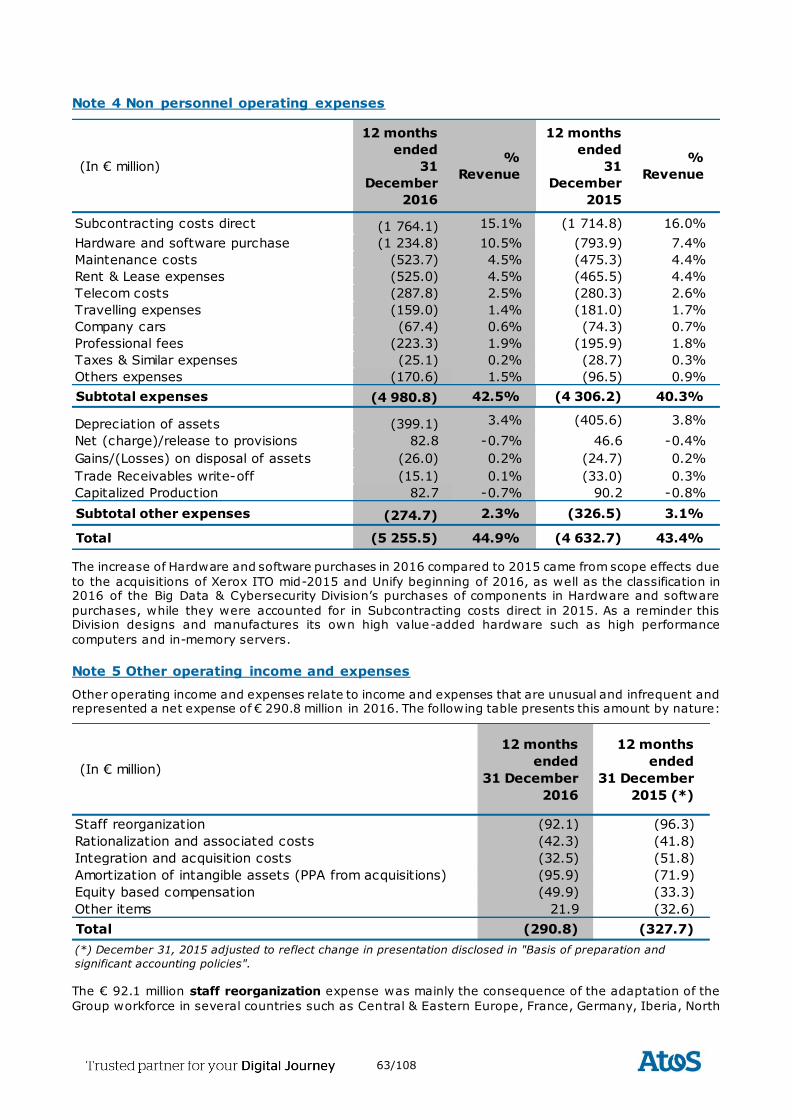
63/108
Note 4 Non personnel operating expenses
The increase of Hardware and software purchases in 2016 compared to 2015 came from scope effects due
to the acquisitions of Xerox ITO mid-2015 and Unify beginning of 2016, as well as the classification in 2016 of the Big Data & Cybersecurity Division’s purchases of components in Hardware and software
purchases, while they were accounted for in Subcontracting costs direct in 2015. As a reminder this Division designs and manufactures its own high value-added hardware such as high performance
computers and in-memory servers.
Note 5 Other operating income and expenses
Other operating income and expenses relate to income and expenses that are unusual and infrequent and represented a net expense of € 290.8 million in 2016. The following table presents this amount by nature:
The € 92.1 million staff reorganization expense was mainly the consequence of the adaptation of the
Group workforce in several countries such as Central & Eastern Europe, France, Germany, Iberia, North
(In € million)
12 months
ended
31
December
2016
%
Revenue
12 months
ended
31
December
2015
%
Revenue
Subcontracting costs direct (1 764.1) 15.1% (1 714.8) 16.0%
Hardware and software purchase (1 234.8) 10.5% (793.9) 7.4%
Maintenance costs (523.7) 4.5% (475.3) 4.4%
Rent & Lease expenses (525.0) 4.5% (465.5) 4.4%
Telecom costs (287.8) 2.5% (280.3) 2.6%
Travelling expenses (159.0) 1.4% (181.0) 1.7%
Company cars (67.4) 0.6% (74.3) 0.7%
Professional fees (223.3) 1.9% (195.9) 1.8%
Taxes & Similar expenses (25.1) 0.2% (28.7) 0.3%
Others expenses (170.6) 1.5% (96.5) 0.9%
Subtotal expenses (4 980.8) 42.5% (4 306.2) 40.3%
Depreciation of assets (399.1) 3.4% (405.6) 3.8%
Net (charge)/release to provisions 82.8 -0.7% 46.6 -0.4%
Gains/(Losses) on disposal of assets (26.0) 0.2% (24.7) 0.2%
Trade Receivables write-off (15.1) 0.1% (33.0) 0.3%
Capitalized Production 82.7 -0.7% 90.2 -0.8%
Subtotal other expenses (274.7) 2.3% (326.5) 3.1%
Total (5 255.5) 44.9% (4 632.7) 43.4%
(In € million)
12 months
ended
31 December
2016
12 months
ended
31 December
2015 (*)
Staff reorganization (92.1) (96.3)
Rationalization and associated costs (42.3) (41.8)
Integration and acquisition costs (32.5) (51.8)
Amortization of intangible assets (PPA from acquisitions) (95.9) (71.9)
Equity based compensation (49.9) (33.3)
Other items 21.9 (32.6)
Total (290.8) (327.7)
(*) December 31, 2015 adjusted to reflect change in presentation disclosed in "Basis of preparation and
significant accounting policies".
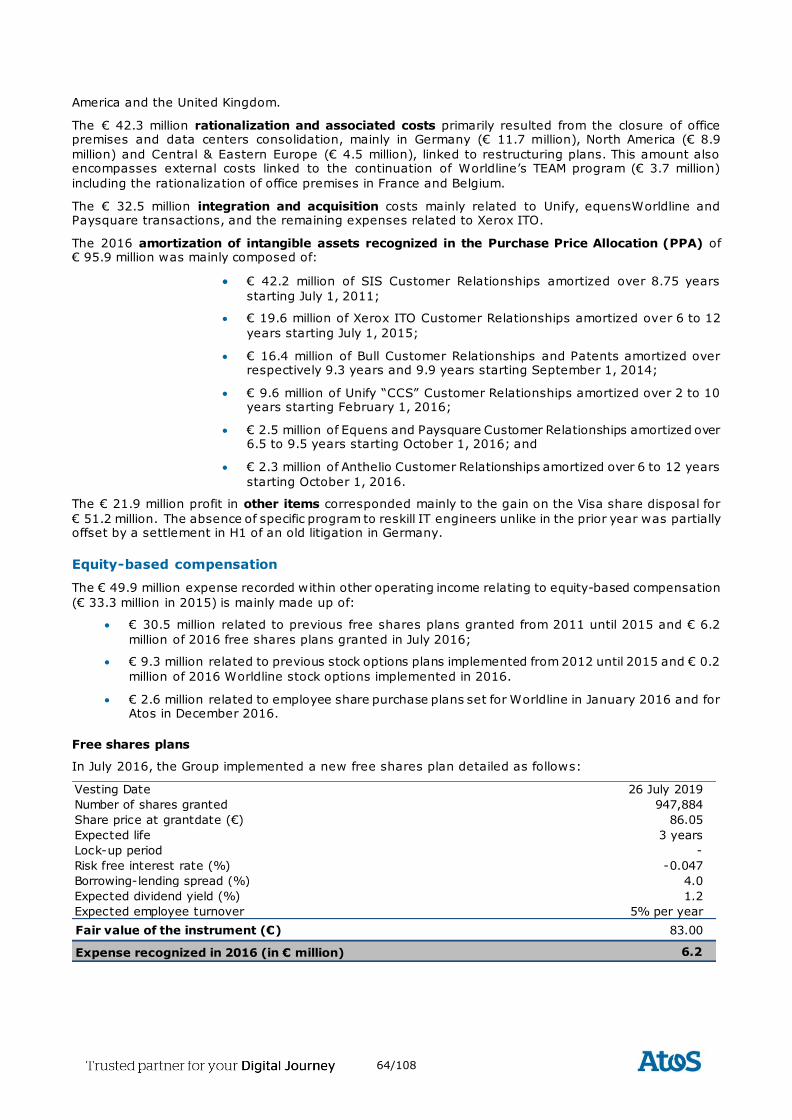
64/108
America and the United Kingdom.
The € 42.3 million rationalization and associated costs primarily resulted from the closure of office premises and data centers consolidation, mainly in Germany (€ 11.7 million), North America (€ 8.9
million) and Central & Eastern Europe (€ 4.5 million), linked to restructuring plans. This amount also encompasses external costs linked to the continuation of Worldline’s TEAM program (€ 3.7 million)
including the rationalization of office premises in France and Belgium.
The € 32.5 million integration and acquisition costs mainly related to Unify, equensWorldline and Paysquare transactions, and the remaining expenses related to Xerox ITO.
The 2016 amortization of intangible assets recognized in the Purchase Price Allocation (PPA) of € 95.9 million was mainly composed of:
€ 42.2 million of SIS Customer Relationships amortized over 8.75 years
starting July 1, 2011;
€ 19.6 million of Xerox ITO Customer Relationships amortized over 6 to 12
years starting July 1, 2015;
€ 16.4 million of Bull Customer Relationships and Patents amortized over respectively 9.3 years and 9.9 years starting September 1, 2014;
€ 9.6 million of Unify “CCS” Customer Relationships amortized over 2 to 10 years starting February 1, 2016;
€ 2.5 million of Equens and Paysquare Customer Relationships amortized over 6.5 to 9.5 years starting October 1, 2016; and
€ 2.3 million of Anthelio Customer Relationships amortized over 6 to 12 years
starting October 1, 2016.
The € 21.9 million profit in other items corresponded mainly to the gain on the Visa share disposal for
€ 51.2 million. The absence of specific program to reskill IT engineers unlike in the prior year was partially offset by a settlement in H1 of an old litigation in Germany.
Equity-based compensation
The € 49.9 million expense recorded within other operating income relating to equity-based compensation
(€ 33.3 million in 2015) is mainly made up of:
€ 30.5 million related to previous free shares plans granted from 2011 until 2015 and € 6.2
million of 2016 free shares plans granted in July 2016;
€ 9.3 million related to previous stock options plans implemented from 2012 until 2015 and € 0.2
million of 2016 Worldline stock options implemented in 2016.
€ 2.6 million related to employee share purchase plans set for Worldline in January 2016 and for Atos in December 2016.
Free shares plans
In July 2016, the Group implemented a new free shares plan detailed as follows:
Vesting Date 26 July 2019
Number of shares granted 947,884
Share price at grant date (€) 86.05
Expected life 3 years
Lock-up period -
Risk free interest rate (%) -0.047
Borrowing-lending spread (%) 4.0
Expected dividend yield (%) 1.2
Expected employee turnover 5% per year
Fair value of the instrument (€) 83.00
Expense recognized in 2016 (in € million) 6.2
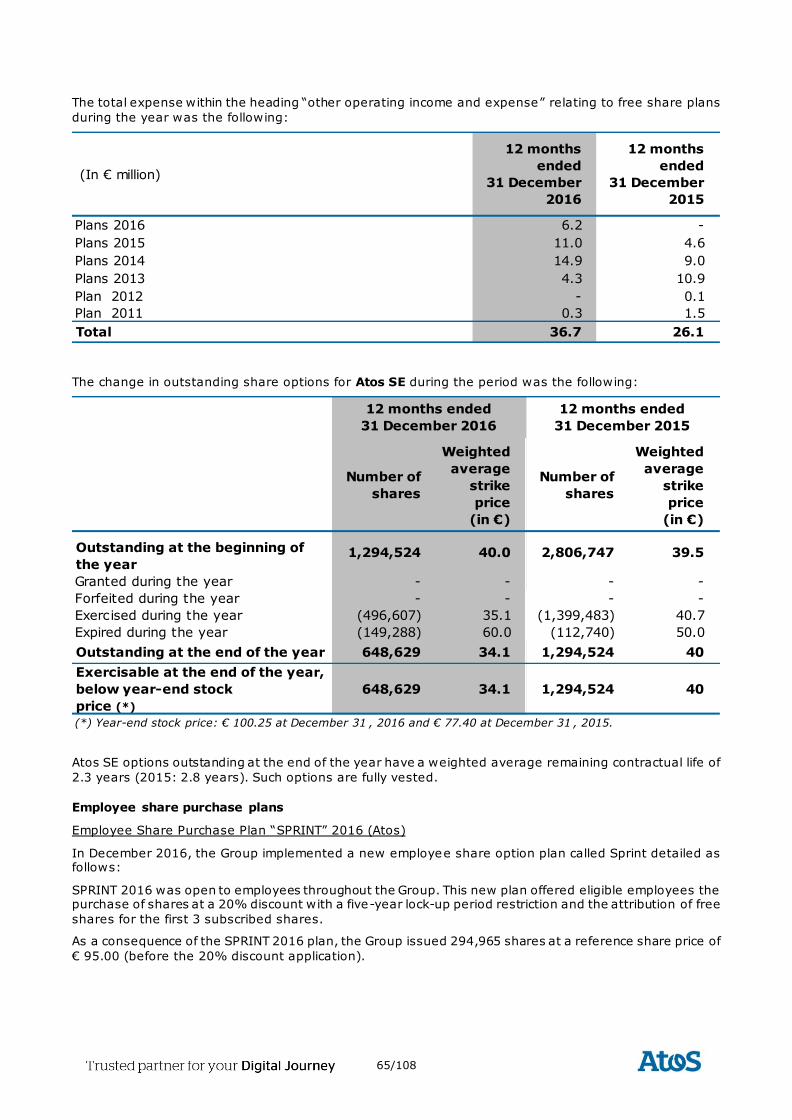
65/108
The total expense within the heading “other operating income and expense” relating to free share plans
during the year was the following:
The change in outstanding share options for Atos SE during the period was the following:
Atos SE options outstanding at the end of the year have a weighted average remaining contractual life of
2.3 years (2015: 2.8 years). Such options are fully vested.
Employee share purchase plans
Employee Share Purchase Plan “SPRINT” 2016 (Atos)
In December 2016, the Group implemented a new employee share option plan called Sprint detailed as follows:
SPRINT 2016 was open to employees throughout the Group. This new plan offered eligible employees the purchase of shares at a 20% discount with a five-year lock-up period restriction and the attribution of free
shares for the first 3 subscribed shares.
As a consequence of the SPRINT 2016 plan, the Group issued 294,965 shares at a reference share price of
€ 95.00 (before the 20% discount application).
(In € million)
12 months
ended
31 December
2016
12 months
ended
31 December
2015
Plans 2016 6.2 -
Plans 2015 11.0 4.6
Plans 2014 14.9 9.0
Plans 2013 4.3 10.9
Plan 2012 - 0.1
Plan 2011 0.3 1.5
Total 36.7 26.1
Number of
shares
Weighted
average
strike
price
(in €)
Number of
shares
Weighted
average
strike
price
(in €)
Outstanding at the beginning of
the year1,294,524 40.0 2,806,747 39.5
Granted during the year - - - -
Forfeited during the year - - - -
Exercised during the year (496,607) 35.1 (1,399,483) 40.7
Expired during the year (149,288) 60.0 (112,740) 50.0
Outstanding at the end of the year 648,629 34.1 1,294,524 40
Exercisable at the end of the year,
below year-end stock
price (*)
648,629 34.1 1,294,524 40
(*) Year-end stock price: € 100.25 at December 31 , 2016 and € 77.40 at December 31 , 2015.
12 months ended
31 December 2016
12 months ended
31 December 2015
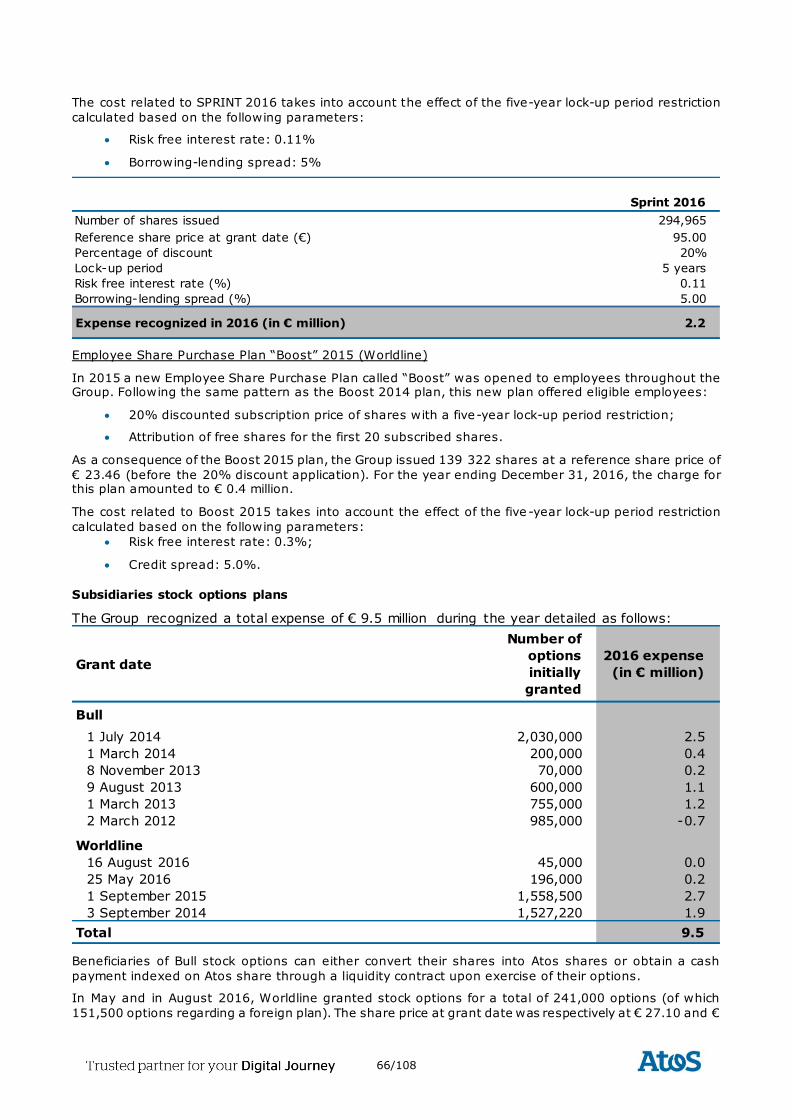
66/108
The cost related to SPRINT 2016 takes into account the effect of the five-year lock-up period restriction
calculated based on the following parameters:
Risk free interest rate: 0.11%
Borrowing-lending spread: 5%
Employee Share Purchase Plan “Boost” 2015 (Worldline)
In 2015 a new Employee Share Purchase Plan called “Boost” was opened to employees throughout the Group. Following the same pattern as the Boost 2014 plan, this new plan offered eligible employees:
20% discounted subscription price of shares with a five-year lock-up period restriction;
Attribution of free shares for the first 20 subscribed shares.
As a consequence of the Boost 2015 plan, the Group issued 139 322 shares at a reference share price of
€ 23.46 (before the 20% discount application). For the year ending December 31, 2016, the charge for this plan amounted to € 0.4 million.
The cost related to Boost 2015 takes into account the effect of the five -year lock-up period restriction
calculated based on the following parameters:
Risk free interest rate: 0.3%;
Credit spread: 5.0%.
Subsidiaries stock options plans
The Group recognized a total expense of € 9.5 million during the year detailed as follows:
Beneficiaries of Bull stock options can either convert their shares into Atos shares or obtain a cash
payment indexed on Atos share through a liquidity contract upon exercise of their options.
In May and in August 2016, Worldline granted stock options for a total of 241,000 options (of which
151,500 options regarding a foreign plan). The share price at grant date was respectively at € 27.10 and €
Sprint 2016
Number of shares issued 294,965
Reference share price at grant date (€) 95.00
Percentage of discount 20%
Lock-up period 5 years
Risk free interest rate (%) 0.11
Borrowing-lending spread (%) 5.00
Expense recognized in 2016 (in € million) 2.2
Grant date
Number of
options
initially
granted
2016 expense
(in € million)
Bull
1 July 2014 2,030,000 2.5
1 March 2014 200,000 0.4
8 November 2013 70,000 0.2
9 August 2013 600,000 1.1
1 March 2013 755,000 1.2
2 March 2012 985,000 -0.7
Worldline
16 August 2016 45,000 0.0
25 May 2016 196,000 0.2
1 September 2015 1,558,500 2.7
3 September 2014 1,527,220 1.9
Total 9.5
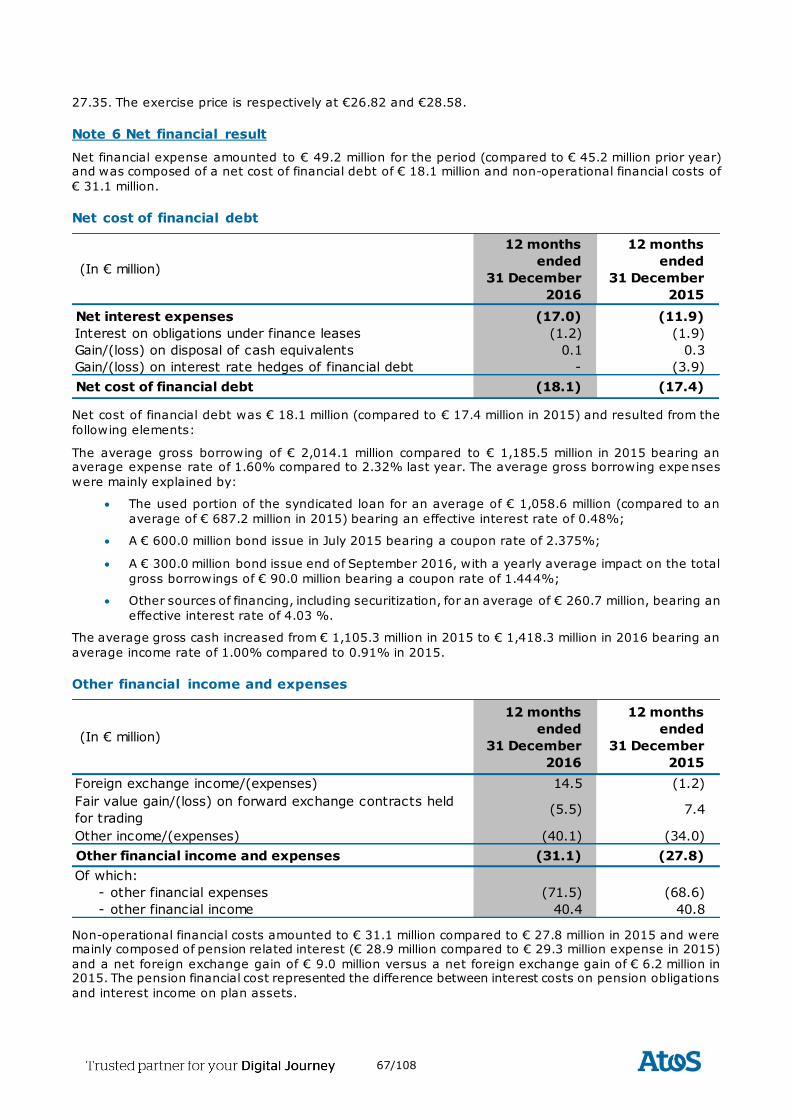
67/108
27.35. The exercise price is respectively at €26.82 and €28.58.
Note 6 Net financial result
Net financial expense amounted to € 49.2 million for the period (compared to € 45.2 million prior year) and was composed of a net cost of financial debt of € 18.1 million and non-operational financial costs of
€ 31.1 million.
Net cost of financial debt
Net cost of financial debt was € 18.1 million (compared to € 17.4 million in 2015) and resulted from the
following elements:
The average gross borrowing of € 2,014.1 million compared to € 1,185.5 million in 2015 bearing an average expense rate of 1.60% compared to 2.32% last year. The average gross borrowing expe nses
were mainly explained by:
The used portion of the syndicated loan for an average of € 1,058.6 million (compared to an
average of € 687.2 million in 2015) bearing an effective interest rate of 0.48%;
A € 600.0 million bond issue in July 2015 bearing a coupon rate of 2.375%;
A € 300.0 million bond issue end of September 2016, with a yearly average impact on the total
gross borrowings of € 90.0 million bearing a coupon rate of 1.444%;
Other sources of financing, including securitization, for an average of € 260.7 million, bearing an
effective interest rate of 4.03 %.
The average gross cash increased from € 1,105.3 million in 2015 to € 1,418.3 million in 2016 bearing an
average income rate of 1.00% compared to 0.91% in 2015.
Other financial income and expenses
Non-operational financial costs amounted to € 31.1 million compared to € 27.8 million in 2015 and were mainly composed of pension related interest (€ 28.9 million compared to € 29.3 million expense in 2015)
and a net foreign exchange gain of € 9.0 million versus a net foreign exchange gain of € 6.2 million in 2015. The pension financial cost represented the difference between interest costs on pension obligations
and interest income on plan assets.
(In € million)
12 months
ended
31 December
2016
12 months
ended
31 December
2015
Net interest expenses (17.0) (11.9)
Interest on obligations under finance leases (1.2) (1.9)
Gain/(loss) on disposal of cash equivalents 0.1 0.3
Gain/(loss) on interest rate hedges of financial debt - (3.9)
Net cost of financial debt (18.1) (17.4)
(In € million)
12 months
ended
31 December
2016
12 months
ended
31 December
2015
Foreign exchange income/(expenses) 14.5 (1.2)
Fair value gain/(loss) on forward exchange contracts held
for trading(5.5) 7.4
Other income/(expenses) (40.1) (34.0)
Other financial income and expenses (31.1) (27.8)
Of which:
- other financial expenses (71.5) (68.6)
- other financial income 40.4 40.8
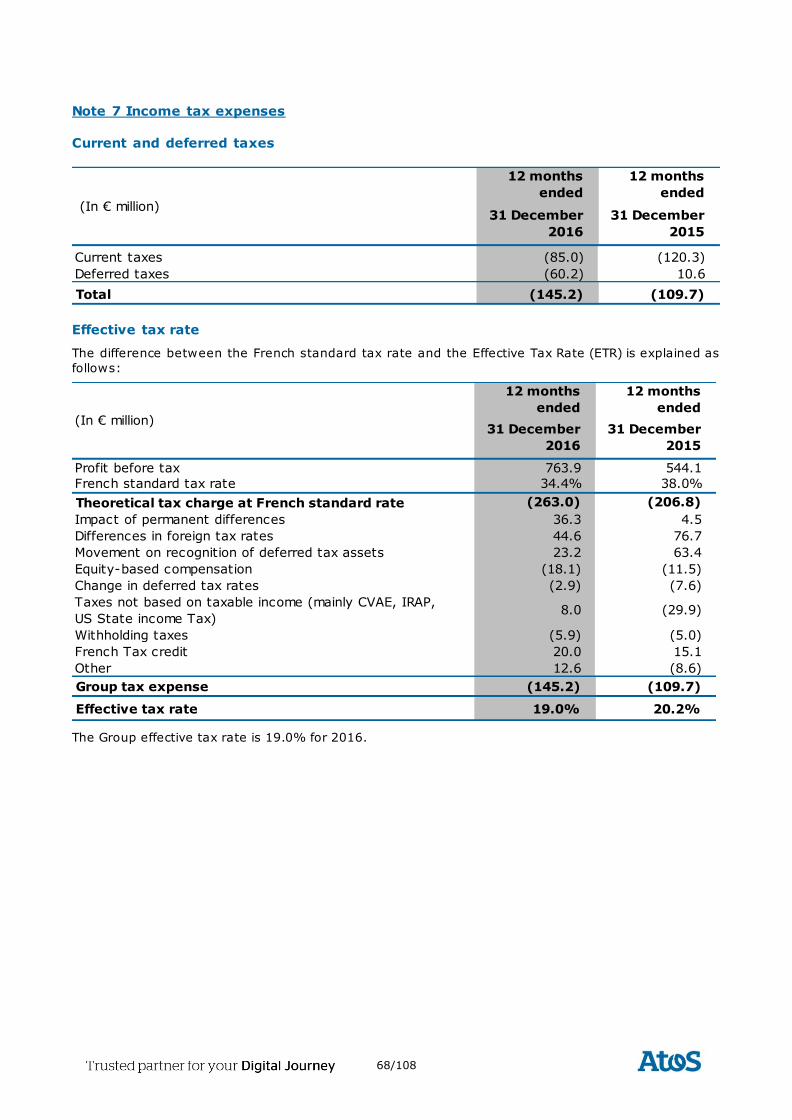
68/108
Note 7 Income tax expenses
Current and deferred taxes
Effective tax rate
The difference between the French standard tax rate and the Effective Tax Rate (ETR) is explained as
follows:
The Group effective tax rate is 19.0% for 2016.
12 months
ended
12 months
ended
31 December
2016
31 December
2015
Current taxes (85.0) (120.3)
Deferred taxes (60.2) 10.6
Total (145.2) (109.7)
(In € million)
12 months
ended
12 months
ended
31 December
2016
31 December
2015
Profit before tax 763.9 544.1
French standard tax rate 34.4% 38.0%
Theoretical tax charge at French standard rate (263.0) (206.8)
Impact of permanent differences 36.3 4.5
Differences in foreign tax rates 44.6 76.7
Movement on recognition of deferred tax assets 23.2 63.4
Equity-based compensation (18.1) (11.5)
Change in deferred tax rates (2.9) (7.6)
Taxes not based on taxable income (mainly CVAE, IRAP,
US State income Tax)8.0 (29.9)
Withholding taxes (5.9) (5.0)
French Tax credit 20.0 15.1
Other 12.6 (8.6)
Group tax expense (145.2) (109.7)
Effective tax rate 19.0% 20.2%
(In € million)
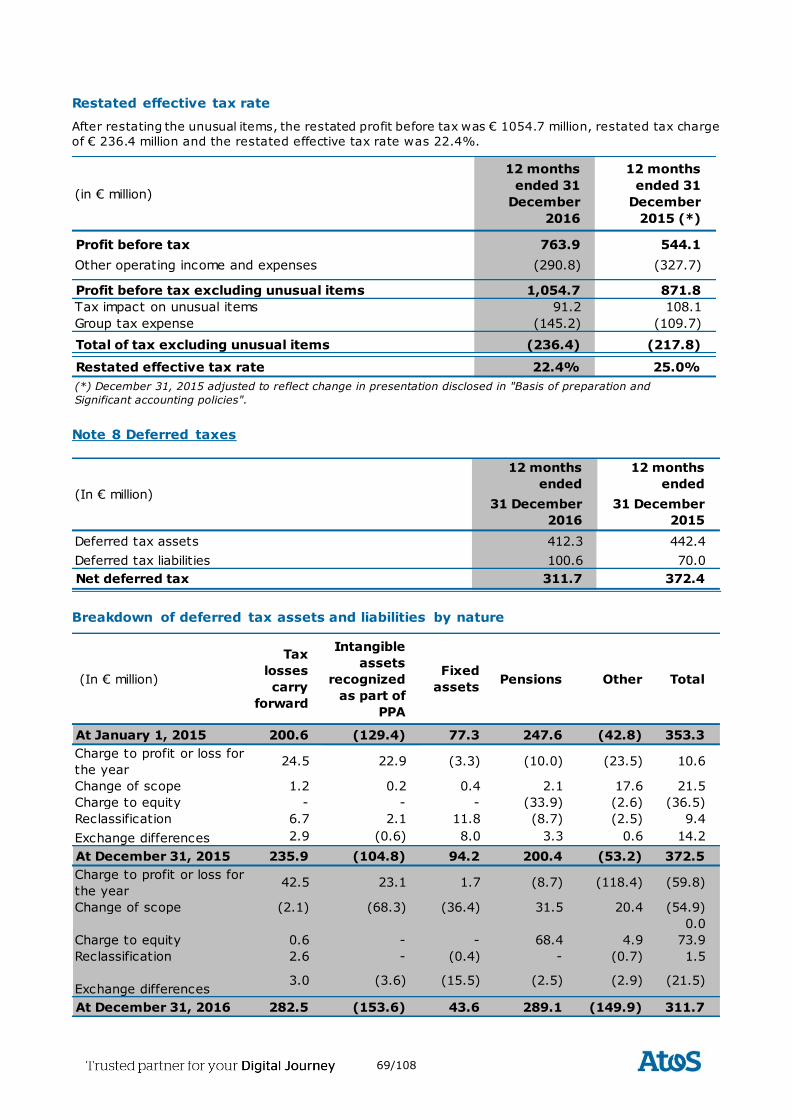
69/108
Restated effective tax rate
After restating the unusual items, the restated profit before tax was € 1054.7 million, restated tax charge
of € 236.4 million and the restated effective tax rate was 22.4%.
Note 8 Deferred taxes
Breakdown of deferred tax assets and liabilities by nature
(in € million)
12 months
ended 31
December
2016
12 months
ended 31
December
2015 (*)
Profit before tax 763.9 544.1
Other operating income and expenses (290.8) (327.7)
Profit before tax excluding unusual items 1,054.7 871.8
Tax impact on unusual items 91.2 108.1
Group tax expense (145.2) (109.7)
Total of tax excluding unusual items (236.4) (217.8)
Restated effective tax rate 22.4% 25.0%
(*) December 31, 2015 adjusted to reflect change in presentation disclosed in "Basis of preparation and
Significant accounting policies".
Deferred tax assets 442.4
70.0
Net deferred tax 372.4
412.3
12 months
ended
31 December
2015
Deferred tax liabilities
311.7
31 December
2016
100.6
(In € million)
12 months
ended
(In € million)
Tax
losses
carry
forward
Intangible
assets
recognized
as part of
PPA
Fixed
assetsPensions Other Total
At January 1, 2015 200.6 (129.4) 77.3 247.6 (42.8) 353.3
Charge to profit or loss for
the year24.5 22.9 (3.3) (10.0) (23.5) 10.6
Change of scope 1.2 0.2 0.4 2.1 17.6 21.5
Charge to equity - - - (33.9) (2.6) (36.5)
Reclassification 6.7 2.1 11.8 (8.7) (2.5) 9.4
Exchange differences 2.9 (0.6) 8.0 3.3 0.6 14.2
At December 31, 2015 235.9 (104.8) 94.2 200.4 (53.2) 372.5
Charge to profit or loss for
the year42.5 23.1 1.7 (8.7) (118.4) (59.8)
Change of scope (2.1) (68.3) (36.4) 31.5 20.4 (54.9)
0.0
Charge to equity 0.6 - - 68.4 4.9 73.9
Reclassification 2.6 - (0.4) - (0.7) 1.5
Exchange differences3.0 (3.6) (15.5) (2.5) (2.9) (21.5)
At December 31, 2016 282.5 (153.6) 43.6 289.1 (149.9) 311.7
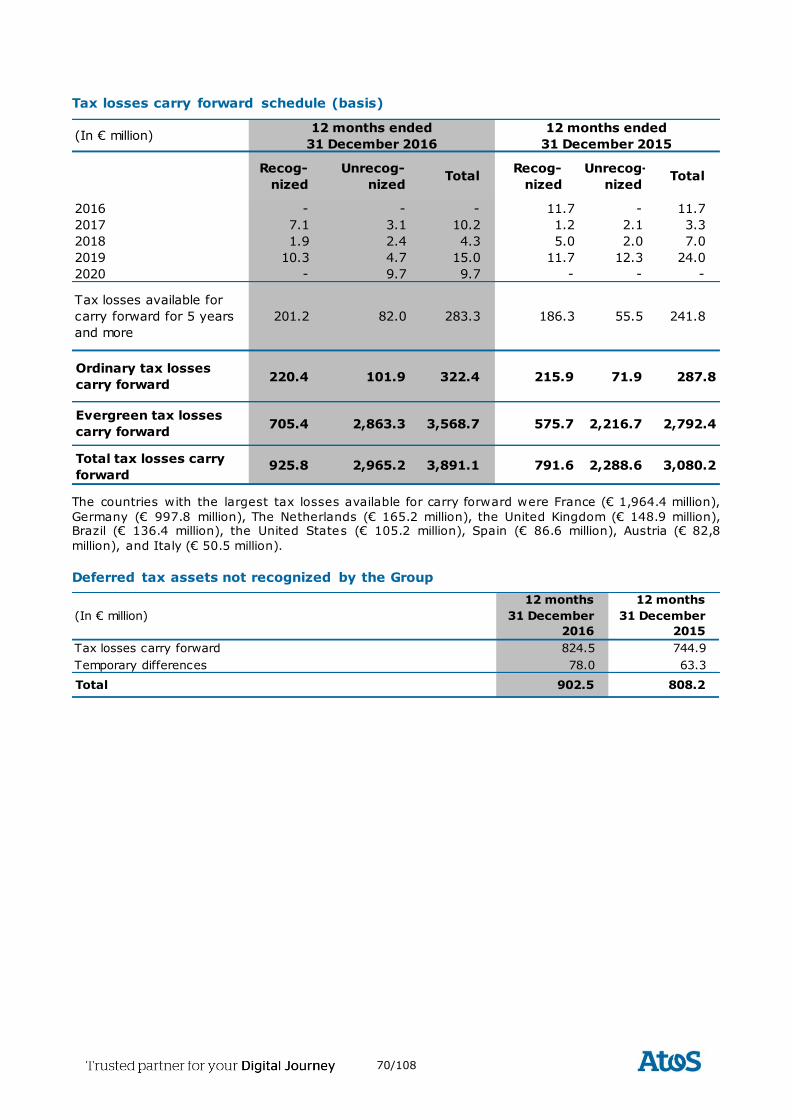
70/108
Tax losses carry forward schedule (basis)
The countries with the largest tax losses available for carry forward were France (€ 1,964.4 million),
Germany (€ 997.8 million), The Netherlands (€ 165.2 million), the United Kingdom (€ 148.9 million), Brazil (€ 136.4 million), the United States (€ 105.2 million), Spain (€ 86.6 million), Austria (€ 82,8
million), and Italy (€ 50.5 million).
Deferred tax assets not recognized by the Group
Recog-
nized
Unrecog-
nizedTotal
Recog-
nized
Unrecog-
nizedTotal
2016 - - - 11.7 - 11.7
2017 7.1 3.1 10.2 1.2 2.1 3.3
2018 1.9 2.4 4.3 5.0 2.0 7.0
2019 10.3 4.7 15.0 11.7 12.3 24.0
2020 - 9.7 9.7 - - -
Tax losses available for
carry forward for 5 years
and more
201.2 82.0 283.3 186.3 55.5 241.8
Ordinary tax losses
carry forward220.4 101.9 322.4 215.9 71.9 287.8
Evergreen tax losses
carry forward705.4 2,863.3 3,568.7 575.7 2,216.7 2,792.4
Total tax losses carry
forward925.8 2,965.2 3,891.1 791.6 2,288.6 3,080.2
12 months ended
31 December 2016
12 months ended
31 December 2015(In € million)
12 months 12 months
31 December
2016
31 December
2015
824.5 744.9
78.0 63.3
Total 902.5 808.2
(In € million)
Temporary differences
Tax losses carry forward
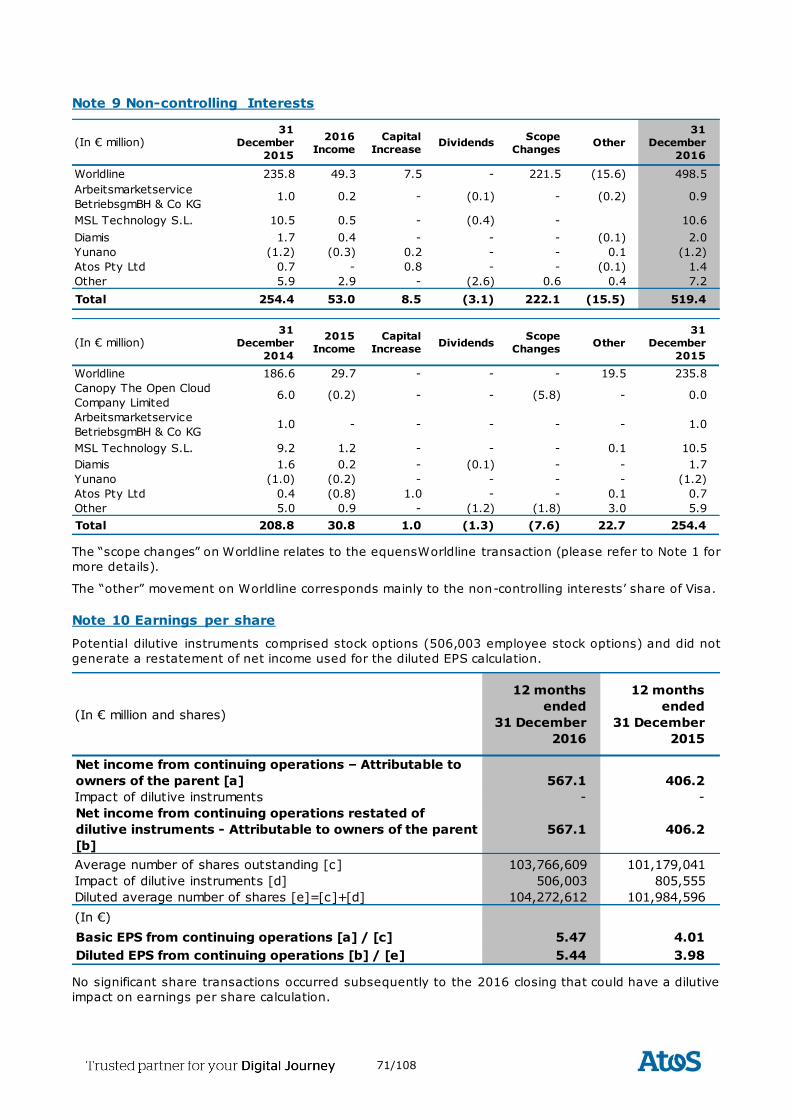
71/108
Note 9 Non-controlling Interests
The “scope changes” on Worldline relates to the equensWorldline transaction (please refer to Note 1 for
more details).
The “other” movement on Worldline corresponds mainly to the non-controlling interests’ share of Visa.
Note 10 Earnings per share
Potential dilutive instruments comprised stock options (506,003 employee stock options) and did not
generate a restatement of net income used for the diluted EPS calculation.
No significant share transactions occurred subsequently to the 2016 closing that could have a dilutive
impact on earnings per share calculation.
(In € million)31
December
2015
2016
Income
Capital
IncreaseDividends
Scope
ChangesOther
31
December
2016
Worldline 235.8 49.3 7.5 - 221.5 (15.6) 498.5
Arbeitsmarketservice
BetriebsgmBH & Co KG1.0 0.2 - (0.1) - (0.2) 0.9
MSL Technology S.L. 10.5 0.5 - (0.4) - 10.6
Diamis 1.7 0.4 - - - (0.1) 2.0
Yunano (1.2) (0.3) 0.2 - - 0.1 (1.2)
Atos Pty Ltd 0.7 - 0.8 - - (0.1) 1.4
Other 5.9 2.9 - (2.6) 0.6 0.4 7.2
Total 254.4 53.0 8.5 (3.1) 222.1 (15.5) 519.4
(In € million)31
December
2014
2015
Income
Capital
IncreaseDividends
Scope
ChangesOther
31
December
2015
Worldline 186.6 29.7 - - - 19.5 235.8
Canopy The Open Cloud
Company Limited6.0 (0.2) - - (5.8) - 0.0
Arbeitsmarketservice
BetriebsgmBH & Co KG1.0 - - - - - 1.0
MSL Technology S.L. 9.2 1.2 - - - 0.1 10.5
Diamis 1.6 0.2 - (0.1) - - 1.7
Yunano (1.0) (0.2) - - - - (1.2)
Atos Pty Ltd 0.4 (0.8) 1.0 - - 0.1 0.7
Other 5.0 0.9 - (1.2) (1.8) 3.0 5.9
Total 208.8 30.8 1.0 (1.3) (7.6) 22.7 254.4
(In € million and shares)
12 months
ended
31 December
2016
12 months
ended
31 December
2015
Net income from continuing operations – Attributable to
owners of the parent [a] 567.1 406.2
Impact of dilutive instruments - -
Net income from continuing operations restated of
dilutive instruments - Attributable to owners of the parent
[b]
567.1 406.2
Average number of shares outstanding [c] 103,766,609 101,179,041
Impact of dilutive instruments [d] 506,003 805,555
Diluted average number of shares [e]=[c]+[d] 104,272,612 101,984,596
(In €)
Basic EPS from continuing operations [a] / [c] 5.47 4.01
Diluted EPS from continuing operations [b] / [e] 5.44 3.98
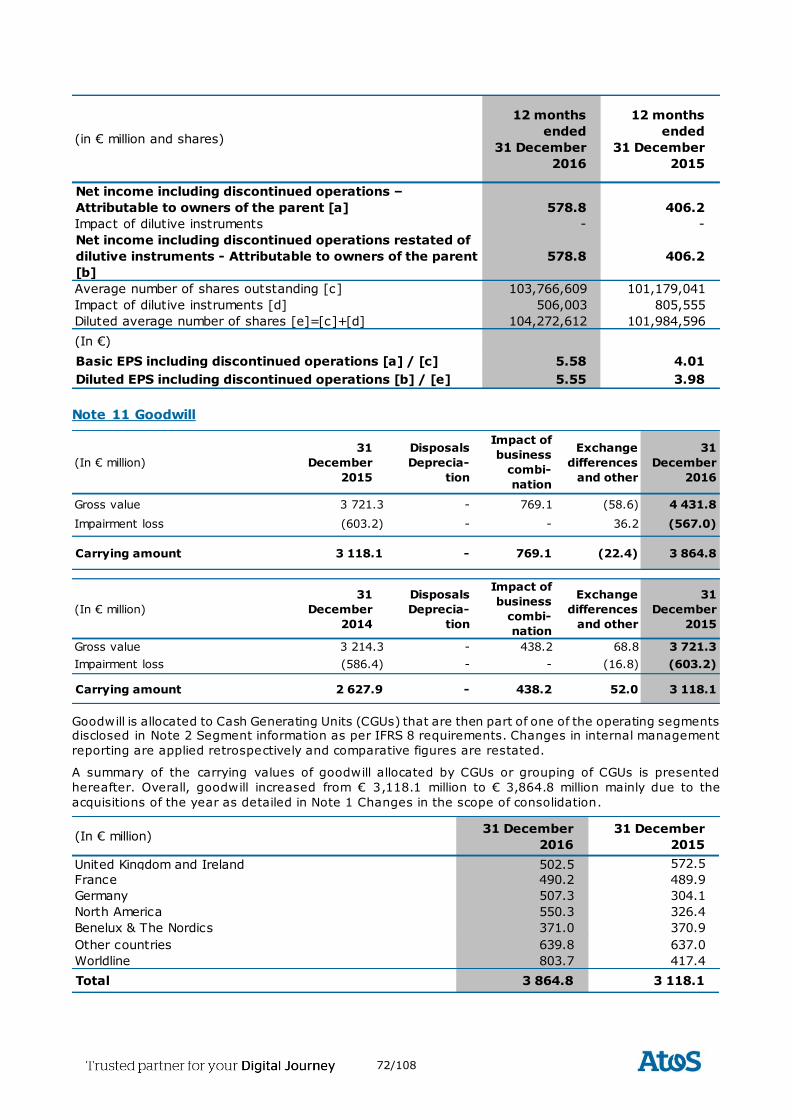
72/108
Note 11 Goodwill
Goodwill is allocated to Cash Generating Units (CGUs) that are then part of one of the operating segments disclosed in Note 2 Segment information as per IFRS 8 requirements. Changes in internal management
reporting are applied retrospectively and comparative figures are restated.
A summary of the carrying values of goodwill allocated by CGUs or grouping of CGUs is presented
hereafter. Overall, goodwill increased from € 3,118.1 million to € 3,864.8 million mainly due to the
acquisitions of the year as detailed in Note 1 Changes in the scope of consolidation.
(in € million and shares)
12 months
ended
31 December
2016
12 months
ended
31 December
2015
Net income including discontinued operations –
Attributable to owners of the parent [a] 578.8 406.2
Impact of dilutive instruments - -
Net income including discontinued operations restated of
dilutive instruments - Attributable to owners of the parent
[b]
578.8 406.2
Average number of shares outstanding [c] 103,766,609 101,179,041
Impact of dilutive instruments [d] 506,003 805,555
Diluted average number of shares [e]=[c]+[d] 104,272,612 101,984,596
(In €)
Basic EPS including discontinued operations [a] / [c] 5.58 4.01
Diluted EPS including discontinued operations [b] / [e] 5.55 3.98
(In € million)
31
December
2015
Disposals
Deprecia-
tion
Impact of
business
combi-
nation
Exchange
differences
and other
31
December
2016
Gross value 3 721.3 - 769.1 (58.6) 4 431.8
Impairment loss (603.2) - - 36.2 (567.0)
Carrying amount 3 118.1 - 769.1 (22.4) 3 864.8
(In € million)
31
December
2014
Disposals
Deprecia-
tion
Impact of
business
combi-
nation
Exchange
differences
and other
31
December
2015
Gross value 3 214.3 - 438.2 68.8 3 721.3
Impairment loss (586.4) - - (16.8) (603.2)
Carrying amount 2 627.9 - 438.2 52.0 3 118.1
(In € million)31 December
2016
31 December
2015
United Kingdom and Ireland 502.5 572.5
France 490.2 489.9
Germany 507.3 304.1
North America 550.3 326.4
Benelux & The Nordics 371.0 370.9
Other countries 639.8 637.0
Worldline 803.7 417.4
Total 3 864.8 3 118.1
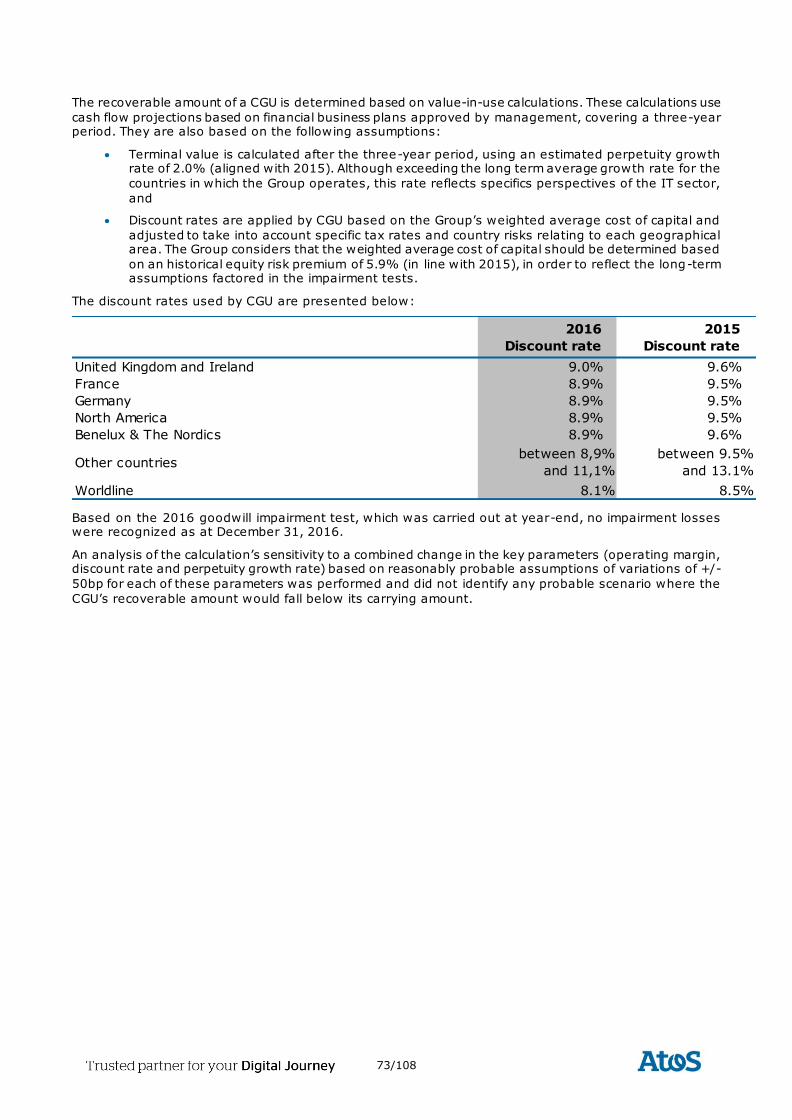
73/108
The recoverable amount of a CGU is determined based on value-in-use calculations. These calculations use
cash flow projections based on financial business plans approved by management, covering a three-year period. They are also based on the following assumptions:
Terminal value is calculated after the three-year period, using an estimated perpetuity growth rate of 2.0% (aligned with 2015). Although exceeding the long term average growth rate for the
countries in which the Group operates, this rate reflects specifics perspectives of the IT sector,
and
Discount rates are applied by CGU based on the Group’s weighted average cost of capital and
adjusted to take into account specific tax rates and country risks relating to each geographical area. The Group considers that the weighted average cost of capital should be determined based
on an historical equity risk premium of 5.9% (in line with 2015), in order to reflect the long-term assumptions factored in the impairment tests.
The discount rates used by CGU are presented below:
Based on the 2016 goodwill impairment test, which was carried out at year-end, no impairment losses were recognized as at December 31, 2016.
An analysis of the calculation’s sensitivity to a combined change in the key parameters (operating margin, discount rate and perpetuity growth rate) based on reasonably probable assumptions of variations of +/-
50bp for each of these parameters was performed and did not identify any probable scenario where the
CGU’s recoverable amount would fall below its carrying amount.
2016
Discount rate
2015
Discount rate
United Kingdom and Ireland 9.0% 9.6%
France 8.9% 9.5%
Germany 8.9% 9.5%
North America 8.9% 9.5%
Benelux & The Nordics 8.9% 9.6%
Other countriesbetween 8,9%
and 11,1%
between 9.5%
and 13.1%
Worldline 8.1% 8.5%
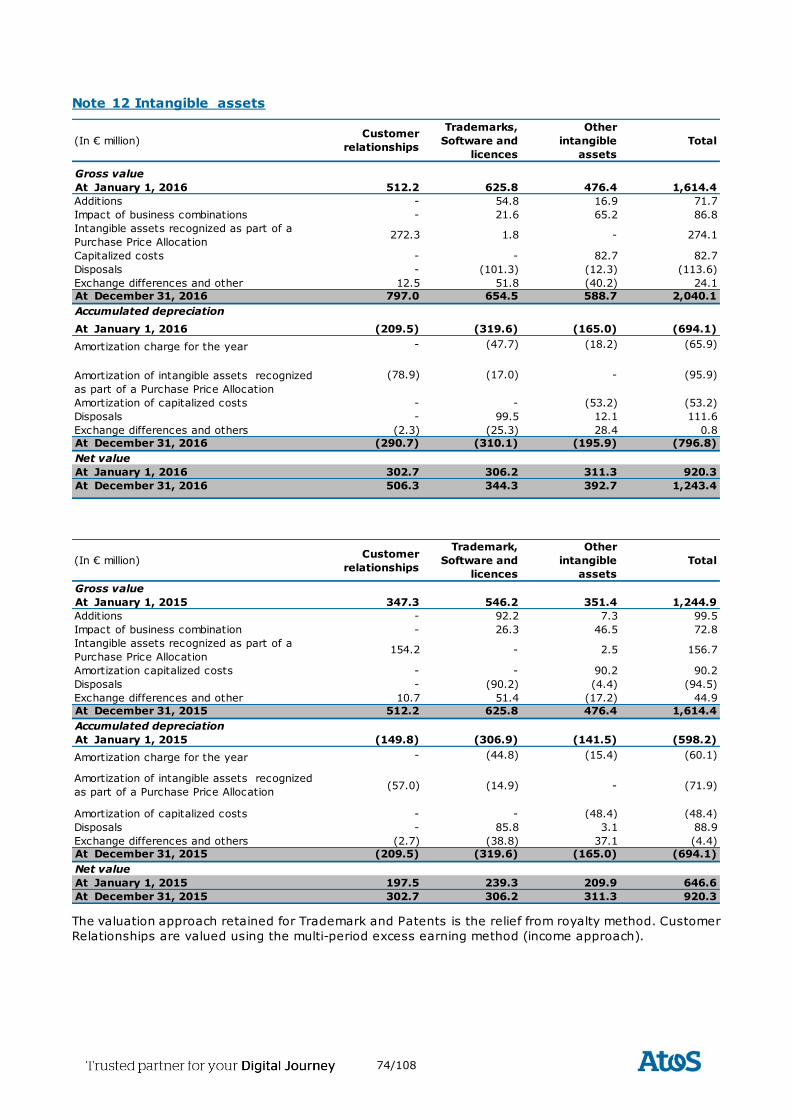
74/108
Note 12 Intangible assets
The valuation approach retained for Trademark and Patents is the relief from royalty method. Customer
Relationships are valued using the multi-period excess earning method (income approach).
(In € million)Customer
relationships
Trademarks,
Software and
licences
Other
intangible
assets
Total
Gross value
At January 1, 2016 512.2 625.8 476.4 1,614.4
Additions - 54.8 16.9 71.7
Impact of business combinations - 21.6 65.2 86.8
Intangible assets recognized as part of a
Purchase Price Allocation272.3 1.8 - 274.1
Capitalized costs - - 82.7 82.7
Disposals - (101.3) (12.3) (113.6)
Exchange differences and other 12.5 51.8 (40.2) 24.1
At December 31, 2016 797.0 654.5 588.7 2,040.1
Accumulated depreciation
At January 1, 2016 (209.5) (319.6) (165.0) (694.1)
Amortization charge for the year - (47.7) (18.2) (65.9)
Amortization of intangible assets recognized
as part of a Purchase Price Allocation
(78.9) (17.0) - (95.9)
Amortization of capitalized costs - - (53.2) (53.2)
Disposals - 99.5 12.1 111.6
Exchange differences and others (2.3) (25.3) 28.4 0.8
At December 31, 2016 (290.7) (310.1) (195.9) (796.8)
Net value
At January 1, 2016 302.7 306.2 311.3 920.3
At December 31, 2016 506.3 344.3 392.7 1,243.4
(In € million)Customer
relationships
Trademark,
Software and
licences
Other
intangible
assets
Total
Gross value
At January 1, 2015 347.3 546.2 351.4 1,244.9
Additions - 92.2 7.3 99.5
Impact of business combination - 26.3 46.5 72.8
Intangible assets recognized as part of a
Purchase Price Allocation154.2 - 2.5 156.7
Amortization capitalized costs - - 90.2 90.2
Disposals - (90.2) (4.4) (94.5)
Exchange differences and other 10.7 51.4 (17.2) 44.9
At December 31, 2015 512.2 625.8 476.4 1,614.4
Accumulated depreciation
At January 1, 2015 (149.8) (306.9) (141.5) (598.2)
Amortization charge for the year - (44.8) (15.4) (60.1)
Amortization of intangible assets recognized
as part of a Purchase Price Allocation(57.0) (14.9) - (71.9)
Amortization of capitalized costs - - (48.4) (48.4)
Disposals - 85.8 3.1 88.9
Exchange differences and others (2.7) (38.8) 37.1 (4.4)
At December 31, 2015 (209.5) (319.6) (165.0) (694.1)
Net value
At January 1, 2015 197.5 239.3 209.9 646.6
At December 31, 2015 302.7 306.2 311.3 920.3
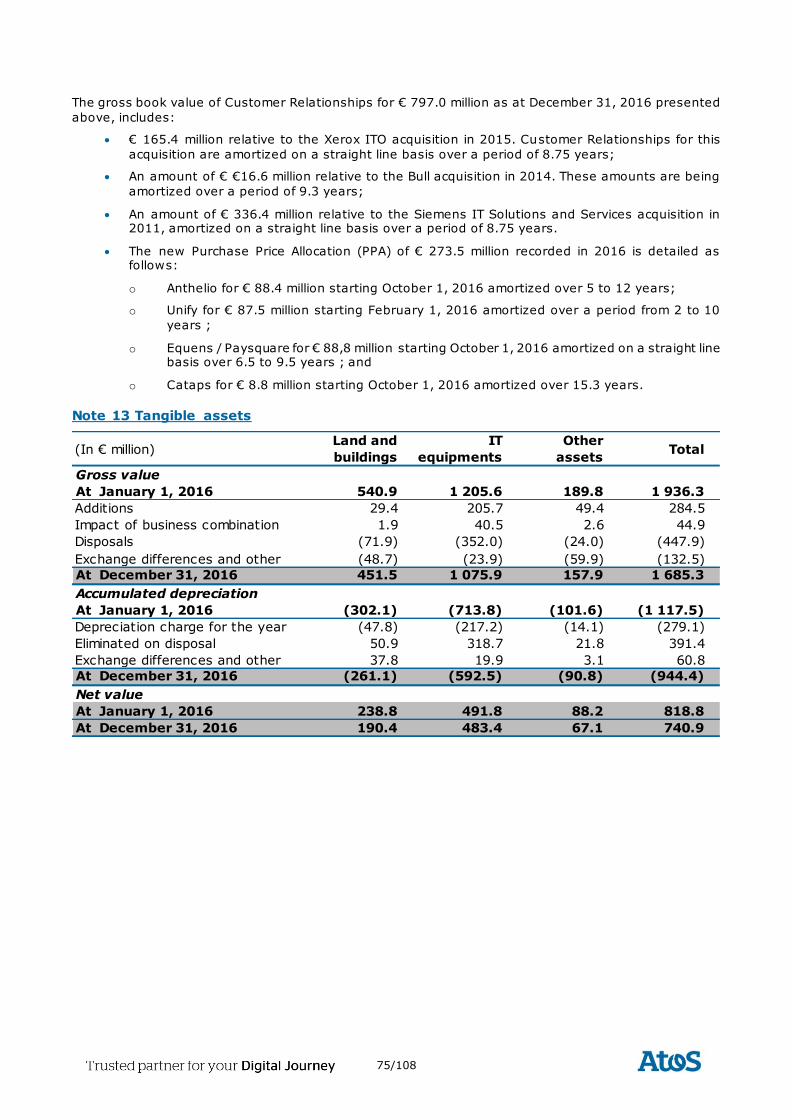
75/108
The gross book value of Customer Relationships for € 797.0 million as at December 31, 2016 presented
above, includes:
€ 165.4 million relative to the Xerox ITO acquisition in 2015. Customer Relationships for this
acquisition are amortized on a straight line basis over a period of 8.75 years;
An amount of € €16.6 million relative to the Bull acquisition in 2014. These amounts are being
amortized over a period of 9.3 years;
An amount of € 336.4 million relative to the Siemens IT Solutions and Services acquisition in 2011, amortized on a straight line basis over a period of 8.75 years.
The new Purchase Price Allocation (PPA) of € 273.5 million recorded in 2016 is detailed as follows:
o Anthelio for € 88.4 million starting October 1, 2016 amortized over 5 to 12 years;
o Unify for € 87.5 million starting February 1, 2016 amortized over a period from 2 to 10
years ;
o Equens / Paysquare for € 88,8 million starting October 1, 2016 amortized on a straight line basis over 6.5 to 9.5 years ; and
o Cataps for € 8.8 million starting October 1, 2016 amortized over 15.3 years.
Note 13 Tangible assets
(In € million)Land and
buildings
IT
equipments
Other
assetsTotal
Gross value
At January 1, 2016 540.9 1 205.6 189.8 1 936.3
Additions 29.4 205.7 49.4 284.5
Impact of business combination 1.9 40.5 2.6 44.9
Disposals (71.9) (352.0) (24.0) (447.9)
Exchange differences and other (48.7) (23.9) (59.9) (132.5)
At December 31, 2016 451.5 1 075.9 157.9 1 685.3
Accumulated depreciation
At January 1, 2016 (302.1) (713.8) (101.6) (1 117.5)
Depreciation charge for the year (47.8) (217.2) (14.1) (279.1)
Eliminated on disposal 50.9 318.7 21.8 391.4
Exchange differences and other 37.8 19.9 3.1 60.8
At December 31, 2016 (261.1) (592.5) (90.8) (944.4)
Net value
At January 1, 2016 238.8 491.8 88.2 818.8
At December 31, 2016 190.4 483.4 67.1 740.9
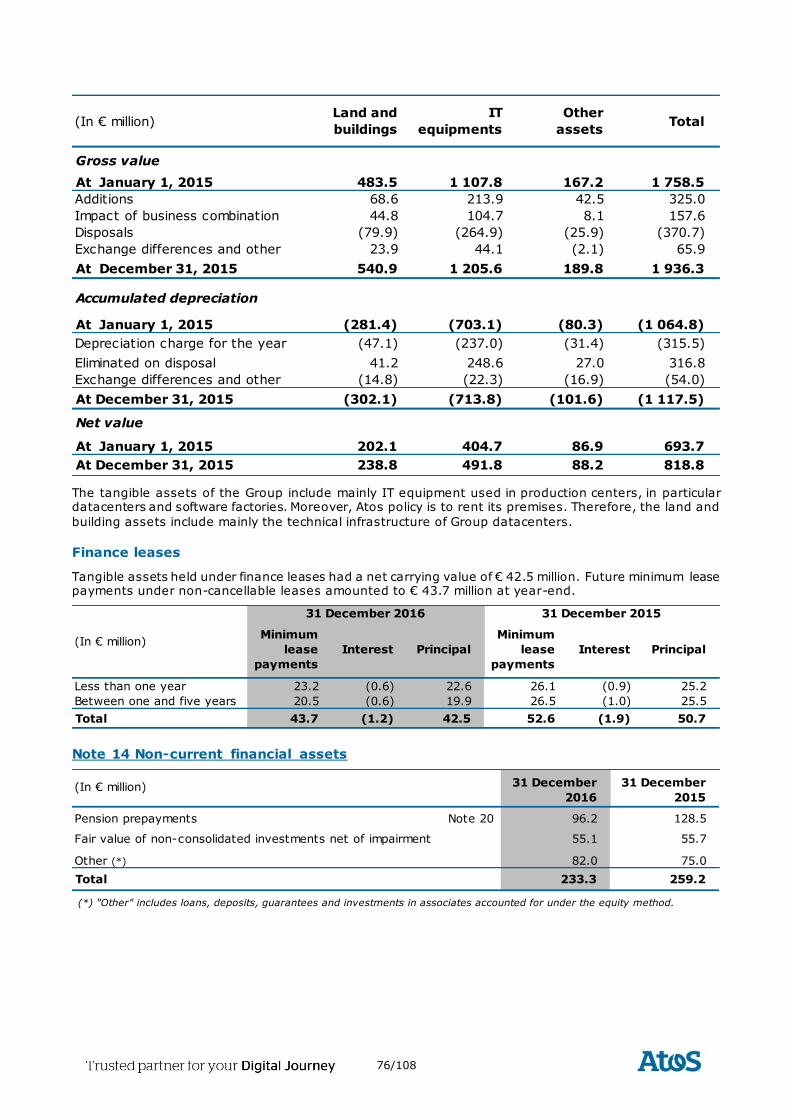
76/108
The tangible assets of the Group include mainly IT equipment used in production centers, in particular datacenters and software factories. Moreover, Atos policy is to rent its premises. Therefore, the land and
building assets include mainly the technical infrastructure of Group datacenters.
Finance leases
Tangible assets held under finance leases had a net carrying value of € 42.5 million. Future minimum lease payments under non-cancellable leases amounted to € 43.7 million at year-end.
Note 14 Non-current financial assets
(In € million)Land and
buildings
IT
equipments
Other
assetsTotal
Gross value
At January 1, 2015 483.5 1 107.8 167.2 1 758.5
Additions 68.6 213.9 42.5 325.0
Impact of business combination 44.8 104.7 8.1 157.6
Disposals (79.9) (264.9) (25.9) (370.7)
Exchange differences and other 23.9 44.1 (2.1) 65.9
At December 31, 2015 540.9 1 205.6 189.8 1 936.3
Accumulated depreciation
At January 1, 2015 (281.4) (703.1) (80.3) (1 064.8)
Depreciation charge for the year (47.1) (237.0) (31.4) (315.5)
Eliminated on disposal 41.2 248.6 27.0 316.8
Exchange differences and other (14.8) (22.3) (16.9) (54.0)
At December 31, 2015 (302.1) (713.8) (101.6) (1 117.5)
Net value
At January 1, 2015 202.1 404.7 86.9 693.7
At December 31, 2015 238.8 491.8 88.2 818.8
Minimum
lease
payments
Interest Principal
Minimum
lease
payments
Interest Principal
Less than one year 23.2 (0.6) 22.6 26.1 (0.9) 25.2
Between one and five years 20.5 (0.6) 19.9 26.5 (1.0) 25.5
Total 43.7 (1.2) 42.5 52.6 (1.9) 50.7
(In € million)
31 December 2016 31 December 2015
(In € million) 31 December
2016
31 December
2015
Pension prepayments Note 20 96.2 128.5
Fair value of non-consolidated investments net of impairment 55.1 55.7
Other (*) 82.0 75.0
Total 233.3 259.2
(*) "Other" includes loans, deposits, guarantees and investments in associates accounted for under the equity method.
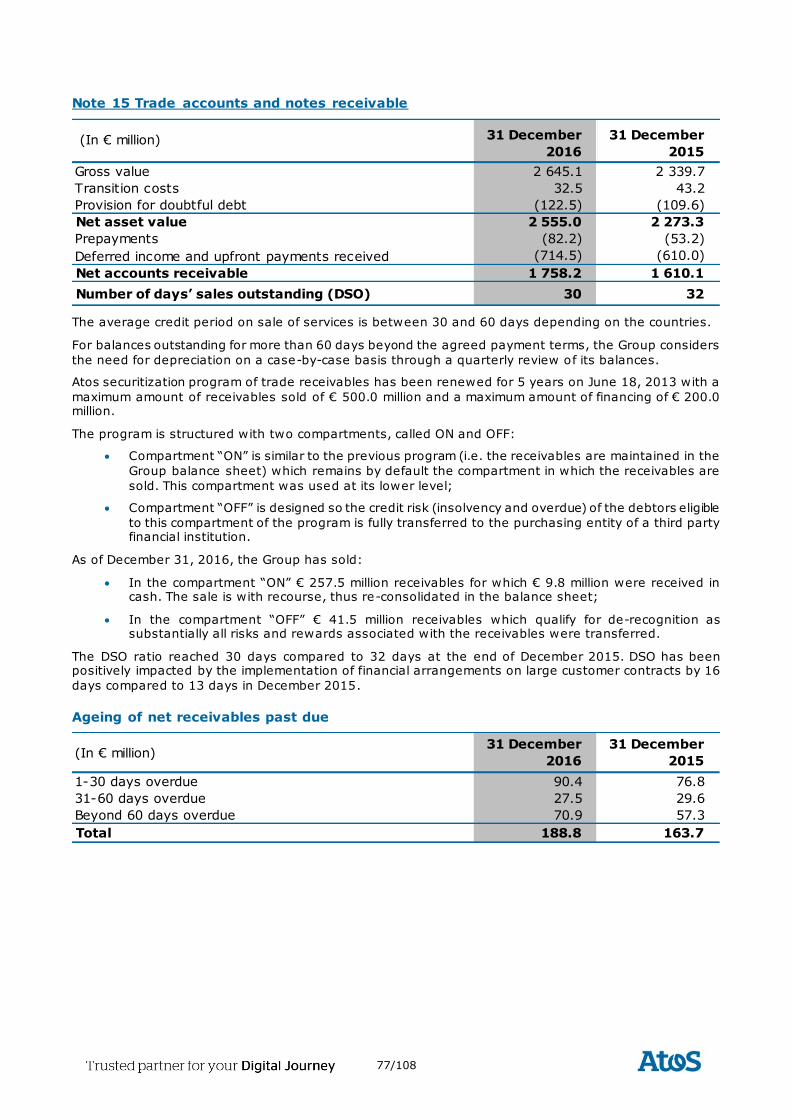
77/108
Note 15 Trade accounts and notes receivable
The average credit period on sale of services is between 30 and 60 days depending on the countries.
For balances outstanding for more than 60 days beyond the agreed payment terms, the Group considers
the need for depreciation on a case-by-case basis through a quarterly review of its balances.
Atos securitization program of trade receivables has been renewed for 5 years on June 18, 2013 with a
maximum amount of receivables sold of € 500.0 million and a maximum amount of financing of € 200.0 million.
The program is structured with two compartments, called ON and OFF:
Compartment “ON” is similar to the previous program (i.e. the receivables are maintained in the
Group balance sheet) which remains by default the compartment in which the receivables are
sold. This compartment was used at its lower level;
Compartment “OFF” is designed so the credit risk (insolvency and overdue) of the debtors eligible
to this compartment of the program is fully transferred to the purchasing entity of a third party financial institution.
As of December 31, 2016, the Group has sold:
In the compartment “ON” € 257.5 million receivables for which € 9.8 million were received in cash. The sale is with recourse, thus re-consolidated in the balance sheet;
In the compartment “OFF” € 41.5 million receivables which qualify for de-recognition as substantially all risks and rewards associated with the receivables were transferred.
The DSO ratio reached 30 days compared to 32 days at the end of December 2015. DSO has been positively impacted by the implementation of financial arrangements on large customer contracts by 16
days compared to 13 days in December 2015.
Ageing of net receivables past due
(In € million) 31 December
2016
31 December
2015
Gross value 2 645.1 2 339.7
Transition costs 32.5 43.2
Provision for doubtful debt (122.5) (109.6)
Net asset value 2 555.0 2 273.3
Prepayments (82.2) (53.2)
Deferred income and upfront payments received (714.5) (610.0)
Net accounts receivable 1 758.2 1 610.1
Number of days’ sales outstanding (DSO) 30 32
(In € million)31 December
2016
31 December
2015
1-30 days overdue 90.4 76.8
31-60 days overdue 27.5 29.6
Beyond 60 days overdue 70.9 57.3
Total 188.8 163.7
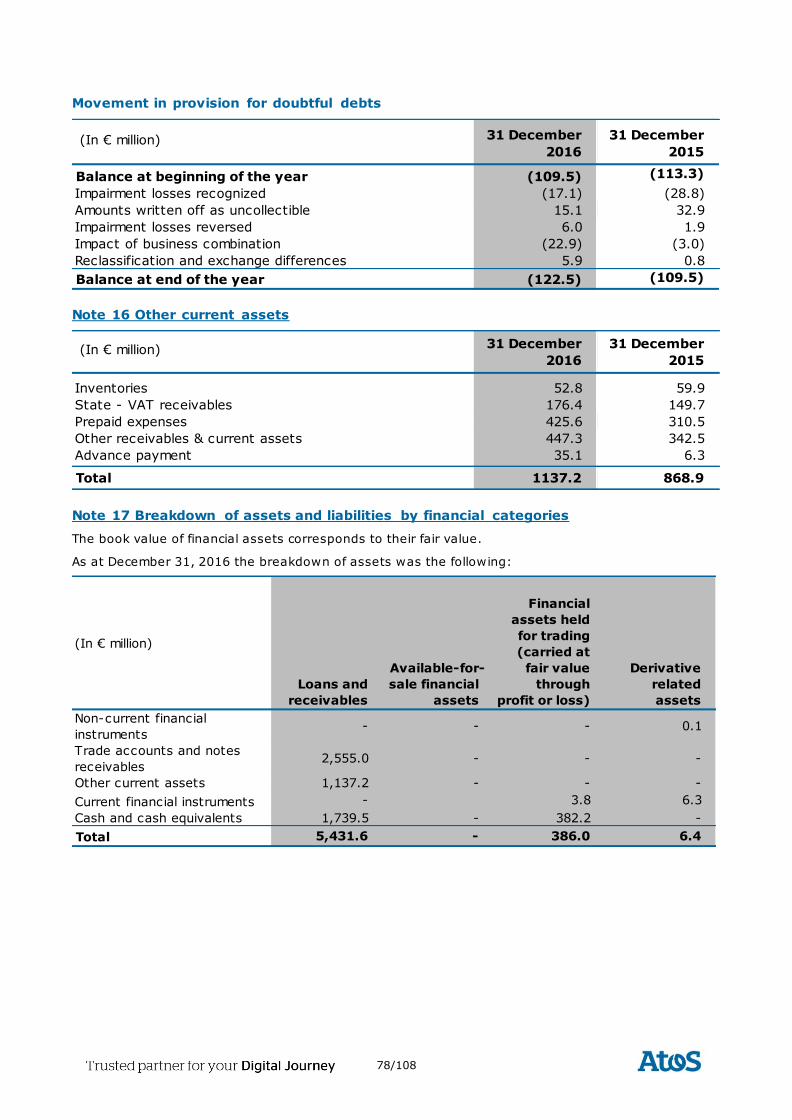
78/108
Movement in provision for doubtful debts
Note 16 Other current assets
Note 17 Breakdown of assets and liabilities by financial categories
The book value of financial assets corresponds to their fair value.
As at December 31, 2016 the breakdown of assets was the following:
(In € million) 31 December
2016
31 December
2015
Balance at beginning of the year (109.5) (113.3)
Impairment losses recognized (17.1) (28.8)
Amounts written off as uncollectible 15.1 32.9
Impairment losses reversed 6.0 1.9
Impact of business combination (22.9) (3.0)
Reclassification and exchange differences 5.9 0.8
Balance at end of the year (122.5) (109.5)
(In € million) 31 December
2016
31 December
2015
Inventories 52.8 59.9
State - VAT receivables 176.4 149.7
Prepaid expenses 425.6 310.5
Other receivables & current assets 447.3 342.5
Advance payment 35.1 6.3
Total 1137.2 868.9
(In € million)
Loans and
receivables
Available-for-
sale financial
assets
Financial
assets held
for trading
(carried at
fair value
through
profit or loss)
Derivative
related
assets
Non-current financial
instruments - - - 0.1
Trade accounts and notes
receivables2,555.0 - - -
Other current assets 1,137.2 - - -
Current financial instruments - 3.8 6.3
Cash and cash equivalents 1,739.5 - 382.2 -
Total 5,431.6 - 386.0 6.4
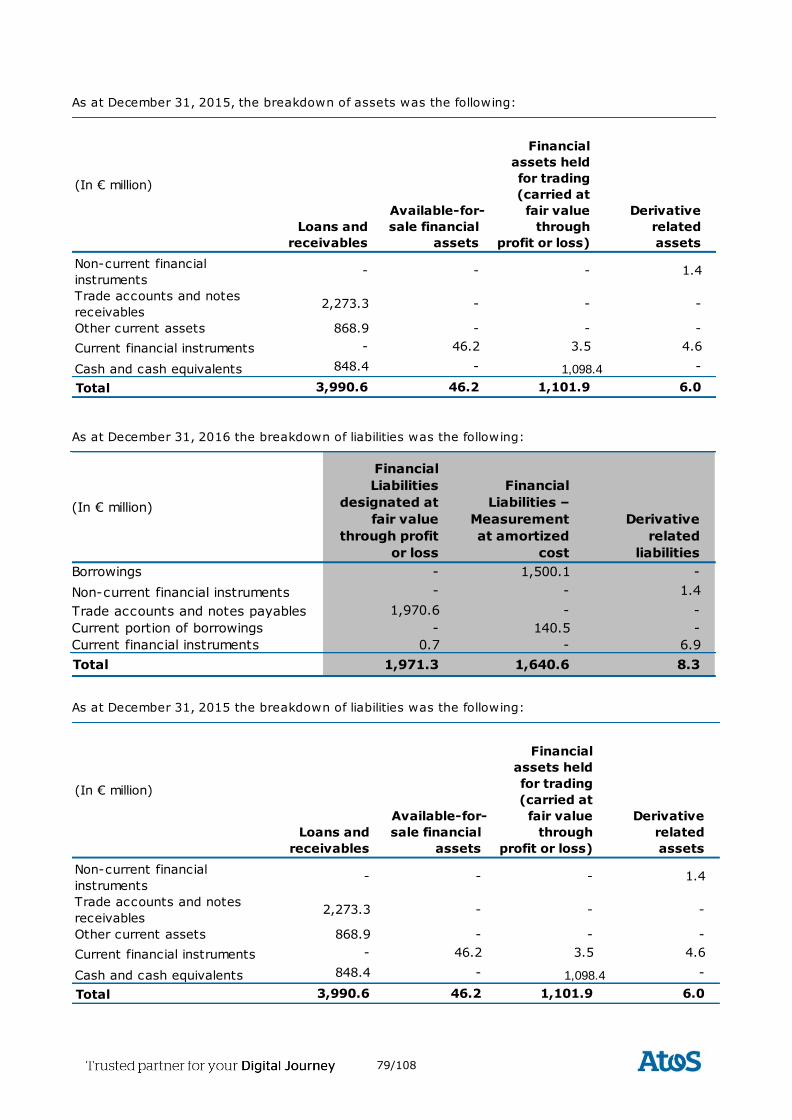
79/108
As at December 31, 2015, the breakdown of assets was the following:
As at December 31, 2016 the breakdown of liabilities was the following:
As at December 31, 2015 the breakdown of liabilities was the following:
(In € million)
Loans and
receivables
Available-for-
sale financial
assets
Financial
assets held
for trading
(carried at
fair value
through
profit or loss)
Derivative
related
assets
Non-current financial
instruments - - - 1.4
Trade accounts and notes
receivables2,273.3 - - -
Other current assets 868.9 - - -
Current financial instruments - 46.2 3.5 4.6
Cash and cash equivalents 848.4 - 1,098.4 -
Total 3,990.6 46.2 1,101.9 6.0
(In € million)
Financial
Liabilities
designated at
fair value
through profit
or loss
Financial
Liabilities –
Measurement
at amortized
cost
Derivative
related
liabilities
Borrowings - 1,500.1 -
Non-current financial instruments - - 1.4
Trade accounts and notes payables 1,970.6 - -
Current portion of borrowings - 140.5 -
Current financial instruments 0.7 - 6.9
Total 1,971.3 1,640.6 8.3
(In € million)
Loans and
receivables
Available-for-
sale financial
assets
Financial
assets held
for trading
(carried at
fair value
through
profit or loss)
Derivative
related
assets
Non-current financial
instruments - - - 1.4
Trade accounts and notes
receivables2,273.3 - - -
Other current assets 868.9 - - -
Current financial instruments - 46.2 3.5 4.6
Cash and cash equivalents 848.4 - 1,098.4 -
Total 3,990.6 46.2 1,101.9 6.0
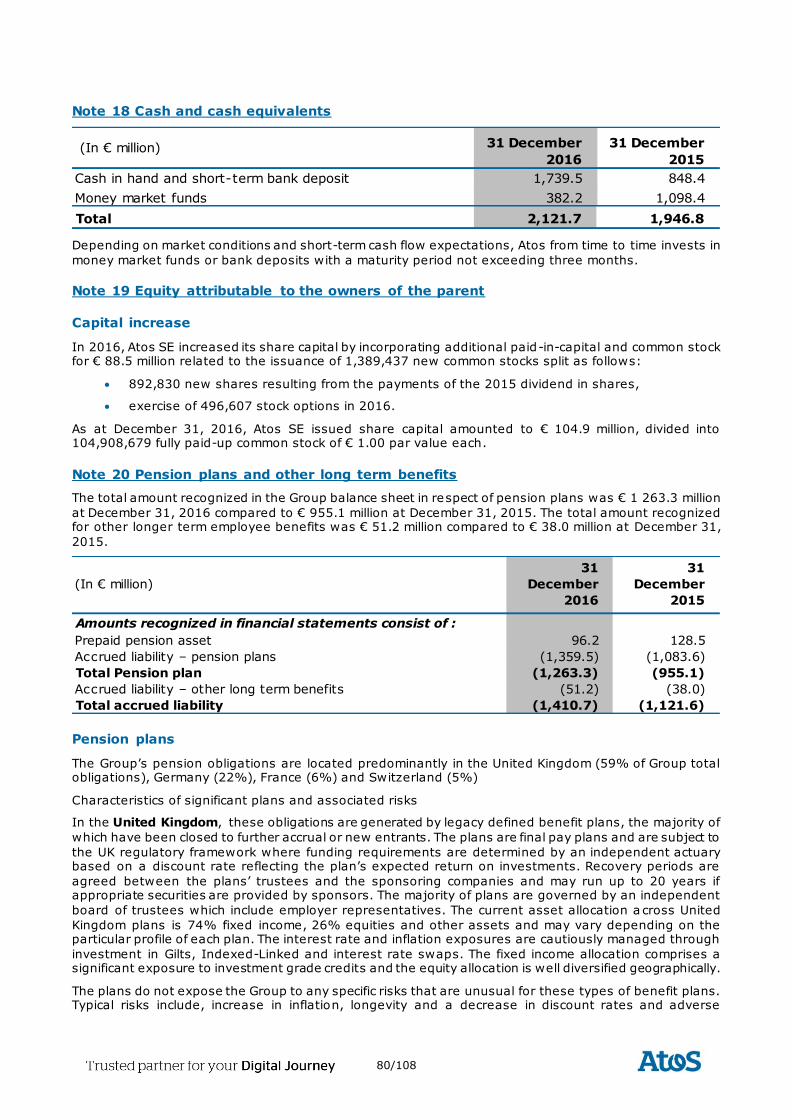
80/108
Note 18 Cash and cash equivalents
Depending on market conditions and short-term cash flow expectations, Atos from time to time invests in
money market funds or bank deposits with a maturity period not exceeding three months.
Note 19 Equity attributable to the owners of the parent
Capital increase
In 2016, Atos SE increased its share capital by incorporating additional paid-in-capital and common stock for € 88.5 million related to the issuance of 1,389,437 new common stocks split as follows:
892,830 new shares resulting from the payments of the 2015 dividend in shares,
exercise of 496,607 stock options in 2016.
As at December 31, 2016, Atos SE issued share capital amounted to € 104.9 million, divided into 104,908,679 fully paid-up common stock of € 1.00 par value each.
Note 20 Pension plans and other long term benefits
The total amount recognized in the Group balance sheet in respect of pension plans was € 1 263.3 million
at December 31, 2016 compared to € 955.1 million at December 31, 2015. The total amount recognized for other longer term employee benefits was € 51.2 million compared to € 38.0 million at December 31,
2015.
Pension plans
The Group’s pension obligations are located predominantly in the United Kingdom (59% of Group total obligations), Germany (22%), France (6%) and Switzerland (5%)
Characteristics of significant plans and associated risks
In the United Kingdom, these obligations are generated by legacy defined benefit plans, the majority of
which have been closed to further accrual or new entrants. The plans are final pay plans and are subject to
the UK regulatory framework where funding requirements are determined by an independent actuary based on a discount rate reflecting the plan’s expected return on investments. Recovery periods are
agreed between the plans’ trustees and the sponsoring companies and may run up to 20 years if appropriate securities are provided by sponsors. The majority of plans are governed by an independent
board of trustees which include employer representatives. The current asset allocation a cross United
Kingdom plans is 74% fixed income, 26% equities and other assets and may vary depending on the particular profile of each plan. The interest rate and inflation exposures are cautiously managed through
investment in Gilts, Indexed-Linked and interest rate swaps. The fixed income allocation comprises a significant exposure to investment grade credits and the equity allocation is well diversified geographically.
The plans do not expose the Group to any specific risks that are unusual for these types of benefit plans. Typical risks include, increase in inflation, longevity and a decrease in discount rates and adverse
(In € million) 31 December
2016
31 December
2015
Cash in hand and short-term bank deposit 1,739.5 848.4
Money market funds 382.2 1,098.4
Total 2,121.7 1,946.8
(In € million)
31
December
2016
31
December
2015
Amounts recognized in financial statements consist of :
Prepaid pension asset 96.2 128.5
Accrued liability – pension plans (1,359.5) (1,083.6)
Total Pension plan (1,263.3) (955.1)
Accrued liability – other long term benefits (51.2) (38.0)
Total accrued liability (1,410.7) (1,121.6)
81/108
investment returns.
In Germany the majority of the liabilities relate to pension entitlements that transferred to the Group with the acquisition of SIS in 2011. They mainly consist of grandfathering benefits related to a harmonization
introducing a contribution based pension plan in 2004. The plans are closed for new entrants, but do still accrue benefits for past service up to 2004. The plans cover multiple legal entities in Germany and are
subject to the German regulatory framework, which has no funding requirements, but does include
compulsory insolvency insurance (PSV). The plans are funded however, using a Contractual Trust Agreement (CTA). The CTA is governed by a professional independent third party. The investment strategy
is set by the Investment Committee composed of employer representatives. The asset allocation related to the largest German schemes is 79% fixed income, 12% equities and other assets and 9% property. The
fixed income allocation is predominantly in credit investment grade (c. 82%) and the remaining part in core euro zone government bonds. The return seeking portfolio comprises diversified equity and high yield
bonds. The asset allocation related to the other scheme is more in line with the lower interest rate
sensitivities of the schemes and are predominantly invested in investment grade credits and, to a lesser extent, in balanced funds and European high yield.
The Group obligations are also generated, but to a lesser extent, by legal or collectively bargained end of service or end of career benefit plans. The Group obligations with respect to post-employment healthcare
benefits are not significant.
Events in 2016
Over 2016 interest rates decreased in both the United Kingdom and the Eurozone leading to an increase in the measurement of pension liability values and positive investment returns on plan assets especially on
fixed income portfolio.
The acquisition of Unify led to an increase in liabilities (mainly in Germany and the United States) of €
136.3 million, covered by € 93.4 million of plan assets. Further to this, the joint venture between Worldline
and Equens, and the acquisition of Arvato led to a combined increase of liability of € 65.0 million covered by 23.0 million of plan assets.
In Germany, Atos has extended to Unify plans the additional lump sum options offered to Atos employees in 2015 and adopted the same indexing policy. This led to a reduction of operating expenses of € 6.5
million.
In the UK, the company and trustees of the Atos (Sema) Pension Scheme have reached an agreement to move the basis for inflation indexation from the Retail Price Index (RPI) to the Consumer Price Index (CPI)
in exchange for improved long term security to the plan including a Group parental guarantee of up to GBP 385 million and a one off discretionary benefit enhancement for affected beneficiaries. This led to an
overall reduction in liabilities and operating expenses of GBP 35.9 million including actuarial, legal and other project costs.
Curtailment in pension liabilities related to restructuring and other events have been recorded in other
operating income for a total amount of € 10.3 million and mainly concerns Switzerland.
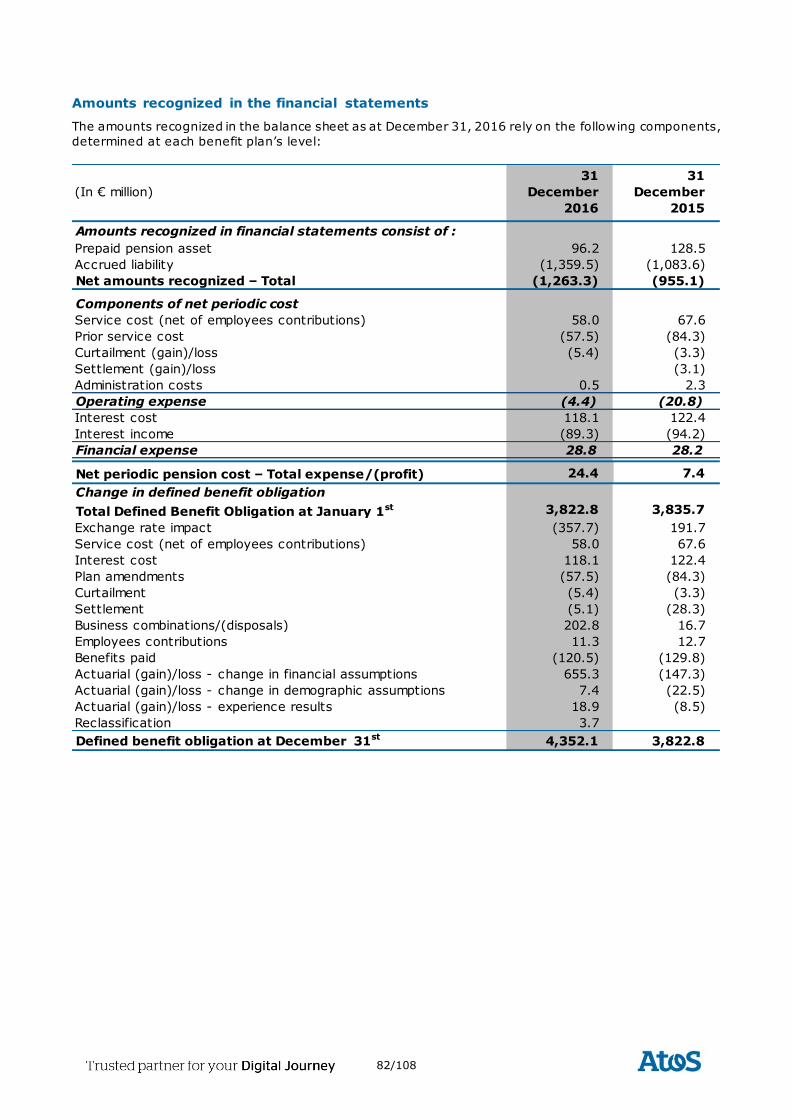
82/108
Amounts recognized in the financial statements
The amounts recognized in the balance sheet as at December 31, 2016 rely on the following components,
determined at each benefit plan’s level:
(In € million)
31
December
2016
31
December
2015
Amounts recognized in financial statements consist of :
Prepaid pension asset 96.2 128.5
Accrued liability (1,359.5) (1,083.6)
Net amounts recognized – Total (1,263.3) (955.1)
Components of net periodic cost
Service cost (net of employees contributions) 58.0 67.6
Prior service cost (57.5) (84.3)
Curtailment (gain)/loss (5.4) (3.3)
Settlement (gain)/loss (3.1)
Administration costs 0.5 2.3
Operating expense (4.4) (20.8)
Interest cost 118.1 122.4
Interest income (89.3) (94.2)
Financial expense 28.8 28.2
Net periodic pension cost – Total expense/(profit) 24.4 7.4
Change in defined benefit obligation
Total Defined Benefit Obligation at January 1st 3,822.8 3,835.7
Exchange rate impact (357.7) 191.7
Service cost (net of employees contributions) 58.0 67.6
Interest cost 118.1 122.4
Plan amendments (57.5) (84.3)
Curtailment (5.4) (3.3)
Settlement (5.1) (28.3)
Business combinations/(disposals) 202.8 16.7
Employees contributions 11.3 12.7
Benefits paid (120.5) (129.8)
Actuarial (gain)/loss - change in financial assumptions 655.3 (147.3)
Actuarial (gain)/loss - change in demographic assumptions 7.4 (22.5)
Actuarial (gain)/loss - experience results 18.9 (8.5)
Reclassification 3.7
Defined benefit obligation at December 31st 4,352.1 3,822.8
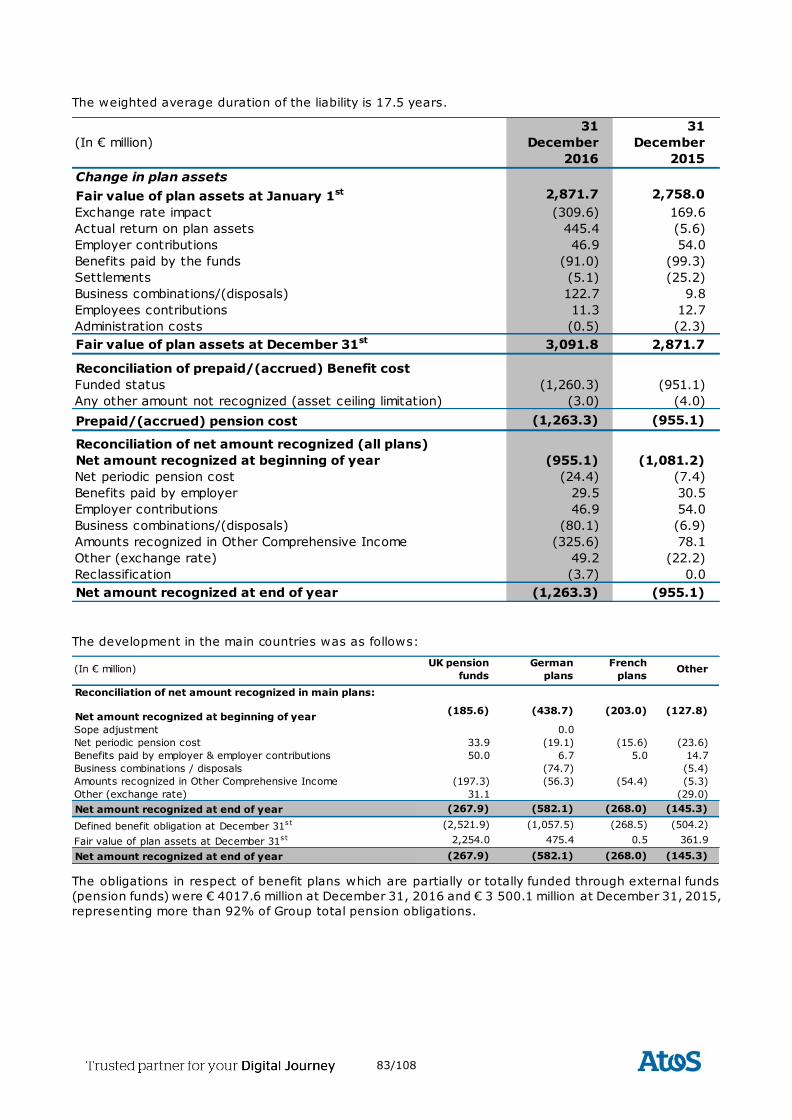
83/108
The weighted average duration of the liability is 17.5 years.
The development in the main countries was as follows:
The obligations in respect of benefit plans which are partially or totally funded through external funds
(pension funds) were € 4017.6 million at December 31, 2016 and € 3 500.1 million at December 31, 2015,
representing more than 92% of Group total pension obligations.
(In € million)
31
December
2016
31
December
2015
Change in plan assets
Fair value of plan assets at January 1st 2,871.7 2,758.0
Exchange rate impact (309.6) 169.6
Actual return on plan assets 445.4 (5.6)
Employer contributions 46.9 54.0
Benefits paid by the funds (91.0) (99.3)
Settlements (5.1) (25.2)
Business combinations/(disposals) 122.7 9.8
Employees contributions 11.3 12.7
Administration costs (0.5) (2.3)
Fair value of plan assets at December 31st 3,091.8 2,871.7
Reconciliation of prepaid/(accrued) Benefit cost
Funded status (1,260.3) (951.1)
Any other amount not recognized (asset ceiling limitation) (3.0) (4.0)
Prepaid/(accrued) pension cost (1,263.3) (955.1)
Reconciliation of net amount recognized (all plans)
Net amount recognized at beginning of year (955.1) (1,081.2)
Net periodic pension cost (24.4) (7.4)
Benefits paid by employer 29.5 30.5
Employer contributions 46.9 54.0
Business combinations/(disposals) (80.1) (6.9)
Amounts recognized in Other Comprehensive Income (325.6) 78.1
Other (exchange rate) 49.2 (22.2)
Reclassification (3.7) 0.0
Net amount recognized at end of year (1,263.3) (955.1)
(In € million)UK pension
funds
German
plans
French
plansOther
Reconciliation of net amount recognized in main plans:
Net amount recognized at beginning of year(185.6) (438.7) (203.0) (127.8)
Sope adjustment 0.0
Net periodic pension cost 33.9 (19.1) (15.6) (23.6)
Benefits paid by employer & employer contributions 50.0 6.7 5.0 14.7
Business combinations / disposals (74.7) (5.4)
Amounts recognized in Other Comprehensive Income (197.3) (56.3) (54.4) (5.3)
Other (exchange rate) 31.1 (29.0)
Net amount recognized at end of year (267.9) (582.1) (268.0) (145.3)
Defined benefit obligation at December 31s t (2,521.9) (1,057.5) (268.5) (504.2)
Fair value of plan assets at December 31s t 2,254.0 475.4 0.5 361.9
Net amount recognized at end of year (267.9) (582.1) (268.0) (145.3)
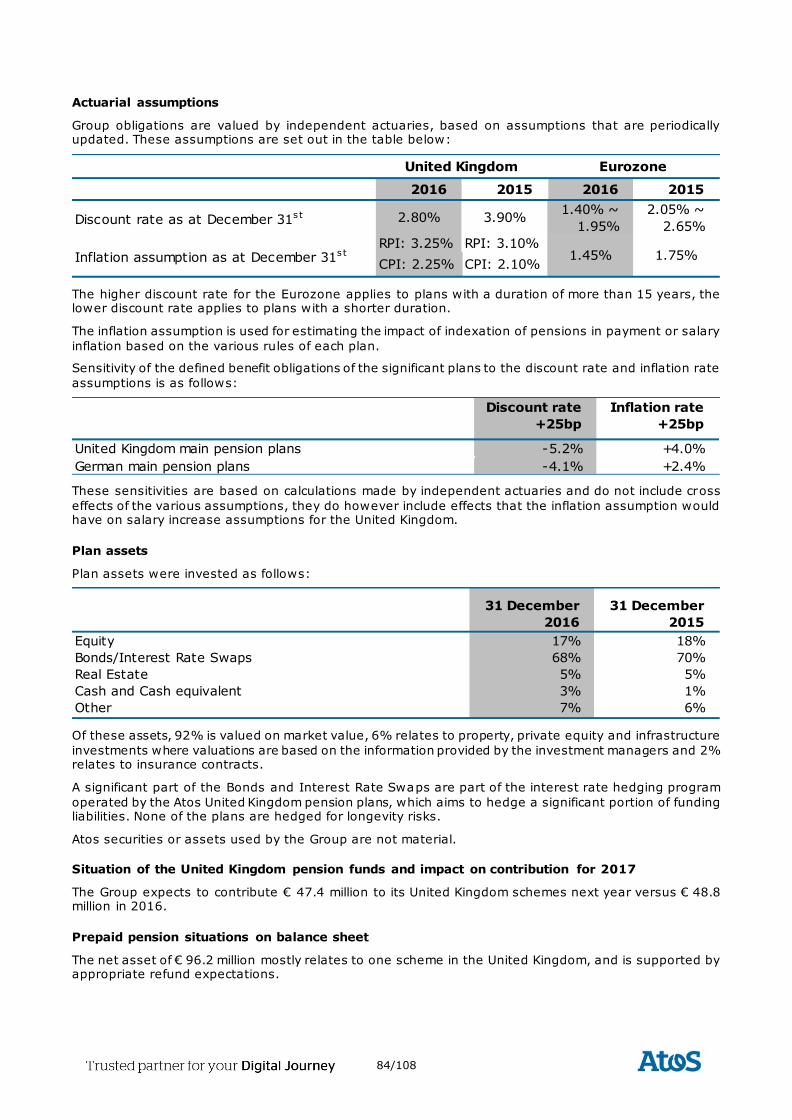
84/108
Actuarial assumptions
Group obligations are valued by independent actuaries, based on assumptions that are periodically updated. These assumptions are set out in the table below:
The higher discount rate for the Eurozone applies to plans with a duration of more than 15 years, the lower discount rate applies to plans with a shorter duration.
The inflation assumption is used for estimating the impact of indexation of pensions in payment or salary
inflation based on the various rules of each plan.
Sensitivity of the defined benefit obligations of the significant plans to the discount rate and inflation rate
assumptions is as follows:
These sensitivities are based on calculations made by independent actuaries and do not include cross
effects of the various assumptions, they do however include effects that the inflation assumption would have on salary increase assumptions for the United Kingdom.
Plan assets
Plan assets were invested as follows:
Of these assets, 92% is valued on market value, 6% relates to property, private equity and infrastructure
investments where valuations are based on the information provided by the investment managers and 2% relates to insurance contracts.
A significant part of the Bonds and Interest Rate Swaps are part of the interest rate hedging program
operated by the Atos United Kingdom pension plans, which aims to hedge a significant portion of funding liabilities. None of the plans are hedged for longevity risks.
Atos securities or assets used by the Group are not material.
Situation of the United Kingdom pension funds and impact on contribution for 2017
The Group expects to contribute € 47.4 million to its United Kingdom schemes next year versus € 48.8 million in 2016.
Prepaid pension situations on balance sheet
The net asset of € 96.2 million mostly relates to one scheme in the United Kingdom, and is supported by appropriate refund expectations.
2016 2015 2016 2015
Discount rate as at December 31s t 2.80% 3.90%1.40% ~
1.95%
2.05% ~
2.65%
RPI: 3.25% RPI: 3.10%
CPI: 2.25% CPI: 2.10%Inflation assumption as at December 31s t
United Kingdom Eurozone
1.45% 1.75%
Discount rate
+25bp
Inflation rate
+25bp
United Kingdom main pension plans -5.2% +4.0%
German main pension plans -4.1% +2.4%
31 December
2016
31 December
2015
Equity 17% 18%
Bonds/Interest Rate Swaps 68% 70%
Real Estate 5% 5%
Cash and Cash equivalent 3% 1%
Other 7% 6%
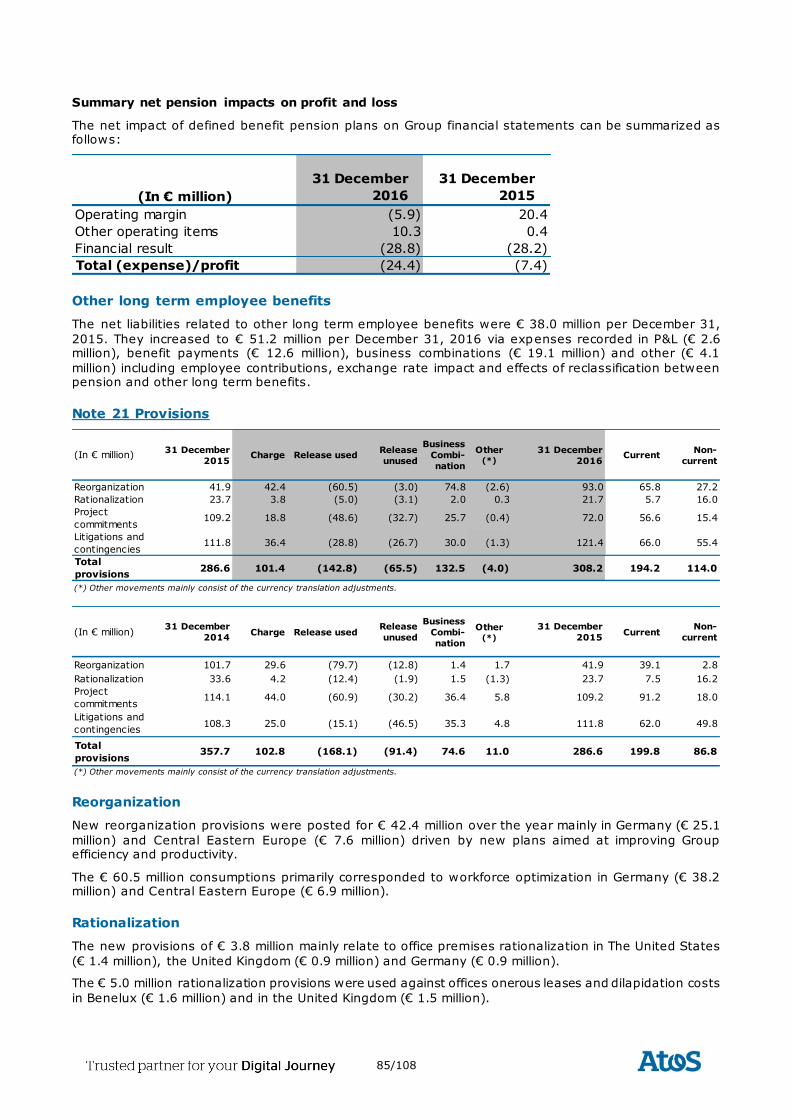
85/108
Summary net pension impacts on profit and loss
The net impact of defined benefit pension plans on Group financial statements can be summarized as follows:
Other long term employee benefits
The net liabilities related to other long term employee benefits were € 38.0 million per December 31,
2015. They increased to € 51.2 million per December 31, 2016 via expenses recorded in P&L (€ 2.6 million), benefit payments (€ 12.6 million), business combinations (€ 19.1 million) and other (€ 4.1
million) including employee contributions, exchange rate impact and effects of reclassification between pension and other long term benefits.
Note 21 Provisions
Reorganization
New reorganization provisions were posted for € 42.4 million over the year mainly in Germany (€ 25.1
million) and Central Eastern Europe (€ 7.6 million) driven by new plans aimed at improving Group efficiency and productivity.
The € 60.5 million consumptions primarily corresponded to workforce optimization in Germany (€ 38.2 million) and Central Eastern Europe (€ 6.9 million).
Rationalization
The new provisions of € 3.8 million mainly relate to office premises rationalization in The United States
(€ 1.4 million), the United Kingdom (€ 0.9 million) and Germany (€ 0.9 million).
The € 5.0 million rationalization provisions were used against offices onerous leases and dilapidation costs
in Benelux (€ 1.6 million) and in the United Kingdom (€ 1.5 million).
(In € million)
31 December
2016
31 December
2015
Operating margin (5.9) 20.4
Other operating items 10.3 0.4
Financial result (28.8) (28.2)
Total (expense)/profit (24.4) (7.4)
(In € million)31 December
2015Charge Release used
Release
unused
Business
Combi-
nation
Other (*)
31 December
2016Current
Non-
current
Reorganization 41.9 42.4 (60.5) (3.0) 74.8 (2.6) 93.0 65.8 27.2
Rationalization 23.7 3.8 (5.0) (3.1) 2.0 0.3 21.7 5.7 16.0
Project
commitments109.2 18.8 (48.6) (32.7) 25.7 (0.4) 72.0 56.6 15.4
Litigations and
contingencies111.8 36.4 (28.8) (26.7) 30.0 (1.3) 121.4 66.0 55.4
Total
provisions286.6 101.4 (142.8) (65.5) 132.5 (4.0) 308.2 194.2 114.0
(*) Other movements mainly consist of the currency translation adjustments.
(In € million)31 December
2014Charge Release used
Release
unused
Business
Combi-
nation
Other (*)
31 December
2015Current
Non-
current
Reorganization 101.7 29.6 (79.7) (12.8) 1.4 1.7 41.9 39.1 2.8
Rationalization 33.6 4.2 (12.4) (1.9) 1.5 (1.3) 23.7 7.5 16.2
Project
commitments114.1 44.0 (60.9) (30.2) 36.4 5.8 109.2 91.2 18.0
Litigations and
contingencies108.3 25.0 (15.1) (46.5) 35.3 4.8 111.8 62.0 49.8
Total
provisions357.7 102.8 (168.1) (91.4) 74.6 11.0 286.6 199.8 86.8
(*) Other movements mainly consist of the currency translation adjustments.
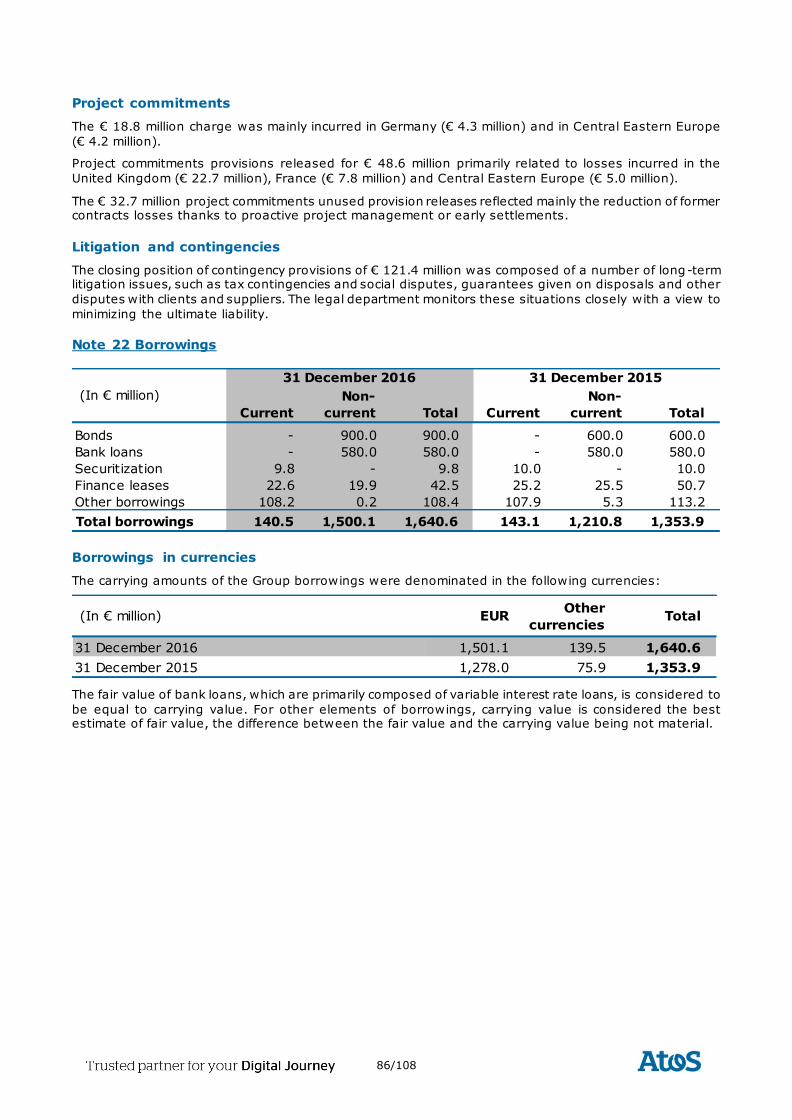
86/108
Project commitments
The € 18.8 million charge was mainly incurred in Germany (€ 4.3 million) and in Central Eastern Europe
(€ 4.2 million).
Project commitments provisions released for € 48.6 million primarily related to losses incurred in the
United Kingdom (€ 22.7 million), France (€ 7.8 million) and Central Eastern Europe (€ 5.0 million).
The € 32.7 million project commitments unused provision releases reflected mainly the reduction of former contracts losses thanks to proactive project management or early settlements.
Litigation and contingencies
The closing position of contingency provisions of € 121.4 million was composed of a number of long -term litigation issues, such as tax contingencies and social disputes, guarantees given on disposals and other
disputes with clients and suppliers. The legal department monitors these situations closely with a view to
minimizing the ultimate liability.
Note 22 Borrowings
Borrowings in currencies
The carrying amounts of the Group borrowings were denominated in the following currencies:
The fair value of bank loans, which are primarily composed of variable interest rate loans, is considered to
be equal to carrying value. For other elements of borrowings, carrying value is considered the best estimate of fair value, the difference between the fair value and the carrying value being not material.
Current
Non-
current Total Current
Non-
current Total
Bonds - 900.0 900.0 - 600.0 600.0
Bank loans - 580.0 580.0 - 580.0 580.0
Securitization 9.8 - 9.8 10.0 - 10.0
Finance leases 22.6 19.9 42.5 25.2 25.5 50.7
Other borrowings 108.2 0.2 108.4 107.9 5.3 113.2
Total borrowings 140.5 1,500.1 1,640.6 143.1 1,210.8 1,353.9
(In € million)
31 December 201531 December 2016
(In € million) EUROther
currenciesTotal
31 December 2016 1,501.1 139.5 1,640.6
31 December 2015 1,278.0 75.9 1,353.9
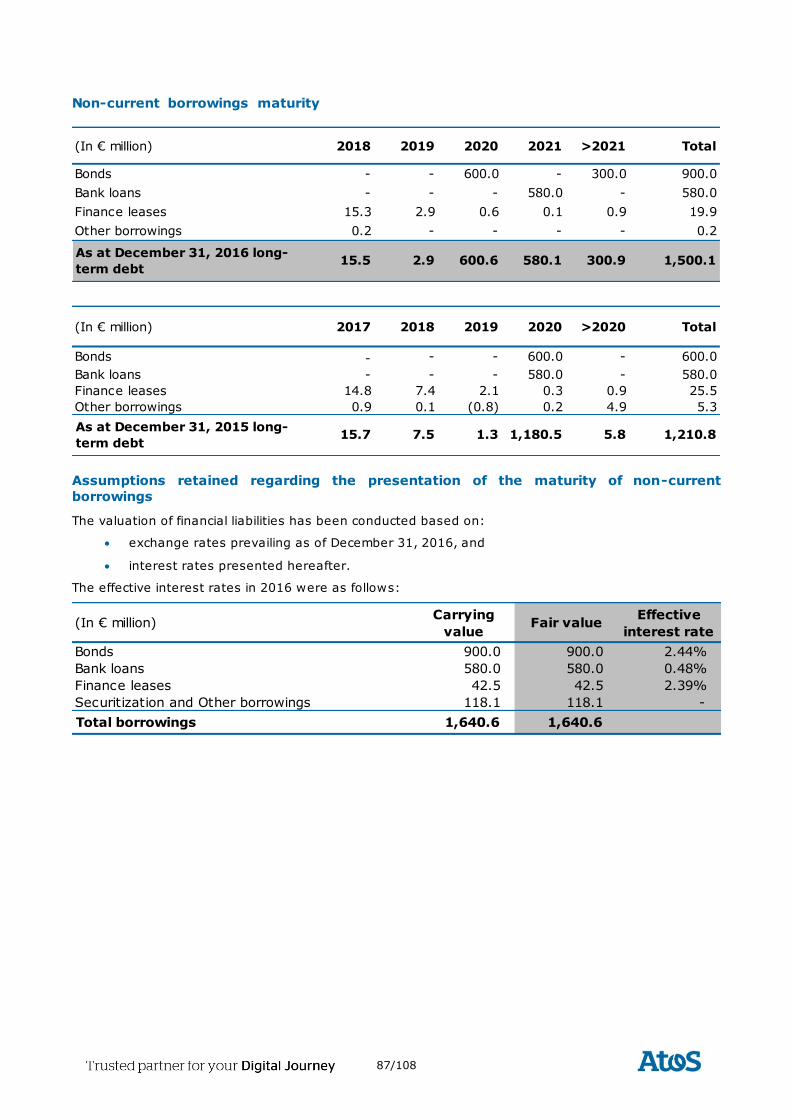
87/108
Non-current borrowings maturity
Assumptions retained regarding the presentation of the maturity of non-current
borrowings
The valuation of financial liabilities has been conducted based on:
exchange rates prevailing as of December 31, 2016, and
interest rates presented hereafter.
The effective interest rates in 2016 were as follows:
(In € million) 2018 2019 2020 2021 >2021 Total
Bonds - - 600.0 - 300.0 900.0
Bank loans - - - 580.0 - 580.0
Finance leases 15.3 2.9 0.6 0.1 0.9 19.9
Other borrowings 0.2 - - - - 0.2
(In € million) 2017 2018 2019 2020 >2020 Total
Bonds - - - 600.0 - 600.0
Bank loans - - - 580.0 - 580.0
Finance leases 14.8 7.4 2.1 0.3 0.9 25.5
Other borrowings 0.9 0.1 (0.8) 0.2 4.9 5.3
1,180.5 5.8 1,210.8As at December 31, 2015 long-
term debt15.7 7.5 1.3
As at December 31, 2016 long-
term debt 1,500.1 300.9 15.5 2.9 600.6 580.1
(In € million)Carrying
valueFair value
Effective
interest rate
Bonds 900.0 900.0 2.44%
Bank loans 580.0 580.0 0.48%
Finance leases 42.5 42.5 2.39%
Securitization and Other borrowings 118.1 118.1 -
Total borrowings 1,640.6 1,640.6
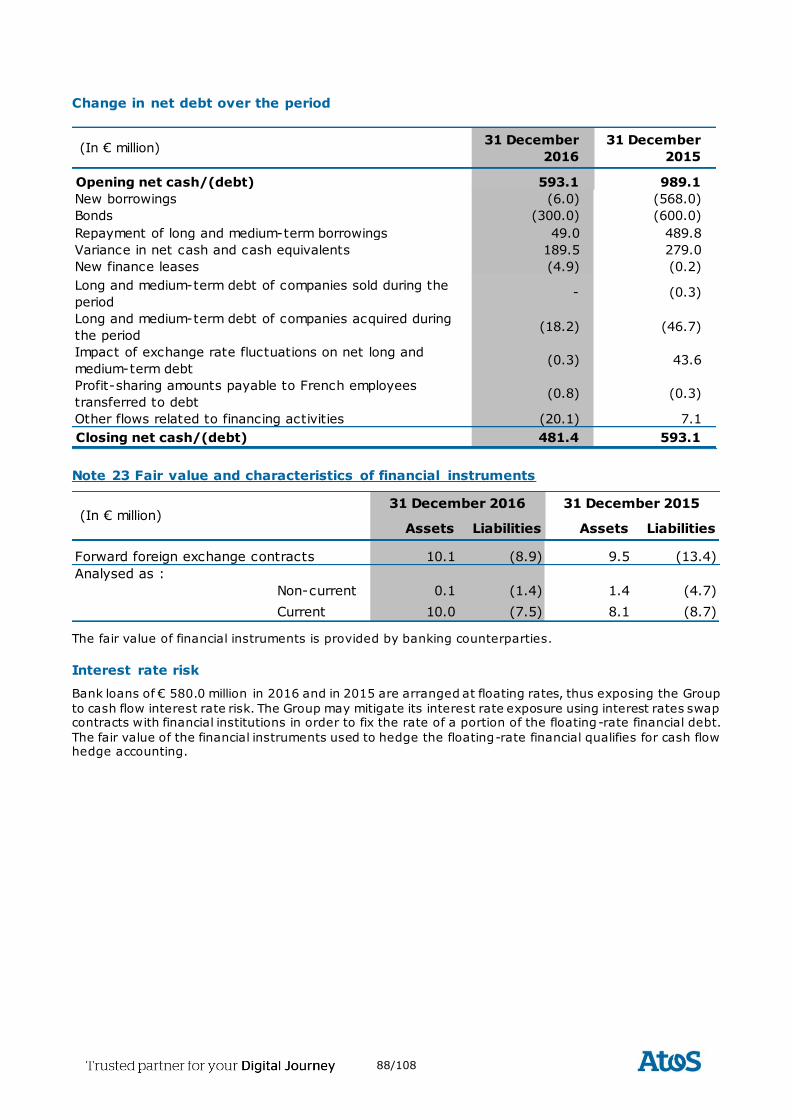
88/108
Change in net debt over the period
Note 23 Fair value and characteristics of financial instruments
The fair value of financial instruments is provided by banking counterparties.
Interest rate risk
Bank loans of € 580.0 million in 2016 and in 2015 are arranged at floating rates, thus exposing the Group
to cash flow interest rate risk. The Group may mitigate its interest rate exposure using interest rates swap contracts with financial institutions in order to fix the rate of a portion of the floating-rate financial debt.
The fair value of the financial instruments used to hedge the floating-rate financial qualifies for cash flow hedge accounting.
(In € million)31 December
2016
31 December
2015
Opening net cash/(debt) 593.1 989.1
New borrowings (6.0) (568.0)
Bonds (300.0) (600.0)
Repayment of long and medium-term borrowings 49.0 489.8
Variance in net cash and cash equivalents 189.5 279.0
New finance leases (4.9) (0.2)
Long and medium-term debt of companies sold during the
period- (0.3)
Long and medium-term debt of companies acquired during
the period (18.2) (46.7)
Impact of exchange rate fluctuations on net long and
medium-term debt (0.3) 43.6
Profit-sharing amounts payable to French employees
transferred to debt (0.8) (0.3)
Other flows related to financing activities (20.1) 7.1
Closing net cash/(debt) 481.4 593.1
Assets Liabilities Assets Liabilities
10.1 (8.9) 9.5 (13.4)
Non-current 0.1 (1.4) 1.4 (4.7)
Current 10.0 (7.5) 8.1 (8.7)
Analysed as :
(In € million)31 December 2016 31 December 2015
Forward foreign exchange contracts
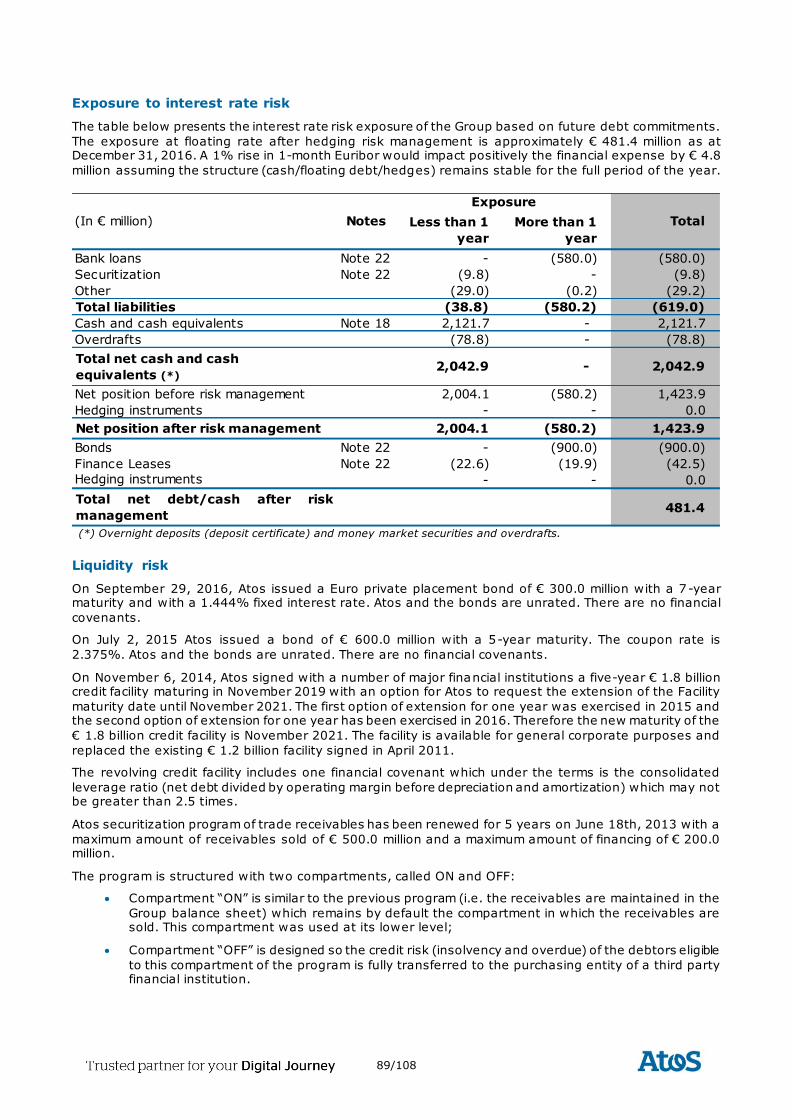
89/108
Exposure to interest rate risk
The table below presents the interest rate risk exposure of the Group based on future debt commitments.
The exposure at floating rate after hedging risk management is approximately € 481.4 million as at December 31, 2016. A 1% rise in 1-month Euribor would impact positively the financial expense by € 4.8
million assuming the structure (cash/floating debt/hedges) remains stable for the full period of the year.
Liquidity risk
On September 29, 2016, Atos issued a Euro private placement bond of € 300.0 million with a 7 -year maturity and with a 1.444% fixed interest rate. Atos and the bonds are unrated. There are no financial
covenants.
On July 2, 2015 Atos issued a bond of € 600.0 million with a 5-year maturity. The coupon rate is
2.375%. Atos and the bonds are unrated. There are no financial covenants.
On November 6, 2014, Atos signed with a number of major financial institutions a five-year € 1.8 billion credit facility maturing in November 2019 with an option for Atos to request the extension of the Facility
maturity date until November 2021. The first option of extension for one year was exercised in 2015 and the second option of extension for one year has been exercised in 2016. Therefore the new maturity of the
€ 1.8 billion credit facility is November 2021. The facility is available for general corporate purposes and
replaced the existing € 1.2 billion facility signed in April 2011.
The revolving credit facility includes one financial covenant which under the terms is the consolidated
leverage ratio (net debt divided by operating margin before depreciation and amortization) which may not be greater than 2.5 times.
Atos securitization program of trade receivables has been renewed for 5 years on June 18th, 2013 with a
maximum amount of receivables sold of € 500.0 million and a maximum amount of financing of € 200.0 million.
The program is structured with two compartments, called ON and OFF:
Compartment “ON” is similar to the previous program (i.e. the receivables are maintained in the
Group balance sheet) which remains by default the compartment in which the receivables are sold. This compartment was used at its lower level;
Compartment “OFF” is designed so the credit risk (insolvency and overdue) of the debtors eligible
to this compartment of the program is fully transferred to the purchasing entity of a third party financial institution.
Less than 1
year
More than 1
year
Bank loans Note 22 - (580.0) (580.0)
Securitization Note 22 (9.8) - (9.8)
Other (29.0) (0.2) (29.2)
Total liabilities (38.8) (580.2) (619.0)
Cash and cash equivalents Note 18 2,121.7 - 2,121.7
Overdrafts (78.8) - (78.8)
Total net cash and cash
equivalents (*)2,042.9 - 2,042.9
Net position before risk management 2,004.1 (580.2) 1,423.9
Hedging instruments - - 0.0
Net position after risk management 2,004.1 (580.2) 1,423.9
Bonds Note 22 - (900.0) (900.0)
Finance Leases Note 22 (22.6) (19.9) (42.5)
Hedging instruments - - 0.0
Total net debt/cash after risk
management481.4
(In € million) Notes
Exposure
Total
(*) Overnight deposits (deposit certificate) and money market securities and overdrafts.
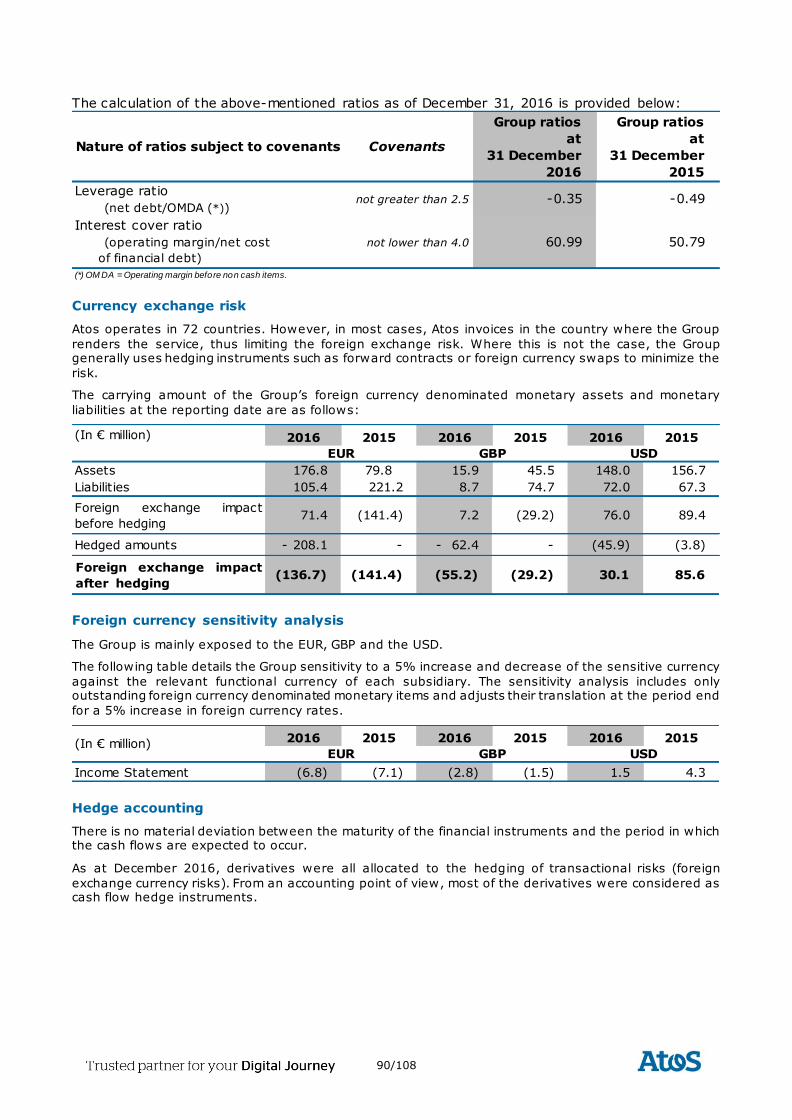
90/108
The calculation of the above-mentioned ratios as of December 31, 2016 is provided below:
Currency exchange risk
Atos operates in 72 countries. However, in most cases, Atos invoices in the country where the Group
renders the service, thus limiting the foreign exchange risk. Where this is not the case, the Group generally uses hedging instruments such as forward contracts or foreign currency swaps to minimize the
risk.
The carrying amount of the Group’s foreign currency denominated monetary assets and monetary
liabilities at the reporting date are as follows:
Foreign currency sensitivity analysis
The Group is mainly exposed to the EUR, GBP and the USD.
The following table details the Group sensitivity to a 5% increase and decrease of the sensitive currency
against the relevant functional currency of each subsidiary. The sensitivity analysis includes only outstanding foreign currency denominated monetary items and adjusts their translation at the period end
for a 5% increase in foreign currency rates.
Hedge accounting
There is no material deviation between the maturity of the financial instruments and the period in which the cash flows are expected to occur.
As at December 2016, derivatives were all allocated to the hedging of transactional risks (foreign
exchange currency risks). From an accounting point of view, most of the derivatives were considered as cash flow hedge instruments.
Nature of ratios subject to covenants Covenants
Group ratios
at
31 December
2016
Group ratios
at
31 December
2015
Leverage ratio
(net debt/OMDA (*))not greater than 2.5 -0.35 -0.49
Interest cover ratio
(operating margin/net cost
of financial debt)
not lower than 4.0 60.99 50.79
(*) OM DA = Operating margin before non cash items.
(In € million) 2016 2015 2016 2015 2016 2015
Assets 176.8 79.8 15.9 45.5 148.0 156.7
Liabilities 105.4 221.2 8.7 74.7 72.0 67.3
Foreign exchange impact
before hedging71.4 (141.4) 7.2 (29.2) 76.0 89.4
Hedged amounts - 208.1 - - 62.4 - (45.9) (3.8)
Foreign exchange impact
after hedging(136.7) (141.4) (55.2) (29.2) 30.1 85.6
EUR GBP USD
2016 2015 2016 2015 2016 2015
Income Statement (6.8) (7.1) (2.8) (1.5) 1.5 4.3
(In € million)EUR GBP USD
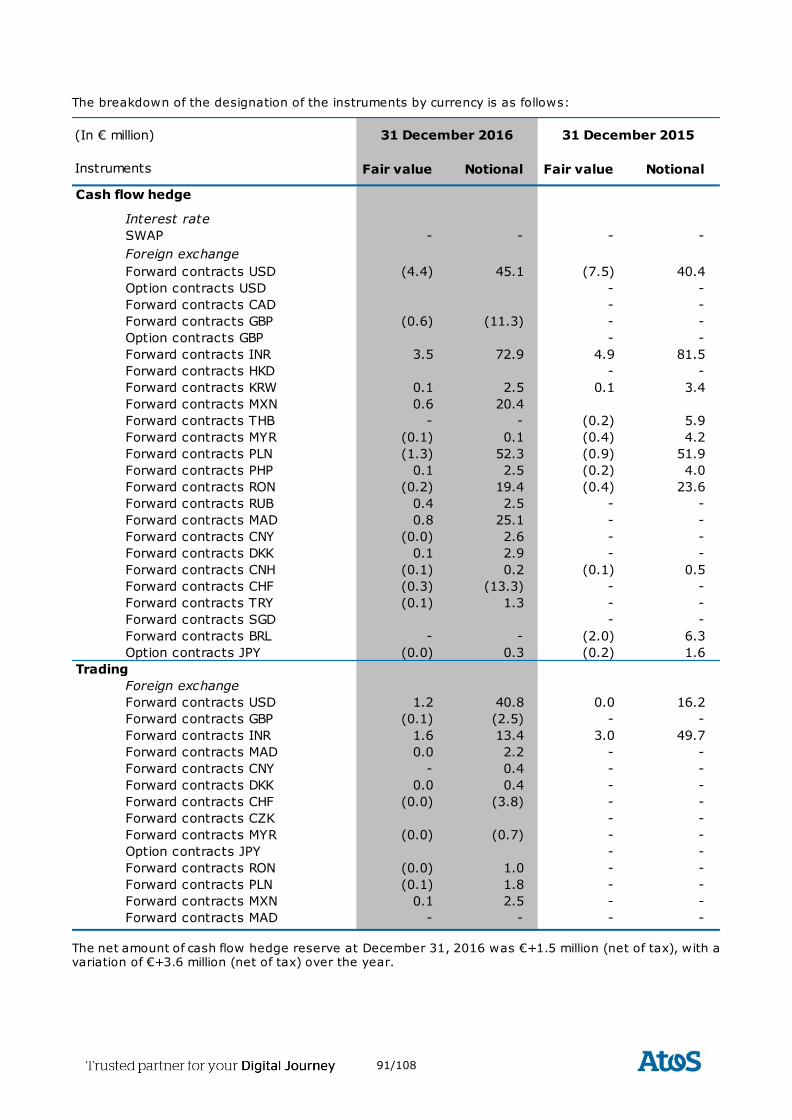
91/108
The breakdown of the designation of the instruments by currency is as follows:
The net amount of cash flow hedge reserve at December 31, 2016 was €+1.5 million (net of tax), with a variation of €+3.6 million (net of tax) over the year.
Fair value Notional Fair value Notional
Interest rate
SWAP - - - -
Foreign exchange
Forward contracts USD (4.4) 45.1 (7.5) 40.4
Option contracts USD - -
Forward contracts CAD - -
Forward contracts GBP (0.6) (11.3) - -
Option contracts GBP - -
Forward contracts INR 3.5 72.9 4.9 81.5
Forward contracts HKD - -
Forward contracts KRW 0.1 2.5 0.1 3.4
Forward contracts MXN 0.6 20.4
Forward contracts THB - - (0.2) 5.9
Forward contracts MYR (0.1) 0.1 (0.4) 4.2
Forward contracts PLN (1.3) 52.3 (0.9) 51.9
Forward contracts PHP 0.1 2.5 (0.2) 4.0
Forward contracts RON (0.2) 19.4 (0.4) 23.6
Forward contracts RUB 0.4 2.5 - -
Forward contracts MAD 0.8 25.1 - -
Forward contracts CNY (0.0) 2.6 - -
Forward contracts DKK 0.1 2.9 - -
Forward contracts CNH (0.1) 0.2 (0.1) 0.5
Forward contracts CHF (0.3) (13.3) - -
Forward contracts TRY (0.1) 1.3 - -
Forward contracts SGD - -
Forward contracts BRL - - (2.0) 6.3
Option contracts JPY (0.0) 0.3 (0.2) 1.6
Foreign exchange
Forward contracts USD 1.2 40.8 0.0 16.2
Forward contracts GBP (0.1) (2.5) - -
Forward contracts INR 1.6 13.4 3.0 49.7
Forward contracts MAD 0.0 2.2 - -
Forward contracts CNY - 0.4 - -
Forward contracts DKK 0.0 0.4 - -
Forward contracts CHF (0.0) (3.8) - -
Forward contracts CZK - -
Forward contracts MYR (0.0) (0.7) - -
Option contracts JPY - -
Forward contracts RON (0.0) 1.0 - -
Forward contracts PLN (0.1) 1.8 - -
Forward contracts MXN 0.1 2.5 - -
Forward contracts MAD - - - -- -
31 December 2015
Cash flow hedge
Trading
(In € million)
Instruments
31 December 2016
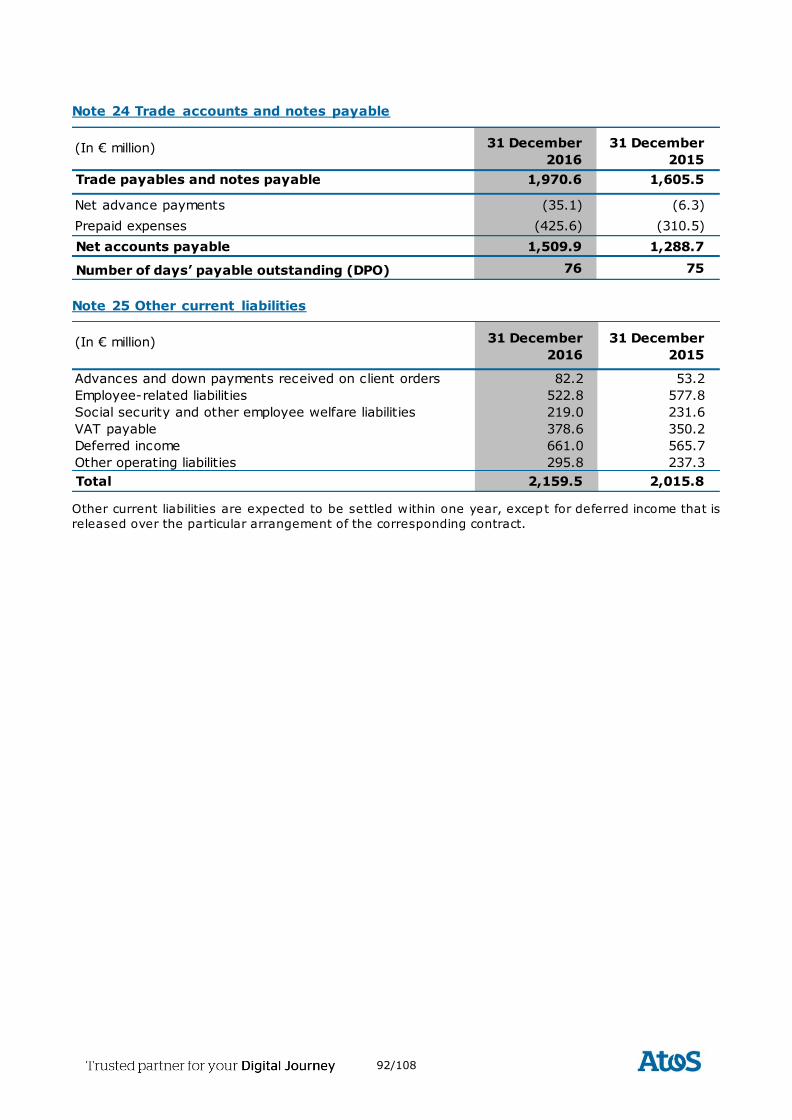
92/108
Note 24 Trade accounts and notes payable
Note 25 Other current liabilities
Other current liabilities are expected to be settled within one year, except for deferred income that is
released over the particular arrangement of the corresponding contract.
(In € million) 31 December
2016
31 December
2015
Trade payables and notes payable 1,970.6 1,605.5
Net advance payments (35.1) (6.3)
Prepaid expenses (425.6) (310.5)
Net accounts payable 1,509.9 1,288.7
Number of days’ payable outstanding (DPO) 76 75
(In € million) 31 December
2016
31 December
2015
Advances and down payments received on client orders 82.2 53.2
Employee-related liabilities 522.8 577.8
Social security and other employee welfare liabilities 219.0 231.6
VAT payable 378.6 350.2
Deferred income 661.0 565.7
Other operating liabilities 295.8 237.3
Total 2,159.5 2,015.8
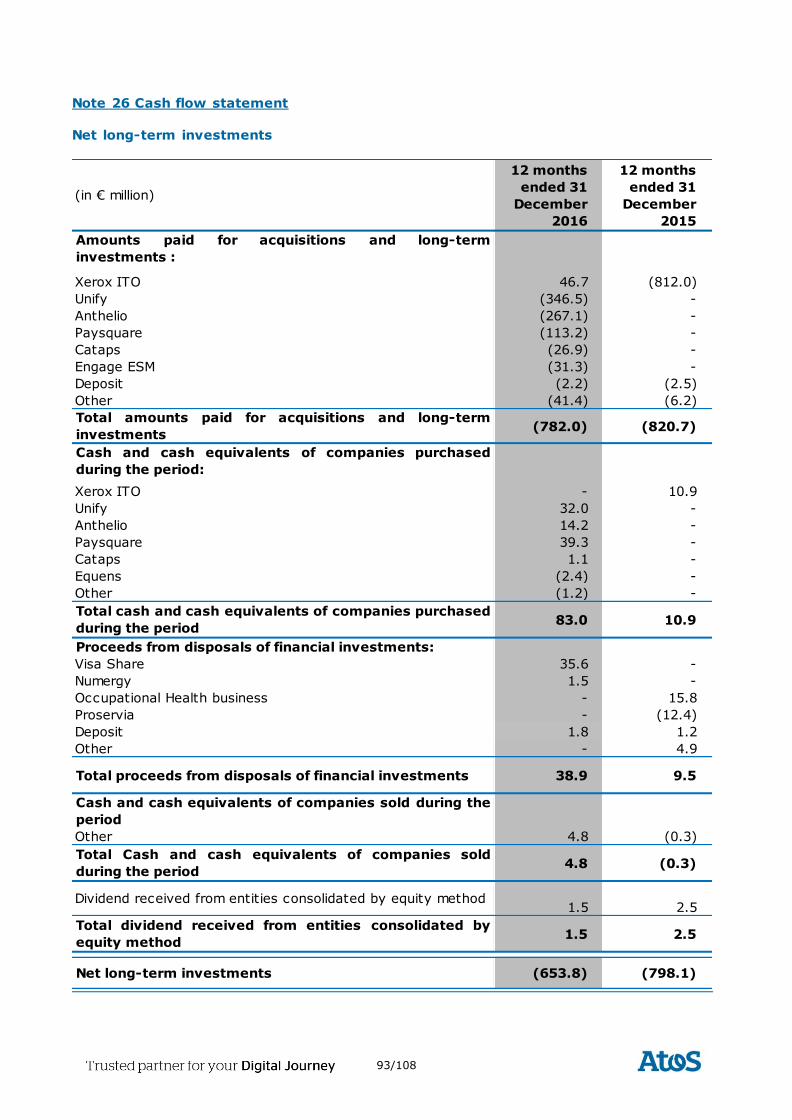
93/108
Note 26 Cash flow statement
Net long-term investments
(in € million)
12 months
ended 31
December
2016
12 months
ended 31
December
2015
Amounts paid for acquisitions and long-term
investments :
Xerox ITO 46.7 (812.0)
Unify (346.5) -
Anthelio (267.1) -
Paysquare (113.2) -
Cataps (26.9) -
Engage ESM (31.3) -
Deposit (2.2) (2.5)
Other (41.4) (6.2)
Total amounts paid for acquisitions and long-term
investments (782.0) (820.7)
Cash and cash equivalents of companies purchased
during the period:
Xerox ITO - 10.9
Unify 32.0 -
Anthelio 14.2 -
Paysquare 39.3 -
Cataps 1.1 -
Equens (2.4) -
Other (1.2) -
Total cash and cash equivalents of companies purchased
during the period83.0 10.9
Proceeds from disposals of financial investments:
Visa Share 35.6 -
Numergy 1.5 -
Occupational Health business - 15.8
Proservia - (12.4)
Deposit 1.8 1.2
Other - 4.9
Total proceeds from disposals of financial investments 38.9 9.5
Cash and cash equivalents of companies sold during the
period
Other 4.8 (0.3)
Total Cash and cash equivalents of companies sold
during the period4.8 (0.3)
Dividend received from entities consolidated by equity method1.5 2.5
Total dividend received from entities consolidated by
equity method1.5 2.5
Net long-term investments (653.8) (798.1)
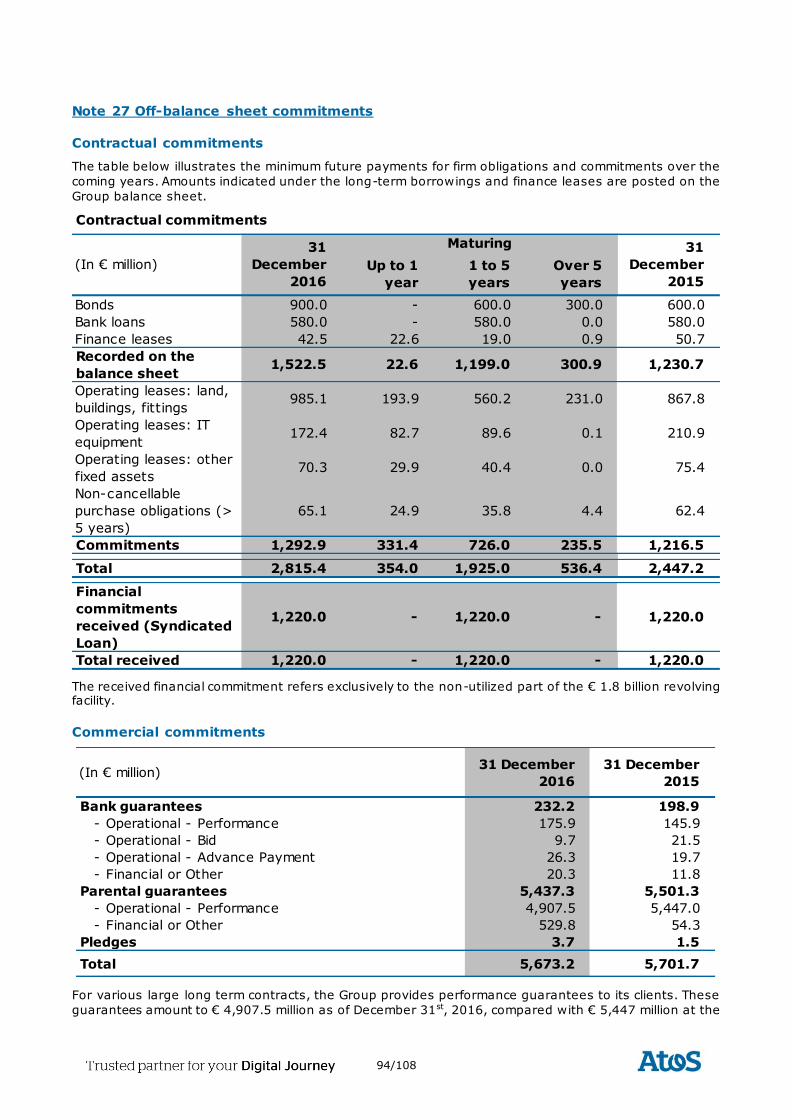
94/108
Note 27 Off-balance sheet commitments
Contractual commitments
The table below illustrates the minimum future payments for firm obligations and commitments over the
coming years. Amounts indicated under the long-term borrowings and finance leases are posted on the
Group balance sheet.
The received financial commitment refers exclusively to the non-utilized part of the € 1.8 billion revolving facility.
Commercial commitments
For various large long term contracts, the Group provides performance guarantees to its clients. These
guarantees amount to € 4,907.5 million as of December 31st, 2016, compared with € 5,447 million at the
Contractual commitments
Up to 1
year
1 to 5
years
Over 5
years
Bonds 900.0 - 600.0 300.0 600.0
Bank loans 580.0 - 580.0 0.0 580.0
Finance leases 42.5 22.6 19.0 0.9 50.7
Recorded on the
balance sheet1,522.5 22.6 1,199.0 300.9 1,230.7
Operating leases: land,
buildings, fittings985.1 193.9 560.2 231.0 867.8
Operating leases: IT
equipment172.4 82.7 89.6 0.1 210.9
Operating leases: other
fixed assets70.3 29.9 40.4 0.0 75.4
Non-cancellable
purchase obligations (>
5 years)
65.1 24.9 35.8 4.4 62.4
Commitments 1,292.9 331.4 726.0 235.5 1,216.5
Total 2,815.4 354.0 1,925.0 536.4 2,447.2
Financial
commitments
received (Syndicated
Loan)
1,220.0 - 1,220.0 - 1,220.0
Total received 1,220.0 - 1,220.0 - 1,220.0
(In € million)
Maturing31
December
2016
31
December
2015
(In € million)31 December
2016
31 December
2015
Bank guarantees 232.2 198.9
- Operational - Performance 175.9 145.9
- Operational - Bid 9.7 21.5
- Operational - Advance Payment 26.3 19.7
- Financial or Other 20.3 11.8
Parental guarantees 5,437.3 5,501.3
- Operational - Performance 4,907.5 5,447.0
- Financial or Other 529.8 54.3
Pledges 3.7 1.5
Total 5,673.2 5,701.7
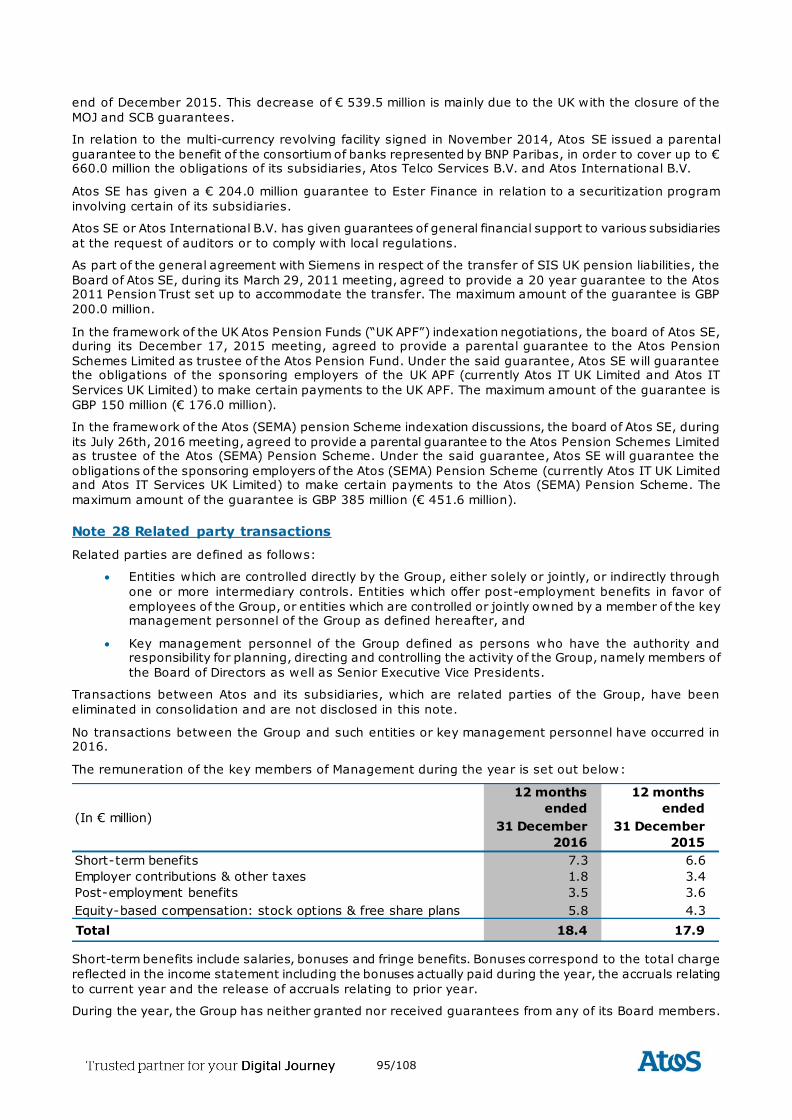
95/108
end of December 2015. This decrease of € 539.5 million is mainly due to the UK with the closure of the
MOJ and SCB guarantees.
In relation to the multi-currency revolving facility signed in November 2014, Atos SE issued a parental
guarantee to the benefit of the consortium of banks represented by BNP Paribas, in order to cover up to € 660.0 million the obligations of its subsidiaries, Atos Telco Services B.V. and Atos International B.V.
Atos SE has given a € 204.0 million guarantee to Ester Finance in relation to a securitization program
involving certain of its subsidiaries.
Atos SE or Atos International B.V. has given guarantees of general financial support to various subsidiaries
at the request of auditors or to comply with local regulations.
As part of the general agreement with Siemens in respect of the transfer of SIS UK pension liabilities, the
Board of Atos SE, during its March 29, 2011 meeting, agreed to provide a 20 year guarantee to the Atos 2011 Pension Trust set up to accommodate the transfer. The maximum amount of the guarantee is GBP
200.0 million.
In the framework of the UK Atos Pension Funds (“UK APF”) indexation negotiations, the board of Atos SE, during its December 17, 2015 meeting, agreed to provide a parental guarantee to the Atos Pension
Schemes Limited as trustee of the Atos Pension Fund. Under the said guarantee, Atos SE will guarantee the obligations of the sponsoring employers of the UK APF (currently Atos IT UK Limited and Atos IT
Services UK Limited) to make certain payments to the UK APF. The maximum amount of the guarantee is
GBP 150 million (€ 176.0 million).
In the framework of the Atos (SEMA) pension Scheme indexation discussions, the board of Atos SE, during
its July 26th, 2016 meeting, agreed to provide a parental guarantee to the Atos Pension Schemes Limited as trustee of the Atos (SEMA) Pension Scheme. Under the said guarantee, Atos SE will guarantee the
obligations of the sponsoring employers of the Atos (SEMA) Pension Scheme (currently Atos IT UK Limited and Atos IT Services UK Limited) to make certain payments to the Atos (SEMA) Pension Scheme. The
maximum amount of the guarantee is GBP 385 million (€ 451.6 million).
Note 28 Related party transactions
Related parties are defined as follows:
Entities which are controlled directly by the Group, either solely or jointly, or indirectly through
one or more intermediary controls. Entities which offer post-employment benefits in favor of
employees of the Group, or entities which are controlled or jointly owned by a member of the key management personnel of the Group as defined hereafter, and
Key management personnel of the Group defined as persons who have the authority and responsibility for planning, directing and controlling the activity of the Group, namely members of
the Board of Directors as well as Senior Executive Vice Presidents.
Transactions between Atos and its subsidiaries, which are related parties of the Group, have been
eliminated in consolidation and are not disclosed in this note.
No transactions between the Group and such entities or key management personnel have occurred in 2016.
The remuneration of the key members of Management during the year is set out below:
Short-term benefits include salaries, bonuses and fringe benefits. Bonuses correspond to the total charge
reflected in the income statement including the bonuses actually paid during the year, the accruals relating
to current year and the release of accruals relating to prior year.
During the year, the Group has neither granted nor received guarantees from any of its Board members.
12 months
ended
12 months
ended
31 December
2016
31 December
2015
Short-term benefits 7.3 6.6
Employer contributions & other taxes 1.8 3.4
Post-employment benefits 3.5 3.6
Equity-based compensation: stock options & free share plans 5.8 4.3
Total 18.4 17.9
(In € million)
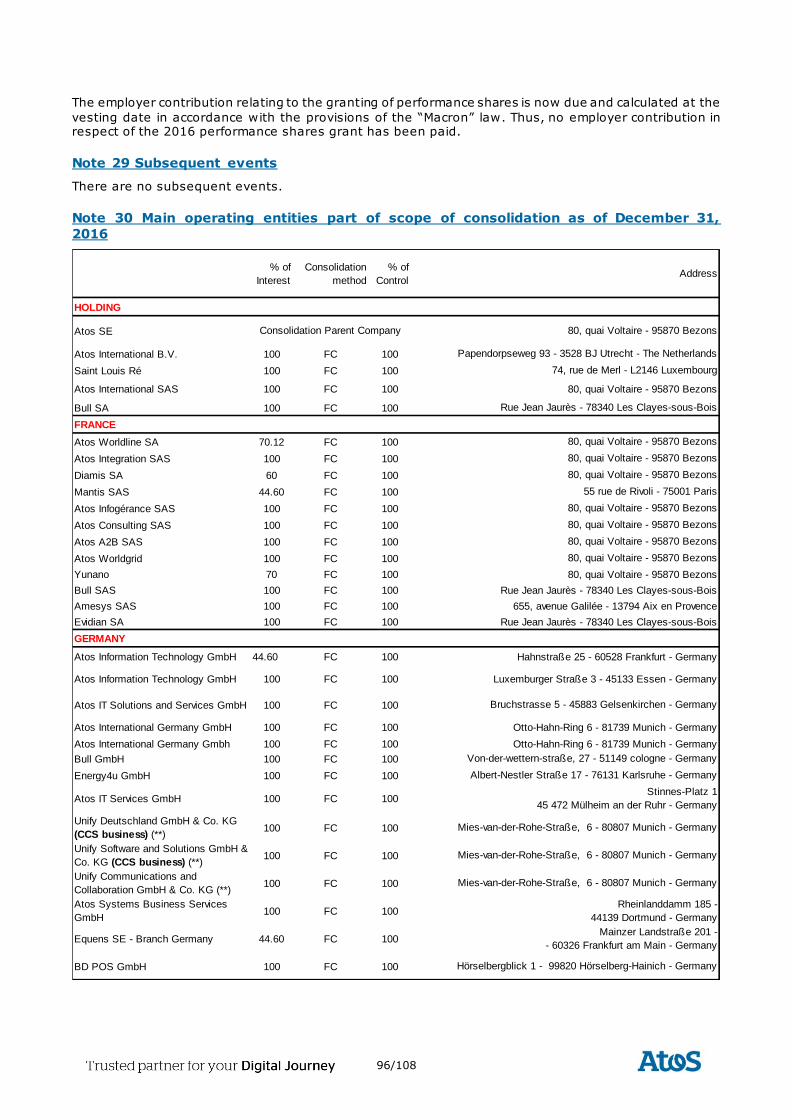
96/108
The employer contribution relating to the granting of performance shares is now due and calculated at the
vesting date in accordance with the provisions of the “Macron” law. Thus, no employer contribution in respect of the 2016 performance shares grant has been paid.
Note 29 Subsequent events
There are no subsequent events.
Note 30 Main operating entities part of scope of consolidation as of December 31,
2016
HOLDING
Atos SE
Atos International B.V. 100 FC 100
Saint Louis Ré 100 FC 100
Atos International SAS 100 FC 100
Bull SA 100 FC 100
FRANCE
Atos Worldline SA 70.12 FC 100
Atos Integration SAS 100 FC 100
Diamis SA 60 FC 100
Mantis SAS 44.60 FC 100
Atos Infogérance SAS 100 FC 100
Atos Consulting SAS 100 FC 100
Atos A2B SAS 100 FC 100
Atos Worldgrid 100 FC 100
Yunano 70 FC 100
Bull SAS 100 FC 100
Amesys SAS 100 FC 100
Evidian SA 100 FC 100
GERMANY
Atos Information Technology GmbH 44.60 FC 100
Atos Information Technology GmbH 100 FC 100
Atos IT Solutions and Services GmbH 100 FC 100
Atos International Germany GmbH 100 FC 100
Atos International Germany Gmbh 100 FC 100
Bull GmbH 100 FC 100
Energy4u GmbH 100 FC 100
Atos IT Services GmbH 100 FC 100
Unify Deutschland GmbH & Co. KG
(CCS business) (**)100 FC 100
Unify Software and Solutions GmbH &
Co. KG (CCS business) (**)100 FC 100
Unify Communications and
Collaboration GmbH & Co. KG (**)100 FC 100
Atos Systems Business Services
GmbH 100 FC 100
Equens SE - Branch Germany 44.60 FC 100
BD POS GmbH 100 FC 100
% of
Interest
Consolidation
method
% of
Control Address
Consolidation Parent Company 80, quai Voltaire - 95870 Bezons
80, quai Voltaire - 95870 Bezons
55 rue de Rivoli - 75001 Paris
80, quai Voltaire - 95870 Bezons
80, quai Voltaire - 95870 Bezons
80, quai Voltaire - 95870 Bezons
80, quai Voltaire - 95870 Bezons
Papendorpseweg 93 - 3528 BJ Utrecht - The Netherlands
74, rue de Merl - L2146 Luxembourg
80, quai Voltaire - 95870 Bezons
Rue Jean Jaurès - 78340 Les Clayes-sous-Bois
80, quai Voltaire - 95870 Bezons
80, quai Voltaire - 95870 Bezons
80, quai Voltaire - 95870 Bezons
Rue Jean Jaurès - 78340 Les Clayes-sous-Bois
655, avenue Galilée - 13794 Aix en Provence
Rue Jean Jaurès - 78340 Les Clayes-sous-Bois
Hahnstraße 25 - 60528 Frankfurt - Germany
Luxemburger Straße 3 - 45133 Essen - Germany
Bruchstrasse 5 - 45883 Gelsenkirchen - Germany
Otto-Hahn-Ring 6 - 81739 Munich - Germany
Otto-Hahn-Ring 6 - 81739 Munich - Germany
Von-der-wettern-straße, 27 - 51149 cologne - Germany
Mies-van-der-Rohe-Straße, 6 - 80807 Munich - Germany
Rheinlanddamm 185 -
44139 Dortmund - Germany
Mainzer Landstraße 201 -
- 60326 Frankfurt am Main - Germany
Albert-Nestler Straße 17 - 76131 Karlsruhe - Germany
Stinnes-Platz 1
45 472 Mülheim an der Ruhr - Germany
Hörselbergblick 1 - 99820 Hörselberg-Hainich - Germany
Mies-van-der-Rohe-Straße, 6 - 80807 Munich - Germany
Mies-van-der-Rohe-Straße, 6 - 80807 Munich - Germany
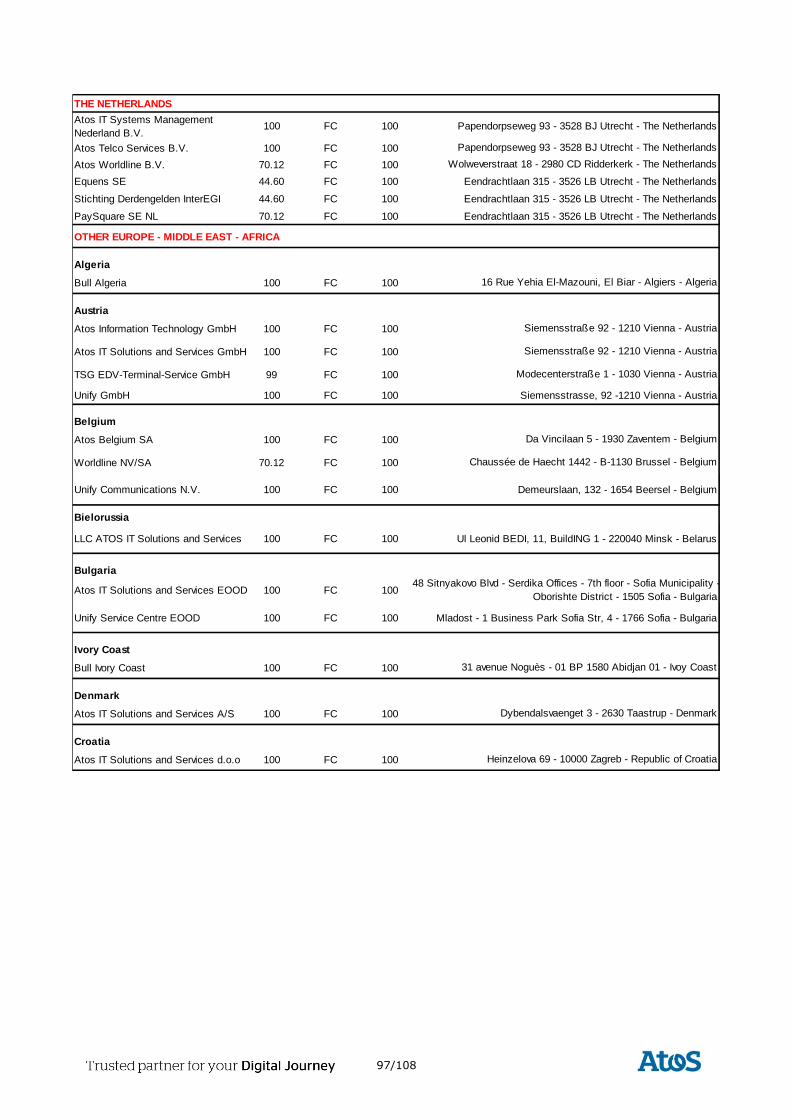
97/108
THE NETHERLANDS
Atos IT Systems Management
Nederland B.V.100 FC 100
Atos Telco Services B.V. 100 FC 100
Atos Worldline B.V. 70.12 FC 100
Equens SE 44.60 FC 100
Stichting Derdengelden InterEGI 44.60 FC 100
PaySquare SE NL 70.12 FC 100
OTHER EUROPE - MIDDLE EAST - AFRICA
Algeria
Bull Algeria 100 FC 100
Austria
Atos Information Technology GmbH 100 FC 100
Atos IT Solutions and Services GmbH 100 FC 100
TSG EDV-Terminal-Service GmbH 99 FC 100
Unify GmbH 100 FC 100
Belgium
Atos Belgium SA 100 FC 100
Worldline NV/SA 70.12 FC 100
Unify Communications N.V. 100 FC 100
Bielorussia
LLC ATOS IT Solutions and Services 100 FC 100
Bulgaria
Atos IT Solutions and Services EOOD 100 FC 100
Unify Service Centre EOOD 100 FC 100
Ivory Coast
Bull Ivory Coast 100 FC 100
Denmark
Atos IT Solutions and Services A/S 100 FC 100
Croatia
Atos IT Solutions and Services d.o.o 100 FC 100
Chaussée de Haecht 1442 - B-1130 Brussel - Belgium
Demeurslaan, 132 - 1654 Beersel - Belgium
Ul Leonid BEDI, 11, BuildING 1 - 220040 Minsk - Belarus
Mladost - 1 Business Park Sofia Str, 4 - 1766 Sofia - Bulgaria
48 Sitnyakovo Blvd - Serdika Offices - 7th floor - Sofia Municipality -
Oborishte District - 1505 Sofia - Bulgaria
31 avenue Noguès - 01 BP 1580 Abidjan 01 - Ivoy Coast
Siemensstraße 92 - 1210 Vienna - Austria
Dybendalsvaenget 3 - 2630 Taastrup - Denmark
Heinzelova 69 - 10000 Zagreb - Republic of Croatia
Siemensstraße 92 - 1210 Vienna - Austria
Modecenterstraße 1 - 1030 Vienna - Austria
Siemensstrasse, 92 -1210 Vienna - Austria
Da Vincilaan 5 - 1930 Zaventem - Belgium
Eendrachtlaan 315 - 3526 LB Utrecht - The Netherlands
Eendrachtlaan 315 - 3526 LB Utrecht - The Netherlands
Eendrachtlaan 315 - 3526 LB Utrecht - The Netherlands
Wolweverstraat 18 - 2980 CD Ridderkerk - The Netherlands
16 Rue Yehia El-Mazouni, El Biar - Algiers - Algeria
Papendorpseweg 93 - 3528 BJ Utrecht - The Netherlands
Papendorpseweg 93 - 3528 BJ Utrecht - The Netherlands
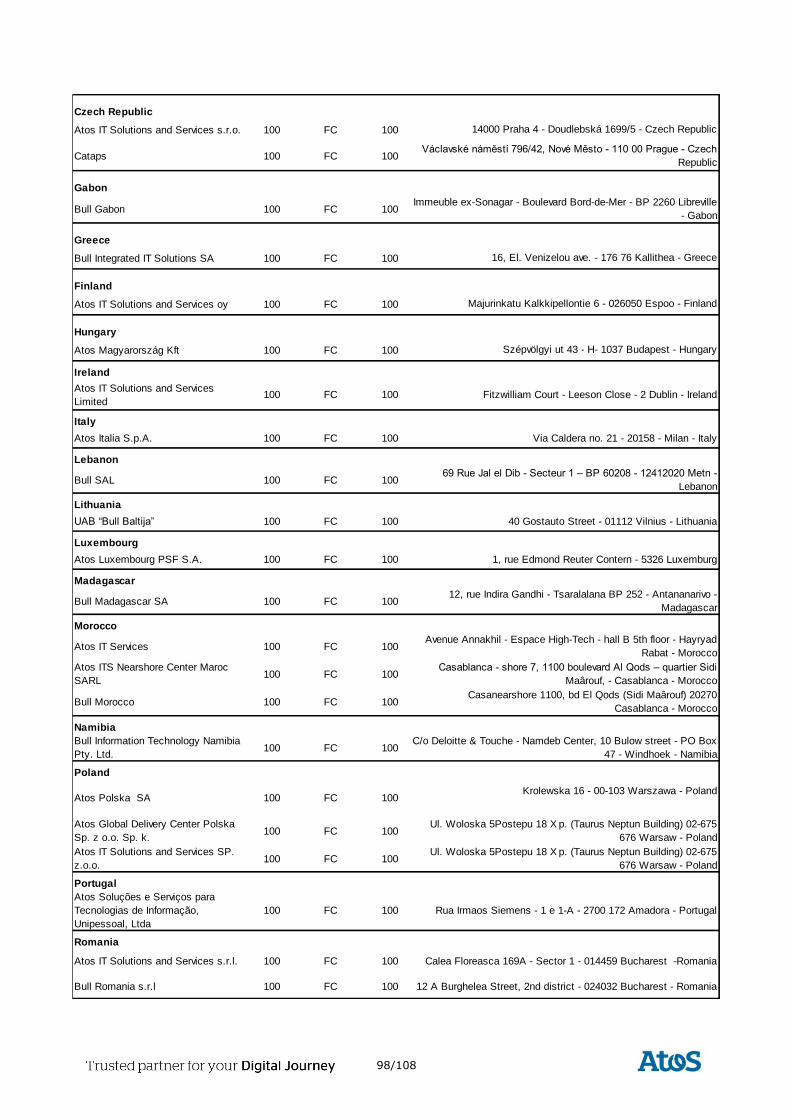
98/108
Czech Republic
Atos IT Solutions and Services s.r.o. 100 FC 100
Cataps 100 FC 100
Gabon
Bull Gabon 100 FC 100
Greece
Bull Integrated IT Solutions SA 100 FC 100
Finland
Atos IT Solutions and Services oy 100 FC 100
Hungary
Atos Magyarország Kft 100 FC 100
Ireland
Atos IT Solutions and Services
Limited100 FC 100
Italy
Atos Italia S.p.A. 100 FC 100
Lebanon
Bull SAL 100 FC 100
Lithuania
UAB “Bull Baltija” 100 FC 100
Luxembourg
Atos Luxembourg PSF S.A. 100 FC 100
Madagascar
Bull Madagascar SA 100 FC 100
Morocco
Atos IT Services 100 FC 100
Atos ITS Nearshore Center Maroc
SARL100 FC 100
Bull Morocco 100 FC 100
Namibia
Bull Information Technology Namibia
Pty. Ltd.100 FC 100
Poland
Atos Polska SA 100 FC 100
Atos Global Delivery Center Polska
Sp. z o.o. Sp. k.100 FC 100
Atos IT Solutions and Services SP.
z.o.o.100 FC 100
Portugal
Atos Soluções e Serviços para
Tecnologias de Informação,
Unipessoal, Ltda
100 FC 100
Romania
Atos IT Solutions and Services s.r.l. 100 FC 100
Bull Romania s.r.l 100 FC 100
Calea Floreasca 169A - Sector 1 - 014459 Bucharest -Romania
12 A Burghelea Street, 2nd district - 024032 Bucharest - Romania
Casanearshore 1100, bd El Qods (Sidi Maârouf) 20270
Casablanca - Morocco
C/o Deloitte & Touche - Namdeb Center, 10 Bulow street - PO Box
47 - Windhoek - Namibia
Krolewska 16 - 00-103 Warszawa - Poland
Ul. Woloska 5Postepu 18 X p. (Taurus Neptun Building) 02-675
676 Warsaw - Poland
Ul. Woloska 5Postepu 18 X p. (Taurus Neptun Building) 02-675
676 Warsaw - Poland
Rua Irmaos Siemens - 1 e 1-A - 2700 172 Amadora - Portugal
1, rue Edmond Reuter Contern - 5326 Luxemburg
12, rue Indira Gandhi - Tsaralalana BP 252 - Antananarivo -
Madagascar
Avenue Annakhil - Espace High-Tech - hall B 5th floor - Hayryad
Rabat - Morocco
Casablanca - shore 7, 1100 boulevard Al Qods – quartier Sidi
Maârouf, - Casablanca - Morocco
Via Caldera no. 21 - 20158 - Milan - Italy
69 Rue Jal el Dib - Secteur 1 – BP 60208 - 12412020 Metn -
Lebanon
40 Gostauto Street - 01112 Vilnius - Lithuania
14000 Praha 4 - Doudlebská 1699/5 - Czech Republic
Immeuble ex-Sonagar - Boulevard Bord-de-Mer - BP 2260 Libreville
- Gabon
16, El. Venizelou ave. - 176 76 Kallithea - Greece
Majurinkatu Kalkkipellontie 6 - 026050 Espoo - Finland
Szépvölgyi ut 43 - H- 1037 Budapest - Hungary
Václavské náměstí 796/42, Nové Město - 110 00 Prague - Czech
Republic
Fitzwilliam Court - Leeson Close - 2 Dublin - Ireland
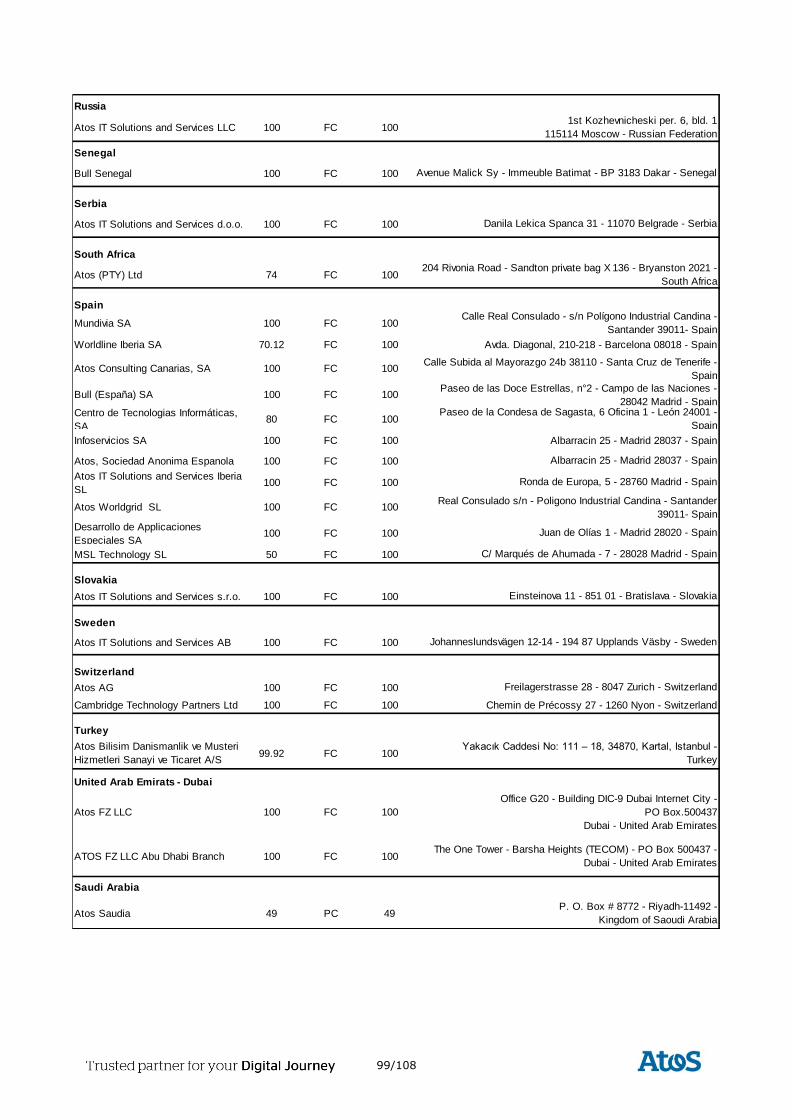
99/108
Russia
Atos IT Solutions and Services LLC 100 FC 100
Senegal
Bull Senegal 100 FC 100
Serbia
Atos IT Solutions and Services d.o.o. 100 FC 100
South Africa
Atos (PTY) Ltd 74 FC 100
Spain
Mundivia SA 100 FC 100
Worldline Iberia SA 70.12 FC 100
Atos Consulting Canarias, SA 100 FC 100
Bull (España) SA 100 FC 100
Centro de Tecnologias Informáticas,
SA80 FC 100
Infoservicios SA 100 FC 100
Atos, Sociedad Anonima Espanola 100 FC 100
Atos IT Solutions and Services Iberia
SL100 FC 100
Atos Worldgrid SL 100 FC 100
Desarrollo de Applicaciones
Especiales SA100 FC 100
MSL Technology SL 50 FC 100
Slovakia
Atos IT Solutions and Services s.r.o. 100 FC 100
Sweden
Atos IT Solutions and Services AB 100 FC 100
Switzerland
Atos AG 100 FC 100
Cambridge Technology Partners Ltd 100 FC 100
Turkey
Atos Bilisim Danismanlik ve Musteri
Hizmetleri Sanayi ve Ticaret A/S99.92 FC 100
United Arab Emirats - Dubai
Atos FZ LLC 100 FC 100
ATOS FZ LLC Abu Dhabi Branch 100 FC 100
Saudi Arabia
Atos Saudia 49 PC 49
The One Tower - Barsha Heights (TECOM) - PO Box 500437 -
Dubai - United Arab Emirates
P. O. Box # 8772 - Riyadh-11492 -
Kingdom of Saoudi Arabia
Einsteinova 11 - 851 01 - Bratislava - Slovakia
Johanneslundsvägen 12-14 - 194 87 Upplands Väsby - Sweden
Freilagerstrasse 28 - 8047 Zurich - Switzerland
Chemin de Précossy 27 - 1260 Nyon - Switzerland
Yakacık Caddesi No: 111 – 18, 34870, Kartal, Istanbul -
Turkey
Office G20 - Building DIC-9 Dubai Internet City -
PO Box.500437
Dubai - United Arab Emirates
Albarracin 25 - Madrid 28037 - Spain
Albarracin 25 - Madrid 28037 - Spain
Ronda de Europa, 5 - 28760 Madrid - Spain
Real Consulado s/n - Poligono Industrial Candina - Santander
39011- Spain
Juan de Olías 1 - Madrid 28020 - Spain
C/ Marqués de Ahumada - 7 - 28028 Madrid - Spain
204 Rivonia Road - Sandton private bag X 136 - Bryanston 2021 -
South Africa
Calle Real Consulado - s/n Polígono Industrial Candina -
Santander 39011- Spain
Avda. Diagonal, 210-218 - Barcelona 08018 - Spain
Calle Subida al Mayorazgo 24b 38110 - Santa Cruz de Tenerife -
Spain
Paseo de las Doce Estrellas, n°2 - Campo de las Naciones -
28042 Madrid - SpainPaseo de la Condesa de Sagasta, 6 Oficina 1 - León 24001 -
Spain
1st Kozhevnicheski per. 6, bld. 1
115114 Moscow - Russian Federation
Avenue Malick Sy - Immeuble Batimat - BP 3183 Dakar - Senegal
Danila Lekica Spanca 31 - 11070 Belgrade - Serbia
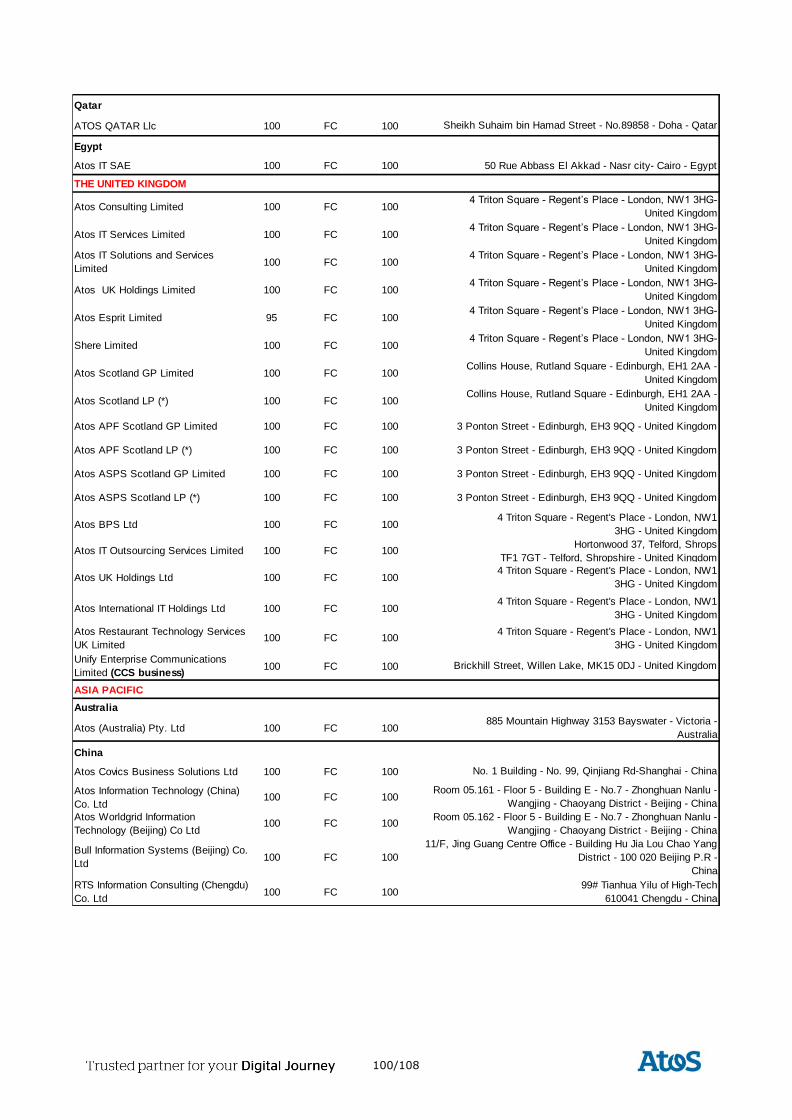
100/108
Qatar
ATOS QATAR Llc 100 FC 100
Egypt
Atos IT SAE 100 FC 100
THE UNITED KINGDOM
Atos Consulting Limited 100 FC 100
Atos IT Services Limited 100 FC 100
Atos IT Solutions and Services
Limited100 FC 100
Atos UK Holdings Limited 100 FC 100
Atos Esprit Limited 95 FC 100
Shere Limited 100 FC 100
Atos Scotland GP Limited 100 FC 100
Atos Scotland LP (*) 100 FC 100
Atos APF Scotland GP Limited 100 FC 100
Atos APF Scotland LP (*) 100 FC 100
Atos ASPS Scotland GP Limited 100 FC 100
Atos ASPS Scotland LP (*) 100 FC 100
Atos BPS Ltd 100 FC 100
Atos IT Outsourcing Services Limited 100 FC 100
Atos UK Holdings Ltd 100 FC 100
Atos International IT Holdings Ltd 100 FC 100
Atos Restaurant Technology Services
UK Limited100 FC 100
Unify Enterprise Communications
Limited (CCS business)100 FC 100
ASIA PACIFIC
Australia
Atos (Australia) Pty. Ltd 100 FC 100
China
Atos Covics Business Solutions Ltd 100 FC 100
Atos Information Technology (China)
Co. Ltd100 FC 100
Atos Worldgrid Information
Technology (Beijing) Co Ltd100 FC 100
Bull Information Systems (Beijing) Co.
Ltd100 FC 100
RTS Information Consulting (Chengdu)
Co. Ltd100 FC 100
No. 1 Building - No. 99, Qinjiang Rd-Shanghai - China
Room 05.161 - Floor 5 - Building E - No.7 - Zhonghuan Nanlu -
Wangjing - Chaoyang District - Beijing - China
Room 05.162 - Floor 5 - Building E - No.7 - Zhonghuan Nanlu -
Wangjing - Chaoyang District - Beijing - China
11/F, Jing Guang Centre Office - Building Hu Jia Lou Chao Yang
District - 100 020 Beijing P.R -
China
99# Tianhua Yilu of High-Tech
610041 Chengdu - China
3 Ponton Street - Edinburgh, EH3 9QQ - United Kingdom
3 Ponton Street - Edinburgh, EH3 9QQ - United Kingdom
Hortonwood 37, Telford, Shrops
TF1 7GT - Telford, Shropshire - United Kingdom
4 Triton Square - Regent's Place - London, NW1
3HG - United Kingdom
4 Triton Square - Regent's Place - London, NW1
3HG - United Kingdom
885 Mountain Highway 3153 Bayswater - Victoria -
Australia
4 Triton Square - Regent’s Place - London, NW1 3HG-
United Kingdom
Collins House, Rutland Square - Edinburgh, EH1 2AA -
United Kingdom
Collins House, Rutland Square - Edinburgh, EH1 2AA -
United Kingdom
3 Ponton Street - Edinburgh, EH3 9QQ - United Kingdom
3 Ponton Street - Edinburgh, EH3 9QQ - United Kingdom
Brickhill Street, Willen Lake, MK15 0DJ - United Kingdom
4 Triton Square - Regent's Place - London, NW1
3HG - United Kingdom
4 Triton Square - Regent's Place - London, NW1
3HG - United Kingdom
4 Triton Square - Regent’s Place - London, NW1 3HG-
United Kingdom
4 Triton Square - Regent’s Place - London, NW1 3HG-
United Kingdom
4 Triton Square - Regent’s Place - London, NW1 3HG-
United Kingdom
4 Triton Square - Regent’s Place - London, NW1 3HG-
United Kingdom
4 Triton Square - Regent’s Place - London, NW1 3HG-
United Kingdom
Sheikh Suhaim bin Hamad Street - No.89858 - Doha - Qatar
50 Rue Abbass El Akkad - Nasr city- Cairo - Egypt
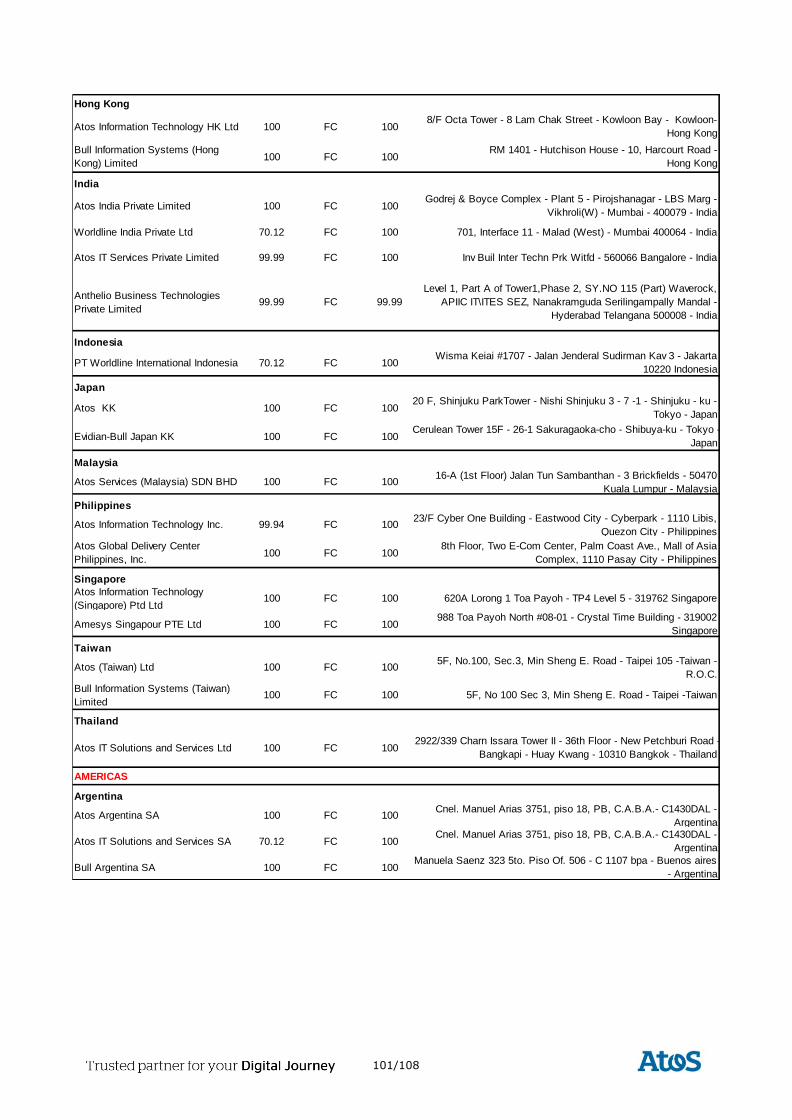
101/108
Hong Kong
Atos Information Technology HK Ltd 100 FC 100
Bull Information Systems (Hong
Kong) Limited100 FC 100
India
Atos India Private Limited 100 FC 100
Worldline India Private Ltd 70.12 FC 100
Atos IT Services Private Limited 99.99 FC 100
Anthelio Business Technologies
Private Limited99.99 FC 99.99
Indonesia
PT Worldline International Indonesia 70.12 FC 100
Japan
Atos KK 100 FC 100
Evidian-Bull Japan KK 100 FC 100
Malaysia
Atos Services (Malaysia) SDN BHD 100 FC 100
Philippines
Atos Information Technology Inc. 99.94 FC 100
Atos Global Delivery Center
Philippines, Inc.100 FC 100
Singapore
Atos Information Technology
(Singapore) Ptd Ltd100 FC 100
Amesys Singapour PTE Ltd 100 FC 100
Taiwan
Atos (Taiwan) Ltd 100 FC 100
Bull Information Systems (Taiwan)
Limited100 FC 100
Thailand
Atos IT Solutions and Services Ltd 100 FC 100
AMERICAS
Argentina
Atos Argentina SA 100 FC 100
Atos IT Solutions and Services SA 70.12 FC 100
Bull Argentina SA 100 FC 100
Cerulean Tower 15F - 26-1 Sakuragaoka-cho - Shibuya-ku - Tokyo -
Japan
16-A (1st Floor) Jalan Tun Sambanthan - 3 Brickfields - 50470
Kuala Lumpur - Malaysia
23/F Cyber One Building - Eastwood City - Cyberpark - 1110 Libis,
Quezon City - Philippines
8th Floor, Two E-Com Center, Palm Coast Ave., Mall of Asia
Complex, 1110 Pasay City - Philippines
620A Lorong 1 Toa Payoh - TP4 Level 5 - 319762 Singapore
988 Toa Payoh North #08-01 - Crystal Time Building - 319002
Singapore
RM 1401 - Hutchison House - 10, Harcourt Road -
Hong Kong
Godrej & Boyce Complex - Plant 5 - Pirojshanagar - LBS Marg -
Vikhroli(W) - Mumbai - 400079 - India
701, Interface 11 - Malad (West) - Mumbai 400064 - India
Inv Buil Inter Techn Prk Witfd - 560066 Bangalore - India
Wisma Keiai #1707 - Jalan Jenderal Sudirman Kav 3 - Jakarta
10220 Indonesia
20 F, Shinjuku ParkTower - Nishi Shinjuku 3 - 7 -1 - Shinjuku - ku -
Tokyo - Japan
5F, No.100, Sec.3, Min Sheng E. Road - Taipei 105 -Taiwan -
R.O.C.
5F, No 100 Sec 3, Min Sheng E. Road - Taipei -Taiwan
2922/339 Charn Issara Tower II - 36th Floor - New Petchburi Road -
Bangkapi - Huay Kwang - 10310 Bangkok - Thailand
Cnel. Manuel Arias 3751, piso 18, PB, C.A.B.A.- C1430DAL -
ArgentinaCnel. Manuel Arias 3751, piso 18, PB, C.A.B.A.- C1430DAL -
Argentina
Manuela Saenz 323 5to. Piso Of. 506 - C 1107 bpa - Buenos aires
- Argentina
8/F Octa Tower - 8 Lam Chak Street - Kowloon Bay - Kowloon-
Hong Kong
Level 1, Part A of Tower1,Phase 2, SY.NO 115 (Part) Waverock,
APIIC IT\ITES SEZ, Nanakramguda Serilingampally Mandal -
Hyderabad Telangana 500008 - India
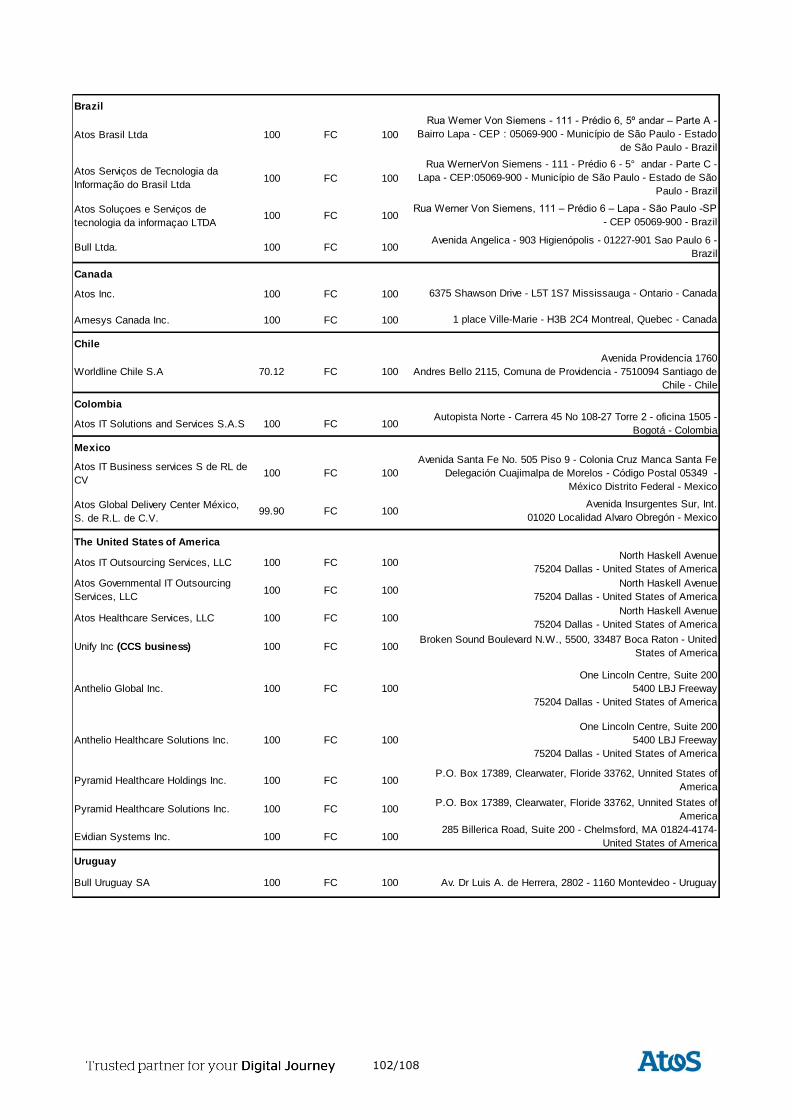
102/108
Brazil
Atos Brasil Ltda 100 FC 100
Atos Serviços de Tecnologia da
Informação do Brasil Ltda100 FC 100
Atos Soluçoes e Serviços de
tecnologia da informaçao LTDA100 FC 100
Bull Ltda. 100 FC 100
Canada
Atos Inc. 100 FC 100
Amesys Canada Inc. 100 FC 100
Chile
Worldline Chile S.A 70.12 FC 100
Colombia
Atos IT Solutions and Services S.A.S 100 FC 100
Mexico
Atos IT Business services S de RL de
CV100 FC 100
Atos Global Delivery Center México,
S. de R.L. de C.V.99.90 FC 100
The United States of America
Atos IT Outsourcing Services, LLC 100 FC 100
Atos Governmental IT Outsourcing
Services, LLC100 FC 100
Atos Healthcare Services, LLC 100 FC 100
Unify Inc (CCS business) 100 FC 100
Anthelio Global Inc. 100 FC 100
Anthelio Healthcare Solutions Inc. 100 FC 100
Pyramid Healthcare Holdings Inc. 100 FC 100
Pyramid Healthcare Solutions Inc. 100 FC 100
Evidian Systems Inc. 100 FC 100
Uruguay
Bull Uruguay SA 100 FC 100
Rua Wemer Von Siemens - 111 - Prédio 6, 5º andar – Parte A -
Bairro Lapa - CEP : 05069-900 - Município de São Paulo - Estado
de São Paulo - Brazil
Rua WernerVon Siemens - 111 - Prédio 6 - 5° andar - Parte C -
Lapa - CEP:05069-900 - Município de São Paulo - Estado de São
Paulo - Brazil
Rua Werner Von Siemens, 111 – Prédio 6 – Lapa - São Paulo -SP
- CEP 05069-900 - Brazil
Avenida Angelica - 903 Higienópolis - 01227-901 Sao Paulo 6 -
Brazil
6375 Shawson Drive - L5T 1S7 Mississauga - Ontario - Canada
1 place Ville-Marie - H3B 2C4 Montreal, Quebec - Canada
North Haskell Avenue
75204 Dallas - United States of America
North Haskell Avenue
75204 Dallas - United States of America
North Haskell Avenue
75204 Dallas - United States of America
285 Billerica Road, Suite 200 - Chelmsford, MA 01824-4174-
United States of America
Av. Dr Luis A. de Herrera, 2802 - 1160 Montevideo - Uruguay
Avenida Providencia 1760
Andres Bello 2115, Comuna de Providencia - 7510094 Santiago de
Chile - Chile
Autopista Norte - Carrera 45 No 108-27 Torre 2 - oficina 1505 -
Bogotá - Colombia
Avenida Santa Fe No. 505 Piso 9 - Colonia Cruz Manca Santa Fe
Delegación Cuajimalpa de Morelos - Código Postal 05349 -
México Distrito Federal - Mexico
Avenida Insurgentes Sur, Int.
01020 Localidad Alvaro Obregón - Mexico
Broken Sound Boulevard N.W., 5500, 33487 Boca Raton - United
States of America
One Lincoln Centre, Suite 200
5400 LBJ Freeway
75204 Dallas - United States of America
One Lincoln Centre, Suite 200
5400 LBJ Freeway
75204 Dallas - United States of America
P.O. Box 17389, Clearwater, Floride 33762, Unnited States of
America
P.O. Box 17389, Clearwater, Floride 33762, Unnited States of
America
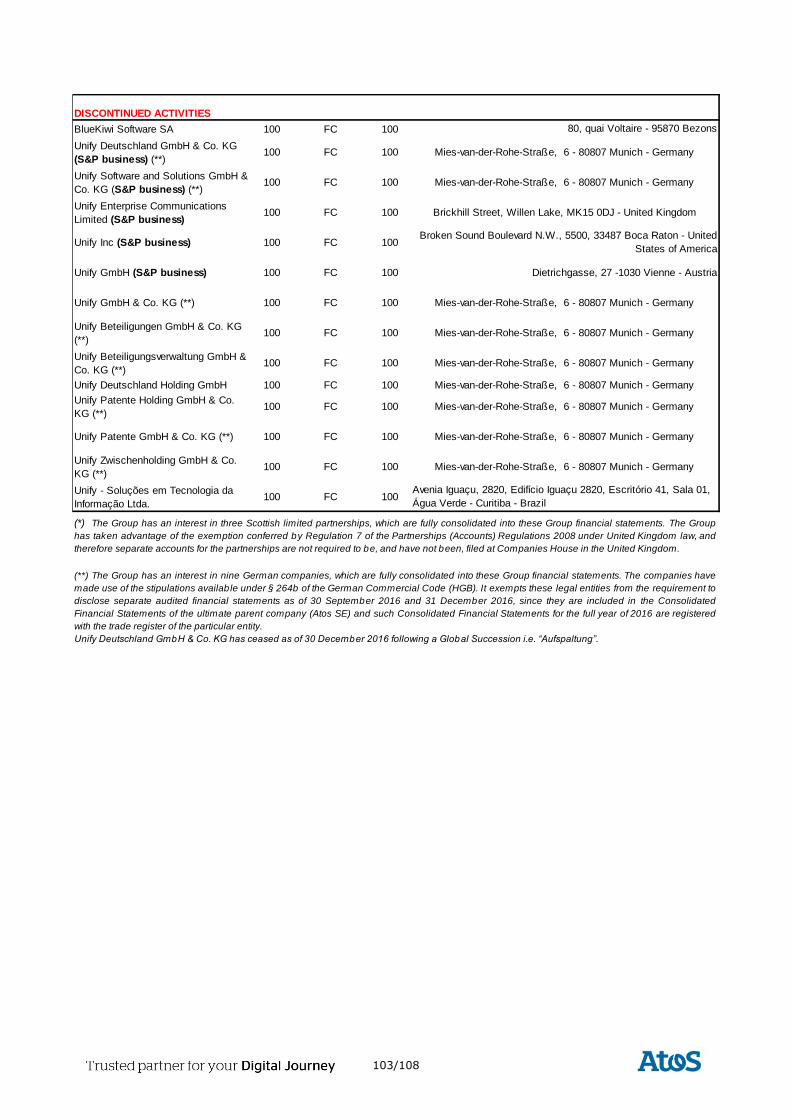
103/108
DISCONTINUED ACTIVITIES
BlueKiwi Software SA 100 FC 100
Unify Deutschland GmbH & Co. KG
(S&P business) (**)100 FC 100
Unify Software and Solutions GmbH &
Co. KG (S&P business) (**)100 FC 100
Unify Enterprise Communications
Limited (S&P business)100 FC 100
Unify Inc (S&P business) 100 FC 100
Unify GmbH (S&P business) 100 FC 100
Unify GmbH & Co. KG (**) 100 FC 100
Unify Beteiligungen GmbH & Co. KG
(**)100 FC 100
Unify Beteiligungsverwaltung GmbH &
Co. KG (**)100 FC 100
Unify Deutschland Holding GmbH 100 FC 100
Unify Patente Holding GmbH & Co.
KG (**)100 FC 100
Unify Patente GmbH & Co. KG (**) 100 FC 100
Unify Zwischenholding GmbH & Co.
KG (**)100 FC 100
Unify - Soluções em Tecnologia da
Informação Ltda.100 FC 100
80, quai Voltaire - 95870 Bezons
(**) The Group has an interest in nine German companies, which are fully consolidated into these Group financial statements. The companies have
made use of the stipulations availab le under § 264b of the German Commercial Code (HGB). It exempts these legal entities from the requirement to
disclose separate audited financial statements as of 30 September 2016 and 31 December 2016, since they are included in the Consolidated
Financial Statements of the ultimate parent company (Atos SE) and such Consolidated Financial Statements for the full year of 2016 are registered
with the trade register of the particular entity.
Unify Deutschland GmbH & Co. KG has ceased as of 30 December 2016 following a Global Succession i.e. “Aufspaltung”.
Mies-van-der-Rohe-Straße, 6 - 80807 Munich - Germany
Mies-van-der-Rohe-Straße, 6 - 80807 Munich - Germany
Mies-van-der-Rohe-Straße, 6 - 80807 Munich - Germany
Mies-van-der-Rohe-Straße, 6 - 80807 Munich - Germany
Avenia Iguaçu, 2820, Edifício Iguaçu 2820, Escritório 41, Sala 01,
Água Verde - Curitiba - Brazil
(*) The Group has an interest in three Scottish limited partnerships, which are fully consolidated into these Group financial statements. The Group
has taken advantage of the exemption conferred by Regulation 7 of the Partnerships (Accounts) Regulations 2008 under United Kingdom law, and
therefore separate accounts for the partnerships are not required to be, and have not been, filed at Companies House in the United Kingdom.
Mies-van-der-Rohe-Straße, 6 - 80807 Munich - Germany
Mies-van-der-Rohe-Straße, 6 - 80807 Munich - Germany
Brickhill Street, Willen Lake, MK15 0DJ - United Kingdom
Broken Sound Boulevard N.W., 5500, 33487 Boca Raton - United
States of America
Dietrichgasse, 27 -1030 Vienne - Austria
Mies-van-der-Rohe-Straße, 6 - 80807 Munich - Germany
Mies-van-der-Rohe-Straße, 6 - 80807 Munich - Germany
Mies-van-der-Rohe-Straße, 6 - 80807 Munich - Germany
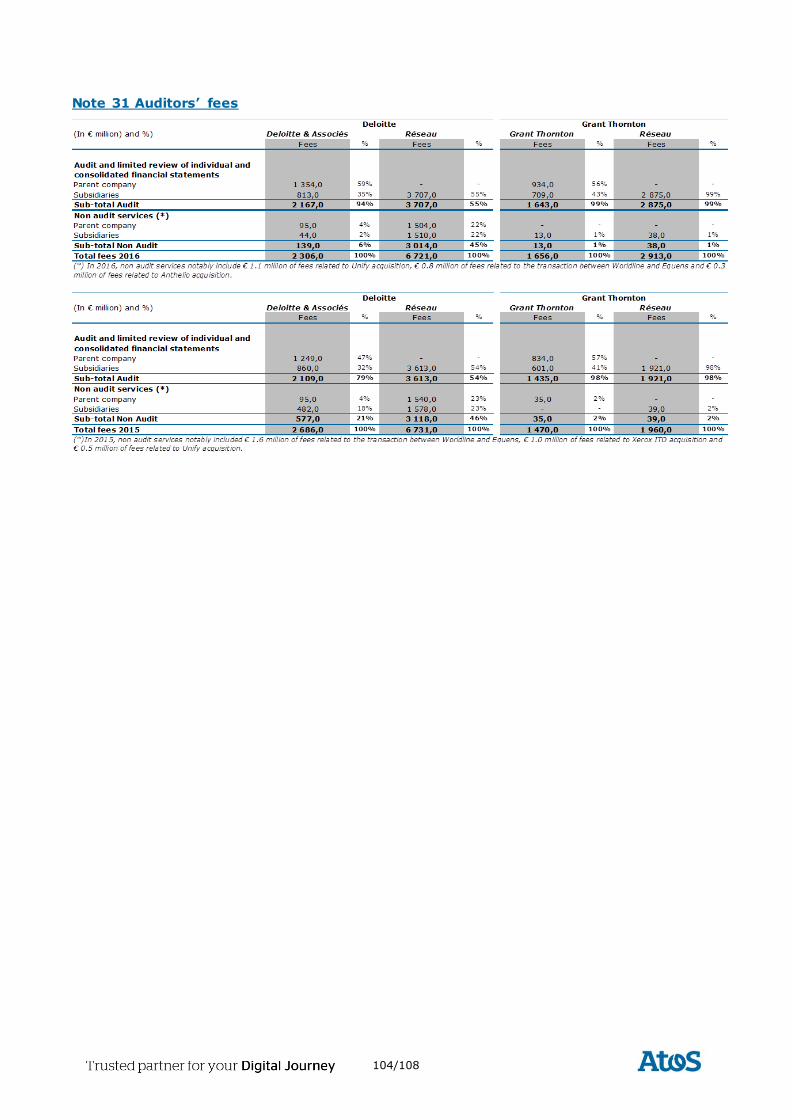
104/108
Note 31 Auditors’ fees
105/108
C CONTACTS AND LOCATIONS
C.1.1 Global Headquarters
River Ouest
80 Quai Voltaire 95870 Bezons – France
+33 1 73 26 00 00
C.1.2 Corporate functions
Finance
Elie Girard
+33 1 73 26 00 31
Human Resources & Siemens Partnership
Philippe Mareine +49 21 13 99 20 800
Executive & Talent Management,
Communications
Marc Meyer
+33 1 73 26 00 26
Sales & Marketing
Patrick Adiba +33 1 73 26 00 36
Investor Relations & Financial
Communication
Gilles Arditti
+33 1 73 26 00 66
Mergers & Acquisitions, Legal, Compliance &
Contract Management
Alexandre Menais +33 1 73 26 42 15
Procurement
Enguerrand de Pontevès
+33 1 73 26 01 02
Internal Audit
Arnaud Ruffat
+33 1 73 26 01 91
C.1.3 Global organization
Business & Platform Solutions
Ursula Morgenstern
+44 20 78 30 44 47
Infrastructure & Data Management
Eric Grall +33 1 73 26 01 20
Big Data & Cybersecurity
Philippe Vannier +33 1 58 04 05 18
Worldline
Marc Henri Desportes
+33 1 73 26 00 29
106/108
C.1.4 Locations
Atos is present in main cities to support customers. The addresses and phone numbers of the Group main
offices can be found on the Locations page on website atos.net. Details of current job opportunities can be
found in Careers pages. An email address for general questions and comments about the Atos’ Internet site can be found at the bottom of the page.
Global Headquarters
River Ouest
80 Quai Voltaire
95870 Bezons – France +33 1 73 26 00 00
Americas
Argentina
Brazil
Canada
Chile
Colombia
Guatemala
Jamaica
Mexico
Peru
Uruguay
USA
Asia Pacific
Australia
China
Hong Kong
Indonesia
Japan
Korea
Malaysia
New-Zealand
Philippines
Singapore
Taiwan
Thailand
Europe
Andorra
Austria
Belgium
Bulgaria
Croatia
Cyprus
Czech Republic
Denmark
Estonia
Finland
France
Germany
Greece
Hungary
Italy
Ireland
Lithuania
Luxembourg
Poland
Portugal
Romania
Russia
Serbia
Slovakia
Slovenia
Spain
Sweden
Switzerland
The Netherlands
United Kingdom
India, Middle-East &
Africa
Algeria
Benin
Burkina Faso
Egypt
Gabon
India
Israel
Ivory-coast
Lebanon
Madagascar
Mali
Mauritius
Morocco
Qatar
Saudi Arabia
Senegal
South Africa
Turkey
United Arab Emirates
107/108
D FULL INDEX
Contents ................................................................................................................................................ 2
A Group overview ............................................................................................................................... 3
A.1 Revenue profile ....................................................................................................................... 3
A.1.1 By Division ....................................................................................................................... 3
A.1.2 By Business Unit .............................................................................................................. 3
A.1.3 By Market ........................................................................................................................ 3
A.2 Business profile ....................................................................................................................... 4
A.3 2016 key achievements ........................................................................................................... 7
B Financials ...................................................................................................................................... 11
B.1 Operational review ................................................................................................................ 11
B.1.1 Executive summary ........................................................................................................ 11
B.1.2 Statutory to constant scope and exchange rates reconciliation ........................................ 14
B.1.3 Performance by Division ................................................................................................. 15
B.1.3.1 Infrastructure & Data Management.......................................................................... 15
B.1.3.2 Business & Platform Solutions ................................................................................. 16
B.1.3.3 Big Data & Cybersecurity ........................................................................................ 17
B.1.3.4 Worldline ................................................................................................................ 18
B.1.4 Performance by Business Unit......................................................................................... 19
B.1.4.1 North America......................................................................................................... 20
B.1.4.2 Germany................................................................................................................. 20
B.1.4.3 United Kingdom & Ireland ....................................................................................... 21
B.1.4.4 France .................................................................................................................... 21
B.1.4.5 Benelux & The Nordics ............................................................................................ 22
B.1.4.6 Other Business Units ............................................................................................... 22
B.1.4.7 Global structures costs ............................................................................................ 23
B.1.5 Revenue by Market ........................................................................................................ 23
B.1.5.1 Manufacturing, Retail & Transportation .................................................................... 23
B.1.5.2 Public & Health........................................................................................................ 23
B.1.5.3 Telcos, Media & Utilities........................................................................................... 24
B.1.5.4 Financial Services.................................................................................................... 24
B.1.6 Group exposure to the Brexit.......................................................................................... 24
B.1.7 Portfolio ......................................................................................................................... 24
B.1.7.1 Order entry and book to bill .................................................................................... 24
B.1.7.2 Full backlog............................................................................................................. 25
B.1.7.3 Full qualified pipeline............................................................................................... 25
B.1.8 Human Resources .......................................................................................................... 25
B.2 2017 objectives ..................................................................................................................... 26
B.3 Financial review..................................................................................................................... 27
B.3.1 Income statement .......................................................................................................... 27
B.3.2 Cash Flow ...................................................................................................................... 32
108/108
B.3.3 Financing policy.............................................................................................................. 34
B.3.3.1 Financing structure ................................................................................................. 34
B.3.3.2 Bank covenants ...................................................................................................... 34
B.3.3.3 Investment policy ................................................................................................... 35
B.3.3.4 Hedging policy ........................................................................................................ 35
B.4 Consolidated financial statements .......................................................................................... 36
B.4.1 Statutory Auditors’ report on the consolidated financial statements for the year ended December 31, 2016 ....................................................................................................................... 36
B.4.2 Consolidated income statement ...................................................................................... 37
B.4.3 Consolidated statement of comprehensive income .......................................................... 38
B.4.4 Consolidated statement of financial position.................................................................... 39
B.4.5 Consolidated cash flow statement ................................................................................... 40
B.4.6 Consolidated statement of changes in shareholders’ equity ............................................. 41
B.4.7 Notes to the consolidated financial statements................................................................ 42
B.4.7.1 General information ................................................................................................ 42
B.4.7.2 Basis of preparation and significant accounting policies............................................ 42
B.4.7.3 Financial risk management ...................................................................................... 53
B.4.7.4 Notes to the consolidated financial statements ........................................................ 54
C Contacts and locations ................................................................................................................. 105
C.1.1 Global Headquarters..................................................................................................... 105
C.1.2 Corporate functions ...................................................................................................... 105
C.1.3 Global organization ...................................................................................................... 105
C.1.4 Locations ..................................................................................................................... 106
D Full index .................................................................................................................................... 107