Embed Size (px)
Citation preview
Shaw and Partners
0.94500 0000 000
AMS – Equity Report current as at –30/04/2021–Pg. 1
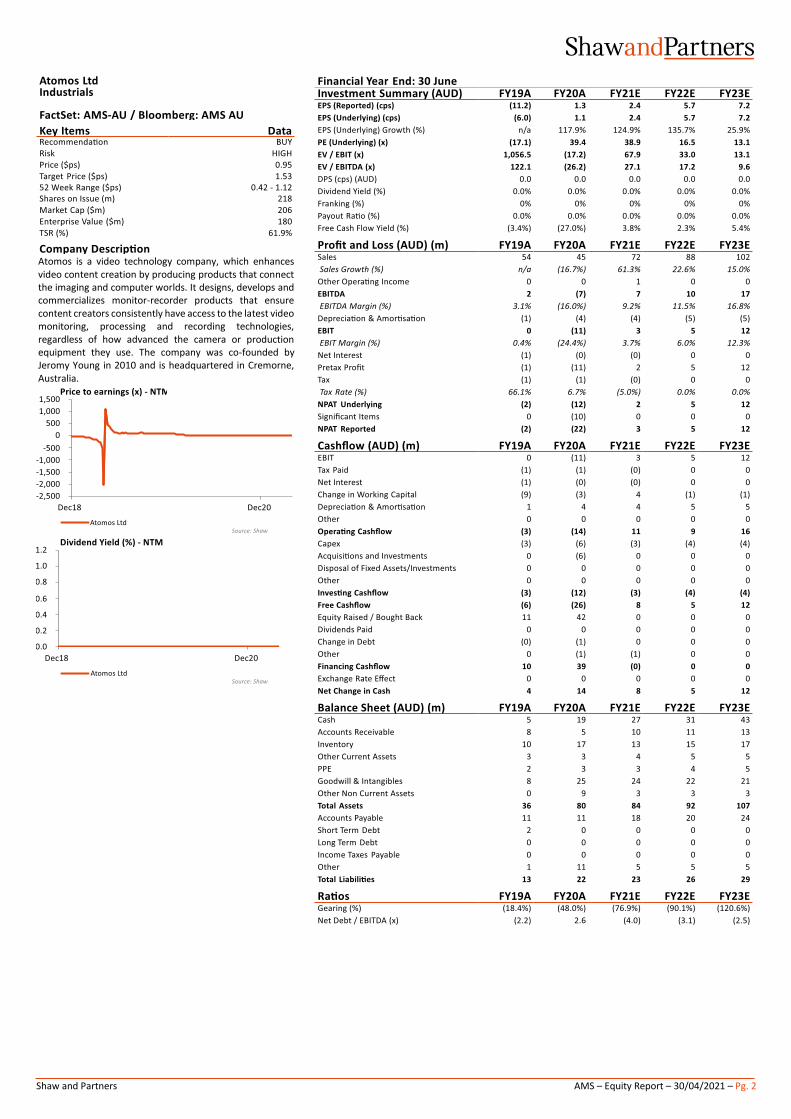
Atomos Ltd (AMS) Rating: Buy | Risk: High | Price Target: $1.53
Capturing 8K performance at 1080p prices
James Bisinella | Analyst
+61 3 9268 1123 [email protected]
Jonathon Higgins | Analyst
+61 3 9268 1182 [email protected]
Event We initiate on Atomos (ASX: AMS) with a Buy Recommendation and Price Target of $1.53 per share (61.9% upside).
Highlights • Market leading products addressing hypergrowth trends – Atomos designs,
manufactures and distributes market leading monitor-recorders globally. These products RRP from US$299 to US$6,499 with gross margins of ~45%. Atomos gives video professionals a faster, superior quality and more affordable output which is highly sought after in the digital age driven by hypergrowth across streaming (Netflix with >200m subscribers), social media (Instagram and Facebook with 2.8bn and 1.3bn users respectively) and gaming (Twitch with ~10m streamers and growing ~150% MoM).
• Positioned for revenue acceleration in 2H21 – Atomos is entering 2H21 on strong grounds with revenue of $32.8m accelerating MoM in 1H21. A recent company outlook statement pointed to sales momentum continuing into 2H21, which supports our revenue estimate of $39.4m or +20% HoH in 2H21 alongside maiden contributions from software sales, Ninja launches, further ProRes RAW integrations, rising organic website visits (+7.6% MoM in April) and growth in the recently launched Neon range.
• Ninja range extended to 8K and streaming – Yesterday AMS announced the launch of the Ninja V+ (first monitor-recorder with 8K recording), Ninja Stream (livestream across the world without a PC) and H.265 codec for Ninja V (via a US$99 software upgrade from May 2021). These represent high quality and relevant opportunities in growing markets with live product launches slated for May 6th which should shed further light.
• Product expansion opportunities to contribute – Over and above growth in the existing product base, Atomos is planning new product launches over the next 6 - 18 months including new categories (gaming), further ProRes RAW integrations and Series 2 product range releases. Additionally, partnership opportunities with the likes of Disney, Zoom, Netflix, Twitch, Cisco could also provide further upside opportunities.
• Profits to emerge alongside operating leverage – We anticipate material operating leverage as Atomos continues to scale its business after turning EBITDA and cashflow positive in the most recent half. Latest 1H21 results and Shaw estimates include:
▪ Revenue: $32.8m at 1H21, Shaw estimates of $39.4m, $72.2m and $88.5m across 2H21e, FY21e and FY22e respectively. We anticipate strong growth driven by new product launches, core video thematic tailwinds, market leadership and accelerating performance in Entertainment across recently launched Neon products.
▪ Gross profit and margins: $14.7m / 44.9% gross margin at 1H21, Shaw estimates of $17.9m, $32.6m and $40.9m across 2H21e, FY21e and FY22e respectively. We see potential for more favourable GM profile over time including software sales.
▪ EBITDA (post-R&D) and margins: $3.0m at 1H21 at 9.2% EBITDA margin, Shaw estimates of $3.6m, $6.6m and $10.2m across 2H21e, FY21e and FY22e respectively.
• Video the enduring modern communication modality of choice – The importance of video communication emerged pre-Covid and accelerated during the WFH phenomenon. Video has proven more efficacious than traditional print and radio media. Internet-based video is forecast to reach 82% of internet traffic in 2022 (source: Cisco). With users and penetration rising in all Atomos segments (Social, Pro-Video, Entertainment) we see social media, gaming and video streaming continuing to drive adoption.
• Risks – Technological change, competition, supply chain, IP protection, cash burn (net cash ~$23m), international operations and key board/management risk, among others.
Recommendation Atomos offers exposure to a globally relevant, market leader in the monitor-recorder space. With superior design, manufacturing and distribution, we see Atomos continuing to deliver significant revenue growth alongside high gross margins and a scalable business model. Initiate with Buy Recommendation. 299
Shaw and Partners AMS – Equity Report – 30/04/2021 – Pg. 2
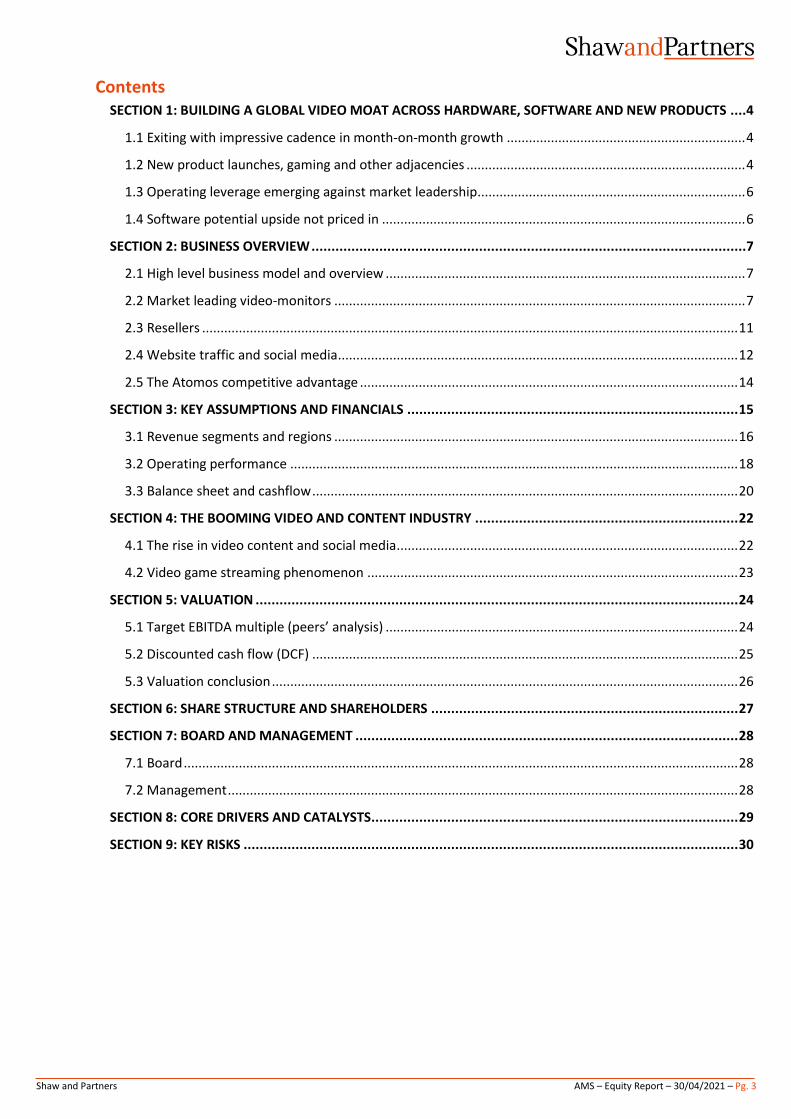
Atomos is a video technology company, which enhances video content creation by producing products that connect the imaging and computer worlds. It designs, develops and commercializes monitor-recorder products that ensure content creators consistently have access to the latest video monitoring, processing and recording technologies, regardless of how advanced the camera or production equipment they use. The company was co-founded by Jeromy Young in 2010 and is headquartered in Cremorne, Australia.
Shaw and Partners AMS – Equity Report – 30/04/2021 – Pg. 3
Contents SECTION 1: BUILDING A GLOBAL VIDEO MOAT ACROSS HARDWARE, SOFTWARE AND NEW PRODUCTS ....4
1.1 Exiting with impressive cadence in month-on-month growth ................................................................. 4
1.2 New product launches, gaming and other adjacencies ............................................................................ 4
1.3 Operating leverage emerging against market leadership......................................................................... 6
1.4 Software potential upside not priced in ................................................................................................... 6
SECTION 2: BUSINESS OVERVIEW .............................................................................................................7
2.1 High level business model and overview .................................................................................................. 7
2.2 Market leading video-monitors ................................................................................................................ 7
2.3 Resellers .................................................................................................................................................. 11
2.4 Website traffic and social media ............................................................................................................. 12
2.5 The Atomos competitive advantage ....................................................................................................... 14
SECTION 3: KEY ASSUMPTIONS AND FINANCIALS ................................................................................... 15
3.1 Revenue segments and regions .............................................................................................................. 16
3.2 Operating performance .......................................................................................................................... 18
3.3 Balance sheet and cashflow .................................................................................................................... 20
SECTION 4: THE BOOMING VIDEO AND CONTENT INDUSTRY .................................................................. 22
4.1 The rise in video content and social media ............................................................................................. 22
4.2 Video game streaming phenomenon ..................................................................................................... 23
SECTION 5: VALUATION ......................................................................................................................... 24
5.1 Target EBITDA multiple (peers’ analysis) ................................................................................................ 24
5.2 Discounted cash flow (DCF) .................................................................................................................... 25
5.3 Valuation conclusion ............................................................................................................................... 26
SECTION 6: SHARE STRUCTURE AND SHAREHOLDERS ............................................................................. 27
SECTION 7: BOARD AND MANAGEMENT ................................................................................................ 28
7.1 Board ....................................................................................................................................................... 28
7.2 Management ........................................................................................................................................... 28
SECTION 8: CORE DRIVERS AND CATALYSTS ............................................................................................ 29
SECTION 9: KEY RISKS ............................................................................................................................ 30
Shaw and Partners AMS – Equity Report – 30/04/2021 – Pg. 4
SECTION 1: BUILDING A GLOBAL VIDEO MOAT ACROSS HARDWARE, SOFTWARE AND NEW PRODUCTS
1.1 Exiting with impressive cadence in month-on-month growth
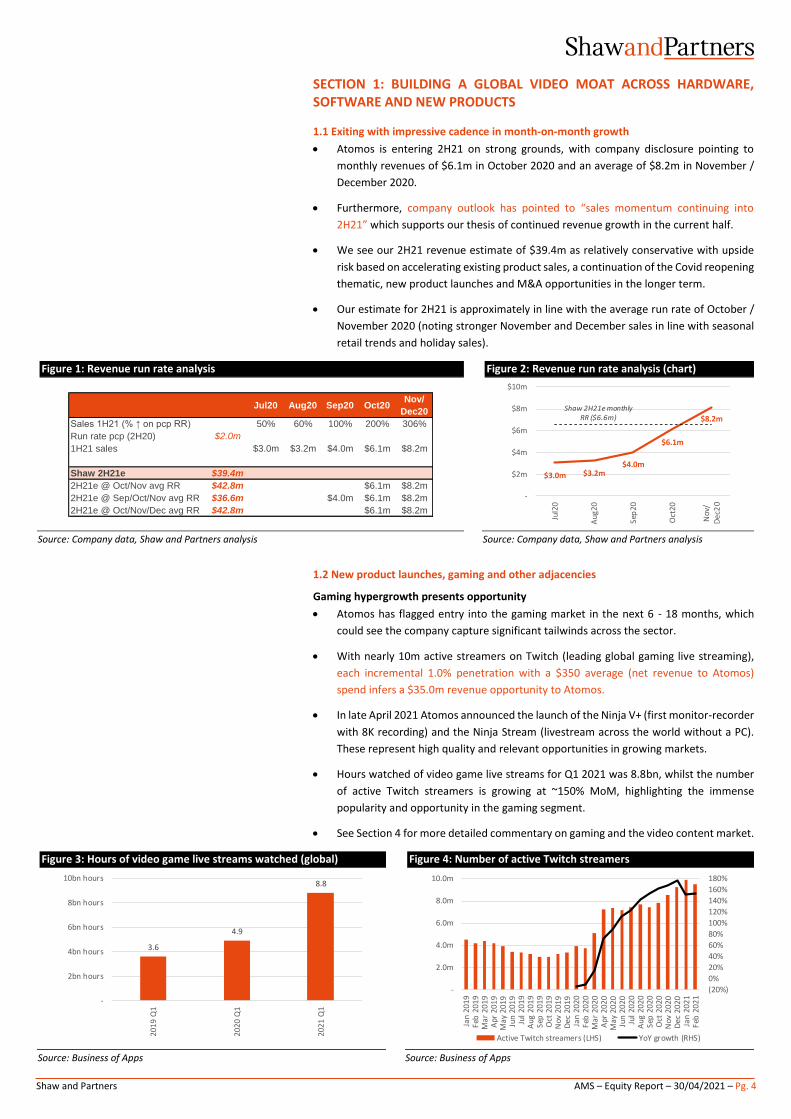
• Atomos is entering 2H21 on strong grounds, with company disclosure pointing to
monthly revenues of $6.1m in October 2020 and an average of $8.2m in November /
December 2020.
• Furthermore, company outlook has pointed to “sales momentum continuing into
2H21” which supports our thesis of continued revenue growth in the current half.
• We see our 2H21 revenue estimate of $39.4m as relatively conservative with upside
risk based on accelerating existing product sales, a continuation of the Covid reopening
thematic, new product launches and M&A opportunities in the longer term.
• Our estimate for 2H21 is approximately in line with the average run rate of October /
November 2020 (noting stronger November and December sales in line with seasonal
retail trends and holiday sales).
Figure 1: Revenue run rate analysis Figure 2: Revenue run rate analysis (chart)
Source: Company data, Shaw and Partners analysis Source: Company data, Shaw and Partners analysis
1.2 New product launches, gaming and other adjacencies
Gaming hypergrowth presents opportunity
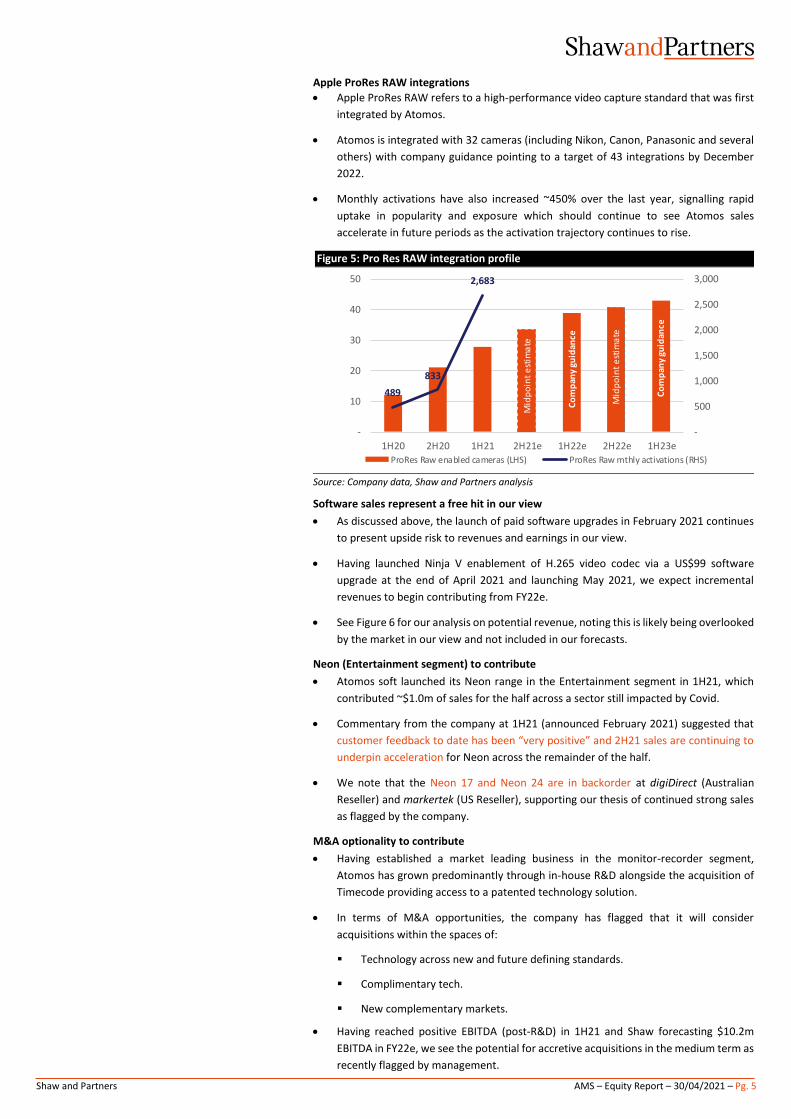
• Atomos has flagged entry into the gaming market in the next 6 - 18 months, which
could see the company capture significant tailwinds across the sector.
• With nearly 10m active streamers on Twitch (leading global gaming live streaming),
each incremental 1.0% penetration with a $350 average (net revenue to Atomos)
spend infers a $35.0m revenue opportunity to Atomos.
• In late April 2021 Atomos announced the launch of the Ninja V+ (first monitor-recorder
with 8K recording) and the Ninja Stream (livestream across the world without a PC).
These represent high quality and relevant opportunities in growing markets.
• Hours watched of video game live streams for Q1 2021 was 8.8bn, whilst the number
of active Twitch streamers is growing at ~150% MoM, highlighting the immense
popularity and opportunity in the gaming segment.
• See Section 4 for more detailed commentary on gaming and the video content market.
Figure 3: Hours of video game live streams watched (global) Figure 4: Number of active Twitch streamers
Source: Business of Apps Source: Business of Apps
Jul20 Aug20 Sep20 Oct20Nov/
Dec20
Sales 1H21 (% ↑ on pcp RR) 50% 60% 100% 200% 306%
Run rate pcp (2H20) $2.0m
1H21 sales $3.0m $3.2m $4.0m $6.1m $8.2m
Shaw 2H21e $39.4m
2H21e @ Oct/Nov avg RR $42.8m $6.1m $8.2m
2H21e @ Sep/Oct/Nov avg RR $36.6m $4.0m $6.1m $8.2m
2H21e @ Oct/Nov/Dec avg RR $42.8m $6.1m $8.2m
$3.0m $3.2m$4.0m
$6.1m
$8.2mShaw 2H21e monthly
RR ($6.6m)
-
$2m
$4m
$6m
$8m
$10m
Jul2
0
Au
g20
Sep
20
Oct
20
No
v/D
ec2
0
3.6
4.9
8.8
-
2bn hours
4bn hours
6bn hours
8bn hours
10bn hours
20
19
Q1
20
20
Q1
20
21
Q1
(20%)
0%
20%
40%
60%
80%
100%
120%
140%
160%
180%
-
2.0m
4.0m
6.0m
8.0m
10.0m
Jan
20
19
Feb
201
9M
ar 2
01
9A
pr
20
19
May
201
9Ju
n 2
01
9Ju
l 2
01
9A
ug
20
19
Sep
201
9O
ct 2
01
9N
ov
20
19
Dec
201
9Ja
n 2
02
0Fe
b 2
020
Mar
20
20
Ap
r 2
02
0M
ay 2
020
Jun
20
20
Jul
20
20
Au
g 2
02
0Se
p 2
020
Oct
20
20
No
v 2
02
0D
ec 2
020
Jan
20
21
Feb
202
1
Active Twitch streamers (LHS) YoY growth (RHS)
Shaw and Partners AMS – Equity Report – 30/04/2021 – Pg. 5
Apple ProRes RAW integrations
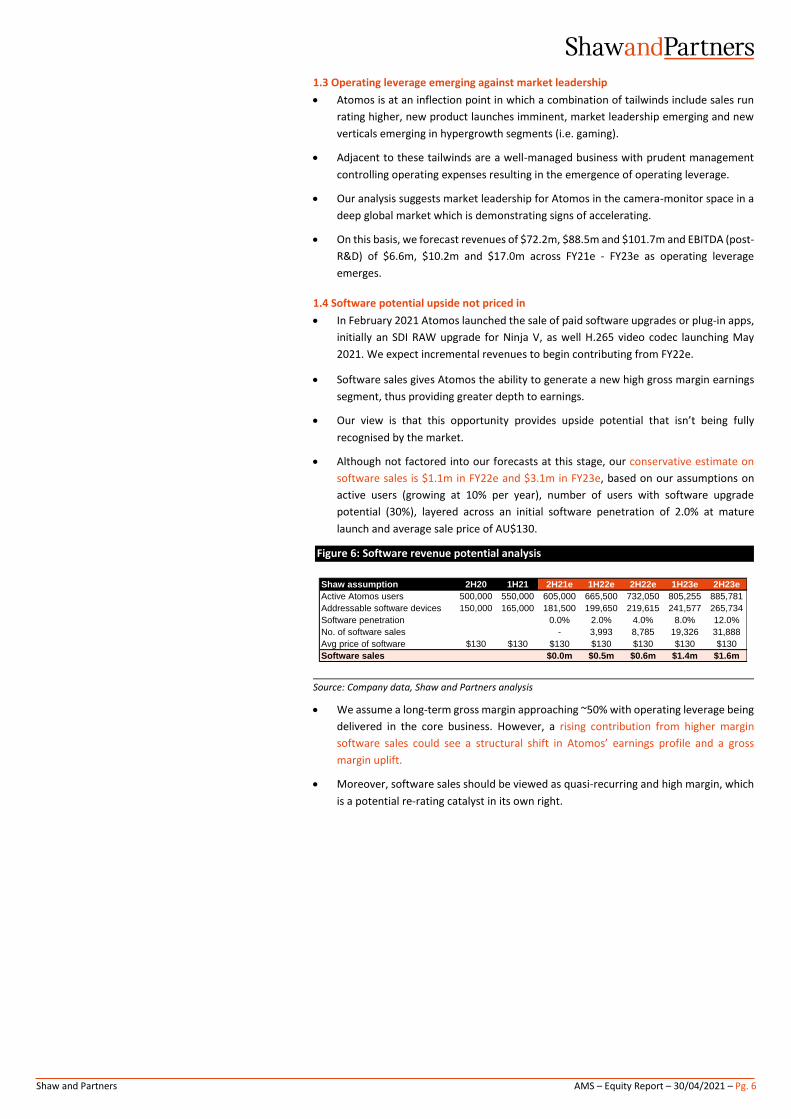
• Apple ProRes RAW refers to a high-performance video capture standard that was first
integrated by Atomos.
• Atomos is integrated with 32 cameras (including Nikon, Canon, Panasonic and several
others) with company guidance pointing to a target of 43 integrations by December
2022.
• Monthly activations have also increased ~450% over the last year, signalling rapid
uptake in popularity and exposure which should continue to see Atomos sales
accelerate in future periods as the activation trajectory continues to rise.
Figure 5: Pro Res RAW integration profile
Source: Company data, Shaw and Partners analysis
Software sales represent a free hit in our view
• As discussed above, the launch of paid software upgrades in February 2021 continues
to present upside risk to revenues and earnings in our view.
• Having launched Ninja V enablement of H.265 video codec via a US$99 software
upgrade at the end of April 2021 and launching May 2021, we expect incremental
revenues to begin contributing from FY22e.
• See Figure 6 for our analysis on potential revenue, noting this is likely being overlooked
by the market in our view and not included in our forecasts.
Neon (Entertainment segment) to contribute
• Atomos soft launched its Neon range in the Entertainment segment in 1H21, which
contributed ~$1.0m of sales for the half across a sector still impacted by Covid.
• Commentary from the company at 1H21 (announced February 2021) suggested that
customer feedback to date has been “very positive” and 2H21 sales are continuing to
underpin acceleration for Neon across the remainder of the half.
• We note that the Neon 17 and Neon 24 are in backorder at digiDirect (Australian
Reseller) and markertek (US Reseller), supporting our thesis of continued strong sales
as flagged by the company.
M&A optionality to contribute
• Having established a market leading business in the monitor-recorder segment,
Atomos has grown predominantly through in-house R&D alongside the acquisition of
Timecode providing access to a patented technology solution.
• In terms of M&A opportunities, the company has flagged that it will consider
acquisitions within the spaces of:
▪ Technology across new and future defining standards.
▪ Complimentary tech.
▪ New complementary markets.
• Having reached positive EBITDA (post-R&D) in 1H21 and Shaw forecasting $10.2m
EBITDA in FY22e, we see the potential for accretive acquisitions in the medium term as
recently flagged by management.
489
833
2,683
-
500
1,000
1,500
2,000
2,500
3,000
1H20 2H20 1H21 2H21e 1H22e 2H22e 1H23e
-
10
20
30
40
50
ProRes Raw enabled cameras (LHS) ProRes Raw mthly activations (RHS)
Mid
po
int
est
ima
te
Mid
po
int
est
ima
te
Co
mp
any
guid
ance
Co
mp
any
guid
ance
Shaw and Partners AMS – Equity Report – 30/04/2021 – Pg. 6
1.3 Operating leverage emerging against market leadership
• Atomos is at an inflection point in which a combination of tailwinds include sales run
rating higher, new product launches imminent, market leadership emerging and new
verticals emerging in hypergrowth segments (i.e. gaming).
• Adjacent to these tailwinds are a well-managed business with prudent management
controlling operating expenses resulting in the emergence of operating leverage.
• Our analysis suggests market leadership for Atomos in the camera-monitor space in a
deep global market which is demonstrating signs of accelerating.
• On this basis, we forecast revenues of $72.2m, $88.5m and $101.7m and EBITDA (post-
R&D) of $6.6m, $10.2m and $17.0m across FY21e - FY23e as operating leverage
emerges.
1.4 Software potential upside not priced in
• In February 2021 Atomos launched the sale of paid software upgrades or plug-in apps,
initially an SDI RAW upgrade for Ninja V, as well H.265 video codec launching May
2021. We expect incremental revenues to begin contributing from FY22e.
• Software sales gives Atomos the ability to generate a new high gross margin earnings
segment, thus providing greater depth to earnings.
• Our view is that this opportunity provides upside potential that isn’t being fully
recognised by the market.
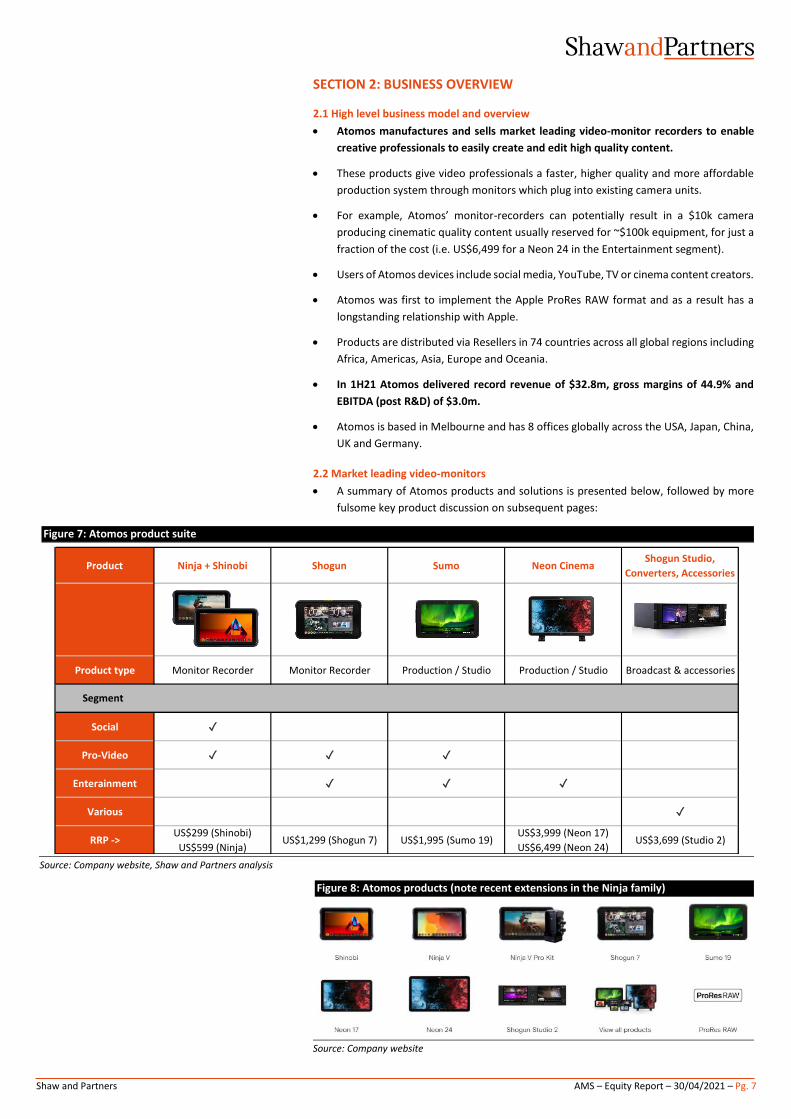
• Although not factored into our forecasts at this stage, our conservative estimate on
software sales is $1.1m in FY22e and $3.1m in FY23e, based on our assumptions on
active users (growing at 10% per year), number of users with software upgrade
potential (30%), layered across an initial software penetration of 2.0% at mature
launch and average sale price of AU$130.
Figure 6: Software revenue potential analysis
Source: Company data, Shaw and Partners analysis
• We assume a long-term gross margin approaching ~50% with operating leverage being
delivered in the core business. However, a rising contribution from higher margin
software sales could see a structural shift in Atomos’ earnings profile and a gross
margin uplift.
• Moreover, software sales should be viewed as quasi-recurring and high margin, which
is a potential re-rating catalyst in its own right.
Shaw assumption 2H20 1H21 2H21e 1H22e 2H22e 1H23e 2H23e
Active Atomos users 500,000 550,000 605,000 665,500 732,050 805,255 885,781
Addressable software devices 150,000 165,000 181,500 199,650 219,615 241,577 265,734
Software penetration 0.0% 2.0% 4.0% 8.0% 12.0%
No. of software sales - 3,993 8,785 19,326 31,888
Avg price of software $130 $130 $130 $130 $130 $130 $130
Software sales $0.0m $0.5m $0.6m $1.4m $1.6m
Shaw and Partners AMS – Equity Report – 30/04/2021 – Pg. 7
SECTION 2: BUSINESS OVERVIEW
2.1 High level business model and overview
• Atomos manufactures and sells market leading video-monitor recorders to enable
creative professionals to easily create and edit high quality content.
• These products give video professionals a faster, higher quality and more affordable
production system through monitors which plug into existing camera units.
• For example, Atomos’ monitor-recorders can potentially result in a $10k camera
producing cinematic quality content usually reserved for ~$100k equipment, for just a
fraction of the cost (i.e. US$6,499 for a Neon 24 in the Entertainment segment).
• Users of Atomos devices include social media, YouTube, TV or cinema content creators.
• Atomos was first to implement the Apple ProRes RAW format and as a result has a
longstanding relationship with Apple.
• Products are distributed via Resellers in 74 countries across all global regions including
Africa, Americas, Asia, Europe and Oceania.
• In 1H21 Atomos delivered record revenue of $32.8m, gross margins of 44.9% and
EBITDA (post R&D) of $3.0m.
• Atomos is based in Melbourne and has 8 offices globally across the USA, Japan, China,
UK and Germany.
2.2 Market leading video-monitors
• A summary of Atomos products and solutions is presented below, followed by more
fulsome key product discussion on subsequent pages:
Figure 7: Atomos product suite
Source: Company website, Shaw and Partners analysis
Figure 8: Atomos products (note recent extensions in the Ninja family)
Source: Company website
Product Ninja + Shinobi Shogun Sumo Neon CinemaShogun Studio,
Converters, Accessories
Product type Monitor Recorder Monitor Recorder Production / Studio Production / Studio Broadcast & accessories
Social ✓
Pro-Video ✓ ✓ ✓
Enterainment ✓ ✓ ✓
Various ✓
RRP ->US$299 (Shinobi)
US$599 (Ninja)US$1,299 (Shogun 7) US$1,995 (Sumo 19)
US$3,999 (Neon 17)
US$6,499 (Neon 24)US$3,699 (Studio 2)
Segment
Shaw and Partners AMS – Equity Report – 30/04/2021 – Pg. 8
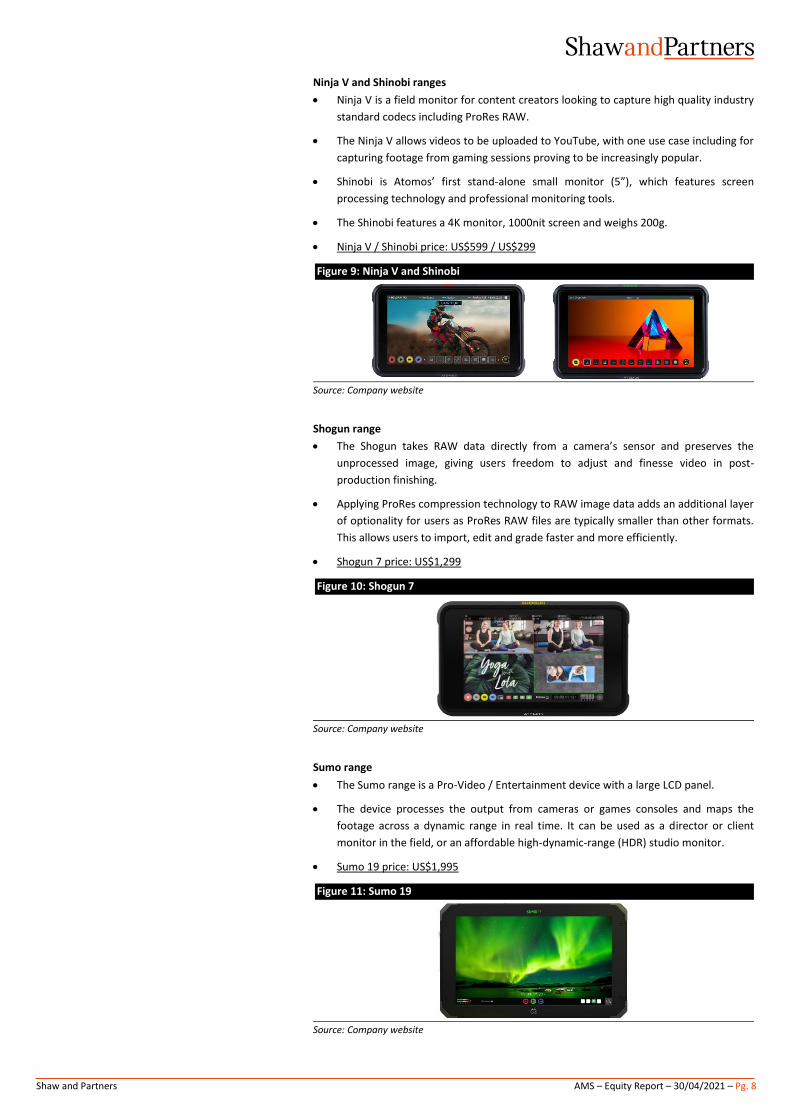
Ninja V and Shinobi ranges
• Ninja V is a field monitor for content creators looking to capture high quality industry
standard codecs including ProRes RAW.
• The Ninja V allows videos to be uploaded to YouTube, with one use case including for
capturing footage from gaming sessions proving to be increasingly popular.
• Shinobi is Atomos’ first stand-alone small monitor (5”), which features screen
processing technology and professional monitoring tools.
• The Shinobi features a 4K monitor, 1000nit screen and weighs 200g.
• Ninja V / Shinobi price: US$599 / US$299
Figure 9: Ninja V and Shinobi
Source: Company website
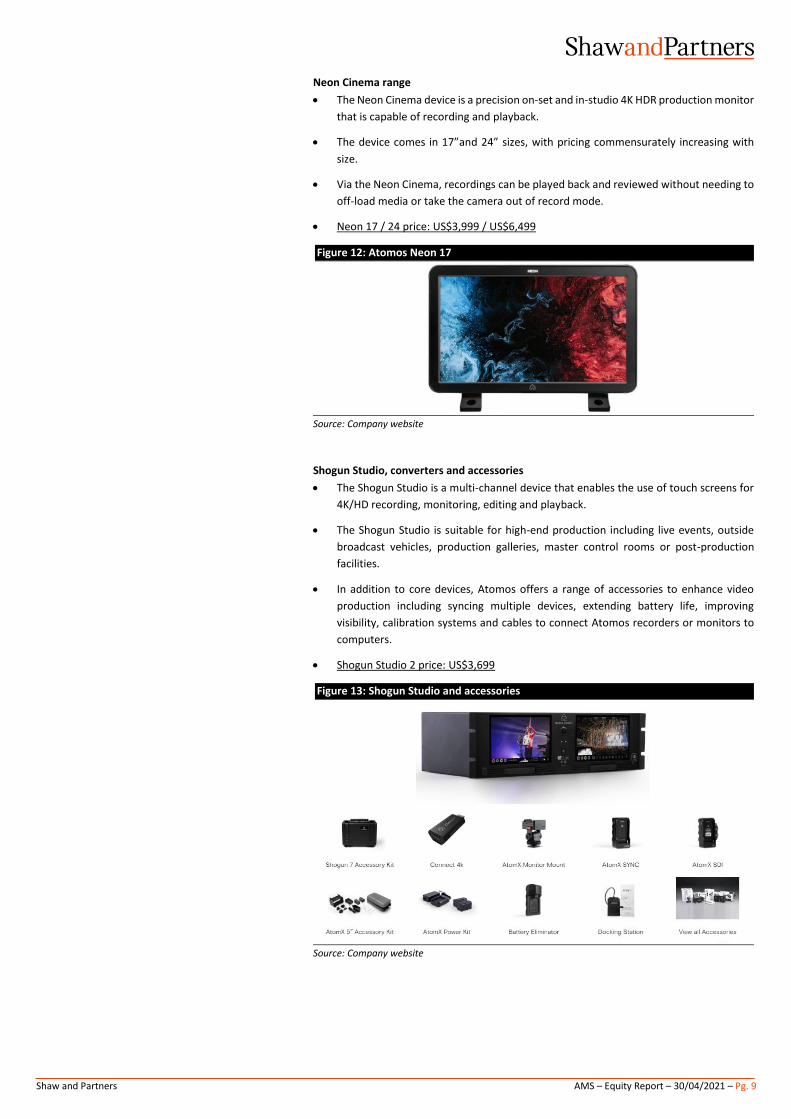
Shogun range
• The Shogun takes RAW data directly from a camera’s sensor and preserves the
unprocessed image, giving users freedom to adjust and finesse video in post-
production finishing.
• Applying ProRes compression technology to RAW image data adds an additional layer
of optionality for users as ProRes RAW files are typically smaller than other formats.
This allows users to import, edit and grade faster and more efficiently.
• Shogun 7 price: US$1,299
Figure 10: Shogun 7
Source: Company website
Sumo range
• The Sumo range is a Pro-Video / Entertainment device with a large LCD panel.
• The device processes the output from cameras or games consoles and maps the
footage across a dynamic range in real time. It can be used as a director or client
monitor in the field, or an affordable high-dynamic-range (HDR) studio monitor.
• Sumo 19 price: US$1,995
Figure 11: Sumo 19
Source: Company website
Shaw and Partners AMS – Equity Report – 30/04/2021 – Pg. 9
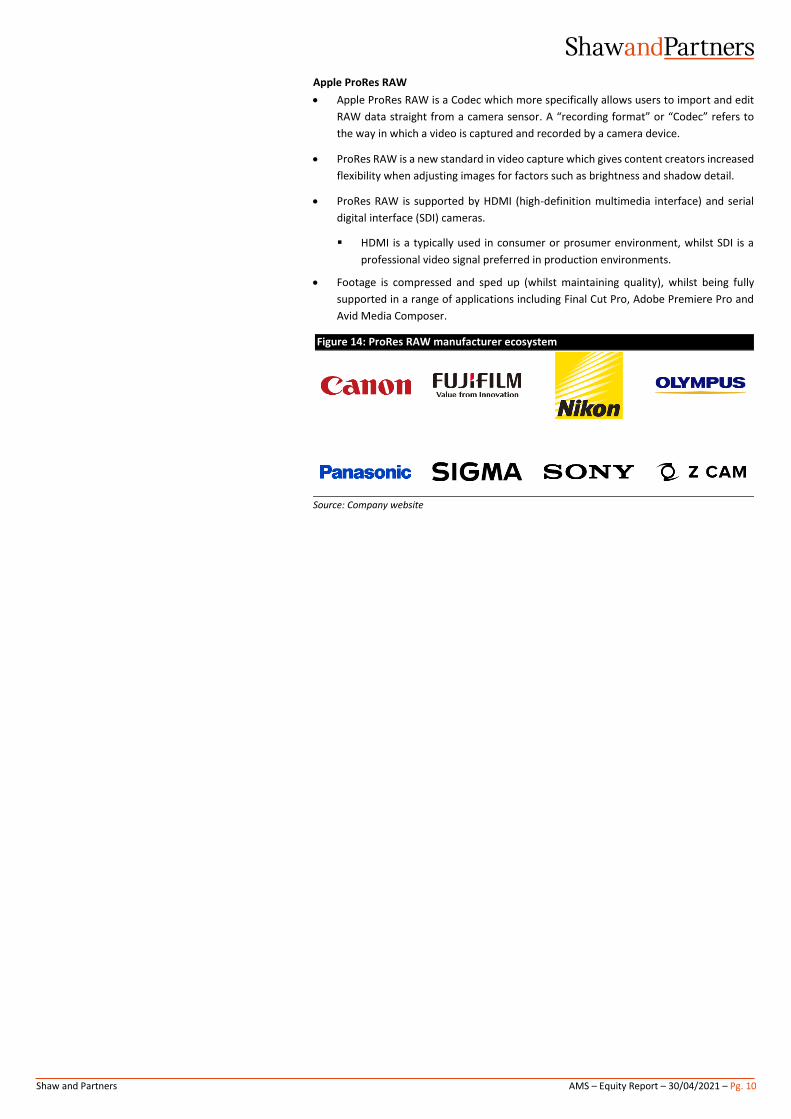
Neon Cinema range
• The Neon Cinema device is a precision on-set and in-studio 4K HDR production monitor
that is capable of recording and playback.
• The device comes in 17”and 24” sizes, with pricing commensurately increasing with
size.
• Via the Neon Cinema, recordings can be played back and reviewed without needing to
off-load media or take the camera out of record mode.
• Neon 17 / 24 price: US$3,999 / US$6,499
Figure 12: Atomos Neon 17
Source: Company website
Shogun Studio, converters and accessories
• The Shogun Studio is a multi-channel device that enables the use of touch screens for
4K/HD recording, monitoring, editing and playback.
• The Shogun Studio is suitable for high-end production including live events, outside
broadcast vehicles, production galleries, master control rooms or post-production
facilities.
• In addition to core devices, Atomos offers a range of accessories to enhance video
production including syncing multiple devices, extending battery life, improving
visibility, calibration systems and cables to connect Atomos recorders or monitors to
computers.
• Shogun Studio 2 price: US$3,699
Figure 13: Shogun Studio and accessories
Source: Company website
Shaw and Partners AMS – Equity Report – 30/04/2021 – Pg. 10
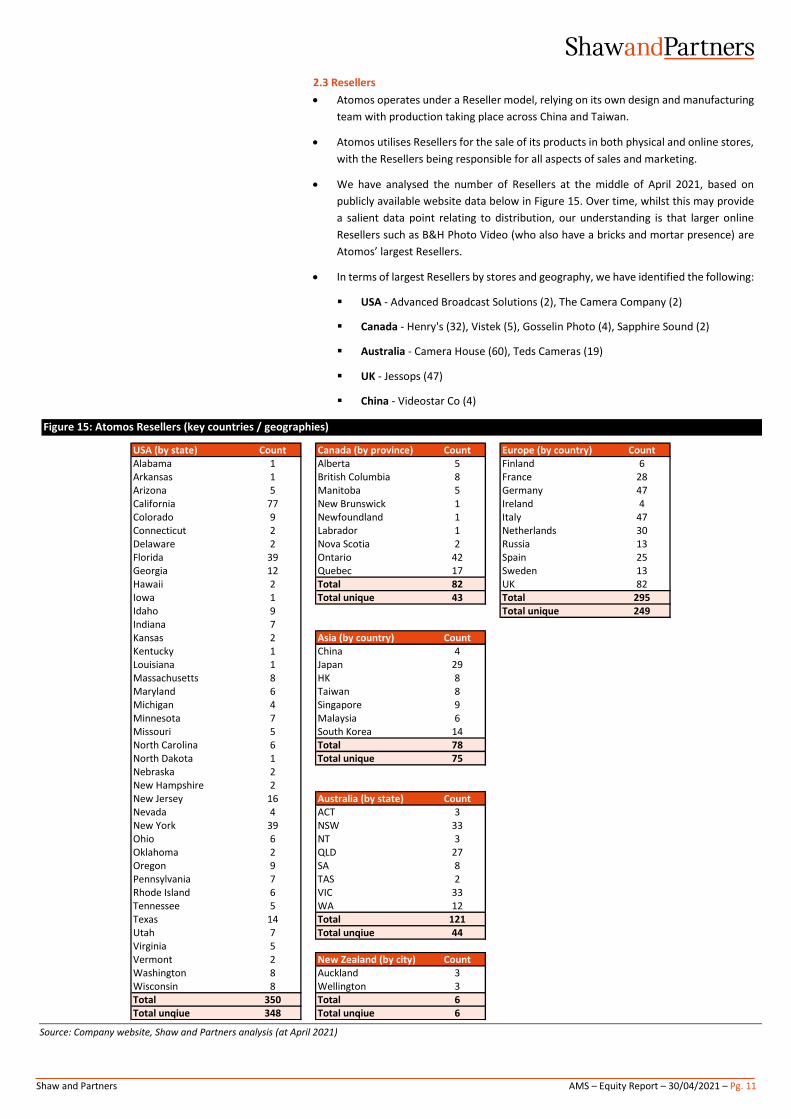
Apple ProRes RAW
• Apple ProRes RAW is a Codec which more specifically allows users to import and edit
RAW data straight from a camera sensor. A “recording format” or “Codec” refers to
the way in which a video is captured and recorded by a camera device.
• ProRes RAW is a new standard in video capture which gives content creators increased
flexibility when adjusting images for factors such as brightness and shadow detail.
• ProRes RAW is supported by HDMI (high-definition multimedia interface) and serial
digital interface (SDI) cameras.
▪ HDMI is a typically used in consumer or prosumer environment, whilst SDI is a
professional video signal preferred in production environments.
• Footage is compressed and sped up (whilst maintaining quality), whilst being fully
supported in a range of applications including Final Cut Pro, Adobe Premiere Pro and
Avid Media Composer.
Figure 14: ProRes RAW manufacturer ecosystem
Source: Company website
Shaw and Partners AMS – Equity Report – 30/04/2021 – Pg. 11
2.3 Resellers
• Atomos operates under a Reseller model, relying on its own design and manufacturing
team with production taking place across China and Taiwan.
• Atomos utilises Resellers for the sale of its products in both physical and online stores,
with the Resellers being responsible for all aspects of sales and marketing.
• We have analysed the number of Resellers at the middle of April 2021, based on
publicly available website data below in Figure 15. Over time, whilst this may provide
a salient data point relating to distribution, our understanding is that larger online
Resellers such as B&H Photo Video (who also have a bricks and mortar presence) are
Atomos’ largest Resellers.
• In terms of largest Resellers by stores and geography, we have identified the following:
▪ USA - Advanced Broadcast Solutions (2), The Camera Company (2)
▪ Canada - Henry's (32), Vistek (5), Gosselin Photo (4), Sapphire Sound (2)
▪ Australia - Camera House (60), Teds Cameras (19)
▪ UK - Jessops (47)
▪ China - Videostar Co (4)
Figure 15: Atomos Resellers (key countries / geographies)
Source: Company website, Shaw and Partners analysis (at April 2021)
USA (by state) Count Canada (by province) Count Europe (by country) CountAlabama 1 Alberta 5 Finland 6Arkansas 1 British Columbia 8 France 28Arizona 5 Manitoba 5 Germany 47California 77 New Brunswick 1 Ireland 4Colorado 9 Newfoundland 1 Italy 47Connecticut 2 Labrador 1 Netherlands 30Delaware 2 Nova Scotia 2 Russia 13Florida 39 Ontario 42 Spain 25Georgia 12 Quebec 17 Sweden 13Hawaii 2 Total 82 UK 82Iowa 1 Total unique 43 Total 295Idaho 9 Total unique 249Indiana 7Kansas 2 Asia (by country) CountKentucky 1 China 4Louisiana 1 Japan 29Massachusetts 8 HK 8Maryland 6 Taiwan 8Michigan 4 Singapore 9Minnesota 7 Malaysia 6Missouri 5 South Korea 14North Carolina 6 Total 78North Dakota 1 Total unique 75Nebraska 2New Hampshire 2New Jersey 16 Australia (by state) CountNevada 4 ACT 3New York 39 NSW 33Ohio 6 NT 3Oklahoma 2 QLD 27Oregon 9 SA 8Pennsylvania 7 TAS 2Rhode Island 6 VIC 33Tennessee 5 WA 12Texas 14 Total 121Utah 7 Total unqiue 44Virginia 5Vermont 2 New Zealand (by city) CountWashington 8 Auckland 3Wisconsin 8 Wellington 3Total 350 Total 6Total unqiue 348 Total unqiue 6
Shaw and Partners AMS – Equity Report – 30/04/2021 – Pg. 12
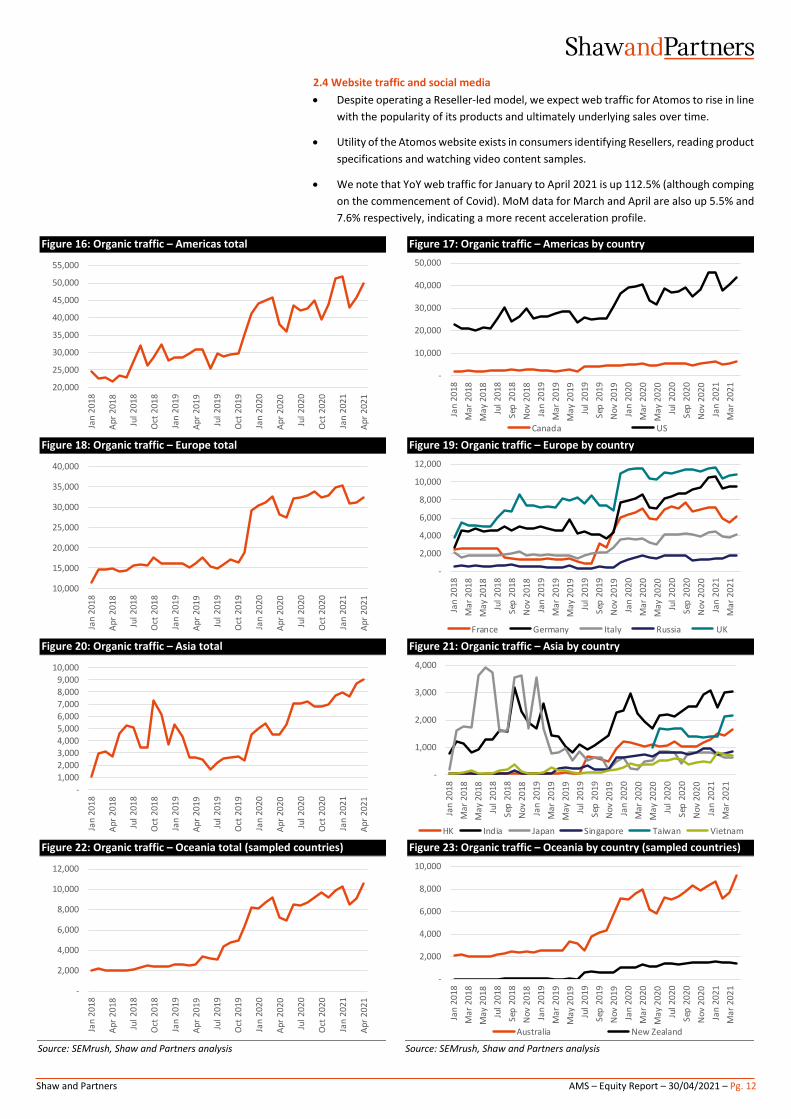
2.4 Website traffic and social media
• Despite operating a Reseller-led model, we expect web traffic for Atomos to rise in line
with the popularity of its products and ultimately underlying sales over time.
• Utility of the Atomos website exists in consumers identifying Resellers, reading product
specifications and watching video content samples.
• We note that YoY web traffic for January to April 2021 is up 112.5% (although comping
on the commencement of Covid). MoM data for March and April are also up 5.5% and
7.6% respectively, indicating a more recent acceleration profile.
Figure 16: Organic traffic – Americas total Figure 17: Organic traffic – Americas by country
Figure 18: Organic traffic – Europe total Figure 19: Organic traffic – Europe by country
Figure 20: Organic traffic – Asia total Figure 21: Organic traffic – Asia by country
Figure 22: Organic traffic – Oceania total (sampled countries) Figure 23: Organic traffic – Oceania by country (sampled countries)
Source: SEMrush, Shaw and Partners analysis Source: SEMrush, Shaw and Partners analysis
20,000
25,000
30,000
35,000
40,000
45,000
50,000
55,000
Jan
20
18
Ap
r 2
01
8
Jul 2
01
8
Oct
20
18
Jan
20
19
Ap
r 2
01
9
Jul 2
01
9
Oct
20
19
Jan
20
20
Ap
r 2
02
0
Jul 2
02
0
Oct
20
20
Jan
20
21
Ap
r 2
02
1
-
10,000
20,000
30,000
40,000
50,000
Jan
20
18
Ma
r 2
01
8
Ma
y 2
01
8
Jul
20
18
Sep
20
18
No
v 2
01
8
Jan
20
19
Ma
r 2
01
9
Ma
y 2
01
9
Jul
20
19
Sep
20
19
No
v 2
01
9
Jan
20
20
Ma
r 2
02
0
Ma
y 2
02
0
Jul
20
20
Sep
20
20
No
v 2
02
0
Jan
20
21
Ma
r 2
02
1
Canada US
10,000
15,000
20,000
25,000
30,000
35,000
40,000
Jan
20
18
Ap
r 2
01
8
Jul 2
01
8
Oct
20
18
Jan
20
19
Ap
r 2
01
9
Jul 2
01
9
Oct
20
19
Jan
20
20
Ap
r 2
02
0
Jul 2
02
0
Oct
20
20
Jan
20
21
Ap
r 2
02
1
-
2,000
4,000
6,000
8,000
10,000
12,000Ja
n 2
01
8
Ma
r 2
01
8
May
20
18
Jul
20
18
Sep
20
18
No
v 2
01
8
Jan
20
19
Ma
r 2
01
9
May
20
19
Jul
20
19
Sep
20
19
No
v 2
01
9
Jan
20
20
Ma
r 2
02
0
Ma
y 2
02
0
Jul
20
20
Sep
20
20
No
v 2
02
0
Jan
20
21
Ma
r 2
02
1
France Germany Italy Russia UK
-
1,000
2,000
3,000
4,000
5,000
6,000
7,000
8,000
9,000
10,000
Jan
20
18
Ap
r 2
01
8
Jul 2
01
8
Oct
20
18
Jan
20
19
Ap
r 2
01
9
Jul 2
01
9
Oct
20
19
Jan
20
20
Ap
r 2
02
0
Jul 2
02
0
Oct
20
20
Jan
20
21
Ap
r 2
02
1
-
1,000
2,000
3,000
4,000
Jan
20
18
Ma
r 2
01
8
Ma
y 2
01
8
Jul 2
01
8
Sep
20
18
No
v 2
01
8
Jan
20
19
Ma
r 2
01
9
Ma
y 2
01
9
Jul 2
01
9
Sep
20
19
No
v 2
01
9
Jan
20
20
Ma
r 2
02
0
Ma
y 2
02
0
Jul 2
02
0
Sep
20
20
No
v 2
02
0
Jan
20
21
Ma
r 2
02
1
HK India Japan Singapore Taiwan Vietnam
-
2,000
4,000
6,000
8,000
10,000
12,000
Jan
20
18
Ap
r 2
01
8
Jul 2
01
8
Oct
20
18
Jan
20
19
Ap
r 2
01
9
Jul 2
01
9
Oct
20
19
Jan
20
20
Ap
r 2
02
0
Jul 2
02
0
Oct
20
20
Jan
20
21
Ap
r 2
02
1
-
2,000
4,000
6,000
8,000
10,000
Jan
20
18
Ma
r 2
01
8
Ma
y 2
01
8
Jul
20
18
Sep
20
18
No
v 2
01
8
Jan
20
19
Ma
r 2
01
9
Ma
y 2
01
9
Jul
20
19
Sep
20
19
No
v 2
01
9
Jan
20
20
Ma
r 2
02
0
Ma
y 2
02
0
Jul
20
20
Sep
20
20
No
v 2
02
0
Jan
20
21
Ma
r 2
02
1
Australia New Zealand
Shaw and Partners AMS – Equity Report – 30/04/2021 – Pg. 13
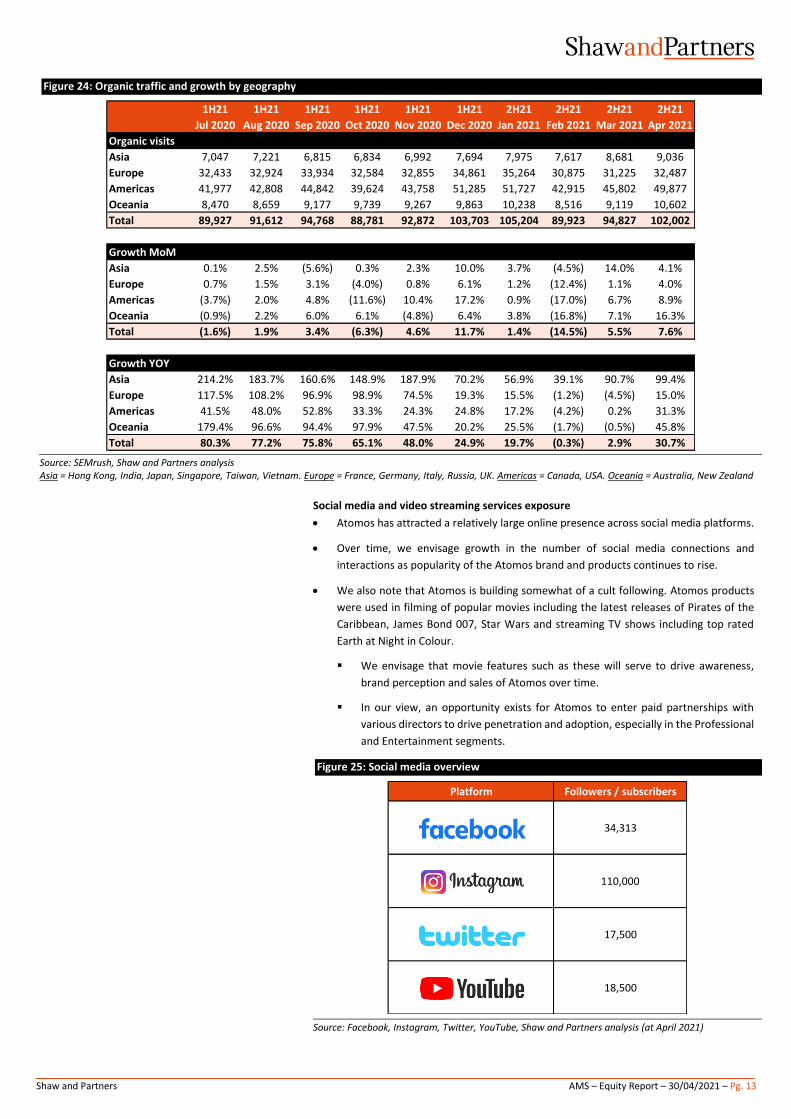
Figure 24: Organic traffic and growth by geography
Source: SEMrush, Shaw and Partners analysis Asia = Hong Kong, India, Japan, Singapore, Taiwan, Vietnam. Europe = France, Germany, Italy, Russia, UK. Americas = Canada, USA. Oceania = Australia, New Zealand
Social media and video streaming services exposure
• Atomos has attracted a relatively large online presence across social media platforms.
• Over time, we envisage growth in the number of social media connections and
interactions as popularity of the Atomos brand and products continues to rise.
• We also note that Atomos is building somewhat of a cult following. Atomos products
were used in filming of popular movies including the latest releases of Pirates of the
Caribbean, James Bond 007, Star Wars and streaming TV shows including top rated
Earth at Night in Colour.
▪ We envisage that movie features such as these will serve to drive awareness,
brand perception and sales of Atomos over time.
▪ In our view, an opportunity exists for Atomos to enter paid partnerships with
various directors to drive penetration and adoption, especially in the Professional
and Entertainment segments.
Figure 25: Social media overview
Source: Facebook, Instagram, Twitter, YouTube, Shaw and Partners analysis (at April 2021)
1H21 1H21 1H21 1H21 1H21 1H21 2H21 2H21 2H21 2H21
Jul 2020 Aug 2020 Sep 2020 Oct 2020 Nov 2020 Dec 2020 Jan 2021 Feb 2021 Mar 2021 Apr 2021
Organic visits
Asia 7,047 7,221 6,815 6,834 6,992 7,694 7,975 7,617 8,681 9,036
Europe 32,433 32,924 33,934 32,584 32,855 34,861 35,264 30,875 31,225 32,487
Americas 41,977 42,808 44,842 39,624 43,758 51,285 51,727 42,915 45,802 49,877
Oceania 8,470 8,659 9,177 9,739 9,267 9,863 10,238 8,516 9,119 10,602
Total 89,927 91,612 94,768 88,781 92,872 103,703 105,204 89,923 94,827 102,002
Growth MoM
Asia 0.1% 2.5% (5.6%) 0.3% 2.3% 10.0% 3.7% (4.5%) 14.0% 4.1%
Europe 0.7% 1.5% 3.1% (4.0%) 0.8% 6.1% 1.2% (12.4%) 1.1% 4.0%
Americas (3.7%) 2.0% 4.8% (11.6%) 10.4% 17.2% 0.9% (17.0%) 6.7% 8.9%
Oceania (0.9%) 2.2% 6.0% 6.1% (4.8%) 6.4% 3.8% (16.8%) 7.1% 16.3%
Total (1.6%) 1.9% 3.4% (6.3%) 4.6% 11.7% 1.4% (14.5%) 5.5% 7.6%
Growth YOY
Asia 214.2% 183.7% 160.6% 148.9% 187.9% 70.2% 56.9% 39.1% 90.7% 99.4%
Europe 117.5% 108.2% 96.9% 98.9% 74.5% 19.3% 15.5% (1.2%) (4.5%) 15.0%
Americas 41.5% 48.0% 52.8% 33.3% 24.3% 24.8% 17.2% (4.2%) 0.2% 31.3%
Oceania 179.4% 96.6% 94.4% 97.9% 47.5% 20.2% 25.5% (1.7%) (0.5%) 45.8%
Total 80.3% 77.2% 75.8% 65.1% 48.0% 24.9% 19.7% (0.3%) 2.9% 30.7%
Platform Followers / subscribers
34,313
110,000
17,500
18,500
Shaw and Partners AMS – Equity Report – 30/04/2021 – Pg. 14
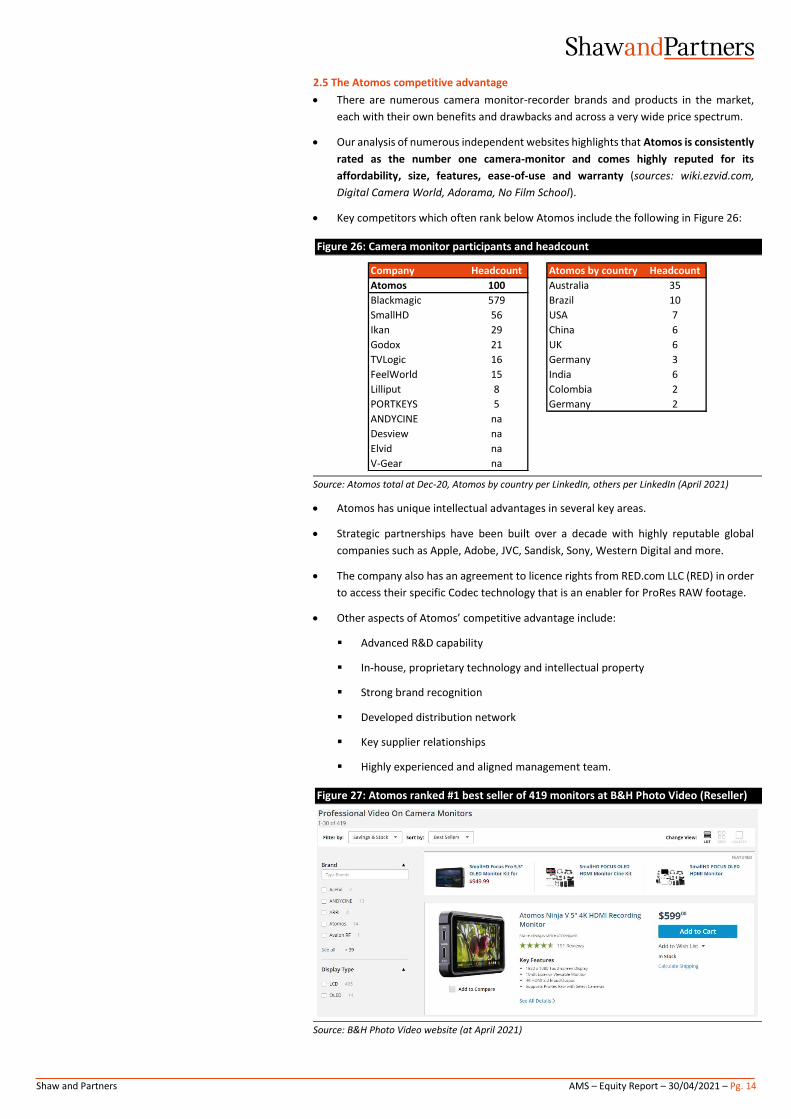
2.5 The Atomos competitive advantage
• There are numerous camera monitor-recorder brands and products in the market,
each with their own benefits and drawbacks and across a very wide price spectrum.
• Our analysis of numerous independent websites highlights that Atomos is consistently
rated as the number one camera-monitor and comes highly reputed for its
affordability, size, features, ease-of-use and warranty (sources: wiki.ezvid.com,
Digital Camera World, Adorama, No Film School).
• Key competitors which often rank below Atomos include the following in Figure 26:
Figure 26: Camera monitor participants and headcount
Source: Atomos total at Dec-20, Atomos by country per LinkedIn, others per LinkedIn (April 2021)
• Atomos has unique intellectual advantages in several key areas.
• Strategic partnerships have been built over a decade with highly reputable global
companies such as Apple, Adobe, JVC, Sandisk, Sony, Western Digital and more.
• The company also has an agreement to licence rights from RED.com LLC (RED) in order
to access their specific Codec technology that is an enabler for ProRes RAW footage.
• Other aspects of Atomos’ competitive advantage include:
▪ Advanced R&D capability
▪ In-house, proprietary technology and intellectual property
▪ Strong brand recognition
▪ Developed distribution network
▪ Key supplier relationships
▪ Highly experienced and aligned management team.
Figure 27: Atomos ranked #1 best seller of 419 monitors at B&H Photo Video (Reseller)
Source: B&H Photo Video website (at April 2021)
Company Headcount Atomos by country Headcount
Atomos 100 Australia 35
Blackmagic 579 Brazil 10
SmallHD 56 USA 7
Ikan 29 China 6
Godox 21 UK 6
TVLogic 16 Germany 3
FeelWorld 15 India 6
Lilliput 8 Colombia 2
PORTKEYS 5 Germany 2
ANDYCINE na
Desview na
Elvid na
V-Gear na
Shaw and Partners AMS – Equity Report – 30/04/2021 – Pg. 15
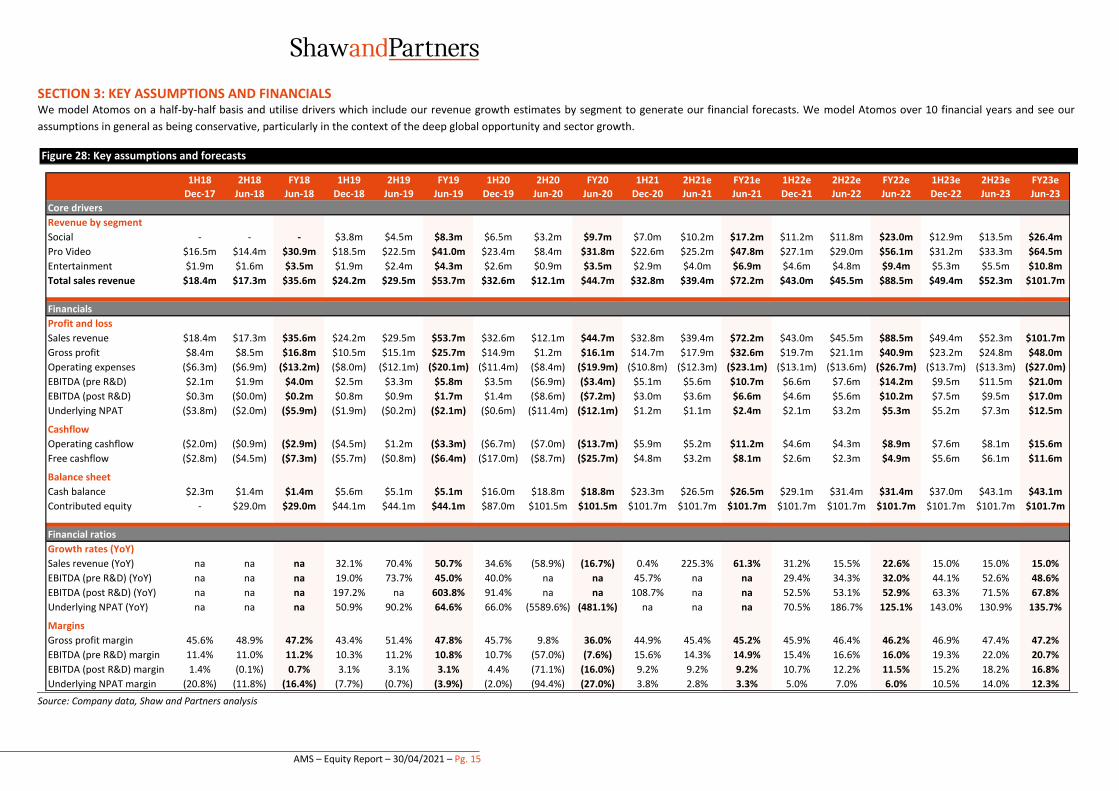
SECTION 3: KEY ASSUMPTIONS AND FINANCIALS We model Atomos on a half-by-half basis and utilise drivers which include our revenue growth estimates by segment to generate our financial forecasts. We model Atomos over 10 financial years and see our
assumptions in general as being conservative, particularly in the context of the deep global opportunity and sector growth.
Figure 28: Key assumptions and forecasts
Source: Company data, Shaw and Partners analysis
1H18 2H18 FY18 1H19 2H19 FY19 1H20 2H20 FY20 1H21 2H21e FY21e 1H22e 2H22e FY22e 1H23e 2H23e FY23e
Dec-17 Jun-18 Jun-18 Dec-18 Jun-19 Jun-19 Dec-19 Jun-20 Jun-20 Dec-20 Jun-21 Jun-21 Dec-21 Jun-22 Jun-22 Dec-22 Jun-23 Jun-23
Core drivers
Revenue by segment
Social - - - $3.8m $4.5m $8.3m $6.5m $3.2m $9.7m $7.0m $10.2m $17.2m $11.2m $11.8m $23.0m $12.9m $13.5m $26.4m
Pro Video $16.5m $14.4m $30.9m $18.5m $22.5m $41.0m $23.4m $8.4m $31.8m $22.6m $25.2m $47.8m $27.1m $29.0m $56.1m $31.2m $33.3m $64.5m
Entertainment $1.9m $1.6m $3.5m $1.9m $2.4m $4.3m $2.6m $0.9m $3.5m $2.9m $4.0m $6.9m $4.6m $4.8m $9.4m $5.3m $5.5m $10.8m
Total sales revenue $18.4m $17.3m $35.6m $24.2m $29.5m $53.7m $32.6m $12.1m $44.7m $32.8m $39.4m $72.2m $43.0m $45.5m $88.5m $49.4m $52.3m $101.7m
Financials
Profit and loss
Sales revenue $18.4m $17.3m $35.6m $24.2m $29.5m $53.7m $32.6m $12.1m $44.7m $32.8m $39.4m $72.2m $43.0m $45.5m $88.5m $49.4m $52.3m $101.7m
Gross profit $8.4m $8.5m $16.8m $10.5m $15.1m $25.7m $14.9m $1.2m $16.1m $14.7m $17.9m $32.6m $19.7m $21.1m $40.9m $23.2m $24.8m $48.0m
Operating expenses ($6.3m) ($6.9m) ($13.2m) ($8.0m) ($12.1m) ($20.1m) ($11.4m) ($8.4m) ($19.9m) ($10.8m) ($12.3m) ($23.1m) ($13.1m) ($13.6m) ($26.7m) ($13.7m) ($13.3m) ($27.0m)
EBITDA (pre R&D) $2.1m $1.9m $4.0m $2.5m $3.3m $5.8m $3.5m ($6.9m) ($3.4m) $5.1m $5.6m $10.7m $6.6m $7.6m $14.2m $9.5m $11.5m $21.0m
EBITDA (post R&D) $0.3m ($0.0m) $0.2m $0.8m $0.9m $1.7m $1.4m ($8.6m) ($7.2m) $3.0m $3.6m $6.6m $4.6m $5.6m $10.2m $7.5m $9.5m $17.0m
Underlying NPAT ($3.8m) ($2.0m) ($5.9m) ($1.9m) ($0.2m) ($2.1m) ($0.6m) ($11.4m) ($12.1m) $1.2m $1.1m $2.4m $2.1m $3.2m $5.3m $5.2m $7.3m $12.5m
Cashflow
Operating cashflow ($2.0m) ($0.9m) ($2.9m) ($4.5m) $1.2m ($3.3m) ($6.7m) ($7.0m) ($13.7m) $5.9m $5.2m $11.2m $4.6m $4.3m $8.9m $7.6m $8.1m $15.6m
Free cashflow ($2.8m) ($4.5m) ($7.3m) ($5.7m) ($0.8m) ($6.4m) ($17.0m) ($8.7m) ($25.7m) $4.8m $3.2m $8.1m $2.6m $2.3m $4.9m $5.6m $6.1m $11.6m
Balance sheet
Cash balance $2.3m $1.4m $1.4m $5.6m $5.1m $5.1m $16.0m $18.8m $18.8m $23.3m $26.5m $26.5m $29.1m $31.4m $31.4m $37.0m $43.1m $43.1m
Contributed equity - $29.0m $29.0m $44.1m $44.1m $44.1m $87.0m $101.5m $101.5m $101.7m $101.7m $101.7m $101.7m $101.7m $101.7m $101.7m $101.7m $101.7m
Financial ratios
Growth rates (YoY)
Sales revenue (YoY) na na na 32.1% 70.4% 50.7% 34.6% (58.9%) (16.7%) 0.4% 225.3% 61.3% 31.2% 15.5% 22.6% 15.0% 15.0% 15.0%
EBITDA (pre R&D) (YoY) na na na 19.0% 73.7% 45.0% 40.0% na na 45.7% na na 29.4% 34.3% 32.0% 44.1% 52.6% 48.6%
EBITDA (post R&D) (YoY) na na na 197.2% na 603.8% 91.4% na na 108.7% na na 52.5% 53.1% 52.9% 63.3% 71.5% 67.8%
Underlying NPAT (YoY) na na na 50.9% 90.2% 64.6% 66.0% (5589.6%) (481.1%) na na na 70.5% 186.7% 125.1% 143.0% 130.9% 135.7%
Margins
Gross profit margin 45.6% 48.9% 47.2% 43.4% 51.4% 47.8% 45.7% 9.8% 36.0% 44.9% 45.4% 45.2% 45.9% 46.4% 46.2% 46.9% 47.4% 47.2%
EBITDA (pre R&D) margin 11.4% 11.0% 11.2% 10.3% 11.2% 10.8% 10.7% (57.0%) (7.6%) 15.6% 14.3% 14.9% 15.4% 16.6% 16.0% 19.3% 22.0% 20.7%
EBITDA (post R&D) margin 1.4% (0.1%) 0.7% 3.1% 3.1% 3.1% 4.4% (71.1%) (16.0%) 9.2% 9.2% 9.2% 10.7% 12.2% 11.5% 15.2% 18.2% 16.8%
Underlying NPAT margin (20.8%) (11.8%) (16.4%) (7.7%) (0.7%) (3.9%) (2.0%) (94.4%) (27.0%) 3.8% 2.8% 3.3% 5.0% 7.0% 6.0% 10.5% 14.0% 12.3%
Shaw and Partners AMS – Equity Report current as at –30/04/2021–Pg. 16
3.1 Revenue segments and regions
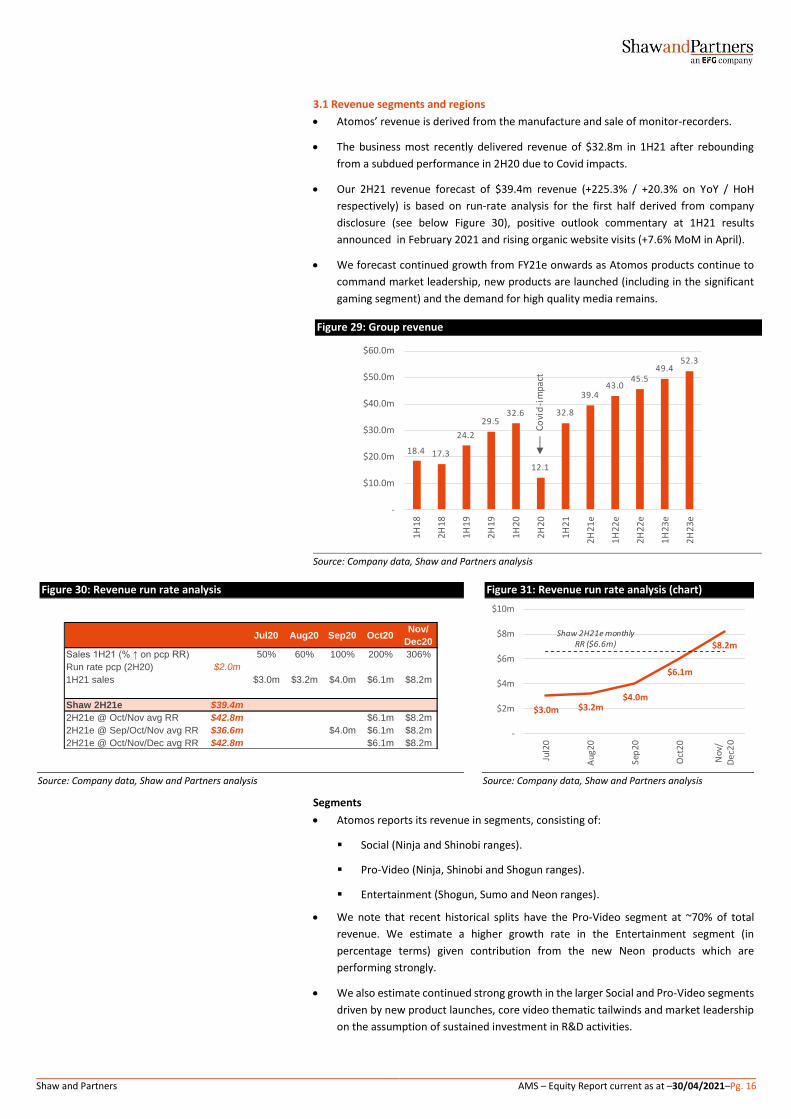
• Atomos’ revenue is derived from the manufacture and sale of monitor-recorders.
• The business most recently delivered revenue of $32.8m in 1H21 after rebounding
from a subdued performance in 2H20 due to Covid impacts.
• Our 2H21 revenue forecast of $39.4m revenue (+225.3% / +20.3% on YoY / HoH
respectively) is based on run-rate analysis for the first half derived from company
disclosure (see below Figure 30), positive outlook commentary at 1H21 results
announced in February 2021 and rising organic website visits (+7.6% MoM in April).
• We forecast continued growth from FY21e onwards as Atomos products continue to
command market leadership, new products are launched (including in the significant
gaming segment) and the demand for high quality media remains.
Figure 29: Group revenue
Source: Company data, Shaw and Partners analysis
Figure 30: Revenue run rate analysis Figure 31: Revenue run rate analysis (chart)
Source: Company data, Shaw and Partners analysis Source: Company data, Shaw and Partners analysis
Segments
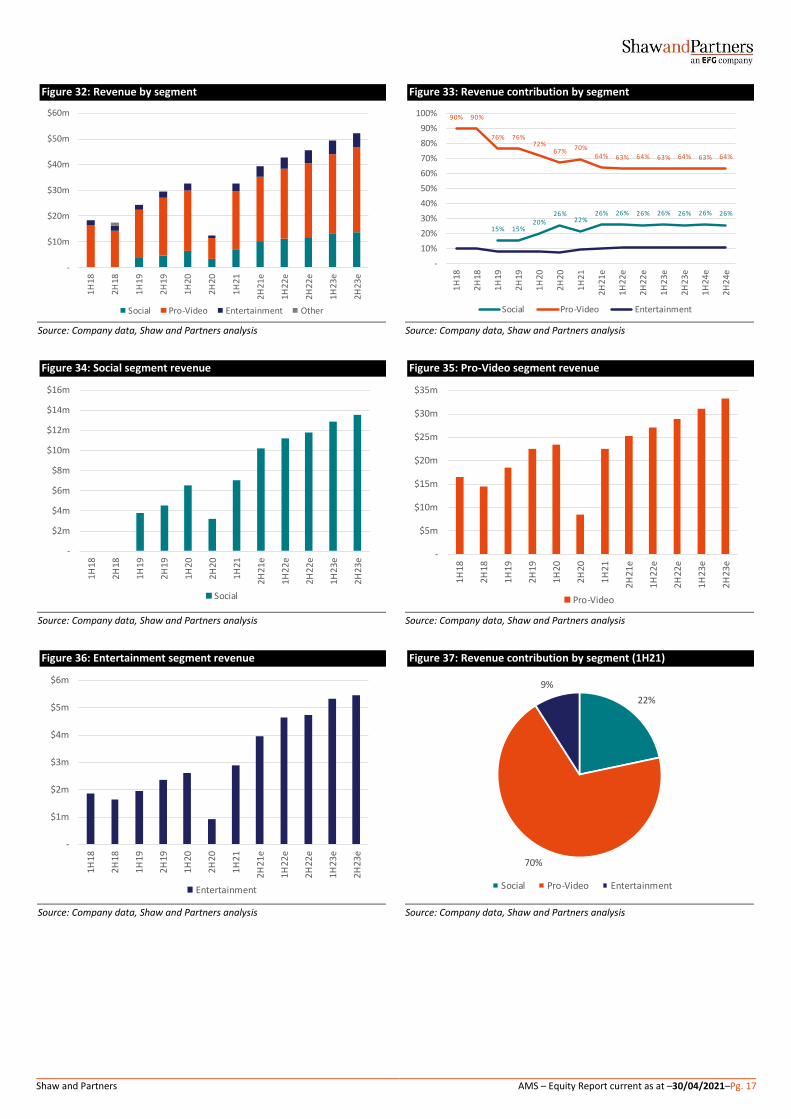
• Atomos reports its revenue in segments, consisting of:
▪ Social (Ninja and Shinobi ranges).
▪ Pro-Video (Ninja, Shinobi and Shogun ranges).
▪ Entertainment (Shogun, Sumo and Neon ranges).
• We note that recent historical splits have the Pro-Video segment at ~70% of total
revenue. We estimate a higher growth rate in the Entertainment segment (in
percentage terms) given contribution from the new Neon products which are
performing strongly.
• We also estimate continued strong growth in the larger Social and Pro-Video segments
driven by new product launches, core video thematic tailwinds and market leadership
on the assumption of sustained investment in R&D activities.
18.4 17.3
24.2
29.532.6
12.1
32.8
39.443.0
45.549.4
52.3
-
$10.0m
$20.0m
$30.0m
$40.0m
$50.0m
$60.0m
1H18
2H18
1H19
2H19
1H20
2H20
1H21
2H21
e
1H22
e
2H22
e
1H23
e
2H23
e
Covi
d-i
mpa
ct
Jul20 Aug20 Sep20 Oct20Nov/
Dec20
Sales 1H21 (% ↑ on pcp RR) 50% 60% 100% 200% 306%
Run rate pcp (2H20) $2.0m
1H21 sales $3.0m $3.2m $4.0m $6.1m $8.2m
Shaw 2H21e $39.4m
2H21e @ Oct/Nov avg RR $42.8m $6.1m $8.2m
2H21e @ Sep/Oct/Nov avg RR $36.6m $4.0m $6.1m $8.2m
2H21e @ Oct/Nov/Dec avg RR $42.8m $6.1m $8.2m
$3.0m $3.2m$4.0m
$6.1m
$8.2mShaw 2H21e monthly
RR ($6.6m)
-
$2m
$4m
$6m
$8m
$10m
Jul2
0
Au
g20
Sep
20
Oct
20
No
v/D
ec2
0
Shaw and Partners AMS – Equity Report current as at –30/04/2021–Pg. 17
Figure 32: Revenue by segment Figure 33: Revenue contribution by segment
Source: Company data, Shaw and Partners analysis Source: Company data, Shaw and Partners analysis
Figure 34: Social segment revenue Figure 35: Pro-Video segment revenue
Source: Company data, Shaw and Partners analysis Source: Company data, Shaw and Partners analysis
Figure 36: Entertainment segment revenue Figure 37: Revenue contribution by segment (1H21)
Source: Company data, Shaw and Partners analysis Source: Company data, Shaw and Partners analysis
-
$10m
$20m
$30m
$40m
$50m
$60m
1H
18
2H
18
1H
19
2H
19
1H
20
2H
20
1H
21
2H
21
e
1H
22
e
2H
22
e
1H
23
e
2H
23
e
Social Pro-Video Entertainment Other
15% 15%20%
26%22%
26% 26% 26% 26% 26% 26% 26%
90% 90%
76% 76%72%
67% 70%64% 63% 64% 63% 64% 63% 64%
-
10%
20%
30%
40%
50%
60%
70%
80%
90%
100%
1H
18
2H
18
1H
19
2H
19
1H
20
2H
20
1H
21
2H
21
e
1H
22
e
2H
22
e
1H
23
e
2H
23
e
1H
24
e
2H
24
e
Social Pro-Video Entertainment
-
$2m
$4m
$6m
$8m
$10m
$12m
$14m
$16m
1H
18
2H
18
1H
19
2H
19
1H
20
2H
20
1H
21
2H
21
e
1H
22
e
2H
22
e
1H
23
e
2H
23
e
Social
-
$5m
$10m
$15m
$20m
$25m
$30m
$35m
1H
18
2H
18
1H
19
2H
19
1H
20
2H
20
1H
21
2H
21
e
1H
22
e
2H
22
e
1H
23
e
2H
23
e
Pro-Video
-
$1m
$2m
$3m
$4m
$5m
$6m
1H
18
2H
18
1H
19
2H
19
1H
20
2H
20
1H
21
2H
21
e
1H
22
e
2H
22
e
1H
23
e
2H
23
e
Entertainment
22%
70%
9%
Social Pro-Video Entertainment
Shaw and Partners AMS – Equity Report current as at –30/04/2021–Pg. 18
Regions
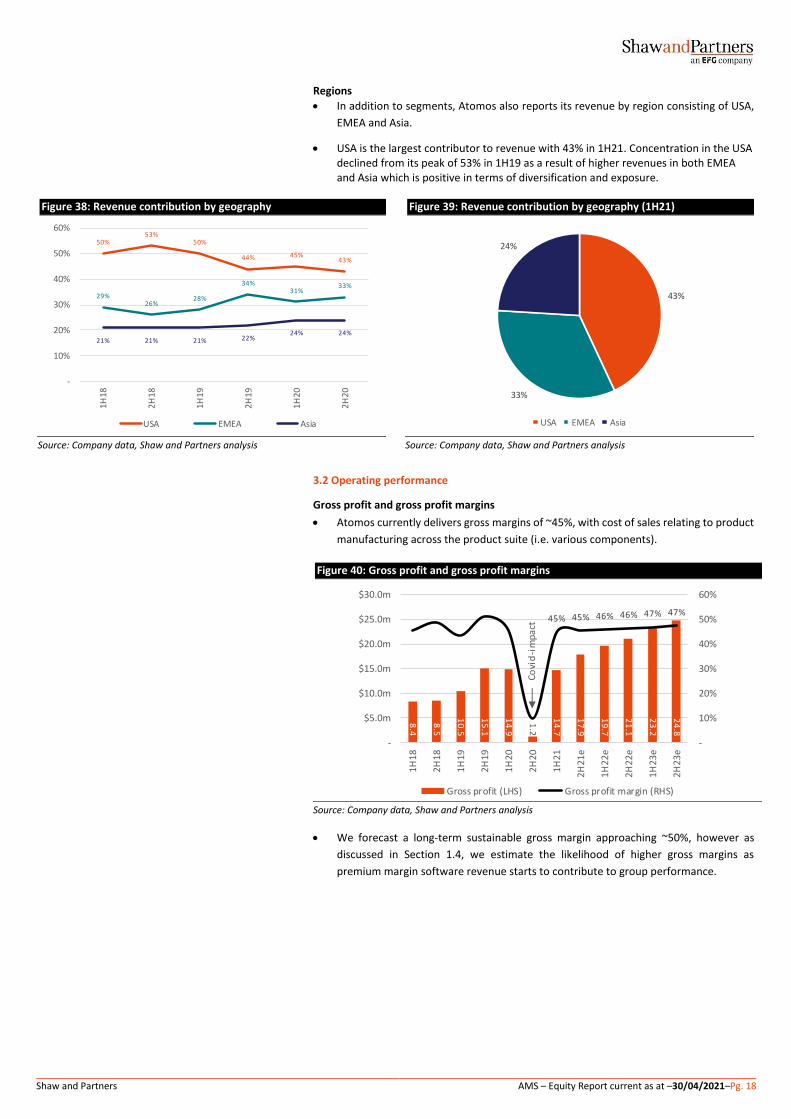
• In addition to segments, Atomos also reports its revenue by region consisting of USA,
EMEA and Asia.
• USA is the largest contributor to revenue with 43% in 1H21. Concentration in the USA declined from its peak of 53% in 1H19 as a result of higher revenues in both EMEA and Asia which is positive in terms of diversification and exposure.
Figure 38: Revenue contribution by geography Figure 39: Revenue contribution by geography (1H21)
Source: Company data, Shaw and Partners analysis Source: Company data, Shaw and Partners analysis
3.2 Operating performance
Gross profit and gross profit margins
• Atomos currently delivers gross margins of ~45%, with cost of sales relating to product
manufacturing across the product suite (i.e. various components).
Figure 40: Gross profit and gross profit margins
Source: Company data, Shaw and Partners analysis
• We forecast a long-term sustainable gross margin approaching ~50%, however as
discussed in Section 1.4, we estimate the likelihood of higher gross margins as
premium margin software revenue starts to contribute to group performance.
50%53%
50%
44% 45%43%
29%26%
28%
34%31%
33%
21% 21% 21% 22%24% 24%
-
10%
20%
30%
40%
50%
60%
1H
18
2H
18
1H
19
2H
19
1H
20
2H
20
USA EMEA Asia
43%
33%
24%
USA EMEA Asia
8.4
8.5
10
.5
15
.1
14
.9
1.2
14
.7
17
.9
19
.7
21
.1
23
.2
24
.8
45% 45% 46% 46% 47% 47%
-
10%
20%
30%
40%
50%
60%
-
$5.0m
$10.0m
$15.0m
$20.0m
$25.0m
$30.0m
1H18
2H18
1H
19
2H19
1H20
2H20
1H21
2H21
e
1H22
e
2H22
e
1H23
e
2H23
e
Gross profit (LHS) Gross profit margin (RHS)
Covi
d-i
mpa
ct
Shaw and Partners AMS – Equity Report current as at –30/04/2021–Pg. 19
Operating expenses and EBITDA
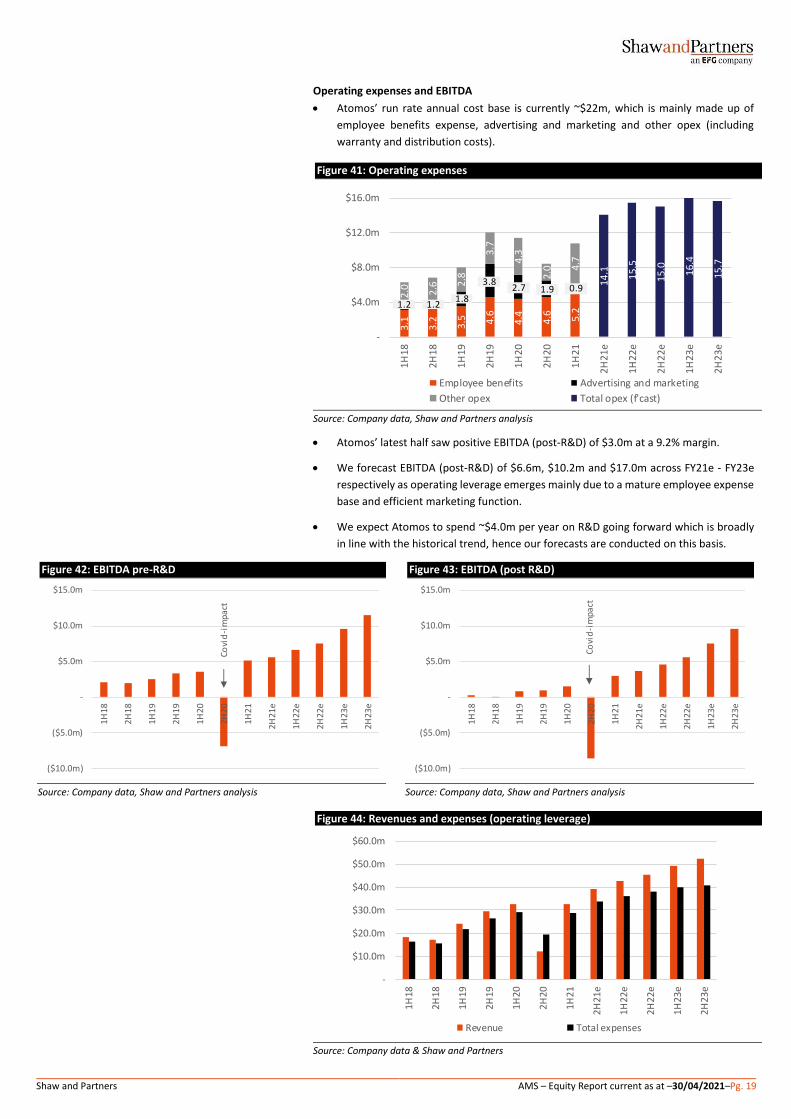
• Atomos’ run rate annual cost base is currently ~$22m, which is mainly made up of
employee benefits expense, advertising and marketing and other opex (including
warranty and distribution costs).
Figure 41: Operating expenses
Source: Company data, Shaw and Partners analysis
• Atomos’ latest half saw positive EBITDA (post-R&D) of $3.0m at a 9.2% margin.
• We forecast EBITDA (post-R&D) of $6.6m, $10.2m and $17.0m across FY21e - FY23e
respectively as operating leverage emerges mainly due to a mature employee expense
base and efficient marketing function.
• We expect Atomos to spend ~$4.0m per year on R&D going forward which is broadly
in line with the historical trend, hence our forecasts are conducted on this basis.
Figure 42: EBITDA pre-R&D Figure 43: EBITDA (post R&D)
Source: Company data, Shaw and Partners analysis Source: Company data, Shaw and Partners analysis
Figure 44: Revenues and expenses (operating leverage)
Source: Company data & Shaw and Partners
3.1 3.2 3.5 4.6
4.4 4.6 5.2
2.0 2.6 2
.8
3.7
4.3
2.0 4.
7
14
.1 15
.5
15.0 16
.4
15
.7
-
$4.0m
$8.0m
$12.0m
$16.0m
1H
18
2H
18
1H
19
2H
19
1H
20
2H
20
1H
21
2H
21
e
1H
22
e
2H
22
e
1H
23
e
2H
23
e
Employee benefits Advertising and marketing
Other opex Total opex (f'cast)
1.2 1.21.8
3.82.7 1.9 0.9
($10.0m)
($5.0m)
-
$5.0m
$10.0m
$15.0m
1H18
2H18
1H19
2H19
1H20
2H20
1H21
2H21
e
1H22
e
2H22
e
1H23
e
2H23
e
Covi
d-i
mpa
ct
($10.0m)
($5.0m)
-
$5.0m
$10.0m
$15.0m
1H
18
2H18
1H19
2H19
1H20
2H20
1H21
2H21
e
1H22
e
2H22
e
1H23
e
2H
23
e
Co
vid
-im
pa
ct
-
$10.0m
$20.0m
$30.0m
$40.0m
$50.0m
$60.0m
1H18
2H18
1H19
2H19
1H20
2H20
1H21
2H21
e
1H22
e
2H22
e
1H23
e
2H23
e
Revenue Total expenses
Shaw and Partners AMS – Equity Report current as at –30/04/2021–Pg. 20
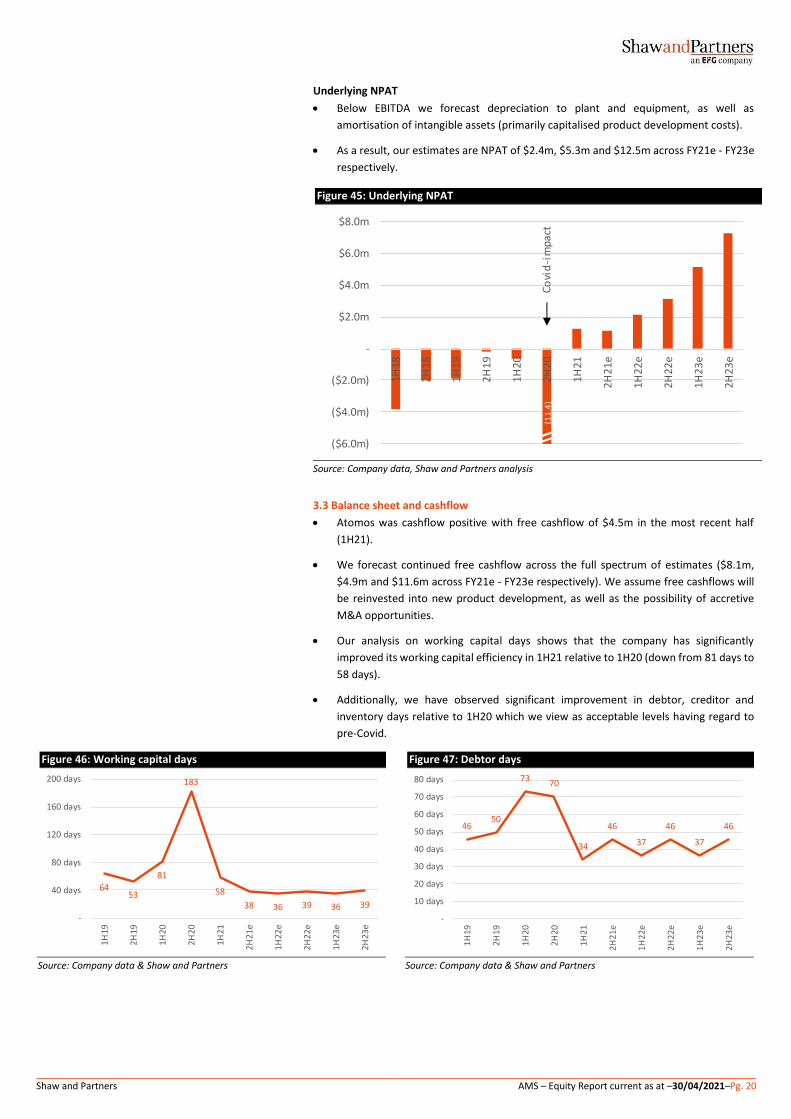
Underlying NPAT
• Below EBITDA we forecast depreciation to plant and equipment, as well as
amortisation of intangible assets (primarily capitalised product development costs).
• As a result, our estimates are NPAT of $2.4m, $5.3m and $12.5m across FY21e - FY23e
respectively.
Figure 45: Underlying NPAT
Source: Company data, Shaw and Partners analysis
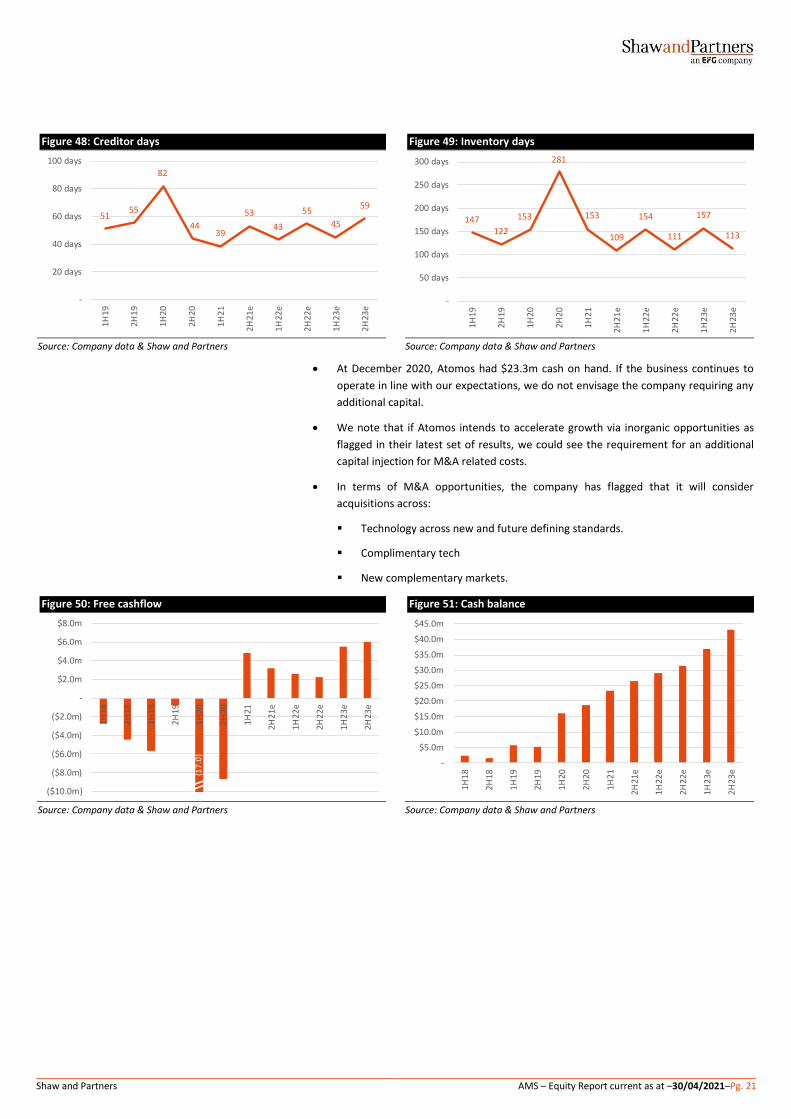
3.3 Balance sheet and cashflow
• Atomos was cashflow positive with free cashflow of $4.5m in the most recent half
(1H21).
• We forecast continued free cashflow across the full spectrum of estimates ($8.1m,
$4.9m and $11.6m across FY21e - FY23e respectively). We assume free cashflows will
be reinvested into new product development, as well as the possibility of accretive
M&A opportunities.
• Our analysis on working capital days shows that the company has significantly
improved its working capital efficiency in 1H21 relative to 1H20 (down from 81 days to
58 days).
• Additionally, we have observed significant improvement in debtor, creditor and
inventory days relative to 1H20 which we view as acceptable levels having regard to
pre-Covid.
Figure 46: Working capital days Figure 47: Debtor days
Source: Company data & Shaw and Partners Source: Company data & Shaw and Partners
(11
.4)
($6.0m)
($4.0m)
($2.0m)
-
$2.0m
$4.0m
$6.0m
$8.0m
1H18
2H18
1H19
2H19
1H20
2H20
1H21
2H
21
e
1H
22
e
2H
22
e
1H
23
e
2H
23
e
Covi
d-i
mpa
ct
6453
81
183
58
38 36 39 36 39
-
40 days
80 days
120 days
160 days
200 days
1H
19
2H
19
1H
20
2H
20
1H
21
2H
21
e
1H
22
e
2H
22
e
1H
23
e
2H
23
e
4650
7370
34
46
37
46
37
46
-
10 days
20 days
30 days
40 days
50 days
60 days
70 days
80 days
1H
19
2H
19
1H
20
2H
20
1H
21
2H
21
e
1H
22
e
2H
22
e
1H
23
e
2H
23
e
Shaw and Partners AMS – Equity Report current as at –30/04/2021–Pg. 21
Figure 48: Creditor days Figure 49: Inventory days
Source: Company data & Shaw and Partners Source: Company data & Shaw and Partners
• At December 2020, Atomos had $23.3m cash on hand. If the business continues to
operate in line with our expectations, we do not envisage the company requiring any
additional capital.
• We note that if Atomos intends to accelerate growth via inorganic opportunities as
flagged in their latest set of results, we could see the requirement for an additional
capital injection for M&A related costs.
• In terms of M&A opportunities, the company has flagged that it will consider
acquisitions across:
▪ Technology across new and future defining standards.
▪ Complimentary tech
▪ New complementary markets.
Figure 50: Free cashflow Figure 51: Cash balance
Source: Company data & Shaw and Partners Source: Company data & Shaw and Partners
5155
82
4439
53
43
55
45
59
-
20 days
40 days
60 days
80 days
100 days
1H
19
2H
19
1H
20
2H
20
1H
21
2H
21
e
1H
22
e
2H
22
e
1H
23
e
2H
23
e
147122
153
281
153
109
154
111
157
113
-
50 days
100 days
150 days
200 days
250 days
300 days
1H
19
2H
19
1H
20
2H
20
1H
21
2H
21
e
1H
22
e
2H
22
e
1H
23
e
2H
23
e
(17
.0)
($10.0m)
($8.0m)
($6.0m)
($4.0m)
($2.0m)
-
$2.0m
$4.0m
$6.0m
$8.0m
1H
18
2H
18
1H
19
2H
19
1H
20
2H
20
1H
21
2H
21
e
1H
22
e
2H
22
e
1H
23
e
2H
23
e
-
$5.0m
$10.0m
$15.0m
$20.0m
$25.0m
$30.0m
$35.0m
$40.0m
$45.0m
1H
18
2H
18
1H
19
2H
19
1H
20
2H
20
1H
21
2H
21
e
1H
22
e
2H
22
e
1H
23
e
2H
23
e
Shaw and Partners AMS – Equity Report current as at –30/04/2021–Pg. 22
SECTION 4: THE BOOMING VIDEO AND CONTENT INDUSTRY • Atomos operates in the camera monitor-recorder and accessories space via sales to
content creators across social media, YouTube, TV and cinema globally.
• The company’s largest markets and focus include USA, Europe and APAC (43% USA,
33% EMEA and 24% Asia at 1H21). USA represents the fastest growing market for
Atomos and is broadly dominating the opportunity for the company.
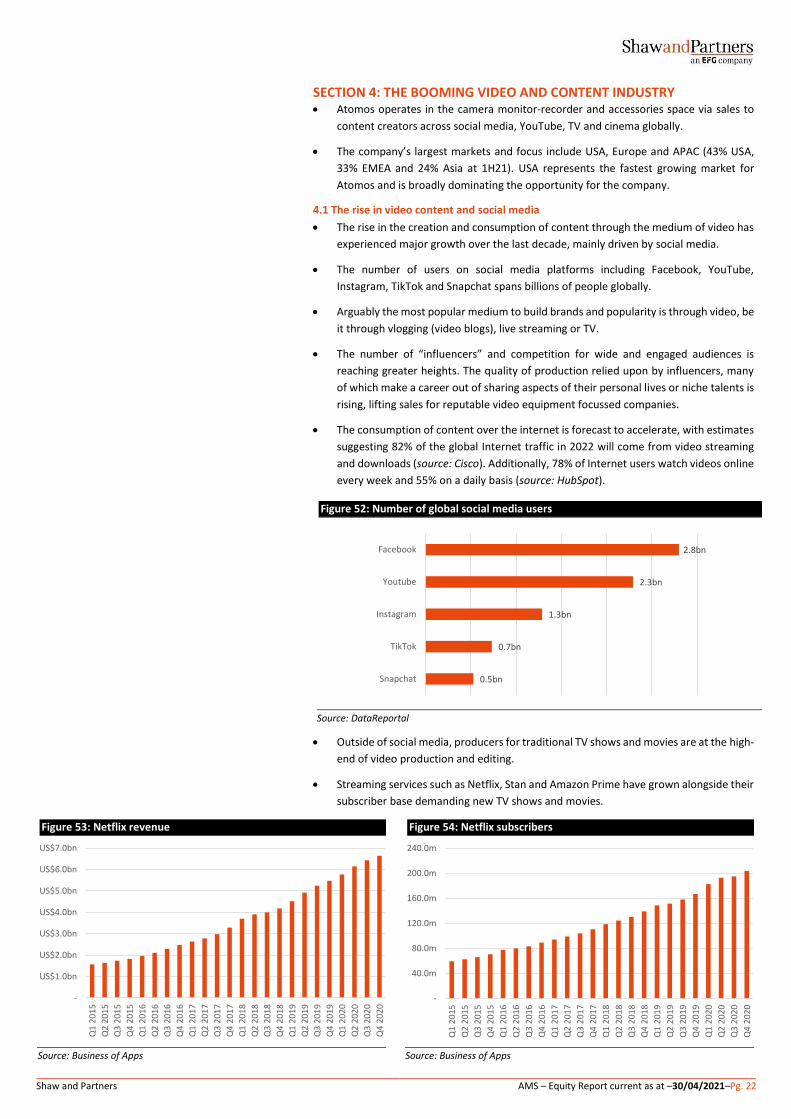
4.1 The rise in video content and social media
• The rise in the creation and consumption of content through the medium of video has
experienced major growth over the last decade, mainly driven by social media.
• The number of users on social media platforms including Facebook, YouTube,
Instagram, TikTok and Snapchat spans billions of people globally.
• Arguably the most popular medium to build brands and popularity is through video, be
it through vlogging (video blogs), live streaming or TV.
• The number of “influencers” and competition for wide and engaged audiences is
reaching greater heights. The quality of production relied upon by influencers, many
of which make a career out of sharing aspects of their personal lives or niche talents is
rising, lifting sales for reputable video equipment focussed companies.
• The consumption of content over the internet is forecast to accelerate, with estimates
suggesting 82% of the global Internet traffic in 2022 will come from video streaming
and downloads (source: Cisco). Additionally, 78% of Internet users watch videos online
every week and 55% on a daily basis (source: HubSpot).
Figure 52: Number of global social media users
Source: DataReportal
• Outside of social media, producers for traditional TV shows and movies are at the high-
end of video production and editing.
• Streaming services such as Netflix, Stan and Amazon Prime have grown alongside their
subscriber base demanding new TV shows and movies.
Figure 53: Netflix revenue Figure 54: Netflix subscribers
Source: Business of Apps Source: Business of Apps
2.8bn
2.3bn
1.3bn
0.7bn
0.5bn
Youtube
TikTok
Snapchat
-
US$1.0bn
US$2.0bn
US$3.0bn
US$4.0bn
US$5.0bn
US$6.0bn
US$7.0bn
Q1
20
15
Q2
20
15
Q3
20
15
Q4
20
15
Q1
20
16
Q2
20
16
Q3
20
16
Q4
20
16
Q1
20
17
Q2
20
17
Q3
20
17
Q4
20
17
Q1
20
18
Q2
20
18
Q3
20
18
Q4
20
18
Q1
20
19
Q2
20
19
Q3
20
19
Q4
20
19
Q1
20
20
Q2
20
20
Q3
20
20
Q4
20
20
-
40.0m
80.0m
120.0m
160.0m
200.0m
240.0m
Q1
20
15
Q2
20
15
Q3
20
15
Q4
20
15
Q1
20
16
Q2
20
16
Q3
20
16
Q4
20
16
Q1
20
17
Q2
20
17
Q3
20
17
Q4
20
17
Q1
20
18
Q2
20
18
Q3
20
18
Q4
20
18
Q1
20
19
Q2
20
19
Q3
20
19
Q4
20
19
Q1
20
20
Q2
20
20
Q3
20
20
Q4
20
20
Shaw and Partners AMS – Equity Report current as at –30/04/2021–Pg. 23
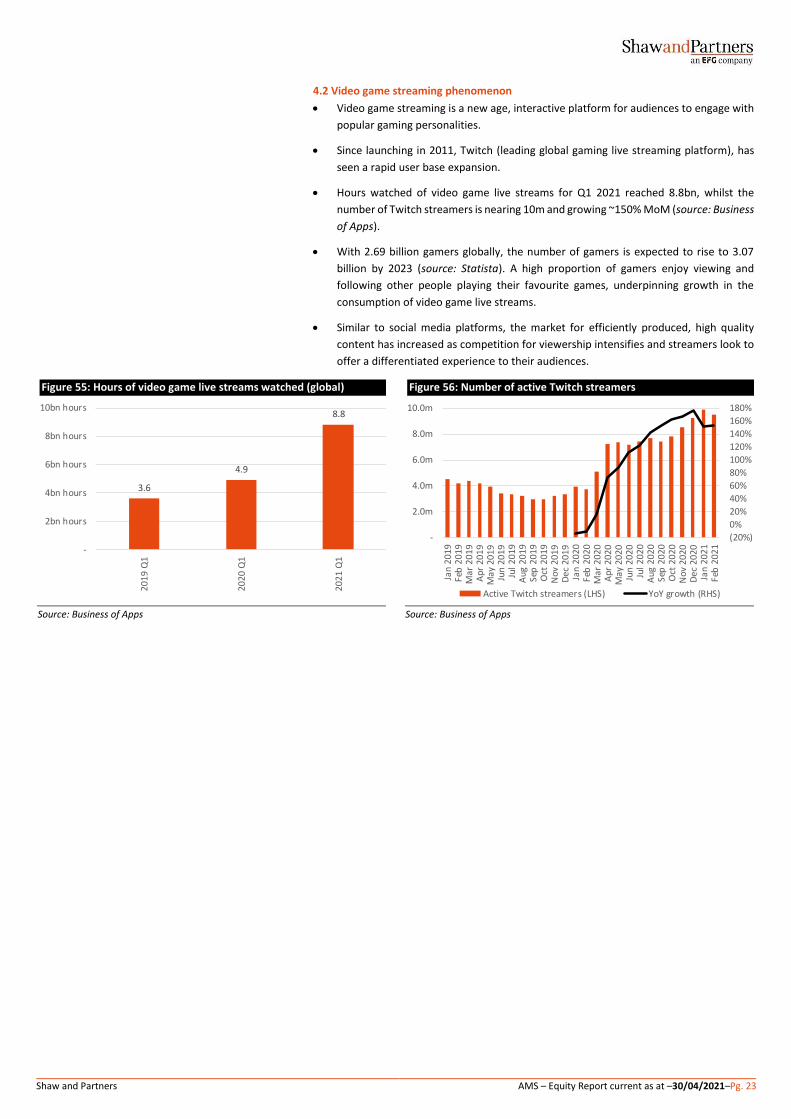
4.2 Video game streaming phenomenon
• Video game streaming is a new age, interactive platform for audiences to engage with
popular gaming personalities.
• Since launching in 2011, Twitch (leading global gaming live streaming platform), has
seen a rapid user base expansion.
• Hours watched of video game live streams for Q1 2021 reached 8.8bn, whilst the
number of Twitch streamers is nearing 10m and growing ~150% MoM (source: Business
of Apps).
• With 2.69 billion gamers globally, the number of gamers is expected to rise to 3.07
billion by 2023 (source: Statista). A high proportion of gamers enjoy viewing and
following other people playing their favourite games, underpinning growth in the
consumption of video game live streams.
• Similar to social media platforms, the market for efficiently produced, high quality
content has increased as competition for viewership intensifies and streamers look to
offer a differentiated experience to their audiences.
Figure 55: Hours of video game live streams watched (global) Figure 56: Number of active Twitch streamers
Source: Business of Apps Source: Business of Apps
3.6
4.9
8.8
-
2bn hours
4bn hours
6bn hours
8bn hours
10bn hours
20
19
Q1
20
20
Q1
20
21
Q1
(20%)
0%
20%
40%
60%
80%
100%
120%
140%
160%
180%
-
2.0m
4.0m
6.0m
8.0m
10.0m
Jan
20
19
Feb
201
9M
ar 2
01
9A
pr
20
19
May
201
9Ju
n 2
01
9Ju
l 2
01
9A
ug
20
19
Sep
201
9O
ct 2
01
9N
ov
20
19
Dec
201
9Ja
n 2
02
0Fe
b 2
020
Mar
20
20
Ap
r 2
02
0M
ay 2
020
Jun
20
20
Jul
20
20
Au
g 2
02
0Se
p 2
020
Oct
20
20
No
v 2
02
0D
ec 2
020
Jan
20
21
Feb
202
1
Active Twitch streamers (LHS) YoY growth (RHS)
Shaw and Partners AMS – Equity Report current as at –30/04/2021–Pg. 24
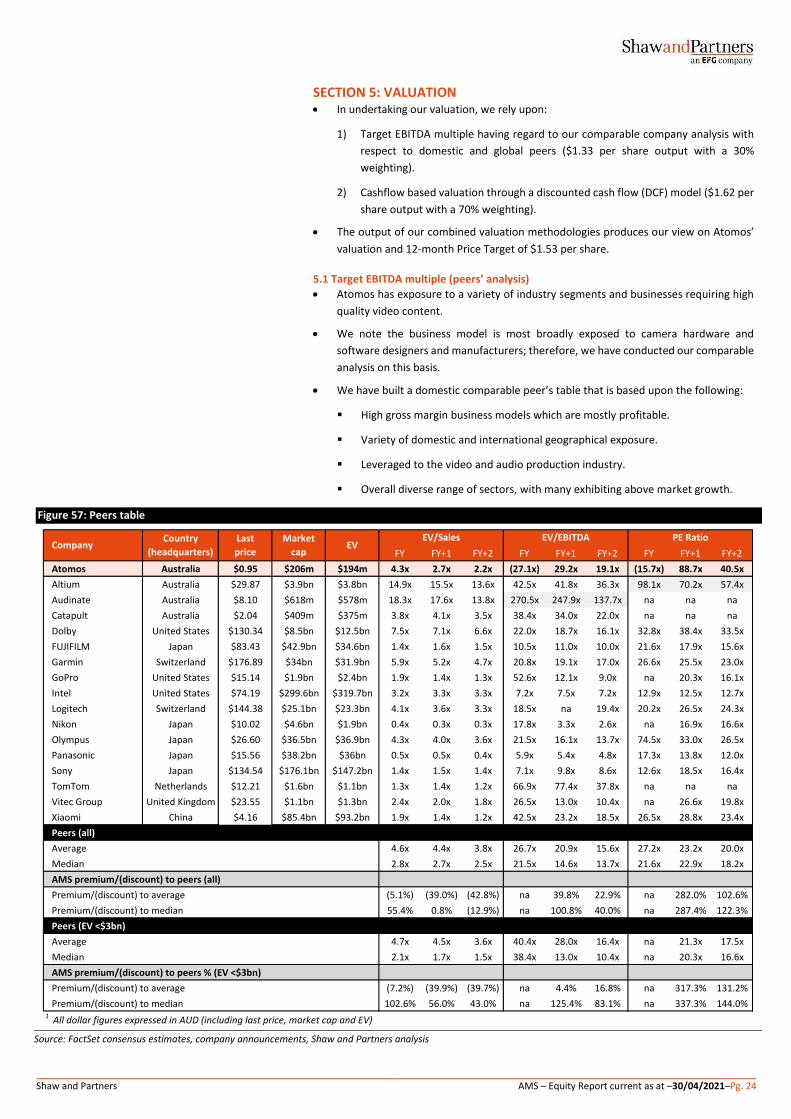
SECTION 5: VALUATION • In undertaking our valuation, we rely upon:
1) Target EBITDA multiple having regard to our comparable company analysis with
respect to domestic and global peers ($1.33 per share output with a 30%
weighting).
2) Cashflow based valuation through a discounted cash flow (DCF) model ($1.62 per
share output with a 70% weighting).
• The output of our combined valuation methodologies produces our view on Atomos’
valuation and 12-month Price Target of $1.53 per share.
5.1 Target EBITDA multiple (peers’ analysis)
• Atomos has exposure to a variety of industry segments and businesses requiring high
quality video content.
• We note the business model is most broadly exposed to camera hardware and
software designers and manufacturers; therefore, we have conducted our comparable
analysis on this basis.
• We have built a domestic comparable peer’s table that is based upon the following:
▪ High gross margin business models which are mostly profitable.
▪ Variety of domestic and international geographical exposure.
▪ Leveraged to the video and audio production industry.
▪ Overall diverse range of sectors, with many exhibiting above market growth.
Figure 57: Peers table
Source: FactSet consensus estimates, company announcements, Shaw and Partners analysis
FY FY+1 FY+2 FY FY+1 FY+2 FY FY+1 FY+2
Atomos Australia $0.95 $206m $194m 4.3x 2.7x 2.2x (27.1x) 29.2x 19.1x (15.7x) 88.7x 40.5x
Altium Australia $29.87 $3.9bn $3.8bn 14.9x 15.5x 13.6x 42.5x 41.8x 36.3x 98.1x 70.2x 57.4x
Audinate Australia $8.10 $618m $578m 18.3x 17.6x 13.8x 270.5x 247.9x 137.7x na na na
Catapult Australia $2.04 $409m $375m 3.8x 4.1x 3.5x 38.4x 34.0x 22.0x na na na
Dolby United States $130.34 $8.5bn $12.5bn 7.5x 7.1x 6.6x 22.0x 18.7x 16.1x 32.8x 38.4x 33.5x
FUJIFILM Japan $83.43 $42.9bn $34.6bn 1.4x 1.6x 1.5x 10.5x 11.0x 10.0x 21.6x 17.9x 15.6x
Garmin Switzerland $176.89 $34bn $31.9bn 5.9x 5.2x 4.7x 20.8x 19.1x 17.0x 26.6x 25.5x 23.0x
GoPro United States $15.14 $1.9bn $2.4bn 1.9x 1.4x 1.3x 52.6x 12.1x 9.0x na 20.3x 16.1x
Intel United States $74.19 $299.6bn $319.7bn 3.2x 3.3x 3.3x 7.2x 7.5x 7.2x 12.9x 12.5x 12.7x
Logitech Switzerland $144.38 $25.1bn $23.3bn 4.1x 3.6x 3.3x 18.5x na 19.4x 20.2x 26.5x 24.3x
Nikon Japan $10.02 $4.6bn $1.9bn 0.4x 0.3x 0.3x 17.8x 3.3x 2.6x na 16.9x 16.6x
Olympus Japan $26.60 $36.5bn $36.9bn 4.3x 4.0x 3.6x 21.5x 16.1x 13.7x 74.5x 33.0x 26.5x
Panasonic Japan $15.56 $38.2bn $36bn 0.5x 0.5x 0.4x 5.9x 5.4x 4.8x 17.3x 13.8x 12.0x
Sony Japan $134.54 $176.1bn $147.2bn 1.4x 1.5x 1.4x 7.1x 9.8x 8.6x 12.6x 18.5x 16.4x
TomTom Netherlands $12.21 $1.6bn $1.1bn 1.3x 1.4x 1.2x 66.9x 77.4x 37.8x na na na
Vitec Group United Kingdom $23.55 $1.1bn $1.3bn 2.4x 2.0x 1.8x 26.5x 13.0x 10.4x na 26.6x 19.8x
Xiaomi China $4.16 $85.4bn $93.2bn 1.9x 1.4x 1.2x 42.5x 23.2x 18.5x 26.5x 28.8x 23.4x
Peers (all)
Average 4.6x 4.4x 3.8x 26.7x 20.9x 15.6x 27.2x 23.2x 20.0x
Median 2.8x 2.7x 2.5x 21.5x 14.6x 13.7x 21.6x 22.9x 18.2x
AMS premium/(discount) to peers (all)
Premium/(discount) to average (5.1%) (39.0%) (42.8%) na 39.8% 22.9% na 282.0% 102.6%
Premium/(discount) to median 55.4% 0.8% (12.9%) na 100.8% 40.0% na 287.4% 122.3%
Peers (EV <$3bn)
Average 4.7x 4.5x 3.6x 40.4x 28.0x 16.4x na 21.3x 17.5x
Median 2.1x 1.7x 1.5x 38.4x 13.0x 10.4x na 20.3x 16.6x
AMS premium/(discount) to peers % (EV <$3bn)
Premium/(discount) to average (7.2%) (39.9%) (39.7%) na 4.4% 16.8% na 317.3% 131.2%
Premium/(discount) to median 102.6% 56.0% 43.0% na 125.4% 83.1% na 337.3% 144.0%1 All dollar figures expressed in AUD (including last price, market cap and EV)
EVPE RatioEV/Sales EV/EBITDA
CompanyCountry
(headquarters)
Last
price
Market
cap
Shaw and Partners AMS – Equity Report current as at –30/04/2021–Pg. 25
• In general, we note the following:
▪ Atomos trades at a historical EV/sales multiple of 4.3x, which represents a 5.1%
discount to the peer group’s latest average historical EV/sales multiple of 4.6x.
▪ Atomos trades at a forward EV/sales (2022) multiple of 2.2x, which represents a
42.8% discount to the peer group’s latest average forward EV/sales multiple of
3.8x.
▪ Although slightly loss making at EBITDA in FY20, Atomos trades at a forward
EV/EBITDA (2022) multiple of 19.1x, which represents a 22.9% premium to the
peer group’s latest average forward EV/EBITDA multiple of 15.6x.
• We see Atomos as having an above average organic revenue and earnings growth
profile over our forecast horizon relative to domestic and global listed peers.
• In order to derive the output for Atomos’ valuation of $1.33 per share on a target
EBITDA multiple basis, we applied a conservative EBITDA multiple of 20.0x on FY23e
EBITDA of $21.0m (pre-R&D), discounted at our WACC of 11.0%.
• We note that our forward EBITDA multiple assumption of 20.0x represents a significant
discount to the historical trading multiple of the peer set of 26.7x and a discount to the
average forward (2021) multiple of 20.9x.
Figure 58: Target EBITDA assumptions and output
Source: Shaw and Partners analysis
5.2 Discounted cash flow (DCF)
• In formulating our DCF we undertake ~10 years of financial forecasts and apply a
terminal value to our valuation to form our DCF output.
• We expect that Atomos has the potential to deliver significant gross margins, EBITDA
and free cashflows at scale and present our DCF key assumptions, output and
sensitivity below.
Figure 59: DCF assumptions and output
Source: Shaw and Partners analysis
• A key tenement in our investment thesis and forecasts is that the group has invested
materially in R&D, human capital and marketing.
• The net result of our DCF is a valuation of $1.62 per share. This is fully diluted and
inclusive of all options and performance rights outstanding.
Variable ValueFY23e EBITDA $21.0mTarget EBITDA multiple 20.0xEnterprise value (EV) $420.9mNet (debt)/cash $42.9m
Fully diluted shares 227.2mValue per share $1.66Time 2.2 yearsWACC 11.0%Valuation (per share) $1.33
Variable ValueCost of equity 12.3%Cost of debt (post tax) 4.2%WACC 11.0%Inflation 2.5%Terminal growth rate 2.5%
Operational NPV $395.1mNet cash (debt) ($26.4m)Total NPV $368.7mFully diluted shares on issue 227.2mValuation (per share) $1.62
Shaw and Partners AMS – Equity Report current as at –30/04/2021–Pg. 26
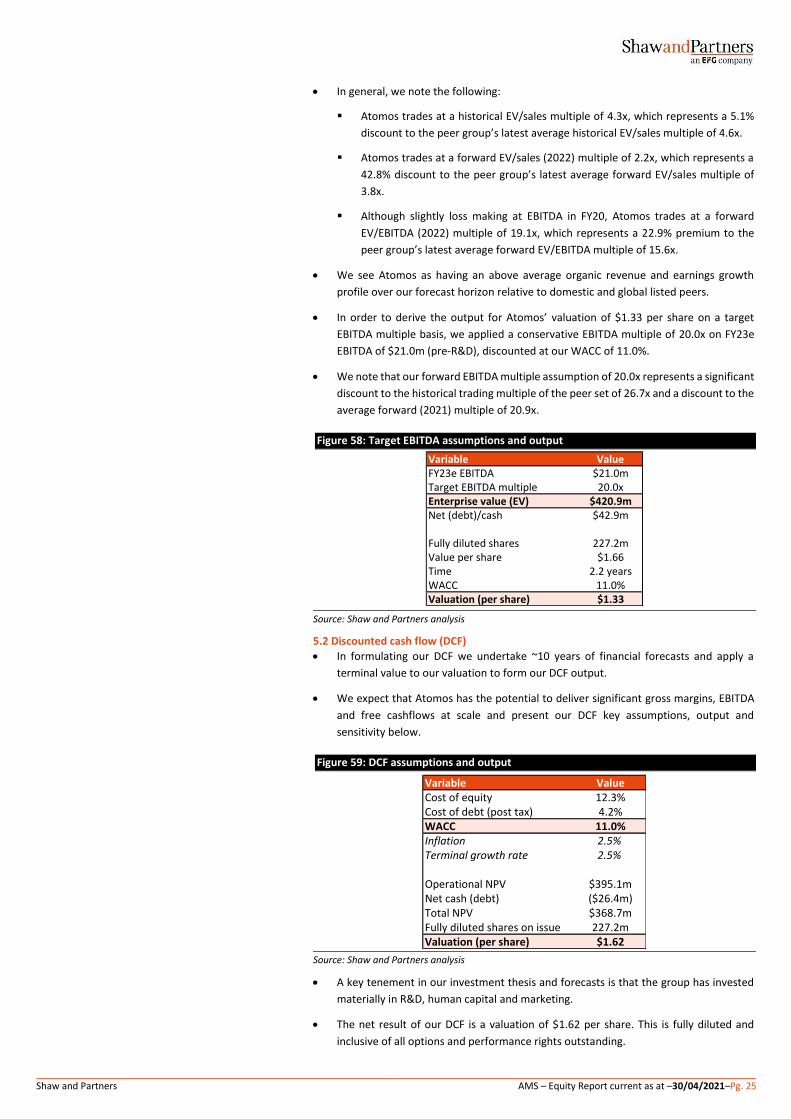
5.3 Valuation conclusion
• We elect to utilise a 30% / 70% weighting of our multiple of EBITDA / DCF
methodologies to derive our valuation. The net result is a valuation and 12-month Price
Target of $1.53 per share, which supports our recommendation of Buy with High Risk.
• In general, our view is that our valuation is supported by the following:
▪ Market leading product that is growing in terms of exposure, quality and
technological capability.
▪ New product launches in high growth markets.
▪ Further investor interest over time as market capitalisation, scale and profile rises.
▪ Robust gross margins, EBITDA margins and free cashflows at scale.
Figure 60: Valuation summary table Figure 61: Valuation summary chart
Source: Shaw and Partners analysis
Source: Shaw and Partners analysis
Method Valuation Weight Value Target EBITDA multiple $1.33 30% $0.40DCF $1.62 70% $1.13Valuation (per share) $1.53
-
$0.20
$0.40
$0.60
$0.80
$1.00
$1.20
$1.40
$1.60
$1.80
Target EBITDA multiple DCF Valuation contribution
Target EBITDA multiple DCF
Valuation contribution
Shaw and Partners AMS – Equity Report current as at –30/04/2021–Pg. 27
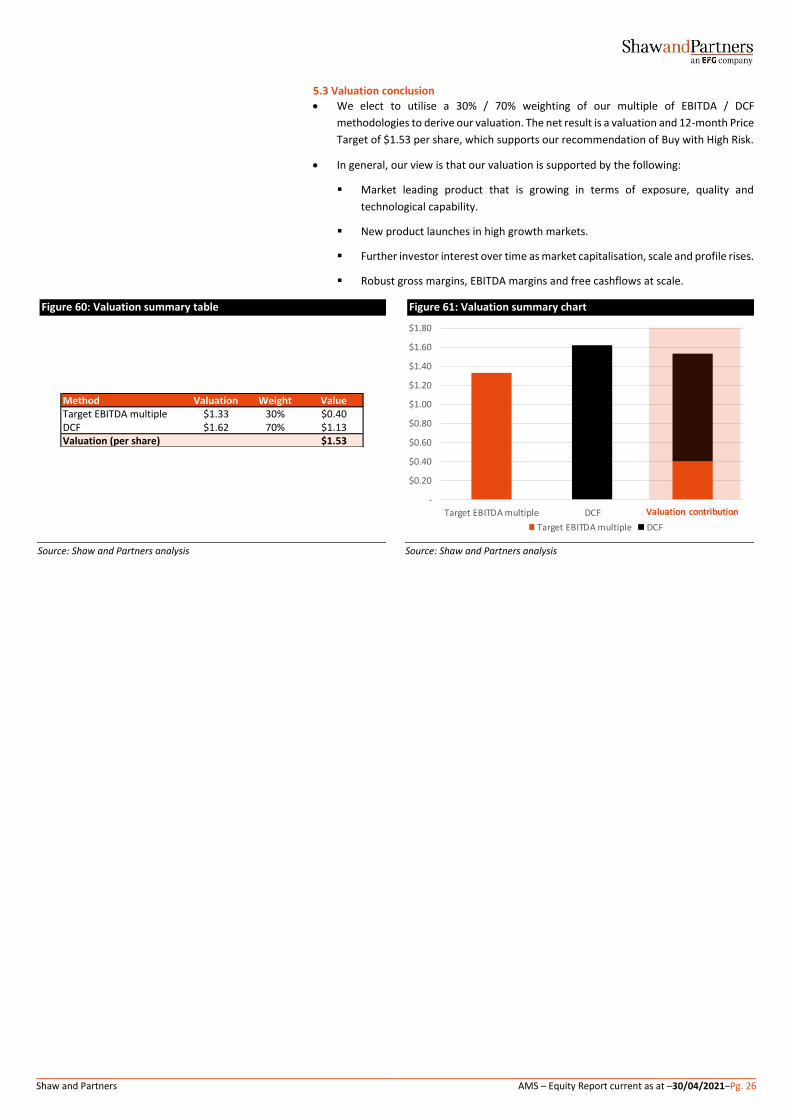
SECTION 6: SHARE STRUCTURE AND SHAREHOLDERS • Atomos was co-founded in 2010 by Jeromy Young and listed on the ASX in 2018, raising
$6.0m through the issuance of 14.6m shares at $0.41 per share. At the IPO issue price,
Atomos had a market capitalisation of $62.2m.
• Since listing in 2018, Atomos has been mostly funded through equity, having raised
$6.2m in FY19 and $41.0m in FY20. Atomos currently has 218.5m fully paid ordinary
shares and 8.7m options and performance rights on issue.
Figure 62: Total equity issued since IPO Figure 63: Share price
Source: Company data, FactSet Source: Company data, FactSet
• Institutional ownership for the material institutional owners makes up over 20% of the
share register. The largest institutional owner is Regal with 17.8m shares or 8.1% of
the register, followed by Ellerston and Perennial with 16.3m and 11.1m shares or 7.5%
and 5.1% of shares outstanding respectively.
• Insider ownership includes a holding of 10.9m shares by Domazet (HNW investor),
7.8m by Jeromy Young (Atomos Founder), 3.2m by Yurong Xi (HNW investor), 3.0m by
Huitong Song (HNW investor) and 1.7m by Hossein Yassaie (Atomos NED).
Figure 64: Institutional ownership and percentage Figure 65: Insider ownership and percentage
Source: Company data, FactSet, Shaw and Partners analysis Source: Company data, FactSet, Shaw and Partners analysis
-
$0.20
$0.40
$0.60
$0.80
$1.00
$1.20
$1.40
-
$5.0m
$10.0m
$15.0m
$20.0m
$25.0m
Nov 2018 Jul 2019 Dec 2019 May 2020
Amount raised (LHS) Weighted avg. price (RHS)
$0.30
$0.40
$0.50
$0.60
$0.70
$0.80
$0.90
$1.00
$1.10
$1.20
Ap
r 2
02
0
Ma
y 2
02
0
Jun
20
20
Jul 2
020
Au
g 2
02
0
Sep
202
0
Oct
20
20
Nov
202
0
Dec
202
0
Jan
20
21
Feb
202
1
Mar
20
21
Ap
r 2
02
1
17.8m / 8.1%
16.3m / 7.5%
11.1m / 5.1%
Regal
Ellerston
Perennial
- 5.0m 10.0m 15.0m 20.0m
Number of shares held
10.9m / 5.0%
7.8m / 3.6%
3.2m / 1.5%
3.0m / 1.4%
1.7m / 0.8%
Domazet
JeromyYoung
YurongXi
HuitongSong
HosseinYassaie
- 2.0m 4.0m 6.0m 8.0m 10.0m 12.0m
Number of shares held
Shaw and Partners AMS – Equity Report current as at –30/04/2021–Pg. 28
SECTION 7: BOARD AND MANAGEMENT
7.1 Board
Chris Tait, Executive Chairman Chris has over 25 years of experience advising private and public companies on general strategic advice, M&A and raising capital. He has also held senior executive roles in a major public company, WHSmith where he was initially Director of Strategy and Acquisitions and then CFO of the Asia Pacific operations. Co-Founder and Managing Director of Henslow, an independent advisory firm and Corporate Adviser to Atomos.
Sir Hossein Yassaie, Non-Executive Director Sir Hossein has over 35 years of experience in specialised research and development and semiconductors and was Founder of Imagination Technologies and held the position of CEO for 18 years. Hossein received a knighthood in 2013 in recognition of his services to technology and innovation in the United Kingdom.
Stephen Stanley, Non-Executive Director Stephen has over 25 years’ experience in the Logistics sector in Australia, Asia, Europe and North America. Stephen was previously Director for Corporate Development for Toll Holdings from 1999 until 2012 and Non-Executive Director for Cabcharge Australia. Stephen is also currently Chairman for Ventura Motors.
7.2 Management
Jeromy Young, Founder Jeromy has over 20 years of technology and management experience in Japan, America, Europe and Asia. Jeromy commenced his career at Canopus (CV) Japan, where he became the Global Business Development Director. Jeromy then transitioned into a global BDM role at Blackmagic Design.
James Cody, CFO James has over 20 years of financial and accounting experience in both private and public businesses. James was previously CFO and Principal at Henslow, a corporate advisory firm in Melbourne. Prior to Henslow, James was CFO at Funtastic, an ASX listed supplier of children’s products with revenue of over $200m.
Trevor Elbourne, CTO Trevor has over 20 years of experience as a hardware engineer with particular focus on IC and ASIC design. At Atomos, Trevor started as a Senior Hardware Engineer before moving to Director of Systems Engineering. Previously, Trevor was Engineering and Hardware manager at Canon and various electronics firms.
Mark Harland, COO Mark has over 20 years of global leadership experience at General Motors with emphasis in operations, sales, marketing and customer experience. He has worked across a number of geographies including North America, Europe, Middle East and Asia. More recently, he was co-founder of an Electric Vehicle Subscription start-up. A native of Montreal, Canada and a permanent resident of Australia he holds an MBA from the New York Institute of Technology.
Shaw and Partners AMS – Equity Report current as at –30/04/2021–Pg. 29
SECTION 8: CORE DRIVERS AND CATALYSTS Our investment thesis for Atomos is driven by the following:
Product competitive advantages In our view and as validated by several independent sources, Atomos’ products are market leading in terms of quality, distribution, R&D capabilities and reputation. Given its current size and company culture, Atomos is agile and has the ability to has a proven ability to adapt to changing market conditions, implement new products and dynamically capitalise on market trends such as gaming.
New product launches Over and above growth in its existing product base, Atomos is planning new product launches including new categories (gaming), further ProRes RAW integrations and Series 2 product range releases. Additionally, partnership opportunities with the likes of Disney, Zoom, Netflix, Twitch, Cisco could also provide further upside opportunities. We also expect the new Ninja products announced in April 2021 to contribute to group sales going forward.
Shifting earnings profile and margins likely to emerge Recently launched software sales gives Atomos the ability to generate a new high gross margin earnings segment, thus providing greater depth to earnings. Our view is that software sales should be viewed as quasi-recurring and high margin, which is a potential re-rating catalyst for Atomos.
Video production and consumption tailwinds With users and penetration rising in all of Atomos’ segment (Social, Pro-Video and Entertainment) we see social media, gaming and video streaming continuing to drive adoption across all time horizons. Atomos gives video professionals a faster, superior quality and more affordable output which is highly sought after in the digital age driven by hypergrowth across streaming (Netflix), social media (Instagram and Facebook) and gaming (Twitch).
Operating leverage emerging against market leadership We anticipate material operating leverage as Atomos continues to scale its business after turning EBITDA and cashflow positive in 1H21 half. Shaw estimates significant operating leverage across the forecast spectrum as a result of a highly expandable business model across employee expenses, marketing and distribution.
Potential M&A and inbound interest Given Atomos’ significant traction in the monitor-recorder market and subsequent revenue growth, we see the potential for industry consolidation. Additionally, given its increasing growth profile and global exposure, Atomos may also attract acquisitive interest from larger competitors or video sector participants.
Shaw and Partners AMS – Equity Report current as at –30/04/2021–Pg. 30
SECTION 9: KEY RISKS Risks to our investment thesis include although are not limited to:
Technological change We see Atomos’ products and software as purpose built and technologically superior to other products in their key markets. However, this may not always be the case due to technological changes. These changes may lead to a requirement for Atomos to redevelop its products or software in order to meet dynamic user and market requirements.
Competition Whilst we view Atomos’ product as broadly differentiated, new competition or intensified competition from existing operators may result in margin erosion, or even loss of existing Resellers or a reduction in customer uptake and loyalty.
Supply chain disruption Atomos relies upon a reliable supply chain relating to components that are core to its various products. There is a risk that supply of certain components is either constrained or ceased, which would result in negative impacts to production and therefore sales and revenue.
Intellectual property protection The products and software of Atomos require the identification and protection of the requisite intellectual property upon which they are built and developed. An inability to successfully protect their intellectual property rights may result in a loss of competitive edge, or even costly legal and administrative proceedings. Cash burn From time-to-time Atomos has delivered negative cash flows and is may deliver negative cash flows across future periods as a result of growth and investment. There is risk that Atomos delivers negative or volatile cashflows. Therefore, there is no guarantee that Atomos will be able to continue financing the business or that the group will reach a material and sustainable level of profitability.
International operations Atomos is a global company with offices, staff, customers and suppliers all over the world, with key jurisdictions consisting of USA, EMEA and Asia. Given the multitude of risks, differing regulatory requirements, currency translations and general geographic risk, there is no guarantee that Atomos has the team, resources or skills to navigate their key markets.
Small cap illiquidity and volatility As a small cap company, Atomos exhibits higher levels of volatility and lower liquidity than the broader market in general. This beta is magnified during periods of market upheaval, such as the current Covid environment.
Key board / management risk Atomos’ key management have a deep knowledge of the company’s product and markets. Failure to retain and grow executive talent may adversely impact the group’s growth. Moreover, this risk is elevated for businesses experiencing material growth over a short time horizon, such as Atomos.
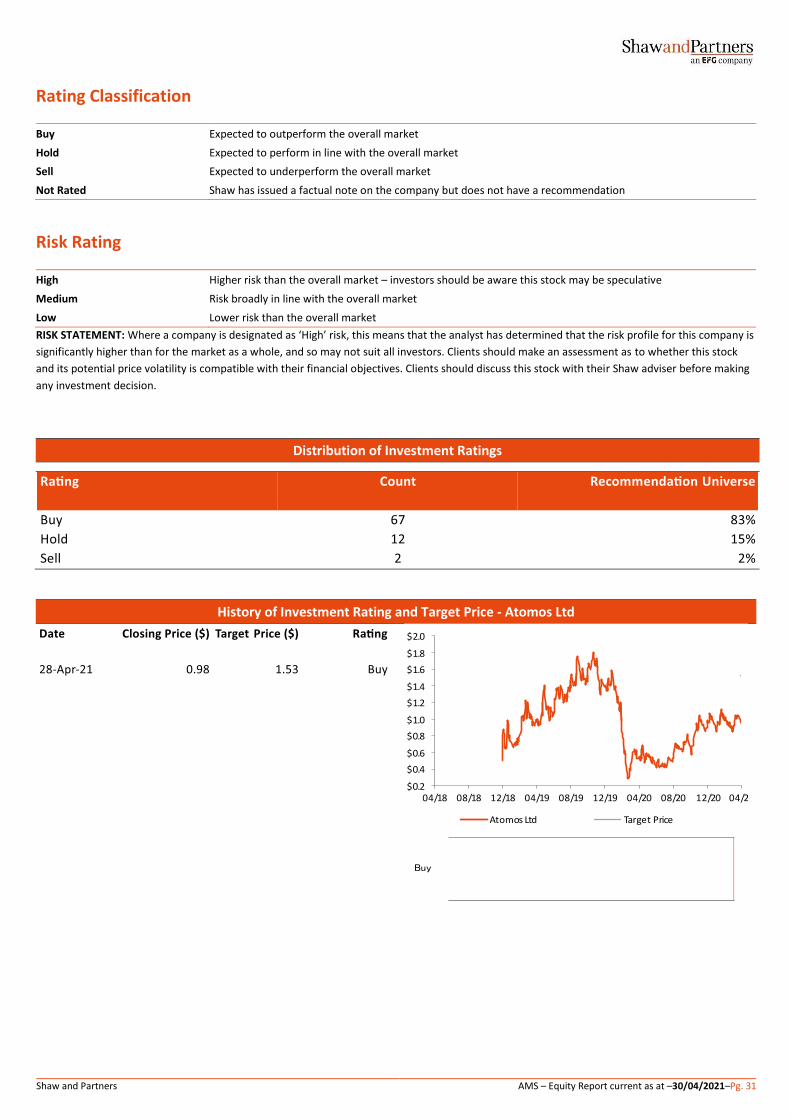
Shaw and Partners AMS – Equity Report current as at –30/04/2021–Pg. 31
Rating Classification
Buy Expected to outperform the overall market
Hold Expected to perform in line with the overall market
Sell Expected to underperform the overall market
Not Rated Shaw has issued a factual note on the company but does not have a recommendation
Risk Rating
High Higher risk than the overall market – investors should be aware this stock may be speculative
Medium Risk broadly in line with the overall market
Low Lower risk than the overall market
RISK STATEMENT: Where a company is designated as ‘High’ risk, this means that the analyst has determined that the risk profile for this company is
significantly higher than for the market as a whole, and so may not suit all investors. Clients should make an assessment as to whether this stock
and its potential price volatility is compatible with their financial objectives. Clients should discuss this stock with their Shaw adviser before making
any investment decision.
Distribution of Investment Ratings
History of Investment Rating and Target Price - Atomos Ltd
04/18 08/18 12/18 04/19 08/19 12/19 04/20 08/20 12/20 04/21$0.2
$0.4
$0.6
$0.8
$1.0
$1.2
$1.4
$1.6
$1.8
$2.0
Atomos Ltd Target Price
Buy
Shaw and Partners AMS – Equity Report current as at –30/04/2021–Pg. 32
Disclaimer
Shaw and Partners Limited ABN 24 003 221 583 (“Shaw”) is a Participant of ASX Limited, Chi-X Australia Pty Limited and holder of Australian Financial Services Licence number 236048. ANALYST CERTIFICATION: The Research Analyst who prepared this report hereby certifies that the views expressed in this document accurately reflect the analyst's personal views about the Company and its financial products. Neither Shaw nor its Research Analysts received any direct financial or non-financial benefits from the company for the production of this document. However, Shaw Research Analysts may receive assistance from the company in preparing their research which can include attending site visits and/or meetings hosted by the company. In some instances the costs of such site visits or meetings may be met in part or in whole by the company if Shaw considers it is reasonable given the specific circumstances relating to the site visit or meeting. As at the date of this report, the Research Analyst does not hold, either directly or through a controlled entity, securities in the Company that is the subject of this report, where they do hold securities those interests are not material. Shaw restricts Research Analysts from trading in securities outside of the ASX/S&P100 for which they write research. Other Shaw employees may hold interests in the company, but none of those interests are material. DISCLAIMER: This report is published by Shaw to its clients by way of general, as opposed to personal, advice. This means it has been prepared for multiple distribution without consideration of your investment objectives, financial situation and needs (“Personal Circumstances”). Accordingly, the advice given is not a recommendation that a particular course of action is suitable for you and the advice is therefore not to be acted on as investment advice. You must assess whether or not the advice is appropriate for your Personal Circumstances before making any investment decisions. You can either make this assessment yourself, or if you require a personal recommendation, you can seek the assistance of your Shaw client adviser. This report is provided to you on the condition that it not be copied, either in whole or in part, distributed to or disclosed to any other person. If you are not the intended recipient, you should destroy the report and advise Shaw that you have done so. This report is published by Shaw in good faith based on the facts known to it at the time of its preparation and does not purport to contain all relevant information with respect to the financial products to which it relates. The research report is current as at the date of publication until it is replaced, updated or withdrawn. Although the report is based on information obtained from sources believed to be reliable, Shaw does not make any representation or warranty that it is accurate, complete or up to date and Shaw accepts no obligation to correct or update the information or opinions in it. If you rely on this report, you do so at your own risk. Any projections are indicative estimates only and may not be realised in the future. Such projections are contingent on matters outside the control of Shaw (including but not limited to market volatility, economic conditions and company-specific fundamentals) and therefore may not be realised in the future. Past performance is not a reliable indicator of future performance. Except to the extent that liability under any law cannot be excluded, Shaw disclaims liability for all loss or damage arising as a result of any opinion, advice, recommendation, representation or information expressly or impliedly published in or in relation to this report notwithstanding any error or omission including negligence. Depending on the timing and size of your investment, your portfolio composition may differ to the model. Performance figures are derived from the inception date of the model and its investment transactions from that date, therefore the performance for your portfolio may be different. If you have any questions in connection with differences between your portfolio and the model, you should speak with your adviser. IMPORTANT INFORMATION TO CONSIDER: It is important that before making a decision to invest in a Shaw Managed Accounts, a managed fund, an exchange traded fund, an individual hybrid security or listed debt instrument that you read the relevant Product Disclosure Statement (“PDS”). The PDS will contain information relevant to the specific product, including the returns, features, benefits and risks. The PDS can be found at: www.shawandpartners.com.au/media/1348/shawmanagedaccounts_pds.pdf. RISKS ASSOCIATED WITH HYBRID SECURITIES: Hybrid securities and listed debt instruments differ from investments in equities and cash products in a number of important respects. The liquidity risk associated with an investment in hybrid securities and listed debt instruments will generally be greater than that associated with equities. The credit risk associated with hybrid securities and listed debt instruments is higher than that of a cash product or term deposit. Some hybrid securities may be perpetual in nature, meaning that they can only be redeemed or exchanged for cash or equity at the issuer’s option. Hybrids may also contain terms which automatically trigger the deferral of an interest payment or cause the issuer to repay the hybrid earlier or later than anticipated. ASIC has published information to assist consumers in understanding the risks and benefits associated with an investment in hybrid securities or listed debt instruments. This information can be found under the heading ‘Complex Investments’ at www.moneysmart.gov.au/investing. DISCLOSURE: Shaw will charge commission in relation to client transactions in financial products and Shaw client advisers will receive a share of that commission. Shaw, its authorised representatives, its associates and their respective officers and employees may have earned previously or may in the future earn fees and commission from dealing in the Company's financial products.