Embed Size (px)
Citation preview
Atomic-Scale Structure of the Hematite α‑Fe2O3(1102) “R-Cut”SurfaceFlorian Kraushofer,† Zdenek Jakub,† Magdalena Bichler,‡ Jan Hulva,† Peter Drmota,† Michael Weinold,†
Michael Schmid,† Martin Setvin,† Ulrike Diebold,† Peter Blaha,‡ and Gareth S. Parkinson*,†
†Institute of Applied Physics, Vienna University of Technology, Vienna, Austria‡Institute of Materials Chemistry, Vienna University of Technology, Vienna, Austria
*S Supporting Information
ABSTRACT: The α-Fe2O3(11 02) surface (also known as thehematite r-cut or (012) surface) was studied using low-energyelectron diffraction (LEED), X-ray photoelectron spectroscopy(XPS), ultraviolet photoelectron spectroscopy (UPS), scan-ning tunneling microscopy (STM), noncontact atomic forcemicroscopy (nc-AFM), and ab initio density functional theory(DFT)+U calculations. Two surface structures are stable underultrahigh vacuum (UHV) conditions; a stoichiometric (1 × 1)surface can be prepared by annealing at 450 °C in ≈10−6 mbarO2, and a reduced (2 × 1) reconstruction is formed by UHVannealing at 540 °C. The (1 × 1) surface is close to an idealbulk termination, and the undercoordinated surface Fe atomsreduce the surface bandgap by ≈0.2 eV with respect to thebulk. The work function is measured to be 5.7 ± 0.2 eV, and the VBM is located 1.5 ± 0.1 eV below EF. The images obtainedfrom the (2 × 1) reconstruction cannot be reconciled with previously proposed models, and a new “alternating trench” structureis proposed based on an ordered removal of lattice oxygen atoms. DFT+U calculations show that this surface is favored inreducing conditions and that 4-fold-coordinated Fe2+ cations at the surface introduce gap states approximately 1 eV below EF.The work function on the (2 × 1) termination is 5.4 ± 0.2 eV.
1. INTRODUCTION
The study of iron oxides is motivated by their abundance in theEarth’s crust, their importance in geochemistry and corrosionprocesses, and their wide range of applications includingcatalysis, biomedicine, and spintronics.1 The most stable ironoxide under atmospheric conditions is hematite (α-Fe2O3).This material is a promising candidate for photoelectrochemical(PEC) water splitting because it is stable in water, is nontoxic,and has a bandgap of 1.9−2.2 eV.2,3 In principle, α-Fe2O3 canachieve a maximum solar-to-hydrogen efficiency of 15%,4 whichis sufficient for application, but the practical efficiency ishindered by a low absorption coefficient,5 short minority carrierlifetime,6 low conductivity,7,8 and sluggish reaction kinetics.9,10
Several strategies have been developed to improve theperformance of α-Fe2O3 photoanodes, including oxygenvacancy engineering,11 doping,12,13 and the addition ofcocatalysts,14 and a large foundation of prior work on hematitesurfaces exists. However, many aspects of α-Fe2O3 surfacestructures remain poorly understood at the atomic scale, whichlimits the understanding of their impact on surface (photo)-chemistry.One approach to understanding α-Fe2O3 surface chemistry is
to study well-defined model systems in a highly controlledenvironment, thereby reducing complex phenomena to atractable level. In the so-called surface science method,
adsorption and surface chemistry are studied molecule bymolecule on low-index single-crystal surfaces, allowing anunderstanding of the basic interactions to be built up. Anaccurate and precise knowledge of the atomic-scale surfacestructure is a prerequisite, and there remain many importantmetal oxides where this basic knowledge does not exist. Todate, most surface-science studies of α-Fe2O3 have utilized thin-film samples grown epitaxially on a metal substrate. Thisapproach usually results in growth of the (0001) facet becausean FeO(111) ultrathin film forms at the interface when Fe isdeposited in an oxygen background, and this templates furthergrowth with the basal plane parallel to the surface.1,15,16
Unfortunately, it has proven extremely difficult to prepare andmeasure a stoichiometric α-Fe2O3(0001) surface under UHVconditions,16 and the termination is still debated,1 as are thoseof several reduced phases that have also been reported.16−23
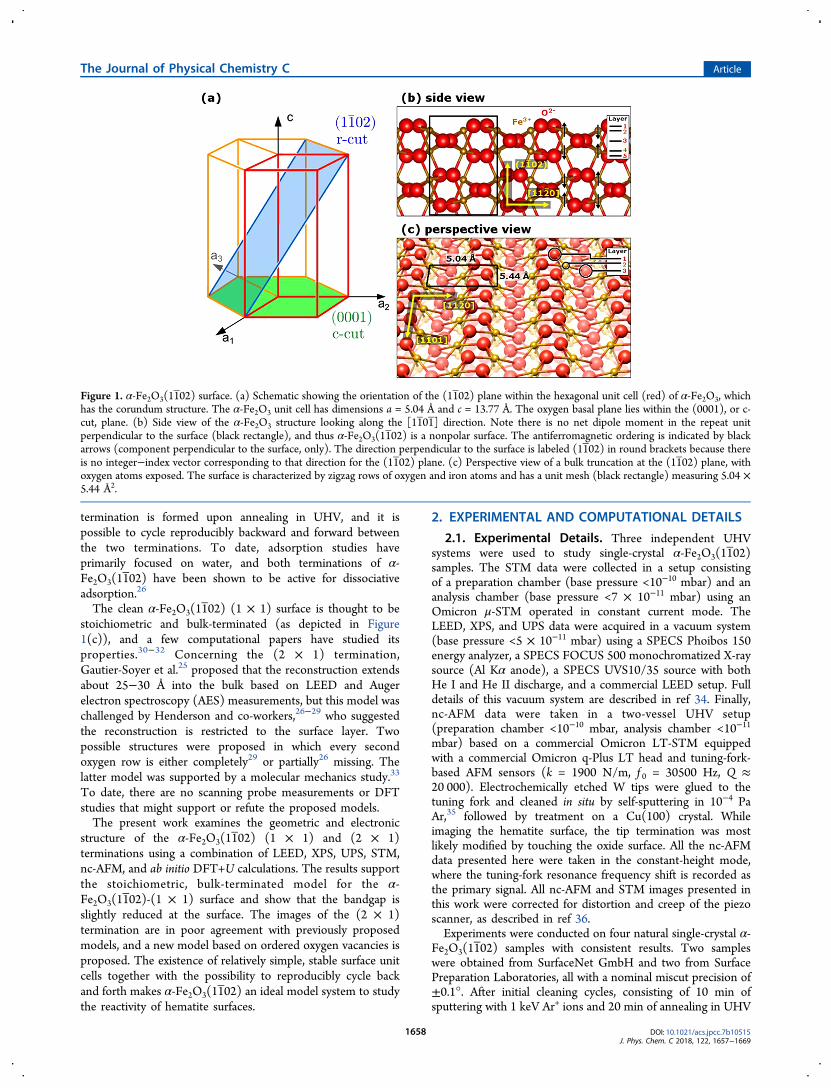
The nonpolar α-Fe2O3(11 02) surface (see Figure 1) hasattracted considerably less attention, despite the fact that it isprevalent on nanohematite,1,24 and it is reported that a (1 × 1)surface can be easily prepared by annealing a single-crystalsample in ≈10−6 mbar O2.
17,25−29 A reduced (2 × 1)
Received: October 24, 2017Revised: December 8, 20173Published: December 8, 2017
Article
pubs.acs.org/JPCCCite This: J. Phys. Chem. C 2018, 122, 1657−1669
© 2017 American Chemical Society 1657 DOI: 10.1021/acs.jpcc.7b10515J. Phys. Chem. C 2018, 122, 1657−1669
This is an open access article published under a Creative Commons Attribution (CC-BY)License, which permits unrestricted use, distribution and reproduction in any medium,provided the author and source are cited.
termination is formed upon annealing in UHV, and it ispossible to cycle reproducibly backward and forward betweenthe two terminations. To date, adsorption studies haveprimarily focused on water, and both terminations of α-Fe2O3(11 02) have been shown to be active for dissociativeadsorption.26
The clean α-Fe2O3(11 02) (1 × 1) surface is thought to bestoichiometric and bulk-terminated (as depicted in Figure1(c)), and a few computational papers have studied itsproperties.30−32 Concerning the (2 × 1) termination,Gautier-Soyer et al.25 proposed that the reconstruction extendsabout 25−30 Å into the bulk based on LEED and Augerelectron spectroscopy (AES) measurements, but this model waschallenged by Henderson and co-workers,26−29 who suggestedthe reconstruction is restricted to the surface layer. Twopossible structures were proposed in which every secondoxygen row is either completely29 or partially26 missing. Thelatter model was supported by a molecular mechanics study.33
To date, there are no scanning probe measurements or DFTstudies that might support or refute the proposed models.The present work examines the geometric and electronic
structure of the α-Fe2O3(11 02) (1 × 1) and (2 × 1)terminations using a combination of LEED, XPS, UPS, STM,nc-AFM, and ab initio DFT+U calculations. The results supportthe stoichiometric, bulk-terminated model for the α-Fe2O3(11 02)-(1 × 1) surface and show that the bandgap isslightly reduced at the surface. The images of the (2 × 1)termination are in poor agreement with previously proposedmodels, and a new model based on ordered oxygen vacancies isproposed. The existence of relatively simple, stable surface unitcells together with the possibility to reproducibly cycle backand forth makes α-Fe2O3(11 02) an ideal model system to studythe reactivity of hematite surfaces.
2. EXPERIMENTAL AND COMPUTATIONAL DETAILS
2.1. Experimental Details. Three independent UHVsystems were used to study single-crystal α-Fe2O3(11 02)samples. The STM data were collected in a setup consistingof a preparation chamber (base pressure <10−10 mbar) and ananalysis chamber (base pressure <7 × 10⁻¹¹ mbar) using anOmicron μ-STM operated in constant current mode. TheLEED, XPS, and UPS data were acquired in a vacuum system(base pressure <5 × 10⁻¹¹ mbar) using a SPECS Phoibos 150energy analyzer, a SPECS FOCUS 500 monochromatized X-raysource (Al Kα anode), a SPECS UVS10/35 source with bothHe I and He II discharge, and a commercial LEED setup. Fulldetails of this vacuum system are described in ref 34. Finally,nc-AFM data were taken in a two-vessel UHV setup(preparation chamber <10−10 mbar, analysis chamber <10−11
mbar) based on a commercial Omicron LT-STM equippedwith a commercial Omicron q-Plus LT head and tuning-fork-based AFM sensors (k = 1900 N/m, f 0 = 30500 Hz, Q ≈20 000). Electrochemically etched W tips were glued to thetuning fork and cleaned in situ by self-sputtering in 10−4 PaAr,35 followed by treatment on a Cu(100) crystal. Whileimaging the hematite surface, the tip termination was mostlikely modified by touching the oxide surface. All the nc-AFMdata presented here were taken in the constant-height mode,where the tuning-fork resonance frequency shift is recorded asthe primary signal. All nc-AFM and STM images presented inthis work were corrected for distortion and creep of the piezoscanner, as described in ref 36.Experiments were conducted on four natural single-crystal α-
Fe2O3(11 02) samples with consistent results. Two sampleswere obtained from SurfaceNet GmbH and two from SurfacePreparation Laboratories, all with a nominal miscut precision of±0.1°. After initial cleaning cycles, consisting of 10 min ofsputtering with 1 keV Ar+ ions and 20 min of annealing in UHV
Figure 1. α-Fe2O3(1102) surface. (a) Schematic showing the orientation of the (1102) plane within the hexagonal unit cell (red) of α-Fe2O3, whichhas the corundum structure. The α-Fe2O3 unit cell has dimensions a = 5.04 Å and c = 13.77 Å. The oxygen basal plane lies within the (0001), or c-cut, plane. (b) Side view of the α-Fe2O3 structure looking along the [1101 ] direction. Note there is no net dipole moment in the repeat unitperpendicular to the surface (black rectangle), and thus α-Fe2O3(11 02) is a nonpolar surface. The antiferromagnetic ordering is indicated by blackarrows (component perpendicular to the surface, only). The direction perpendicular to the surface is labeled (1102) in round brackets because thereis no integer−index vector corresponding to that direction for the (11 02) plane. (c) Perspective view of a bulk truncation at the (11 02) plane, withoxygen atoms exposed. The surface is characterized by zigzag rows of oxygen and iron atoms and has a unit mesh (black rectangle) measuring 5.04 ×5.44 Å2.
The Journal of Physical Chemistry C Article
DOI: 10.1021/acs.jpcc.7b10515J. Phys. Chem. C 2018, 122, 1657−1669
1658
(T = 540 °C), all contaminants detectable by XPS weresuccessfully removed from the samples. Potassium contami-nation was observed after high-temperature O2 annealing ofone sample, resulting in a (2 × 3) superstructure. Presumably,oxidation caused segregation of K from the bulk of the naturalsample. Data from the contaminated crystal are not shownhere, although results for the (2 × 1) surface were identical tothose of the noncontaminated crystals. At room temperature,all samples initially exhibited charging in LEED below electronenergies of about 90 eV. STM measurements were notattempted until the conductivity had increased to a levelwhere no charging was observed in LEED above 20 eV electronenergy. This was achieved by 60−100 cycles of sputtering for10 min with 1 keV Ar+ ions and annealing in UHV (20 min, T= 540 °C). During this preparation process, the samples werealso annealed in oxygen (20 min, pO2 = 1 × 10⁻⁶ mbar, T = 450°C) every 5−10 cycles to prevent the surface from being overlyreduced, which is a common issue when working with the(0001) surface of hematite.37 The increase in conductivity ismost likely linked to the reduction of the sample. Fe interstitialsare thought to be the most likely bulk defect in suchconditions,38 and these donate electrons into the lattice,resulting in small-polaron-type conductivity.39
The (1 × 1) surface was prepared by directly oxidizing the (2× 1) surface, or from a freshly sputtered crystal, by annealing inoxygen (pO2 = 1 × 10⁻⁶ mbar, 20 min at 450 °C). The (2 × 1)surface could be prepared by annealing (20 min at 540 °C)either a freshly sputtered or a (1 × 1) surface in UHV. A mixedsurface was prepared by annealing the (1 × 1) surface in UHVfor shorter times or at lower temperatures.2.2. Density Functional Theory Calculations. Spin-
polarized density functional theory (DFT) calculations wereperformed by using the full-potential augmented plane wave +local orbital method as implemented in the WIEN2k code.40
The PBEsol exchange-correlation functional41 was employedtogether with a Hubbard U (Ueff = 4 eV)42 to treat the highlycorrelated Fe 3d electrons.43 This functional was used becauseit yields bulk lattice constants a = 5.03 Å and c = 13.74 Å, whichagree well with experiment,44 and these parameters weresubsequently used for the slab setup. All calculations were spinpolarized due to the antiferromagnetism of hematite. In bulkhematite, spin-up and spin-down iron atoms are antiferromag-netically ordered along [0001] and ferromagnetically coupled ineach (0001) layer. In the (11 02) planes, this results inalternating spins along the [112 0] direction, as indicated byblack arrows in Figure 1(b). Note that the spin directions areonly qualitatively correct as shown. At low temperatures, thespins are oriented antiferromagnetically, but a magnetictransition occurs at the Morin temperature, TM = 260 K,after which spin canting results in weak ferromagnetism.45−48
Both (11 02) hematite surfaces, (1 × 1) and (2 × 1), weremodeled by fully relaxed slabs without inversion symmetry anda vacuum of 19 Å. These slabs contain five Fe2O3 units asdepicted in Figure 1(b), with five atomic layers (three oxygenand two iron layers) within every unit (labeled 1−5 in Figure1). The slabs consist of an upper and a lower surface, which aresymmetry-equivalent. The (2 × 1) reconstructions were builtfrom a (2 × 1) supercell of the bulk-terminated surface,removing oxygen or adding iron depending on the model. Themodels consist of 50 atoms for the bulk-terminated surface and94−102 atoms for the (2 × 1) reconstructions, respectively.A plane-wave cutoff of Rkmax = 7.0, where R is the smallest
atomic sphere radius, was used, and the Brillouin zones of the
surface models were sampled by a 8 × 7 × 1 k-mesh for thebulk terminated model. Atomic-sphere radii of 1.86 and 1.50bohr were chosen for Fe and O, respectively. All surface modelswere relaxed until all residual forces were below 1 mRy/bohr.STM simulations were done in constant-height mode by usingthe Tersoff−Hamann approximation, using a slab withadditional vacuum.49 The electron density in the intervalbetween EF and the limit imposed by the sample bias isdetermined, and the simulated STM images are then obtainedby plotting this partial electron density in a plane above thesurface at a defined height (3−5 Å).Ab initio thermodynamics was used to determine the relative
stability of the (1 × 1) and (2 × 1) reconstructions. The surfacephase diagram was computed with the SCAN (nonempiricalstrongly constrained and appropriately normed) meta GGA50
due to its more accurate results for energies. Scheffler andReuter51 define the surface free energy γ of a semi-infinite slabwith two equivalent surfaces, which are in contact with a gas-phase reservoir, at temperature T and pressure p as
γ μ= − ΣT p NA
G T p N N T p( , , )1
2( ( , , ) ( , ))i i i i i
slab
Here Gslab is the Gibbs free energy; Ni and μi are the numberand chemical potentials of the respective atom species; and Arepresents the surface area. The chemical potentials of Fe andO are linked by the Gibbs free energy of bulk hematite. Hence,the surface free energy can be obtained as a function of theoxygen chemical potential only, which may vary within areasonable range. This range is constrained by an upper limit,where oxygen would condense on the sample, and a lower limit,where the bulk material would start to turn into magnetite(Fe3O4). Because the total energies for small molecules such asO2 or H2O are not accurately described by semilocal DFT, weuse the experimental value for the Gibbs free energy offormation (as was described by Scheffler and Reuter51)
Δ = − −G T p g T p g T p g T p( , ) ( , ) 2 ( , )32
( , )fexp
Fe Obulk
Febulk
O2 3 2
with ΔGfexp(T,p) as the experimental value of the Gibbs free
energy of formation and gx(T,p) as the Gibbs free energy performula unit. This approach allows us to express the Gibbs freeenergy of formation of O2 with results from calculations of bulkmaterials only, which are more accurate than total-energycalculations for the O2 molecule.The Gibbs free energies may be replaced by the total
energies computed by DFT+U calculations, disregardingtemperature-induced entropic contributions. This approxima-tion allows us to construct a surface phase diagram by using thetotal energies of the slab, the bulk material, and the molecularspecies. Based on basic thermodynamics and tabulatedexperimental data, the range of the chemical potential may beconverted into a temperature or pressure scale.
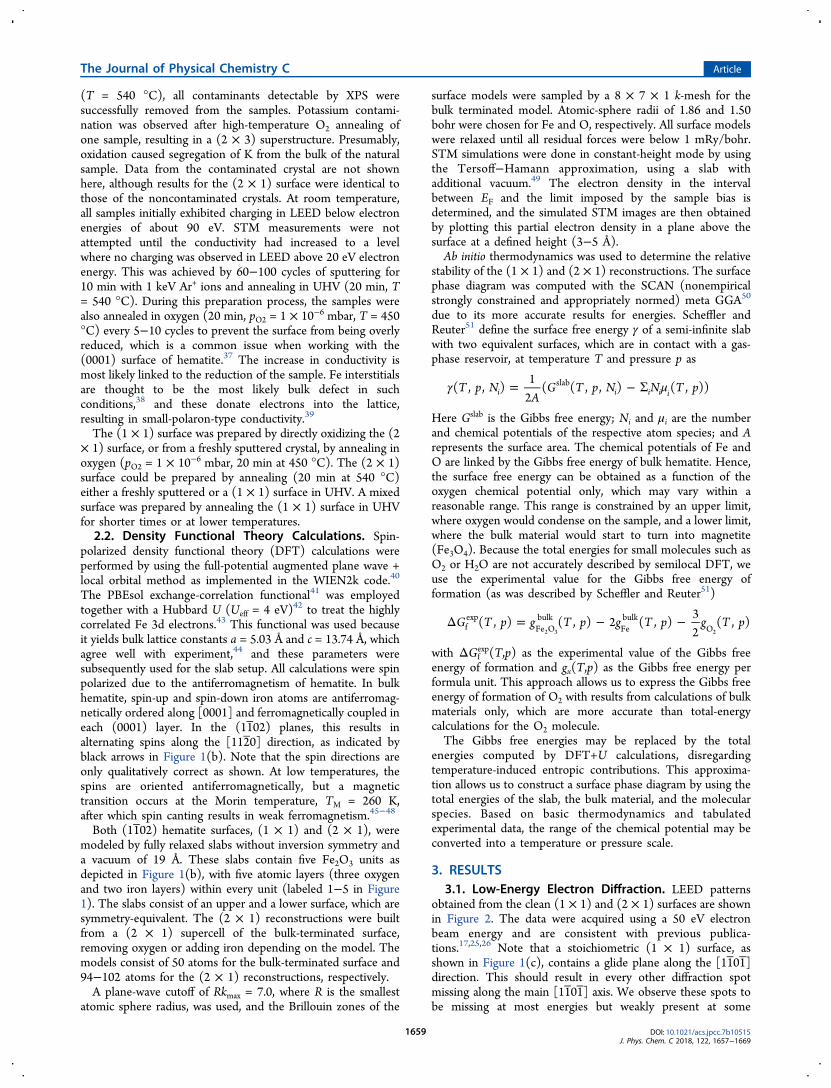
3. RESULTS3.1. Low-Energy Electron Diffraction. LEED patterns
obtained from the clean (1 × 1) and (2 × 1) surfaces are shownin Figure 2. The data were acquired using a 50 eV electronbeam energy and are consistent with previous publica-tions.17,25,26 Note that a stoichiometric (1 × 1) surface, asshown in Figure 1(c), contains a glide plane along the [1101 ]direction. This should result in every other diffraction spotmissing along the main [1101] axis. We observe these spots tobe missing at most energies but weakly present at some
The Journal of Physical Chemistry C Article
DOI: 10.1021/acs.jpcc.7b10515J. Phys. Chem. C 2018, 122, 1657−1669
1659
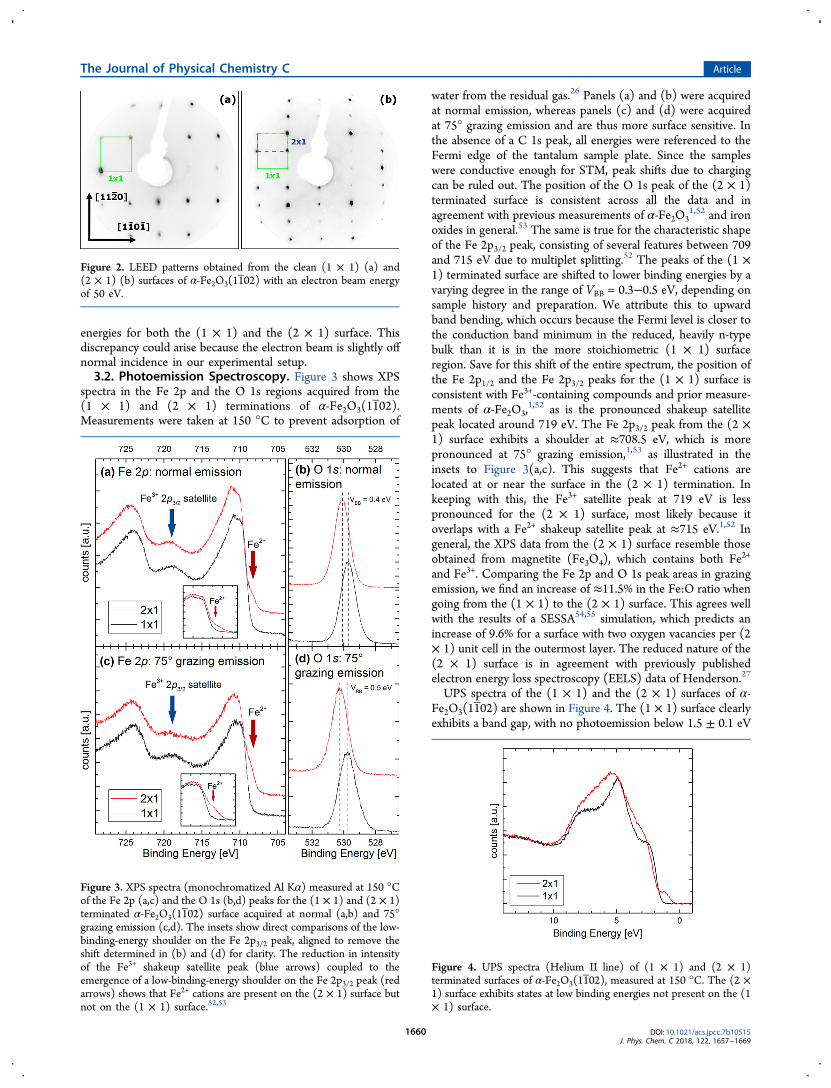
energies for both the (1 × 1) and the (2 × 1) surface. Thisdiscrepancy could arise because the electron beam is slightly offnormal incidence in our experimental setup.3.2. Photoemission Spectroscopy. Figure 3 shows XPS
spectra in the Fe 2p and the O 1s regions acquired from the(1 × 1) and (2 × 1) terminations of α-Fe2O3(11 02).Measurements were taken at 150 °C to prevent adsorption of
water from the residual gas.26 Panels (a) and (b) were acquiredat normal emission, whereas panels (c) and (d) were acquiredat 75° grazing emission and are thus more surface sensitive. Inthe absence of a C 1s peak, all energies were referenced to theFermi edge of the tantalum sample plate. Since the sampleswere conductive enough for STM, peak shifts due to chargingcan be ruled out. The position of the O 1s peak of the (2 × 1)terminated surface is consistent across all the data and inagreement with previous measurements of α-Fe2O3
1,52 and ironoxides in general.53 The same is true for the characteristic shapeof the Fe 2p3/2 peak, consisting of several features between 709and 715 eV due to multiplet splitting.52 The peaks of the (1 ×1) terminated surface are shifted to lower binding energies by avarying degree in the range of VBB = 0.3−0.5 eV, depending onsample history and preparation. We attribute this to upwardband bending, which occurs because the Fermi level is closer tothe conduction band minimum in the reduced, heavily n-typebulk than it is in the more stoichiometric (1 × 1) surfaceregion. Save for this shift of the entire spectrum, the position ofthe Fe 2p1/2 and the Fe 2p3/2 peaks for the (1 × 1) surface isconsistent with Fe3+-containing compounds and prior measure-ments of α-Fe2O3,
1,52 as is the pronounced shakeup satellitepeak located around 719 eV. The Fe 2p3/2 peak from the (2 ×1) surface exhibits a shoulder at ≈708.5 eV, which is morepronounced at 75° grazing emission,1,53 as illustrated in theinsets to Figure 3(a,c). This suggests that Fe2+ cations arelocated at or near the surface in the (2 × 1) termination. Inkeeping with this, the Fe3+ satellite peak at 719 eV is lesspronounced for the (2 × 1) surface, most likely because itoverlaps with a Fe2+ shakeup satellite peak at ≈715 eV.1,52 Ingeneral, the XPS data from the (2 × 1) surface resemble thoseobtained from magnetite (Fe3O4), which contains both Fe2+
and Fe3+. Comparing the Fe 2p and O 1s peak areas in grazingemission, we find an increase of ≈11.5% in the Fe:O ratio whengoing from the (1 × 1) to the (2 × 1) surface. This agrees wellwith the results of a SESSA54,55 simulation, which predicts anincrease of 9.6% for a surface with two oxygen vacancies per (2× 1) unit cell in the outermost layer. The reduced nature of the(2 × 1) surface is in agreement with previously publishedelectron energy loss spectroscopy (EELS) data of Henderson.27
UPS spectra of the (1 × 1) and the (2 × 1) surfaces of α-Fe2O3(11 02) are shown in Figure 4. The (1 × 1) surface clearlyexhibits a band gap, with no photoemission below 1.5 ± 0.1 eV
Figure 2. LEED patterns obtained from the clean (1 × 1) (a) and(2 × 1) (b) surfaces of α-Fe2O3(11 02) with an electron beam energyof 50 eV.
Figure 3. XPS spectra (monochromatized Al Kα) measured at 150 °Cof the Fe 2p (a,c) and the O 1s (b,d) peaks for the (1 × 1) and (2 × 1)terminated α-Fe2O3(11 02) surface acquired at normal (a,b) and 75°grazing emission (c,d). The insets show direct comparisons of the low-binding-energy shoulder on the Fe 2p3/2 peak, aligned to remove theshift determined in (b) and (d) for clarity. The reduction in intensityof the Fe3+ shakeup satellite peak (blue arrows) coupled to theemergence of a low-binding-energy shoulder on the Fe 2p3/2 peak (redarrows) shows that Fe2+ cations are present on the (2 × 1) surface butnot on the (1 × 1) surface.52,53
Figure 4. UPS spectra (Helium II line) of (1 × 1) and (2 × 1)terminated surfaces of α-Fe2O3(11 02), measured at 150 °C. The (2 ×1) surface exhibits states at low binding energies not present on the (1× 1) surface.
The Journal of Physical Chemistry C Article
DOI: 10.1021/acs.jpcc.7b10515J. Phys. Chem. C 2018, 122, 1657−1669
1660

binding energy. The data are consistent with prior UPSmeasurements of an α-Fe2O3 single crystal56 and thin-filmsamples.53 Interestingly, ref 56 contains both regular photo-emission and inverse photoemission spectroscopy data, fromwhich the authors estimate a total bandgap of ≈2.6 eV. On the(2 × 1) surface, the bulk states appear to be shifted to higherbinding energies, with the major valence band contributionsappearing at 1.7 ± 0.1 eV binding energy. A small peak isobserved closer to the Fermi level, contributing photoemissiondown to binding energies as low as 0.6 ± 0.1 eV. The datastrongly resemble that obtained from Fe3O4 samples,53,57 wherethe small peak just below EF is attributed to Fe2+-like cations.The work function was measured with XPS as 5.7 ± 0.2 eV
for the (1 × 1) terminated surface and as 5.4 ± 0.2 eV for the(2 × 1) reconstruction. The work function is determined as thedifference between beam energy and high binding energy cutoff(with respect to the Fermi edge of the Ta sample mount). Thedifference is consistent with the energy shift of the (1 × 1)electronic states observed in both XPS and UPS. Figure 5shows the interrelation of the energies discussed in this section.3.3. Scanning Tunneling Microscopy. STM images of
the α-Fe2O3(11 02)-(1 × 1) surface are shown in Figure 6. Theimages were acquired on the same sample area with (a)negative and (b) positive sample bias and thus represent filledand empty states, respectively. Both images are characterized byzigzag lines of bright protrusions running in the [11 01]direction, which are displaced by ≈5.0 Å in the [112 0]direction. This appearance is consistent with the bulk-truncatedstructure shown in Figure 1(c), with one sublattice selectivelyimaged bright. Using point defects as markers (green andorange circles), we infer that the species imaged as bright zigzaglines differs between the filled and empty state images. STMsimulations (inset), based on our theoretical calculations (seesection 3.5), suggest that the oxygen sublattice is imaged infilled states, whereas the empty state images reveal the surfaceiron sublattice. The nature of the defects is presently unknown,but some are most likely adsorbates from the residual gas. Onepossibility is water, which is known to stick on the (1 × 1)surface at room temperature.26
Figure 7 shows STM images of the α-Fe2O3(11 02)-(2 × 1)surface acquired with positive and negative sample bias on thesame sample area. Both imaging conditions show paired zigzagrows of bright protrusions running in the [11 01] direction. Thepaired rows have a repeat distance in the [112 0] direction of10.1 Å separated by a dark depression, consistent with the (2 ×1) periodicity observed in LEED. High-resolution images(Figure 7(c,e)) of the surface show that the (2 × 1) unit cellcontains a protrusion close to the center. A comparison of thepoint defects in the filled and empty state images (green circlesin Figure 7) suggests that the same surface species are imagedin each case. Over the course of many experiments, it wasobserved that the appearance of the (2 × 1) surface variessomewhat with the tip condition. Although a similar lattice ofprotrusions is always observed, the apparent depth of the dark
Figure 5. Schematic of the experimentally and computationally determined energy levels for the (1 × 1)- and the (2 × 1)-terminated α-Fe2O3(11 02)surface. The computational values are discussed in section 3.5. It should be noted that this figure does not take into account effects such as bandbending and that the experimentally measured O-p edge is that of near-surface oxygen, which might be different in energy from the bulk.
Figure 6. STM images of the α-Fe2O3(11 02)-(1 × 1) surface imaging:(a) filled states (10 × 10 nm2, Usample = −3 V, Itunnel = 0.1 nA) and (b)empty states (10 × 10 nm2, Usample = +3 V, Itunnel = 0.1 nA). Bothimages were acquired on the same sample area and exhibit zigzag rowsof bright protrusions running in the [11 01] direction. The relativepositions of the defects marked in the green and orange circles suggestthat a different sublattice is imaged for each bias polarity. STMsimulations (inset), based on the DFT+U calculations described insections 2.2 and 3.5, are in line with this conclusion. Larger-area STMimages of both the (1 × 1) and the (2 × 1) surface are shown inFigure S1.
The Journal of Physical Chemistry C Article
DOI: 10.1021/acs.jpcc.7b10515J. Phys. Chem. C 2018, 122, 1657−1669
1661

depression between the rows varies, and in some conditions itis not resolved.Additional information about the (1 × 1) to (2 × 1)
transition can be obtained by studying STM images of a mixed-phase surface. The surface in Figure 8 was formed by UHVannealing of the (1 × 1) surface at 500 °C for 15 min. A largedomain of the (2 × 1) structure shown in Figure 7(a) isembedded within the (1 × 1) structure, with a dark depressionat the boundary. As demonstrated by the green lines in Figure8, we see that each zigzag row of the (1 × 1) surface (filled
states) continues in the (2 × 1) phase with a row ofcomparatively large, round protrusions. This suggests that theprotrusions of the (2 × 1) structure are close to the positions ofthe O sublattice in the unreconstructed surface.Given that a (2 × 1) surface can have two possible registries
to the underlying bulk, one would also expect to observeantiphase domain boundaries (APDBs) in the (2 × 1)structure. Such APDBs were rarely observed over the courseof the STM measurements. The rarity of such features, togetherwith the size of uniform (2 × 1) domains such as the oneshown in the inset to Figure 8, is consistent with the predictionby Henderson et al. that growth of existing (2 × 1) domainshappens on a short time scale compared to the emergence ofnew nucleation points.27
3.4. Noncontact Atomic Force Microscopy. The nc-AFM technique provides complementary information to theSTM data. Whereas STM reveals electronic structure, nc-AFMis more sensitive to the atom positions and their chemicalnature.58
In the (1 × 1) case, the images recorded at large tip−sampledistance (Figure 9(a)) resemble the contrast obtained in STMimages, with zigzag rows of bright and dark features along the[11 01] direction. In this regime, the AFM contrast isdominated by electrostatic forces,59 and thus the images aresensitive to the distribution of charge at the surface. Thereduced surface (Figure 9(b)) exhibits a clear (2 × 1)periodicity with bright, elongated protrusions that rotate by90° between neighboring rows. The protrusions are too large tocorrespond to individual surface ions.With a smaller tip−sample separation (Figure 9(c,d,e)), the
image contrast becomes dominated by short-range interactions.This short-range tip−surface interaction on oxide surfaces is amixture of ionic and covalent interactions58,60−62 and may befurther influenced by effects such as Pauli repulsion63 or tipbending.64 Therefore, depending on the tip termination and itsreactivity with the surface, the information on surface ionpositions can be present both in a strong attractive signal and ina highly localized repulsion. On the (2 × 1) reconstruction, wetypically observed strong, localized attractive forces as in Figure9(d). We attribute this to chemical bonding toward the ironsublattice. On the (1 × 1) termination, we observed only weakattractive bonding and repulsion (Figure 9(c)).In the short-range interaction regime, zigzag rows of bright
and dark features are clearly visible on the (1 × 1) surface(Figure 9(c)). Interestingly, the reduced surface (Figure 9(d))looks very similar, and the (2 × 1) periodicity is not obvious atfirst glance. On closer inspection, it is present in a slightdifference in the interaction measured above every second rowof dark features and, more evidently, in a periodic lateraldisplacement of the dark features along the [11 01] direction(green arrow and cyan box in Figure 9(d)).Figure 9(e) shows an image of the (2 × 1) surface obtained
with a different tip, which exhibits the same underlyingstructure but with inverted contrast. Similar contrast reversalhas been observed in pioneering works on TiO2
60−62,65 andlater on other oxides66 and attributed to tips with oppositepolarity. Tips terminated with an anion feel attractive bondingwith surface cations, while the interaction with the oxygensublattice is repulsive and much weaker. Positively terminatedtips provide the opposite situation.Assuming that the contrast shown in Figure 9(d)
corresponds to a negatively charged tip, the dark rows inFigures 9(b) and (d) can be interpreted as zigzag chains of Fe
Figure 7. STM images of the α-Fe2O3(11 02)-(2 × 1) surface in (a)filled states (20 × 20 nm2, Usample = −2.5 V, Itunnel = 0.1 nA) and (b)empty states (20 × 20 nm2, Usample = +2.5 V, Itunnel = 0.1 nA), recordedover the same sample area. The bright protrusions form zigzag lines,with a pronounced gap between each zigzag. The common position ofthe defects (marked in green) in the images suggests that the samesublattice is imaged in both filled and empty states. High-resolutionimages of the (2 × 1) surface are shown in (c) Usample = −1 V, Itunnel =0.1 nA and (e) Usample = +2 V, Itunnel = 0.1 nA. The (2 × 1) unit meshis marked by a yellow rectangle. Note that the unit cell contains aprotrusion slightly off center of the rectangle. STM simulations basedon the “alternating trench” model are shown in (d) for filled states and(f) for empty states.
Figure 8. STM image (12.5 × 12.5 nm2, Usample = −2 V, Itunnel = 0.1nA) of a phase boundary between the (1 × 1) and (2 × 1) surfaceterminations. The green lines demonstrate that the zigzag rows ofsurface oxygen atoms imaged in the (1 × 1) phase are continued by arow of larger protrusions in the (2 × 1) termination. The (2 × 1)reconstruction domain has formed on a (1 × 1) terrace, as can be seenin the inset (50 × 50 nm2, Usample = −2.5 V, Itunnel = 0.1 nA). The redbox in the inset marks the position of the main image.
The Journal of Physical Chemistry C Article
DOI: 10.1021/acs.jpcc.7b10515J. Phys. Chem. C 2018, 122, 1657−1669
1662

cations running in the [1101 ] direction. The same pattern isobserved as a weak repulsion signal in Figure 9(e), and thus thetip was likely positively terminated here. Figure 9(f) and (g)shows both contrasts overlaid by the top two atomic layers ofthe proposed “alternating trench” model for the (2 × 1)reconstruction. The positions of the dark features in Figure 9(f)and the bright features in Figure 9(g) correspond to the cationpositions of the “alternating trench” model, particularly thecharacteristic lateral displacement of cations along the [11 01]direction.3.5. Density Functional Theory Calculations. In Figure
10 we show the results of atomistic thermodynamicscalculations for a variety of different possible α-Fe2O3(11 02)surface structures. Previous models for the (2 × 1)
reconstruction26,29 (see Introduction) were relaxed and thentested, as were several new trial structures based on eitheroxygen vacancies or subsurface Fe interstitials. The plot showsthe surface free energy for each structure as a function of theoxygen chemical potential. Clearly, a stoichiometric surfacewith an essentially bulk-truncated structure (shown in Figure11(a,b)) is most stable under ambient conditions (horizontalblack line). This structure remains the most energeticallyfavorable surface down to an O2 chemical potential of −2.3 eV,which corresponds to an O2 pressure of ≈5 × 10⁻¹⁰ mbar at1000 K, i.e., well into the UHV regime. Structurally, thestoichiometric (1 × 1) termination differs slightly from a bulk-truncated surface; the outermost five layers relax slightly by+0.06, −0.21, +0.05, +0.10, and −0.07 Å, respectively, in thedirection perpendicular to the (11 02) surface, as shown inFigure 11(a,b). Most of the relaxation is due to layer-2 andlayer-4 Fe atoms. All iron cations appear to remain Fe3+, basedon their magnetic moment (≈4 μB) and their core-levelenergies being identical to the bulk atoms. They have bulk-like6-fold octahedral coordination, apart from layer 2 (top Fe layer,see Figure 11(b)), where all iron atoms are 5-fold coordinated(truncated octahedra, missing the topmost oxygen). The topoxygen atoms are 3-fold coordinated, while all other oxygenatoms show the bulk-like 4-fold coordination with oxygenlocated at the center of distorted iron tetrahedra.In a narrow window of chemical potentials at more reducing
conditions, a (2 × 1) reconstruction previously suggested byHenderson et al.26 becomes competitive. This structure (Figure11(c,d)) contains one oxygen vacancy per (2 × 1) unit cell,with oxygen atoms removed along a row in the [1101 ]direction. Some Fe atoms in layer 2 have a 4-fold coordinationand are reduced to an Fe2+-like charge state, and the oxygenzigzag rows in layer 3 tilt out of the (11 02) plane due to theasymmetric relaxation. This structure does not show the lateralFe displacement observed in AFM and is only favorable over avery small range of chemical potentials around μO = −2.35 eV.
Figure 9. Constant-height noncontact AFM data acquired on (a) theα-Fe2O3(11 02)-(1 × 1) surface (8 × 8 nm2, T = 78 K, A = 150 pm)and (b) the α-Fe2O3(1102)-(2 × 1) surface (8 × 8 nm2, T = 5 K, A =500 pm). Panels (c) and (d) show detailed images of the same surfacesacquired at smaller tip−sample distances ((c) 2 × 2 nm2, T = 78 K, A= 100 pm, (d) 2 × 2 nm2, T = 5 K, A = 55 pm). Panel (e) shows the(2 × 1) surface measured with a different tip providing invertedcontrast (2 × 2 nm2, T = 78 K, A = 250 pm). The (1 × 1) and (2 × 1)unit cells are indicated by yellow boxes. A periodic lateral displacementof neighboring rows along the [1101 ] direction is observed in (d), (e),as indicated by the green arrow and the cyan box. Panels (f), (g) showboth contrasts obtained on the (2 × 1) surface overlaid with theproposed “alternating trench” model. The positions of the measureddark (f) and bright (e) features correspond to the cation positions inthe model.
Figure 10. Surface energies calculated by DFT+U for several surfaceterminations as a function of oxygen chemical potential μO (bottom xaxis) and as a function of oxygen pressure at a temperature of 1000 K(top x axis).51 The surfaces calculated to be most stable inexperimentally accessible UHV conditions are drawn as bold lines.These correspond to the surface structures shown in Figure 11. Thesurfaces found to be unfavorable, drawn with dashed lines, are shownin Figure S2.
The Journal of Physical Chemistry C Article
DOI: 10.1021/acs.jpcc.7b10515J. Phys. Chem. C 2018, 122, 1657−1669
1663

At more reducing conditions, a new structure based on twooxygen vacancies per (2 × 1) unit cell is favorable. This“alternating trench” structure (Figure 11(e,f)) is based on theaforementioned vacancy model, but now two rows of oxygenatoms (the first and the fourth atom of the (2 × 1) bulk unitcell) are removed in the [1101 ] direction. This createsalternating wide and narrow trenches, based on the distanceof the remaining top-layer oxygen rows. This is the mostfavorable surface over a broad range of oxygen chemicalpotentials (i.e., between −2.4 and −2.8 eV). These μO valuesare low but still experimentally accessible. A fourth model withthree oxygen vacancies per (2 × 1) unit cell becomesenergetically favorable at oxygen chemical potentials below−2.8 eV; however, this one was not considered further becausemagnetite (Fe3O4) becomes the stable bulk phase at this μO,and a more extensive reduction is to be expected.24
In the “alternating trench” (2 × 1) model, all surface Featoms (layer 2) are 4-fold coordinated and located at the edgesof strongly distorted oxygen tetrahedra. The calculatedmagnetic moments (3.5 μB for Fe2+ and 4 μB for Fe3+ atoms)as well as the partial DOS (Figure 12) suggest that all theseatoms have a charge state of Fe2+. This is further supported by acalculated 1 eV Fe 2p core level shift toward lower bindingenergy of these surface Fe atoms with respect to surface Featoms at the (1 × 1) surface, which corresponds well with theexperimental XPS data (Figure 3). The coordination and
charges of the subsurface atoms (from layer 3 down) in the“narrow” trenches are essentially the same as the (1 × 1)surface. By contrast, in the “wide” trenches, the removal oflayer-1 oxygen atoms results in 5-fold-coordinated iron in layer4. Nevertheless, all layer 4 atoms remain Fe3+, based on theirmagnetic moments.As shown in Figure 11(e,f), the outermost five layers relax
perpendicular to the (11 02) surface by +0.14, −0.25, +0.23,−0.07, and +0.02 Å in the wide trenches and +0.11, −0.14,+0.00, +0.13, and −0.09 Å in the narrow trenches. Due to Fe2+
ions in layer 2, the attraction of layer-1 oxygen atoms is lessstrong. Hence, we find stronger relaxations of layer-1 oxygenatoms in comparison to the bulk-terminated surface (with Fe3+
surface atoms). Crucially, the layer-2 iron cations in the widetrenches also relax slightly in the [1101 ] direction (compare theFe in the corner of the (2 × 1) unit cell to that in the center inFigure 11(e)), in qualitative agreement with the lateral shiftobserved in nc-AFM (green arrows in Figure 9(d,e) and Figure11(e)). It is also notable that the layer-3 oxygen zigzag rows arenarrowed in the wide trench, and these atoms relax towardlayer 2 by 0.02 Å. The Supporting Information containsstructure files for the (1 × 1) and alternating trench (2 × 1)models in CIF file format.The remaining models considered in Figure 10, shown in
Figure S2, proved to be energetically unfavorable. While mostof the models considered here are based on ordered oxygenvacancies, it is also possible to construct a reduced surfacereconstruction based on a (2 × 1) arrangement of subsurfaceiron interstitials, which is how the (√2 × √2)R45°reconstruction on Fe3O4(001) is formed,
67 and would thereforealso seem plausible for hematite. However, no model created inthis way yields satisfactory surface energies in the calculationspresented here.The densities of states for the (1 × 1) bulk-terminated
surface and for the energetically favorable alternating-trench(2 × 1) reconstruction are shown in Figure 12. The bulk-likepartial DOS of O and Fe shows the expected behavior: Withthe GGA+U method, the occupied Fe-d (spin-up) states areshifted down in energy below the O-p states, but nevertheless,there is a significant overlap between Fe and O states. On theother hand, the unoccupied (spin-down) DOS of Fe is shiftedup in energy, forming a gap of about 2 eV between the valenceband (which is dominated by O-p character) and theconduction band. For the (1 × 1) surface, the surface oxygenstates of layer 1 are shifted upward in energy with respect tobulk or layer-3 oxygens, reducing the overlap with the Fe-dband and dominating in an energy range of about 2 eV belowthe valence band maximum. This shift can also be seen in thecalculated O 1s core level shifts of about 0.6 eV to lowerbinding energies with respect to the bulk states. Note that wefind identical surface O 1s core level shifts for both surfaces, inkeeping with the idea that the experimentally observed shiftoriginates from band bending. On the other hand, the surfaceiron states are shifted to lower energies compared to the bulk inboth the valence and the conduction band. This results in aslightly reduced band gap compared to bulk α-Fe2O3.
30
On the (2 × 1) reconstructed surface, two new, sharp spin-down Fe d-bands are observed within the original band gap.They originate solely from the outermost layer of iron and areconsistent with the reduction of the Fe charge states from 3+ to2+ at the surface. The calculations show the new in-gap statesto be filled, in agreement with the additional peak seen in UPSat low binding energy (Figure 4). The states at lower energy
Figure 11. Minimum-energy configurations for the three stable surfaceterminations shown in perspective (a,c,e) and side views (b,d,f), asdetermined by density functional theory calculations. (a,b) The (1 ×1) surface exhibits only minor relaxations from a bulk-terminatedsurface. Two possible models for the (2 × 1) surface are shown: (c,d)a single-oxygen vacancy (2 × 1) reconstruction model previouslysuggested by Henderson et al.26 and (e,f) a new (2 × 1) reconstructionmodel based on two oxygen vacancies per unit cell. The latter istermed the alternating trench model, based on the alternating distanceof the remaining top-layer oxygen rows. The respective unit cells aredrawn in black, oxygen atoms as red, and iron atoms as golden. Thelayer labeling convention shown in (b) is used for all modelsthroughout this paper. Iron cations predicted to have a nominal chargestate of Fe2+ are colored in blue in (d) and (f). A periodic lateraldisplacement along [11 01 ] in the iron sublattice of the “alternatingtrench” model is indicated by the green arrow and the cyan box in (e).
The Journal of Physical Chemistry C Article
DOI: 10.1021/acs.jpcc.7b10515J. Phys. Chem. C 2018, 122, 1657−1669
1664
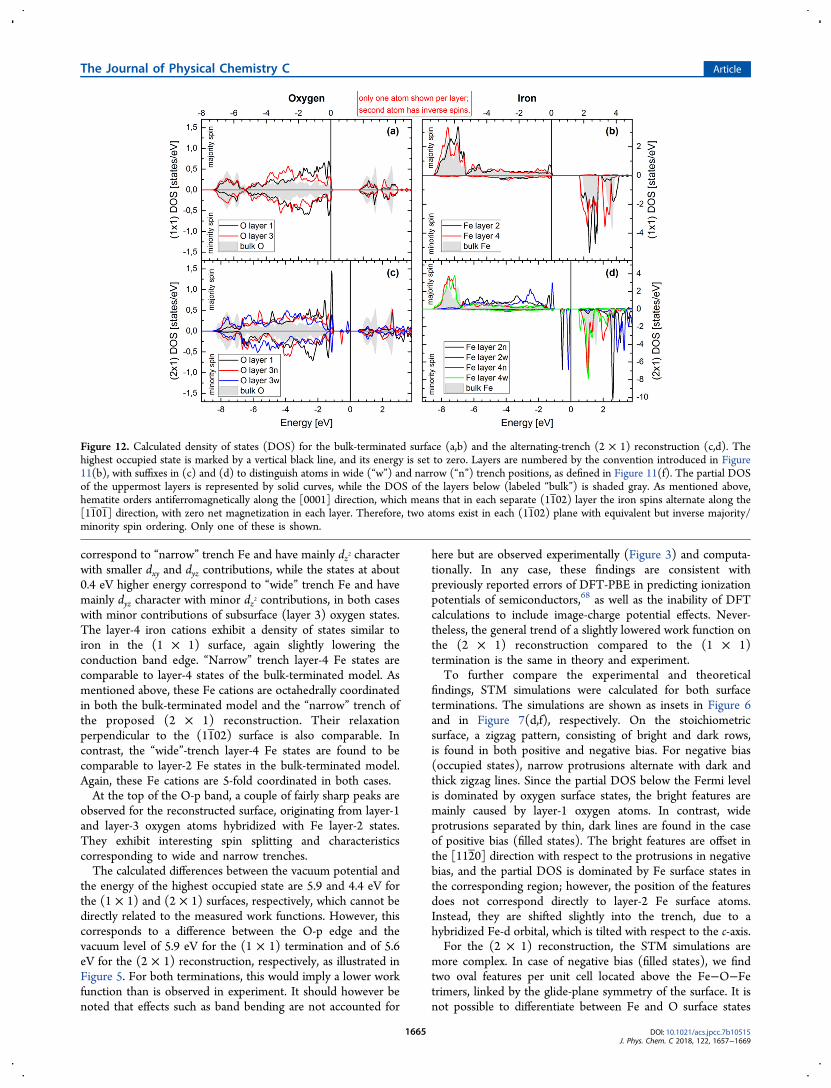
correspond to “narrow” trench Fe and have mainly dz2 characterwith smaller dxy and dyz contributions, while the states at about0.4 eV higher energy correspond to “wide” trench Fe and havemainly dyz character with minor dz2 contributions, in both caseswith minor contributions of subsurface (layer 3) oxygen states.The layer-4 iron cations exhibit a density of states similar toiron in the (1 × 1) surface, again slightly lowering theconduction band edge. “Narrow” trench layer-4 Fe states arecomparable to layer-4 states of the bulk-terminated model. Asmentioned above, these Fe cations are octahedrally coordinatedin both the bulk-terminated model and the “narrow” trench ofthe proposed (2 × 1) reconstruction. Their relaxationperpendicular to the (11 02) surface is also comparable. Incontrast, the “wide”-trench layer-4 Fe states are found to becomparable to layer-2 Fe states in the bulk-terminated model.Again, these Fe cations are 5-fold coordinated in both cases.At the top of the O-p band, a couple of fairly sharp peaks are
observed for the reconstructed surface, originating from layer-1and layer-3 oxygen atoms hybridized with Fe layer-2 states.They exhibit interesting spin splitting and characteristicscorresponding to wide and narrow trenches.The calculated differences between the vacuum potential and
the energy of the highest occupied state are 5.9 and 4.4 eV forthe (1 × 1) and (2 × 1) surfaces, respectively, which cannot bedirectly related to the measured work functions. However, thiscorresponds to a difference between the O-p edge and thevacuum level of 5.9 eV for the (1 × 1) termination and of 5.6eV for the (2 × 1) reconstruction, respectively, as illustrated inFigure 5. For both terminations, this would imply a lower workfunction than is observed in experiment. It should however benoted that effects such as band bending are not accounted for
here but are observed experimentally (Figure 3) and computa-tionally. In any case, these findings are consistent withpreviously reported errors of DFT-PBE in predicting ionizationpotentials of semiconductors,68 as well as the inability of DFTcalculations to include image-charge potential effects. Never-theless, the general trend of a slightly lowered work function onthe (2 × 1) reconstruction compared to the (1 × 1)termination is the same in theory and experiment.To further compare the experimental and theoretical
findings, STM simulations were calculated for both surfaceterminations. The simulations are shown as insets in Figure 6and in Figure 7(d,f), respectively. On the stoichiometricsurface, a zigzag pattern, consisting of bright and dark rows,is found in both positive and negative bias. For negative bias(occupied states), narrow protrusions alternate with dark andthick zigzag lines. Since the partial DOS below the Fermi levelis dominated by oxygen surface states, the bright features aremainly caused by layer-1 oxygen atoms. In contrast, wideprotrusions separated by thin, dark lines are found in the caseof positive bias (filled states). The bright features are offset inthe [112 0] direction with respect to the protrusions in negativebias, and the partial DOS is dominated by Fe surface states inthe corresponding region; however, the position of the featuresdoes not correspond directly to layer-2 Fe surface atoms.Instead, they are shifted slightly into the trench, due to ahybridized Fe-d orbital, which is tilted with respect to the c-axis.For the (2 × 1) reconstruction, the STM simulations are
more complex. In case of negative bias (filled states), we findtwo oval features per unit cell located above the Fe−O−Fetrimers, linked by the glide-plane symmetry of the surface. It isnot possible to differentiate between Fe and O surface states
Figure 12. Calculated density of states (DOS) for the bulk-terminated surface (a,b) and the alternating-trench (2 × 1) reconstruction (c,d). Thehighest occupied state is marked by a vertical black line, and its energy is set to zero. Layers are numbered by the convention introduced in Figure11(b), with suffixes in (c) and (d) to distinguish atoms in wide (“w”) and narrow (“n”) trench positions, as defined in Figure 11(f). The partial DOSof the uppermost layers is represented by solid curves, while the DOS of the layers below (labeled “bulk”) is shaded gray. As mentioned above,hematite orders antiferromagnetically along the [0001] direction, which means that in each separate (1102) layer the iron spins alternate along the[1101 ] direction, with zero net magnetization in each layer. Therefore, two atoms exist in each (1102) plane with equivalent but inverse majority/minority spin ordering. Only one of these is shown.
The Journal of Physical Chemistry C Article
DOI: 10.1021/acs.jpcc.7b10515J. Phys. Chem. C 2018, 122, 1657−1669
1665

based on the partial DOS since there are both oxygen and ironstates below the Fermi level. The maximum intensity of theoval spots is located near the layer-2 Fe atoms in the widetrench but slightly offset in the [1101 ] direction. With positivebias (empty states), droplet-shaped features are observed, withthe same glide-plane symmetry as in negative bias. The ironpartial DOS suggests that the bright centers are mainly due tolayer-2 Fe atoms in the narrow trench (sharp layer-2 states at2.6 eV, drawn black in Figure 12(d)), with smallercontributions from other atoms, which is supported bycomparison with the top view of the unit cell.
4. DISCUSSIONOur results confirm that the α-Fe2O3(11 02)-(1 × 1) surface is astoichiometric bulk termination. Such a termination is stable,based on its Tasker type 2 or “non-polar” classification.69
Structurally, the (1 × 1) surface differs little from that of anideal bulk truncation, with only minor relaxations in the layerspacing near the surface. Interestingly, the 3-fold-coordinatedsurface oxygen atoms exhibit a significantly higher density ofstates at the top of the valence band compared to bulk oxygen,which is why these atoms are imaged bright in filled-state STMimages (Figure 6(a)). The bottom of the conduction band isdominated by states from the 5-fold-coordinated surface Featoms, and these atoms therefore dominate the empty-statesimages (Figure 6(b)). A slight shift to lower energy of the Fe-related states narrows the surface bandgap by ≈0.2 eVcompared to the bulk. Both the XPS and UPS data suggestthat all Fe in the surface is Fe3+, which agrees well with thecalculated magnetic moments.The shift to lower binding energies consistently observed in
XPS and UPS for the (1 × 1) surface can be explained by thesample preparation. First, the sample is rendered conductive byrepeatedly sputtering with Ar+ ions and annealing in UHV. Thisreducing treatment makes the sample bulk an n-type semi-conductor. To form the (1 × 1) termination, the surface isreoxidized, effectively removing the near-surface donors (likelyFe interstitials), resulting in upward band bending. This effectcould be useful for photoelectrochemical water splitting sincethe local field will separate photoinduced electrons and holesand drive holes toward the surface.The XPS data obtained from the (2 × 1) surface clearly show
that the reconstruction involves the reduction of surface ironcations to Fe2+, in line with previous studies.27 In contrast tothe (1 × 1) surface, the atomic-scale structure is notimmediately apparent from the STM images (Figure 7), butthe position of the relatively large protrusions corresponds wellto the outermost oxygen atoms of the “alternating trench”model. STM simulations based on this model resemble theexperimental data, but the shape of the protrusions differsslightly because the simulations include a contribution from theunderlying Fe atoms. Based on the STM simulations, thefeatures on the (2 × 1) surface are expected to line up withrows of oxygen in the (1 × 1) termination, which is in goodagreement with the arrangement we find in Figure 8.Further evidence in favor of the alternating trench model
comes from the nc-AFM images. The images acquired at smalltip−sample distances are qualitatively similar for the (1 × 1)and (2 × 1) surfaces (Figure 9), suggesting that the surface Fesublattice remains intact in the reconstruction. Moreover, thesmall lateral displacement in the registry of neighboring zigzagrows along [11 01] is a feature of the “alternating trench”model, arising because the Fe atoms in the wide and narrow
trenches relax differently due to their differing coordinationenvironment. The tip interacts much more strongly with the (2× 1) surface, consistent with the idea that this surface containsreactive Fe2+ cations. On the other hand, it is difficult to know ifthe bright contrast observed in Figure 9(d) indicates thepositions of surface oxygen atoms or simply the gap betweenthe Fe cations with the least attraction. The strong attractionand poorly localized areas of least attraction suggest the latterscenario.In general, it seems somewhat counterintuitive that the
reduced (2 × 1) reconstruction should be based on oxygenvacancies, given that previous theoretical works have shownthat the formation energy of an Fe interstitial is lower than thatof an oxygen vacancy in bulk hematite.38 Indeed, iron oxidesgenerally tend to deal with stoichiometric variation by varyingthe cation lattice, with the close-packed oxygen sublatticeremaining intact,38,70 and we have recently shown that the (√2× √2)R45° reconstruction on Fe3O4(001) is based on asubsurface array of Fe vacancies and interstitials.67 Never-theless, several (2 × 1) models based on subsurface Fe atoms inoctahedral interstitial sites were tested and found to beextremely unstable compared to models based on surfaceoxygen vacancies.One of the most convincing factors in favor of the
alternating-trench model presented here is that the atomisticthermodynamics calculations predict it to be the most stablesurface at an O2 partial pressure below ≈5 × 10⁻¹⁰ mbar at1000K. Moreover, the predicted transition to the alternatingtrench model occurs at an oxygen chemical potential of −2.4eV, which corresponds well with the preparation conditionsused to create the (2 × 1) surface in the experiments.Interestingly, the surface phase diagram shown in Figure 10predicts stability of a third phase with only one oxygen vacancyper (2 × 1) unit cell in a narrow range around −2.35 eV oxygenchemical potential. Since the calculated stability region is sosmall, and substantial error bars exist in DFT calculations, it isdifficult to conclude if this additional phase is, in fact, realized.A relaxed model of this termination is nevertheless shown inFigure 11(c,d). It is not possible to discount the presence ofthis phase at the (1 × 1)-to-(2 × 1) phase boundaries (Figure8) since no structure is imaged there. However, sincenucleation of the alternating-trench phase appears to bedifficult, probably reducing conditions are needed for itsformation. It is therefore possible that the one-vacancy phase,even if it should be stable in theory, is never observed due toslow transformation kinetics in its stability range.Determination of a reliable structural model is the necessary
first step toward atomic-scale studies of adsorption, surfacechemistry, and (photo)electrochemistry on α-Fe2O3 surfaces.The bulk-truncated nature of the α-Fe2O3(11 02)-(1 × 1)surface is ideal because it is simple and can easily be prepared inUHV. It will be interesting to see if the UHV-prepared surfaceis stable in an aqueous environment and how it compares toprevious studies of α-Fe2O3 in water. With different types ofpreparation, such as chemical etching, hydroxylated surfacemodels with missing cations are also reported to be stable inthese conditions.32,71−73
The structure proposed for the (2 × 1) model is consistentwith all data presented here but certainly requires confirmationby a quantitative structural technique such as surface X-raydiffraction. The possibility to cycle reproducibly between theoxidized and reduced surfaces is ideal to study the impact ofFe2+ cations on surface reactivity. In closing, we note that a (2
The Journal of Physical Chemistry C Article
DOI: 10.1021/acs.jpcc.7b10515J. Phys. Chem. C 2018, 122, 1657−1669
1666

× 1) reconstruction has also been observed on the r-cut surfaceof α-Al2O3, which also has the corundum structure.74,75 It ispossible that a similar alternating trench structure might bepresent there.
■ CONCLUSIONSThe α-Fe2O3(11 02) surface was successfully imaged with bothSTM and nc-AFM and studied with LEED, XPS, UPS, andDFT+U calculations. The results support a stoichiometric bulk-termination model for the (1 × 1) surface, but no previouslysuggested reconstruction explains the STM images acquired onthe (2 × 1) terminated surface. A new model for the (2 × 1)reconstruction is proposed in which two oxygen atoms areremoved per (2 × 1) unit cell. The proposed model is in goodagreement with all existing experimental data and is predictedby DFT+U to be energetically favorable at low oxygen chemicalpotential.
■ ASSOCIATED CONTENT*S Supporting InformationThe Supporting Information is available free of charge on theACS Publications website at DOI: 10.1021/acs.jpcc.7b10515.
Contains Figure S1, showing larger-area STM images,and Figure S2, presenting energetically unfavorable (2 ×1) reconstruction models (PDF)Structure file of the α-Fe2O3(11 02)-(1 × 1) surface in itsminimum energy configuration (CIF)Structure file of the α-Fe2O3(11 02)-(2 × 1) alternatingtrench reconstruction model (CIF)
■ AUTHOR INFORMATIONCorresponding Author*E-mail: [email protected]. Phone: +43 (1) 5880113473.ORCIDFlorian Kraushofer: 0000-0003-1314-9149Michael Schmid: 0000-0003-3373-9357Martin Setvin: 0000-0002-1210-7740Ulrike Diebold: 0000-0003-0319-5256NotesThe authors declare no competing financial interest.
■ ACKNOWLEDGMENTSThe authors gratefully acknowledge funding through projectsfrom the Austrian Science Fund FWF (START-Prize Y 847-N20 (FK, JH, GSP)), the Special Research Project “FunctionalOxide Surfaces and Interfaces” FOXSI (F45 (M Schmid &UD)), the Special Research Project “Vienna ComputationalMaterials Labaratory” ViCoM (F41 (PB)), the EuropeanResearch Council (UD: ERC-2011-ADG_20110209 AdvancedGrant “OxideSurfaces”), the Doctoral College Solids4Fun(MB), and the Doctoral College TU-D (ZJ). The computa-tional results presented have been achieved using the ViennaScientific Cluster (VSC).
■ REFERENCES(1) Parkinson, G. S. Iron Oxide Surfaces. Surf. Sci. Rep. 2016, 71,272−365.(2) Sivula, K.; Le Formal, F.; Gratzel, M. Solar Water Splitting:Progress Using Hematite (α-Fe2O3) Photoelectrodes. ChemSusChem2011, 4, 432−449.
(3) Iandolo, B.; Wickman, B.; Zoric, I.; Hellman, A. The Rise ofHematite: Origin and Strategies to Reduce the High Onset Potentialfor the Oxygen Evolution Reaction. J. Mater. Chem. A 2015, 3, 16896−16912.(4) Tamirat, A. G.; Rick, J.; Dubale, A. A.; Su, W.-N.; Hwang, B.-J.Using Hematite for Photoelectrochemical Water Splitting: A Review ofCurrent Progress and Challenges. Nanoscale Horiz. 2016, 1, 243−267.(5) Marusak, L. A.; Messier, R.; White, W. B. Optical AbsorptionSpectrum of Hematite, α-Fe2O3 near IR to UV. J. Phys. Chem. Solids1980, 41, 981−984.(6) Cherepy, N. J.; Liston, D. B.; Lovejoy, J. A.; Deng, H.; Zhang, J.Z. Ultrafast Studies of Photoexcited Electron Dynamics in γ- and α-Fe2O3 Semiconductor Nanoparticles. J. Phys. Chem. B 1998, 102, 770−776.(7) Launay, J.; Horowitz, G. Crystal Growth and Photoelectrochem-ical Study of Zr-Doped α-Fe2O3 Single Crystal. J. Cryst. Growth 1982,57, 118−124.(8) Warnes, B.; Aplan, F.; Simkovich, G. Electrical Conductivity andSeebeck Voltage of Fe2O3, Pure and Doped, as a Function ofTemperature and Oxygen Pressure. Solid State Ionics 1984, 12, 271−276.(9) Klahr, B.; Gimenez, S.; Fabregat-Santiago, F.; Bisquert, J.;Hamann, T. W. Electrochemical and Photoelectrochemical Inves-tigation of Water Oxidation with Hematite Electrodes. Energy Environ.Sci. 2012, 5, 7626−7636.(10) Klahr, B.; Gimenez, S.; Fabregat-Santiago, F.; Hamann, T.;Bisquert, J. Water Oxidation at Hematite Photoelectrodes: The Role ofSurface States. J. Am. Chem. Soc. 2012, 134, 4294−4302.(11) Rioult, M.; Stanescu, D.; Fonda, E.; Barbier, A.; Magnan, H.Oxygen Vacancies Engineering of Iron Oxides Films for Solar WaterSplitting. J. Phys. Chem. C 2016, 120, 7482−7490.(12) Magnan, H.; Stanescu, D.; Rioult, M.; Fonda, E.; Barbier, A.Enhanced Photoanode Properties of Epitaxial Ti Doped α-Fe2O3(0001) Thin Films. Appl. Phys. Lett. 2012, 101, 133908.(13) Rioult, M.; Belkhou, R.; Magnan, H.; Stanescu, D.; Stanescu, S.;Maccherozzi, F.; Rountree, C.; Barbier, A. Local Electronic Structureand Photoelectrochemical Activity of Partial Chemically Etched Ti-Doped Hematite. Surf. Sci. 2015, 641, 310−313.(14) Zhong, D. K.; Sun, J.; Inumaru, H.; Gamelin, D. R. Solar WaterOxidation by Composite Catalyst/α-Fe2O3 Photoanodes. J. Am. Chem.Soc. 2009, 131, 6086−6087.(15) Woodruff, D. P. Quantitative Structural Studies of Corundumand Rocksalt Oxide Surfaces. Chem. Rev. 2013, 113, 3863−3886.(16) Kuhlenbeck, H.; Shaikhutdinov, S.; Freund, H.-J. Well-OrderedTransition Metal Oxide Layers in Model Catalysis − a Series of CaseStudies. Chem. Rev. 2013, 113, 3986−4034.(17) Lad, R. J.; Henrich, V. E. Structure of α-Fe2O3 Single CrystalSurfaces Following Ar+ Ion Bombardment and Annealing in O2. Surf.Sci. 1988, 193, 81−93.(18) Kurtz, R. L.; Henrich, V. E. Geometric Structure of the α-Fe2O3(001) Surface: A LEED and XPS Study. Surf. Sci. 1983, 129,345−354.(19) Condon, N.; Murray, P.; Leibsle, F.; Thornton, G.; Lennie, A.;Vaughan, D. Fe3O4(111) Termination of α-Fe2O3(0001). Surf. Sci.1994, 310, L609−L613.(20) Condon, N. G.; Leibsle, F. M.; Lennie, A. R.; Murray, P. W.;Vaughan, D. J.; Thornton, G. Biphase Ordering of Iron Oxide Surfaces.Phys. Rev. Lett. 1995, 75, 1961−1964.(21) Condon, N.; Leibsle, F.; Lennie, A.; Murray, P.; Parker, T.;Vaughan, D.; Thornton, G. Scanning Tunnelling Microscopy Studiesof α-Fe2O3(0001). Surf. Sci. 1998, 397, 278−287.(22) Lanier, C. H.; Chiaramonti, A. N.; Marks, L. D.; Poeppelmeier,K. R. The Fe3O4 Origin of the “Biphase” Reconstruction on α-Fe2O3(0001). Surf. Sci. 2009, 603, 2574−2579.(23) Tang, Y.; Qin, H.; Wu, K.; Guo, Q.; Guo, J. The Reduction andOxidation of Fe2O3(0001) Surface Investigated by ScanningTunneling Microscopy. Surf. Sci. 2013, 609, 67−72.(24) Cornell, R. M.; Schwertmann, U. The Iron Oxides: Structure,Properties, Reactions, Occurrences and Uses; John Wiley & Sons, 2003.
The Journal of Physical Chemistry C Article
DOI: 10.1021/acs.jpcc.7b10515J. Phys. Chem. C 2018, 122, 1657−1669
1667

(25) Gautier-Soyer, M.; Pollak, M.; Henriot, M.; Guittet, M. The (1× 2) Reconstruction of the α-Fe2O3(1012) Surface. Surf. Sci. 1996,352, 112−116.(26) Henderson, M. A.; Joyce, S. A.; Rustad, J. R. Interaction ofWater with the (1 × 1) and (2 × 1) Surfaces of α-Fe2O3(012). Surf.Sci. 1998, 417, 66−81.(27) Henderson, M. A. Insights into the (1 × 1)-to-(2 × 1) PhaseTransition of the α-Fe2O3(012) Surface Using EELS, LEED and WaterTPD. Surf. Sci. 2002, 515, 253−262.(28) Henderson, M. A. Surface Stabilization of Organics on Hematiteby Conversion from Terminal to Bridging Adsorption Structures.Geochim. Cosmochim. Acta 2003, 67, 1055−1063.(29) Henderson, M. A. Low Temperature Oxidation of Fe2+ SurfaceSites on the (2 × 1) Reconstructed Surface of α-Fe2O3 (011 2). Surf.Sci. 2010, 604, 1197−1201.(30) Dzade, N. Y.; Roldan, A.; de Leeuw, N. H. A Density FunctionalTheory Study of the Adsorption of Benzene on Hematite (α-Fe2O3)Surfaces. Minerals (Basel, Switz.) 2014, 4, 89−115.(31) Aboud, S.; Wilcox, J.; Brown, G. E., Jr Density FunctionalTheory Investigation of the Interaction of Water with α−Al2O3 andα−Fe2O3(1102) Surfaces: Implications for Surface Reactivity. Phys.Rev. B: Condens. Matter Mater. Phys. 2011, 83, 125407.(32) Lo, C. S.; Tanwar, K. S.; Chaka, A. M.; Trainor, T. P. DensityFunctional Theory Study of the Clean and Hydrated Hematite (11 02).Phys. Rev. B: Condens. Matter Mater. Phys. 2007, 75, 075425.(33) Wang, J.; Rustad, J. R. A Simple Model for the Effect ofHydration on the Distribution of Ferrous Iron at Reduced Hematite(012) Surfaces. Geochim. Cosmochim. Acta 2006, 70, 5285−5292.(34) Pavelec, J.; Hulva, J.; Halwidl, D.; Bliem, R.; Gamba, O.; Jakub,Z.; Brunbauer, F.; Schmid, M.; Diebold, U.; Parkinson, G. S. A Multi-Technique Study of CO2 Adsorption on Fe3O4 Magnetite. J. Chem.Phys. 2017, 146, 014701.(35) Setvin, M.; Javorsky, J.; Turcinkova, D.; Matolinova, I.; Sobotik,P.; Kocan, P.; Ostadal, I. Ultrasharp Tungsten Tips Character-ization and Nondestructive Cleaning. Ultramicroscopy 2012, 113, 152−157.(36) Choi, J.; Mayr-Schmolzer, W.; Mittendorfer, F.; Redinger, J.;Diebold, U.; Schmid, M. The Growth of Ultra-Thin Zirconia Films onPd3Zr(0001). J. Phys.: Condens. Matter 2014, 26, 225003.(37) Lewandowski, M.; Groot, I. M.; Qin, Z.-H.; Ossowski, T.;Pabisiak, T.; Kiejna, A.; Pavlovska, A.; Shaikhutdinov, S.; Freund, H.-J.;Bauer, E. Nanoscale Patterns on Polar Oxide Surfaces. Chem. Mater.2016, 28, 7433−7443.(38) Lee, J.; Han, S. Thermodynamics of Native Point Defects in α-Fe2O3: An Ab Initio Study. Phys. Chem. Chem. Phys. 2013, 15, 18906−18914.(39) Rosso, K. M.; Smith, D. M.; Dupuis, M. An Ab Initio Model ofElectron Transport in Hematite (α-Fe2O3) Basal Planes. J. Chem. Phys.2003, 118, 6455−6466.(40) Blaha, P.; Schwarz, K.; Madsen, G.; Kvasnicka, D.; Luitz, J.WIEN2k: An Augmented Plane Wave Plus Local Orbitals Program forCalculating Crystal Properties; Vienna University of Technology, 2001.(41) Perdew, J. P.; Ruzsinszky, A.; Csonka, G. I.; Vydrov, O. A.;Scuseria, G. E.; Constantin, L. A.; Zhou, X.; Burke, K. Restoring theDensity-Gradient Expansion for Exchange in Solids and Surfaces. Phys.Rev. Lett. 2008, 100, 136406.(42) Ovcharenko, R.; Voloshina, E.; Sauer, J. Water Adsorption andO-Defect Formation on Fe2O3(0001) Surfaces. Phys. Chem. Chem.Phys. 2016, 18, 25560−25568.(43) Anisimov, V. I.; Zaanen, J.; Andersen, O. K. Band Theory andMott Insulators: Hubbard U Instead of Stoner I. Phys. Rev. B: Condens.Matter Mater. Phys. 1991, 44, 943.(44) Finger, L. W.; Hazen, R. M. Crystal Structure and IsothermalCompression of Fe2O3, Cr2O3, and V2O3 to 50 kbars. J. Appl. Phys.1980, 51, 5362−5367.(45) Sandratskii, L.; Kubler, J. First-Principles LSDF Study of WeakFerromagnetism in Fe2O3. EPL 1996, 33, 447.(46) Zboril, R.; Mashlan, M.; Petridis, D. Iron (III) Oxides fromThermal Processes Synthesis, Structural and Magnetic Properties,
Mossbauer Spectroscopy Characterization, and Applications. Chem.Mater. 2002, 14, 969−982.(47) Searle, C.; Dean, G. Temperature and Field Dependence of theWeak Ferromagnetic Moment of Hematite. Phys. Rev. B 1970, 1, 4337.(48) Levinson, L. M. Temperature Dependence of the WeakFerromagnetic Moment of Hematite. Phys. Rev. B 1971, 3, 3965.(49) Tersoff, J.; Hamann, D. Theory of the Scanning TunnelingMicroscope. In Scanning Tunneling Microscopy; Springer: 1985; pp 59−67.(50) Sun, J.; Ruzsinszky, A.; Perdew, J. P. Strongly Constrained andAppropriately Normed Semilocal Density Functional. Phys. Rev. Lett.2015, 115, 036402.(51) Reuter, K.; Scheffler, M. Composition, Structure, and Stability ofRuO2(110) as a Function of Oxygen Pressure. Phys. Rev. B: Condens.Matter Mater. Phys. 2001, 65, 035406.(52) Grosvenor, A.; Kobe, B.; Biesinger, M.; McIntyre, N.Investigation of Multiplet Splitting of Fe 2p XPS Spectra and Bondingin Iron Compounds. Surf. Interface Anal. 2004, 36, 1564−1574.(53) Weiss, W.; Ranke, W. Surface Chemistry and Catalysis on Well-Defined Epitaxial Iron-Oxide Layers. Prog. Surf. Sci. 2002, 70, 1−151.(54) Smekal, W.; Werner, W. S.; Powell, C. J. Simulation of ElectronSpectra for Surface Analysis (SESSA): A Novel Software Tool forQuantitative Auger-Electron Spectroscopy and X-Ray PhotoelectronSpectroscopy. Surf. Interface Anal. 2005, 37, 1059−1067.(55) Werner, W. S.; Smekal, W.; Powell, C. J. NIST Database for theSimulation of Electron Spectra for Surface Analysis (SESSA). Version:2.1, 2016.(56) Zimmermann, R.; Steiner, P.; Claessen, R.; Reinert, F.; Hufner,S.; Blaha, P.; Dufek, P. Electronic Structure of 3d-Transition-MetalOxides: On-Site Coulomb Repulsion Versus Covalency. J. Phys.:Condens. Matter 1999, 11, 1657.(57) Parkinson, G. S.; Mulakaluri, N.; Losovyj, Y.; Jacobson, P.;Pentcheva, R.; Diebold, U. Semiconductor-Half Metal Transition atthe Fe3O4(001) Surface Upon Hydrogen Adsorption. Phys. Rev. B:Condens. Matter Mater. Phys. 2010, 82, 125413.(58) Sugimoto, Y.; Pou, P.; Abe, M.; Jelinek, P.; Perez, R.; Morita, S.;Custance, O. Chemical Identification of Individual Surface Atoms byAtomic Force Microscopy. Nature 2007, 446, 64−67.(59) Gross, L.; Schuler, B.; Mohn, F.; Moll, N.; Pavlicek, N.; Steurer,W.; Scivetti, I.; Kotsis, K.; Persson, M.; Meyer, G. Investigating AtomicContrast in Atomic Force Microscopy and Kelvin Probe ForceMicroscopy on Ionic Systems Using Functionalized Tips. Phys. Rev. B:Condens. Matter Mater. Phys. 2014, 90, 155455.(60) Enevoldsen, G. H.; Pinto, H. P.; Foster, A. S.; Jensen, M. C. R.;Kuhnle, A.; Reichling, M.; Hofer, W. A.; Lauritsen, J. V.; Besenbacher,F. Detailed Scanning Probe Microscopy Tip Models Determined fromSimultaneous Atom-Resolved AFM and STM Studies of theTiO2(110) Surface. Phys. Rev. B: Condens. Matter Mater. Phys. 2008,78, 045416.(61) Enevoldsen, G. H.; Foster, A. S.; Christensen, M. C.; Lauritsen,J. V.; Besenbacher, F. Noncontact Atomic Force Microscopy Studies ofVacancies and Hydroxyls of TiO2(110): Experiments and AtomisticSimulations. Phys. Rev. B: Condens. Matter Mater. Phys. 2007, 76,205415.(62) Yurtsever, A.; Fernandez-Torre, D.; Gonzalez, C.; Jelinek, P.;Pou, P.; Sugimoto, Y.; Abe, M.; Perez, R.; Morita, S. UnderstandingImage Contrast Formation in TiO2 with Force Spectroscopy. Phys.Rev. B: Condens. Matter Mater. Phys. 2012, 85, 125416.(63) Gross, L.; Mohn, F.; Moll, N.; Liljeroth, P.; Meyer, G. TheChemical Structure of a Molecule Resolved by Atomic ForceMicroscopy. Science 2009, 325, 1110−1114.(64) Hapala, P.; Kichin, G.; Wagner, C.; Tautz, F. S.; Temirov, R.;Jelínek, P. Mechanism of High-Resolution STM/AFM Imaging withFunctionalized Tips. Phys. Rev. B: Condens. Matter Mater. Phys. 2014,90, 085421.(65) Lauritsen, J. V.; Reichling, M. Atomic Resolution Non-ContactAtomic Force Microscopy of Clean Metal Oxide Surfaces. J. Phys.:Condens. Matter 2010, 22, 263001.
The Journal of Physical Chemistry C Article
DOI: 10.1021/acs.jpcc.7b10515J. Phys. Chem. C 2018, 122, 1657−1669
1668

(66) Rasmussen, M. K.; Foster, A. S.; Canova, F. F.; Hinnemann, B.;Helveg, S.; Meinander, K.; Besenbacher, F.; Lauritsen, J. V.Noncontact Atomic Force Microscopy Imaging of Atomic Structureand Cation Defects of the Polar MgAl2O4(100) Surface: Experimentsand First-Principles Simulations. Phys. Rev. B: Condens. Matter Mater.Phys. 2011, DOI: 10.1103/PhysRevB.84.235419.(67) Bliem, R.; McDermott, E.; Ferstl, P.; Setvin, M.; Gamba, O.;Pavelec, J.; Schneider, M.; Schmid, M.; Diebold, U.; Blaha, P.; et al.Subsurface Cation Vacancy Stabilization of the Magnetite (001).Science 2014, 346, 1215−1218.(68) Jiang, H.; Blaha, P. GW with Linearized Augmented PlaneWaves Extended by High-Energy Local Orbitals. Phys. Rev. B: Condens.Matter Mater. Phys. 2016, 93, 115203.(69) Tasker, P. The Stability of Ionic Crystal Surfaces. J. Phys. C:Solid State Phys. 1979, 12, 4977.(70) Setvin, M.; Wagner, M.; Schmid, M.; Parkinson, G. S.; Diebold,U. Surface Point Defects on Bulk Oxides: Atomically-ResolvedScanning Probe Microscopy. Chem. Soc. Rev. 2017, 46, 1772−1784.(71) Tanwar, K. S.; Lo, C. S.; Eng, P. J.; Catalano, J. G.; Walko, D. A.;Brown, G. E.; Waychunas, G. A.; Chaka, A. M.; Trainor, T. P. SurfaceDiffraction Study of the Hydrated Hematite Surface. Surf. Sci. 2007,601, 460−474.(72) Tanwar, K. S.; Catalano, J. G.; Petitto, S. C.; Ghose, S. K.; Eng,P. J.; Trainor, T. P. Hydrated α-Fe2O3(1102) Surface Structure: Roleof Surface Preparation. Surf. Sci. 2007, 601, L59−L64.(73) McBriarty, M. E.; von Rudorff, G. F.; Stubbs, J. E.; Eng, P. J.;Blumberger, J.; Rosso, K. M. Dynamic Stabilization of Metal Oxide−Water Interfaces. J. Am. Chem. Soc. 2017, 139, 2581−2584.(74) Gillet, E.; Ealet, B. Characterization of Sapphire Surfaces byElectron Energy-Loss Spectroscopy. Surf. Sci. 1992, 273, 427−436.(75) Schildbach, M.; Hamza, A. Clean and Water-Covered Sapphire(1102) Surfaces: Structure and Laser-Induced Desorption. Surf. Sci.1993, 282, 306−322.
The Journal of Physical Chemistry C Article
DOI: 10.1021/acs.jpcc.7b10515J. Phys. Chem. C 2018, 122, 1657−1669
1669


![Sn- AND 57Fe- MÖSSBAUER INVESTIGATION OF xSnO O ... · 2 119Sn- and 57Fe- Mössbauer investigation of xSnO 2-[(1-x)[α-Fe2O3] nanoparticle system 693 the important role of Sn4+ ions](https://img.pdfslide.us/doc/110x75/5c085d3a09d3f23a458c0090/sn-and-57fe-moessbauer-investigation-of-xsno-o-2-119sn-and-57fe-moessbauer.jpg)


![Hematite from Iron Ore/Lumps [Haematite, mineral form of iron(III) oxide (Fe2O3), Oxide Minerals] - Manufacturing Plant, Detailed Project Report, Profile, Business Plan, Industry Trends,](https://img.pdfslide.us/doc/110x75/577c7bec1a28abe05498aec2/hematite-from-iron-orelumps-haematite-mineral-form-of-ironiii-oxide-fe2o3.jpg)