Embed Size (px)
Citation preview

The ESPON 2013 Programme The Development of the Islands – European Islands and Cohesion Policy (EUROISLANDS)
Targeted Analysis 2013/2/2
Atlas of the Islands
EUROPEAN UNION Part-financed by the European Regional Development Fund INVESTING IN YOUR FUTURE
ESPON EUROISLANDS Project - Atlas of the Islands
ESPON and University of the Aegean 2/39
Contents
Foreword ______________________________________________________ 3
Introduction ___________________________________________________ 4
1. A Typology of European Islands __________________________________ 5
2. A note on methodology: indexes for the state of islands, changes and their attractiveness __________________________________________________ 6
3. The Atlas ____________________________________________________ 8
3.1. The State of European Islands _________________________________________ 9 3.1.1. Efficiency of Islands’ economy __________________________________________________________ 9 3.1.2. Social equity_______________________________________________________________________ 12 3.1.3. Environmental conservation ___________________________________________________________ 18 3.1.4. Synthesis on the State of Islands ______________________________________________________ 20
3.2. Analysis of Attractiveness parameters __________________________________ 24 3.2.1. Measurement of attractiveness parameters _______________________________________________ 24 3.2.2. Classification of Attractiveness factors by islanders _________________________________________ 33 3.2.3. The results of the Delphi workshop _____________________________________________________ 34 3.2.4. Attractiveness indexes _______________________________________________________________ 35
References ___________________________________________________ 38
List of authors
Lead Partner - University of Aegean, Mytilini, Greece
Ioannis SPILANIS Department of Environment, Laboratory of Local and Insular Development Thanasis KIZOS, Department of Geography Michalis VAITIS, Department of Geography, Laboratory of Geo-informatics Nikoletta KOUKOUROUVLI, Laboratory of Geo-informatics
ESPON EUROISLANDS Project - Atlas of the Islands
ESPON and University of the Aegean 3/39
Atlas of the Islands This publication presents part of the results of a Targeted Analysis conducted within the framework of the ESPON 2013 Programme, partly financed by the European Regional Development Fund. The partnership behind the ESPON Programme consists of the EU Commission and the Member States of the EU27, plus Iceland, Liechtenstein, Norway and Switzerland. Each partner is represented in the ESPON Monitoring Committee. This report does not necessarily reflect the opinion of the members of the Monitoring Committee. Information on the ESPON Programme and projects can be found on www.espon.eu The web site provides the possibility to download and examine the most recent documents produced by finalised and ongoing ESPON projects. © ESPON & University of the Aegean, 2010 Printing, reproduction or quotation is authorised provided the source is acknowledged and a copy is forwarded to the ESPON Coordination Unit in Luxembourg. This report should be quoted: ESPON (2010) Islands’ Atlas, The Development of the Islands – European Islands and Cohesion Policy (EUROISLANDS), ESPON 2013 Program ESPON & University of the Aegean
Communication: Ioannis Spilanis, Thanasis Kizos University of the Aegean, University Hill Tel: 22510 36290, 22510 36447, e-mail: [email protected]; [email protected]
Foreword This Atlas represents an effort to scientifically document the state of European Islands and assist all parties involved (the EU, the Commission, Member States, Regional Autrhorities, stakeholders, etc.) to visualize and understand the problems and the issues that islands face today. Insularity is the connecting link, the common characteristic of all islands regardless of their size, population and development level. Insularity expresses ‘objective’ and measurable characteristics, including small areal size, small population (small market), isolation and remoteness, as well as unique natural and cultural environments. However, it also involves a distinctive ‘experiential identity’, which is a non-measurable
quality expressing the various symbols that islands are connected to. With this Atlas, we want to illustrate that the problems of islands are not circumstantial, but at the same time they are also not ‘permanent’. The goal is to use the given geographical and natural characteristics of islands as advantages and not as disadvantages. We hope that you will find it useful, Ioannis Spilanis, Assist. Professor Project Leader and Scientific Responsible

ESPON EUROISLANDS Project - Atlas of the Islands
ESPON and University of the Aegean 4/39
Introduction The purpose of this Atlas is to present some basic and essential facts for European Islands. The facts will be presented under two broad headings: (a) the state of the islands (sustainability indicators) and (b) the attractiveness of the islands. The former heading deals with the situation of Europe’s islands within the context of sustainable development compared to the European mainland. The later heading refers to the causes of this situation and how insularity affects attractiveness. This framework can provide useful information and highlight spatial differences on the problems that islands face today in Europe and the causes of these problems classified to internal and external factors. This approach can lead to conceptualization and implementation of policy measures
to face attractiveness problems and improve the state of the islands eventually. Different sets of indicators are developed for sustainable development and attractiveness. The most important of them make up this Atlas. The complete list of the indicators is analysed in detail in the Scientific Report of the study. The analysis is based on information from 31 Island regions that are European statistical units (Member States, NUTS II or NUTS III). Additional information has been used from other European islands, especially smaller ones that are not covered within this analysis. We have tried to refer to islands and not regions, but, this was not possible due to the lack of consistent and reliable data for all islands as a lot of information does not exist on the island level (especially for coastal islands). Therefore, data for Regions are used in most cases. Qualitative information and results from previous studies, reports, work documents etc. are extensively used. The data used come from available data that have been used already in previous ESPON studies and the ESPON databases for the 24 NUTS II and III island areas. Other sources include quantitative and qualitative data from European Institutions and sources (the EC, Eurostat, the Corine database, the EEA). Environmental
information consist a particular problem: although vital for the special features of islands (limited area, isolation and remoteness), the existing quantitative information is extremely limited even at the NUTS II level. In the next section, a typology of the European islands is presented to meet the reader with the diversity of the islands, from the very big to the very small. Next is a note on the methodology of composite indexes and the indicators of the Atlas follow.
ESPON EUROISLANDS Project - Atlas of the Islands
ESPON and University of the Aegean 5/39
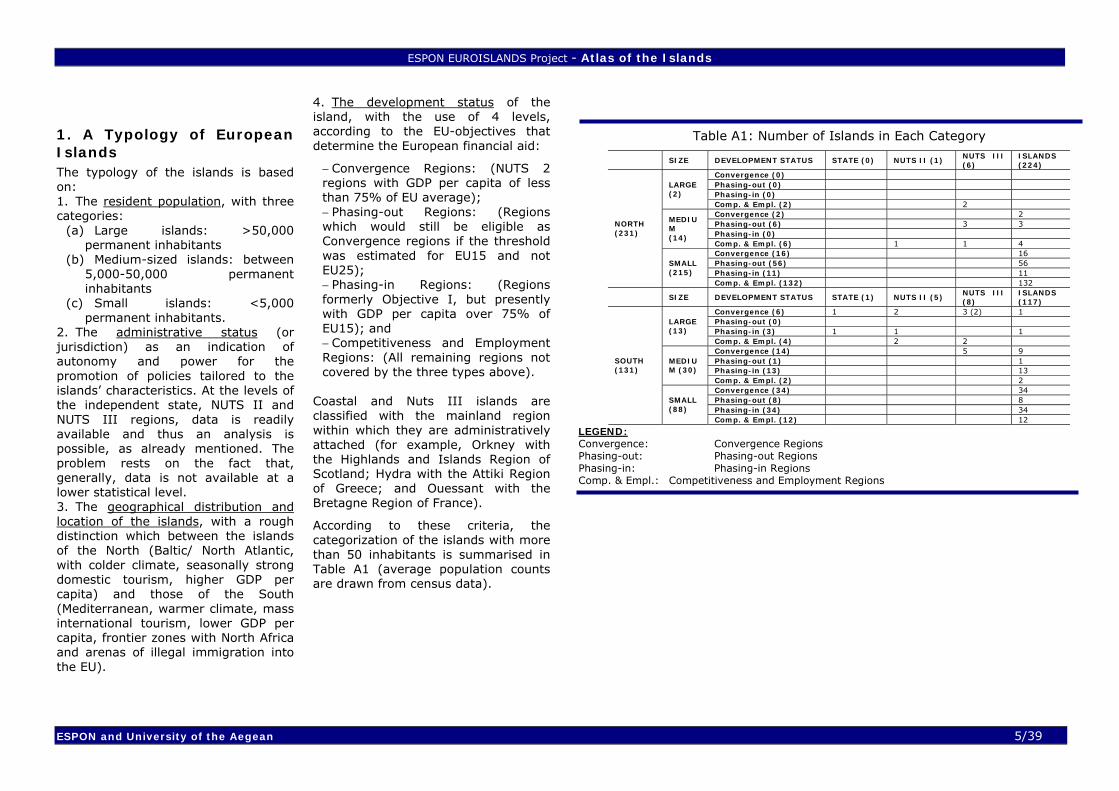
1. A Typology of European Islands The typology of the islands is based on: 1. The resident population, with three categories:
(a) Large islands: >50,000 permanent inhabitants
(b) Medium-sized islands: between 5,000-50,000 permanent inhabitants
(c) Small islands: <5,000 permanent inhabitants.
2. The administrative status (or jurisdiction) as an indication of autonomy and power for the promotion of policies tailored to the islands’ characteristics. At the levels of the independent state, NUTS II and NUTS III regions, data is readily available and thus an analysis is possible, as already mentioned. The problem rests on the fact that, generally, data is not available at a lower statistical level. 3. The geographical distribution and location of the islands, with a rough distinction which between the islands of the North (Baltic/ North Atlantic, with colder climate, seasonally strong domestic tourism, higher GDP per capita) and those of the South (Mediterranean, warmer climate, mass international tourism, lower GDP per capita, frontier zones with North Africa and arenas of illegal immigration into the EU).
4. The development status of the island, with the use of 4 levels, according to the EU-objectives that determine the European financial aid:
− Convergence Regions: (NUTS 2 regions with GDP per capita of less than 75% of EU average); − Phasing-out Regions: (Regions which would still be eligible as Convergence regions if the threshold was estimated for EU15 and not EU25); − Phasing-in Regions: (Regions formerly Objective I, but presently with GDP per capita over 75% of EU15); and − Competitiveness and Employment Regions: (All remaining regions not covered by the three types above).
Coastal and Nuts III islands are classified with the mainland region within which they are administratively attached (for example, Orkney with the Highlands and Islands Region of Scotland; Hydra with the Attiki Region of Greece; and Ouessant with the Bretagne Region of France).
According to these criteria, the categorization of the islands with more than 50 inhabitants is summarised in Table A1 (average population counts are drawn from census data).
Table A1: Number of Islands in Each Category
SIZE DEVELOPMENT STATUS STATE (0) NUTS II (1) NUTS III (6)
ISLANDS (224)
Convergence (0) Phasing-out (0) Phasing-in (0)
LARGE (2)
Comp. & Empl. (2) 2 Convergence (2) 2 Phasing-out (6) 3 3 Phasing-in (0)
MEDIUM (14)
Comp. & Empl. (6) 1 1 4 Convergence (16) 16 Phasing-out (56) 56 Phasing-in (11) 11
NORTH (231)
SMALL (215)
Comp. & Empl. (132) 132
SIZE DEVELOPMENT STATUS STATE (1) NUTS II (5) NUTS III (8)
ISLANDS (117)
Convergence (6) 1 2 3 (2) 1 Phasing-out (0) Phasing-in (3) 1 1 1
LARGE (13)
Comp. & Empl. (4) 2 2 Convergence (14) 5 9 Phasing-out (1) 1 Phasing-in (13) 13
MEDIUM (30)
Comp. & Empl. (2) 2 Convergence (34) 34 Phasing-out (8) 8 Phasing-in (34) 34
SOUTH (131)
SMALL (88)
Comp. & Empl. (12) 12
LEGEND: Convergence: Convergence Regions Phasing-out: Phasing-out Regions Phasing-in: Phasing-in Regions Comp. & Empl.: Competitiveness and Employment Regions

ESPON EUROISLANDS Project - Atlas of the Islands
ESPON and University of the Aegean 6/39
2. A note on methodology: indexes for the state of islands, changes and their attractiveness The attempt to facilitate comparisons between islands and highlight differences among them and between them and their national entities and the European average resulted in the creation of complex indexes with the use of the EU average as a base for the comparisons. Finaly, five different indexes were calculated: (a) One for the state of the islands regions (NUTS 0, 2 and 3 statistical units) and the member states they are located in (State Index); (b) One for changes that have taken place during 2000-6 (Change Index); (c) Three for the attractiveness of the islands: • One for attractiveness based on
issues of accessibility and urban dynamism, the direct effects of insularity (Attractiveness Direct Index);
• One for attractiveness based on indicators that cover the rest of the attractiveness factors identified in the report as indirect effect of insularity (Attractiveness Indirect Index);
• One for the attractiveness based on the natural and cultural potential of the islands (Attractiveness Potential Index).
The 3 attractiveness indexes are not directly comparable and cannot be synthesized to a composite one as the
availability of data is not homogeneous. For urban dynamism the Functional Urban Areas (FUA) concept was used, for which data are available only at NUTS 3 level, which is the case of the accessibility indicators as well.
Therefore, a European average is not available and the classes that were used for the calculation of the index had to be estimated with different methods (details below). Data for Attractiveness Potential Index are also available for NUTS 2/3 regions. On the contrary, indicators for other attractiveness factors (education level, R& D and ICT) are available at NUTS 0 and NUTS2 level. For the values of all indicators 9 classes were created. These classes were constructed with the basic assumption that the European average in the particular indicator and the values around this average should form the middle class and four classes should be constructed with higher values than the middle class and four with lower values. The middle class has a width of ten values and the six subsequent classes also have a ten value width, while the two extreme classes include all the values that are lower or higher. In the two cases where the European average was not available, the range of the values of the indicator was divided by nine and nine equal classes where created. The limits of the classes are presented in Table A2.
Table A2: Limits of the classes used for
the construction of the indexes
Class
Indicators of change, where EU27 change = 0%
Indicators where EU27 = 100
FUA (Max=5, min =0)
Accessibility
(Max=190, min = 24)
1 <-35 < 65 0 to 0,55 24 to 42,4
2 -35 to -25 65-75 0,55 to 1,1 42,4 to 60,8
3 -25 to -15 75-85 1,1 to 1,65 60,8 to 79,2
4 -15 to -5 85-95 1,65 to 2,2 79,2 to 97,6
5 -5 to 5 95-105 2,2 to 2,75 97,6 to 116
6 5 to 15 105-115 2,75 to 3,3 116 to 134,4
7 15 to 25 115-125 3,3 to 3,85 134,4 to 152,8
8 25 to 35 125-135 3,85 to 4,4 152,8 to 171,2
9 > 35 > 135 4,4 to 5 171,2 to 190
The calculation of each index is based on the summing up of the values of the class of the individual indicators, assuming equal weight for each of the indicators that make up the index. The basic assumption is that the higher the value from the EU average the better the value of the index for the geographical areas. Therefore, when the indicator expresses a negative issue, such as the percentage of unemployment, the value of the class was inversed, i.e. if the value was 9 it becomes 1, if it was 8 it becomes 2, etc. Thus, the value of the index is always ‘positive’ and expresses how ‘better’ or ‘worse’ the state, the change or the attractiveness of the areas discussed are compared to the EU average and the average values of the member states with islands (except for the case of the first attractiveness index where the comparison is with the average value of the range of the values of the
indicators). The geographical areas that are considered for the calculation of the indexes include all types of NUTS areas: • EU27 NUTS 0: Member states with islands as
statistical units (NUTS 2 and 3); 11 in total: • Cyprus (CY) island state • Denmark (DK) • Estonia (EE) • Spain (ES) • Finland (FI) • France (FR) • Greece (GR) • Italy (IT) • Malta (MT) island state • Sweden (SE) • United Kingdom (UK) NUTS 2: Island Regions or islands • Corse (FR83) • Ionian Islands (GR22) • North Aegean (GR41) • South Aegean (GR42) • Crete (GR43) • Sicily (ITG1) • Sardegna (ITG2) • Åland (FI20) • Illes Balears (ES53) NUTS 3: Island Regions or islands • Bornhom (DK014) • Mallorca (ES531) • Menorca (ES532) • Eivissa y Formentera (ES533) • Zakinthos (GR221) • Kerkira (GR222) • Kefallinia (GR223) • Lefkada (GR224) • Lesvos (GR411) • Chios (GR412) • Samos (GR413) • Kyklades (GR421) • Dodekanisos (GR422) • Malta (MT001) • Gozo (MT002) • Gotland (SE214) • Island of Wight (UKJ34) • Eilean Siar (Western Isles) UKM64 • Orkney Islands UKM65 • Shetland Islands UKM66
ESPON EUROISLANDS Project - Atlas of the Islands
ESPON and University of the Aegean 7/39
Some of the above islands are included in more than one NUTS level. Malta is such a case, which is both a Member State (along with Gozo) and a NUTS 3 area, separate from Gozo. Greek islands are another case where the NUTS 2 areas GR22, GR41 and GR42 have many islands, but are considered as a single unit, while the NUTS 3 divisions also have typically more than one island (12 for GR422, 20 for GR421, etc.). When data are available for both NUTS 2 and NUTS3 level for the same geographical area, only the NUTS3 data are included in the calculation of the index in order to avoid double counting. Cyprus and Malta are included two times in the calculation of the indexes: within the calculation of the member-states average, but also in the calculation of the islands’ average. The variables selected for the creation of indexes come from the long lists for the state and the attractiveness of the islands, while the availability of data and the degree of correlation between them also were considered during the selection. The State index is calculated with the use of five indicators: (a) GDP per capita 2006 (EU 27=100); (b) The active population / total
population % that is first transformed with the EU27=100 and then the classes are assigned to the values;
(c) The unemployment rate % in 2008 that is first transformed with
the EU27=100 and then the classes are inverted to keep the overall scale of the values of the indicator already discussed above;
(d) The percentage of population older than 65 in 2007, which is first transformed with the EU27=100 and then the classes are inverted to keep the overall scale of the values of the indicator already discussed above.
(e) The percentage of artificial land to the total land from the CORINE data base in 2000, with the EU27=100 and then the classes are inverted.
The State Index is used not only to compare islands with EU average but also for the classification of islands into groups. The Change index covers the period 2000 – 2006 and is calculated with the use of three indicators: (a) population change 2000 - 2006
% that is first transformed with the EU27=100 and then the classes are assigned;
(b) The GDP per capita with the EU27=100 change % 2000 – 2006, where the classes are assigned to the values;
(c) The active population change % 2000-2006, which is first transformed with the EU27=100 and then the values of the indicator are assigned.
The first Attractiveness index (Attractiveness Direct Index) is calculated with the use of two indicators: (a) The average FUA value for which
the classes are assigned;
(b) The ESPON multimodal accessibility indicator;
These two indicators are selected among all attractiveness parameters as the most representative indicators of insularity influencing directly their attractiveness: the first records the differences of dynamism between cities based on their population size and their functions; the second records the difference of accessibility between the European territories, islands included. The second Attractiveness index (Attractiveness Indirect Index) is calculated with the use of five indicators: (a) The percentage of population
with low education level % of the population in 2008 that is first transformed with the EU27=100 and then the classes are assigned and reversed;
(b) Research and Development % of the GDP in 2008 that is first transformed with the EU27=100 and then the classes are assigned (data for NUTS 2 areas refer to 2007);
(c) The percentage of households with broadband access % of the total number of households in 2008, which is first transformed with the EU27=100 and then the values of the indicator are assigned;
(d) The unemployment rate for the group 15 to 24 years old in 2008, which is first transformed with the EU27=100 and then the classes are assigned and reversed;
(e) The governance indicator is based on quantitative and qualitative data produced by the ESPON 2006,
“Governance of Territorial and Urban Policies from EU to local level”, as number of public employees, national governance patterns, shift from government to governance, state structure and process etc.
These five indicators are selected among the attractiveness parameters that are related to “Lisbon Strategy”. Data are available typically at NUTS 2 level and therefore the Index is calculated only for this level. The third Attractiveness index (Attractiveness Assets Index) is calculated with the use of two indicators (data from the ESPON DataBase) in order to evaluate the islands’ potential: (a) The share of Natura 2000 area
on the total area of the islands region;
(b) The density of cultural monuments of the island regions as estimated by ESPON 2006, The role and the spatial effects of Cultural Heritage and Identity (Project 1.3.3).
The values of all indicators are presented and discussed in the text of the Atlas in the next section.
ESPON EUROISLANDS Project - Atlas of the Islands
ESPON and University of the Aegean 8/39
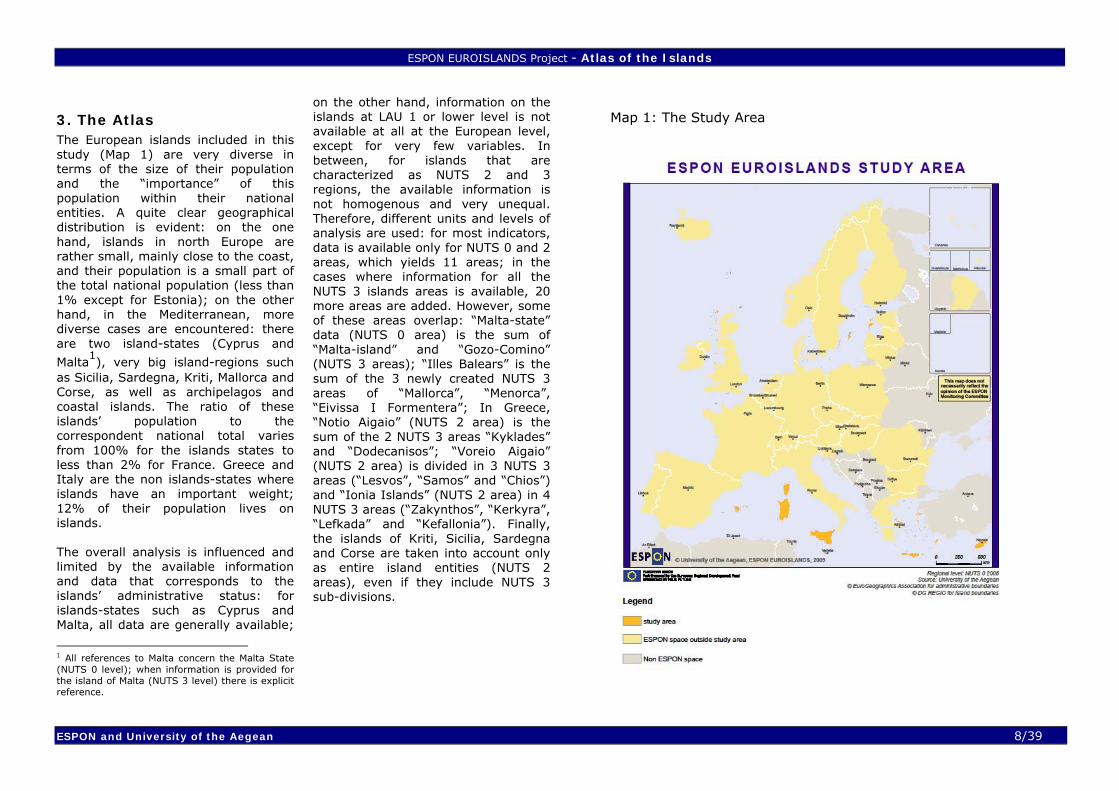
3. The Atlas The European islands included in this study (Map 1) are very diverse in terms of the size of their population and the “importance” of this population within their national entities. A quite clear geographical distribution is evident: on the one hand, islands in north Europe are rather small, mainly close to the coast, and their population is a small part of the total national population (less than 1% except for Estonia); on the other hand, in the Mediterranean, more diverse cases are encountered: there are two island-states (Cyprus and
Malta1), very big island-regions such
as Sicilia, Sardegna, Kriti, Mallorca and Corse, as well as archipelagos and coastal islands. The ratio of these islands’ population to the correspondent national total varies from 100% for the islands states to less than 2% for France. Greece and Italy are the non islands-states where islands have an important weight; 12% of their population lives on islands. The overall analysis is influenced and limited by the available information and data that corresponds to the islands’ administrative status: for islands-states such as Cyprus and Malta, all data are generally available;
1 All references to Malta concern the Malta State (NUTS 0 level); when information is provided for the island of Malta (NUTS 3 level) there is explicit reference.
on the other hand, information on the islands at LAU 1 or lower level is not available at all at the European level, except for very few variables. In between, for islands that are characterized as NUTS 2 and 3 regions, the available information is not homogenous and very unequal. Therefore, different units and levels of analysis are used: for most indicators, data is available only for NUTS 0 and 2 areas, which yields 11 areas; in the cases where information for all the NUTS 3 islands areas is available, 20 more areas are added. However, some of these areas overlap: “Malta-state” data (NUTS 0 area) is the sum of “Malta-island” and “Gozo-Comino” (NUTS 3 areas); “Illes Balears” is the sum of the 3 newly created NUTS 3 areas of “Mallorca”, “Menorca”, “Eivissa I Formentera”; In Greece, “Notio Aigaio” (NUTS 2 area) is the sum of the 2 NUTS 3 areas “Kyklades” and “Dodecanisos”; “Voreio Aigaio” (NUTS 2 area) is divided in 3 NUTS 3 areas (“Lesvos”, “Samos” and “Chios”) and “Ionia Islands” (NUTS 2 area) in 4 NUTS 3 areas (“Zakynthos”, “Kerkyra”, “Lefkada” and “Kefallonia”). Finally, the islands of Kriti, Sicilia, Sardegna and Corse are taken into account only as entire island entities (NUTS 2 areas), even if they include NUTS 3 sub-divisions.
Map 1: The Study Area

ESPON EUROISLANDS Project - Atlas of the Islands
ESPON and University of the Aegean 9/39
The data used for the analysis generally cover the period 1996-2008 and originate from the following European sources: (a) the EUROSTAT web data base; (b) the EUROSTAT Regional Yearbook 2009; (c) the 4th Report on economic and social cohesion, 2007; (d) the ESPON data base and (e) the ESPON Altas.
3.1. The State of European Islands The answer to the question “what is the situation of European Islands within the context of sustainable development?” is derived by pointing out the differences that distinguish the islands from the EU-27 as well as from their national entities. The following analysis is structured in 3 sections that correspond to the three components of sustainable development: the efficiency of islands’ economy; the social equity; and the environmental conservation.
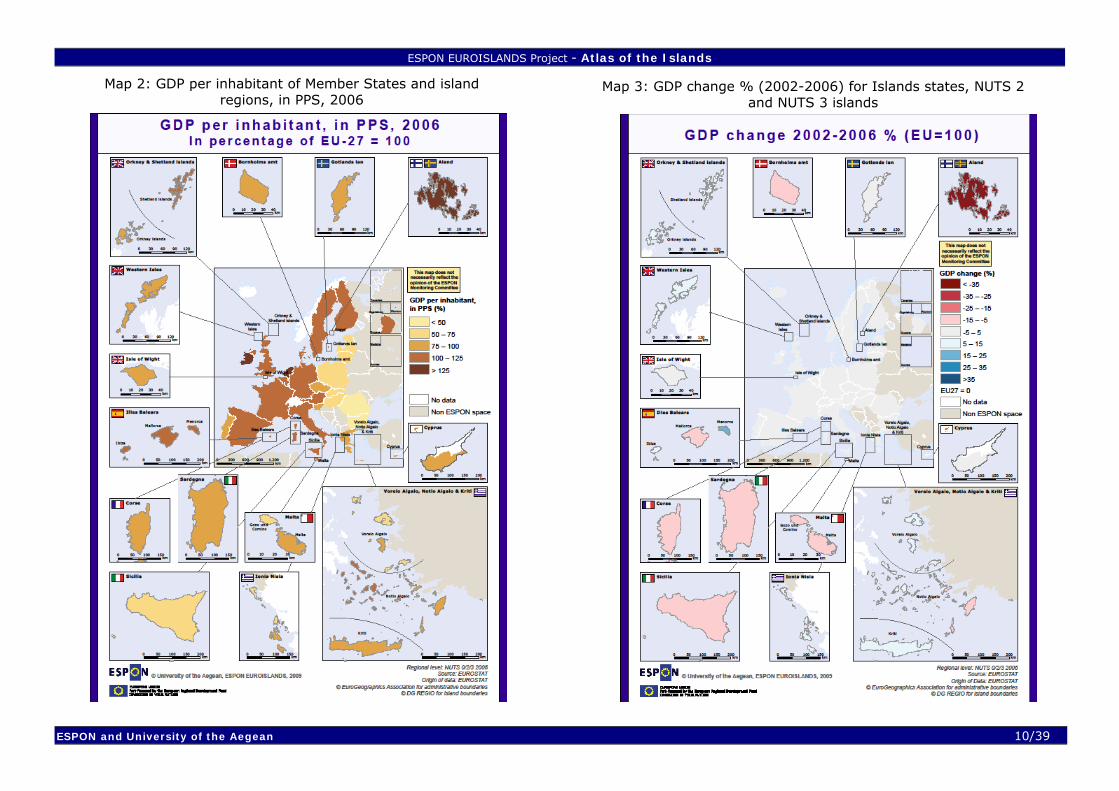
3.1.1. Efficiency of Islands’ economy The degree of the economic success of a region is usually assessed with the use of the Gross Domestic Product (GDP) that describes the value of its output and the effectiveness of its economic system. The GDP per inhabitant (in PPS) is even more helpful to compare economic growth
and the effectiveness of the economy between areas, while its change rate estimates its dynamism. However, the use of this indicator is straightforward only if all the persons involved in generating GDP are also residents of the region in question which is not the case for most of the islands2. The majority of NUTS 2 and 3 islands (24 out of 31, island states included) have GDP per capita (in PPS) below the EU27 average (79,2 in 2006 with EU27=100), with a range of 20,3 compared to 50,0 for the EU-27 (EU, 2009, p.8-9). Only Åland, Illes Balears (NUTS 2), Shetland and Kyklades (NUTS 3) perform better than the European average (146,7, 114,1, 110,9 and 104,0 in 2006 respectively) and Åland, Illes Balears and Kyklades better than the national average (Table A3.1.1 and Map 2). The economic convergence in terms of GDP of the examined NUTS 2/3 island regions with the EU27 average from 2000 to 2006 was positive for some of the NUTS2/3 regions with Western Islands, Shetland, Chios, Kefallinia having the best scores. On the contrary, Sardegna, Sicilia, Malta,
2 Tourism is a typical economic activity that raises production in an area; in many cases an important part of employers and employees does not reside permanently in it. Therefore, the activity generates GDP, but part of this production ‘leaks’ out of the area along with the people that leave when the season ends. In parallel, the created GDP is divided by the number of the permanent inhabitants, giving a high GDP/capita indicator.
Bornholn, Kerkyra and Dodecanisos faced a net divergence compared to EU-27. One region, Ionia Nissia, fell again below the 75% limit of the European average. Consequently, in this period, the majority of the island regions has not followed the trends of the countries and diverged from the EU average (Map 3).
Productivity level is also diverging (EU, 2007, p.178-195): in Corse, Sardegna, Sicilia, and Åland productivity is above
the EU 27 average (in the 100 – 120 class) following the trend of their respective countries. Notio Aigaio and Illes Balears have better scores than the national ones (106,9 compared to 85,1 and 94,5 compared to 91,7 respectively). On the contrary, in Cyprus, Ionia Nisia, Voreio Aigaio and Malta productivity is very low.
Table A3.1.1: Islands Regions, Cohesion Policy objectives and GDP (2006)
Regions NUTS Cohesion Policy Objective % of EU27 average 2006
% of National average 2006
Cyprus 2 Phasing-in 90,3 100,0 Bornholm 3 Competitiveness & Employment 89,4 72,7 Illes Balears 2 Competitiveness & Employment 114,1 109,6 Eivissa y Formentera 3 Competitiveness & Employment 123,8 118,9 Mallorca 3 Competitiveness & Employment 111,5 107,1 Menorca 3 Competitiveness & Employment 124,2 119,3 Åland 2 Competitiveness & Employment 146,7 127,7 Corse 2 Competitiveness & Employment 85,8 78,4 Ionia Nisia 2 Convergence 73,9 78,5 Zakynthos 3 Convergence 92,3 98,1 Kerkyra 3 Convergence 67,1 71,3 Kefallinia 3 Convergence 82 87,1 Lefkada 3 Convergence 64,9 69,0 Voreio Aigaio 2 Convergence 67,4 71,6 Lesvos 3 Convergence 64,1 68,1 Samos 3 Convergence 65,4 69,5 Chios 3 Convergence 75,9 80,7 Notio Aigaio 2 Phasing-in 96,2 102,2 Dodekanisos 3 Phasing-in 91,7 97,4 Kyklades 3 Phasing-in 104 110,5 Kriti 2 Convergence 82,8 88,0 Sicilia 2 Convergence 66,9 64,6 Sardegna 2 Phasing-in 79,5 76,8 Malta 2 Convergence 76,9 100,0 Malta island 3 Convergence 78,4 102,0 Gozo and Comino /Ghawdex 3 Convergence 59,2 77,0 Gotlands län 3 Competitiveness & Employment 98,1 80,7 Isle of Wight 3 Phasing-out 81,1 67,4 Eilean Siar (Western Isles) 3 Phasing-out 77,7 64,5 Orkney Islands 3 Phasing-out 94 78,1 Shetland Islands 3 Phasing-out 110,9 92,1 Source: EUROSTAT, TPG calculations
ESPON EUROISLANDS Project - Atlas of the Islands
ESPON and University of the Aegean 10/39
Map 2: GDP per inhabitant of Member States and island regions, in PPS, 2006
Map 3: GDP change % (2002-2006) for Islands states, NUTS 2 and NUTS 3 islands
ESPON EUROISLANDS Project - Atlas of the Islands
ESPON and University of the Aegean 11/39
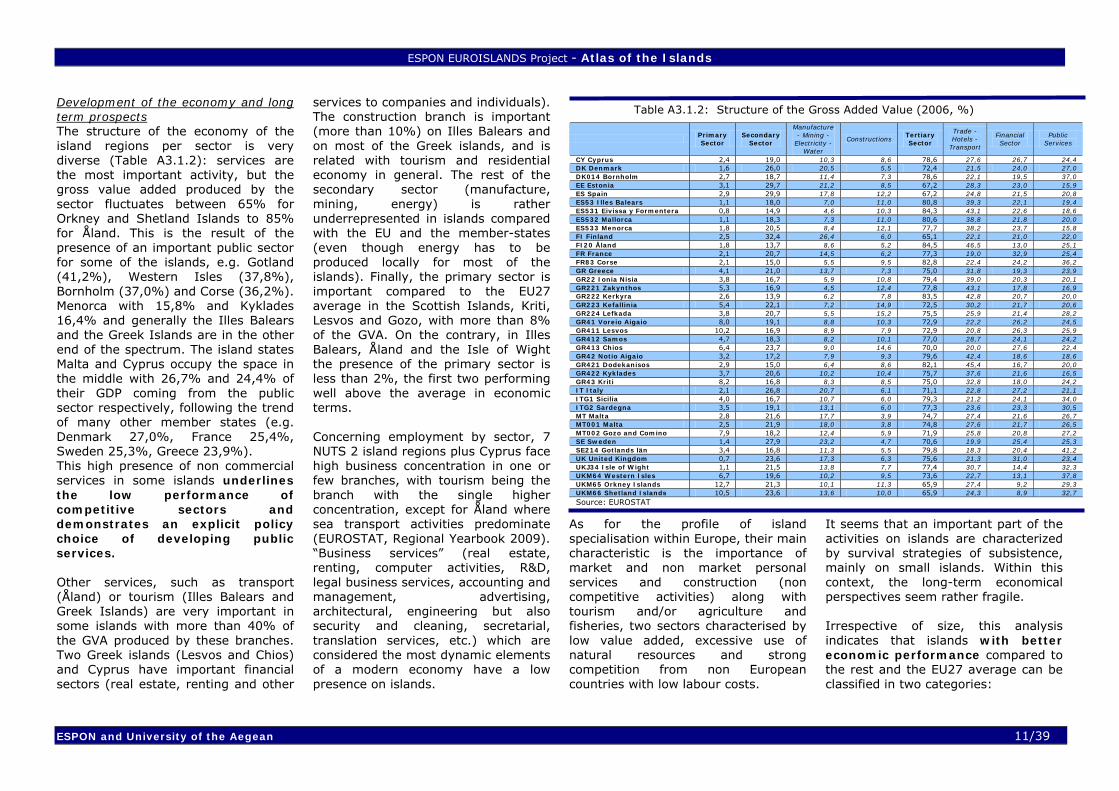
Development of the economy and long term prospects The structure of the economy of the island regions per sector is very diverse (Table A3.1.2): services are the most important activity, but the gross value added produced by the sector fluctuates between 65% for Orkney and Shetland Islands to 85% for Åland. This is the result of the presence of an important public sector for some of the islands, e.g. Gotland (41,2%), Western Isles (37,8%), Bornholm (37,0%) and Corse (36,2%). Menorca with 15,8% and Kyklades 16,4% and generally the Illes Balears and the Greek Islands are in the other end of the spectrum. The island states Malta and Cyprus occupy the space in the middle with 26,7% and 24,4% of their GDP coming from the public sector respectively, following the trend of many other member states (e.g. Denmark 27,0%, France 25,4%, Sweden 25,3%, Greece 23,9%). This high presence of non commercial services in some islands underlines the low performance of competitive sectors and demonstrates an explicit policy choice of developing public services. Other services, such as transport (Åland) or tourism (Illes Balears and Greek Islands) are very important in some islands with more than 40% of the GVA produced by these branches. Two Greek islands (Lesvos and Chios) and Cyprus have important financial sectors (real estate, renting and other
services to companies and individuals). The construction branch is important (more than 10%) on Illes Balears and on most of the Greek islands, and is related with tourism and residential economy in general. The rest of the secondary sector (manufacture, mining, energy) is rather underrepresented in islands compared with the EU and the member-states (even though energy has to be produced locally for most of the islands). Finally, the primary sector is important compared to the EU27 average in the Scottish Islands, Kriti, Lesvos and Gozo, with more than 8% of the GVA. On the contrary, in Illes Balears, Åland and the Isle of Wight the presence of the primary sector is less than 2%, the first two performing well above the average in economic terms. Concerning employment by sector, 7 NUTS 2 island regions plus Cyprus face high business concentration in one or few branches, with tourism being the branch with the single higher concentration, except for Åland where sea transport activities predominate (EUROSTAT, Regional Yearbook 2009). “Business services” (real estate, renting, computer activities, R&D, legal business services, accounting and management, advertising, architectural, engineering but also security and cleaning, secretarial, translation services, etc.) which are considered the most dynamic elements of a modern economy have a low presence on islands.
As for the profile of island specialisation within Europe, their main characteristic is the importance of market and non market personal services and construction (non competitive activities) along with tourism and/or agriculture and fisheries, two sectors characterised by low value added, excessive use of natural resources and strong competition from non European countries with low labour costs.
It seems that an important part of the activities on islands are characterized by survival strategies of subsistence, mainly on small islands. Within this context, the long-term economical perspectives seem rather fragile. Irrespective of size, this analysis indicates that islands with better economic performance compared to the rest and the EU27 average can be classified in two categories:
Table A3.1.2: Structure of the Gross Added Value (2006, %)
Primary Sector
Secondary Sector
Manufacture - Mining -
Electricity - Water
Constructions Tertiary Sector
Trade - Hotels -
Transport
Financial Sector
Public Services
CY Cyprus 2,4 19,0 10,3 8,6 78,6 27,6 26,7 24,4 DK Denmark 1,6 26,0 20,5 5,5 72,4 21,5 24,0 27,0 DK014 Bornholm 2,7 18,7 11,4 7,3 78,6 22,1 19,5 37,0 EE Estonia 3,1 29,7 21,2 8,5 67,2 28,3 23,0 15,9 ES Spain 2,9 29,9 17,8 12,2 67,2 24,8 21,5 20,8 ES53 Illes Balears 1,1 18,0 7,0 11,0 80,8 39,3 22,1 19,4 ES531 Eivissa y Formentera 0,8 14,9 4,6 10,3 84,3 43,1 22,6 18,6 ES532 Mallorca 1,1 18,3 7,3 11,0 80,6 38,8 21,8 20,0 ES533 Menorca 1,8 20,5 8,4 12,1 77,7 38,2 23,7 15,8 FI Finland 2,5 32,4 26,4 6,0 65,1 22,1 21,0 22,0 FI20 Åland 1,8 13,7 8,6 5,2 84,5 46,5 13,0 25,1 FR France 2,1 20,7 14,5 6,2 77,3 19,0 32,9 25,4 FR83 Corse 2,1 15,0 5,5 9,5 82,8 22,4 24,2 36,2 GR Greece 4,1 21,0 13,7 7,3 75,0 31,8 19,3 23,9 GR22 Ionia Nisia 3,8 16,7 5,9 10,8 79,4 39,0 20,3 20,1 GR221 Zakynthos 5,3 16,9 4,5 12,4 77,8 43,1 17,8 16,9 GR222 Kerkyra 2,6 13,9 6,2 7,8 83,5 42,8 20,7 20,0 GR223 Kefallinia 5,4 22,1 7,2 14,9 72,5 30,2 21,7 20,6 GR224 Lefkada 3,8 20,7 5,5 15,2 75,5 25,9 21,4 28,2 GR41 Voreio Aigaio 8,0 19,1 8,8 10,3 72,9 22,2 26,2 24,5 GR411 Lesvos 10,2 16,9 8,9 7,9 72,9 20,8 26,3 25,9 GR412 Samos 4,7 18,3 8,2 10,1 77,0 28,7 24,1 24,2 GR413 Chios 6,4 23,7 9,0 14,6 70,0 20,0 27,6 22,4 GR42 Notio Aigaio 3,2 17,2 7,9 9,3 79,6 42,4 18,6 18,6 GR421 Dodekanisos 2,9 15,0 6,4 8,6 82,1 45,4 16,7 20,0 GR422 Kyklades 3,7 20,6 10,2 10,4 75,7 37,6 21,6 16,5 GR43 Kriti 8,2 16,8 8,3 8,5 75,0 32,8 18,0 24,2 IT Italy 2,1 26,8 20,7 6,1 71,1 22,8 27,2 21,1 ITG1 Sicilia 4,0 16,7 10,7 6,0 79,3 21,2 24,1 34,0 ITG2 Sardegna 3,5 19,1 13,1 6,0 77,3 23,6 23,3 30,5 MT Malta 2,8 21,6 17,7 3,9 74,7 27,4 21,6 26,7 MT001 Malta 2,5 21,9 18,0 3,8 74,8 27,6 21,7 26,5 MT002 Gozo and Comino 7,9 18,2 12,4 5,9 71,9 25,8 20,8 27,2 SE Sweden 1,4 27,9 23,2 4,7 70,6 19,9 25,4 25,3 SE214 Gotlands län 3,4 16,8 11,3 5,5 79,8 18,3 20,4 41,2 UK United Kingdom 0,7 23,6 17,3 6,3 75,6 21,3 31,0 23,4 UKJ34 Isle of Wight 1,1 21,5 13,8 7,7 77,4 30,7 14,4 32,3 UKM64 Western Isles 6,7 19,6 10,2 9,5 73,6 22,7 13,1 37,8 UKM65 Orkney Islands 12,7 21,3 10,1 11,3 65,9 27,4 9,2 29,3 UKM66 Shetland Islands 10,5 23,6 13,6 10,0 65,9 24,3 8,9 32,7 Source: EUROSTAT
ESPON EUROISLANDS Project - Atlas of the Islands
ESPON and University of the Aegean 12/39
- Islands with very clear international specialisation in a low added value activity such as the tourism sector (Illes Balears, Notio Aigaio, Zakynthos, Cyprus). Monoculture is the basis of their current prosperity, which has yielded good results, but at the same time they are more vulnerable than other areas during a crisis.
- Islands with a GDP “boosted” by specific exogenous influences, such as Åland, Shetland, Orkney and Gotland. Such influences range from are the existence of a duty free area (Åland) to oil extraction (Shetland), rather than the utilization of local comparative advantages. The presence of the State is an important reason. This public sector acts like a lever for development, creates employment and GDP, improves the attractiveness for residence (more public services), but presupposes the possibility and the policy option of transferring public resources, human capital and know-how from the national mainland. Islands with a developed and efficient public sector are in general less vulnerable and exposed to external influences; but this option is under threat within a period of bugjet restriction.
Box 1: Main issues in the analysis of islands’ economy:
Islands have an average GDP/capita lower than the EU 27 average, and only few of them perform better (Åland, Illes Balears, Shetland and Kyklades). In general the process of economic convergence is slower than for the rest of the EU regions. Islands are lagging compared to their national entities (except Åland, Kyklades and Illes Balears) For many islands (Nordic islands, Corse, Sicilia and Sardegna) GDP level and employment are sustained by an important public sector; this is a sign of low competitiveness of the economy. Even though services remain the most important activity, two main groups with competitive activities are found: (a) islands where tourism prevails; and (b) few islands with a significant activity in agriculture and fisheries. Long term development perspectives seem rather fragile – even in the islands with high performance-, because of the predominance of low value added activities in an increasingly competitive international environment based on an excessive use of scarce natural resources.
3.1.2. Social equity Population evolution and structure The structure of a population and its change is affected by a number of factors, both external to the area and internal. External factors, such as economic conditions, changes in life styles, cultures and aspirations are considered as more important for shaping the demographic profile of an area. For islands, the demographic profiles have been profoundly changed during the last decades. Here, we focus on differences between islands and the European mainland and discuss some important differences between islands. A general demographic trend of the end of the 1990s was a population decrease on a number of regions in the European periphery, but also in some of the core regions (e.g. in some regions of Germany, Italy and France). This was the result of negative natural balance or of negative migratory balance or a combination of both (ESPON Atlas, 2006, p.10). Most of the island regions considered in this study followed this trend: Sardegna, Sicilia, Voreio Aigaio recorded a significant decline of their population mainly due to a negative natural balance when Gotland, Western Isles and Shetland displayed a minor decrease. Another group of islands, including Illes Balears, Isle of Wight, Kriti, Malta, Cyprus, Notio Aigaio and Åland, recorded an increase.
During the 2000s (Map 4), population projections are in general positive for Western Europe with only a limited number of regions facing population decline (Germany, many Greek regions and some Scandinavian regions), while in Eastern Europe continuing emigration caused again negative trends. For island regions, the evolution is generally positive, with Illes Balears recording the best results (2,9% per year and 4,2% for Eivissa y Formentera) followed by Cyprus (1,6%) and Corse (1,5%). In the Scottish islands, Gotland and Bornholm in the North, Sicilia and Voreio Aigaio in the South the population seems to stabilise or decrease slowly. These positive results seem to come from positive immigration flows and not from natural change, as fertility rates are stable and rather low (1,3) and the replacement level is 2,1 children per woman. This positive immigration has improved the age pyramid as well, as immigrants are younger and have more children (EUROSTAT, Regional Yearbook 2009). These migrants come either from Eastern Europe or from Asia and Africa (legally or illegally) for almost all islands that are external boarders. But, recent positive developments of the population of islands (+0,85%, EU, 2009, p.8) compared to previous decades and the European average (0,37%) obscures the situation of smaller islands especially in archipelagos, which continue to lose population.
ESPON EUROISLANDS Project - Atlas of the Islands
ESPON and University of the Aegean 13/39
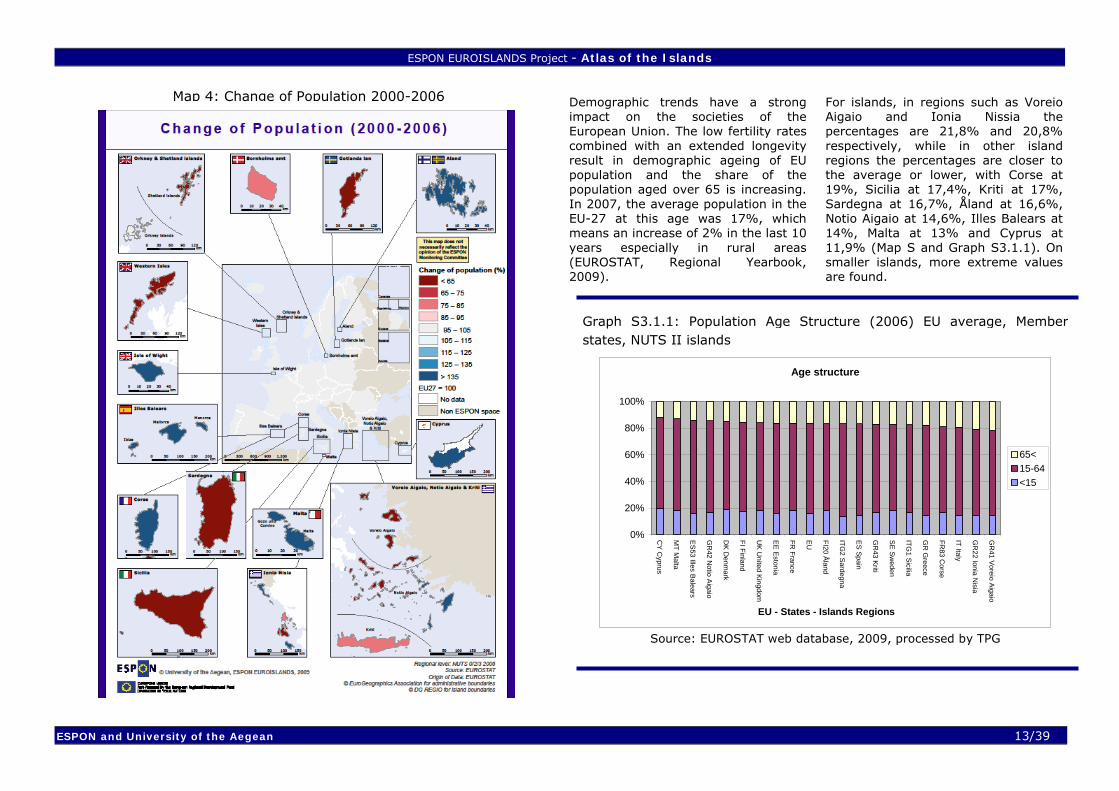
Age structure
Demographic trends have a strong impact on the societies of the European Union. The low fertility rates combined with an extended longevity result in demographic ageing of EU population and the share of the population aged over 65 is increasing. In 2007, the average population in the EU-27 at this age was 17%, which means an increase of 2% in the last 10 years especially in rural areas (EUROSTAT, Regional Yearbook, 2009).
For islands, in regions such as Voreio Aigaio and Ionia Nissia the percentages are 21,8% and 20,8% respectively, while in other island regions the percentages are closer to the average or lower, with Corse at 19%, Sicilia at 17,4%, Kriti at 17%, Sardegna at 16,7%, Åland at 16,6%, Notio Aigaio at 14,6%, Illes Balears at 14%, Malta at 13% and Cyprus at 11,9% (Map S and Graph S3.1.1). On smaller islands, more extreme values are found.
Map 4: Change of Population 2000-2006
Graph S3.1.1: Population Age Structure (2006) EU average, Member states, NUTS II islands
Age structure
0%
20%
40%
60%
80%
100%
CY
Cyprus
MT M
alta
ES
53 Illes Balears
GR
42 Notio A
igaio
DK
Denm
ark
FI Finland
UK
United K
ingdom
EE
Estonia
FR France
EU
FI20 Åland
ITG2 S
ardegna
ES
Spain
GR
43 Kriti
SE
Sw
eden
ITG1 S
icilia
GR
Greece
FR83 C
orse
IT Italy
GR
22 Ionia Nisia
GR
41 Voreio A
igaio
EU - States - Islands Regions
65<15-64<15
Source: EUROSTAT web database, 2009, processed by TPG

ESPON EUROISLANDS Project - Atlas of the Islands
ESPON and University of the Aegean 14/39
Map 5: Population ageing (>65 years old) for Island states, NUTS 2 and NUTS 3 islands
Map 6: Economically Active Population as % of the total population
ESPON EUROISLANDS Project - Atlas of the Islands
ESPON and University of the Aegean 15/39
Economically active Population and Employment Rate These two indicators give an indication of the dynamism and the competitiveness of the local economy. Demography influences the supply of labour but the economic performance creates jobs opportunities and demand for labour in terms of numbers and skills. Economically active population rate is more influenced by demography as it reflects the percentage of the young (<15) and the old (>65) population of the area. Only 4 islands (Zakynthos, Eivissa I Formentera, Åland and Gotland) out of the 28 island NUTS 0, 2 and 3 areas (EUROSTAT data base, 2006) score better than the EU average 54,5% (Map 6). The same pattern is observed for female activity: with a European average at 55,9%, Åland is the leading region with 76,7% followed by Cyprus (58,4%) and Illes Balears (57,5%); while Sicilia and Malta have the lowest scores (28,1% and 32,1% respectively) (Table A3.1.4). It seems that Åland -following Nordic trends- and the tourism influenced islands (mainly Illes Balears, Cyprus and Notio Aigaio) have employment rates higher than the EU average and the rest of the island regions. Unemployment Unemployment is a very important parameter for social cohesion as it raises the risk of poverty and weakens the social fabric. It is the most visible sign of labour market imbalances, reflecting shortfall in jobs, mismatch
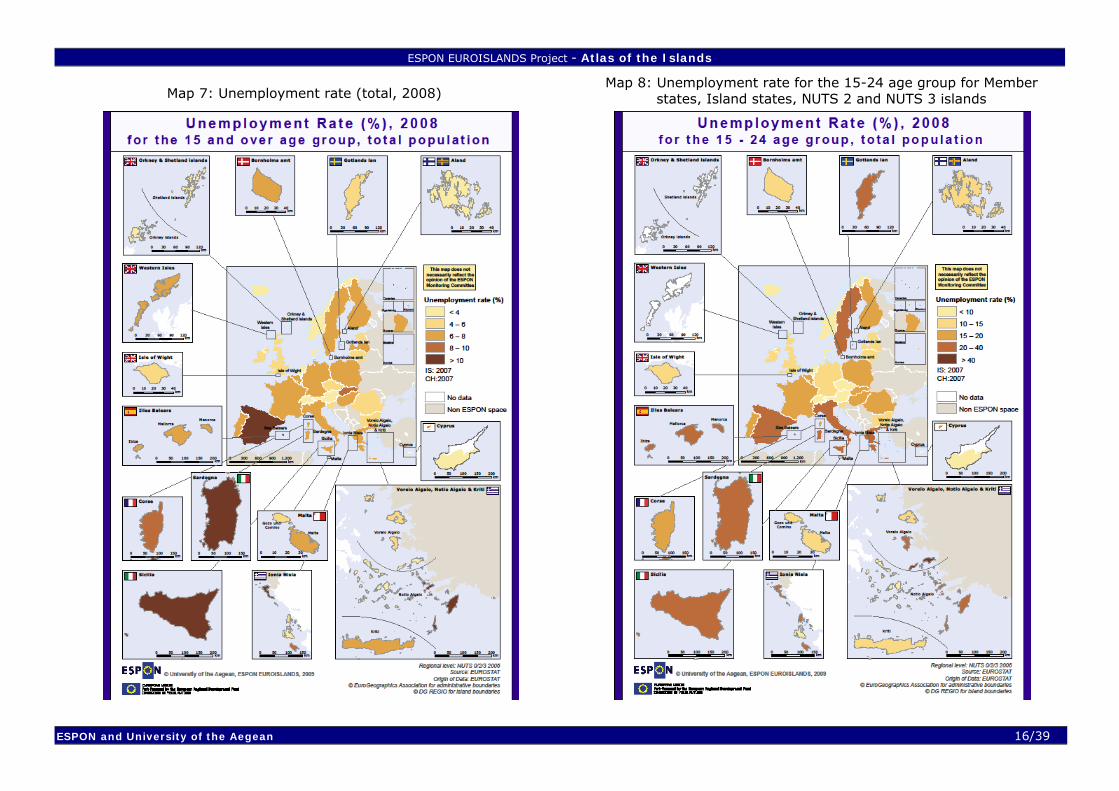
between offered and needed skills and structural deficiencies. But, the complete picture is not always provided by the unemployment rate alone, as in areas with limited employment opportunities some choose to abandon the labour market or to emigrate. Therefore, the unemployment rate could be low, but jobs could be sparse at the same time. Such an example seems to be Malta, where the absence of job opportunities is reflected by the very low activity rate but not by the unemployment rate. Women, the young and long term unemployed provide complementary information for the labour picture of the endogenous potential of the region. With an average EU 27 rate at 7% for 2008, East Germany, Poland, many Finish regions and a big part of the Mediterranean regions face serious unemployment problems (EUROSTAT, 2009). In 2007, this EU27 average was at 7,5% compared to 11,6% for island regions (EU, 2009, p.8). Among these regions, Sicily, Sardegna, Kerkyra, Zakynthos, the Dodecanese and Corse perform worse, while Åland and generally the Nordic islands perform better (Map 7). The changes of the unemployment rate are very diverse: e.g. in Corse it dropped from 22,2% to 8,2% from 2000 to 2007, in Voreio Aigaio from 11,5% to 4,5%, in Sardegna from 20,0% to 12,2% and in Sicilia from 24,0% to 13,8%, compared to the EU average drop of 1,7%. These changes appear to
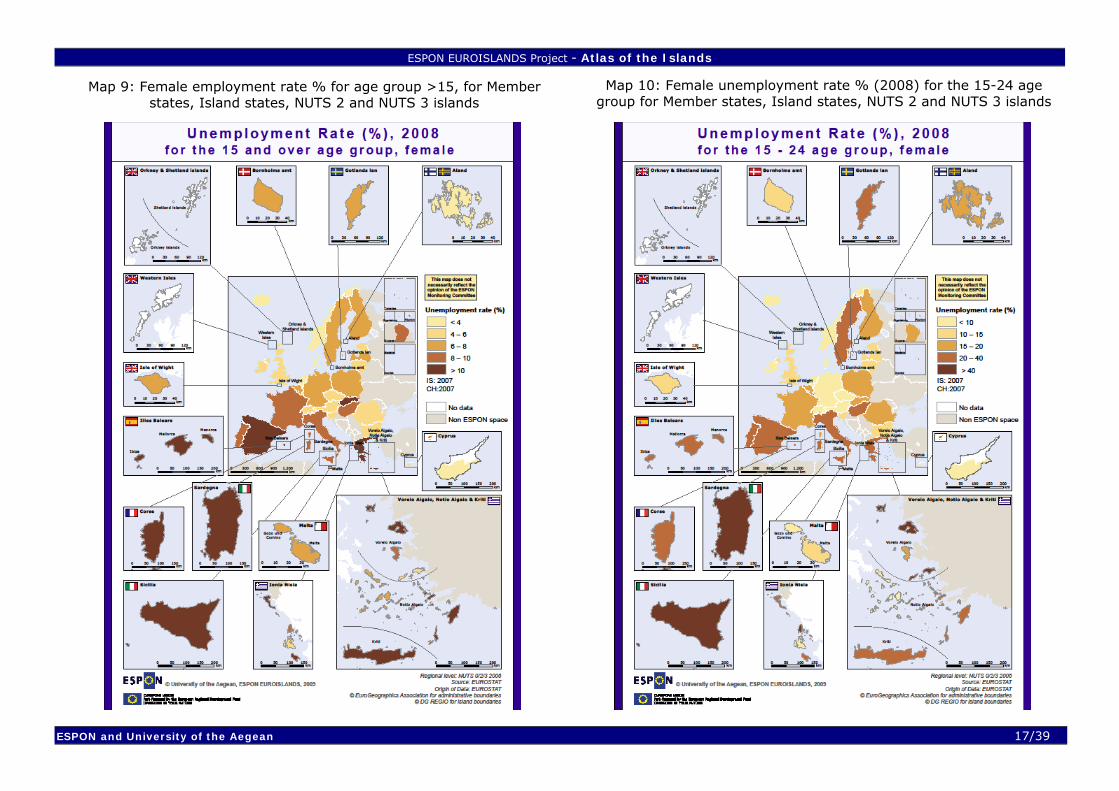
highlight structural employment problems in these areas, rather than indicating a sharp rise of employment. Unemployment of the young in EU 27 is more than double of the overall unemployment rate (15,5% compared to 7% in 2008). The lowest rate is recorded in Cyprus with 9%, while the highest ones on Sicilia and Sardegna of 39,3% and 36,8% respectively (Table S3.1.4, Map 8). Female unemployment is higher in the 7 NUTS 2 island regions for which data are available (no data available for Åland and Voreio Aigaio) than the EU 27 (7,5% in 2008); only Cyprus (4,2%) and Malta (6,8%) have recorded better scores, while on Sicilia, Sardegna, Notio Aigaio, Ionia Nissia and Corse rates of more than 12% are recorded (Table A3.1.4, Maps 8 and 9). Long-term unemployment is very high in Corse, Sardegna, Sicilia, and Voreio Aigaio (more than 45%, with a EU 27 average at 37,2%, Table A3.1.4). Income As already analyzed, the Gross Domestic Product is an index for measuring the efficiency of the economy. However owing to different interregional linkages and state interventions, the GDP generated in a given region does not always correspond to the income available to the inhabitants of the region. Therefore, in order to estimate the population’s welfare the knowledge of income levels (primary and disposable)
per inhabitant and its trends is necessary. The first important issue revealed by incomes is the risk of poverty3 for different groups of population. For islands, with an EU-27 average income of 16.200 € for 2006, (EUROSTAT, 2009) only in Åland (17.190 €) and Illes Balears (18.306 €) the incomes are higher. On the contrary, in Sicilia (11.372 €) and the Greek insular regions the average income per capita is very low (e.g. in Ionia Nissia 10.176 € and in Kriti 10.856 €) and close to 60% of the European average. Out of these regions, in Sicilia the average income is also close to the national poverty rate (average income for Italy at 17.632 €) which means that an important part of the population of the island is living in poverty. Considering that the non active (young, women and older people) and the unemployed have a higher poverty risk and having in mind the low active population percentages in most of the island regions, these seem to tend to concentrate high percentage of population at poverty risk. In combination with previous results, the main conclusion is that the size of the island does not seem to affect income, which is positively correlated with economic performance.
3 The population, whose disposable income is below 60% of the national average level of income, as measured by the median (on the assumption that household income is distributed evenly between all members), is considered to be in a risk of being socially excluded.
ESPON EUROISLANDS Project - Atlas of the Islands
ESPON and University of the Aegean 16/39
Map 7: Unemployment rate (total, 2008) Map 8: Unemployment rate for the 15-24 age group for Member
states, Island states, NUTS 2 and NUTS 3 islands
ESPON EUROISLANDS Project - Atlas of the Islands
ESPON and University of the Aegean 17/39
Map 9: Female employment rate % for age group >15, for Member states, Island states, NUTS 2 and NUTS 3 islands
Map 10: Female unemployment rate % (2008) for the 15-24 age group for Member states, Island states, NUTS 2 and NUTS 3 islands
ESPON EUROISLANDS Project - Atlas of the Islands
ESPON and University of the Aegean 18/39
Box 2: Main issues of the analysis on
the social equity: - After a general population decrease in the nineties, the trend is rather positive since the 2000s, mostly due to in-migration flows. But this is shielding an important and persistent decrease trend that characterises the smaller islands, especially in archipelagos. - Activity rate is significantly higher in the Nordic and the touristic islands. - Unemployment, especially of young and female, is rather high but there is no correlation with the level of GDP.
3.1.3. Environmental conservation Environmental conservation concerns the capacity of the natural capital to ensure the supply of environmental goods and services to a specific community and to preserve ecosystem functions and increase the quality of life. This capacity is endangered by the pressures inflicted by human activities. For island regions, previous ESPON studies (ESPON 2006a; 2006b) will be used to assess pressures from the population and human interventions. Population density is used as a first approach, although it does not include seasonal pressures by non permanent residents and tourists. New constructions that are added to the existing ones increase these pressures,
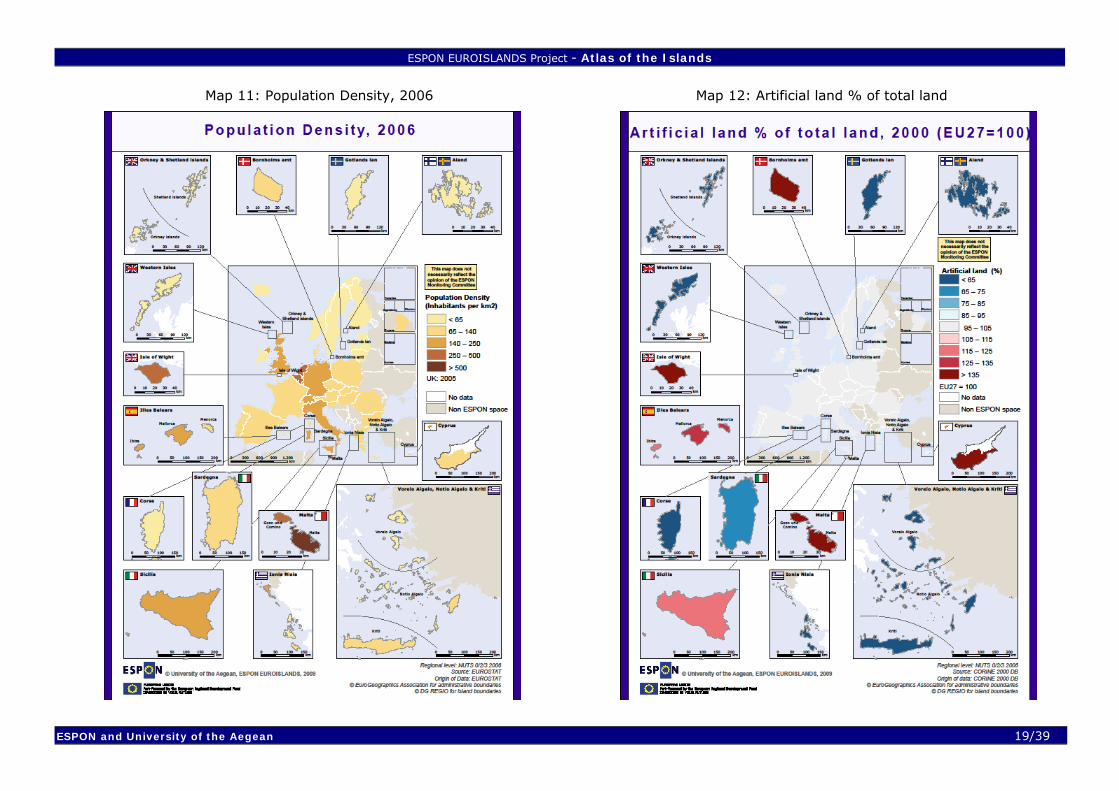
as the residential economy has become a very important activity in the majority of the islands. The classification of islands by their population density yields very diverse results (Map 11):
- Very sparsely populated islands, with less than 12,5 inhabitants per km2 (c. 58.000 inhabitants). Most of these are in North Europe but there are some in the Mediterranean (Notio Aigaio). The majority (147 islands) is small islands with population less than 50 inhabitants, but there are 73 islands with population between 50 and 5895 (Uist – Western Isles). - Sparsely populated islands, with density between 12,5 and 50 inhabitants per km2, approximately 60.000 inhabitants in total. The category includes 60 very small islands, plus 123 larger ones. - Islands with intermediate density, between 50 and 114 inh./ km2 (the EU27 average). In this category, 12 small and 53 larger islands are included, with approximately 3,5 million people in total.
- Densely populates islands, with higher population density than the EU average (114 inhabitants/ km2). In this category, 5 small and 58 large islands are included. From these, 35 have more than 200 inhabitants/km2 and 15 of them over 500 (Malta, 4 Italian coastal islands from which Ischia is the most densely populated one and 10
coastal islands in northern Europe are included). In general, pressures on the resources of all these islands are very high and so is the artificialization of the environment. On the islands of this category live approximately 6,8 million islanders. A brief description of the state of island environment follows.
Land use and land cover The part of the area under artificial cover is the first indication of existing pressures (Map 12). Trends are diverging: on some islands (Malta, Cyprus, Bornholm, Isle of Wight and Mallorca artificial areas cover more than the Eu average and more than 10% of the total area. On others, semi-natural or natural areas are very important and artificial areas rather limited. But even in these islands, artificial areas tend to cover the coastal strip, where pressures are more important. A more spatial approach is required (see the Scientific Report of the study for one in the case study islands). Fresh water availability Most of the islands, regardless their size, face overexploitation issues of their underground water, a fact that has put much stress on underground aquifers (Benoit and Comeau, 2005). The construction of dams and desalination plants has been a common response, but such interventions have created secondary environmental problems the most
important of which are the prevention of the normal circulation of sediments that are vital for the preservation of beaches. Sea and coasts The eastern part of the Mediterranean Sea is less productive than the western part. However, over the last few decades, Mediterranean ecosystems have experienced biodiversity changes due to climatic and environmental changes or to accidental introduction of exotic species. Observed changes in nutrient concentrations and ratios in the deep waters of the Western Mediterranean suggest that shifts have occurred in the relative distribution of nutrients and therefore probably phytoplankton species in all sea waters. The most significant pollution sources are industrial emissions, municipal waste and urban waste water, responsible for up to 80% of pollution in the Mediterranean Sea. Problems of sea pollution are very important in the northern seas and especially in the Baltic Sea where eutrophication is an important problem along with the collapse of the fishing stocks. Concerning sea pollution, problems for all islands stem mainly from the European mainland and the sea transport than from the islands, as for most of them the only pressure is from household and tourism waste as sewage treatment doe not cover yet all settlements. Only in a few big islands industrial activity is found along with related problems.
ESPON EUROISLANDS Project - Atlas of the Islands
ESPON and University of the Aegean 19/39
Map 11: Population Density, 2006 Map 12: Artificial land % of total land

ESPON EUROISLANDS Project - Atlas of the Islands
ESPON and University of the Aegean 20/39
Biodiversity The Mediterranean region is a zone of high endemism and considered as an important place for the global biodiversity (Benoit and Comeau, 2005). One of the factors behind this fact is the high fragmentation of habitats due to its relief and its many islands. Islands such as Kriti, Mallorca, Formentera, Lesvos, Corse together with Sicilia and Cyprus are considered as particularly rich in terrestrial and marine biodiversity. In general, this is reflected to the fact that on most of the islands some sort of protected areas are found, but these areas are larger in the Mediterranean covering from 20% to over 40% of the total surface and part of the NATURA 2000 network (ESPON, 2006b) On the contrary, the only insular region in North Europe with a high percentage of protected areas is Western Isles. Today, this natural capital is under pressure from climate change, sea level rise, urbanisation, pollution, fires, agricultural practices, exotic species invasion, excessive fishing etc (UNEP/MAP-Blue Plan, 2009). An indication of this pressure is the fragmentation of the natural and semi-natural areas. The majority of the islands have low or intermediate levels of fragmentation with scores of 2 and 3 in a scale of 0-4, except Malta (ESPON Atlas 2006, p.46). The areas with the lowest level of ecological vulnerability are mostly in Europe’s mountain regions.
Soil Desertification risk is a serious problem for the Mediterranean islands, as it is an irreversible trend with severe repercussions to their capacity for food production, water retention, biodiversity and generally for the conservation of ecosystem functions and services. Environmental problems in general seem to differ between the North and the South: urban sprawl due to tourism and holiday homes construction, coast artificialisation, water shortages, fires and high soil erosion risk are the principal problems to be addressed in the South; sea eutrophication and coastal erosion are the main problems in the North. A common problem seems to be fish stock collapse – more severe in the north- with direct repercussions on islands’ economies and societies.
Box 3: Main issues of the analysis on environmental conservation:
- Population density varies from very low, especially in Northern Europe and some Notio Aigaio islands, to much higher than the EU average.
- Some islands show relatively high rates of artificialization, as well as a high rate of artificial coasts.
- Nearly all islands face more or less serious problems of fresh water availability
- Sea pollution (caused mainly by non island activities), desertification and landscape degradation are also serious concerns for all islands, the problems being more acute in the touristic Southern islands.
- Islands’ natural environment -especially in the Mediterranean basin- is rich but particularly vulnerable to human and other external pressures.
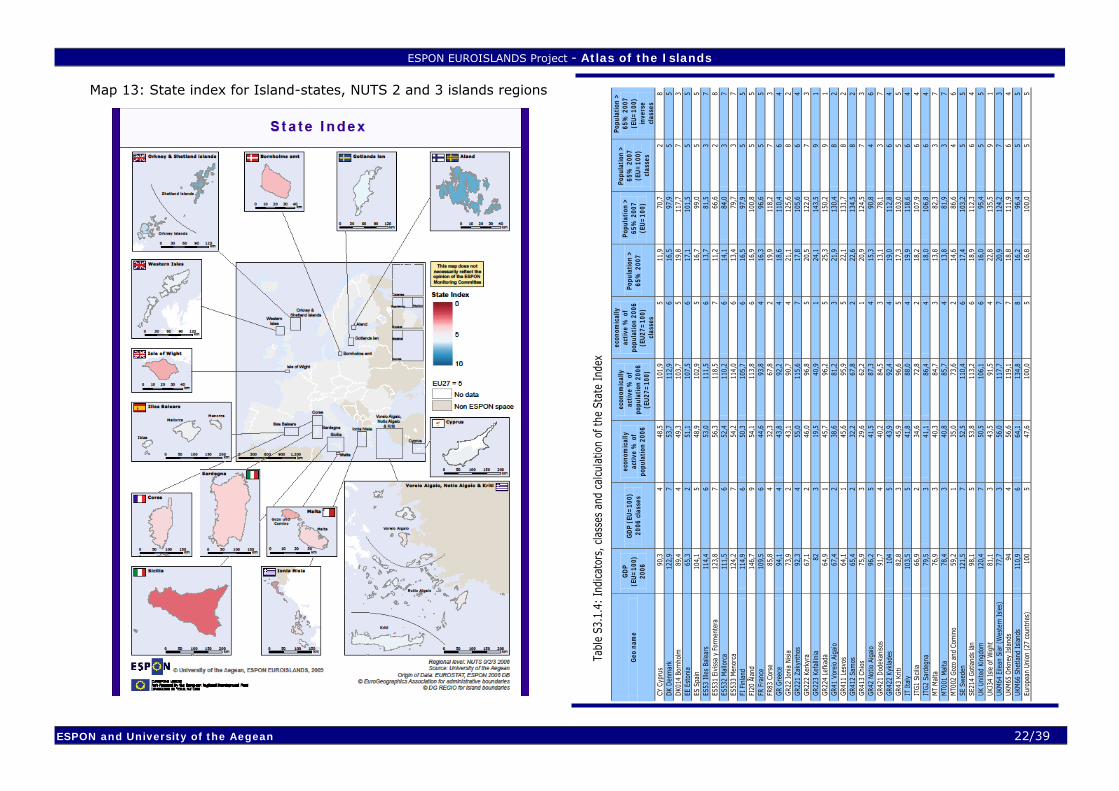
3.1.4. Synthesis on the State of Islands After presenting the available data for the variables defined in the methodology, two indexes are proposed to summarize these findings on island regions (see section 2): (a) A “State index”, for the situation of the islands in comparison with the member states they are located in and the EU, calculated with the use of five indicators (GDP per capita 2006, active
population / total population %, unemployment rate %, population older than 65 %, artificial land to the total land %,); (b) A “Change index”, capturing changes that have taken place during 2000 – 2006, depending on the availability over time of the series of the particular indicators used, calculated with the use of three indicators for the period 2000 - 2006: population change %, GDP per capita (EU27=100), active population change%, Table A3.1.5. A summary of descriptive statistics for the indexes is presented in Table A3.1.3. Table A3.1.3: Descriptive statistics for
the State Index, GDP/capita and Change Index
Area
GDP (EU=100) 2006
State 5
Change index
EU27
N 1 1 1 Mean 100,0 5,0 5,0 Median 100,0 5,0 5,0 Min 100,0 5,0 5,0 Max 100,0 5,0 5,0
Member States with Islands
N 11 11 11 Mean 102,1 5,2 5,6 Median 104,1 5,2 6,3 Mini 65,3 4,0 2,3 Max 122,9 6,6 8,0
Island Regions (NUTS 2 or 3)
N 26 26 26 Mean 88,7 4,9 5,1 Median 84,3 5,0 5,0 Mini 59,2 2,4 2,0 Max 146,7 7,6 8,3
ESPON EUROISLANDS Project - Atlas of the Islands
ESPON and University of the Aegean 21/39
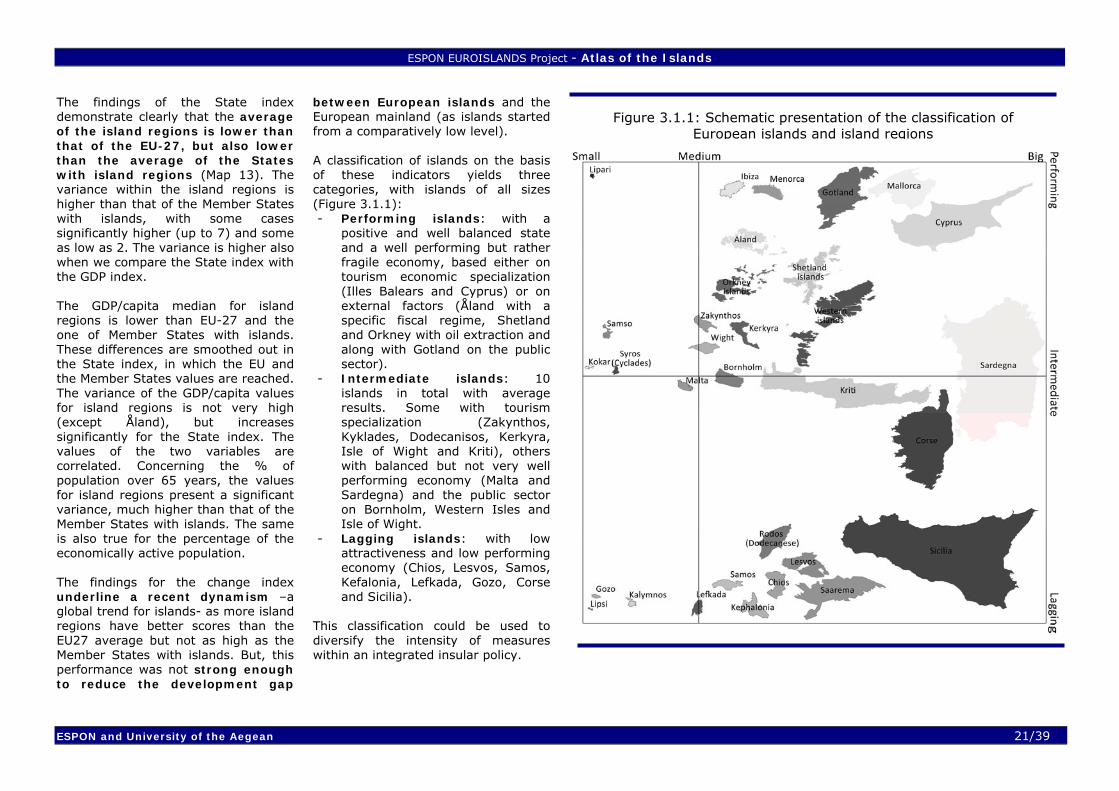
The findings of the State index demonstrate clearly that the average of the island regions is lower than that of the EU-27, but also lower than the average of the States with island regions (Map 13). The variance within the island regions is higher than that of the Member States with islands, with some cases significantly higher (up to 7) and some as low as 2. The variance is higher also when we compare the State index with the GDP index. The GDP/capita median for island regions is lower than EU-27 and the one of Member States with islands. These differences are smoothed out in the State index, in which the EU and the Member States values are reached. The variance of the GDP/capita values for island regions is not very high (except Åland), but increases significantly for the State index. The values of the two variables are correlated. Concerning the % of population over 65 years, the values for island regions present a significant variance, much higher than that of the Member States with islands. The same is also true for the percentage of the economically active population. The findings for the change index underline a recent dynamism –a global trend for islands- as more island regions have better scores than the EU27 average but not as high as the Member States with islands. But, this performance was not strong enough to reduce the development gap
between European islands and the European mainland (as islands started from a comparatively low level). A classification of islands on the basis of these indicators yields three categories, with islands of all sizes (Figure 3.1.1): - Performing islands: with a
positive and well balanced state and a well performing but rather fragile economy, based either on tourism economic specialization (Illes Balears and Cyprus) or on external factors (Åland with a specific fiscal regime, Shetland and Orkney with oil extraction and along with Gotland on the public sector).
- Intermediate islands: 10 islands in total with average results. Some with tourism specialization (Zakynthos, Kyklades, Dodecanisos, Kerkyra, Isle of Wight and Kriti), others with balanced but not very well performing economy (Malta and Sardegna) and the public sector on Bornholm, Western Isles and Isle of Wight.
- Lagging islands: with low attractiveness and low performing economy (Chios, Lesvos, Samos, Kefalonia, Lefkada, Gozo, Corse and Sicilia).
This classification could be used to diversify the intensity of measures within an integrated insular policy.
Figure 3.1.1: Schematic presentation of the classification of European islands and island regions
ESPON EUROISLANDS Project - Atlas of the Islands
ESPON and University of the Aegean 22/39
Map 13: State index for Island-states, NUTS 2 and 3 islands regions
Tabl
e S3
.1.4
: In
dica
tors
, cla
sses
and
cal
cula
tion
of th
e St
ate
Inde
x
Geo
nam
e G
DP
(EU
=10
0)
2006
GD
P (E
U=
100)
20
06 c
lass
es
econ
omic
ally
ac
tive
% o
f po
pula
tion
200
6
econ
omic
ally
ac
tive
% o
f po
pula
tion
200
6 (E
U27
=10
0)
econ
omic
ally
ac
tive
% o
f po
pula
tion
200
6 (E
U27
=10
0)
clas
ses
Popu
lati
on >
65
% 2
007
Popu
lati
on >
65
% 2
007
(EU
=10
0)
Popu
lati
on >
65
% 2
007
(EU
=10
0)
clas
ses
Popu
lati
on >
65
% 2
007
(EU
=10
0)
inve
rse
clas
ses
CY C
ypru
s 90
,3
4 48
,5
101,
9 5
11,9
70
,7
2 8
DK D
enm
ark
122,
9 7
53,7
11
2,9
6 16
,5
97,9
5
5 DK
014
Born
holm
89
,4
4 49
,3
103,
7 5
19,8
11
7,7
7 3
EE E
ston
ia
65,3
2
51,1
10
7,5
6 17
,1
101,
5 5
5 ES
Spa
in
104,
1 5
48,9
10
2,9
5 16
,7
99,0
5
5 ES
53 Il
les
Bale
ars
114,
4 6
53,0
11
1,5
6 13
,7
81,5
3
7 ES
531
Eivi
ssa
y Fo
rmen
tera
12
3,8
7 56
,3
118,
5 7
11,2
66
,6
2 8
ES53
2 M
allo
rca
111,
5 6
52,4
11
0,2
6 14
,1
84,0
3
7 ES
533
Men
orca
12
4,2
7 54
,2
114,
0 6
13,4
79
,7
3 7
FI F
inla
nd
114,
9 6
50,3
10
5,7
6 16
,5
97,9
5
5 FI
20 Å
land
14
6,7
9 54
,1
113,
8 6
16,9
10
0,8
5 5
FR F
ranc
e 10
9,5
6 44
,6
93,8
4
16,3
96
,6
5 5
FR83
Cor
se
85,8
4
32,3
67
,8
2 19
,9
118,
2 7
3 GR
Gre
ece
94,1
4
43,8
92
,2
4 18
,6
110,
4 6
4 GR
22 Io
nia
Nisi
a 73
,9
2 43
,1
90,7
4
21,1
12
5,6
8 2
GR22
1 Za
kynt
hos
92,3
4
55,0
11
5,6
7 17
,8
105,
6 6
4 GR
222
Kerk
yra
67,1
2
46,0
96
,8
5 20
,5
122,
0 7
3 GR
223
Kefa
llini
a 82
3
19,5
40
,9
1 24
,1
143,
5 9
1 GR
224
Lefk
ada
64,9
1
45,7
96
,2
5 25
,3
150,
2 9
1 GR
41 V
orei
o Ai
gaio
67
,4
2 38
,6
81,2
3
21,9
13
0,4
8 2
GR41
1 Le
svos
64
,1
1 45
,6
95,9
5
22,1
13
1,7
8 2
GR41
2 Sa
mos
65
,4
2 32
,2
67,8
2
22,6
13
4,5
8 2
GR41
3 Ch
ios
75,9
3
29,6
62
,2
1 20
,9
124,
5 7
3 GR
42 N
otio
Aig
aio
96,2
5
41,5
87
,3
4 15
,3
90,8
4
6 GR
421
Dode
kani
sos
91,7
4
40,2
84
,5
3 13
,1
78,1
3
7 GR
422
Kykl
ades
10
4 5
43,9
92
,4
4 19
,0
112,
8 6
4 GR
43 K
riti
82,8
3
45,9
96
,6
5 17
,3
103,
0 5
5 IT
Ital
y 10
3,5
5 41
,8
88,0
4
19,9
11
8,6
6 4
ITG1
Sic
ilia
66,9
2
34,6
72
,8
2 18
,2
107,
9 6
4 IT
G2 S
arde
gna
79,5
3
41,1
86
,4
4 18
,0
106,
8 6
4 M
T M
alta
76
,9
3 40
,3
84,7
3
13,8
82
,3
3 7
MT0
01 M
alta
78
,4
3 40
,8
85,7
4
13,8
81
,9
3 7
MT0
02 G
ozo
and
Com
ino
59,2
1
35,0
73
,6
2 14
,6
86,6
4
6 SE
Sw
eden
12
1,5
7 52
,5
110,
4 6
17,4
10
3,2
5 5
SE21
4 Go
tland
s lä
n 98
,1
5 53
,8
113,
2 6
18,9
11
2,3
6 4
UK U
nite
d Ki
ngdo
m
120,
4 7
50,5
10
6,1
6 16
,0
95,4
5
5 UK
J34
Isle
of W
ight
81
,1
3 43
,5
91,5
4
22,8
13
5,5
9 1
UKM
64 E
ilean
Sia
r (W
este
rn Is
les)
77
,7
3 56
,0
117,
7 7
20,9
12
4,2
7 3
UKM
65 O
rkne
y Is
land
s 94
4
56,6
11
9,1
7 18
,8
111,
9 6
4 UK
M66
She
tland
Isla
nds
110,
9 6
64,1
13
4,8
8 16
,2
96,4
5
5 Eu
rope
an U
nion
(27
cou
ntrie
s)
100
5 47
,6
100,
0 5
16,8
10
0,0
5 5

ESPON EUROISLANDS Project - Atlas of the Islands
ESPON and University of the Aegean 23/39
Tabl
e S3
.1.4
: Ind
icato
rs, c
lass
es a
nd c
alcu
latio
n of
the
Stat
e In
dex
Geo
nam
e GD
P (E
U=10
0)
2006
GDP
(EU=
100)
20
06 c
lass
es
econ
omic
ally
ac
tive
% o
f po
pula
tion
2006
econ
omic
ally
ac
tive
% o
f po
pula
tion
2006
(E
U27=
100)
econ
omic
ally
ac
tive
% o
f po
pula
tion
2006
(E
U27=
100)
cl
asse
s
Popu
latio
n >
65
% 2
007
Popu
latio
n >
65
% 2
007
(EU=
100)
Popu
latio
n >
65
% 2
007
(EU=
100)
cl
asse
s
Popu
latio
n >
65
% 2
007
(EU=
100)
in
vers
e cl
asse
s CY
Cyp
rus
90,3
4
48,5
10
1,9
5 11
,9
70,7
2
8 DK
Den
mar
k 12
2,9
7 53
,7
112,
9 6
16,5
97
,9
5 5
DK01
4 Bo
rnho
lm
89,4
4
49,3
10
3,7
5 19
,8
117,
7 7
3 EE
Est
onia
65
,3
2 51
,1
107,
5 6
17,1
10
1,5
5 5
ES S
pain
10
4,1
5 48
,9
102,
9 5
16,7
99
,0
5 5
ES53
Ille
s Ba
lear
s 11
4,4
6 53
,0
111,
5 6
13,7
81
,5
3 7
ES53
1 Ei
viss
a y
Form
ente
ra
123,
8 7
56,3
11
8,5
7 11
,2
66,6
2
8 ES
532
Mallo
rca
111,
5 6
52,4
11
0,2
6 14
,1
84,0
3
7 ES
533
Meno
rca
124,
2 7
54,2
11
4,0
6 13
,4
79,7
3
7 FI
Fin
land
11
4,9
6 50
,3
105,
7 6
16,5
97
,9
5 5
FI20
Åla
nd
146,
7 9
54,1
11
3,8
6 16
,9
100,
8 5
5 FR
Fra
nce
109,
5 6
44,6
93
,8
4 16
,3
96,6
5
5 FR
83 C
orse
85
,8
4 32
,3
67,8
2
19,9
11
8,2
7 3
GR G
reec
e 94
,1
4 43
,8
92,2
4
18,6
11
0,4
6 4
GR22
Ioni
a Ni
sia
73,9
2
43,1
90
,7
4 21
,1
125,
6 8
2 GR
221
Zaky
ntho
s 92
,3
4 55
,0
115,
6 7
17,8
10
5,6
6 4
GR22
2 Ke
rkyr
a 67
,1
2 46
,0
96,8
5
20,5
12
2,0
7 3
GR22
3 Ke
fallin
ia
82
3 19
,5
40,9
1
24,1
14
3,5
9 1
GR22
4 Le
fkad
a 64
,9
1 45
,7
96,2
5
25,3
15
0,2
9 1
GR41
Vor
eio
Aiga
io
67,4
2
38,6
81
,2
3 21
,9
130,
4 8
2 GR
411
Lesv
os
64,1
1
45,6
95
,9
5 22
,1
131,
7 8
2 GR
412
Sam
os
65,4
2
32,2
67
,8
2 22
,6
134,
5 8
2 GR
413
Chio
s 75
,9
3 29
,6
62,2
1
20,9
12
4,5
7 3
GR42
Not
io A
igai
o 96
,2
5 41
,5
87,3
4
15,3
90
,8
4 6
GR42
1 Do
deka
niso
s 91
,7
4 40
,2
84,5
3
13,1
78
,1
3 7
GR42
2 Ky
klad
es
104
5 43
,9
92,4
4
19,0
11
2,8
6 4
GR43
Krit
i 82
,8
3 45
,9
96,6
5
17,3
10
3,0
5 5
IT It
aly
103,
5 5
41,8
88
,0
4 19
,9
118,
6 6
4 IT
G1 S
icilia
66
,9
2 34
,6
72,8
2
18,2
10
7,9
6 4
ITG2
Sar
degn
a 79
,5
3 41
,1
86,4
4
18,0
10
6,8
6 4
MT M
alta
76
,9
3 40
,3
84,7
3
13,8
82
,3
3 7
MT00
1 Ma
lta
78,4
3
40,8
85
,7
4 13
,8
81,9
3
7 MT
002
Gozo
and
Com
ino
59,2
1
35,0
73
,6
2 14
,6
86,6
4
6 SE
Swe
den
121,
5 7
52,5
11
0,4
6 17
,4
103,
2 5
5 SE
214
Gotla
nds
län
98,1
5
53,8
11
3,2
6 18
,9
112,
3 6
4 UK
Uni
ted
King
dom
12
0,4
7 50
,5
106,
1 6
16,0
95
,4
5 5
UKJ3
4 Is
le o
f Wig
ht
81,1
3
43,5
91
,5
4 22
,8
135,
5 9
1 UK
M64
Eile
an S
iar (
Wes
tern
Isle
s)
77,7
3
56,0
11
7,7
7 20
,9
124,
2 7
3 UK
M65
Orkn
ey Is
land
s 94
4
56,6
11
9,1
7 18
,8
111,
9 6
4 UK
M66
Shet
land
Isla
nds
110,
9 6
64,1
13
4,8
8 16
,2
96,4
5
5 Eu
rope
an U
nion
(27
coun
tries
) 10
0 5
47,6
10
0,0
5 16
,8
100,
0 5
5
Tabl
e S3.1
.5:
Indic
ator
s, c
lass
es a
nd c
alcu
lation
of th
e Chan
ge I
nde
x
Geo n
am
e
Po
pu
lati
on
ch
an
ge
rate
20
00
-0
6%
Po
pu
lati
on
ch
an
ge
rate
20
00
-0
6%
(E
U2
7
=1
00
)
Pop
ula
tion
ch
an
ge r
ate
2
00
0-0
6%
(E
U2
7
=1
00
) cl
ass
es
Act
ive
chan
ge
20
00
-6
%
Eco
no-
mic
ally
act
ive
20
00
-6
chan
ge
rate
%
Eco
no-
mic
ally
act
ive
20
00
-6
chan
ge
rate
%
(EU
27
=
10
0)
Eco
no-
mic
ally
act
ive
20
00
-6
chan
ge
rate
%
(EU
27
=
10
0)
class
es
GD
P/
cap
ita
20
00
(E
U2
7
=1
00
)
GD
P/
cap
ita
20
06
(E
U2
7
=1
00
)
GD
P/
cap
ita
chan
ge
20
00
-6
% (
EU
27
=
0)
GD
P/
ca
pit
a
chan
ge
20
00
-6 %
(E
U2
7=
0)
class
es
Ch
an
ge
ind
ex
CY
Cyp
rus
1,4
496,1
9
21,1
3,0
406,7
9
88,5
90,3
1,8
5
7,7
D
K D
enm
ark
0,2
82,2
3
2,6
0,4
50,4
1
131,4
123,3
-8
,1
4
2,7
D
K014 B
ornhol
m
0,2
82,8
3
0,9
0,1
18,3
1
99,7
89,5
-1
0,3
4
2,7
EE E
ston
ia
-0,2
-8
3,3
1
3,6
0,5
70,1
2
23,6
41,5
76,2
9
4
ES S
pain
1,2
419,7
9
19,8
2,8
382,4
9
96,9
104,2
7,4
6
8,0
ES53 I
lles
Bal
ears
2,4
859,1
9
29,9
4,3
575,6
9
119,4
114,4
-5
,0
5
7,7
ES531 E
ivis
sa y
For
men
tera
3,5
1227,5
9
26,6
3,8
512,3
9
112,8
124,2
11,4
6
8,0
ES532 M
allo
rca
2,4
827,3
9
30,2
4,3
581,3
9
120,7
111,4
-9
,3
4
7,3
ES533 M
enor
ca
2,0
686,0
9
32,1
4,6
618,1
9
118,5
124,2
5,6
7
8,3
FI
Fin
land
0,2
76,3
3
2,3
0,3
43,7
1
116,8
114,8
-1
,9
5
3,0
FI
20 Å
land
0,5
187,7
9
4,3
0,6
83,2
3
145,5
147,0
1,5
5
5,7
FR
Fra
nce
0,5
192,6
9
9,9
1,4
190,6
9
115,2
109,7
-5
,4
4
7,3
FR
83 C
orse
1,5
536,6
9
37,0
5,3
712,6
9
86,9
86,0
-0
,9
5
7,7
G
R G
reec
e 0,3
92,8
4
6,0
0,9
114,9
6
83,8
94,1
10,3
6
5,3
G
R22 I
onia
Nis
ia
0,9
323,0
9
3,9
0,6
74,5
2
74,9
74,2
-0
,7
5
5,3
G
R221 Z
akyn
thos
0,5
181,8
9
25,6
3,7
492,9
9
93,2
92,4
-0
,8
5
7,7
G
R222 K
erky
ra
1,5
518,1
9
-0,2
0,0
-3
,4
1
72,3
67,4
-4
,9
5
5,0
G
R223 K
efal
linia
0,1
34,9
1
-41,3
-5
,9
-795,6
1
71,2
82,2
11,0
6
2,7
G
R224 L
efka
da
0,2
80,1
3
72,9
10,4
1405,1
9
59,2
64,8
5,7
6
6,0
G
R41 V
orei
o Aig
aio
-0,2
-7
9,1
1
10,2
1,5
196,6
9
59,2
67,4
8,2
6
5,3
G
R411 L
esvo
s -0
,2
-64,9
1
14,6
2,1
281,9
9
56,5
64,0
7,4
6
5,3
G
R412 S
amos
-0
,3
-100,1
1
20,0
2,9
385,6
9
60,7
65,3
4,5
5
5,0
G
R413 C
hios
-0
,3
-90,7
1
-7,8
-1
,1
-150,1
1
62,8
75,8
13,0
6
2,7
G
R42 N
otio
Aig
aio
0,3
110,8
6
1,3
0,2
24,7
1
97,4
96,2
-1
,2
5
4,0
G
R421 D
odek
anis
os
0,4
147,3
9
-0,4
-0
,1
-7,4
1
97,9
91,9
-6
,0
4
4,7
G
R422 K
ykla
des
0,1
48,1
1
3,8
0,5
74,1
2
96,3
104,2
7,9
6
3,0
G
R43 K
riti
0,2
82,9
3
1,1
0,2
20,4
1
77,5
83,1
5,6
6
3,3
IT
Ita
ly
0,4
153,5
9
4,6
0,7
88,9
4
116,8
103,8
-1
2,9
4
5,7
IT
G1 S
icili
a 0,1
26,4
1
-2,2
-0
,3
-42,5
1
73,6
66,9
-6
,7
4
2,0
IT
G2 S
arde
gna
0,2
56,3
1
4,9
0,7
95,0
5
88,0
79,7
-8
,3
4
3,3
M
T M
alta
0,5
162,0
9
6,6
0,9
127,4
8
83,2
77,1
-6
,1
4
7,0
M
T001 M
alta
0,4
150,0
9
6,5
0,9
126,0
8
84,8
78,4
-6
,4
4
7,0
M
T002 G
ozo
and
Com
ino
0,9
305,0
9
7,6
1,1
146,9
9
64,9
59,3
-5
,6
4
7,3
SE S
wed
en
0,3
103,0
5
9,2
1,3
177,7
9
126,2
121,6
-4
,6
5
6,3
SE214 G
otla
nds
län
0,0
0,0
1
12,0
1,7
230,5
9
98,4
98,3
-0
,1
5
5,0
U
K U
nite
d Kin
gdom
0,4
146,0
9
6,2
0,9
119,9
7
118,8
120,3
1,5
5
7,0
U
KJ3
4 Is
le o
f W
ight
0,7
240,3
9
6,3
0,9
122,4
7
79,6
81,4
1,8
5
7,0
U
KM
64 W
este
rn I
sles
-0
,2
-81,8
1
-18,8
-2
,7
-362,2
1
67,5
78,0
10,4
6
2,7
U
KM
65 O
rkney
Isl
ands
0,3
101,8
5
-2,5
-0
,4
-47,7
1
85,9
94,1
8,2
6
4,0
U
KM
66 S
het
land
Isla
nds
-0
,2
-66,7
1
1,8
0,3
34,7
1
96,9
111,0
14,2
6
2,7
EU
(27 c
ountr
ies)
0,3
100,0
5
5,2
0,7
100,0
5
100
100,0
0,0
5
5,0
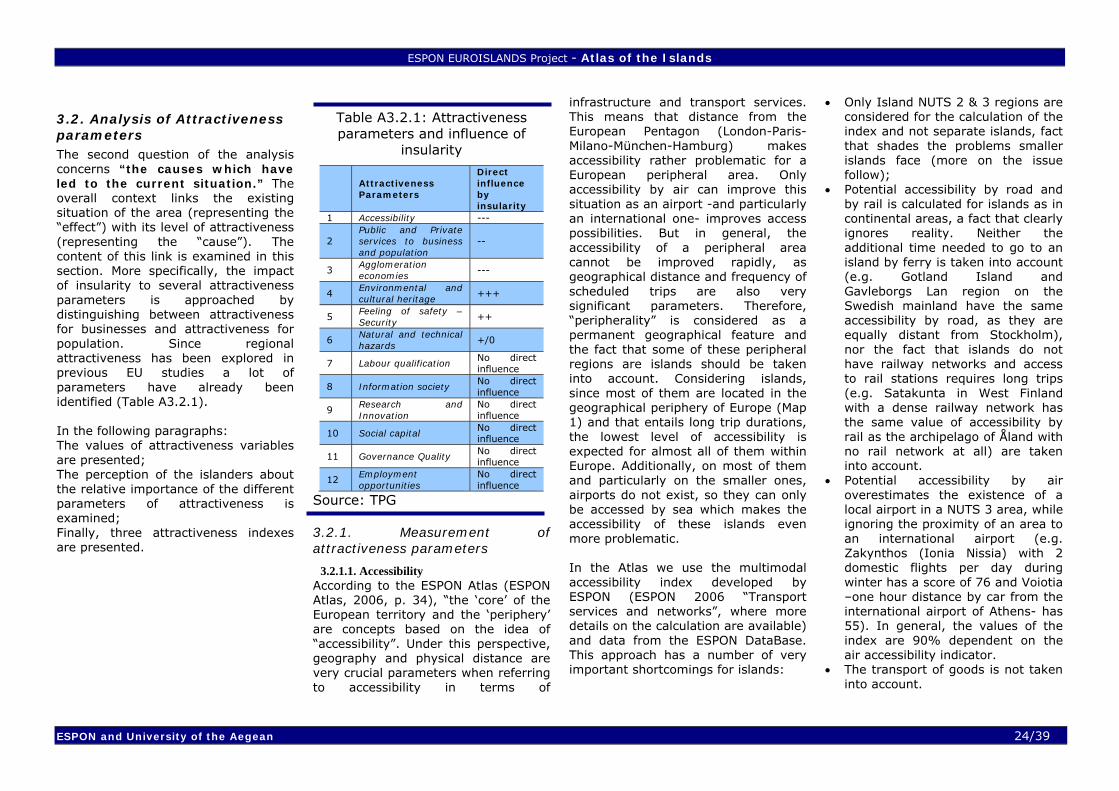
ESPON EUROISLANDS Project - Atlas of the Islands
ESPON and University of the Aegean 24/39
3.2. Analysis of Attractiveness parameters The second question of the analysis concerns “the causes which have led to the current situation.” The overall context links the existing situation of the area (representing the “effect”) with its level of attractiveness (representing the “cause”). The content of this link is examined in this section. More specifically, the impact of insularity to several attractiveness parameters is approached by distinguishing between attractiveness for businesses and attractiveness for population. Since regional attractiveness has been explored in previous EU studies a lot of parameters have already been identified (Table A3.2.1). In the following paragraphs: The values of attractiveness variables are presented; The perception of the islanders about the relative importance of the different parameters of attractiveness is examined; Finally, three attractiveness indexes are presented.
Table A3.2.1: Attractiveness parameters and influence of
insularity
Attractiveness Parameters
Direct influence by insularity
1 Accessibility ---
2 Public and Private services to business and population
--
3 Agglomeration economies
---
4 Environmental and cultural heritage
+++
5 Feeling of safety – Security
++
6 Natural and technical hazards
+/0
7 Labour qualification No direct influence
8 Information society No direct influence
9 Research and Innovation
No direct influence
10 Social capital No direct influence
11 Governance Quality No direct influence
12 Employment opportunities
No direct influence
Source: TPG
3.2.1. Measurement of attractiveness parameters
3.2.1.1. Accessibility According to the ESPON Atlas (ESPON Atlas, 2006, p. 34), “the ‘core’ of the European territory and the ‘periphery’ are concepts based on the idea of “accessibility”. Under this perspective, geography and physical distance are very crucial parameters when referring to accessibility in terms of
infrastructure and transport services. This means that distance from the European Pentagon (London-Paris-Milano-München-Hamburg) makes accessibility rather problematic for a European peripheral area. Only accessibility by air can improve this situation as an airport -and particularly an international one- improves access possibilities. But in general, the accessibility of a peripheral area cannot be improved rapidly, as geographical distance and frequency of scheduled trips are also very significant parameters. Therefore, “peripherality” is considered as a permanent geographical feature and the fact that some of these peripheral regions are islands should be taken into account. Considering islands, since most of them are located in the geographical periphery of Europe (Map 1) and that entails long trip durations, the lowest level of accessibility is expected for almost all of them within Europe. Additionally, on most of them and particularly on the smaller ones, airports do not exist, so they can only be accessed by sea which makes the accessibility of these islands even more problematic. In the Atlas we use the multimodal accessibility index developed by ESPON (ESPON 2006 “Transport services and networks”, where more details on the calculation are available) and data from the ESPON DataBase. This approach has a number of very important shortcomings for islands:
• Only Island NUTS 2 & 3 regions are considered for the calculation of the index and not separate islands, fact that shades the problems smaller islands face (more on the issue follow);
• Potential accessibility by road and by rail is calculated for islands as in continental areas, a fact that clearly ignores reality. Neither the additional time needed to go to an island by ferry is taken into account (e.g. Gotland Island and Gavleborgs Lan region on the Swedish mainland have the same accessibility by road, as they are equally distant from Stockholm), nor the fact that islands do not have railway networks and access to rail stations requires long trips (e.g. Satakunta in West Finland with a dense railway network has the same value of accessibility by rail as the archipelago of Åland with no rail network at all) are taken into account.
• Potential accessibility by air overestimates the existence of a local airport in a NUTS 3 area, while ignoring the proximity of an area to an international airport (e.g. Zakynthos (Ionia Nissia) with 2 domestic flights per day during winter has a score of 76 and Voiotia –one hour distance by car from the international airport of Athens- has 55). In general, the values of the index are 90% dependent on the air accessibility indicator.
• The transport of goods is not taken into account.
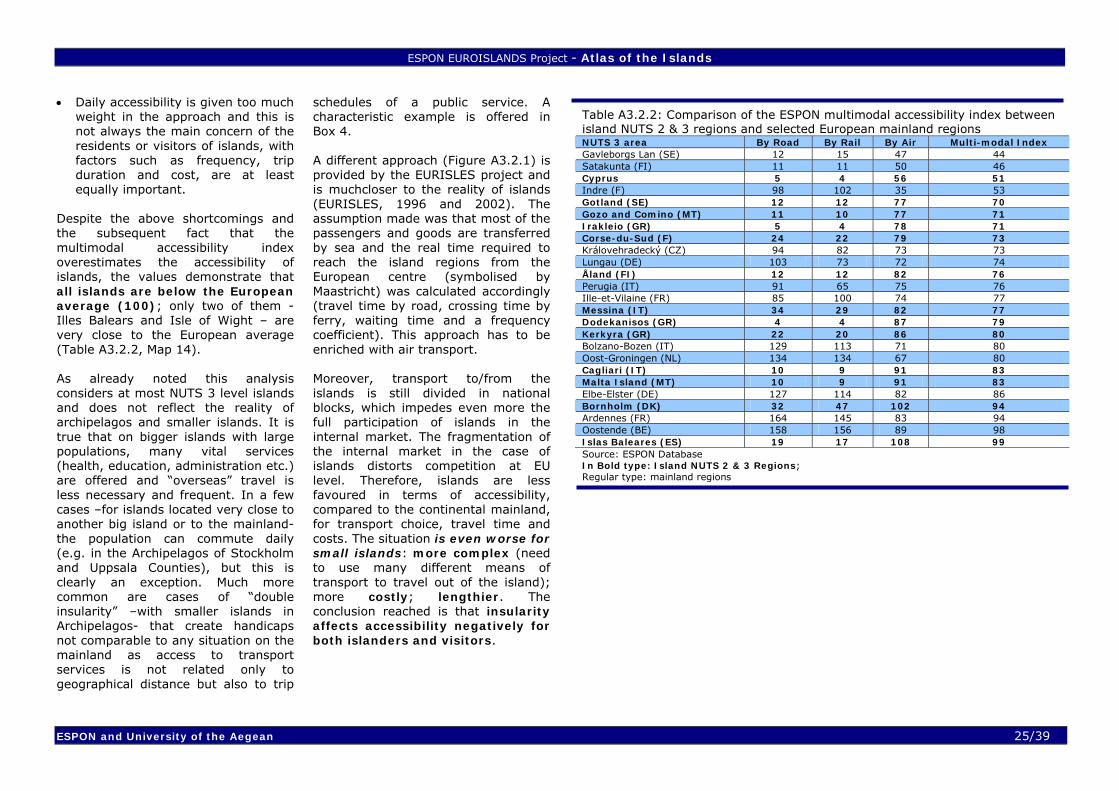
ESPON EUROISLANDS Project - Atlas of the Islands
ESPON and University of the Aegean 25/39
• Daily accessibility is given too much weight in the approach and this is not always the main concern of the residents or visitors of islands, with factors such as frequency, trip duration and cost, are at least equally important.
Despite the above shortcomings and the subsequent fact that the multimodal accessibility index overestimates the accessibility of islands, the values demonstrate that all islands are below the European average (100); only two of them -Illes Balears and Isle of Wight – are very close to the European average (Table A3.2.2, Map 14). As already noted this analysis considers at most NUTS 3 level islands and does not reflect the reality of archipelagos and smaller islands. It is true that on bigger islands with large populations, many vital services (health, education, administration etc.) are offered and “overseas” travel is less necessary and frequent. In a few cases –for islands located very close to another big island or to the mainland- the population can commute daily (e.g. in the Archipelagos of Stockholm and Uppsala Counties), but this is clearly an exception. Much more common are cases of “double insularity” –with smaller islands in Archipelagos- that create handicaps not comparable to any situation on the mainland as access to transport services is not related only to geographical distance but also to trip
schedules of a public service. A characteristic example is offered in Box 4. A different approach (Figure A3.2.1) is provided by the EURISLES project and is muchcloser to the reality of islands (EURISLES, 1996 and 2002). The assumption made was that most of the passengers and goods are transferred by sea and the real time required to reach the island regions from the European centre (symbolised by Maastricht) was calculated accordingly (travel time by road, crossing time by ferry, waiting time and a frequency coefficient). This approach has to be enriched with air transport. Moreover, transport to/from the islands is still divided in national blocks, which impedes even more the full participation of islands in the internal market. The fragmentation of the internal market in the case of islands distorts competition at EU level. Therefore, islands are less favoured in terms of accessibility, compared to the continental mainland, for transport choice, travel time and costs. The situation is even worse for small islands: more complex (need to use many different means of transport to travel out of the island); more costly; lengthier. The conclusion reached is that insularity affects accessibility negatively for both islanders and visitors.
Table A3.2.2: Comparison of the ESPON multimodal accessibility index between island NUTS 2 & 3 regions and selected European mainland regions NUTS 3 area By Road By Rail By Air Multi-modal Index Gavleborgs Lan (SE) 12 15 47 44 Satakunta (FI) 11 11 50 46 Cyprus 5 4 56 51 Indre (F) 98 102 35 53 Gotland (SE) 12 12 77 70 Gozo and Comino (MT) 11 10 77 71 Irakleio (GR) 5 4 78 71 Corse-du-Sud (F) 24 22 79 73 Královehradecký (CZ) 94 82 73 73 Lungau (DE) 103 73 72 74 Åland (FI) 12 12 82 76 Perugia (IT) 91 65 75 76 Ille-et-Vilaine (FR) 85 100 74 77 Messina (IT) 34 29 82 77 Dodekanisos (GR) 4 4 87 79 Kerkyra (GR) 22 20 86 80 Bolzano-Bozen (IT) 129 113 71 80 Oost-Groningen (NL) 134 134 67 80 Cagliari (IT) 10 9 91 83 Malta Island (MT) 10 9 91 83 Elbe-Elster (DE) 127 114 82 86 Bornholm (DK) 32 47 102 94 Ardennes (FR) 164 145 83 94 Oostende (BE) 158 156 89 98 Islas Baleares (ES) 19 17 108 99 Source: ESPON Database In Bold type: Island NUTS 2 & 3 Regions; Regular type: mainland regions
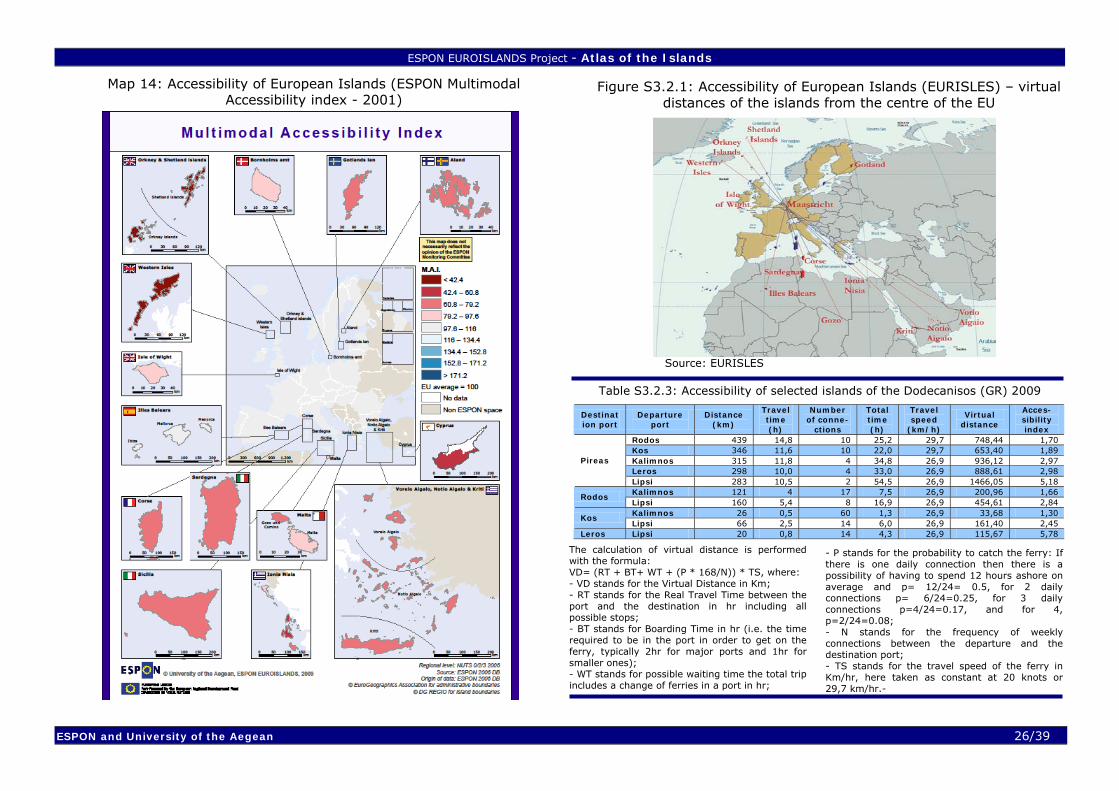
ESPON EUROISLANDS Project - Atlas of the Islands
ESPON and University of the Aegean 26/39
Source: EURISLES
The calculation of virtual distance is performed with the formula: VD= (RΤ + ΒΤ+ WΤ + (P * 168/Ν)) * TS, where: - VD stands for the Virtual Distance in Km; - RT stands for the Real Travel Time between the port and the destination in hr including all possible stops; - BT stands for Boarding Time in hr (i.e. the time required to be in the port in order to get on the ferry, typically 2hr for major ports and 1hr for smaller ones); - WT stands for possible waiting time the total trip includes a change of ferries in a port in hr;
- P stands for the probability to catch the ferry: If there is one daily connection then there is a possibility of having to spend 12 hours ashore on average and p= 12/24= 0.5, for 2 daily connections p= 6/24=0.25, for 3 daily connections p=4/24=0.17, and for 4, p=2/24=0.08; - N stands for the frequency of weekly connections between the departure and the destination port; - TS stands for the travel speed of the ferry in Km/hr, here taken as constant at 20 knots or 29,7 km/hr.-
Map 14: Accessibility of European Islands (ESPON Multimodal Accessibility index - 2001)
Figure S3.2.1: Accessibility of European Islands (EURISLES) – virtual distances of the islands from the centre of the EU
Table S3.2.3: Accessibility of selected islands of the Dodecanisos (GR) 2009
Destination port
Departure port
Distance (km)
Travel time (h)
Number of conne-
ctions
Total time (h)
Travel speed
(km/h)
Virtual distance
Acces-sibility index
Rodos 439 14,8 10 25,2 29,7 748,44 1,70 Kos 346 11,6 10 22,0 29,7 653,40 1,89 Kalimnos 315 11,8 4 34,8 26,9 936,12 2,97 Leros 298 10,0 4 33,0 26,9 888,61 2,98
Pireas
Lipsi 283 10,5 2 54,5 26,9 1466,05 5,18 Kalimnos 121 4 17 7,5 26,9 200,96 1,66
Rodos Lipsi 160 5,4 8 16,9 26,9 454,61 2,84 Kalimnos 26 0,5 60 1,3 26,9 33,68 1,30
Kos Lipsi 66 2,5 14 6,0 26,9 161,40 2,45
Leros Lipsi 20 0,8 14 4,3 26,9 115,67 5,78
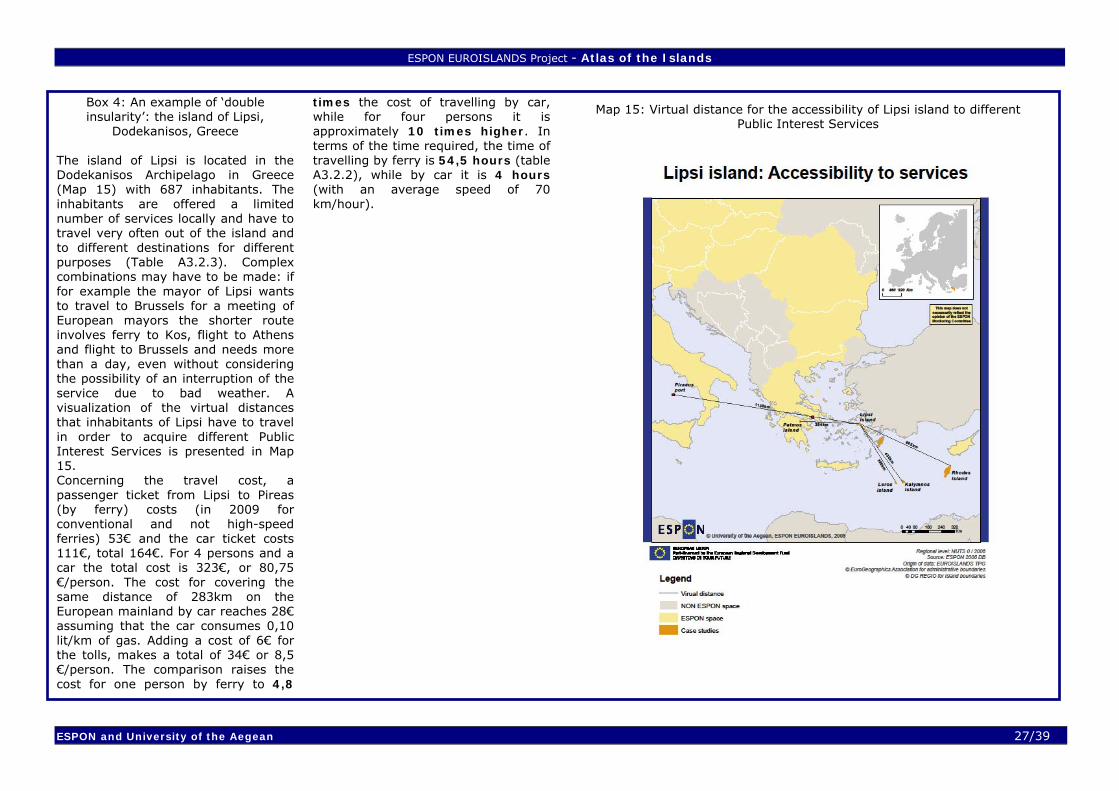
ESPON EUROISLANDS Project - Atlas of the Islands
ESPON and University of the Aegean 27/39
Box 4: An example of ‘double insularity’: the island of Lipsi,
Dodekanisos, Greece The island of Lipsi is located in the Dodekanisos Archipelago in Greece (Map 15) with 687 inhabitants. The inhabitants are offered a limited number of services locally and have to travel very often out of the island and to different destinations for different purposes (Table A3.2.3). Complex combinations may have to be made: if for example the mayor of Lipsi wants to travel to Brussels for a meeting of European mayors the shorter route involves ferry to Kos, flight to Athens and flight to Brussels and needs more than a day, even without considering the possibility of an interruption of the service due to bad weather. A visualization of the virtual distances that inhabitants of Lipsi have to travel in order to acquire different Public Interest Services is presented in Map 15. Concerning the travel cost, a passenger ticket from Lipsi to Pireas (by ferry) costs (in 2009 for conventional and not high-speed ferries) 53€ and the car ticket costs 111€, total 164€. For 4 persons and a car the total cost is 323€, or 80,75 €/person. The cost for covering the same distance of 283km on the European mainland by car reaches 28€ assuming that the car consumes 0,10 lit/km of gas. Adding a cost of 6€ for the tolls, makes a total of 34€ or 8,5 €/person. The comparison raises the cost for one person by ferry to 4,8
times the cost of travelling by car, while for four persons it is approximately 10 times higher. In terms of the time required, the time of travelling by ferry is 54,5 hours (table A3.2.2), while by car it is 4 hours (with an average speed of 70 km/hour).
Map 15: Virtual distance for the accessibility of Lipsi island to different Public Interest Services
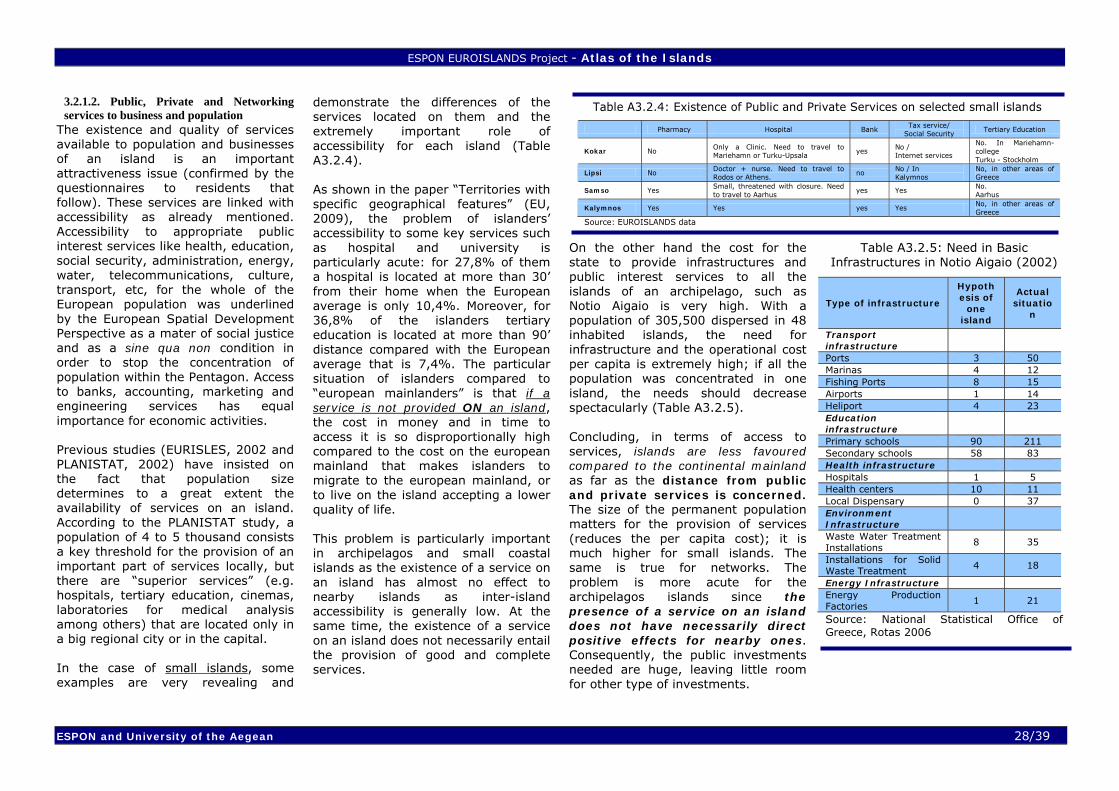
ESPON EUROISLANDS Project - Atlas of the Islands
ESPON and University of the Aegean 28/39
3.2.1.2. Public, Private and Networking services to business and population
The existence and quality of services available to population and businesses of an island is an important attractiveness issue (confirmed by the questionnaires to residents that follow). These services are linked with accessibility as already mentioned. Accessibility to appropriate public interest services like health, education, social security, administration, energy, water, telecommunications, culture, transport, etc, for the whole of the European population was underlined by the European Spatial Development Perspective as a mater of social justice and as a sine qua non condition in order to stop the concentration of population within the Pentagon. Access to banks, accounting, marketing and engineering services has equal importance for economic activities. Previous studies (EURISLES, 2002 and PLANISTAT, 2002) have insisted on the fact that population size determines to a great extent the availability of services on an island. According to the PLANISTAT study, a population of 4 to 5 thousand consists a key threshold for the provision of an important part of services locally, but there are “superior services” (e.g. hospitals, tertiary education, cinemas, laboratories for medical analysis among others) that are located only in a big regional city or in the capital. In the case of small islands, some examples are very revealing and
demonstrate the differences of the services located on them and the extremely important role of accessibility for each island (Table A3.2.4). As shown in the paper “Territories with specific geographical features” (EU, 2009), the problem of islanders’ accessibility to some key services such as hospital and university is particularly acute: for 27,8% of them a hospital is located at more than 30’ from their home when the European average is only 10,4%. Moreover, for 36,8% of the islanders tertiary education is located at more than 90’ distance compared with the European average that is 7,4%. The particular situation of islanders compared to “european mainlanders” is that if a service is not provided ON an island, the cost in money and in time to access it is so disproportionally high compared to the cost on the european mainland that makes islanders to migrate to the european mainland, or to live on the island accepting a lower quality of life. This problem is particularly important in archipelagos and small coastal islands as the existence of a service on an island has almost no effect to nearby islands as inter-island accessibility is generally low. At the same time, the existence of a service on an island does not necessarily entail the provision of good and complete services.
On the other hand the cost for the state to provide infrastructures and public interest services to all the islands of an archipelago, such as Notio Aigaio is very high. With a population of 305,500 dispersed in 48 inhabited islands, the need for infrastructure and the operational cost per capita is extremely high; if all the population was concentrated in one island, the needs should decrease spectacularly (Table A3.2.5). Concluding, in terms of access to services, islands are less favoured compared to the continental mainland as far as the distance from public and private services is concerned. The size of the permanent population matters for the provision of services (reduces the per capita cost); it is much higher for small islands. The same is true for networks. The problem is more acute for the archipelagos islands since the presence of a service on an island does not have necessarily direct positive effects for nearby ones. Consequently, the public investments needed are huge, leaving little room for other type of investments.
Table A3.2.5: Need in Basic Infrastructures in Notio Aigaio (2002)
Type of infrastructure
Hypothesis of
one island
Actual situatio
n
Transport infrastructure
Ports 3 50 Marinas 4 12 Fishing Ports 8 15 Airports 1 14 Heliport 4 23 Education infrastructure
Primary schools 90 211 Secondary schools 58 83 Health infrastructure Hospitals 1 5 Health centers 10 11 Local Dispensary 0 37 Environment Infrastructure
Waste Water Treatment Installations
8 35
Installations for Solid Waste Treatment
4 18
Energy Infrastructure Energy Production Factories
1 21
Source: National Statistical Office of Greece, Rotas 2006
Table A3.2.4: Existence of Public and Private Services on selected small islands
Pharmacy Hospital Bank Tax service/ Social Security
Tertiary Education
Kokar No Only a Clinic. Need to travel to Mariehamn or Turku-Upsala
yes No / Internet services
No. In Mariehamn-college Turku - Stockholm
Lipsi No Doctor + nurse. Need to travel to Rodos or Athens.
no No / In Kalymnos
No, in other areas of Greece
Samso Yes Small, threatened with closure. Need to travel to Aarhus
yes Yes No. Aarhus
Kalymnos Yes Yes yes Yes No, in other areas of Greece
Source: EUROISLANDS data
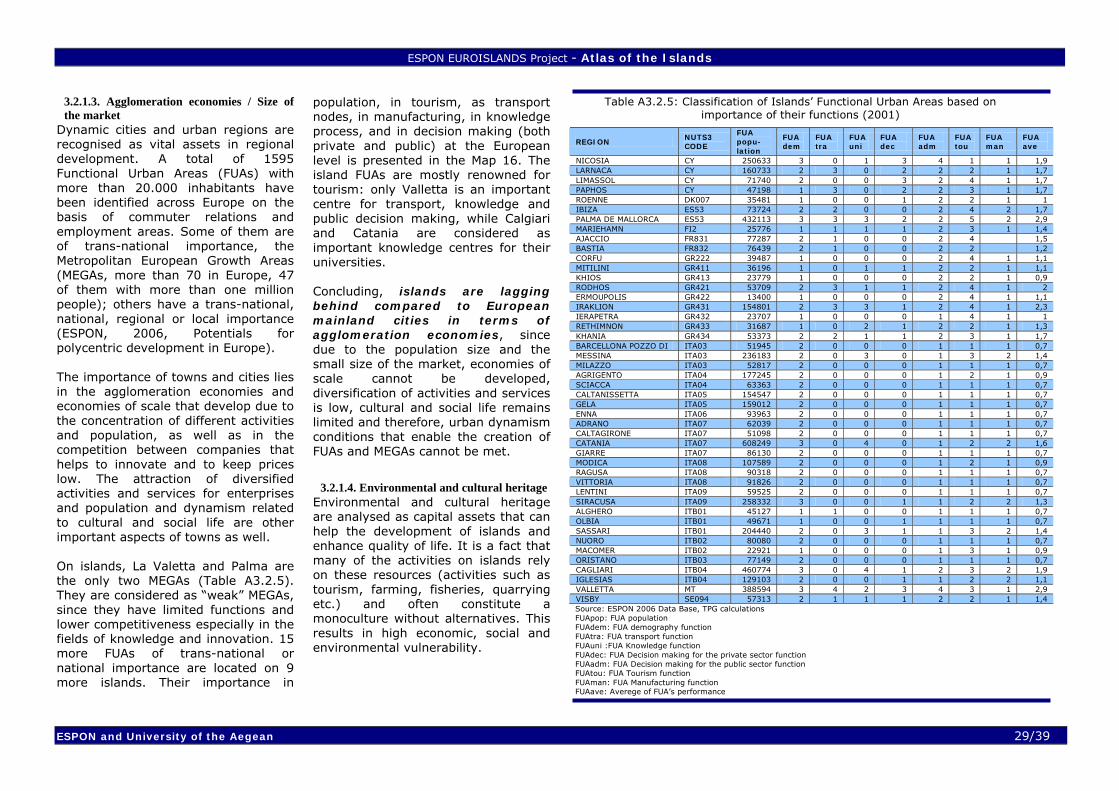
ESPON EUROISLANDS Project - Atlas of the Islands
ESPON and University of the Aegean 29/39
3.2.1.3. Agglomeration economies / Size of the market
Dynamic cities and urban regions are recognised as vital assets in regional development. A total of 1595 Functional Urban Areas (FUAs) with more than 20.000 inhabitants have been identified across Europe on the basis of commuter relations and employment areas. Some of them are of trans-national importance, the Metropolitan European Growth Areas (MEGAs, more than 70 in Europe, 47 of them with more than one million people); others have a trans-national, national, regional or local importance (ESPON, 2006, Potentials for polycentric development in Europe). The importance of towns and cities lies in the agglomeration economies and economies of scale that develop due to the concentration of different activities and population, as well as in the competition between companies that helps to innovate and to keep prices low. The attraction of diversified activities and services for enterprises and population and dynamism related to cultural and social life are other important aspects of towns as well. On islands, La Valetta and Palma are the only two MEGAs (Table A3.2.5). They are considered as “weak” MEGAs, since they have limited functions and lower competitiveness especially in the fields of knowledge and innovation. 15 more FUAs of trans-national or national importance are located on 9 more islands. Their importance in
population, in tourism, as transport nodes, in manufacturing, in knowledge process, and in decision making (both private and public) at the European level is presented in the Map 16. The island FUAs are mostly renowned for tourism: only Valletta is an important centre for transport, knowledge and public decision making, while Calgiari and Catania are considered as important knowledge centres for their universities. Concluding, islands are lagging behind compared to European mainland cities in terms of agglomeration economies, since due to the population size and the small size of the market, economies of scale cannot be developed, diversification of activities and services is low, cultural and social life remains limited and therefore, urban dynamism conditions that enable the creation of FUAs and MEGAs cannot be met.
3.2.1.4. Environmental and cultural heritage Environmental and cultural heritage are analysed as capital assets that can help the development of islands and enhance quality of life. It is a fact that many of the activities on islands rely on these resources (activities such as tourism, farming, fisheries, quarrying etc.) and often constitute a monoculture without alternatives. This results in high economic, social and environmental vulnerability.
Table A3.2.5: Classification of Islands’ Functional Urban Areas based on importance of their functions (2001)
REGION NUTS3 CODE
FUA popu-lation
FUA dem
FUA tra
FUA uni
FUA dec
FUA adm
FUA tou
FUA man
FUA ave
NICOSIA CY 250633 3 0 1 3 4 1 1 1,9 LARNACA CY 160733 2 3 0 2 2 2 1 1,7 LIMASSOL CY 71740 2 0 0 3 2 4 1 1,7 PAPHOS CY 47198 1 3 0 2 2 3 1 1,7 ROENNE DK007 35481 1 0 0 1 2 2 1 1 IBIZA ES53 73724 2 2 0 0 2 4 2 1,7 PALMA DE MALLORCA ES53 432113 3 3 3 2 2 5 2 2,9 MARIEHAMN FI2 25776 1 1 1 1 2 3 1 1,4 AJACCIO FR831 77287 2 1 0 0 2 4 1,5 BASTIA FR832 76439 2 1 0 0 2 2 1,2 CORFU GR222 39487 1 0 0 0 2 4 1 1,1 MITILINI GR411 36196 1 0 1 1 2 2 1 1,1 KHIOS GR413 23779 1 0 0 0 2 2 1 0,9 RODHOS GR421 53709 2 3 1 1 2 4 1 2 ERMOUPOLIS GR422 13400 1 0 0 0 2 4 1 1,1 IRAKLION GR431 154801 2 3 3 1 2 4 1 2,3 IERAPETRA GR432 23707 1 0 0 0 1 4 1 1 RETHIMNON GR433 31687 1 0 2 1 2 2 1 1,3 KHANIA GR434 53373 2 2 1 1 2 3 1 1,7 BARCELLONA POZZO DI ITA03 51945 2 0 0 0 1 1 1 0,7 MESSINA ITA03 236183 2 0 3 0 1 3 2 1,4 MILAZZO ITA03 52817 2 0 0 0 1 1 1 0,7 AGRIGENTO ITA04 177245 2 0 0 0 1 2 1 0,9 SCIACCA ITA04 63363 2 0 0 0 1 1 1 0,7 CALTANISSETTA ITA05 154547 2 0 0 0 1 1 1 0,7 GELA ITA05 159012 2 0 0 0 1 1 1 0,7 ENNA ITA06 93963 2 0 0 0 1 1 1 0,7 ADRANO ITA07 62039 2 0 0 0 1 1 1 0,7 CALTAGIRONE ITA07 51098 2 0 0 0 1 1 1 0,7 CATANIA ITA07 608249 3 0 4 0 1 2 2 1,6 GIARRE ITA07 86130 2 0 0 0 1 1 1 0,7 MODICA ITA08 107589 2 0 0 0 1 2 1 0,9 RAGUSA ITA08 90318 2 0 0 0 1 1 1 0,7 VITTORIA ITA08 91826 2 0 0 0 1 1 1 0,7 LENTINI ITA09 59525 2 0 0 0 1 1 1 0,7 SIRACUSA ITA09 258332 3 0 0 1 1 2 2 1,3 ALGHERO ITB01 45127 1 1 0 0 1 1 1 0,7 OLBIA ITB01 49671 1 0 0 1 1 1 1 0,7 SASSARI ITB01 204440 2 0 3 1 1 3 2 1,4 NUORO ITB02 80080 2 0 0 0 1 1 1 0,7 MACOMER ITB02 22921 1 0 0 0 1 3 1 0,9 ORISTANO ITB03 77149 2 0 0 0 1 1 1 0,7 CAGLIARI ITB04 460774 3 0 4 1 2 3 2 1,9 IGLESIAS ITB04 129103 2 0 0 1 1 2 2 1,1 VALLETTA MT 388594 3 4 2 3 4 3 1 2,9 VISBY SE094 57313 2 1 1 1 2 2 1 1,4 Source: ESPON 2006 Data Base, TPG calculations FUApop: FUA population FUAdem: FUA demography function FUAtra: FUA transport function FUAuni :FUA Knowledge function FUAdec: FUA Decision making for the private sector function FUAadm: FUA Decision making for the public sector function FUAtou: FUA Tourism function FUAman: FUA Manufacturing function FUAave: Averege of FUA’s performance
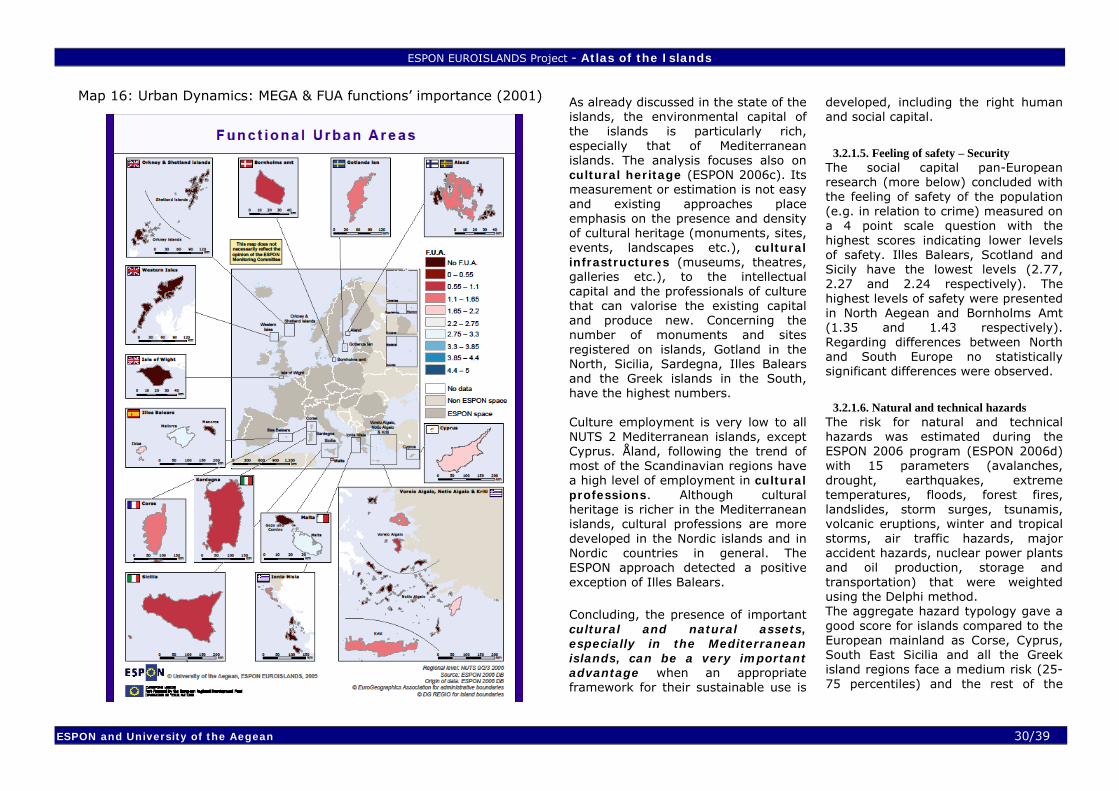
ESPON EUROISLANDS Project - Atlas of the Islands
ESPON and University of the Aegean 30/39
As already discussed in the state of the islands, the environmental capital of the islands is particularly rich, especially that of Mediterranean islands. The analysis focuses also on cultural heritage (ESPON 2006c). Its measurement or estimation is not easy and existing approaches place emphasis on the presence and density of cultural heritage (monuments, sites, events, landscapes etc.), cultural infrastructures (museums, theatres, galleries etc.), to the intellectual capital and the professionals of culture that can valorise the existing capital and produce new. Concerning the number of monuments and sites registered on islands, Gotland in the North, Sicilia, Sardegna, Illes Balears and the Greek islands in the South, have the highest numbers. Culture employment is very low to all NUTS 2 Mediterranean islands, except Cyprus. Åland, following the trend of most of the Scandinavian regions have a high level of employment in cultural professions. Although cultural heritage is richer in the Mediterranean islands, cultural professions are more developed in the Nordic islands and in Nordic countries in general. The ESPON approach detected a positive exception of Illes Balears. Concluding, the presence of important cultural and natural assets, especially in the Mediterranean islands, can be a very important advantage when an appropriate framework for their sustainable use is
developed, including the right human and social capital.
3.2.1.5. Feeling of safety – Security The social capital pan-European research (more below) concluded with the feeling of safety of the population (e.g. in relation to crime) measured on a 4 point scale question with the highest scores indicating lower levels of safety. Illes Balears, Scotland and Sicily have the lowest levels (2.77, 2.27 and 2.24 respectively). The highest levels of safety were presented in North Aegean and Bornholms Amt (1.35 and 1.43 respectively). Regarding differences between North and South Europe no statistically significant differences were observed.
3.2.1.6. Natural and technical hazards The risk for natural and technical hazards was estimated during the ESPON 2006 program (ESPON 2006d) with 15 parameters (avalanches, drought, earthquakes, extreme temperatures, floods, forest fires, landslides, storm surges, tsunamis, volcanic eruptions, winter and tropical storms, air traffic hazards, major accident hazards, nuclear power plants and oil production, storage and transportation) that were weighted using the Delphi method. The aggregate hazard typology gave a good score for islands compared to the European mainland as Corse, Cyprus, South East Sicilia and all the Greek island regions face a medium risk (25-75 percentiles) and the rest of the
Map 16: Urban Dynamics: MEGA & FUA functions’ importance (2001)
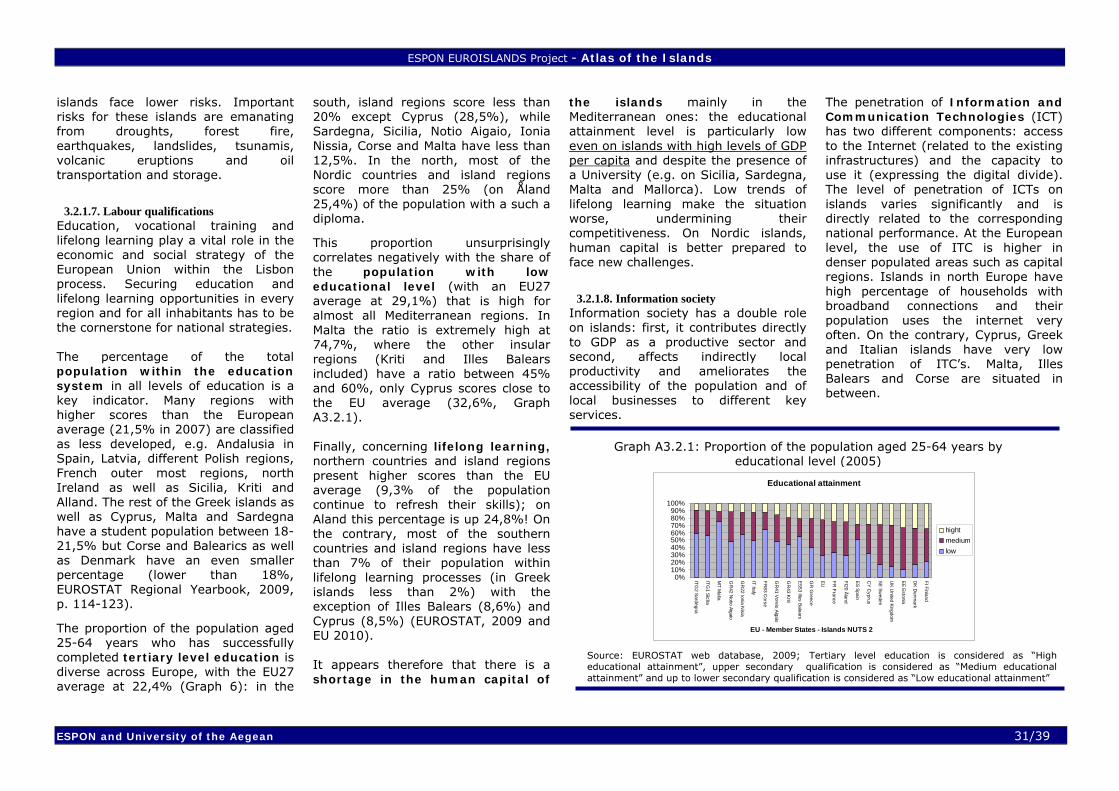
ESPON EUROISLANDS Project - Atlas of the Islands
ESPON and University of the Aegean 31/39
islands face lower risks. Important risks for these islands are emanating from droughts, forest fire, earthquakes, landslides, tsunamis, volcanic eruptions and oil transportation and storage.
3.2.1.7. Labour qualifications Education, vocational training and lifelong learning play a vital role in the economic and social strategy of the European Union within the Lisbon process. Securing education and lifelong learning opportunities in every region and for all inhabitants has to be the cornerstone for national strategies. The percentage of the total population within the education system in all levels of education is a key indicator. Many regions with higher scores than the European average (21,5% in 2007) are classified as less developed, e.g. Andalusia in Spain, Latvia, different Polish regions, French outer most regions, north Ireland as well as Sicilia, Kriti and Alland. The rest of the Greek islands as well as Cyprus, Malta and Sardegna have a student population between 18-21,5% but Corse and Balearics as well as Denmark have an even smaller percentage (lower than 18%, EUROSTAT Regional Yearbook, 2009, p. 114-123).
The proportion of the population aged 25-64 years who has successfully completed tertiary level education is diverse across Europe, with the EU27 average at 22,4% (Graph 6): in the
south, island regions score less than 20% except Cyprus (28,5%), while Sardegna, Sicilia, Notio Aigaio, Ionia Nissia, Corse and Malta have less than 12,5%. In the north, most of the Nordic countries and island regions score more than 25% (on Åland 25,4%) of the population with a such a diploma.
This proportion unsurprisingly correlates negatively with the share of the population with low educational level (with an EU27 average at 29,1%) that is high for almost all Mediterranean regions. In Malta the ratio is extremely high at 74,7%, where the other insular regions (Kriti and Illes Balears included) have a ratio between 45% and 60%, only Cyprus scores close to the EU average (32,6%, Graph A3.2.1). Finally, concerning lifelong learning, northern countries and island regions present higher scores than the EU average (9,3% of the population continue to refresh their skills); on Aland this percentage is up 24,8%! On the contrary, most of the southern countries and island regions have less than 7% of their population within lifelong learning processes (in Greek islands less than 2%) with the exception of Illes Balears (8,6%) and Cyprus (8,5%) (EUROSTAT, 2009 and EU 2010). It appears therefore that there is a shortage in the human capital of
the islands mainly in the Mediterranean ones: the educational attainment level is particularly low even on islands with high levels of GDP per capita and despite the presence of a University (e.g. on Sicilia, Sardegna, Malta and Mallorca). Low trends of lifelong learning make the situation worse, undermining their competitiveness. On Nordic islands, human capital is better prepared to face new challenges.
3.2.1.8. Information society Information society has a double role on islands: first, it contributes directly to GDP as a productive sector and second, affects indirectly local productivity and ameliorates the accessibility of the population and of local businesses to different key services.
The penetration of Information and Communication Technologies (ICT) has two different components: access to the Internet (related to the existing infrastructures) and the capacity to use it (expressing the digital divide). The level of penetration of ICTs on islands varies significantly and is directly related to the corresponding national performance. At the European level, the use of ITC is higher in denser populated areas such as capital regions. Islands in north Europe have high percentage of households with broadband connections and their population uses the internet very often. On the contrary, Cyprus, Greek and Italian islands have very low penetration of ITC’s. Malta, Illes Balears and Corse are situated in between.
Educational attainment
0%10%20%30%40%50%60%70%80%90%
100%
ITG2 Sardegna
ITG1 Sicilia
MT M
alta
GR
42 Notio Aigaio
GR
22 Ionia Nisia
IT Italy
FR83 C
orse
GR
41 Voreio Aigaio
GR
43 Kriti
ES53 Illes Balears
GR
Greece
EU FR France
FI20 Åland
ES Spain
CY C
yprus
SE Sweden
UK U
nited Kingdom
EE Estonia
DK D
enmark
FI Finland
EU - Member States - Islands NUTS 2
hightmediumlow
Graph A3.2.1: Proportion of the population aged 25-64 years by educational level (2005)
Source: EUROSTAT web database, 2009; Tertiary level education is considered as “High educational attainment”, upper secondary qualification is considered as “Medium educational attainment” and up to lower secondary qualification is considered as “Low educational attainment”
ESPON EUROISLANDS Project - Atlas of the Islands
ESPON and University of the Aegean 32/39
The same pattern is observed for e-commerce: more than 55% of the population in Åland use internet for shopping while people in Corse and the Balears use it as much as the European average. Malta has the lowest score while the rest of the Mediterranean islands are classified among the European regions with the lowest use of this facility (lower than the EU average 15%) (EUROSTAT, 2009). The findings on ITC penetration follow a similar pattern as the labour qualification results, with the Nordic islands performing better that the Mediterranean ones. The “technology” gap causes lack of information and knowledge, factors that are necessary to achieve social equity and economic competitiveness.
3.2.1.9. Research and Innovation Knowledge and innovation constitute one of the three main areas of action in the new Lisbon partnership for growth and jobs. The performance of the different areas is assessed through R&D expenditure, patents, employment in Science and Technology and in the medium and high tech manufacture. On islands, R&D is particularly important as it has to address the characteristics of insularity (small scale, environmental vulnerability and remoteness) and therefore the penetration of technology in low skilled societies as
well as its adaptation to insularity is necessary. The EU as a whole dedicates 1,9% of its GDP and 1,11% of the employment to R&D. In all islands, very low expenditure and human capital dedicated to R&D are recorded in comparison with EU average (Eurostat webdata base, 2009) and only in one case (Kriti) R&D performances are better than the national ones: 0,94 % of the GDP and 0,84% of the human capital compared to 0,59% and 0,77% (2005); from the other regions Sicilia (0,8% and 0,6% respectively 2005), Malta (0,54% and 0,56% - 2008), Voreio Aigaio (0,48% and 0,39% 2005) and Sardegna (0,58% and 0,47% - 2005) have the highest involvement. On the contrary, Åland (0,16% - 0,21% -2007) and Illes Balears (0,33% – 0,31% -2007) have particularly low involvement in R&D. Considering that the part of the private sector resources dedicated to R&D is lower than 0,2% (except in Malta where it is 0,4%) the assumption that research is concentrated in the Universities and in public research institutes is unavoidable. This is typical for Sicilia and Sardegna that are considered as knowledge nodes of European significance (ESPON Atlas, 2006, p.25 – EUROSTAT, 2009). The high performing regions of competitiveness and innovation present the same concentration for the Information Society Index as well. Illes Balears, Åland and Cyprus plus Kriti
are performing better than other Mediterranean islands but are below European average (ESPON Atlas, 2006, Table S3.2.13). According to the Regional Innovation Performance Index for 2002-3 (EU 4th Report on Economic & Social Cohesion, 2007, p. 79) all Mediterranean islands performed below the EU average (Illes Balears, Notio Aigaio and Voreio Aigaio recorded the poorest performance) where the Nordic Islands (or the european mainland region to which these islands are attached) performed above the average. All islands perform very poorly in R&D. This is due to (a) the lack of significant Research Institutions located on the islands (lack of infrastructure) and (b) the low attractiveness of islands for highly educated and skilled people. Among the Mediterranean islands, all of which are far below European average, Kriti, Sicilia, Malta and Sardegna perform relatively better than the rest since these islands have Universities and research institutes, which are the incubators for R&D Development.
3.2.1.10. Social capital For assessing social capital on islands, the results of the European Social Survey have been used4 (2003), with the main outcomes being:
4 This Survey was not organised on a NUTS level and didn’t cover all island regions or Member States such as Malta.
Social trust Three questions measuring social trust were combined in one quantitative variable. According to the results of the analysis differences of social trust between regions are statistically significant. In particular, several South European regions record the lowest, including Ionian Islands (mean score: -1.30), South Aegean (-0.87), Sicily (-0.69), Cyprus (-0.48) and Crete (-0.41). The highest levels of social trust are observed in Southern Finland and Åland (0.61), Bornholms Amt (0.59) and Illes Balears (0.42). Statistically significant differences of averages were also observed between South and North regions of the study. Northern regions present an average score of 0.54 whereas Southern regions have significantly lower levels of social trust (-0.43). Institutional trust Trust in institutions was investigated for three entities (Parliament, European Parliament, and Legal System) and was measured in one variable. One-way ANOVA tests recorded several statistically significant differences of means between regions. Differences are significant between north and south European regions, with Southern areas having higher scores (South: 0.08, North: -0.10). Mean scores for each region reveal the highest levels in the Ionian Islands (0.53) followed by South Aegean and Cyprus (0.32 and 0.25 respectively). On the other hand, Scotland (-0.65), Mediterranee (-0.47) and Illes Balears
ESPON EUROISLANDS Project - Atlas of the Islands
ESPON and University of the Aegean 33/39
(-0.25) have significantly lower levels of institutional trust. Social networks Social networks measurements were based on the number of organizations in which individuals are members or volunteers. One-way ANOVA tests reveal several statistical differences between regions regarding the density of these networks. The highest mean score is presented in the area of Bornholms Amt (2.14) followed by Scotland (1.60) and Southern Finland (1.58). The majority of South European regions have significantly lower levels (Illes Balears: 0.05, Ionian Islands: 0.18, North Aegean: 0.41, Sardegna: 0.50, Sicily: 0.57, Crete: 0.59). Similar results are observed for volunteerism, with lower scores on Balears and Ionian Islands where no respondents declared positive answers. The highest scores were noticed in Bornholms Amt (0.79). Interest in politics Regarding the level of interest in politics, the least concerned citizens are those in Greece, Spain and Italy. The most interested ones are those of Scotland and Southern Finland and Åland. This is reflected in the average values of all South (2.85) and North regions (2.61). Level of satisfaction with public issues The level of satisfaction was measured for several public issues including the national government, democracy, health services, the economy and
education, all included in one factor. The results indicate significant disparity between the level of satisfaction among Southern and Northern regions (average of Northern areas 0.25 whereas for Southern regions -0.20). Nordic islands present higher scores in social capital than the southern ones: higher levels of social trust and civic participation indicate more “connected” areas, therefore more enhanced productivity and level of cohesion.
3.2.1.11. Governance Quality Governance quality influences public policy and is linked to effective development. Here, it refers to the effectiveness of local authorities and the procedures used in order to involve the participation of stakeholders in planning and decision making processes- these parameters make an area more attractive than another. Different national traditions of governance across European space exist and that these differences still influence practices (ESPON Atlas, 2006, p.60). A categorisation of countries in terms of their “shift towards governance” shows that countries such as France, Spain, UK, Sweden, Denmark and Finland are leaders at this process. On the other hand in Malta, Cyprus, Esthonia and particularly in Greece, traditional
patterns of government are still dominant.
3.2.1.12. Employment opportunities The particular indicator can be approached indirectly by the percentage of the economically active population, the evolution of the employed and unemployment (total, women, young) that were presented earlier in this report (previous section).
3.2.2. Classification of Attractiveness factors by islanders The perception that islanders have about the importance of the attractiveness parameters is very important as it can influence (among other issues) policy priorities. It has to be underlined here that “scientific objectivity” is necessary but not critical to persuade businessmen and population about islands’ attractiveness and to influence their decision for location. The findings come from field research to local populations, stakeholders and businesses in the case study (for detailed analysis see the Scientific Report of the study). For population attractiveness, respondents were asked to rate twenty four different factors that could define islands' attractiveness for permanent residence on a scale from 1 to 5 (1 was the first most important factor of attractiveness, 2 the second most important factor and so on).
3.2.2.1. Islands’ attractiveness for living (Local Authorities’ Responses)
Classification of Factors In Table A3.2.6 the hierarchy of attractiveness factors based on their importance is presented. Values closer to 1 denote higher importance while those closer to 5 signify lower importance. Factors not rated by the respondents are excluded. Parameters are classified in four classes according to the frequency of the values: High priority factors (up to 3.5). Intermediate priority factors (from 3.51 to 4.00). Low priority factors (4.01 to 4.85). Insignificant factors (from 4.86 to 5.00). The five most important factors are (Table A3.2.6): Quality of health care system, Trip frequency, Regularity of water supply, Job Opportunities, Quality of life.
Table A3.2.6: Classification of factors
influencing the attractiveness of islands for living
High priority factors (1.00-3.50) Quality of health care system Trip frequency Regularity water supply Job Opportunities Medial priority factors (3.51-4.00) Quality of life Quality of education services. Regularity of energy supply Low priority factors (4.01-4.85) Cost of travel Cost of living Quality of nature Quality of transport
ESPON EUROISLANDS Project - Atlas of the Islands
ESPON and University of the Aegean 34/39
Career opportunities Cost of Land Connection to the water waste system Insignificant- complementary factors (4.86-5.00) Effectiveness of solid waste collection Linguistic, religious, racial or ethnic diversity in society Opportunities to attend cultural events Quality of public transport system Quality of built environment Networks of trust and social capital Training opportunities Participation in non-government collective activities
3.2.2.2. Islands’ attractiveness for economic activities (Chambers and Local Authorities Responses)
The second type of questionnaire was addressed to chambers and local authorities (municipalities, prefectures, universities) in order to investigate and define the factors that make an island attractive for setting up local economic activities. In total 55 responses were gathered, 40 of which were valid. Participants were asked: a) to prioritize the five most important factors from a list of 24 and b) to rate all factors on a scale from “very important” to “insignificant”. As before, values closer to 1 indicate the most important factors and those closer to 5 are the least important ones. The first six factors are (Table A3.2.7): The Frequency of scheduled trips, Economic Incentives, Regularity of water supply, The vision of local authorities, Regularity of energy supply, Travel cost.
Table A3.2.7: Classification of factors influencing islands attractiveness for
business according to their average score
High priority factors (1.00-3.50) Trip frequency Economic incentives Regularity of water supply Development vision of local authorities Regularity of energy supply Travel cost Medial priority factors (3.51-4.00) Effectiveness of public administration Labour costs Land and construction cost Quality of transport services Supply of trained/ qualified human capital Competence of local authorities to solve problem Low priority factors (4.01-4.3) Quality of local public transport Broadband connection Possibility to support innovation Degree of stakeholder involvement in decision making Support by other business Business support agencies Insignificant- complementary factors (4.31-4.40) Security Effectiveness of solid waste collection Connection to the waste water system Cooperation with other business Threat of natural hazards Threat of technological hazards.
Common factors From the listed factors, ten are common (table A3.2.8). In most of them, the hierarchy ranking has small differences. Table A3.2.8: Commons Factors of the attractiveness of islands for living and business ranked in decreasing priority
Factor
Business hierarchy
Population
hierarchy
Trip frequency 1 2 Regularity of water supply 3 3 Regularity of energy supply 5 7 Travel cost 6 8 Land cost 9 13 Quality of transport services 10 11 Broadband connection 14 -
Effectiveness of solid waste collection
20 15
Connection to the waste water system
21 14
Quality of public transport system
13 18
3.2.3. The results of the Delphi workshop The Delhi workshop included two different rounds for factors of attractiveness for both residence and economic activities. The second round of the evaluation between experts produced some differences compared to that of locals (Table A3.2.9). From the classification of attractiveness parameters, some remarks can be made: - both stakeholders and experts place high importance to the main characteristics of attractiveness influenced negatively by insularity: accessibility and services of public interest (energy, water, healthcare, education); preservation of quality of life and quality of nature are seen as an asset by both the stakeholders and the experts;
- governance is considered as an important factor influencing local development - economic incentives are important for local entrepreneurs The differences in the classification between local stakeholders and experts could be attributed to the more technocratic view of the experts that express the broader (global) view concerning attractiveness and the islands development perspective based on parameters such as the human capital, ITC, innovation. The locals have a less broad view since they focus on the everyday problems and can see the solutions to the “classical” hard infrastructure and activities.
Table A3.2.9: Factors of attractiveness at the 2nd round of Delphi
Factor of attractiveness for business
Average Factor of attractiveness for living Average
Regularity of energy supply 5.765 Job Opportunities 6.00 Frequency of scheduled trips 5.706 Quality of life 5.824 Supply of trained human capital 5.294 Frequency of scheduled trips 5.412 Effectiveness of public administration 5.176 Quality of nature 5.353 Broadband connection 5.176 Quality of health care and services 4.882 Competence of local authorities to solve problems 5.176 Regularity of water supply 4.824 Regularity of water supply 4.824 Career opportunities 4.353
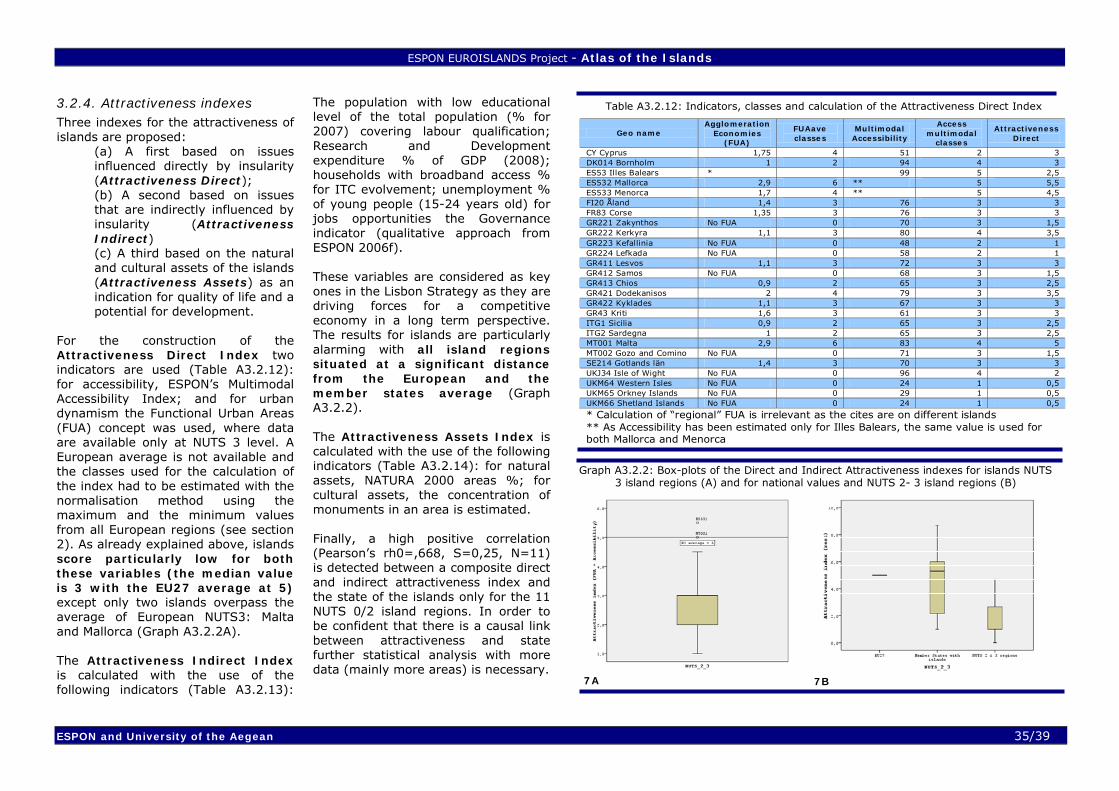
ESPON EUROISLANDS Project - Atlas of the Islands
ESPON and University of the Aegean 35/39
3.2.4. Attractiveness indexes Three indexes for the attractiveness of islands are proposed:
(a) A first based on issues influenced directly by insularity (Attractiveness Direct); (b) A second based on issues that are indirectly influenced by insularity (Attractiveness Indirect) (c) A third based on the natural and cultural assets of the islands (Attractiveness Assets) as an indication for quality of life and a potential for development.
For the construction of the Attractiveness Direct Index two indicators are used (Table A3.2.12): for accessibility, ESPON’s Multimodal Accessibility Index; and for urban dynamism the Functional Urban Areas (FUA) concept was used, where data are available only at NUTS 3 level. A European average is not available and the classes used for the calculation of the index had to be estimated with the normalisation method using the maximum and the minimum values from all European regions (see section 2). As already explained above, islands score particularly low for both these variables (the median value is 3 with the EU27 average at 5) except only two islands overpass the average of European NUTS3: Malta and Mallorca (Graph A3.2.2A). The Attractiveness Indirect Index is calculated with the use of the following indicators (Table A3.2.13):
The population with low educational level of the total population (% for 2007) covering labour qualification; Research and Development expenditure % of GDP (2008); households with broadband access % for ITC evolvement; unemployment % of young people (15-24 years old) for jobs opportunities the Governance indicator (qualitative approach from ESPON 2006f). These variables are considered as key ones in the Lisbon Strategy as they are driving forces for a competitive economy in a long term perspective. The results for islands are particularly alarming with all island regions situated at a significant distance from the European and the member states average (Graph A3.2.2). The Attractiveness Assets Index is calculated with the use of the following indicators (Table A3.2.14): for natural assets, NATURA 2000 areas %; for cultural assets, the concentration of monuments in an area is estimated. Finally, a high positive correlation (Pearson’s rh0=,668, S=0,25, N=11) is detected between a composite direct and indirect attractiveness index and the state of the islands only for the 11 NUTS 0/2 island regions. In order to be confident that there is a causal link between attractiveness and state further statistical analysis with more data (mainly more areas) is necessary.
Table A3.2.12: Indicators, classes and calculation of the Attractiveness Direct Index
Geo name Agglomeration
Economies (FUA)
FUAave classes
Multimodal Accessibility
Access multimodal
classes
Attractiveness Direct
CY Cyprus 1,75 4 51 2 3 DK014 Bornholm 1 2 94 4 3 ES53 Illes Balears * 99 5 2,5 ES532 Mallorca 2,9 6 ** 5 5,5 ES533 Menorca 1,7 4 ** 5 4,5 FI20 Åland 1,4 3 76 3 3 FR83 Corse 1,35 3 76 3 3 GR221 Zakynthos No FUA 0 70 3 1,5 GR222 Kerkyra 1,1 3 80 4 3,5 GR223 Kefallinia No FUA 0 48 2 1 GR224 Lefkada No FUA 0 58 2 1 GR411 Lesvos 1,1 3 72 3 3 GR412 Samos No FUA 0 68 3 1,5 GR413 Chios 0,9 2 65 3 2,5 GR421 Dodekanisos 2 4 79 3 3,5 GR422 Kyklades 1,1 3 67 3 3 GR43 Kriti 1,6 3 61 3 3 ITG1 Sicilia 0,9 2 65 3 2,5 ITG2 Sardegna 1 2 65 3 2,5 MT001 Malta 2,9 6 83 4 5 MT002 Gozo and Comino No FUA 0 71 3 1,5 SE214 Gotlands län 1,4 3 70 3 3 UKJ34 Isle of Wight No FUA 0 96 4 2 UKM64 Western Isles No FUA 0 24 1 0,5 UKM65 Orkney Islands No FUA 0 29 1 0,5 UKM66 Shetland Islands No FUA 0 24 1 0,5
* Calculation of “regional” FUA is irrelevant as the cites are on different islands ** As Accessibility has been estimated only for Illes Balears, the same value is used for both Mallorca and Menorca
Graph A3.2.2: Box-plots of the Direct and Indirect Attractiveness indexes for islands NUTS 3 island regions (A) and for national values and NUTS 2- 3 island regions (B)
7A
7B

ESPON EUROISLANDS Project - Atlas of the Islands
ESPON and University of the Aegean 36/39
Table
A3.2
.13:
Indic
ator
s, c
lass
es a
nd c
alcu
lation
of
the
Indirec
t Att
ract
iven
ess
Index
Ge
o n
am
e
low
e
du
ca-
tion
al
leve
l
low
ed
uca
t-io
na
l le
ve
l (E
U2
7
=1
00
)
low
ed
uca
-ti
on
al
leve
l in
ve
rse
cl
ass
es
R&
D
ex
pe
n-
dit
ure
%
GD
P
20
08
(N
UT
S 2
dif
fere
nt
ye
ars
)
R&
D
ex
pe
n-
dit
ure
%
GD
P
20
08
(E
U2
7
=1
00
) (N
UT
S 2
d
iffe
ren
t ye
ars
)
R&
D
ex
pe
n-
dit
ure
%
GD
P
20
08
cl
ass
es
(NU
TS
2
dif
fere
nt
ye
ars
) cl
ass
es
Ho
use
-h
old
s w
ith
b
roa
d-
ba
nd
a
cce
ss
%
20
08
Ho
use
-h
old
s w
ith
bro
ad
-b
an
d
acc
ess
%
20
08
(E
U=
10
0)
Ho
use
-h
old
s w
ith
b
roa
d-
ba
nd
acc
ess
%
20
08
(E
U=
10
0)
class
es
CY C
ypru
s 32,6
112,0
4
0,4
6
24,2
1
33
67,3
2
DK D
enm
ark
17,3
59,5
9
2,7
2
143,2
9
74
151,0
9
EE E
stonia
10,9
37,5
9
1,2
9
67,9
2
54
110,2
6
ES S
pai
n
51,2
175,9
1
1,3
5
71,1
2
45
91,8
4
ES53 I
lles
Bal
ears
55,6
191,1
4
0,3
3
17,4
1
50
102,0
5
FI F
inla
nd
21,2
72,9
8
3,7
3
196,3
9
66
134,7
8
FI20 Å
land
29,5
101,4
5
0,1
6
8,4
1
64
130,6
8
FR F
rance
33,6
115,5
3
2,2
115,8
7
57
116,3
7
FR83 C
ors
e 64,2
220,6
1
0,2
2
11,6
1
57
116,3
7
GR G
reec
e 40
137,5
1
0,5
8
30,5
1
22
44,9
1
GR22 I
onia
Nis
ia
57,2
196,6
1
0,1
6
8,4
1
18
36,7
1
GR41 V
ore
io A
igai
o
47,7
163,9
1
0,4
8
25,3
1
18
36,7
1
GR42 N
otio A
igai
o
48,1
165,3
1
0,1
5
7,9
1
18
36,7
1
GR43 K
riti
44,6
153,3
1
18
36,7
1
IT I
taly
49,3
169,4
1
1,1
8
62,1
1
31
63,3
1
ITG
1 S
icili
a 56,7
194,8
1
0,8
42,1
1
22
44,9
1
ITG
2 S
ard
egna
58,9
202,4
1
0,5
8
30,5
1
27
55,1
1
MT M
alta
74,7
256,7
1
0,5
4
28,4
1
55
112,2
6
SE S
wed
en
16,5
56,7
8
3,7
5
197,4
9
71
144,9
9
UK U
nit
ed K
ingdom
14,8
50,9
9
1,8
8
98,9
5
62
126,5
8
EU
(27 c
ountr
ies)
29,1
100,0
5
1,9
100,0
5
49
100
5
Table
A3.2
.13 (
continued
): I
ndic
ator
s, c
lass
es a
nd c
alcu
lation o
f th
e In
direc
t Att
ract
iven
ess
Index
Geo
na
me
Un
em
plo
-ym
en
t ra
te
tota
l 1
5-
24
20
08
Un
em
plo
-ym
en
t ra
te
tota
l 1
5-
24
20
08
(E
U2
7
=1
00
)
Un
em
plo
-ym
en
t ra
te t
ota
l 1
5-2
4
20
08
(EU
27
=
10
0)
invers
e
cla
sse
s
Go
ver-
na
nce
Att
ract
i-ven
ess
In
dir
ect
CY C
ypru
s 9
57,7
9
6
4,4
D
K D
enm
ark
7,6
48,7
9
9,0
EE E
stonia
12
76,9
7
6,0
ES S
pai
n
24,6
157,7
1
2,0
ES53 I
lles
Bal
ears
24,3
155,8
1
8
3,8
FI
Fin
land
16,5
105,8
4
7,3
FI
20 Å
land
10,6
67,9
8
8
6,0
FR
Fra
nce
19
121,8
3
5,0
FR
83 C
ors
e 18
115,4
3
5
3,4
G
R G
reec
e 22,1
141,7
1
1,0
G
R22 I
onia
Nis
ia
26,7
171,2
1
4
1,6
G
R41 V
ore
io A
igai
o
20,2
129,5
2
4
1,8
G
R42 N
otio A
igai
o
14,9
95,5
5
4
2,4
G
R43 K
riti
13,9
89,1
6
3
2,2
IT
Ita
ly
21,3
136,5
1
ITG
1 S
icili
a 39,3
251,9
1
2
1,2
IT
G2 S
ard
egna
36,8
235,9
1
2
1,2
M
T M
alta
12,2
78,2
7
4
3,8
SE S
wed
en
20,2
129,5
2
7,0
U
K U
nit
ed K
ingdom
15
96,2
5
6,8
Euro
pean
Unio
n (
27 c
ountr
ies)
15,6
100,0
5
5,0

ESPON EUROISLANDS Project - Atlas of the Islands
ESPON and University of the Aegean 37/39
Table
A3.2
.14:
Indic
ato
rs,
class
es a
nd c
alc
ula
tion
of
the
Att
ract
iveness
Ass
ets
Index
Ge
o n
am
e
La
nd
u
nd
er
NA
TU
RA
2
00
0
(km
2)
La
nd
u
nde
r N
AT
UR
A
20
00
%
of
tota
l
La
nd
un
de
r N
AT
UR
A
20
00
% o
f to
tal
(EU
27
=1
00
)
La
nd
un
de
r N
AT
UR
A
20
00
% o
f to
tal
(EU
27
=1
00
) cl
ass
es
Den
sity
o
f m
on
um
en
ts
Cu
ltu
ral
ind
ica
tor
Ass
ets
in
dic
ato
r
CY C
ypru
s 74276
8,7
61,3
1
0,0
023
1
1
DK D
enm
ark
423639
9,9
69,7
2
D
K014 B
orn
holm
8034
13,5
95,1
5
0,2
396
4
4,5
EE E
stonia
794721
18,3
128,8
8
ES S
pai
n
13880379
27,4
193,2
9
ES53 I
lles
Bal
ears
111051
21,8
153,5
9
0,5
668
5
7
ES531 E
ivis
sa y
Form
ente
ra
ES532 M
allo
rca
ES533 M
enorc
a
FI F
inla
nd
4959995
14,7
103,5
5
FI
20 Å
land
2942
1,9
13,4
1
0,0
026
1
1
FR F
rance
4972249
9,1
63,8
1
FR
83 C
ors
e 114727
13,2
92,7
4
0,0
306
2
3
GR G
reec
e 2595058
19,8
139,1
9
G
R221 Z
akyn
thos
5176
12,7
89,4
4
2,3
124
8
6
GR222 K
erkyr
a 5875
9,6
67,6
2
4,3
881
9
5,5
G
R223 K
efal
linia
9477
10,5
73,9
2
2,0
741
7
4,5
G
R224 L
efkad
a 5434
13,6
95,8
5
0,0
000
1
3
GR411 L
esvo
s 45372
21,5
151,4
9
1,3
064
6
7,5
G
R412 S
am
os
27446
27
190,1
9
2,4
110
8
8,5
G
R413 C
hio
s 32265
35,1
247,2
9
2,0
745
7
8
GR421 D
odek
anis
os
92107
28,9
203,5
9
3,1
097
9
9
GR422 K
ykl
ades
70878
21,6
152,1
9
5,4
702
9
9
GR43 K
riti
272314
32,8
230,8
9
1,6
877
8
8,5
IT
Ita
ly
5064396
16,8
118,4
7
IT
G1 S
icili
a 407861
15,9
111,7
6
1,3
136
8
7
ITG
2 S
ard
egna
385255
20,0
141,1
9
0,5
840
7
8
MT M
alta
5066
14,5
102,1
5
M
T001 M
alta
4086
14,9
104,9
5
0,0
400
2
3,5
M
T002 G
ozo
and C
om
ino
980
13,2
93,0
4
0,0
403
2
3
SE S
wed
en
7670683
17,1
120,2
7
SE214 G
otlan
ds
län
16020
4,8
33,8
1
1,1
947
6
3,5
U
K U
nit
ed K
ingdom
1880238
7,7
54,2
1
U
KJ3
4 I
sle
of
Wig
ht
3344
6,5
45,8
1
0,3
013
5
3
UKM
64 W
est
ern I
sles
99765
18,3
128,9
8
0,0
670
2
5
UKM
65 O
rkney
Isl
ands
21849
12,1
85,2
4
0,3
681
5
4,5
U
KM
66 S
het
land I
slan
ds
22651
8,5
59,9
1
0,2
531
4
2,5
Euro
pean
Unio
n (
27 c
ountr
ies)
61090938
14,2
100,0
5
Map 17: Attractiveness Direct Index for Island-states, NUTS 2 and NUTS 3 islands concerning accessibility and urban dynamism
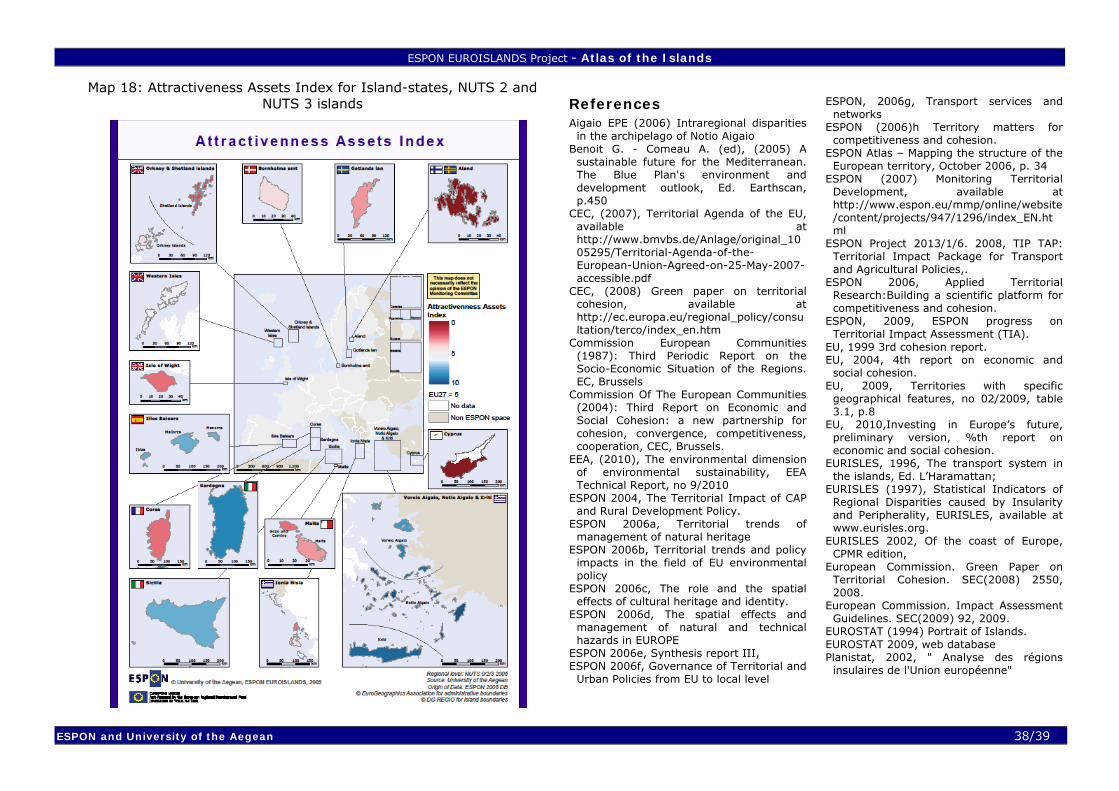
ESPON EUROISLANDS Project - Atlas of the Islands
ESPON and University of the Aegean 38/39
References Aigaio EPE (2006) Intraregional disparities
in the archipelago of Notio Aigaio Benoit G. - Comeau A. (ed), (2005) A
sustainable future for the Mediterranean. The Blue Plan's environment and development outlook, Ed. Earthscan, p.450
CEC, (2007), Territorial Agenda of the EU, available at http://www.bmvbs.de/Anlage/original_1005295/Territorial-Agenda-of-the-European-Union-Agreed-on-25-May-2007-accessible.pdf
CEC, (2008) Green paper on territorial cohesion, available at http://ec.europa.eu/regional_policy/consultation/terco/index_en.htm
Commission European Communities (1987): Third Periodic Report on the Socio-Economic Situation of the Regions. EC, Brussels
Commission Of The European Communities (2004): Third Report on Economic and Social Cohesion: a new partnership for cohesion, convergence, competitiveness, cooperation, CEC, Brussels.
EEA, (2010), The environmental dimension of environmental sustainability, EEA Technical Report, no 9/2010
ESPON 2004, The Territorial Impact of CAP and Rural Development Policy.
ESPON 2006a, Territorial trends of management of natural heritage
ESPON 2006b, Territorial trends and policy impacts in the field of EU environmental policy
ESPON 2006c, The role and the spatial effects of cultural heritage and identity.
ESPON 2006d, The spatial effects and management of natural and technical hazards in EUROPE
ESPON 2006e, Synthesis report III, ESPON 2006f, Governance of Territorial and
Urban Policies from EU to local level
ESPON, 2006g, Transport services and networks
ESPON (2006)h Territory matters for competitiveness and cohesion.
ESPON Atlas – Mapping the structure of the European territory, October 2006, p. 34
ESPON (2007) Monitoring Territorial Development, available at http://www.espon.eu/mmp/online/website/content/projects/947/1296/index_EN.html
ESPON Project 2013/1/6. 2008, TIP TAP: Territorial Impact Package for Transport and Agricultural Policies,.
ESPON 2006, Applied Territorial Research:Building a scientific platform for competitiveness and cohesion.
ESPON, 2009, ESPON progress on Territorial Impact Assessment (TIA).
EU, 1999 3rd cohesion report. EU, 2004, 4th report on economic and
social cohesion. EU, 2009, Territories with specific
geographical features, no 02/2009, table 3.1, p.8
EU, 2010,Investing in Europe’s future, preliminary version, %th report on economic and social cohesion.
EURISLES, 1996, The transport system in the islands, Ed. L’Haramattan;
EURISLES (1997), Statistical Indicators of Regional Disparities caused by Insularity and Peripherality, EURISLES, available at www.eurisles.org.
EURISLES 2002, Of the coast of Europe, CPMR edition,
European Commission. Green Paper on Territorial Cohesion. SEC(2008) 2550, 2008.
European Commission. Impact Assessment Guidelines. SEC(2009) 92, 2009.
EUROSTAT (1994) Portrait of Islands. EUROSTAT 2009, web database Planistat, 2002, " Analyse des régions
insulaires de l'Union européenne"
Map 18: Attractiveness Assets Index for Island-states, NUTS 2 and NUTS 3 islands

ESPON EUROISLANDS Project - Atlas of the Islands