Embed Size (px)
Citation preview
ATLAS muon chamber construction at NIKHEF
NIKHEF ATLAS MUON GROUPContact: Marcel Vreeswijk, [email protected]
November 2005
Abstract
At NIKHEF (Amsterdam), the largest muon chambers for the outer layer of the barrel ATLASmuon spectrometer have been constructed. At this facility, more than 40000 single drift tubes havebeen produced and 100 drift tube assemblies (muon chambers) have been constructed. We report onthe quality assurance of both single drift tube production and chamber assembly. This, together with thealso presented results from X-ray scans at CERN (Geneva) and results obtained in a dedicated cosmicray test set-up, also part of the facility, demonstrates that the chambers fulfil ATLAS specifications.
1
Contents
1 Introduction 1
2 Coordinate systems 3
3 Drift tubes 4
3.1 Drift tube requirements . . . . . . . . . . . . . . . . . . . . . . . . . . . . . . . . . . . . 4
3.2 Drift tube production . . . . . . . . . . . . . . . . . . . . . . . . . . . . . . . . . . . . . 5
3.3 Drift tube quality . . . . . . . . . . . . . . . . . . . . . . . . . . . . . . . . . . . . . . . 5
4 Drift tube chambers 10
4.1 Assembly station . . . . . . . . . . . . . . . . . . . . . . . . . . . . . . . . . . . . . . . 11
4.2 Chamber assembly . . . . . . . . . . . . . . . . . . . . . . . . . . . . . . . . . . . . . . 12
4.2.1 Results of X-ray scans . . . . . . . . . . . . . . . . . . . . . . . . . . . . . . . . 14
5 Chamber services 17
6 Broken wires 19
7 Tests of completed chambers 20
7.1 Cosmic ray test stand . . . . . . . . . . . . . . . . . . . . . . . . . . . . . . . . . . . . . 20
7.2 Results . . . . . . . . . . . . . . . . . . . . . . . . . . . . . . . . . . . . . . . . . . . . . 20
8 Chamber transport to CERN and instalation in ATLAS 21
9 Conclusions 21
A Alignment system RASNIK 22
List of Figures
1 xxxxxxxxxxxxxxxxxxxxxxxxxxxATLAS DETECTOR met MDT ingetekend . . . . . . . 1
2 xxxxxxxxxxxxxxxxxxxxxxxxxxxMDT principle . . . . . . . . . . . . . . . . . . . . . . 2
3 Schematic view of a muon chamber.xxxxxxxxxxxxxxxxxxxxxinplane rays are wrong! . . 3
4 Schematic view of a drift tube. Several components are indicated. . . . . . . . . . . . . . 4
5 Picture of an end-plug and its components. . . . . . . . . . . . . . . . . . . . . . . . . . 4
6 OVERNIEUW MET ASPECTEN: LEGE HULZEN, EINDPLUGS, DRAADSPOEL, UITEIN-DELIJKE BUIS. Picture of the wire machine taken at the north side. Indicated are themovable platform in the final position and the clamp to pre-tension the wire. Also indi-cated is the tube with has fixed end-plugs in this stage. . . . . . . . . . . . . . . . . . . . 5
7 Scatterplot of the � and � deviation of the wire position measured on a sub-sample ofproduced drift tubes. . . . . . . . . . . . . . . . . . . . . . . . . . . . . . . . . . . . . . 6
8 Leakrate of all used tubes in b l/s . . . . . . . . . . . . . . . . . . . . . . . . . . . . . . 7
9 a: Dark current in nA of all used tubes. . . . . . . . . . . . . . . . . . . . . . . . . . . . 8
10 Measurement of the wire tension of all tubes just before chamber assembly. . . . . . . . . 8
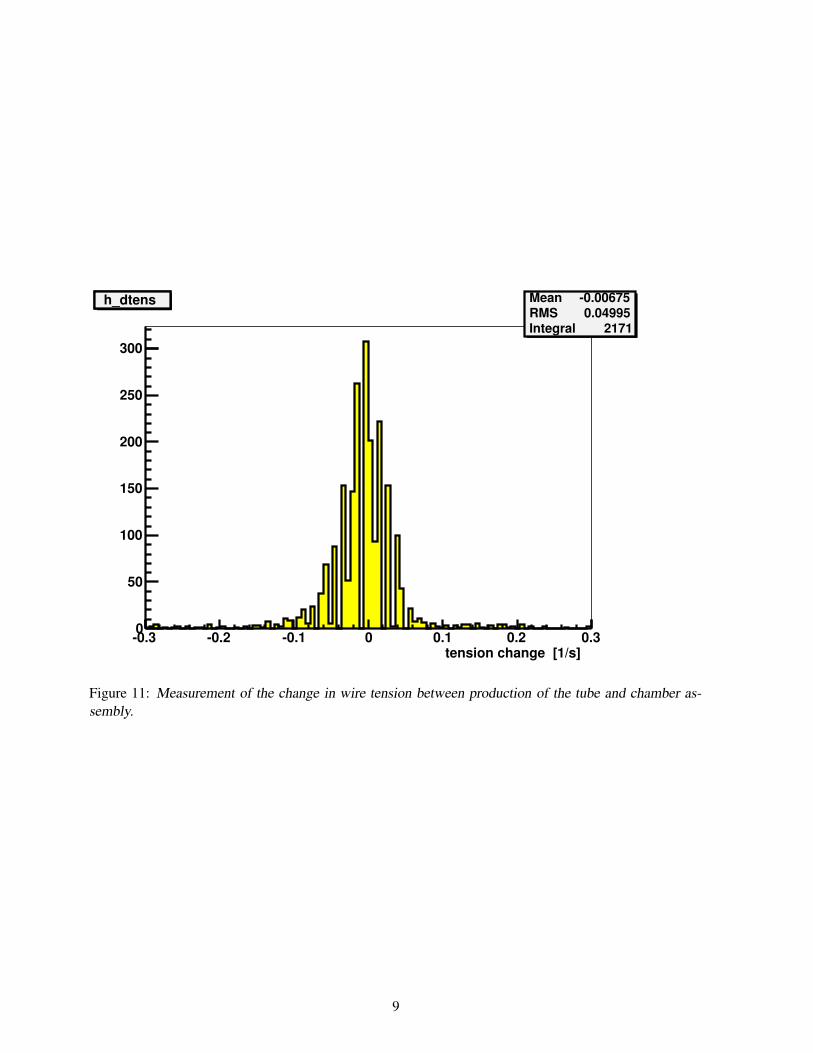
11 Measurement of the change in wire tension between production of the tube and chamberassembly. . . . . . . . . . . . . . . . . . . . . . . . . . . . . . . . . . . . . . . . . . . . 9
12 stacking drawing+gluing . . . . . . . . . . . . . . . . . . . . . . . . . . . . . . . . . . . 10
13 OVERNIEW: FOTO of a muon chamber. EVENTUEEL MET DETAILFOTOOS . . . . . 11
14 Picture taken in the cleanroom, illustrating the last step of the chamber assembly. The jigson the granite table hold the final tube layer. The chamber, which consistst at this point ofthe spacer with 3 layers on top and 2 layers at the bottom is lowered on the last tube layer.Also visible are the stacking towers, sag compensation towers and RASNIK towers thatcontrol the positioning of the spacer. (xxxxxxxxxx indicate this in pixture? xxxxxxxx) . . 12
15 The picture shows the stacking tower supporting the extension of the spacer. The po-sition of the spacer is monitored the alignment system. xxxxxxxxxindicate in the pi-ture?xxxxxxxx . . . . . . . . . . . . . . . . . . . . . . . . . . . . . . . . . . . . . . . . 13
16 Tube positions during assembly. . . . . . . . . . . . . . . . . . . . . . . . . . . . . . . . 14
17 Comparison of results from the tomograph scans for chambers BOL0, BOL2 and BOL3with RASAS data taken during glueing of the layers of these chambers. For each chamber aset of 4 plots show the deviations from the nominal Z layer pitch for the 3 layers within eachmultilayer ( MLI and MLII) at the HV and RO side respectively. xxxxxxxxxxxxxxxxxxkeepit? Then, renew itxxxxxxxxxxxxxxxxx . . . . . . . . . . . . . . . . . . . . . . . . . . . 16
18 Picture of several alignment components. . . . . . . . . . . . . . . . . . . . . . . . . . . 17
19 Picture taken the HV side of a BOL chamber. Some individual tubes can be recognizedtogether with the connections to the gasmanifolds. Also shown is a HV board and thebackplate of the RASNIK mask component. . . . . . . . . . . . . . . . . . . . . . . . . 18
20 Picture taken at the RO side of a nearly completed BOL chamber. The RO electronics ofthe top and bottom multilayer is enclosed in Faraday cages. Also visible are the backplatesof the RASNIK cameras, the DCS control box for the temperature and B field sensors, thereadout motherboard and two RASMUXes as required for this specific chamber. . . . . . 19
21 Picture of the cosmic ray stand with five BOL chambers. The chamber in the in the highestposition is a small type BOL chamber with a width of 48 tubes. . . . . . . . . . . . . . . 20
22 Drift time distribution xxxxxxxxxxxxget it, if we want itxxxxxxxxxxxxxxxx . . . . . . . 21
23 Residual. xxxxxxxxxxxxget plot if we want it.xxxxxxxxxxxxxxx . . . . . . . . . . . . . 21
24 The principle of RASNIK. . . . . . . . . . . . . . . . . . . . . . . . . . . . . . . . . . . 22
25 Illustration of the coded mask. . . . . . . . . . . . . . . . . . . . . . . . . . . . . . . . . 23
1 Introduction
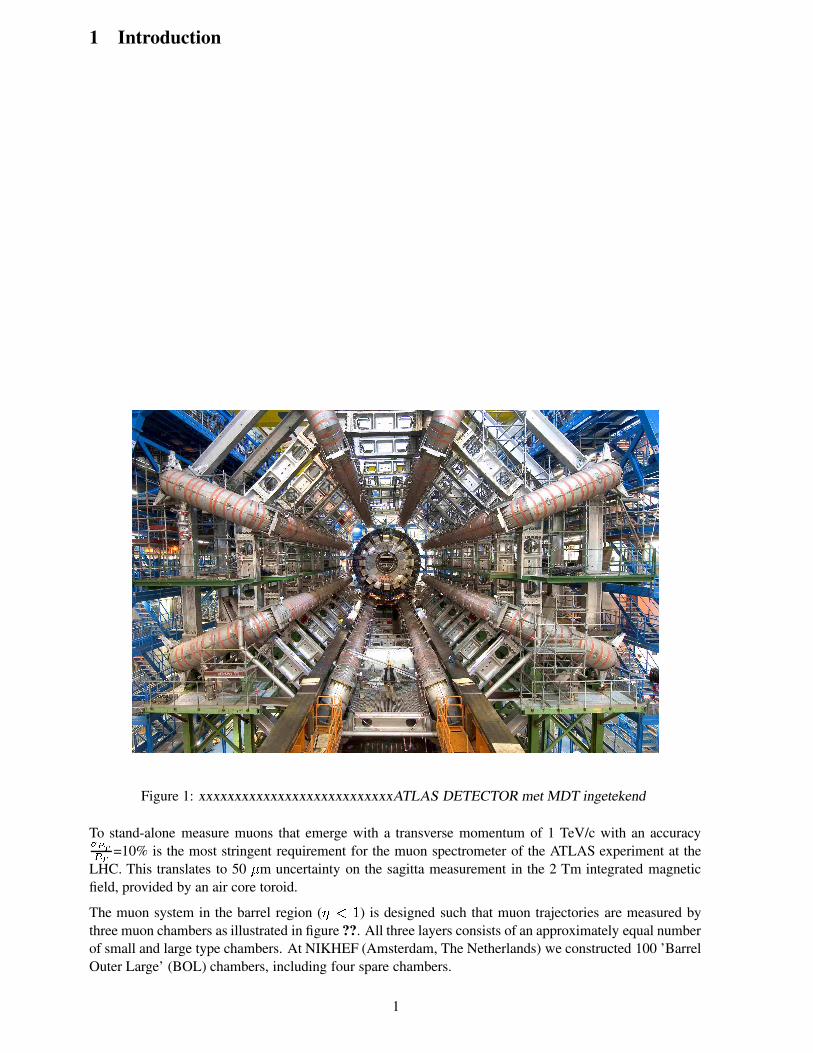
Figure 1: xxxxxxxxxxxxxxxxxxxxxxxxxxxATLAS DETECTOR met MDT ingetekend
To stand-alone measure muons that emerge with a transverse momentum of 1 TeV/c with an accuracy������ � =10% is the most stringent requirement for the muon spectrometer of the ATLAS experiment at theLHC. This translates to 50 � m uncertainty on the sagitta measurement in the 2 Tm integrated magneticfield, provided by an air core toroid.
The muon system in the barrel region ( � � ) is designed such that muon trajectories are measured bythree muon chambers as illustrated in figure ??. All three layers consists of an approximately equal numberof small and large type chambers. At NIKHEF (Amsterdam, The Netherlands) we constructed 100 ’BarrelOuter Large’ (BOL) chambers, including four spare chambers.
1
Figure 2: xxxxxxxxxxxxxxxxxxxxxxxxxxxMDT principle
Muons chambers consist of accurately assembled layers of alumnium drift tubes. A drift tube has a di-ameter close to 3 cm and is closed by two end-plugs that hold a 50 � m thick tungsten wire. Underoperational conditions, the tube is filled with an Ar/CO � mixture of 93%/7% and the wire is set a potentialof 3xxxxxx V with repect to the grounded tube wall. When a muon traverses the tube, it ionises the gas andthe free electrons drift to the wire, generating a signal. The Read-Out electronics measure the arrival timeof the signal above an adjustable threshold as shown in figure ??. The arrival time, containing the actualdrift time information, is offline used to determine the drift radius based on a known relation between drifttime and radius. Earlier tests show that the drift tubes under well-controlled conditions have single hitresolution of about 80 � m (averaged over drift distance), see [?]. The muon chambers in ATLAS haveeach at least ����� drift tube layers, providing sufficient drift radii to recognize and reconstruct a tracksegment with high accuracy.
The BOL muon chambers consists of two separate layers (multi-layers), each with three drift tube layers,mounted on an aluminium support structure (spacer) as shown in figure 3. Physical deformations of thechambers during construction, transport and operation are monitored 1 with an integrated, so called ’in-plane’, alignment system also indicated in figure 3.
The combination of the uncertainties on single hit resolution, alignment and mechanical precision of thechambers should not exceed 50 � m to meet the aforementioned accuracy on the sagitta measurement.
1For this reason the ATLAS muon chamber are called Monitored Drift Tube (MDT) chambers
2
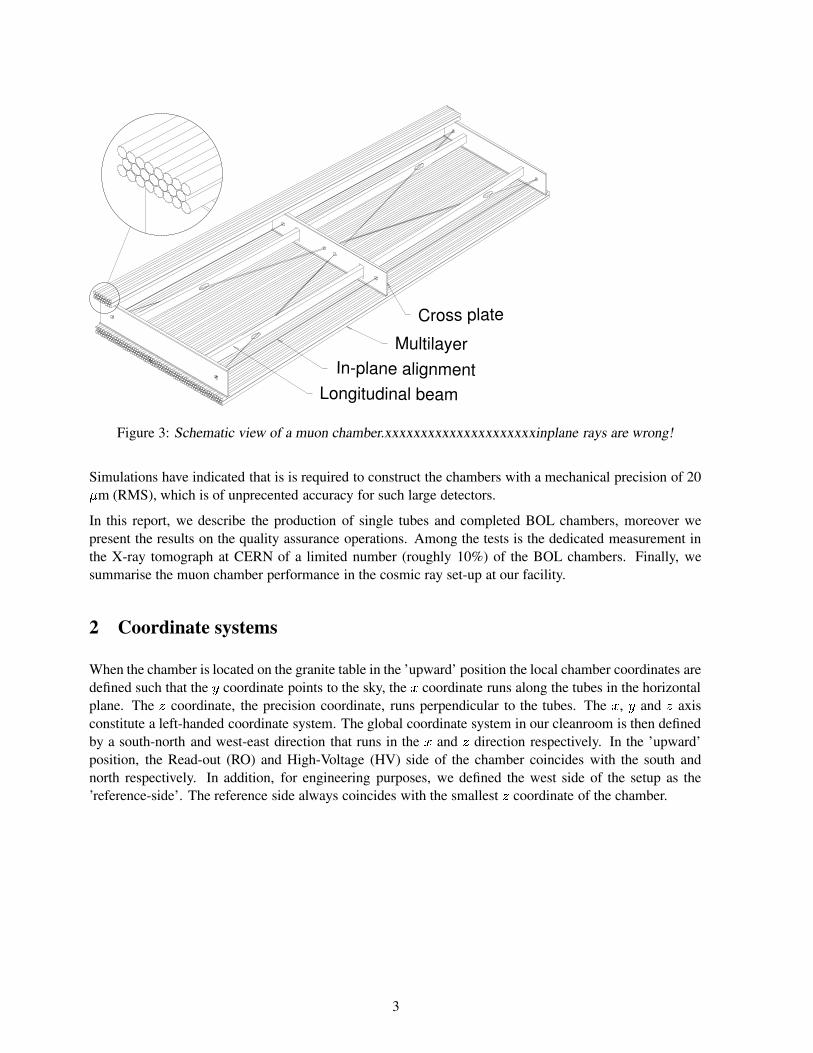
Longitudinal beam
In-plane alignment
Multilayer
Cross plate
Figure 3: Schematic view of a muon chamber.xxxxxxxxxxxxxxxxxxxxxinplane rays are wrong!
Simulations have indicated that is is required to construct the chambers with a mechanical precision of 20� m (RMS), which is of unprecented accuracy for such large detectors.
In this report, we describe the production of single tubes and completed BOL chambers, moreover wepresent the results on the quality assurance operations. Among the tests is the dedicated measurement inthe X-ray tomograph at CERN of a limited number (roughly 10%) of the BOL chambers. Finally, wesummarise the muon chamber performance in the cosmic ray set-up at our facility.
2 Coordinate systems
When the chamber is located on the granite table in the ’upward’ position the local chamber coordinates aredefined such that the � coordinate points to the sky, the � coordinate runs along the tubes in the horizontalplane. The � coordinate, the precision coordinate, runs perpendicular to the tubes. The � , � and � axisconstitute a left-handed coordinate system. The global coordinate system in our cleanroom is then definedby a south-north and west-east direction that runs in the � and � direction respectively. In the ’upward’position, the Read-out (RO) and High-Voltage (HV) side of the chamber coincides with the south andnorth respectively. In addition, for engineering purposes, we defined the west side of the setup as the’reference-side’. The reference side always coincides with the smallest � coordinate of the chamber.
3
3 Drift tubes
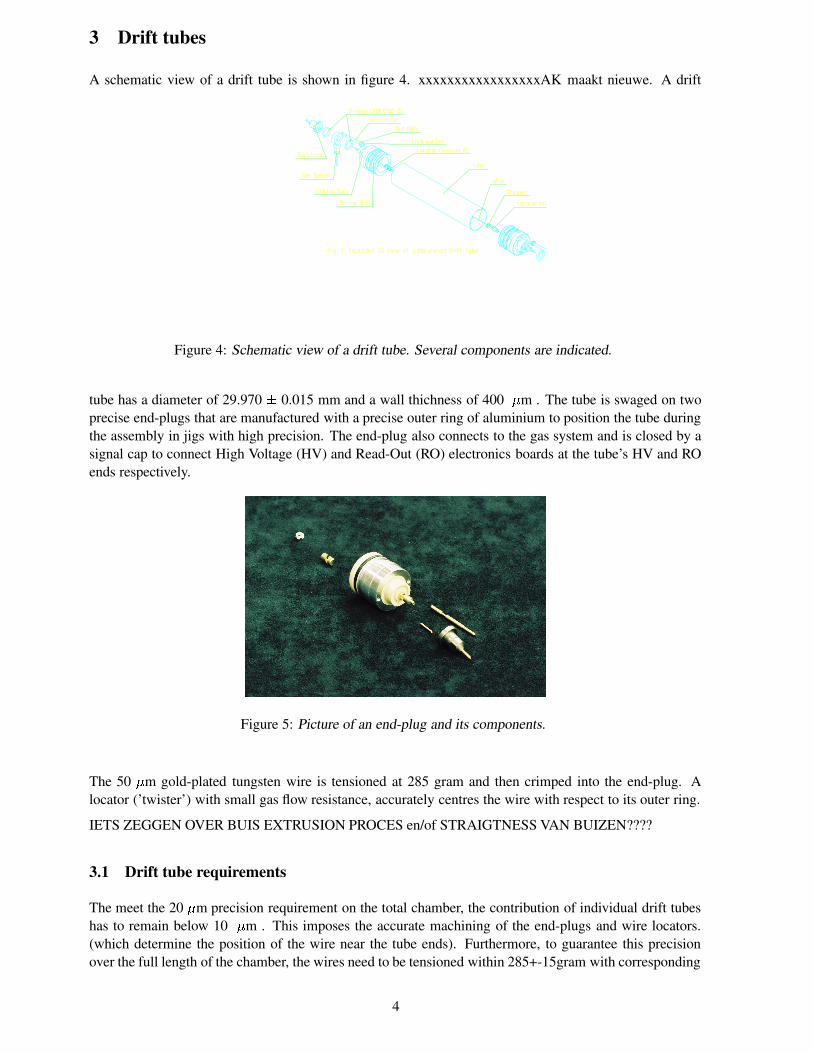
A schematic view of a drift tube is shown in figure 4. xxxxxxxxxxxxxxxxxAK maakt nieuwe. A drift
Figure 4: Schematic view of a drift tube. Several components are indicated.
tube has a diameter of 29.970 � 0.015 mm and a wall thichness of 400 � m . The tube is swaged on twoprecise end-plugs that are manufactured with a precise outer ring of aluminium to position the tube duringthe assembly in jigs with high precision. The end-plug also connects to the gas system and is closed by asignal cap to connect High Voltage (HV) and Read-Out (RO) electronics boards at the tube’s HV and ROends respectively.
Figure 5: Picture of an end-plug and its components.
The 50 � m gold-plated tungsten wire is tensioned at 285 gram and then crimped into the end-plug. Alocator (’twister’) with small gas flow resistance, accurately centres the wire with respect to its outer ring.
IETS ZEGGEN OVER BUIS EXTRUSION PROCES en/of STRAIGTNESS VAN BUIZEN????
3.1 Drift tube requirements
The meet the 20 � m precision requirement on the total chamber, the contribution of individual drift tubeshas to remain below 10 � m . This imposes the accurate machining of the end-plugs and wire locators.(which determine the position of the wire near the tube ends). Furthermore, to guarantee this precisionover the full length of the chamber, the wires need to be tensioned within 285+-15gram with corresponding
4
gravitational sag of 406+-22um. The requirement on the co-centricity of the wire due to non-straightnessof the drift tube (anode-cathode distance) is a second order effect and set at 100 � m RMS.
Other than the mechanical precision we impose:
� the dark current of individual drift tubes shall not exceed 10nA at 3300V at 3bar absolute pressurewith an Ar/CO � (93%/7%) gas mixture (gas gain ��������� ),
� the leak rate under these conditions must be less than ����� � bl/s.
These requirements ensure long term stable operation in the ATLAS experiment.
3.2 Drift tube production
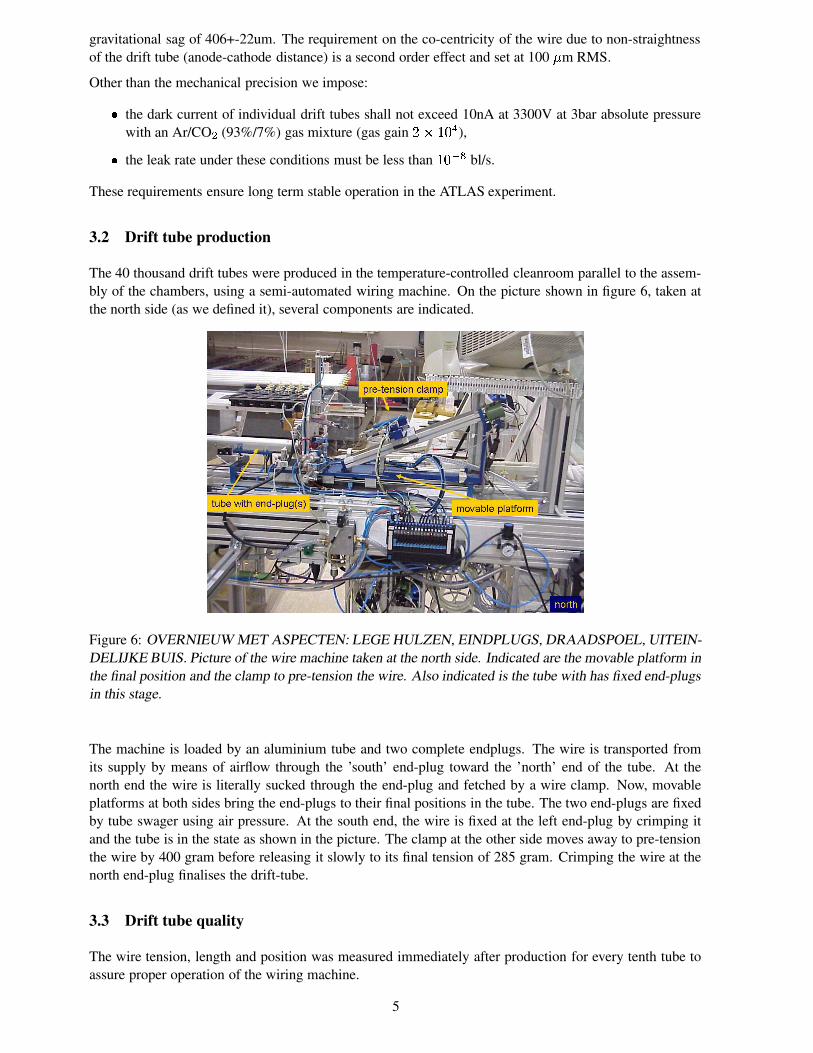
The 40 thousand drift tubes were produced in the temperature-controlled cleanroom parallel to the assem-bly of the chambers, using a semi-automated wiring machine. On the picture shown in figure 6, taken atthe north side (as we defined it), several components are indicated.
Figure 6: OVERNIEUW MET ASPECTEN: LEGE HULZEN, EINDPLUGS, DRAADSPOEL, UITEIN-DELIJKE BUIS. Picture of the wire machine taken at the north side. Indicated are the movable platform inthe final position and the clamp to pre-tension the wire. Also indicated is the tube with has fixed end-plugsin this stage.
The machine is loaded by an aluminium tube and two complete endplugs. The wire is transported fromits supply by means of airflow through the ’south’ end-plug toward the ’north’ end of the tube. At thenorth end the wire is literally sucked through the end-plug and fetched by a wire clamp. Now, movableplatforms at both sides bring the end-plugs to their final positions in the tube. The two end-plugs are fixedby tube swager using air pressure. At the south end, the wire is fixed at the left end-plug by crimping itand the tube is in the state as shown in the picture. The clamp at the other side moves away to pre-tensionthe wire by 400 gram before releasing it slowly to its final tension of 285 gram. Crimping the wire at thenorth end-plug finalises the drift-tube.
3.3 Drift tube quality
The wire tension, length and position was measured immediately after production for every tenth tube toassure proper operation of the wiring machine.
5
The tension is derived from the measurement of the fundamental harmonic resonance. This measurementis als used in [?] and it is based on the induced response to a sinusoidal current while the tube is partiallyimmersed in a magnetic field.
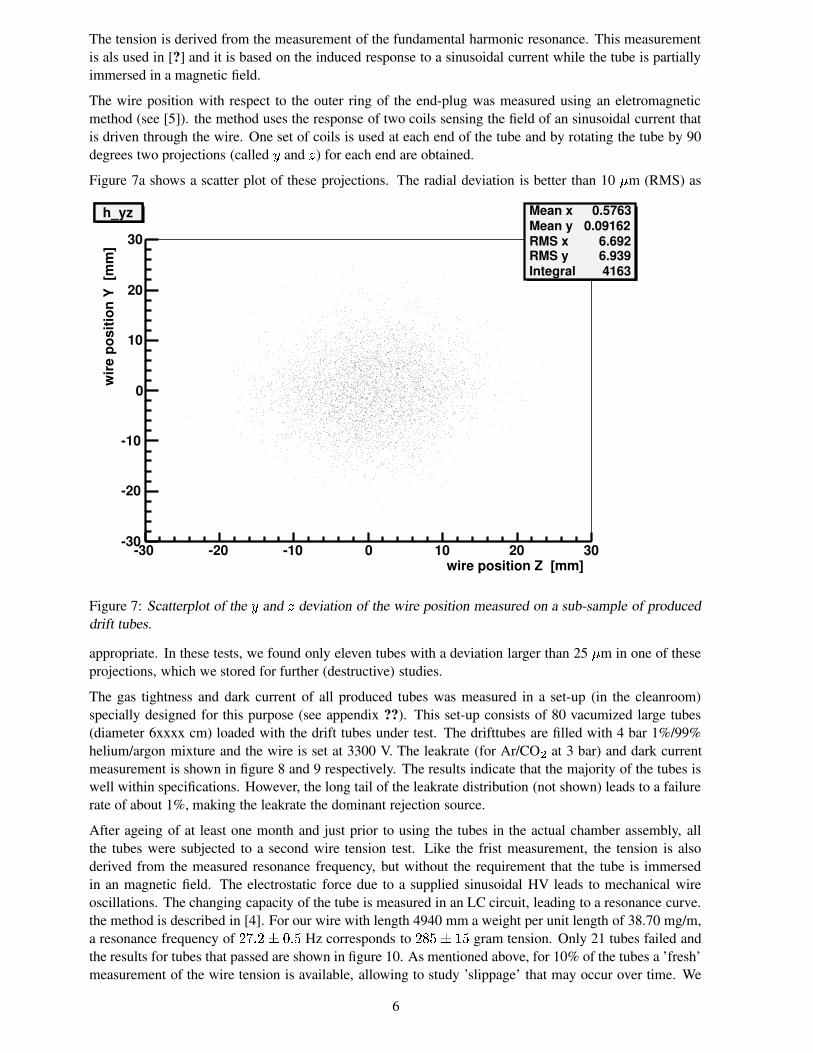
The wire position with respect to the outer ring of the end-plug was measured using an eletromagneticmethod (see [5]). the method uses the response of two coils sensing the field of an sinusoidal current thatis driven through the wire. One set of coils is used at each end of the tube and by rotating the tube by 90degrees two projections (called � and � ) for each end are obtained.
Figure 7a shows a scatter plot of these projections. The radial deviation is better than 10 � m (RMS) as
wire position Z [mm]-30 -20 -10 0 10 20 30
wir
e po
sitio
n Y
[m
m]
-30
-20
-10
0
10
20
30
h_yz Mean x 0.5763Mean y 0.09162RMS x 6.692RMS y 6.939Integral 4163
h_yz
Figure 7: Scatterplot of the � and � deviation of the wire position measured on a sub-sample of produceddrift tubes.
appropriate. In these tests, we found only eleven tubes with a deviation larger than 25 � m in one of theseprojections, which we stored for further (destructive) studies.
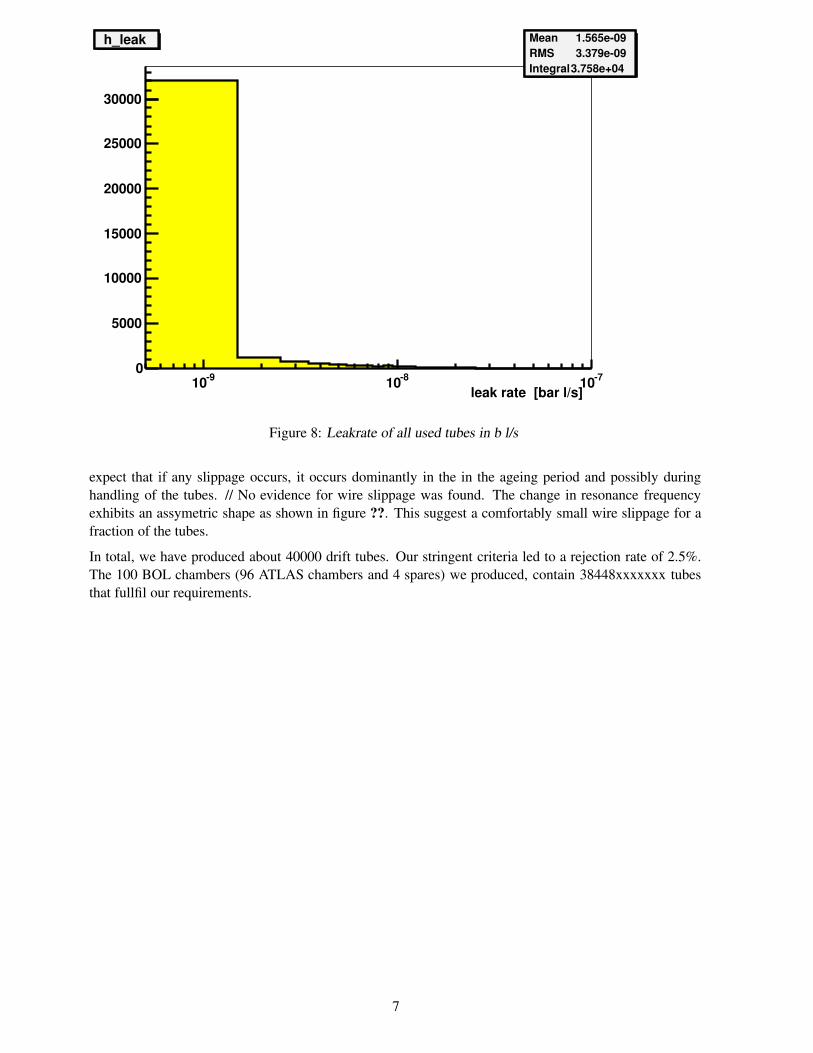
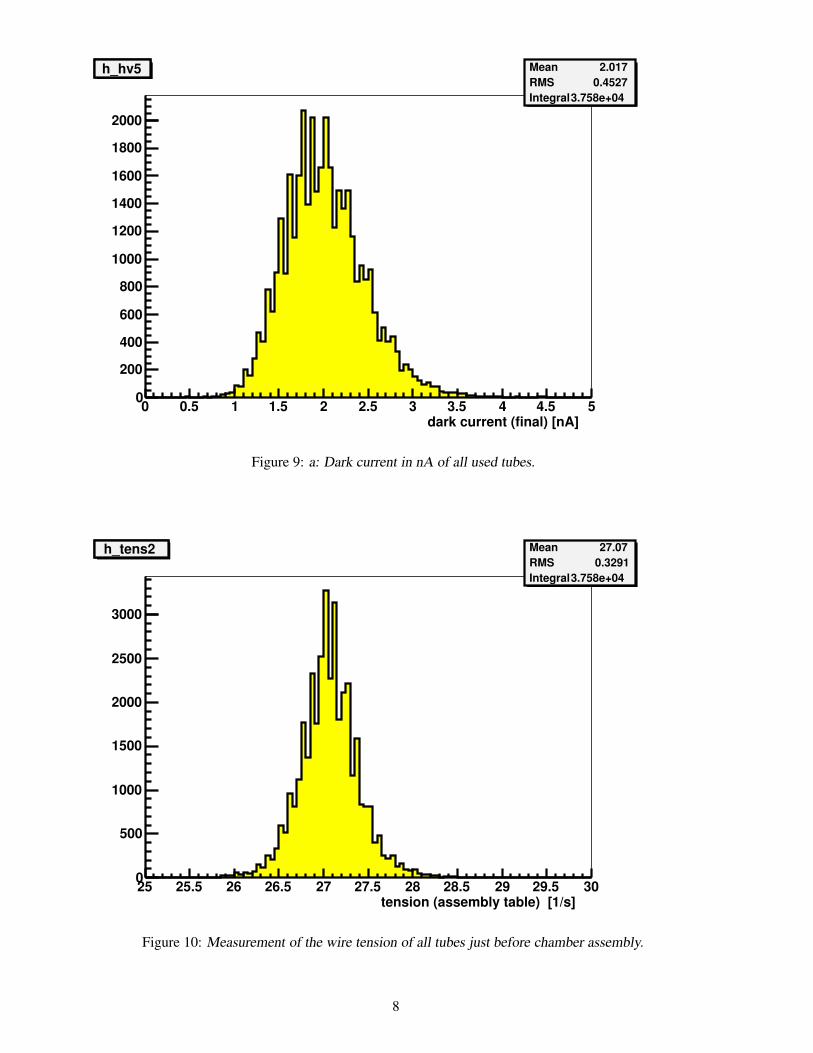
The gas tightness and dark current of all produced tubes was measured in a set-up (in the cleanroom)specially designed for this purpose (see appendix ??). This set-up consists of 80 vacumized large tubes(diameter 6xxxx cm) loaded with the drift tubes under test. The drifttubes are filled with 4 bar 1%/99%helium/argon mixture and the wire is set at 3300 V. The leakrate (for Ar/CO � at 3 bar) and dark currentmeasurement is shown in figure 8 and 9 respectively. The results indicate that the majority of the tubes iswell within specifications. However, the long tail of the leakrate distribution (not shown) leads to a failurerate of about 1%, making the leakrate the dominant rejection source.
After ageing of at least one month and just prior to using the tubes in the actual chamber assembly, allthe tubes were subjected to a second wire tension test. Like the frist measurement, the tension is alsoderived from the measured resonance frequency, but without the requirement that the tube is immersedin an magnetic field. The electrostatic force due to a supplied sinusoidal HV leads to mechanical wireoscillations. The changing capacity of the tube is measured in an LC circuit, leading to a resonance curve.the method is described in [4]. For our wire with length 4940 mm a weight per unit length of 38.70 mg/m,a resonance frequency of �"!$#%�&�'�(#%) Hz corresponds to �+*+),�-��) gram tension. Only 21 tubes failed andthe results for tubes that passed are shown in figure 10. As mentioned above, for 10% of the tubes a ’fresh’measurement of the wire tension is available, allowing to study ’slippage’ that may occur over time. We
6
Mean 1.565e-09RMS 3.379e-09Integral 3.758e+04
leak rate [bar l/s]-910 -810 -710
0
5000
10000
15000
20000
25000
30000
h_leak Mean 1.565e-09RMS 3.379e-09Integral 3.758e+04
h_leak
Figure 8: Leakrate of all used tubes in b l/s
expect that if any slippage occurs, it occurs dominantly in the in the ageing period and possibly duringhandling of the tubes. // No evidence for wire slippage was found. The change in resonance frequencyexhibits an assymetric shape as shown in figure ??. This suggest a comfortably small wire slippage for afraction of the tubes.
In total, we have produced about 40000 drift tubes. Our stringent criteria led to a rejection rate of 2.5%.The 100 BOL chambers (96 ATLAS chambers and 4 spares) we produced, contain 38448xxxxxxx tubesthat fullfil our requirements.
7
dark current (final) [nA]0 0.5 1 1.5 2 2.5 3 3.5 4 4.5 5
0
200
400
600
800
1000
1200
1400
1600
1800
2000
h_hv5 Mean 2.017RMS 0.4527Integral 3.758e+04
h_hv5
Figure 9: a: Dark current in nA of all used tubes.
tension (assembly table) [1/s]25 25.5 26 26.5 27 27.5 28 28.5 29 29.5 300
500
1000
1500
2000
2500
3000
h_tens2 Mean 27.07RMS 0.3291Integral 3.758e+04
h_tens2
Figure 10: Measurement of the wire tension of all tubes just before chamber assembly.
8
tension change [1/s]-0.3 -0.2 -0.1 0 0.1 0.2 0.30
50
100
150
200
250
300
h_dtens Mean -0.00675RMS 0.04995Integral 2171
h_dtens
Figure 11: Measurement of the change in wire tension between production of the tube and chamber as-sembly.
9
4 Drift tube chambers
Above we already showed in figure 3 the mechanical layout of a BOL chamber. The aimed mechanicalprecision of 20 � m RMS is implemented as follows. Any transverse cross section of any chamber can berepresented by a single wire grid. The individual wires of a particular chamber are mapped on this gridwith residuals distributed within 20 � m RMS. Note that this precision applies to the wires, while the tubeshave a looser position requirement of 100 � m RMS (with respect to the wire).
The BOL chambers have a length of 5 m and come in three different widths: 2160 mm (72 tubes/layer),1680 mm (56 tubes/layer) and 1440 mm (48 tubes/layer), all with two multilayers with 3 tube layers oneach side of the spacer. The spacer is constructed of three ’I’ beams, called cross-plates, running orthogonal
Figure 12: stacking drawing+gluing
to the tubes. The cross-plates have low mechanical precision (0.5 mm) and the glue (3M xxxxxxxxx),which connects to the mulilayers, absorbs possible irregularities. The crossplates are themselves connectedby two beams, that run longitudinal (which are therefore called long-beams). The horizontal position ofthe central cross-plate with respect to the long-beams is adjustable to compensate for gravitaional sag ofthe chamber. For the in-plane alignment system, two camera’s and four masks are mounted on the ROand HV crossplate respectively and the central crossplate houses four lenses. With two parallel and twodiagonal light rays several deformations of the spacer and thus chamber can be monitored; most notablythe sag and torque of the chamber. The torque is a relative rotation of the two outer cross-plates. A totalof 10 temperature sensors are mounted on the crossplates to monitor temperature gradients.
Tubes of the same layer lie in the same plane. The tubes of an adjacent layer is shifted by 15 mm (the halfof the tube’s width) and stacked as illustrated in figure 12. Tubes of the same layer are grouped in series ofthree (tripplets) to reduce the number of gas connections to the onchamber manifold. Only the first and lasttube in the tripplet connects to the manifold at the RO side and HV side respectively, while the tubes areconnected with plasticxxxxx gas jumpers as shown in figure ??. During assembly the length differences ofthe tubes are absorbed by using jumpers of appropriate thickness (in steps of 100 � m , maximal 300 � m ).
The mounting of electronic boards, equipped with xxxxconnections, is carefully prepared by fixing therotation of the tubes such that the ground pins finally lie in line within 0.5 mm. In the next chapter we
10
elaborate on the on-chamber services.
Practically, the position requiment of 20 � m on the wires implies that the drift tubes should be accuratelyassembled into a chamber near the endplugs at the outer cross-plates. The straihgtness of the tubes inbetween the endplug is of less importance. Therefore, we aimed to set-up an assembly stand based on agranite table with precision mechanics, such as jigs to hold the drift tubes, machined with a precision of 10� m or better. During assembly, the position of the spacer and individual tubes near the outer cross-platesneed to be monitored to the same level. Below we describe the assembly station and the adopted procedureto routinely produce 100 BOL chambers at NIKHEF.
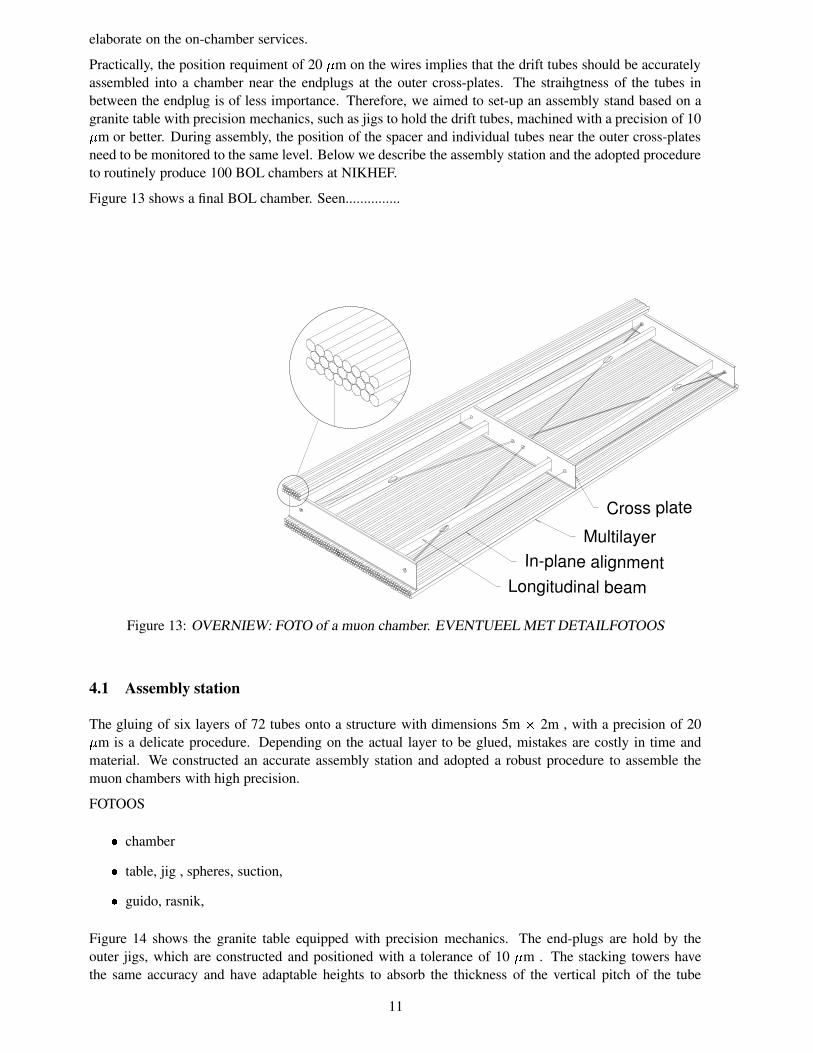
Figure 13 shows a final BOL chamber. Seen...............
Longitudinal beam
In-plane alignment
Multilayer
Cross plate
Figure 13: OVERNIEW: FOTO of a muon chamber. EVENTUEEL MET DETAILFOTOOS
4.1 Assembly station
The gluing of six layers of 72 tubes onto a structure with dimensions 5m � 2m , with a precision of 20� m is a delicate procedure. Depending on the actual layer to be glued, mistakes are costly in time andmaterial. We constructed an accurate assembly station and adopted a robust procedure to assemble themuon chambers with high precision.
FOTOOS
� chamber
� table, jig , spheres, suction,
� guido, rasnik,
Figure 14 shows the granite table equipped with precision mechanics. The end-plugs are hold by theouter jigs, which are constructed and positioned with a tolerance of 10 � m . The stacking towers havethe same accuracy and have adaptable heights to absorb the thickness of the vertical pitch of the tube
11
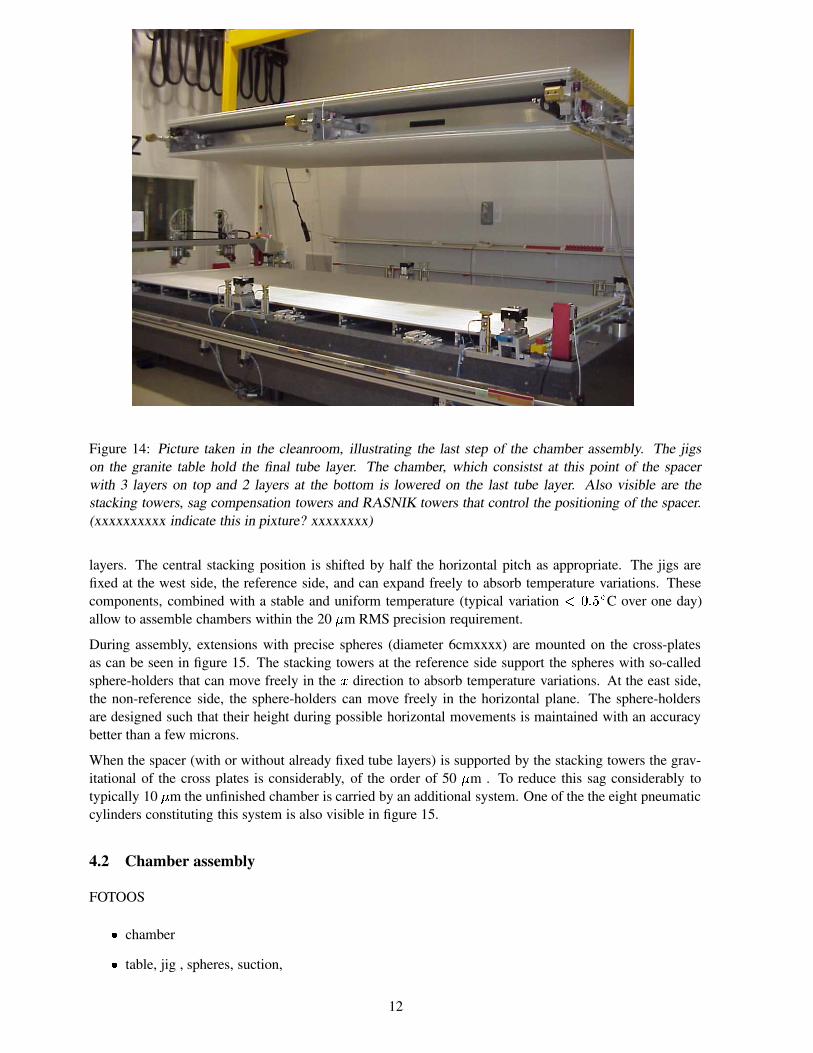
Figure 14: Picture taken in the cleanroom, illustrating the last step of the chamber assembly. The jigson the granite table hold the final tube layer. The chamber, which consistst at this point of the spacerwith 3 layers on top and 2 layers at the bottom is lowered on the last tube layer. Also visible are thestacking towers, sag compensation towers and RASNIK towers that control the positioning of the spacer.(xxxxxxxxxx indicate this in pixture? xxxxxxxx)
layers. The central stacking position is shifted by half the horizontal pitch as appropriate. The jigs arefixed at the west side, the reference side, and can expand freely to absorb temperature variations. Thesecomponents, combined with a stable and uniform temperature (typical variation .�(#%) / C over one day)allow to assemble chambers within the 20 � m RMS precision requirement.
During assembly, extensions with precise spheres (diameter 6cmxxxx) are mounted on the cross-platesas can be seen in figure 15. The stacking towers at the reference side support the spheres with so-calledsphere-holders that can move freely in the � direction to absorb temperature variations. At the east side,the non-reference side, the sphere-holders can move freely in the horizontal plane. The sphere-holdersare designed such that their height during possible horizontal movements is maintained with an accuracybetter than a few microns.
When the spacer (with or without already fixed tube layers) is supported by the stacking towers the grav-itational of the cross plates is considerably, of the order of 50 � m . To reduce this sag considerably totypically 10 � m the unfinished chamber is carried by an additional system. One of the the eight pneumaticcylinders constituting this system is also visible in figure 15.
4.2 Chamber assembly
FOTOOS
� chamber
� table, jig , spheres, suction,
12
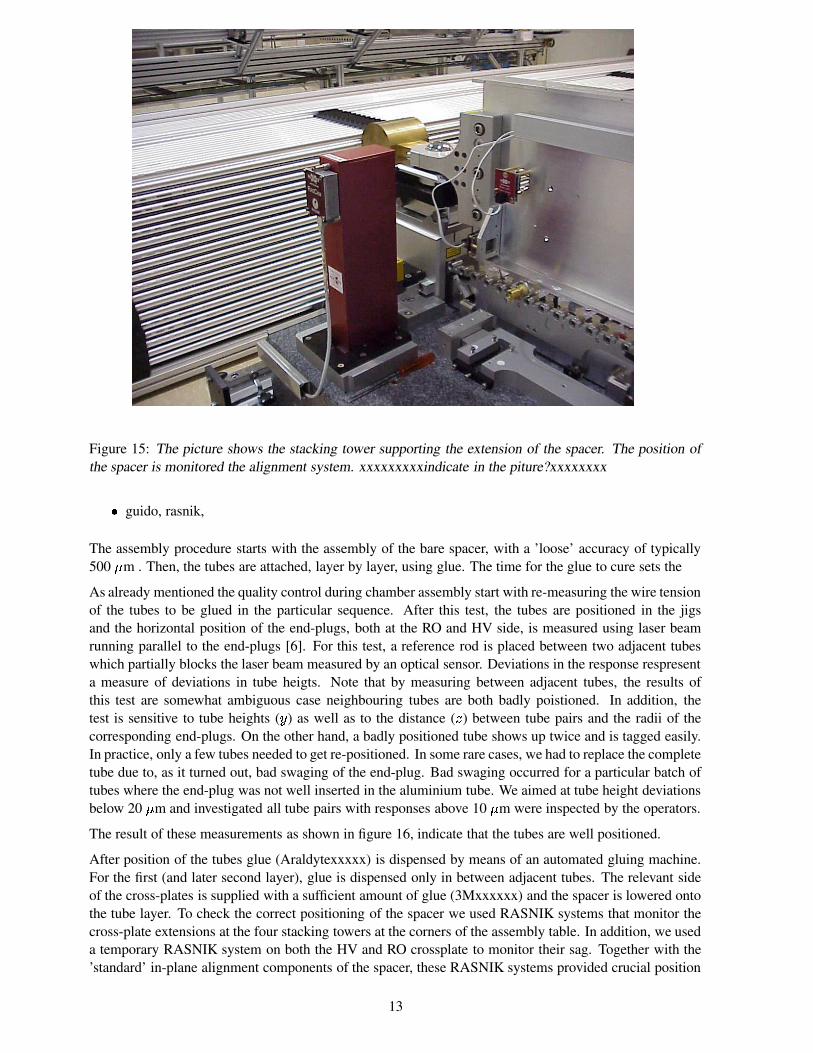
Figure 15: The picture shows the stacking tower supporting the extension of the spacer. The position ofthe spacer is monitored the alignment system. xxxxxxxxxindicate in the piture?xxxxxxxx
� guido, rasnik,
The assembly procedure starts with the assembly of the bare spacer, with a ’loose’ accuracy of typically500 � m . Then, the tubes are attached, layer by layer, using glue. The time for the glue to cure sets the
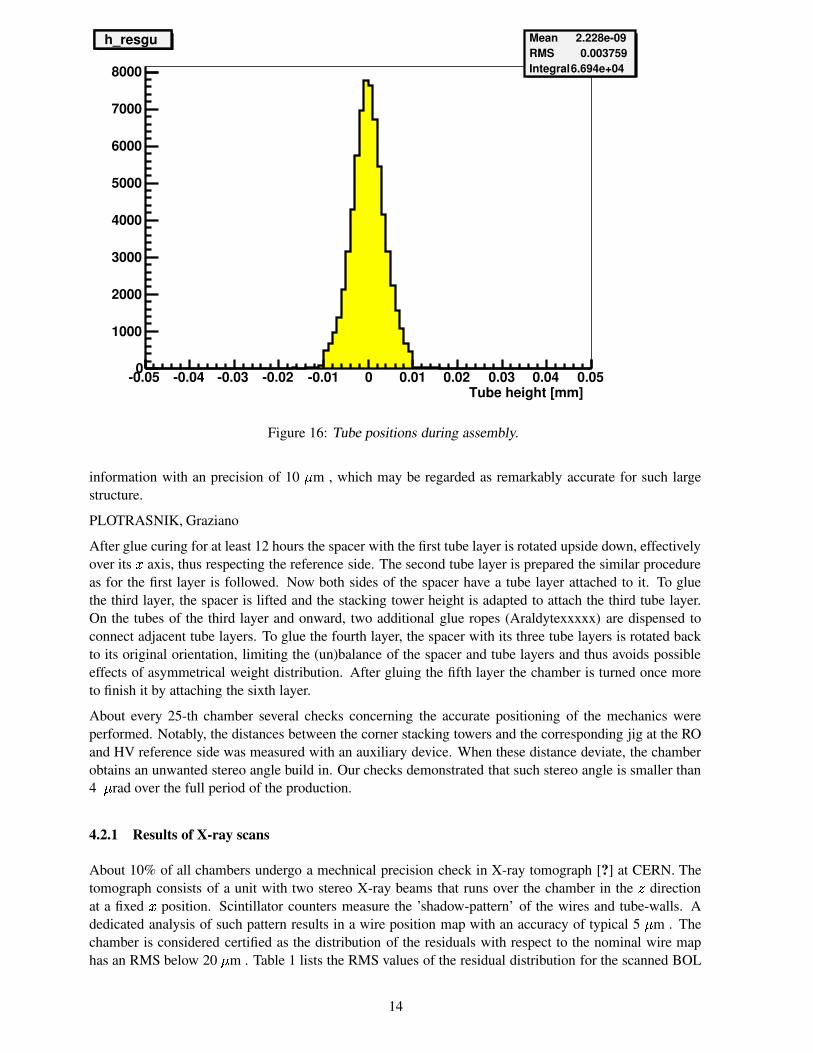
As already mentioned the quality control during chamber assembly start with re-measuring the wire tensionof the tubes to be glued in the particular sequence. After this test, the tubes are positioned in the jigsand the horizontal position of the end-plugs, both at the RO and HV side, is measured using laser beamrunning parallel to the end-plugs [6]. For this test, a reference rod is placed between two adjacent tubeswhich partially blocks the laser beam measured by an optical sensor. Deviations in the response respresenta measure of deviations in tube heigts. Note that by measuring between adjacent tubes, the results ofthis test are somewhat ambiguous case neighbouring tubes are both badly poistioned. In addition, thetest is sensitive to tube heights ( � ) as well as to the distance ( � ) between tube pairs and the radii of thecorresponding end-plugs. On the other hand, a badly positioned tube shows up twice and is tagged easily.In practice, only a few tubes needed to get re-positioned. In some rare cases, we had to replace the completetube due to, as it turned out, bad swaging of the end-plug. Bad swaging occurred for a particular batch oftubes where the end-plug was not well inserted in the aluminium tube. We aimed at tube height deviationsbelow 20 � m and investigated all tube pairs with responses above 10 � m were inspected by the operators.
The result of these measurements as shown in figure 16, indicate that the tubes are well positioned.
After position of the tubes glue (Araldytexxxxx) is dispensed by means of an automated gluing machine.For the first (and later second layer), glue is dispensed only in between adjacent tubes. The relevant sideof the cross-plates is supplied with a sufficient amount of glue (3Mxxxxxx) and the spacer is lowered ontothe tube layer. To check the correct positioning of the spacer we used RASNIK systems that monitor thecross-plate extensions at the four stacking towers at the corners of the assembly table. In addition, we useda temporary RASNIK system on both the HV and RO crossplate to monitor their sag. Together with the’standard’ in-plane alignment components of the spacer, these RASNIK systems provided crucial position
13
Tube height [mm]-0.05 -0.04 -0.03 -0.02 -0.01 0 0.01 0.02 0.03 0.04 0.050
1000
2000
3000
4000
5000
6000
7000
8000
h_resgu Mean 2.228e-09RMS 0.003759Integral 6.694e+04
h_resgu
Figure 16: Tube positions during assembly.
information with an precision of 10 � m , which may be regarded as remarkably accurate for such largestructure.
PLOTRASNIK, Graziano
After glue curing for at least 12 hours the spacer with the first tube layer is rotated upside down, effectivelyover its � axis, thus respecting the reference side. The second tube layer is prepared the similar procedureas for the first layer is followed. Now both sides of the spacer have a tube layer attached to it. To gluethe third layer, the spacer is lifted and the stacking tower height is adapted to attach the third tube layer.On the tubes of the third layer and onward, two additional glue ropes (Araldytexxxxx) are dispensed toconnect adjacent tube layers. To glue the fourth layer, the spacer with its three tube layers is rotated backto its original orientation, limiting the (un)balance of the spacer and tube layers and thus avoids possibleeffects of asymmetrical weight distribution. After gluing the fifth layer the chamber is turned once moreto finish it by attaching the sixth layer.
About every 25-th chamber several checks concerning the accurate positioning of the mechanics wereperformed. Notably, the distances between the corner stacking towers and the corresponding jig at the ROand HV reference side was measured with an auxiliary device. When these distance deviate, the chamberobtains an unwanted stereo angle build in. Our checks demonstrated that such stereo angle is smaller than4 � rad over the full period of the production.
4.2.1 Results of X-ray scans
About 10% of all chambers undergo a mechnical precision check in X-ray tomograph [?] at CERN. Thetomograph consists of a unit with two stereo X-ray beams that runs over the chamber in the � directionat a fixed � position. Scintillator counters measure the ’shadow-pattern’ of the wires and tube-walls. Adedicated analysis of such pattern results in a wire position map with an accuracy of typical 5 � m . Thechamber is considered certified as the distribution of the residuals with respect to the nominal wire maphas an RMS below 20 � m . Table 1 lists the RMS values of the residual distribution for the scanned BOL
14
chambers. The numbers indicate that these chamber are assembled according to the specifications.
RMS z � m RMS y � m RMS combinedBOL 2 1000 0000 0BOL 3 1000 0000 0
Table 1: The table list for each scanned BOL chamber the residuals of the wire coordiantes obtained in theX-ray tomograph. The numbers of the BOL chambers refer to their serial production number.
In figure. 17 we compare the layer Z-pitch deviations obtained by the X-ray tomograph with those derivedfrom the RASNIK monitoring at the time the layers were glued. The RASNIK deviations are shifted toset their average deviation to zero as appropriate for this comparison. The distribution of the differencesof the two measurements has an RMS of 6 � m , indicating that the quality control during the assembly iswell understood.
15
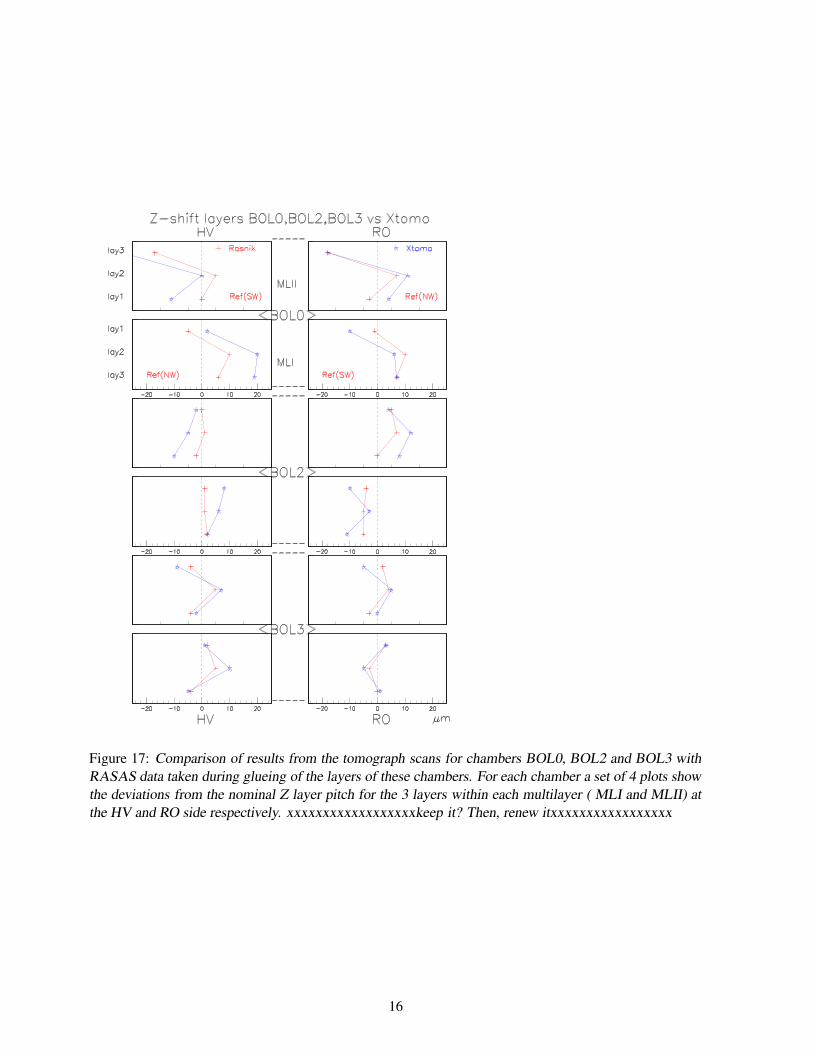
Figure 17: Comparison of results from the tomograph scans for chambers BOL0, BOL2 and BOL3 withRASAS data taken during glueing of the layers of these chambers. For each chamber a set of 4 plots showthe deviations from the nominal Z layer pitch for the 3 layers within each multilayer ( MLI and MLII) atthe HV and RO side respectively. xxxxxxxxxxxxxxxxxxkeep it? Then, renew itxxxxxxxxxxxxxxxxx
16
5 Chamber services
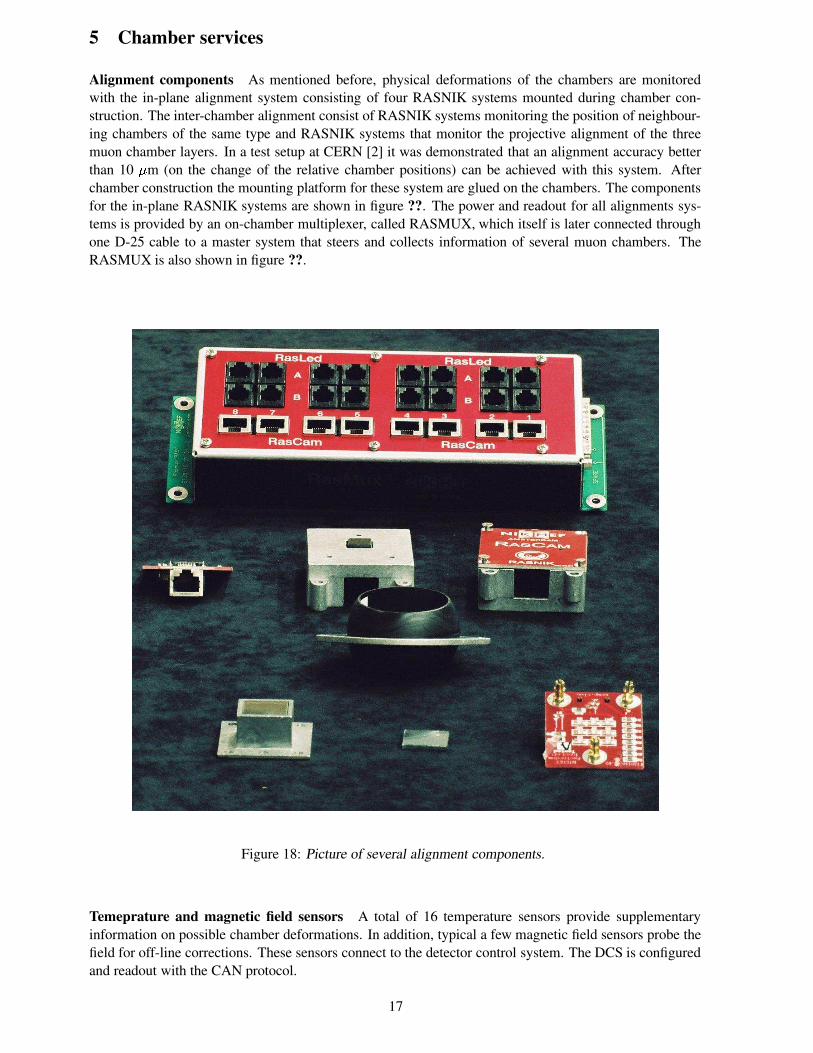
Alignment components As mentioned before, physical deformations of the chambers are monitoredwith the in-plane alignment system consisting of four RASNIK systems mounted during chamber con-struction. The inter-chamber alignment consist of RASNIK systems monitoring the position of neighbour-ing chambers of the same type and RASNIK systems that monitor the projective alignment of the threemuon chamber layers. In a test setup at CERN [2] it was demonstrated that an alignment accuracy betterthan 10 � m (on the change of the relative chamber positions) can be achieved with this system. Afterchamber construction the mounting platform for these system are glued on the chambers. The componentsfor the in-plane RASNIK systems are shown in figure ??. The power and readout for all alignments sys-tems is provided by an on-chamber multiplexer, called RASMUX, which itself is later connected throughone D-25 cable to a master system that steers and collects information of several muon chambers. TheRASMUX is also shown in figure ??.
Figure 18: Picture of several alignment components.
Temeprature and magnetic field sensors A total of 16 temperature sensors provide supplementaryinformation on possible chamber deformations. In addition, typical a few magnetic field sensors probe thefield for off-line corrections. These sensors connect to the detector control system. The DCS is configuredand readout with the CAN protocol.
17
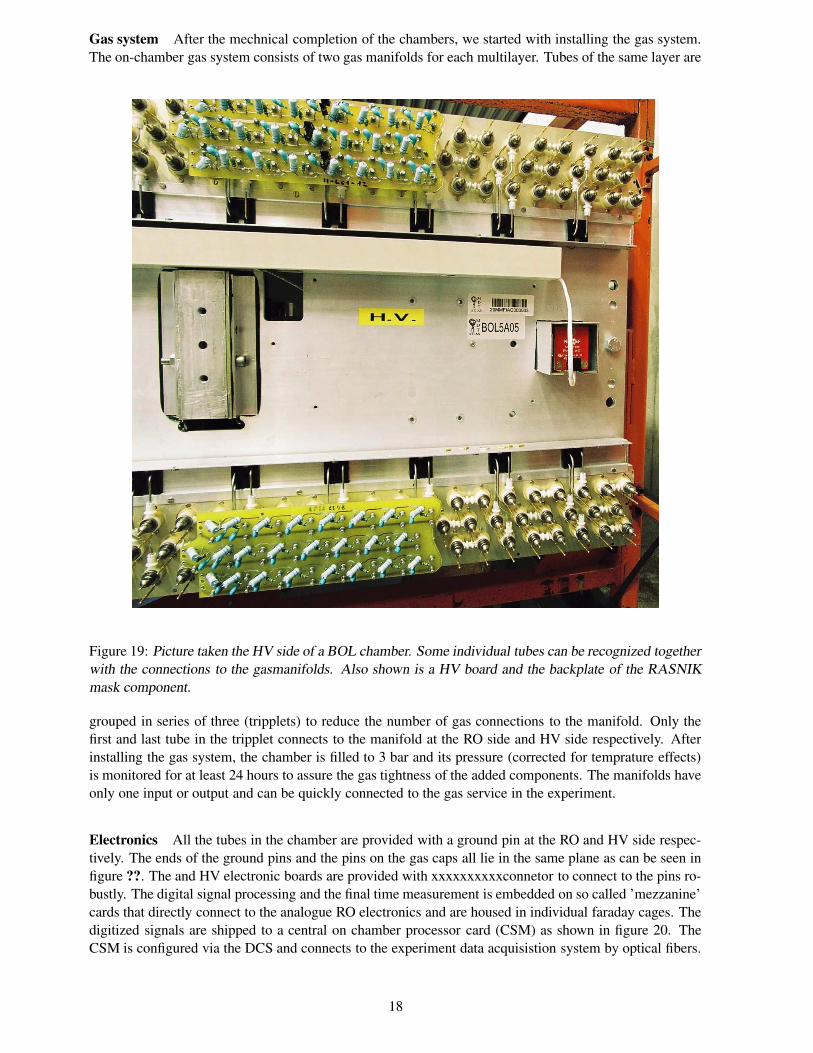
Gas system After the mechnical completion of the chambers, we started with installing the gas system.The on-chamber gas system consists of two gas manifolds for each multilayer. Tubes of the same layer are
Figure 19: Picture taken the HV side of a BOL chamber. Some individual tubes can be recognized togetherwith the connections to the gasmanifolds. Also shown is a HV board and the backplate of the RASNIKmask component.
grouped in series of three (tripplets) to reduce the number of gas connections to the manifold. Only thefirst and last tube in the tripplet connects to the manifold at the RO side and HV side respectively. Afterinstalling the gas system, the chamber is filled to 3 bar and its pressure (corrected for temprature effects)is monitored for at least 24 hours to assure the gas tightness of the added components. The manifolds haveonly one input or output and can be quickly connected to the gas service in the experiment.
Electronics All the tubes in the chamber are provided with a ground pin at the RO and HV side respec-tively. The ends of the ground pins and the pins on the gas caps all lie in the same plane as can be seen infigure ??. The and HV electronic boards are provided with xxxxxxxxxxconnetor to connect to the pins ro-bustly. The digital signal processing and the final time measurement is embedded on so called ’mezzanine’cards that directly connect to the analogue RO electronics and are housed in individual faraday cages. Thedigitized signals are shipped to a central on chamber processor card (CSM) as shown in figure 20. TheCSM is configured via the DCS and connects to the experiment data acquisistion system by optical fibers.
18
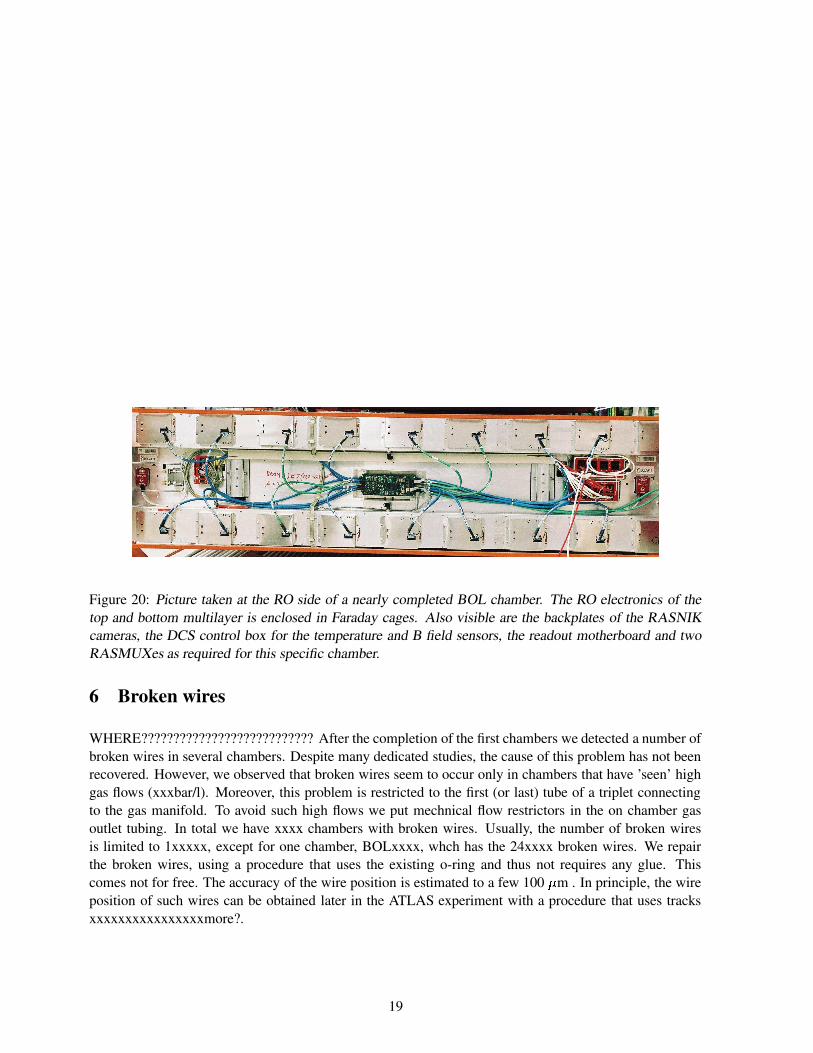
Figure 20: Picture taken at the RO side of a nearly completed BOL chamber. The RO electronics of thetop and bottom multilayer is enclosed in Faraday cages. Also visible are the backplates of the RASNIKcameras, the DCS control box for the temperature and B field sensors, the readout motherboard and twoRASMUXes as required for this specific chamber.
6 Broken wires
WHERE??????????????????????????? After the completion of the first chambers we detected a number ofbroken wires in several chambers. Despite many dedicated studies, the cause of this problem has not beenrecovered. However, we observed that broken wires seem to occur only in chambers that have ’seen’ highgas flows (xxxbar/l). Moreover, this problem is restricted to the first (or last) tube of a triplet connectingto the gas manifold. To avoid such high flows we put mechnical flow restrictors in the on chamber gasoutlet tubing. In total we have xxxx chambers with broken wires. Usually, the number of broken wiresis limited to 1xxxxx, except for one chamber, BOLxxxx, whch has the 24xxxx broken wires. We repairthe broken wires, using a procedure that uses the existing o-ring and thus not requires any glue. Thiscomes not for free. The accuracy of the wire position is estimated to a few 100 � m . In principle, the wireposition of such wires can be obtained later in the ATLAS experiment with a procedure that uses tracksxxxxxxxxxxxxxxxxmore?.
19
7 Tests of completed chambers
The main purpose of the test stand is to verify the electronic read-out of each chamber under ATLAS gas(Ar/CO � = 93%/7% at 3 bar) and HV (3300V) conditions.
7.1 Cosmic ray test stand
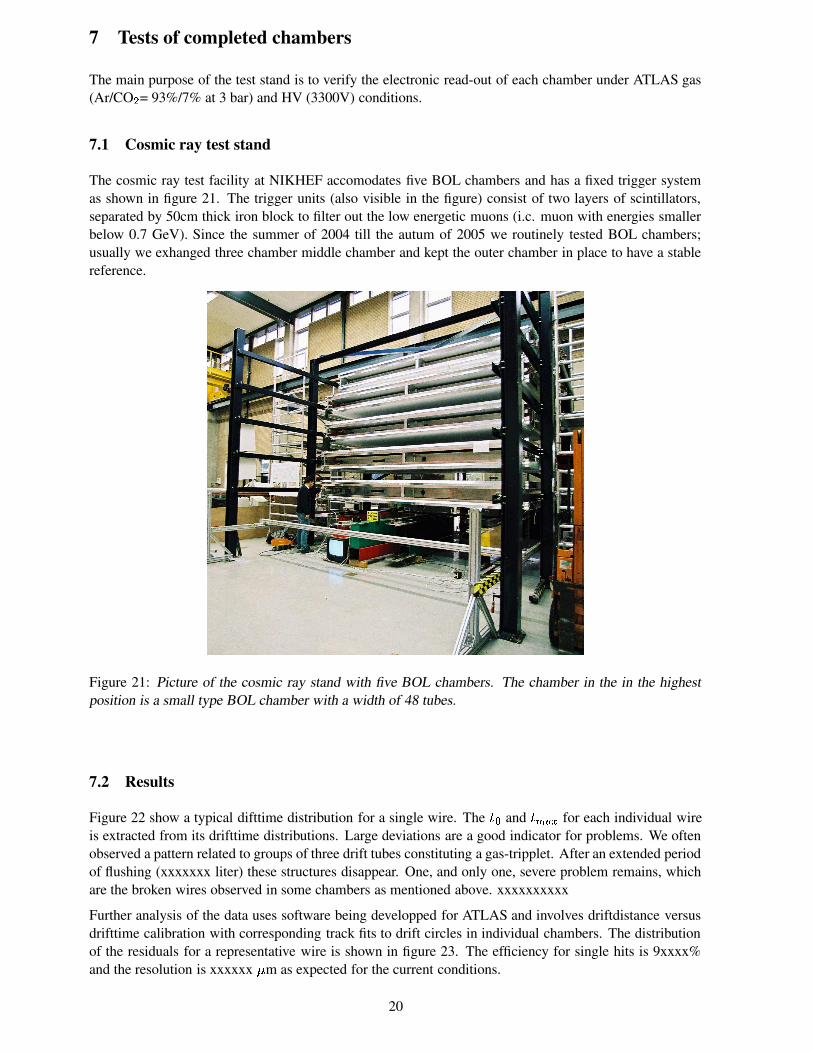
The cosmic ray test facility at NIKHEF accomodates five BOL chambers and has a fixed trigger systemas shown in figure 21. The trigger units (also visible in the figure) consist of two layers of scintillators,separated by 50cm thick iron block to filter out the low energetic muons (i.c. muon with energies smallerbelow 0.7 GeV). Since the summer of 2004 till the autum of 2005 we routinely tested BOL chambers;usually we exhanged three chamber middle chamber and kept the outer chamber in place to have a stablereference.
Figure 21: Picture of the cosmic ray stand with five BOL chambers. The chamber in the in the highestposition is a small type BOL chamber with a width of 48 tubes.
7.2 Results
Figure 22 show a typical difttime distribution for a single wire. The 021 and 0436587 for each individual wireis extracted from its drifttime distributions. Large deviations are a good indicator for problems. We oftenobserved a pattern related to groups of three drift tubes constituting a gas-tripplet. After an extended periodof flushing (xxxxxxx liter) these structures disappear. One, and only one, severe problem remains, whichare the broken wires observed in some chambers as mentioned above. xxxxxxxxxx
Further analysis of the data uses software being developped for ATLAS and involves driftdistance versusdrifttime calibration with corresponding track fits to drift circles in individual chambers. The distributionof the residuals for a representative wire is shown in figure 23. The efficiency for single hits is 9xxxx%and the resolution is xxxxxx � m as expected for the current conditions.
20
Figure 22: Drift time distribution xxxxxxxxxxxxget it, if we want itxxxxxxxxxxxxxxxx
Figure 23: Residual. xxxxxxxxxxxxget plot if we want it.xxxxxxxxxxxxxxx
ONDERWERPEN/FIGUREN:
� hit distributions
� drift properties: TMAX
� efficiencies
� tracks
� problems
� wire/layer locations (correlations XTOMO)
8 Chamber transport to CERN and instalation in ATLAS
ONDERWERPEN:
handling tools, common supports, RCP assembly
Figures:
� Trasnport frames
� Work at CERN: common support
� BOL above magnet (photo exists already)
� installed BOLs
9 Conclusions
chambers are within specs.
21
References
[1] The ATLAS MUON TDR, http://atlasinfo.cern.ch/Atlas/GROUPS/MUON/TDR/Web/TDR.html
[2] First System Performance Experience with the ATLAS High Precision Muon Drift Tube ChambersPoster presented by M. Vreeswijk at Vienna WCC 1998. Published in Nucl.Instrum.Meth.A419:336-341,1998http:atlasinfo.cern.chAtlasGROUPSMUONdatchadatcha.html
[3] M. Woudstra, PhD Thesis, to be published
[4] ELECTROSTATIC DIGITAL METHOD OF WIRE TENSION MEASUREMENT FOR KLOEDRIFT CHAMBER. A. Andryakov et al.. 1998. Prepared for 7th Pisa Meeting on Advanced De-tectors: Frontier Detectors for Frontier Physics, La Biodola, Isola d’Elba, Italy, 25-31 May 1997.Published in Nucl.Instrum.Meth.A409:63-64,1998MDT wire tension measurement using an electrostatic method, ATLAS internal note, ATL-MUON-38-264.
[5] An electromagnetic micrometer to measure wire location inside an ATLAS MDT drift tube, Cambi-aghi, M., Cardini, A., Ferrari, R., Gaudio, G., ATLAS Internal Note ATL-MUON-1998-259, 1998
. M. Cambiaghi et al., Proceedings of the 1999 IEEE Nuclear Science Symposium, IEEE Trans. Nucl.Sci. 47 (3) 2000.
[6] ATLAS Internal Note MUON-NO- 29 September 1998 A QA/QC system to monitor the planarity ofthe tube layers in MDT chambers construction G. Ciapetti, G. De Zorzi, R. Giacalone, L. Montani,D. Pinci Dipartimento di Fisica, Universit di Roma ”La Sapienza” and INFN, Sezione di Roma
[7]
[8] C. Bini et al., Nucl. Instrum. Meth. A 461 (2001) 65.
A Alignment system RASNIK
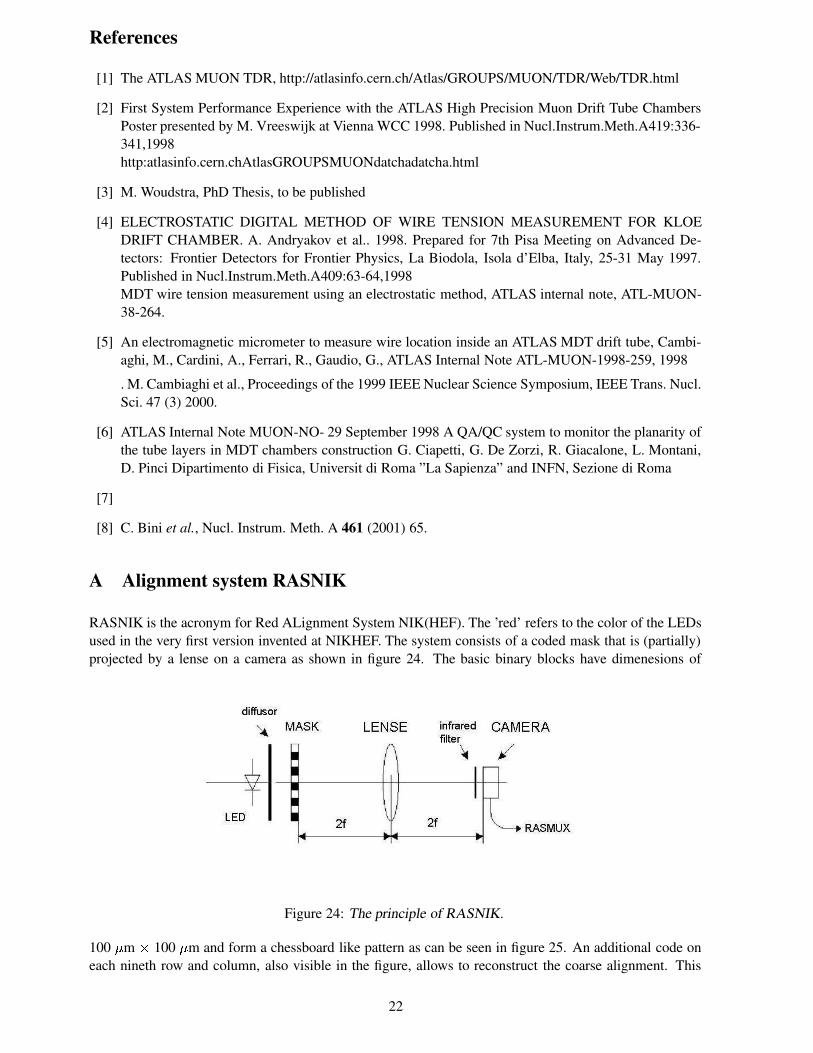
RASNIK is the acronym for Red ALignment System NIK(HEF). The ’red’ refers to the color of the LEDsused in the very first version invented at NIKHEF. The system consists of a coded mask that is (partially)projected by a lense on a camera as shown in figure 24. The basic binary blocks have dimenesions of
Figure 24: The principle of RASNIK.
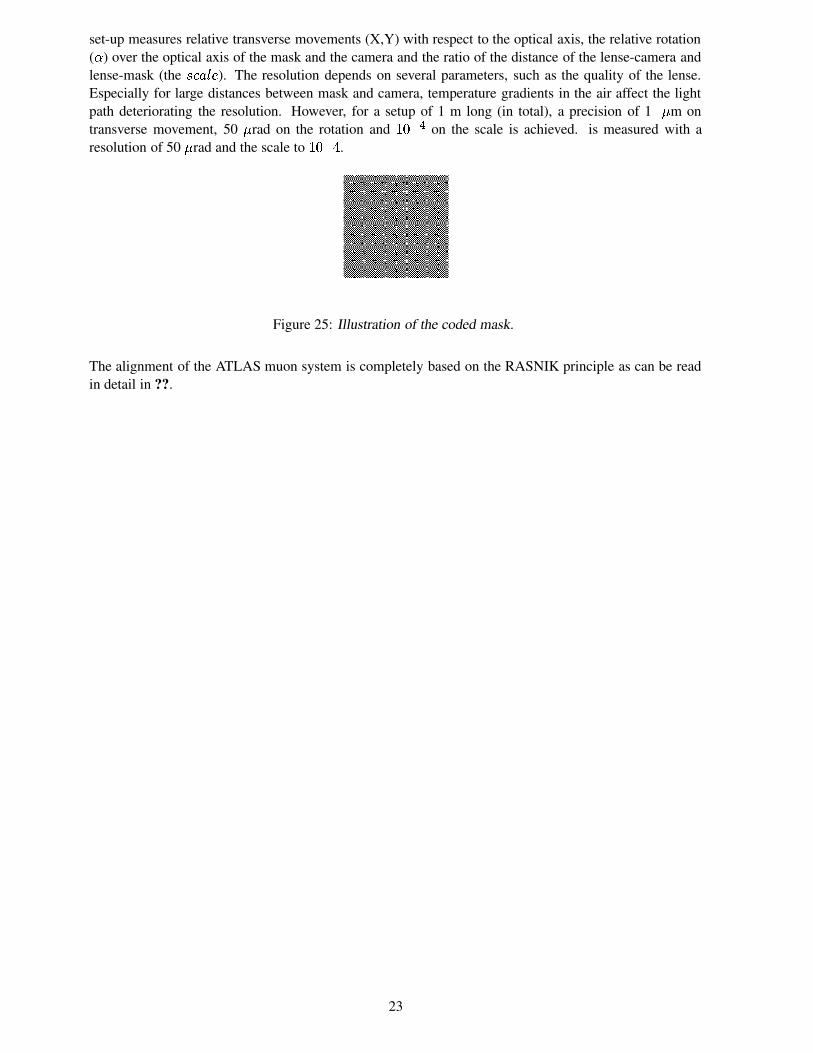
100 � m � 100 � m and form a chessboard like pattern as can be seen in figure 25. An additional code oneach nineth row and column, also visible in the figure, allows to reconstruct the coarse alignment. This
22
set-up measures relative transverse movements (X,Y) with respect to the optical axis, the relative rotation( 9 ) over the optical axis of the mask and the camera and the ratio of the distance of the lense-camera andlense-mask (the :<;�=?>A@ ). The resolution depends on several parameters, such as the quality of the lense.Especially for large distances between mask and camera, temperature gradients in the air affect the lightpath deteriorating the resolution. However, for a setup of 1 m long (in total), a precision of 1 � m ontransverse movement, 50 � rad on the rotation and ��� �B� on the scale is achieved. is measured with aresolution of 50 � rad and the scale to ���B�DC .
Figure 25: Illustration of the coded mask.
The alignment of the ATLAS muon system is completely based on the RASNIK principle as can be readin detail in ??.
23