Embed Size (px)
Citation preview

I if£?
National Hurricane Center Verification
Miles B. Lawrence
Abstract
The National Hurricane Center issues a 72-hour track and intensity forecast, every six hours, for all tropicalcyclones in the Atlantic and eastern Pacific basins. Forecasts are verified by comparison with a best-trackpost analysis of all available track and intensity data. Verification statistics for 1990 are presented.
Atlantic
1.
Tables 1.1 lists average official track errors by storm for theAtlantic for 1990 for tropical storms and hurricanes and Table 1.2compares 1990 with the averages from the previous ten years.Averages for 1990 are slightly less than the previous ten years,ranging from 02% less at the 12-hour forecast period to 14% lessat 48 hours. Table 1.3 lists the 1990 average official trackerrors for tropical depression stage and is is seen that errors fordepressions are 13% higher than for stronger systems at 12 hoursranging to only 02% to 03% higher at 48 and 72 hours.
Track errors are given in Table 1.4 for the primary guidance modelsused in 1990 and Table 1.5 lists the errors for a homogeneous setof cases for selected models. Table 1.6 also gives the homogeneousmodel comparison, but the model errors have been normalized bydividing them by the CLIPER errors. The QLM is an outstanding
~ performer at~ and 22-hours and the deep B~is also impressive.The QLM, however, is not available in time to provide guidance forthe operational forecast of the same time, but is available forthe forecast six hours later.
;?¥-
Table 1.7 lists the 1990 average errors for the official forecastof the one-minute surface wind speed. The mean errors show anegative bias at all forecast perio~s. This bias is larger thanthe previous ten-year average at the'O-hour forecast period but issmaller at all other forecast perio~ The mean absolute errors for1990 are smaller than the previous ten-year average at all forecast
periods.
Eastern Pacific2.Tables 2.1 through 2.6 list errors for the easten Pacific basin ina format similar to that of the Atlantic. The National HurricaneCenter has been issuing forecasts for the eastern Pacific since1988 and the 1990 errors, like 1988 and 1989, are smaller than theten-year average ending in 1987.
A comparison of models shows that the statistical ~ and ~DE havethe lowest errors, although CLIPER is hard to improve on, as isalways the case in the eastern Pacific where most storm tracksremain rather close to the climatological expectations. It isinteresting that the QLM and BAM did poorly, in contrast to theirAtlantic performance.
-;/~I
Finally, wind speed errors in the eastern Pacific show a negativebias at all forecast periods.

forecast period (hours)
storm a 12 24 36 48 72
13(10) 49(8)
104(6)
112(4)
133(2)
Arthur(no. of cases)
Bertha 16(22)
50
(21)90
(19)136
(17)173
(15)230
(11)
Cesar 18(18)
43
(16)72
(14)102
(12)153
(10)290
(6)
Diana 16(13)
50
(12)81
(11)127(9)
189(7)
349
(3)
Edouard 20:7) 78
(5)82
(3)20
(l)-
(0)
-(0)
Fran 33
(4)38
(2)
-(0)
-(0) (0)
Gustav 10(38)
30
(36)71
(34)122
(32)196
(30)388
(26)
Hortense 22(15)
84(13)
141(11)
181(9)
408
(3)
Isidore 19(48)
59
(47)108
(45)151
(43)176
(41)274
(37)
Josephine 20
(28)
89
(24)158
(20)231
(16)294
(13)351(9)
Klaus 12(21) 39
(19)85
(17)129(16) 161
(14)189
(10)
Lili 370
(12)14
(22)75
(22)138
(21)175
(18)189
(16)
Marco 12(7)
43
(5)55
(3)49
(1) (0)
52
(15)113
(13)183
(11)223
(9)Nana 8
(17)
194(163)
306
(121)Total 16
(269)56
(243)
103(215)
149(187)
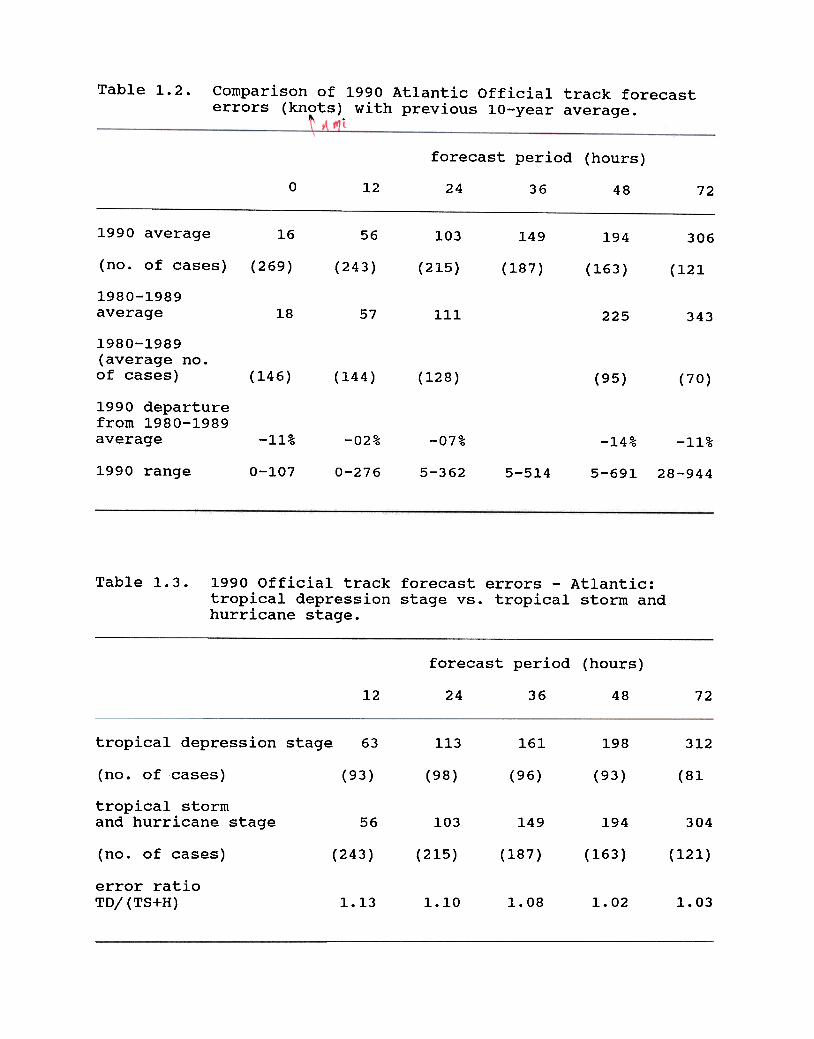
Table 1.2. Comparison of 1990 Atlantic Official track forecasterrors (knots) with previous 10-year average.
'II. .
forecast period (hours)
0 12 24 36 48 72
1990 average 16 56 103 149 194 306
(no. of cases) (269) (243) (215) (187) (163) (121
1980-1989average 18 57 111 225 343
1980-1989(average no.of cases) (146) (144) (128) (95) (70)
1990 departurefrom 1980-1989average -11% -02% -07% -14% -11%
1990 range 0-107 0-276 5-362 5-514 5-691 28-944
Table 1.3. 1990 Official track forecast errors -Atlantic:tropical depression stage vs. tropical storm andhurricane stage.
forecast period (hours)
12 24 36 48 72
tropical depression stage 63 113 161 198 312
(no. of cases) (93) (98) (96) (93) (81
tropical stormand hurricane stage 56 103 149 194 304
(no. of cases) (215) (187) (163)(243) (121)
error ratioTDj(TS+H)1.13 1.10 1.08 1.02 1.03
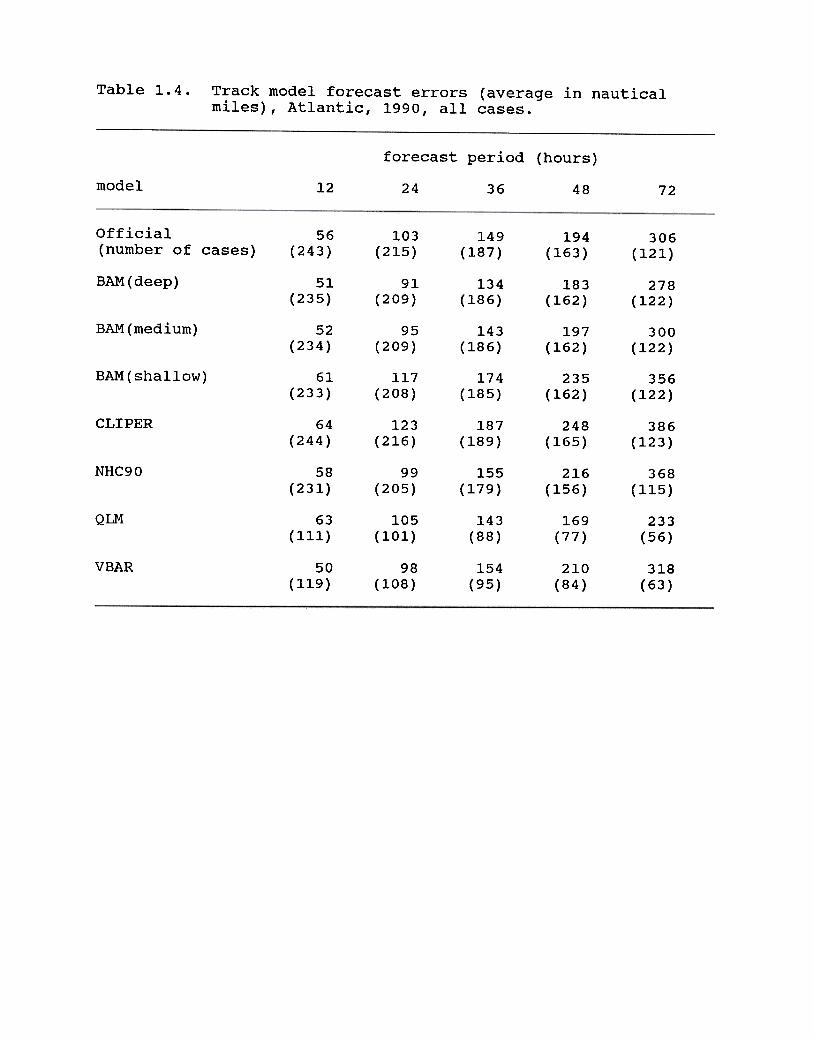
Table 1.4. Track model forecast errors (average in nauticalmiles), Atlantic, 1990, all cases.
forecast period (hours)
model 12 24 36 48 72
56
(243)103
(215)149
(187)194
(163)306
(121)Official(number of cases)
BAM(deep)
51(235)
91(209)
134(186)
183(162)
278
(122)
BAM(medium) 52
(234)
95
(209)
143(186)
197(162)
300
(122)
BAM(shallow) 61(233)
117(208)
174(185)
235(162)
356
(122)
CLIPER 64
(244)
123(216)
187(189)
248
(165)386
(123)
NHC90 58(231)
99
(205)
155(179)
216(156)
368
(115)
QLM 63
(111)105
(101)143
(88)169
(77)233
(56)
VBAR 50
(119)98
(108)154
(95)210
(84)318
(63)

Table 1.5. Track model forecast errors (average in nauticalmiles), Atlantic, 1990, quasi-homogeneous set of
cases .~'"
forecast period (hours)
model 12 24 36 48 72
57(111)
107(101)
156(88)
20177)
321(56)
Official(number of cases)
BAM(deep) 50 94 136 188 290
CLIPER 62 121 193 256 411
NHC90 58 98 157 214 358
QLM 63 105 143 169 233 2::-'"
VBAR 49 97 154 211 321
Table 1.6. Track model forecast errors, normalized with respectto the CLIPER model, Atlantic, 1990, quasi-homogeneous set of cases. The values in this tableare derived by dividing the errors in Table 1.4 bythe CLIPER model error for the same forecast period.
forecast period (hours)
model 12 24 36 48 72
0.92(111)
0.88(101)
0.81(88)
0.79(77)
0.78(56)
Official(number of cases)
BAM(deep)
0.81 0.78 0.70 0.73 0.71
CLIPER 1.00 1.00 1.00 1.00 1.00
NHC90 0.94 0.81 0.81 0.84 0.87
QLM 1.02 0.87 0.74 0.66 0.57
VBAR 0.79 0.80 0.80 0.82 0.78

Table 2.1 (continued). Official track forecast errors (averagein nautical miles), eastern Pacific, 1990.
forecast period (hours)
storm 0 12 24 36 48 72
Polo 10(6)
50
(5)
69
(3)106(1)
-(0) (0)
Rachel 15(11)
61(9)
113(7)
192(5)
430
(3) (0)
simon 17(15)
37
(13)67
(11)104(9)
132(7)
183(3)
Trudy 9
(56)33
(54)70
(52)112
(50)158
(48)269
(44)
Vance 15(29)
48
(27)85
(25)134
(23)174
(21232
(17)
Total 13(451)
38
(418)71
(383)
108(345)
143(308)
200
(237)

Table 2.1. Official track forecast errors by storm (average innautical miles), eastern Pacific, 1990.
forecast period (hours)
storm 0 12 24 36 48 72
14(10)
42
(Ia)71
(10)87
(9)99
(7)194(3)
Alma(no. of cases)
Boris 12(13)
51(11)
127(9)
209
(7)321(5)
502
(1)
21(18)
47(16)
83
(14)109
(12)140
(10)133(6)
Douglas 13(14)
30
(13)58
(11)95
(9)133(7)
296
(3)
Elida 13(16)
43(15)
85
(13)134
(11)148(9)
147(5)
Fausto 15(19)
35
(17)51
(15)64
(13)73
(11)162(7)
Genevieve 12(25)
33
(23)
59
(21)95
(19)127
(17)171
(13)
Hernan J.4(35)
26
(33)
43(31)
60(29)
76
(27)
100(23)
Iselle 12(32)
31(30)
56
(29)84
(27)111
(25)159
(21)
Julio 12(24)
37(22)
59
(20)87
(18)116
(16)160
(12)
Kenna 12(28)
45
(26)78
(24)128
(22)175
(20)213
(16)
Lowell 13(23)
36
(21)69
(19)93
(17)125
(15)181
(11)
Marie 10(23)
29
(23)
63
(23)98
(23)133
(23)195
(23)
Norbert 14(30)
49(28)
101(26)
151(23)
179(21)
212(17)
Odile 10(24)
35
(22)76
(20)127
(18)179
(16)266
(12)

Table 1.7. Official wind speed forecast errors (knots), Atlantic1990. Error = forecast -observed.
forecast period (hours)
0 12 24 36 48 72
1990 mean -2.0 -1.3 -1.8 -2.8 -3.5 -2.7
1990 meanabsolute 3.4 6.4 10.1-
215
12.2 13.9 15.7no. of cases 269 243 187 162 119
max.
error -25 -35 -40 -40 -50 -45
1980-1989mean -1.3 -1.6 -2.7 -5.4 -6.4
1980-1989 avg.no. of cases 143 141 124 90 64
1990 departurefrom 1980-1989mean +54% -19% -33% -35% -58%
1980-1989 meanabsolute 5.6 8.5 11.7 15.8 19.9
1990 departurefrom 1980-1989mean absolute -39% -25% -14% -12% -21%

Table 2.2 Official track forecast errors (nautical miles),by year, eastern Pacific Ocean.
forecast period (hours)
year 0 12 24 36 48
888
107888
108
1978-1987average 84 173
1988-1990average 15 41 75 111 147
3610869515
20
(175)15
(215)13(451)
45(175)
43(215)
38
(418)
75(150)
82(182)
71(383)
103(128)
125(150)
108(345)
138(108)
164(119)
143(308)
176
(74)237
(77)200
(237)
1988(cases)1989(cases)1990(cases)

Table 2.3. Track model forecast errors (average in nauticalmiles), eastern Pacific, 1990, all cases.
forecast period (hours)
model 12 24 36 48 72
38
(418)
71(383)
108(345)
143(308)
200
(237)
Official(number of cases)
BAM(deep)
50
(318)87
(292)122
(263)
162(235)
250
(187)
BAM(medium)
45
(289)80
(267)113
(243)147
(220)
225
(179)
BAM(shallow)
50(289)
88
(267)124
(243)
160(220)
231(179)
CLIPER 41(417)
75
(380)
112(339)
150(302)
200
(232)
PSDE 40
(192)78
(174)115
(156)136
(138)194
(105)
40(411)
72
(374)
109(336)
146(299)
199(230)
57(146)
80
(135)117
(122)163
(112)260
(85)
Table 2.4. Track model forecast errors (average in nauticalmiles), eastern Pacific, 1990, quasi-homogeneous set
of cases.
forecast period (hours)
model 12 24 36 48 72
37
(145)70
(134)105
(120)142
(110)205
(84)
Official(number of cases)
BAM(medium)
45 80 113 146 233
CLIPER 41 75 112 149 201
PSDE 38 74 110 131 198
PSS 39 71 110 145 194
QLM 57 80 117 163 260
Table 2.5. Track model forecast errors, normalized with respectto the CLIPER model, eastern Pacific, 1990, quasi-homogeneous set of cases. The values in this tableare derived by dividing the errors in Table 1.4 bythe CLIPER model error for the same forecast period.
forecast period (hours)
model 12 24 36 48 72
0.90(145)
0.93(134)
0.94(120)
0.95(110)
1.02(84)
Official(number of cases)
BAM(medium)
1.10 1.07 1.01 0.98 1.16
PSDE 0.93 0.99 0.98 0.88 0.99
PSS 0.95 0.95 0.98 0.97 0.97
QLM 1.39 1.07 1.04 1.09 1.29