Embed Size (px)
Citation preview

NATIONAL HURRICANE CENTER TROPICAL CYCLONE REPORT
HURRICANE MARIA (AL152017) 16–30 September 2017
Richard J. Pasch, Andrew B. Penny, and Robbie Berg National Hurricane Center
10 April 20181
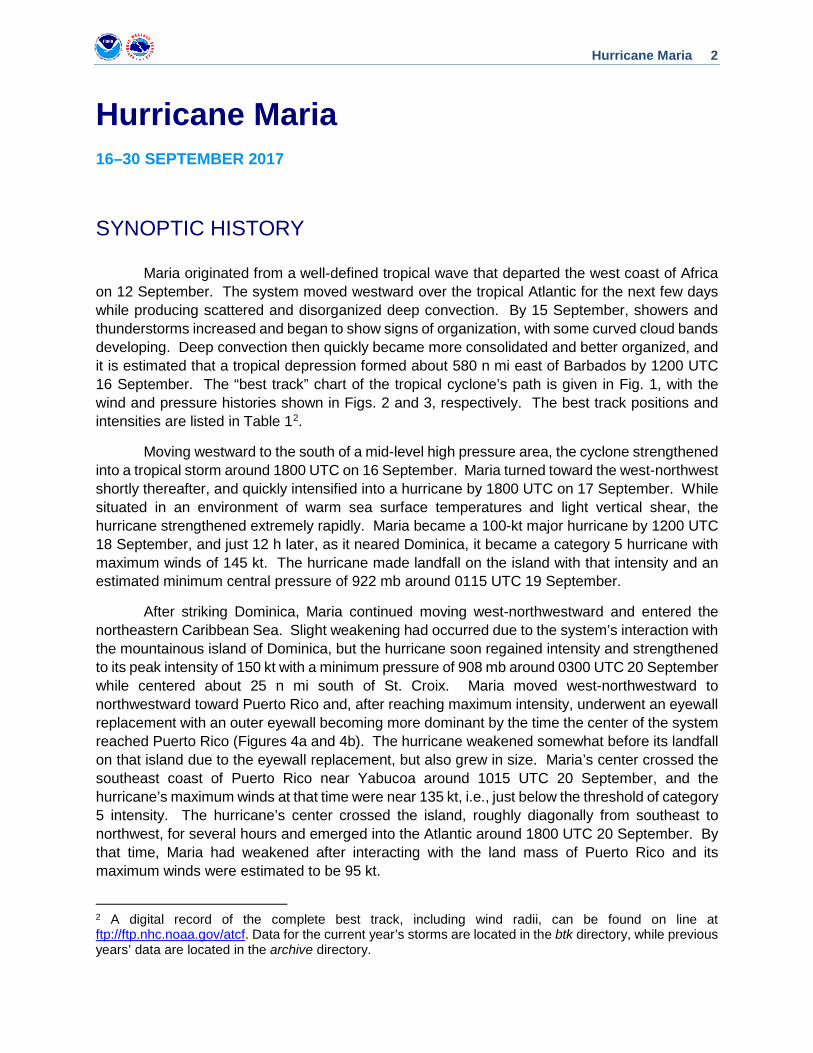
VIIRS SATELLITE IMAGE OF HURRICANE MARIA NEARING PEAK INTENSITY AT 1942 UTC 19 SEPTEMBER 2017. IMAGE
COURTESY OF UW-CIMSS.
Maria was a very severe Cape Verde Hurricane that ravaged the island of Dominica at category 5 (on the Saffir-Simpson Hurricane Wind Scale) intensity, and later devastated Puerto Rico as a high-end category 4 hurricane. It also inflicted serious damage on some of the other islands of the northeastern Caribbean Sea. Maria is the third costliest hurricane in United States history.
1 Original report date 5 April 2018. Corrected damage photo of Dominica in Fig. 9.
Hurricane Maria 2
Hurricane Maria 16–30 SEPTEMBER 2017
SYNOPTIC HISTORY Maria originated from a well-defined tropical wave that departed the west coast of Africa on 12 September. The system moved westward over the tropical Atlantic for the next few days while producing scattered and disorganized deep convection. By 15 September, showers and thunderstorms increased and began to show signs of organization, with some curved cloud bands developing. Deep convection then quickly became more consolidated and better organized, and it is estimated that a tropical depression formed about 580 n mi east of Barbados by 1200 UTC 16 September. The “best track” chart of the tropical cyclone’s path is given in Fig. 1, with the wind and pressure histories shown in Figs. 2 and 3, respectively. The best track positions and intensities are listed in Table 12.
Moving westward to the south of a mid-level high pressure area, the cyclone strengthened into a tropical storm around 1800 UTC on 16 September. Maria turned toward the west-northwest shortly thereafter, and quickly intensified into a hurricane by 1800 UTC on 17 September. While situated in an environment of warm sea surface temperatures and light vertical shear, the hurricane strengthened extremely rapidly. Maria became a 100-kt major hurricane by 1200 UTC 18 September, and just 12 h later, as it neared Dominica, it became a category 5 hurricane with maximum winds of 145 kt. The hurricane made landfall on the island with that intensity and an estimated minimum central pressure of 922 mb around 0115 UTC 19 September.
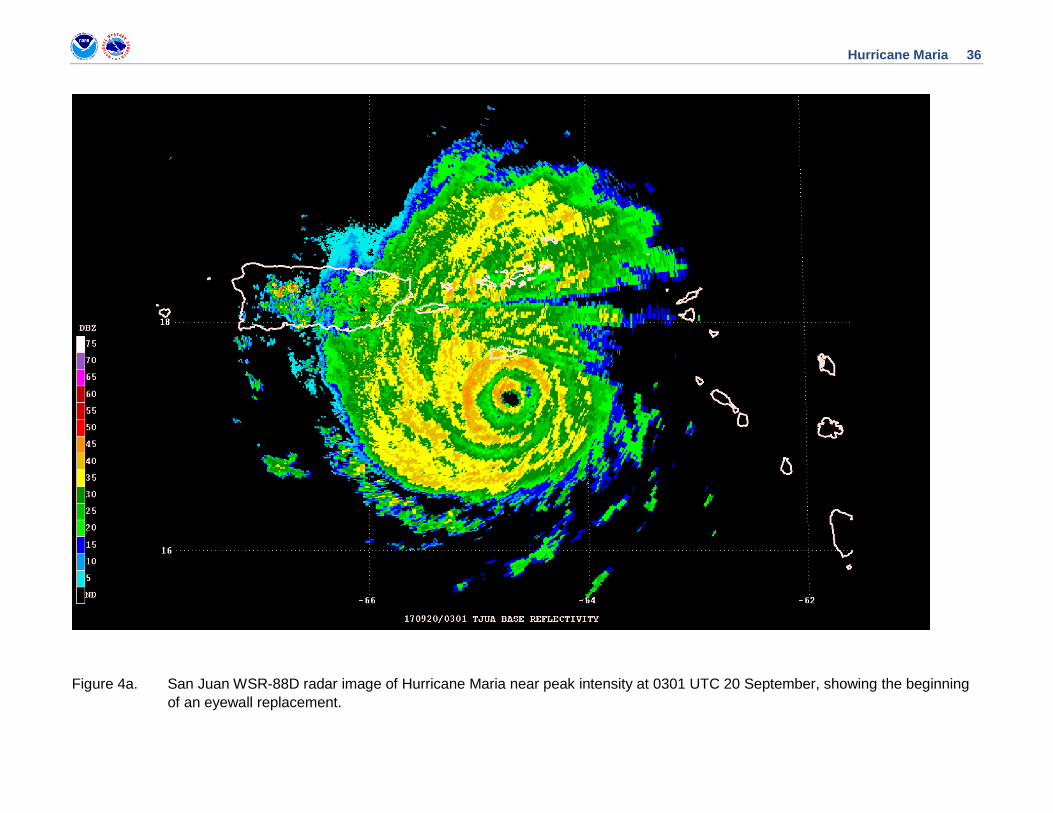
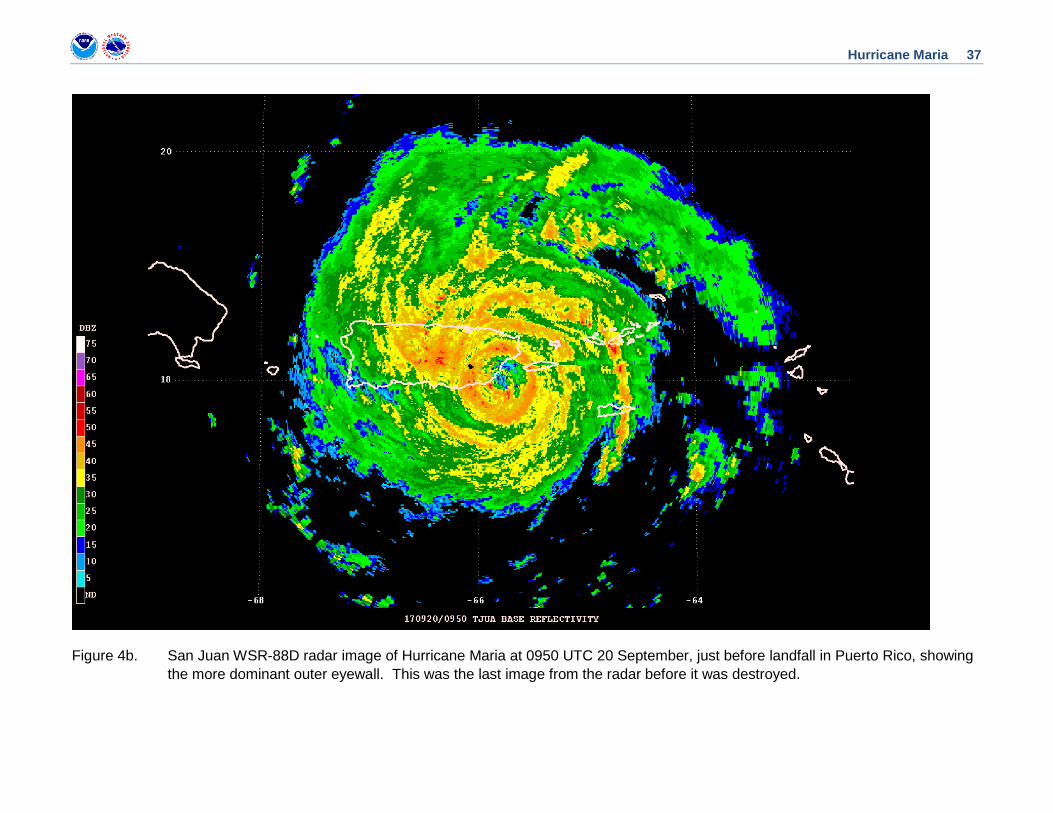
After striking Dominica, Maria continued moving west-northwestward and entered the northeastern Caribbean Sea. Slight weakening had occurred due to the system’s interaction with the mountainous island of Dominica, but the hurricane soon regained intensity and strengthened to its peak intensity of 150 kt with a minimum pressure of 908 mb around 0300 UTC 20 September while centered about 25 n mi south of St. Croix. Maria moved west-northwestward to northwestward toward Puerto Rico and, after reaching maximum intensity, underwent an eyewall replacement with an outer eyewall becoming more dominant by the time the center of the system reached Puerto Rico (Figures 4a and 4b). The hurricane weakened somewhat before its landfall on that island due to the eyewall replacement, but also grew in size. Maria’s center crossed the southeast coast of Puerto Rico near Yabucoa around 1015 UTC 20 September, and the hurricane’s maximum winds at that time were near 135 kt, i.e., just below the threshold of category 5 intensity. The hurricane’s center crossed the island, roughly diagonally from southeast to northwest, for several hours and emerged into the Atlantic around 1800 UTC 20 September. By that time, Maria had weakened after interacting with the land mass of Puerto Rico and its maximum winds were estimated to be 95 kt.
2 A digital record of the complete best track, including wind radii, can be found on line at ftp://ftp.nhc.noaa.gov/atcf. Data for the current year’s storms are located in the btk directory, while previous years’ data are located in the archive directory.
Hurricane Maria 3
Over the next couple of days, the hurricane moved northwestward along the southwestern periphery of a mid-level high over the western Atlantic while gradually restrengthening. Although Maria never regained all of its former intensity, its maximum winds increased to near 110 kt by 0000 UTC 22 September while the hurricane was centered about 60 n mi southeast of Grand Turk Island. Maria turned toward the north-northwest, and its center passed 30 to 40 n mi east and northeast of the Turks and Caicos Islands on 22 September. Moderate southwesterly vertical shear prevented any additional strengthening during that period. The system maintained major hurricane status until 0600 UTC 24 September, while turning toward the north. Maria continued to gradually weaken, and it lost its eyewall structure by 25 September while continuing northward at a slow forward speed well offshore of the southeastern U.S. coast. The cyclone then weakened to category 1 status, and by 0600 UTC 27 September the center of the 65-kt hurricane passed about 130 n mi east of Cape Hatteras, North Carolina. On 28 September, Maria turned sharply toward the east and began to accelerate as it weakened to a tropical storm. Moving rapidly eastward to east-northeastward, the system became an extratropical cyclone by 1800 UTC 30 September while centered about 465 n mi southeast of Cape Race, Newfoundland. The cyclone moved east-northeastward until dissipation over the north Atlantic about 400 n mi southwest of Ireland by 1800 UTC 2 October.
METEOROLOGICAL STATISTICS Observations in Maria (Figs. 2 and 3) include subjective satellite-based Dvorak technique intensity estimates from the Tropical Analysis and Forecast Branch (TAFB) and the Satellite Analysis Branch (SAB), and objective Advanced Dvorak Technique (ADT) estimates from the Cooperative Institute for Meteorological Satellite Studies/University of Wisconsin-Madison. Observations also include flight-level, stepped frequency microwave radiometer (SFMR), and dropwindsonde observations from 22 flights of the 53rd Weather Reconnaissance Squadron of the U.S. Air Force Reserve Command, and 8 flights of the NOAA Hurricane Hunter P-3 aircraft. Data and imagery from NOAA polar-orbiting satellites including the Advanced Microwave Sounding Unit (AMSU), the NASA Global Precipitation Mission (GPM), the European Space Agency’s Advanced Scatterometer (ASCAT), and Defense Meteorological Satellite Program (DMSP) satellites, among others, were also useful in constructing the best track of Maria.
Ship reports of winds of tropical storm force associated with Maria are given in Table 2, and selected surface observations from land stations and data buoys are given in Table 3.
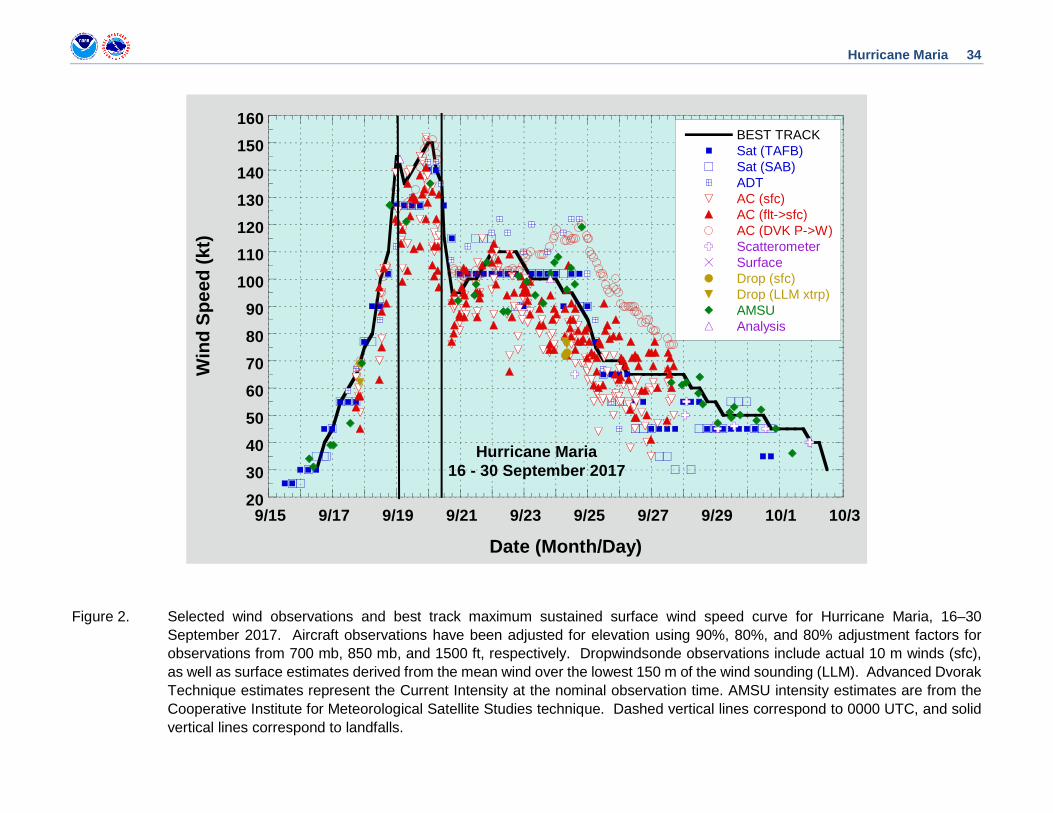
Winds and Pressure Maria’s peak intensity of 150 kt is based on a blend of SFMR-observed surface winds of 152 kt and 700-mb flight-level winds of 157 kt. Maria’s 65-kt intensity increase over 24 h on 18 September makes it tied for the sixth-fastest intensifying hurricane in the Atlantic basin record.
The intensity of the hurricane when it struck Dominica, 145 kt, is based on an SFMR-observed surface wind of 152 kt which, based on quality control by data processing software, is believed to be somewhat inflated, and a maximum 10-min wind of 130 kt measured at Douglas-
Hurricane Maria 4
Charles Airport on the island, which conservatively corresponds to a 1-min wind of 143 kt. Maria is the strongest hurricane on record to make landfall on Dominica (or strike within 60 n mi of that island).
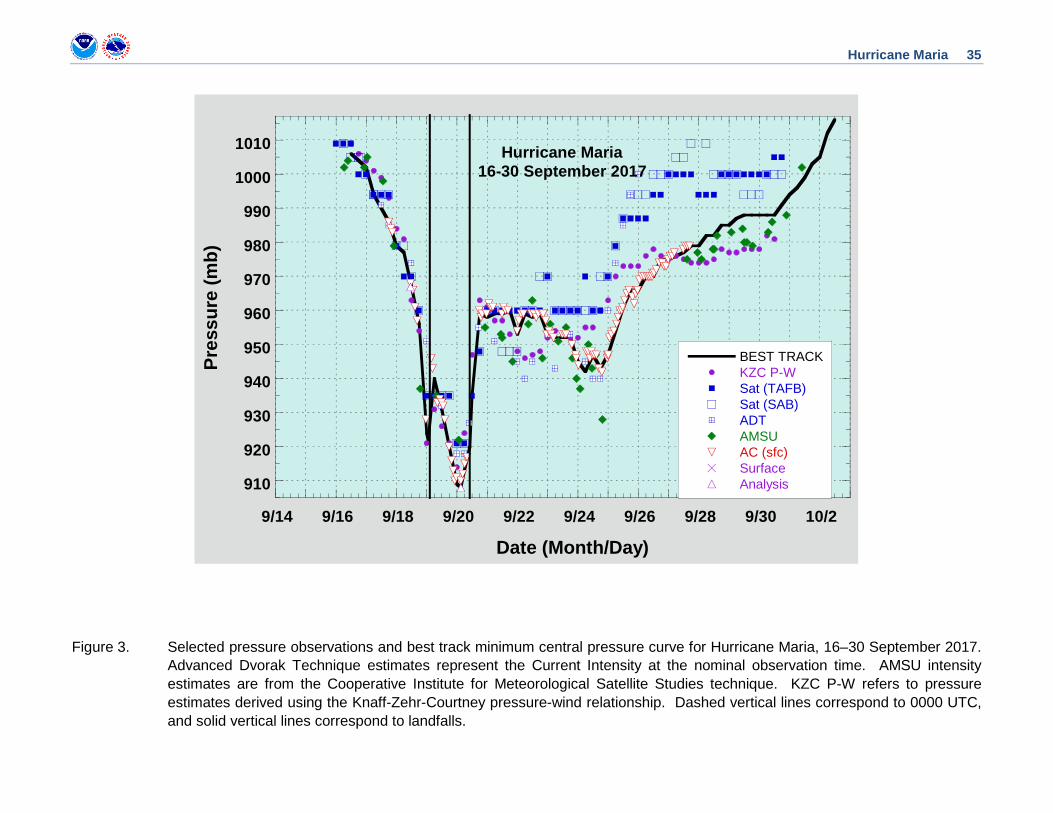
Maria’s minimum central pressure of 908 mb is based on an eye dropsonde measurement by the Air Force Hurricane Hunters of 910 mb with 23-kt winds at the surface at 0313 UTC 20 September. This is the lowest pressure on record of any hurricane in the Atlantic basin east of 70°W, and breaks the record that had been set just a couple of weeks earlier by Irma of 914 mb.
The landfall intensity of the cyclone in Puerto Rico, 135 kt, is based on an extrapolation of the weakening trend noted in the aircraft data after the eyewall replacement began several hours earlier. There were no believable Doppler-derived winds from the San Juan WSR-88D radar that supported a higher intensity. It should be noted, however, that in Puerto Rico, winds of category 5 intensity were almost certainly felt at some elevated locations on the island.
The landfall pressures of the hurricane in Dominica and Puerto Rico of 922 and 920 mb, respectively, are based on an extrapolation of the system’s deepening and filling trends before making landfall in those islands. Several storm chasers observed pressures higher than the estimated minimum value in Puerto Rico, but these observers were not thought to be in the exact center of the hurricane. Maria is the strongest hurricane to make landfall in Puerto Rico since a category 5 hurricane in 1928 (known as Segundo San Felipe).
Maria’s eyewall replacement early on 20 September resulted in roughly a tripling of its eye diameter, from 9 n mi to about 28 n mi, prior to landfall in Puerto Rico. This event was likely a major contributor to weakening, but also increased the areal exposure of the island to the hurricane’s highest winds.
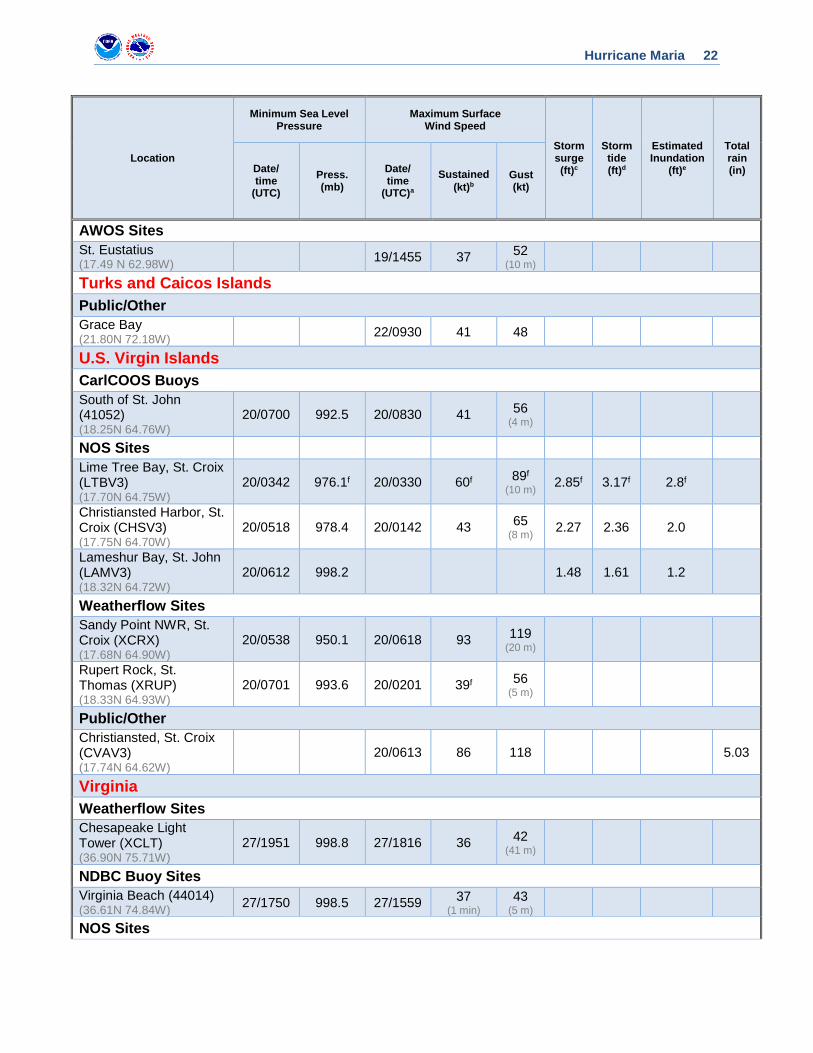
A peak sustained wind of 93 kt with a gust to 119 kt was reported at St. Croix near the northeast edge of Maria’s eyewall. Las Mareas, on the south coast of Puerto Rico, recorded a 1-min sustained wind of 94 kt with a gust to 109 kt in the western eyewall of Maria. Wind gusts to hurricane force were recorded in Guadeloupe and on the northeast coast of the Dominican Republic.
Sustained winds at the low end of tropical storm force occurred over the North Carolina Outer Banks due to Maria.
It should be noted that in Figure 2, beginning around 24 September, Maria’s actual maximum winds were as much as 20-30 kt lower than what would be derived from a standard pressure-wind relationship [AC(DVK->W)]. This is mainly due to the expansion of the cyclone’s circulation while it moved into higher latitudes.

Hurricane Maria 5
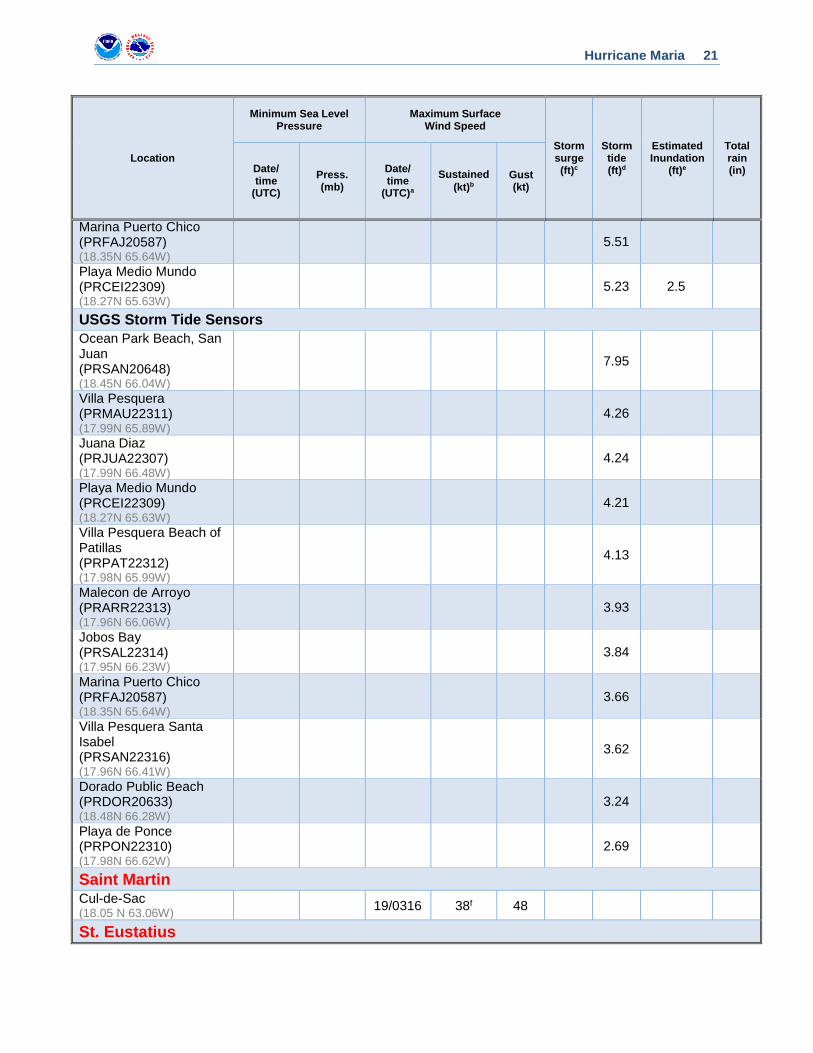
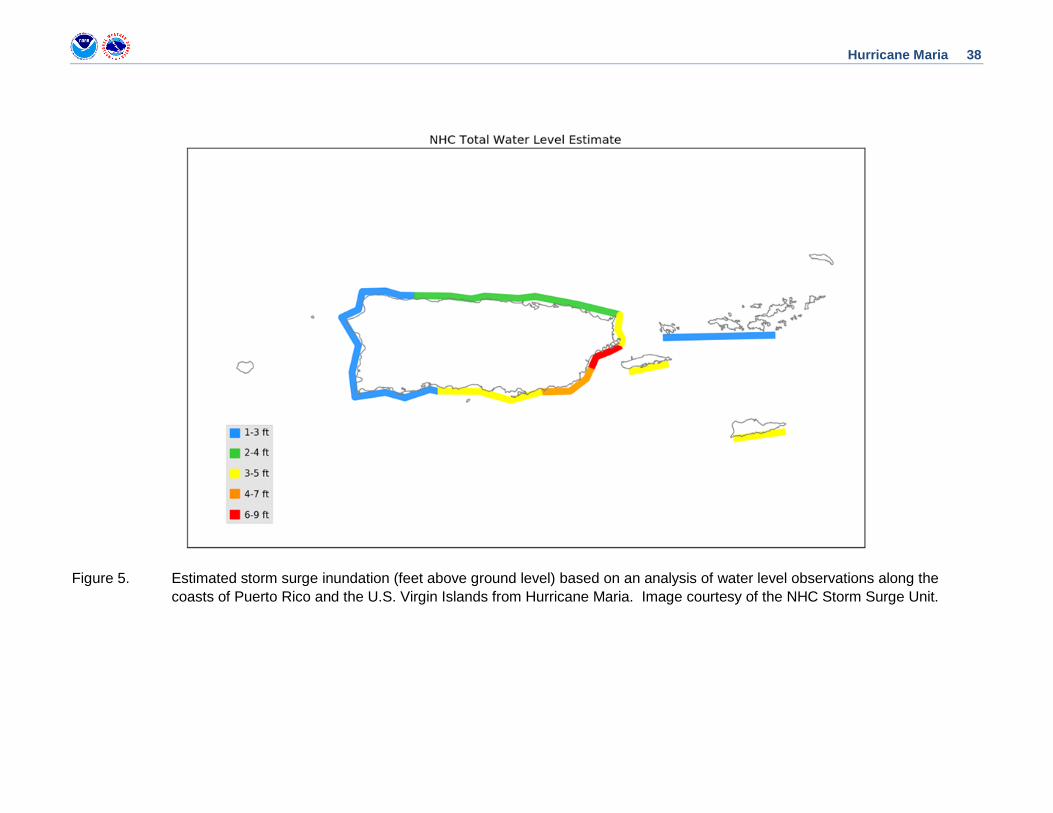
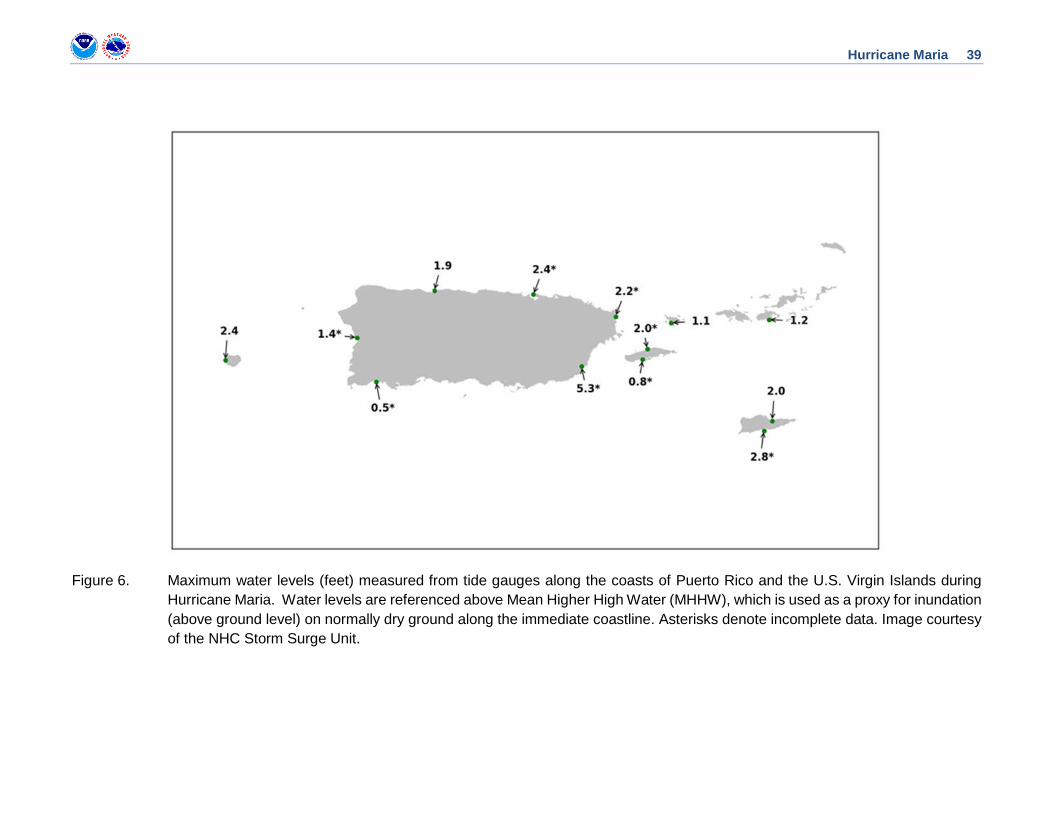
Storm Surge3 The combined effect of the surge and tide produced maximum inundation levels of 6 to 9 ft above ground level to the north of Maria’s landfall along the coasts of Humacao, Naguabo, and Ceiba municipalities in Puerto Rico. Figure 5 provides an analysis of maximum inundation heights along the coasts of Puerto Rico and the U.S. Virgin Islands, and Figure 6 provides peak water levels recorded by tide gauges, relative to Mean Higher High Water (MHHW). The United States Geological Survey (USGS) measured high water marks of 5.1 ft and 4.9 ft above ground level inside structures at Punta Santiago in Humacao. Another high water mark was surveyed at 9.5 ft above the Puerto Rico Vertical Datum of 2002 (PRVD), which converts to about 9 ft MHHW. These data suggest that maximum inundation levels along the immediate shoreline were as high as 9 ft above ground level in these municipalities. Elsewhere along the southeastern coast of Puerto Rico, maximum inundation levels are estimated at 4 to 7 ft above ground level, primarily in the municipalities of Yabucoa, Maunabo, Patillas, and Arroyo. A Puerto Rico Seismic Network tide gauge at Yabucoa Harbor measured a water level of 5.3 ft MHHW, but the sensor went offline for a period and may not have recorded the peak water level.
Maximum inundation levels of 3 to 5 ft above ground level occurred along the coast of northeastern Puerto Rico, especially in the municipalities of Ceiba and Fajardo, and along much of the southern coast from Ponce eastward. A tide gauge in Fajardo measured a water level of 2.2 ft MHHW before it went offline. A USGS storm tide sensor installed on a public dock at Puerto Chico in Fajardo measured a wave-filtered water level of 2.8 ft above the sensor (also about 2.8 ft MHHW), and the waves themselves contributed another 2 ft or so to the total water level, yielding almost 5 ft of inundation in that area. On the southern coast, a high water mark of 5.2 ft PRVD was surveyed at Playa de Salinas, which converts to about 4.8 ft MHHW and supports an estimated maximum inundation of 5 ft above ground level.
Maximum inundation levels of 2 to 4 ft above ground level occurred along much of the northern coast of Puerto Rico. A National Ocean Service (NOS) tide gauge in San Juan Bay measured a peak water level of 2.4 ft MHHW, but the sensor went offline for a period and may not have recorded the highest water level. Farther west, a tide gauge at Arecibo measured a peak water level of 1.9 ft MHHW. Elsewhere, peak water levels along the northwestern, western, and southwestern coasts of Puerto Rico are estimated to have been 1 to 3 ft above ground level.
Post-storm surge simulations suggest that maximum inundation levels of 3 to 5 ft above ground level occurred on Vieques and St. Croix. Tide gauges at Isabel Segunda, Vieques, and Lime Tree Bay, St. Croix, measured peak water levels of 2.0 ft MHHW and 2.8 ft MHHW, respectively, but both of these sensors went offline and may not have recorded the highest water levels. Surge simulations and available tide gauge observations also suggest that maximum inundation levels of 1 to 3 ft above ground level occurred on Culebra, St. Thomas, and St. John.
3 Several terms are used to describe water levels due to a storm. Storm surge is defined as the abnormal rise of water generated by a storm, over and above the predicted astronomical tide, and is expressed in terms of height above normal tide levels. Because storm surge represents the deviation from normal water levels, it is not referenced to a vertical datum. Storm tide is defined as the water level due to the combination of storm surge and the astronomical tide, and is expressed in terms of height above a vertical datum, i.e. the North American Vertical Datum of 1988 (NAVD88) or Mean Lower Low Water (MLLW). Inundation is the total water level that occurs on normally dry ground as a result of the storm tide, and is expressed in terms of height above ground level. At the coast, normally dry land is roughly defined as areas higher than the normal high tide line, or Mean Higher High Water (MHHW).
Hurricane Maria 6
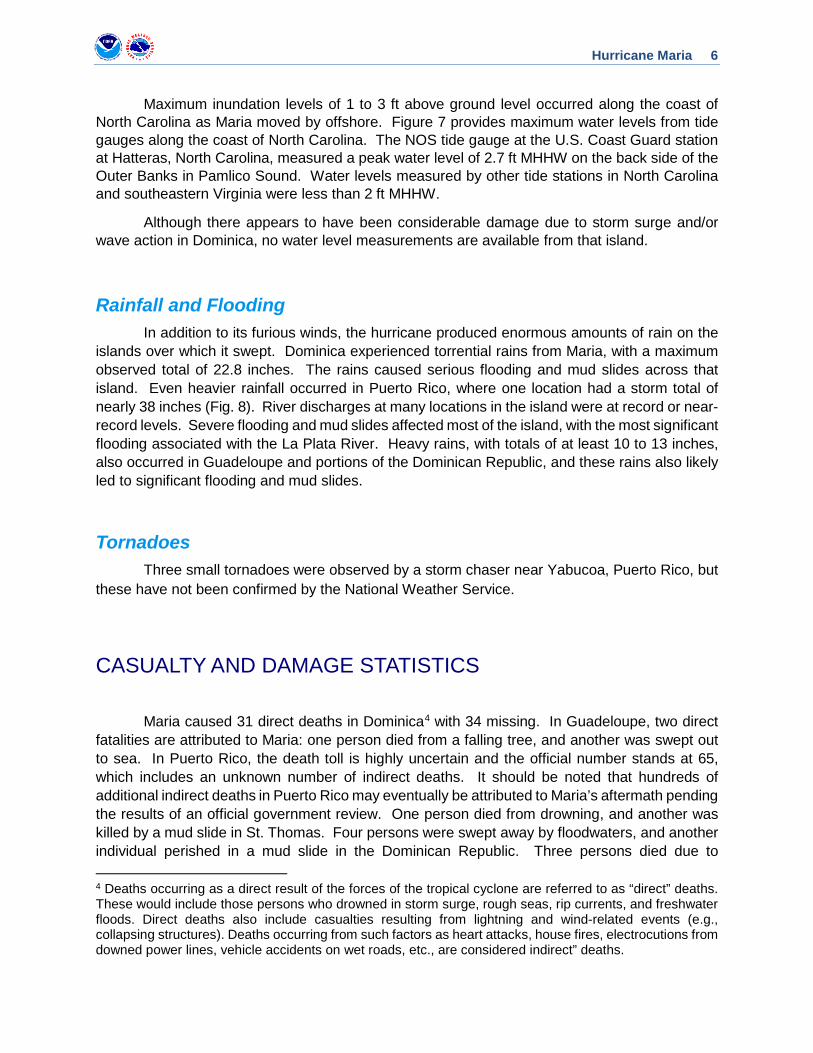
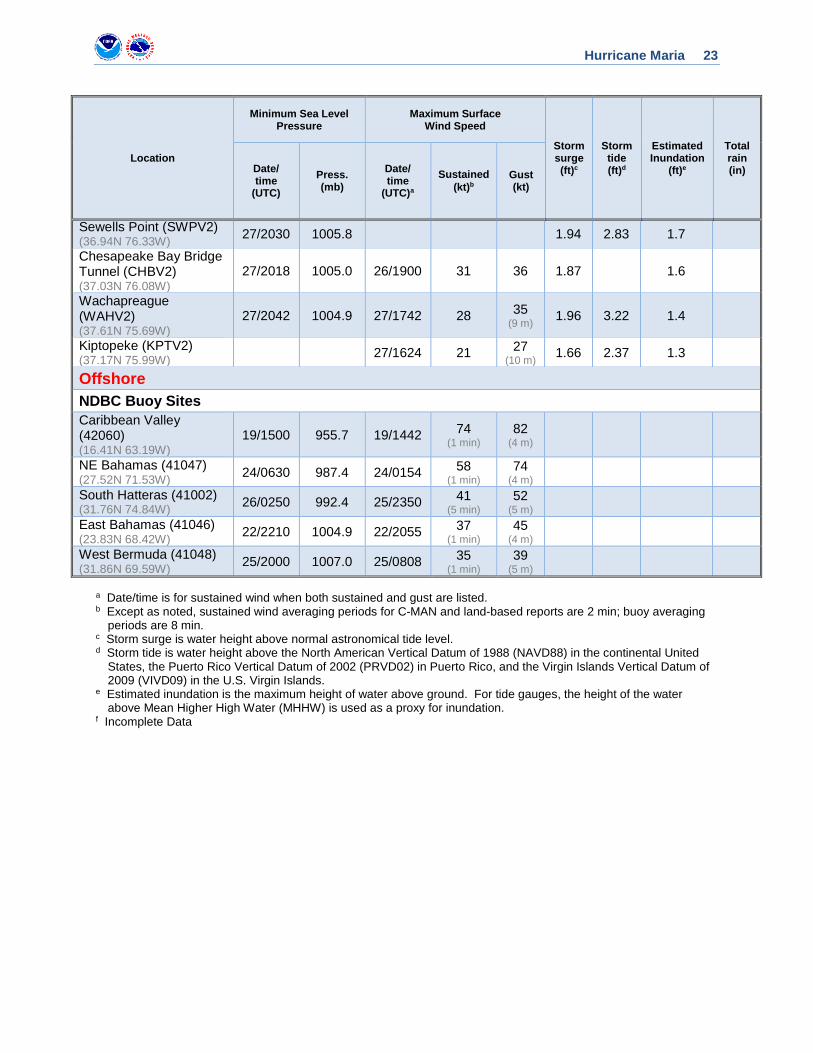
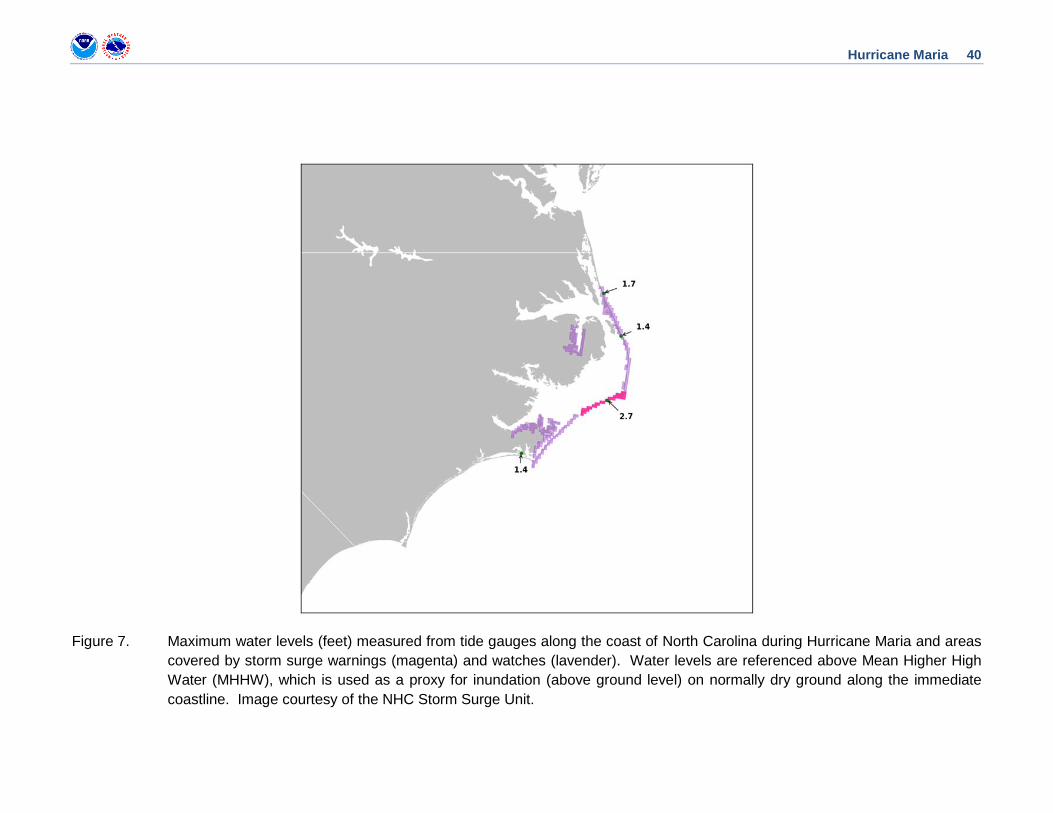
Maximum inundation levels of 1 to 3 ft above ground level occurred along the coast of North Carolina as Maria moved by offshore. Figure 7 provides maximum water levels from tide gauges along the coast of North Carolina. The NOS tide gauge at the U.S. Coast Guard station at Hatteras, North Carolina, measured a peak water level of 2.7 ft MHHW on the back side of the Outer Banks in Pamlico Sound. Water levels measured by other tide stations in North Carolina and southeastern Virginia were less than 2 ft MHHW.
Although there appears to have been considerable damage due to storm surge and/or wave action in Dominica, no water level measurements are available from that island.
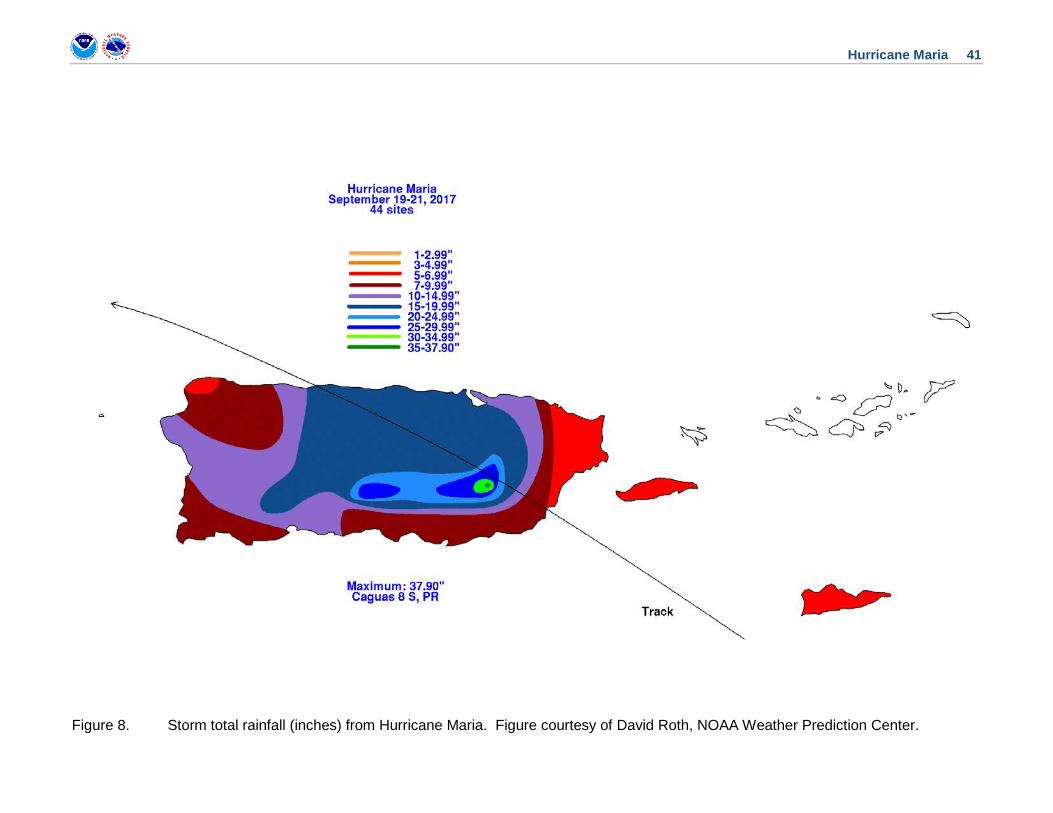
Rainfall and Flooding In addition to its furious winds, the hurricane produced enormous amounts of rain on the islands over which it swept. Dominica experienced torrential rains from Maria, with a maximum observed total of 22.8 inches. The rains caused serious flooding and mud slides across that island. Even heavier rainfall occurred in Puerto Rico, where one location had a storm total of nearly 38 inches (Fig. 8). River discharges at many locations in the island were at record or near-record levels. Severe flooding and mud slides affected most of the island, with the most significant flooding associated with the La Plata River. Heavy rains, with totals of at least 10 to 13 inches, also occurred in Guadeloupe and portions of the Dominican Republic, and these rains also likely led to significant flooding and mud slides.
Tornadoes Three small tornadoes were observed by a storm chaser near Yabucoa, Puerto Rico, but these have not been confirmed by the National Weather Service.
CASUALTY AND DAMAGE STATISTICS
Maria caused 31 direct deaths in Dominica4 with 34 missing. In Guadeloupe, two direct fatalities are attributed to Maria: one person died from a falling tree, and another was swept out to sea. In Puerto Rico, the death toll is highly uncertain and the official number stands at 65, which includes an unknown number of indirect deaths. It should be noted that hundreds of additional indirect deaths in Puerto Rico may eventually be attributed to Maria’s aftermath pending the results of an official government review. One person died from drowning, and another was killed by a mud slide in St. Thomas. Four persons were swept away by floodwaters, and another individual perished in a mud slide in the Dominican Republic. Three persons died due to 4 Deaths occurring as a direct result of the forces of the tropical cyclone are referred to as “direct” deaths. These would include those persons who drowned in storm surge, rough seas, rip currents, and freshwater floods. Direct deaths also include casualties resulting from lightning and wind-related events (e.g., collapsing structures). Deaths occurring from such factors as heart attacks, house fires, electrocutions from downed power lines, vehicle accidents on wet roads, etc., are considered indirect” deaths.
Hurricane Maria 7
floodwaters in Haiti. In the mainland United States, three persons drowned due to rip currents at the Jersey Shore, and there was a fourth drowning death at Fernandina Beach, Florida.
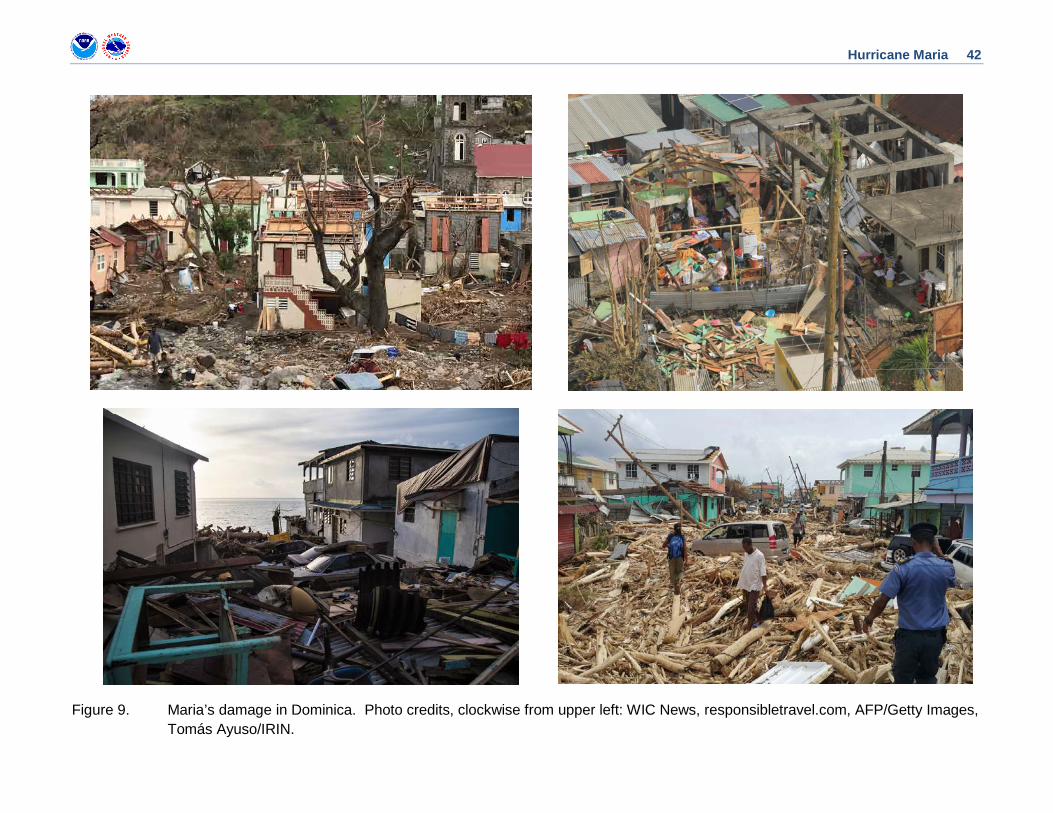
Maria caused catastrophic damage in Dominica, with the majority of structures seriously damaged or destroyed, and most trees and vegetation were downed and/or defoliated. According to media reports, the estimated damage total in Dominica is at least $1.31 billion. The agricultural sector was essentially eliminated. The once-lush tropical island was effectively reduced to an immense field of debris. In a Facebook post just after the hurricane hit, Dominica’s Prime Minister, Roosevelt Skerrit, described the damage as “mind-boggling”. The roofs of the majority of buildings and homes were either damaged or blown off. There was extensive damage to roads. Power, phone, and internet service was cut off, leaving the country almost incommunicado with the outside world. Figure 9 shows some examples of the damage in Dominica.
In Guadeloupe, to the north of Dominica, hurricane-force wind gusts and heavy rain caused a great deal of damage, especially along the southern portions of Basse-Terre Island. An estimated 80,000 homes were without electricity, and almost the entire banana crop was destroyed. An estimated $120 million in damage was reported for Guadeloupe.
To the south of Dominica, the island of Martinique had mostly minor damage.
Among all the U.S. Virgin Islands, St. Croix was the most severely affected by Maria, having experienced the northern portion of the outer eyewall. Wind damage was evident across the entire island with many fallen trees, downed signs, roof damage and complete destruction of many wooden houses. Excessive rainfall generated significant flooding and mud slides across the island. In St. Thomas and St. John, most of the roofs, signs and trees had already been destroyed or damaged earlier by Hurricane Irma, but large rainfall accumulations generated flooding and mud slides across all these islands.
Puerto Rico was devastated by winds and floods. The NOAA estimate of damage in Puerto Rico and the U.S. Virgin Islands due to Maria is 90 billion dollars, with a 90% confidence range of +/-$25.0 billion, or $65.0-$115.0 billion, which makes Maria the third costliest hurricane in U.S. history, behind Katrina (2005) and Harvey (2017). Maria is by far the most destructive hurricane to hit Puerto Rico in modern times, as the previous costliest hurricane on record for the island was Georges in 1998, which in 2017 dollars “only” caused about 5 billion dollars of damage. The combined destructive power of storm surge and wave action from Maria produced extensive damage to buildings, homes and roads along the east and southeast coast of Puerto Rico as well as the south coasts of Vieques and St. Croix. Along these areas, marinas and harbors were severely damaged due to the combination of the waves and currents associated with the surge. A storm surge also caused significant damage over the northwestern coastal area of Puerto Rico. Across the island, many buildings suffered significant damage or were destroyed. Numerous trees were downed, splintered and/or defoliated. River flooding was unprecedented in some areas, especially in the northern portion of the island. The La Plata River flooded the entire alluvial valley including the municipality of Toa Baja, where hundreds of families needed to be rescued from their roof tops. Maria knocked down 80 percent of Puerto Rico’s utility poles and all transmission lines, resulting in the loss of power to essentially all of the island’s 3.4 million residents. Practically all cell phone service was lost and municipal water supplies were knocked out. At of the end of 2017, nearly half of Puerto Rico’s residents were still without power, and by the end of January 2018, electricity had been restored to about 65% of the island. Just before

Hurricane Maria 8
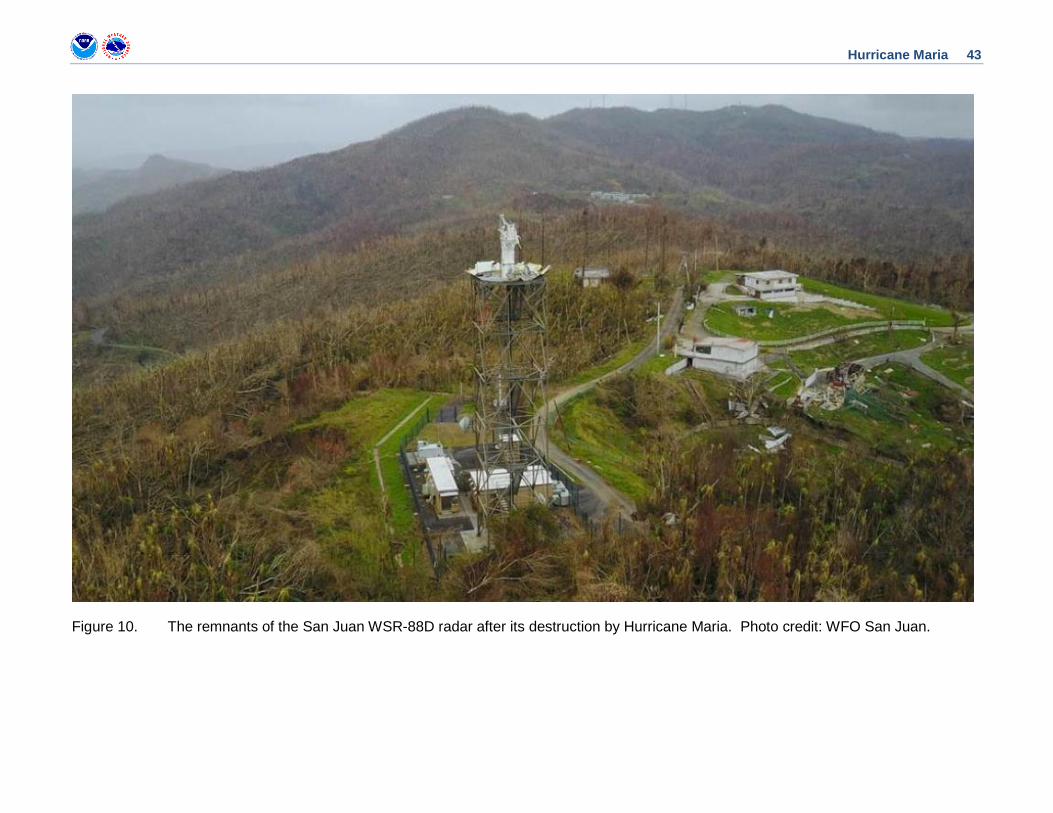
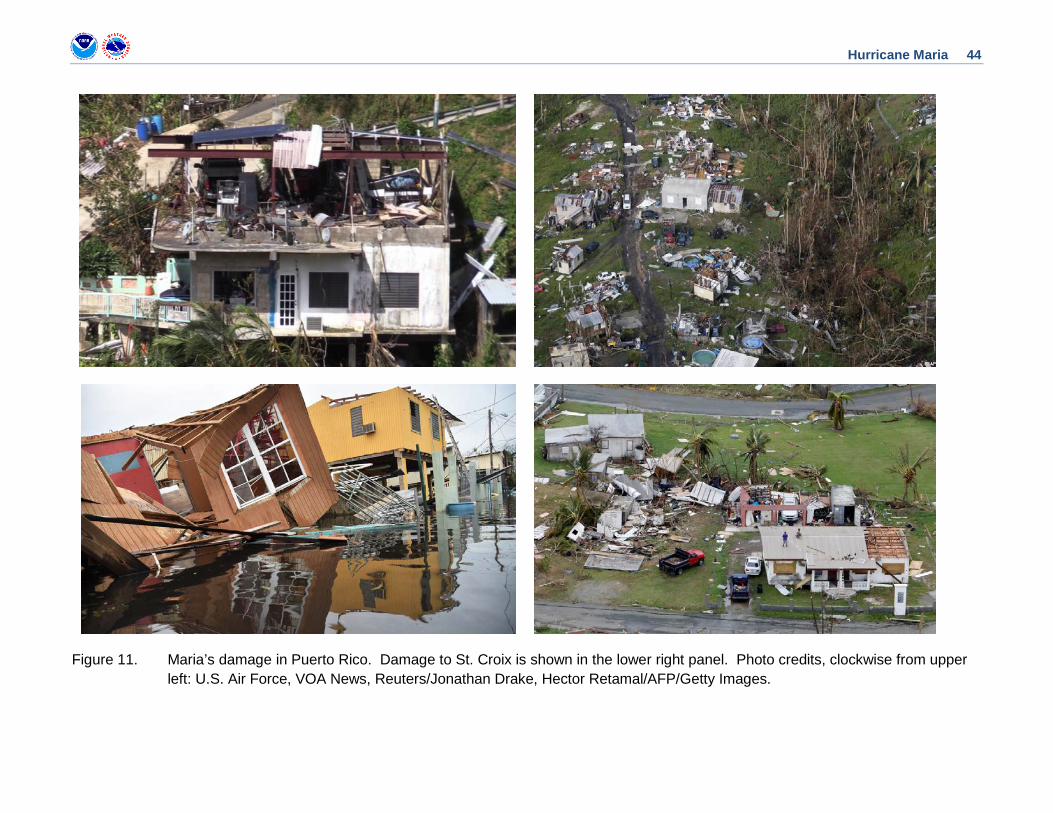
Maria’s center made landfall, extreme winds destroyed the WSR-88D radar in Puerto Rico (Figure 10). Other examples of damage in Puerto Rico and St. Croix are shown in Figure 11.
On the island of Vieques, all wooden structures were either damaged or destroyed. The island of Culebra had recently experienced major damage due to Hurricane Irma, rendering the remaining structures on the island extremely vulnerable to Maria’s winds. There was total destruction of many wooden houses, along with blown off roofs and sunken boats.
Hundreds of homes were either damaged or destroyed in the northern part of the Dominican Republic, and about 60,000 people lost power in that country. Many communities were cut off as a result of flooding and/or mud slides.
There was no significant damage in North Carolina.
FORECAST AND WARNING CRITIQUE
The wave from which Maria developed was first mentioned in both the 48- and 120-h
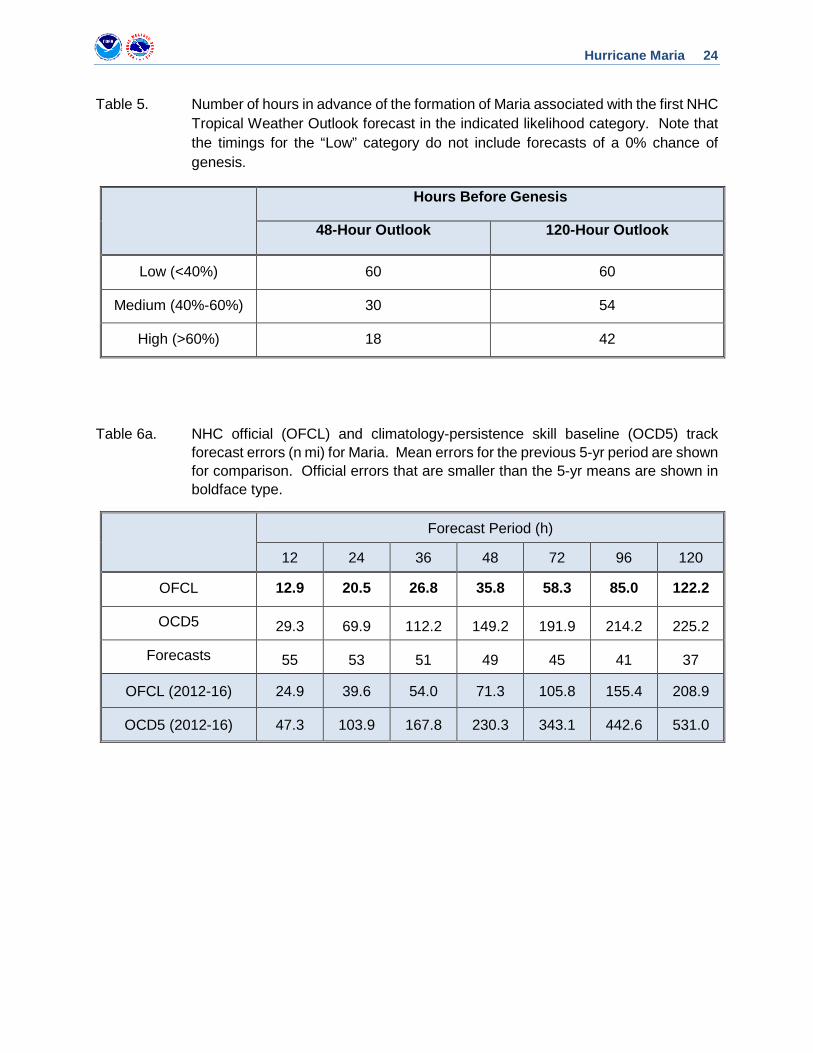
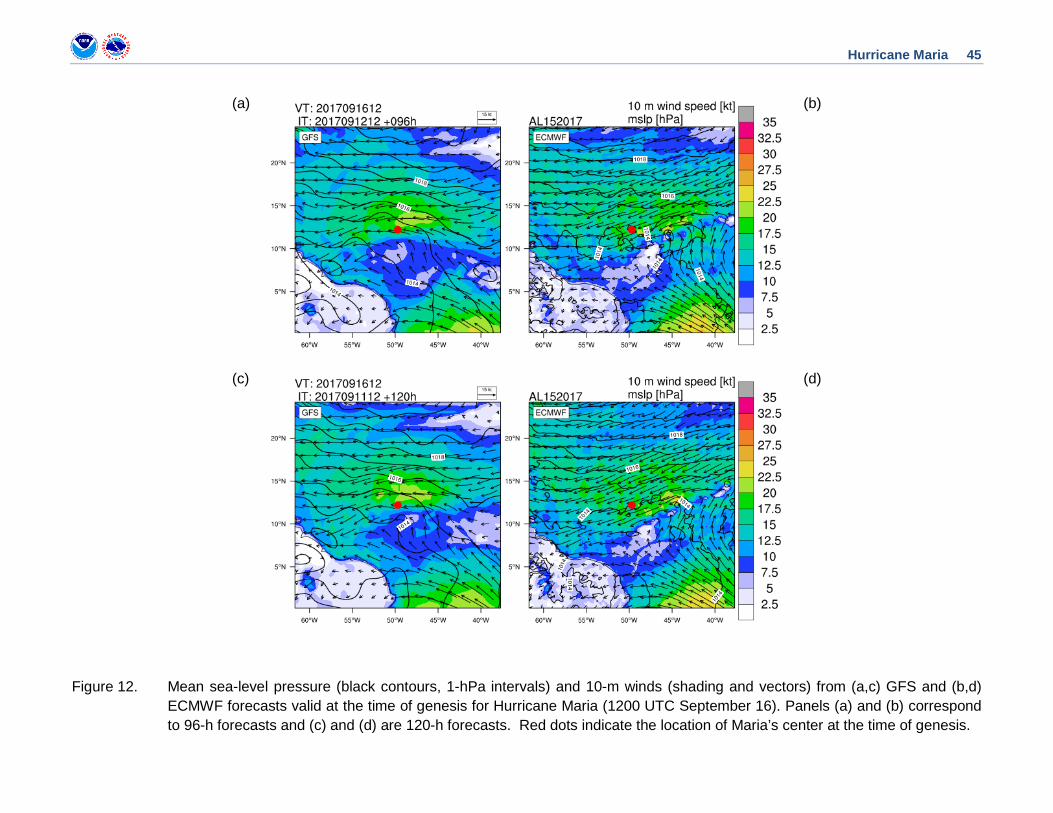
Tropical Weather Outlooks with a “low” (<40%) chance of development 60 h prior to Maria’s formation. The genesis probabilities within 48 h and 120 h were raised to “medium” (40–60%) 30 h and 54 h prior to formation, respectively, and to “high” (>60%) only 18 h and 42 h before formation, respectively (Table 5). Clearly, the genesis of Maria was not well forecast, and one reason for the poor genesis forecasts was a failure of the global models to definitively predict tropical cyclone formation until very soon before it actually occurred. Figure 12 shows 96- and 120-h GFS and ECMWF forecasts verifying at the time of Maria’s genesis; it can be seen that neither global model predicted the development of a closed surface circulation.
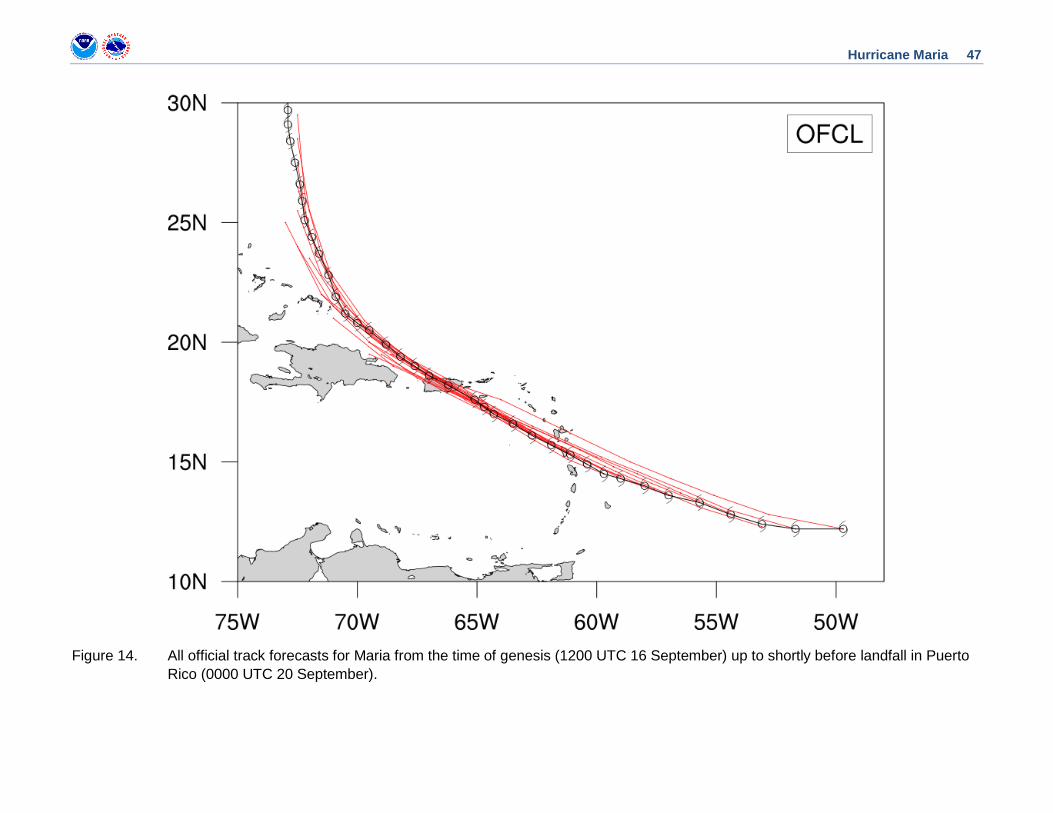
A verification of NHC official track forecasts for Maria is given in Table 6a. The mean official track forecast errors increased about 20 n mi per day, ranging from around 20 n mi at 24 h to around 120 n mi at 120 h. These errors were about 50% smaller than the mean official errors for the previous 5-yr period at all forecast intervals (Figure 13). Figure 14 shows that all of the official forecasts issued from the time of Maria’s formation up to the night before its second landfall correctly showed that the hurricane would strike Puerto Rico. A homogeneous comparison of the official track errors with selected guidance models is given in Table 6b. Most of the models performed quite well for Maria, including the simple and corrected consensus forecasts. It should be noted that the GFS, which has typically been bested by the ECMWF for track prediction in the Atlantic basin, was superior to the ECMWF at 48 through 120 h.
A verification of NHC official intensity forecasts for Maria is given in Table 7a. The mean official forecast intensity errors were 10 to 15 kt from 24 through 72 h, but were less than 10 kt at days 4 and 5. These errors were 15% to 25% higher than the mean official errors for the previous 5-yr period through 48 h, but 10% lower than the long-term mean at 72 h and 35% to 45% lower at 96 and 120 h. A homogeneous comparison of the official intensity errors with selected guidance models is given in Table 7b. The Florida State University Superensemble (FSSE) had lower mean errors than the official forecasts at all forecast intervals. One issue of note regarding intensity forecasts for Maria was how poorly the rapid intensification episode of 18 September

Hurricane Maria 9
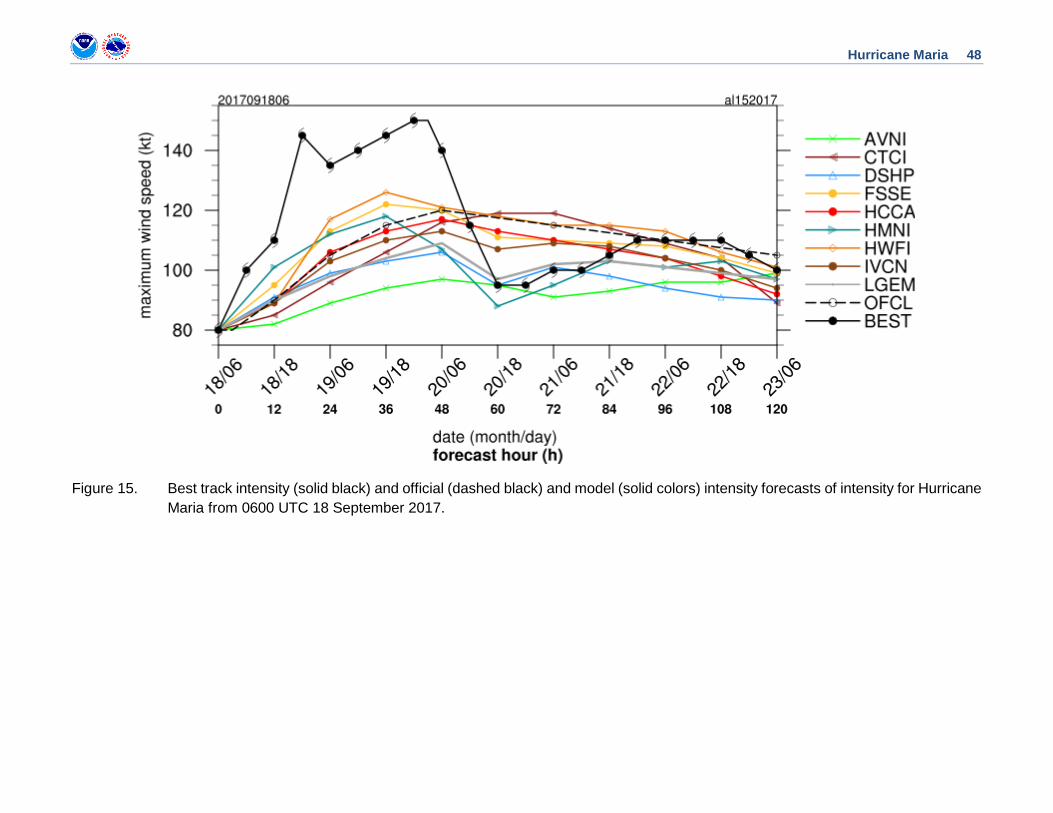
was anticipated. Figure 15 shows the various intensity guidance models for the forecast beginning at the onset of the episode, and it can be seen the guidance substantially underpredicted Maria’s strengthening. It should be noted that the SHIPS model Rapid Intensification Index showed a significant probability, i.e. about a 50% chance, of rapid intensification at this time and the official forecast showed considerable strengthening, but still not nearly enough strengthening. Notwithstanding, beginning with the second official forecast, every NHC forecast indicated that Maria would become a major hurricane by the time it reached Puerto Rico, which was a remarkable 84 h of lead time. In addition, NHC began to forecast Maria making landfall on that island as a category 4 hurricane about 54 h in advance.
NHC’s forecast for maximum storm surge inundation heights in Puerto Rico and the U.S. Virgin Islands (first issued at 1500 UTC 18 September) was 6 to 9 ft above ground level. Storm tide sensor data and high water mark observations indicate that maximum inundation of 6 to 9 ft above ground level occurred north of Maria’s landfall location on the eastern side of Puerto Rico. The initial forecast for maximum storm surge heights in North Carolina (issued at 2100 UTC 24 September) was 2 to 4 ft above ground level. Water level observations indicate that peak water levels were on the lower end of that forecast range.
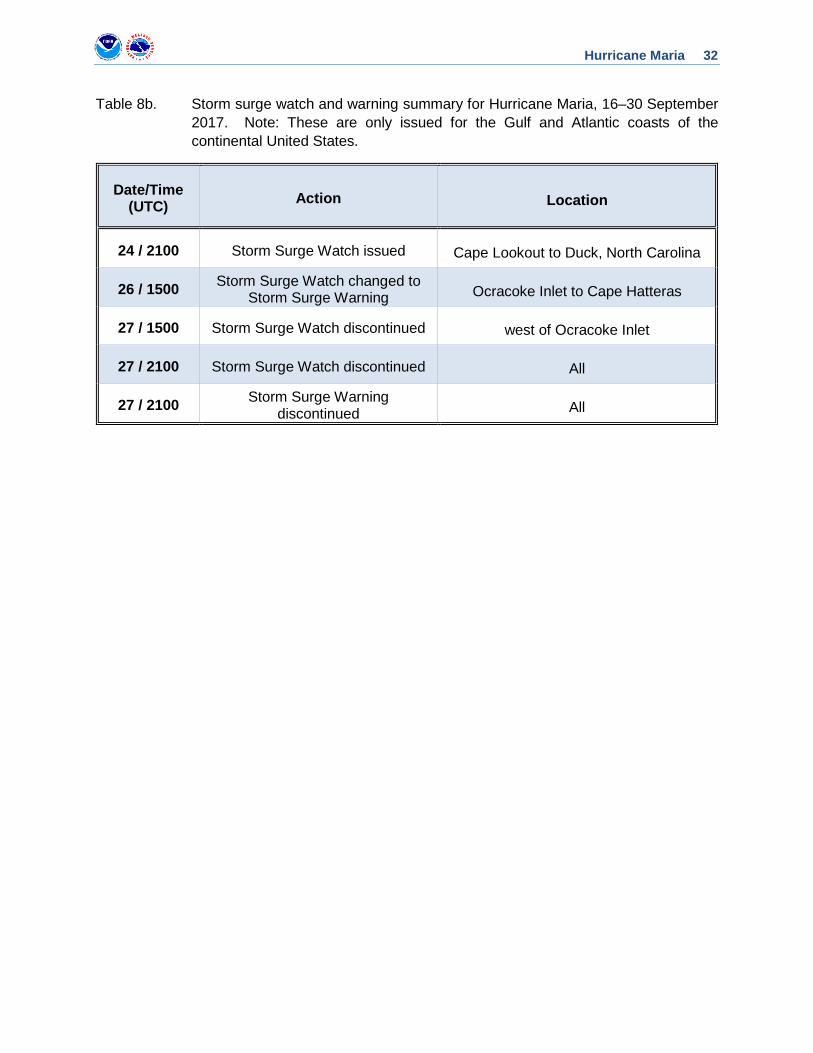
The NWS issued storm surge watches and warnings for portions of the North Carolina coast due to the potential for coastal inundation from Maria5. NWS first issued a Storm Surge Watch from Cape Lookout to Duck, North Carolina, including some portions of southern Pamlico and southern Albemarle Sounds, at 2100 UTC 24 September. The portion of that area from Ocracoke Inlet to Cape Hatteras was upgraded to a Storm Surge Warning at 1500 UTC 26 September. The water level observation from the U.S. Coast Guard station at Hatteras suggests that up to 3 ft of inundation (which NHC uses as a first-cut threshold for the storm surge watch/warning) may have occurred within the Storm Surge Warning area (Fig. 7).
Watches and warnings associated with Maria are given in Table 8. A Hurricane Warning was issued a little over 34 h before Maria made landfall in Dominica, and a little over 37 h before landfall in Puerto Rico.
In addition to its partners within the NWS, the NHC coordinated watches and warnings with a number of countries for areas around the Caribbean Sea, including Barbados (which has responsibility for Dominica), St. Lucia, France (for Martinique, Guadeloupe, and St. Martin), Antigua (which also has responsibility for Montserrat, St. Kitts, Nevis, Barbuda, Anguilla and the British Virgin Islands), the Netherlands (which has responsibility for Saba and St. Eustatius), St. Maarten, the Dominican Republic, and the Bahamas.
The NHC began providing Impact-Based Decision Support Services (IDSS) to emergency managers on 14 September, when Maria was a tropical wave in the central Atlantic and this IDSS continued through 27 September, when Maria moved away from the North Carolina coast. The IDSS included calls and briefings coordinated through the FEMA Hurricane Liaison Team, which is embedded at the NHC. The briefings included the Territories of Puerto Rico and the U.S. Virgin Islands, FEMA Regions 2 and 3, as well as Federal and state video-teleconferences.
5 Currently, storm surge watches and warnings are only issued for the Gulf and Atlantic coasts of the continental United States.
Hurricane Maria 10
The NHC also collaborated with affected NWS offices (primarily San Juan) to ensure a consistent message, and NWS meteorologists provided IDSS for local and state emergency management offices during Maria.
ACKNOWLEDGMENTS The authors thank the San Juan NWS Forecast Office (WFO) for providing information used in this report. Data from the National Data Buoy Center, NOS Center for Operational Oceanographic Products and Services, and United States Geological Survey were also used in this report. David Roth of the NOAA Weather Prediction Center produced the rainfall map.
Hurricane Maria 11
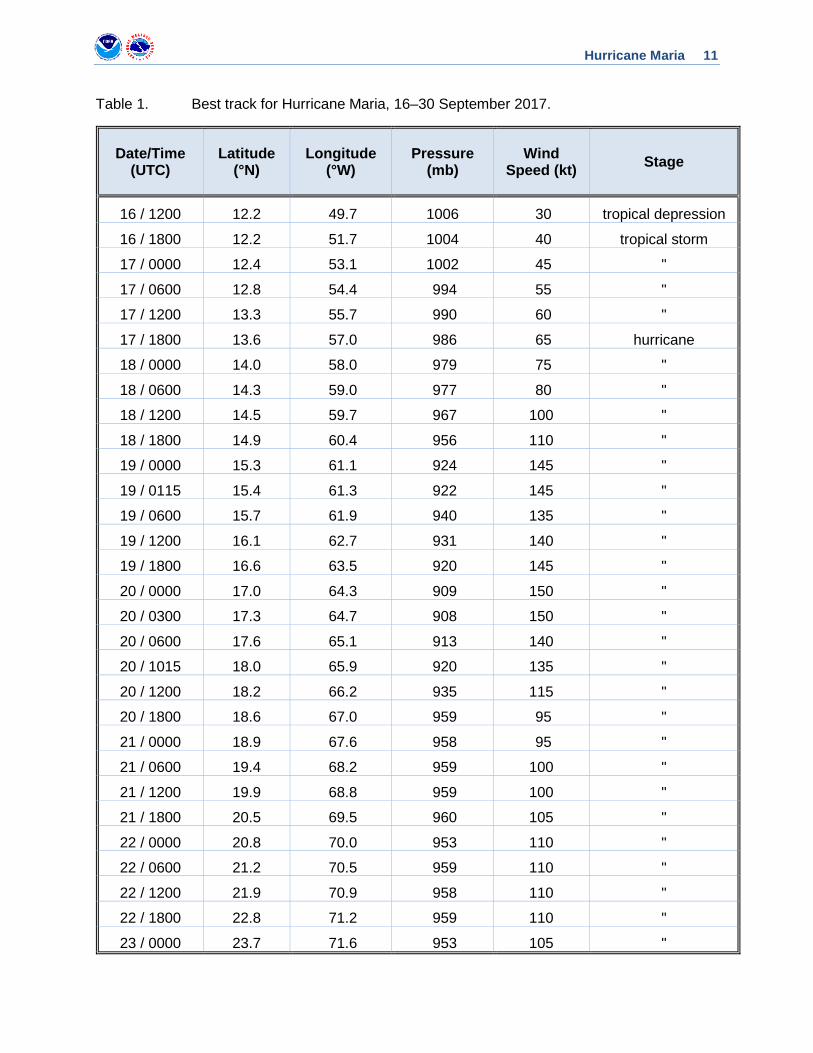
Table 1. Best track for Hurricane Maria, 16–30 September 2017.
Date/Time (UTC)
Latitude (°N)
Longitude (°W)
Pressure (mb)
Wind Speed (kt) Stage
16 / 1200 12.2 49.7 1006 30 tropical depression
16 / 1800 12.2 51.7 1004 40 tropical storm
17 / 0000 12.4 53.1 1002 45 "
17 / 0600 12.8 54.4 994 55 "
17 / 1200 13.3 55.7 990 60 "
17 / 1800 13.6 57.0 986 65 hurricane
18 / 0000 14.0 58.0 979 75 "
18 / 0600 14.3 59.0 977 80 "
18 / 1200 14.5 59.7 967 100 "
18 / 1800 14.9 60.4 956 110 "
19 / 0000 15.3 61.1 924 145 "
19 / 0115 15.4 61.3 922 145 "
19 / 0600 15.7 61.9 940 135 "
19 / 1200 16.1 62.7 931 140 "
19 / 1800 16.6 63.5 920 145 "
20 / 0000 17.0 64.3 909 150 "
20 / 0300 17.3 64.7 908 150 "
20 / 0600 17.6 65.1 913 140 "
20 / 1015 18.0 65.9 920 135 "
20 / 1200 18.2 66.2 935 115 "
20 / 1800 18.6 67.0 959 95 "
21 / 0000 18.9 67.6 958 95 "
21 / 0600 19.4 68.2 959 100 "
21 / 1200 19.9 68.8 959 100 "
21 / 1800 20.5 69.5 960 105 "
22 / 0000 20.8 70.0 953 110 "
22 / 0600 21.2 70.5 959 110 "
22 / 1200 21.9 70.9 958 110 "
22 / 1800 22.8 71.2 959 110 "
23 / 0000 23.7 71.6 953 105 "
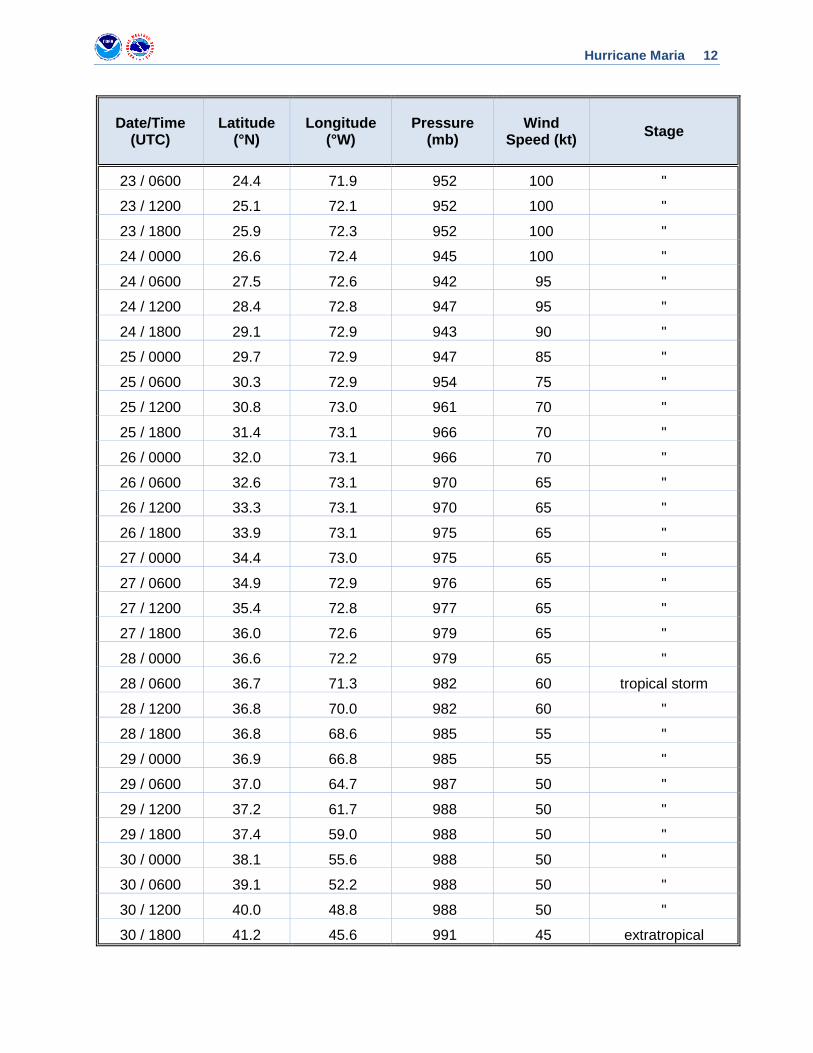
Hurricane Maria 12
Date/Time (UTC)
Latitude (°N)
Longitude (°W)
Pressure (mb)
Wind Speed (kt) Stage
23 / 0600 24.4 71.9 952 100 "
23 / 1200 25.1 72.1 952 100 "
23 / 1800 25.9 72.3 952 100 "
24 / 0000 26.6 72.4 945 100 "
24 / 0600 27.5 72.6 942 95 "
24 / 1200 28.4 72.8 947 95 "
24 / 1800 29.1 72.9 943 90 "
25 / 0000 29.7 72.9 947 85 "
25 / 0600 30.3 72.9 954 75 "
25 / 1200 30.8 73.0 961 70 "
25 / 1800 31.4 73.1 966 70 "
26 / 0000 32.0 73.1 966 70 "
26 / 0600 32.6 73.1 970 65 "
26 / 1200 33.3 73.1 970 65 "
26 / 1800 33.9 73.1 975 65 "
27 / 0000 34.4 73.0 975 65 "
27 / 0600 34.9 72.9 976 65 "
27 / 1200 35.4 72.8 977 65 "
27 / 1800 36.0 72.6 979 65 "
28 / 0000 36.6 72.2 979 65 "
28 / 0600 36.7 71.3 982 60 tropical storm
28 / 1200 36.8 70.0 982 60 "
28 / 1800 36.8 68.6 985 55 "
29 / 0000 36.9 66.8 985 55 "
29 / 0600 37.0 64.7 987 50 "
29 / 1200 37.2 61.7 988 50 "
29 / 1800 37.4 59.0 988 50 "
30 / 0000 38.1 55.6 988 50 "
30 / 0600 39.1 52.2 988 50 "
30 / 1200 40.0 48.8 988 50 "
30 / 1800 41.2 45.6 991 45 extratropical

Hurricane Maria 13
Date/Time (UTC)
Latitude (°N)
Longitude (°W)
Pressure (mb)
Wind Speed (kt) Stage
01 / 0000 42.2 42.6 994 45 "
01 / 0600 43.4 39.4 996 45 "
01 / 1200 44.9 35.5 999 45 "
01 / 1800 46.5 31.0 1003 45 "
02 / 0000 47.5 26.5 1005 40 "
02 / 0600 48.0 22.0 1012 40 "
02 / 1200 48.0 17.0 1016 30 "
02 / 1800 dissipated
20 / 0300 17.3 64.7 908 150 maximum wind and minimum pressure
19 / 0115 15.4 61.3 922 145 landfall in Dominica
20 / 1015 18.0 65.9 920 135 landfall near
Yabucoa, Puerto Rico
Hurricane Maria 14
Table 3. Selected ship reports with winds of at least 34 kt for Hurricane Maria, 16–30 September 2017.
Date/Time (UTC)
Ship call sign
Latitude
(°N)
Longitude
(°W) Wind
dir/speed (kt) Pressure
(mb)
19 / 0600 C6FM9 12.5 62.6 290 / 36 1015.3
23 / 1900 C6VV8 23.1 74.6 270 / 35 1007.6
23 / 2100 C6VV8 23.6 74.5 270 / 40 1007.6
25 / 0900 H3VU 36.1 75.3 050 / 36 1014.7
25 / 1400 C6VV8 33.5 76.4 050 / 45 1008.7
25 / 1600 C6VV8 33.9 76.1 050 / 40 1008.7
25 / 1800 9V9290 33.9 76.4 020 / 35 1011
25 / 1800 C6VV8 34.3 75.7 020 / 35 1010.6
25 / 2200 C6VV8 35.5 74.8 050 / 35 1011.6
26 / 1200 ELQQ4 33.9 76.6 330 / 35 1003
27 / 0600 WMCS 33.7 67.8 150 / 38 1010.2
27 / 0900 WMCS 33.1 68.4 160 / 38 1009
27 / 1800 V7SX3 37.4 69.8 140 / 40 1002.9
29 / 0200 ZCEK6 43.4 64.3 340 / 35 1003.4
29 / 0600 PBIG 40.9 70.9 010 / 35 1012
29 / 0600 ZCDM6 43.6 64.6 330 / 36 1005.8
29 / 0800 ZCEK6 41.9 66 350 / 40 1008
29 / 1700 VRGP2 35.8 60.1 210 / 55 1014
Hurricane Maria 15
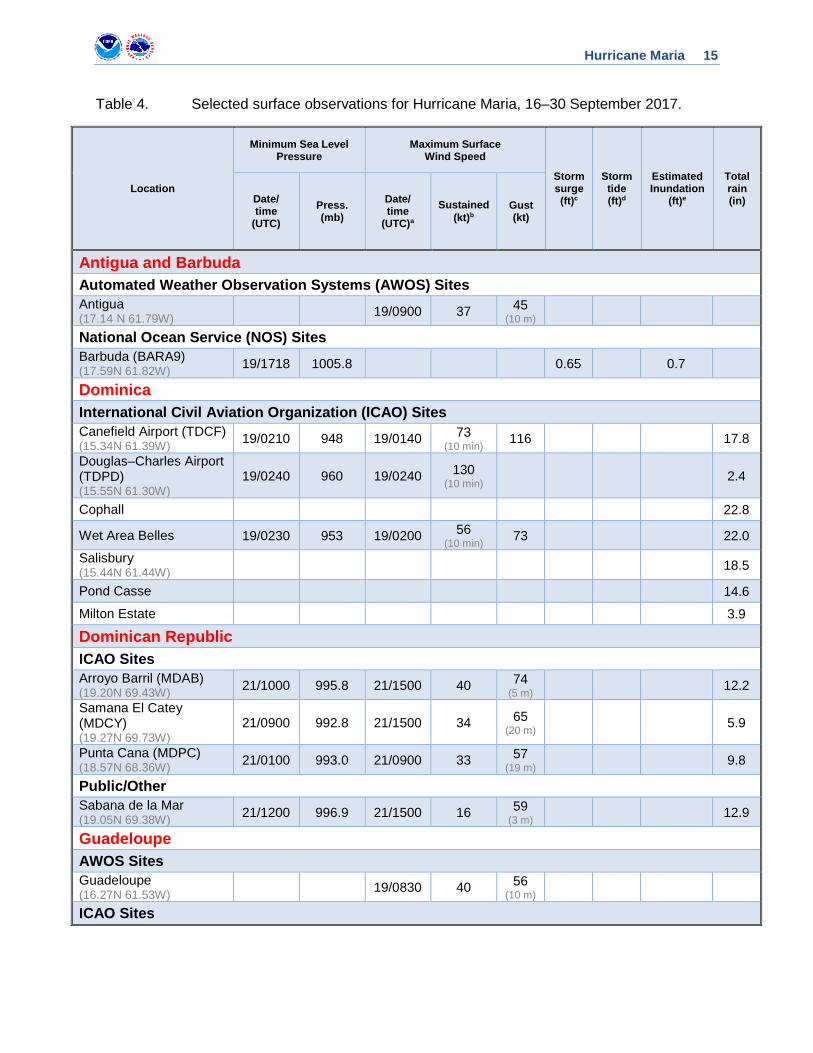
Table 4. Selected surface observations for Hurricane Maria, 16–30 September 2017.
Location
Minimum Sea Level Pressure
Maximum Surface Wind Speed
Storm surge (ft)c
Storm tide (ft)d
Estimated Inundation
(ft)e
Total rain (in) Date/
time (UTC)
Press. (mb)
Date/ time
(UTC)a
Sustained (kt)b
Gust (kt)
Antigua and Barbuda Automated Weather Observation Systems (AWOS) Sites Antigua (17.14 N 61.79W) 19/0900 37 45
(10 m)
National Ocean Service (NOS) Sites Barbuda (BARA9) (17.59N 61.82W) 19/1718 1005.8 0.65 0.7
Dominica International Civil Aviation Organization (ICAO) Sites Canefield Airport (TDCF) (15.34N 61.39W) 19/0210 948 19/0140 73
(10 min) 116 17.8
Douglas–Charles Airport (TDPD) (15.55N 61.30W)
19/0240 960 19/0240 130 (10 min) 2.4
Cophall 22.8
Wet Area Belles 19/0230 953 19/0200 56 (10 min) 73 22.0
Salisbury (15.44N 61.44W) 18.5
Pond Casse 14.6
Milton Estate 3.9
Dominican Republic ICAO Sites Arroyo Barril (MDAB) (19.20N 69.43W) 21/1000 995.8 21/1500 40 74
(5 m) 12.2
Samana El Catey (MDCY) (19.27N 69.73W)
21/0900 992.8 21/1500 34 65 (20 m) 5.9
Punta Cana (MDPC) (18.57N 68.36W) 21/0100 993.0 21/0900 33 57
(19 m) 9.8
Public/Other Sabana de la Mar (19.05N 69.38W) 21/1200 996.9 21/1500 16 59
(3 m) 12.9
Guadeloupe AWOS Sites Guadeloupe (16.27N 61.53W) 19/0830 40 56
(10 m)
ICAO Sites

Hurricane Maria 16
Location
Minimum Sea Level Pressure
Maximum Surface Wind Speed
Storm surge (ft)c
Storm tide (ft)d
Estimated Inundation
(ft)e
Total rain (in) Date/
time (UTC)
Press. (mb)
Date/ time
(UTC)a
Sustained (kt)b
Gust (kt)
Pointe-a-Pitre Le Raizet Airport (TFFR) (16.26N 61.52W)
19/0400 997.6 19/0500 45 67 (11 m) 10.2
Grand Bourg Les Basses Airport (TFFM) (15.87N 61.27W)
18/2300 996.6 18/2200 41f 66 (10 m) 2.1
La Desirade Grande Anse Airport (TFFA) (16.34N 61.00W)
19/0200 1003.6 18/2200 52f 67 (26 m)
Baillif Airport (TFFB) (16.01N 61.74W) 19/0200 50 80
(6 m) 10.4
Gourbeyre Gros-Morne Dole (16.00N 61.67W)
19/0106 88
Pointe-Noire Bellevue (16.23N 61.78W) 19/0236 86
North Carolina Weatherflow Sites KHK Resort (XRTH) (35.58N 75.47W) 27/1750 998.1 27/1655 42 51
(16 m)
Oregon Inlet CG (XORE) (35.77N 75.53W) 27/0640 999.7 27/1405 41 48
(10 m)
Jennettes Pier (XJNP) (35.911N 75.59W) 27/1805 1000.8 27/1600 41 48
(18 m)
Stumpy Point Tower (XSTP) (35.71N 75.77W)
27/1805 39 51 (98 m)
Pamlico Sound (XPM2) (35.43N 75.83W) 27/0731 997.7 26/1816 36 46
(13 m)
REAL Slick (XSLK) (35.57N 75.49W) 27/0735 999.3 27/1555 35 47
(6 m)
Alligator Bridge (XALI) (35.90N 76.01W) 27/0739 1000.8 26/2254 35 46
(12 m)
Frisco Woods (XFRI) (35.25N 75.63W) 27/0745 999.0 27/0145 35 45
(6 m)
Hatteras High (XHAT) (35.26N 75.55W) 27/0521 998.2 27/1616 34 44
(22 m)
Avon Ocean (XAVO) (35.35N 75.50W) 27/0719 998.7 26/2044 34 44
(12 m)
Ocracoke (XOCR) (35.14N 76.01W) 27/0725 1000.4 26/1640 34 42
(8 m)
National Data Buoy Center (NDBC) Sites Diamond Shoals (41025) (35.01N 75.40W) 27/0650 997.1 27/0550 36
(1 min) 47
(5 m)
NOS Sites
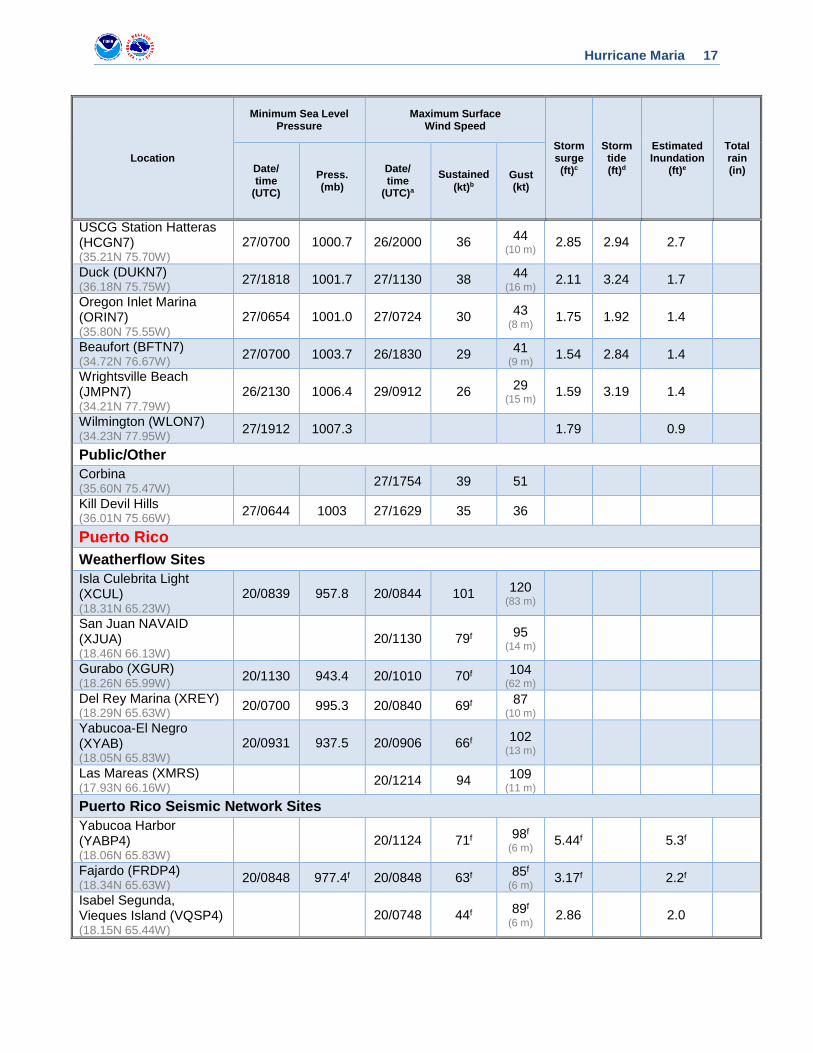
Hurricane Maria 17
Location
Minimum Sea Level Pressure
Maximum Surface Wind Speed
Storm surge (ft)c
Storm tide (ft)d
Estimated Inundation
(ft)e
Total rain (in) Date/
time (UTC)
Press. (mb)
Date/ time
(UTC)a
Sustained (kt)b
Gust (kt)
USCG Station Hatteras (HCGN7) (35.21N 75.70W)
27/0700 1000.7 26/2000 36 44 (10 m) 2.85 2.94 2.7
Duck (DUKN7) (36.18N 75.75W) 27/1818 1001.7 27/1130 38 44
(16 m) 2.11 3.24 1.7
Oregon Inlet Marina (ORIN7) (35.80N 75.55W)
27/0654 1001.0 27/0724 30 43 (8 m) 1.75 1.92 1.4
Beaufort (BFTN7) (34.72N 76.67W) 27/0700 1003.7 26/1830 29 41
(9 m) 1.54 2.84 1.4
Wrightsville Beach (JMPN7) (34.21N 77.79W)
26/2130 1006.4 29/0912 26 29 (15 m) 1.59 3.19 1.4
Wilmington (WLON7) (34.23N 77.95W) 27/1912 1007.3 1.79 0.9
Public/Other Corbina (35.60N 75.47W) 27/1754 39 51
Kill Devil Hills (36.01N 75.66W) 27/0644 1003 27/1629 35 36
Puerto Rico Weatherflow Sites Isla Culebrita Light (XCUL) (18.31N 65.23W)
20/0839 957.8 20/0844 101 120 (83 m)
San Juan NAVAID (XJUA) (18.46N 66.13W)
20/1130 79f 95 (14 m)
Gurabo (XGUR) (18.26N 65.99W) 20/1130 943.4 20/1010 70f 104
(62 m)
Del Rey Marina (XREY) (18.29N 65.63W) 20/0700 995.3 20/0840 69f 87
(10 m)
Yabucoa-El Negro (XYAB) (18.05N 65.83W)
20/0931 937.5 20/0906 66f 102 (13 m)
Las Mareas (XMRS) (17.93N 66.16W) 20/1214 94 109
(11 m)
Puerto Rico Seismic Network Sites Yabucoa Harbor (YABP4) (18.06N 65.83W)
20/1124 71f 98f (6 m) 5.44f 5.3f
Fajardo (FRDP4) (18.34N 65.63W) 20/0848 977.4f 20/0848 63f 85f
(6 m) 3.17f 2.2f
Isabel Segunda, Vieques Island (VQSP4) (18.15N 65.44W)
20/0748 44f 89f (6 m) 2.86 2.0

Hurricane Maria 18
Location
Minimum Sea Level Pressure
Maximum Surface Wind Speed
Storm surge (ft)c
Storm tide (ft)d
Estimated Inundation
(ft)e
Total rain (in) Date/
time (UTC)
Press. (mb)
Date/ time
(UTC)a
Sustained (kt)b
Gust (kt)
Arecibo (AROP4) (18.48N 66.70W) 20/1536 963.7 20/1342 69 98
(6 m) 2.40 1.9
NOS Sites San Juan, La Puntilla, San Juan Bay (SJNP4) (18.46N 66.12W)
20/1212 975.5f 20/0948 42f 61f (7 m) 2.35f 3.18f 2.4f
Mona Island (MISP4) (18.09N 67.94W) 20/2012 998.8 2.54 2.81 2.4
Mayaguez (MGZP4) (18.22N 67.16W) 20/1724 977.1 20/1948 52f 68f
(12 m) 2.56f 2.17f 1.4f
Culebra (CLBP4) (18.30N 65.30W) 20/0830 983.0 1.56 1.69 1.1
Esperanza, Viequez Island (ESPP4) (18.09N 65.47W)
20/0630 986.5f 20/0630 27f 53f (11 m) 0.99f 1.19f 0.8f
Magueyes Island (MGIP4) (17.97N 67.05W)
20/1224 993.4f 20/1148 38f 56f (8 m) 0.40f 0.91f 0.5f
RAWS Sites Camp Santiago (CSAP4) (18.01N 66.29W)
20/1109 55 103 (91 m) 7.56
Cabo Rojo (CRRP4) (18.08N 67.15W) 20/1857 43 70
(32 m) 7.92
Caribbean Integrated Coastal Ocean Observing System (CarICOOS) Buoys Vieques (41056) (18.26N 65.46W) 20/0820 977.4 20/0830 54f 64
(4 m)
Ponce (42085) (17.86N 66.52W) 20/1100 983.0 20/1600 51f 68
(4 m)
San Juan (41053) (18.47N 66.10W) 20/1320 981.5 20/1020 51f 66
(4 m)
Public/Other Yabucoa (18.04N 65.87W) 20/1009 926.6
Palmas Del Mar, Humacao (18.08N 65.80W)
20/0947 929.4
Caguas (CAIP4) (18.23N 66.04W) 37.90
Villalba (TOXP4) (18.13N 66.48W) 27.82
Caguas (BZDP4) (18.23N 66.04W) 23.43
Villalba (VINP4) (18.13N 66.48W) 22.95
Aibonito (AIBP4) (18.14N 66.27W) 22.79

Hurricane Maria 19
Location
Minimum Sea Level Pressure
Maximum Surface Wind Speed
Storm surge (ft)c
Storm tide (ft)d
Estimated Inundation
(ft)e
Total rain (in) Date/
time (UTC)
Press. (mb)
Date/ time
(UTC)a
Sustained (kt)b
Gust (kt)
Coamo (COAP4) (18.08N 66.35W) 19.38
Ciales (VILP4) (18.33N 66.47W) 19.23
Caguas (BZCP4) (18.23N 66.04W) 18.51
Utuado (VIVP4) (18.27N 66.70W) 18.38
Comerio (COMP4) (18.22N 66.22W) 17.50
Juncos 1 S (VALP4) (18.22N 65.93W) 16.86
Yauco (LLYP4) (18.03N 66.86W) 16.73
San Lorenzo (SLGP4) (18.19N 65.97W) 16.52
Bayamon (BAYP4) (18.38N 66.16W) 16.36
Caguas 6 WSW (CAHP4) (18.21N 66.11W)
15.91
San Lorenzo (SLEP4) (18.19N 65.97W) 15.22
Arecibo (ARFP4) (18.45N 66.73W) 14.71
Caguas 1 NE (CAMP4) (18.23N 66.04W) 13.56
Cidra (DRAP4) (18.17N 66.16W) 12.17
Aguas Buenas (BZAP4) (18.25N 66.11W) 12.15
Ponce (PRTP4) (17.98N 66.61W) 11.65
San German (MAOP4) (18.08N 67.05W) 11.12
Ponce (PRNP4) (17.98N 66.61W) 10.47
Utuado (UTHP4) (18.27N 66.70W) 10.11
Orocovis 6 SW (OROP4) (18.21N 66.48W)
9.76
Patillas 1 NE (PASP4) (18.02N 66.02W) 9.42
Juncos 7 ENE (GUSP4) (18.25N 65.83W) 9.3
Guanica (GCAP4) (17.97N 66.93W) 7.12
Hurricane Maria 20
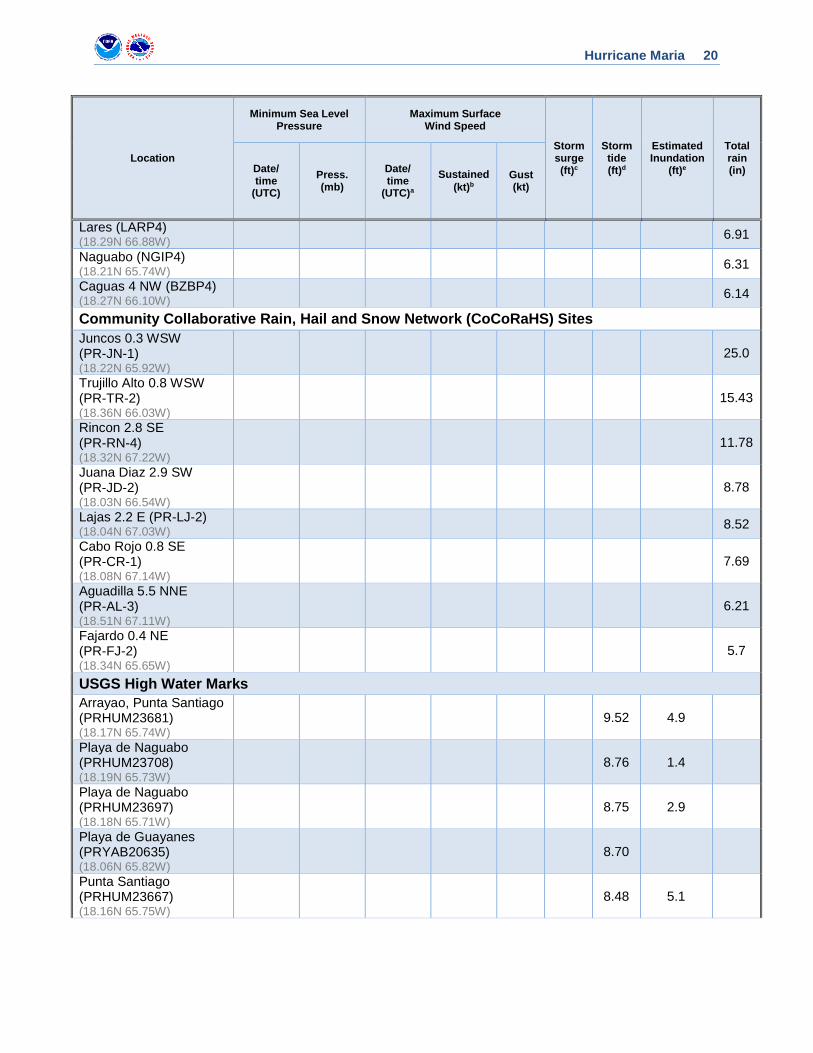
Location
Minimum Sea Level Pressure
Maximum Surface Wind Speed
Storm surge (ft)c
Storm tide (ft)d
Estimated Inundation
(ft)e
Total rain (in) Date/
time (UTC)
Press. (mb)
Date/ time
(UTC)a
Sustained (kt)b
Gust (kt)
Lares (LARP4) (18.29N 66.88W) 6.91
Naguabo (NGIP4) (18.21N 65.74W) 6.31 Caguas 4 NW (BZBP4) (18.27N 66.10W) 6.14
Community Collaborative Rain, Hail and Snow Network (CoCoRaHS) Sites Juncos 0.3 WSW (PR-JN-1) (18.22N 65.92W)
25.0
Trujillo Alto 0.8 WSW (PR-TR-2) (18.36N 66.03W)
15.43
Rincon 2.8 SE (PR-RN-4) (18.32N 67.22W)
11.78
Juana Diaz 2.9 SW (PR-JD-2) (18.03N 66.54W)
8.78
Lajas 2.2 E (PR-LJ-2) (18.04N 67.03W) 8.52
Cabo Rojo 0.8 SE (PR-CR-1) (18.08N 67.14W)
7.69
Aguadilla 5.5 NNE (PR-AL-3) (18.51N 67.11W)
6.21
Fajardo 0.4 NE (PR-FJ-2) (18.34N 65.65W)
5.7
USGS High Water Marks Arrayao, Punta Santiago (PRHUM23681) (18.17N 65.74W)
9.52 4.9
Playa de Naguabo (PRHUM23708) (18.19N 65.73W)
8.76 1.4
Playa de Naguabo (PRHUM23697) (18.18N 65.71W)
8.75 2.9
Playa de Guayanes (PRYAB20635) (18.06N 65.82W)
8.70
Punta Santiago (PRHUM23667) (18.16N 65.75W)
8.48 5.1
Hurricane Maria 21
Location
Minimum Sea Level Pressure
Maximum Surface Wind Speed
Storm surge (ft)c
Storm tide (ft)d
Estimated Inundation
(ft)e
Total rain (in) Date/
time (UTC)
Press. (mb)
Date/ time
(UTC)a
Sustained (kt)b
Gust (kt)
Marina Puerto Chico (PRFAJ20587) (18.35N 65.64W)
5.51
Playa Medio Mundo (PRCEI22309) (18.27N 65.63W)
5.23 2.5
USGS Storm Tide Sensors Ocean Park Beach, San Juan (PRSAN20648) (18.45N 66.04W)
7.95
Villa Pesquera (PRMAU22311) (17.99N 65.89W)
4.26
Juana Diaz (PRJUA22307) (17.99N 66.48W)
4.24
Playa Medio Mundo (PRCEI22309) (18.27N 65.63W)
4.21
Villa Pesquera Beach of Patillas (PRPAT22312) (17.98N 65.99W)
4.13
Malecon de Arroyo (PRARR22313) (17.96N 66.06W)
3.93
Jobos Bay (PRSAL22314) (17.95N 66.23W)
3.84
Marina Puerto Chico (PRFAJ20587) (18.35N 65.64W)
3.66
Villa Pesquera Santa Isabel (PRSAN22316) (17.96N 66.41W)
3.62
Dorado Public Beach (PRDOR20633) (18.48N 66.28W)
3.24
Playa de Ponce (PRPON22310) (17.98N 66.62W)
2.69
Saint Martin Cul-de-Sac (18.05 N 63.06W) 19/0316 38f 48
St. Eustatius
Hurricane Maria 22
Location
Minimum Sea Level Pressure
Maximum Surface Wind Speed
Storm surge (ft)c
Storm tide (ft)d
Estimated Inundation
(ft)e
Total rain (in) Date/
time (UTC)
Press. (mb)
Date/ time
(UTC)a
Sustained (kt)b
Gust (kt)
AWOS Sites St. Eustatius (17.49 N 62.98W) 19/1455 37 52
(10 m)
Turks and Caicos Islands Public/Other Grace Bay (21.80N 72.18W) 22/0930 41 48
U.S. Virgin Islands CarlCOOS Buoys South of St. John (41052) (18.25N 64.76W)
20/0700 992.5 20/0830 41 56 (4 m)
NOS Sites Lime Tree Bay, St. Croix (LTBV3) (17.70N 64.75W)
20/0342 976.1f 20/0330 60f 89f (10 m) 2.85f 3.17f 2.8f
Christiansted Harbor, St. Croix (CHSV3) (17.75N 64.70W)
20/0518 978.4 20/0142 43 65 (8 m) 2.27 2.36 2.0
Lameshur Bay, St. John (LAMV3) (18.32N 64.72W)
20/0612 998.2 1.48 1.61 1.2
Weatherflow Sites Sandy Point NWR, St. Croix (XCRX) (17.68N 64.90W)
20/0538 950.1 20/0618 93 119 (20 m)
Rupert Rock, St. Thomas (XRUP) (18.33N 64.93W)
20/0701 993.6 20/0201 39f 56 (5 m)
Public/Other Christiansted, St. Croix (CVAV3) (17.74N 64.62W)
20/0613 86 118 5.03
Virginia Weatherflow Sites Chesapeake Light Tower (XCLT) (36.90N 75.71W)
27/1951 998.8 27/1816 36 42 (41 m)
NDBC Buoy Sites Virginia Beach (44014) (36.61N 74.84W) 27/1750 998.5 27/1559 37
(1 min) 43
(5 m)
NOS Sites
Hurricane Maria 23
Location
Minimum Sea Level Pressure
Maximum Surface Wind Speed
Storm surge (ft)c
Storm tide (ft)d
Estimated Inundation
(ft)e
Total rain (in) Date/
time (UTC)
Press. (mb)
Date/ time
(UTC)a
Sustained (kt)b
Gust (kt)
Sewells Point (SWPV2) (36.94N 76.33W) 27/2030 1005.8 1.94 2.83 1.7
Chesapeake Bay Bridge Tunnel (CHBV2) (37.03N 76.08W)
27/2018 1005.0 26/1900 31 36 1.87 1.6
Wachapreague (WAHV2) (37.61N 75.69W)
27/2042 1004.9 27/1742 28 35 (9 m) 1.96 3.22 1.4
Kiptopeke (KPTV2) (37.17N 75.99W) 27/1624 21 27
(10 m) 1.66 2.37 1.3
Offshore NDBC Buoy Sites Caribbean Valley (42060) (16.41N 63.19W)
19/1500 955.7 19/1442 74 (1 min)
82 (4 m)
NE Bahamas (41047) (27.52N 71.53W) 24/0630 987.4 24/0154 58
(1 min) 74
(4 m)
South Hatteras (41002) (31.76N 74.84W) 26/0250 992.4 25/2350 41
(5 min) 52
(5 m)
East Bahamas (41046) (23.83N 68.42W) 22/2210 1004.9 22/2055 37
(1 min) 45
(4 m)
West Bermuda (41048) (31.86N 69.59W) 25/2000 1007.0 25/0808 35
(1 min) 39
(5 m)
a Date/time is for sustained wind when both sustained and gust are listed. b Except as noted, sustained wind averaging periods for C-MAN and land-based reports are 2 min; buoy averaging
periods are 8 min. c Storm surge is water height above normal astronomical tide level. d Storm tide is water height above the North American Vertical Datum of 1988 (NAVD88) in the continental United
States, the Puerto Rico Vertical Datum of 2002 (PRVD02) in Puerto Rico, and the Virgin Islands Vertical Datum of 2009 (VIVD09) in the U.S. Virgin Islands.
e Estimated inundation is the maximum height of water above ground. For tide gauges, the height of the water above Mean Higher High Water (MHHW) is used as a proxy for inundation.
f Incomplete Data
Hurricane Maria 24
Table 5. Number of hours in advance of the formation of Maria associated with the first NHC Tropical Weather Outlook forecast in the indicated likelihood category. Note that the timings for the “Low” category do not include forecasts of a 0% chance of genesis.
Hours Before Genesis
48-Hour Outlook 120-Hour Outlook
Low (<40%) 60 60
Medium (40%-60%) 30 54
High (>60%) 18 42
Table 6a. NHC official (OFCL) and climatology-persistence skill baseline (OCD5) track forecast errors (n mi) for Maria. Mean errors for the previous 5-yr period are shown for comparison. Official errors that are smaller than the 5-yr means are shown in boldface type.
Forecast Period (h)
12 24 36 48 72 96 120
OFCL 12.9 20.5 26.8 35.8 58.3 85.0 122.2
OCD5 29.3 69.9 112.2 149.2 191.9 214.2 225.2
Forecasts 55 53 51 49 45 41 37
OFCL (2012-16) 24.9 39.6 54.0 71.3 105.8 155.4 208.9
OCD5 (2012-16) 47.3 103.9 167.8 230.3 343.1 442.6 531.0

Hurricane Maria 25
Table 6b. Homogeneous comparison of selected track forecast guidance models (in n mi) for Maria. Errors smaller than the NHC official forecast are shown in boldface type. The number of official forecasts shown here will generally be smaller than that shown in Table 6a due to the homogeneity requirement.
Model ID Forecast Period (h)
12 24 36 48 72 96 120
OFCL 12.6 19.5 24.6 33.9 54.3 85.1 126.6
OCD5 28.8 69.1 107.6 135.1 163.6 210.7 220.2
GFSI 15.2 24.2 30.8 35.4 47.8 95.6 130.5
HWFI 21.0 35.2 44.9 43.7 55.9 97.5 163.4
HMNI 18.4 30.1 37.3 44.1 61.4 81.4 107.6
EGRI 15.4 28.9 41.7 54.8 73.7 102.1 134.8
EMXI 12.4 20.7 28.2 42.1 84.3 138.1 177.8
CMCI 15.3 25.7 37.2 46.9 58.9 100.4 174.6
CTCI 15.8 27.7 39.1 49.9 81.5 119.4 157.6
TCON 14.9 25.0 33.0 38.3 49.3 79.0 99.0
TVCA 13.5 21.9 29.0 35.8 54.3 81.3 106.2
TVCX 12.7 20.8 28.4 35.3 57.6 85.3 112.6
GFEX 12.5 20.1 25.7 33.1 58.3 94.3 135.9
HCCA 12.2 20.9 28.1 35.0 58.1 84.7 107.0
FSSE 14.5 23.0 30.8 36.7 62.6 84.7 111.9
AEMI 15.7 24.1 31.5 35.9 51.9 108.2 152.4
TABS 36.0 53.5 50.6 61.5 62.5 95.6 144.0
TABM 20.4 39.7 50.6 42.2 62.8 119.4 137.9
TABD 20.4 39.7 50.6 42.2 62.8 119.4 137.9
Forecasts 47 45 43 41 38 37 33

Hurricane Maria 26
Table 7a. NHC official (OFCL) and climatology-persistence skill baseline (OCD5) intensity forecast errors (kt) for Maria. Mean errors for the previous 5-yr period are shown for comparison. Official errors that are smaller than the 5-yr means are shown in boldface type.
Forecast Period (h)
12 24 36 48 72 96 120
OFCL 6.6 10.6 13.0 14.5 12.2 8.8 8.1
OCD5 8.5 13.7 17.3 18.7 15.5 12.2 14.6
Forecasts 55 53 51 49 45 41 37
OFCL (2012-16) 5.5 8.2 10.5 12.0 13.4 14.0 14.5
OCD5 (2012-16) 7.1 10.5 13.0 15.1 17.4 18.2 20.6
Hurricane Maria 27
Table 7b. Homogeneous comparison of selected intensity forecast guidance models (in kt) for Maria. Errors smaller than the NHC official forecast are shown in boldface type. The number of official forecasts shown here will generally be smaller than that shown in Table 7a due to the homogeneity requirement.
Model ID Forecast Period (h)
12 24 36 48 72 96 120
OFCL 6.7 11.0 13.8 15.2 12.0 8.4 7.7
OCD5 8.5 14.0 17.6 18.5 14.1 11.2 14.2
HWFI 7.2 10.4 13.1 14.3 11.0 8.6 8.8
HMNI 7.6 12.1 14.0 14.7 14.4 12.8 14.6
DSHP 8.4 14.7 19.1 20.4 16.1 14.1 15.0
LGEM 7.3 12.2 15.7 16.7 10.3 7.6 8.4
ICON 7.0 11.6 15.1 15.8 10.1 7.1 9.0
IVCN 7.1 11.7 15.3 15.9 9.9 5.4 7.3
CTCI 8.6 12.6 17.2 18.1 13.6 7.6 8.5
GFSI 9.9 16.7 21.4 22.3 18.9 15.7 13.5
EMXI 10.6 17.5 22.8 25.5 24.9 23.1 27.5
HCCA 7.1 11.5 14.8 15.0 9.9 3.7 7.3
FSSE 6.2 9.3 11.8 12.5 9.4 6.1 4.5
Forecasts 49 47 45 43 40 38 35
Hurricane Maria 28
Table 8a. Wind watch and warning summary for Hurricane Maria, 16–30 September 2017.
Date/Time (UTC) Action Location
16 / 1500 Tropical Storm Watch issued St. Lucia
16 / 1500 Tropical Storm Watch issued Martinique
16 / 1500 Tropical Storm Watch issued Guadeloupe
16 / 1500 Tropical Storm Watch issued Dominica
16 / 1800 Tropical Storm Watch issued Barbados
16 / 1800 Tropical Storm Watch issued St. Vincent/Grenadines
16 / 2100 Hurricane Watch issued Antigua/Barbuda/St. Kitts/Nevis/Montserrat
17 / 0000 Tropical Storm Watch changed to Hurricane Watch Guadeloupe
17 / 0300 Hurricane Watch issued Saba/St. Eustatius
17 / 0300 Hurricane Watch issued St. Maarten
17 / 0300 Hurricane Watch issued Anguilla
17 / 0900 Tropical Storm Watch changed to Hurricane Watch Dominica
17 / 1200 Hurricane Watch issued St. Martin/St. Barthelemy
17 / 1500 Tropical Storm Watch changed to Tropical Storm Warning St. Lucia
17 / 1500 Hurricane Watch changed to Hurricane Warning Dominica
17 / 1800 Tropical Storm Watch changed to Tropical Storm Warning Martinique
17 / 1800 Hurricane Watch changed to Hurricane Warning Guadeloupe
17 / 2100 Tropical Storm Warning issued Antigua/Barbuda
17 / 2100 Tropical Storm Warning issued Saba/St. Eustatius
17 / 2100 Hurricane Watch discontinued Antigua/Barbuda/St. Kitts/Nevis/Montserrat
17 / 2100 Hurricane Watch issued U.S. Virgin Islands
17 / 2100 Hurricane Watch issued British Virgin Islands
17 / 2100 Hurricane Warning issued St. Kitts/Nevis/Montserrat
Hurricane Maria 29
Date/Time (UTC) Action Location
18 / 0000 Tropical Storm Warning changed to Hurricane Warning Martinique
18 / 0900 Hurricane Watch issued Puerto Rico/Vieques/Culebra
18 / 1200 Tropical Storm Warning changed to Hurricane Warning St. Lucia
18 / 1200 Tropical Storm Warning issued St. Maarten
18 / 1500 Hurricane Watch changed to Hurricane Warning U.S. Virgin Islands
18 / 1500 Hurricane Watch changed to Hurricane Warning British Virgin Islands
18 / 1500 Tropical Storm Warning issued Anguilla
18 / 1800 Tropical Storm Watch discontinued Barbados
18 / 2100 Hurricane Watch changed to Hurricane Warning Puerto Rico/Vieques/Culebra
18 / 2100 Hurricane Warning changed to Tropical Storm Warning St. Lucia
18 / 2100 Tropical Storm Watch issued Puerto Plata to Northern DR/Haiti Border, Dominican Republic
18 / 2100 Hurricane Watch issued Isla Saona to Puerto Plata, Dominican Republic
19 / 0000 Hurricane Warning changed to Tropical Storm Warning Martinique
19 / 1200 Tropical Storm Watch discontinued St. Vincent/Grenadines
19 / 1200 Tropical Storm Warning discontinued St. Lucia
19 / 1800 Tropical Storm Watch changed to Tropical Storm Warning
Puerto Plata to Northern DR/Haiti Border, Dominican Republic
19 / 1800 Hurricane Warning changed to Tropical Storm Warning Guadeloupe
19 / 1800 Tropical Storm Warning discontinued Martinique
19 / 1800 Tropical Storm Warning issued Cabo Engano to Punta Palenque, Dominican Republic
19 / 1800 Hurricane Watch modified to Isla Saona to Cabo Engano, Dominican Republic
Hurricane Maria 30
Date/Time (UTC) Action Location
19 / 1800 Hurricane Warning issued Cabo Engano to Puerto Plata, Dominican Republic
19 / 2100 Tropical Storm Warning discontinued Antigua/Barbuda
19 / 2100 Hurricane Watch issued Turks and Caicos Islands/Southeastern Bahamas
19 / 2100 Hurricane Warning discontinued Dominica
20 / 0000 Tropical Storm Warning discontinued Anguilla
20 / 0000 Hurricane Watch discontinued Anguilla
20 / 0000 Hurricane Warning discontinued St. Kitts/Nevis/Montserrat
20 / 0600 Tropical Storm Warning changed to Hurricane Watch Saba/St. Eustatius
20 / 0600 Tropical Storm Warning issued Saba
20 / 0900 Hurricane Watch changed to Hurricane Warning
Turks and Caicos Islands/Southeastern Bahamas
20 / 0900 Tropical Storm Warning discontinued Guadeloupe
20 / 0900 Hurricane Watch discontinued Saba/St. Eustatius
20 / 1200 Hurricane Watch changed to Tropical Storm Warning St. Martin/St. Barthelemy
20 / 1500 Tropical Storm Warning discontinued Saba
20 / 1500 Tropical Storm Warning discontinued St. Maarten
20 / 1500 Tropical Storm Warning discontinued St. Martin/St. Barthelemy
20 / 1500 Hurricane Watch discontinued St. Maarten
20 / 2100 Hurricane Warning discontinued U.S. Virgin Islands
20 / 2100 Hurricane Warning discontinued British Virgin Islands
21 / 0300 Hurricane Warning discontinued Puerto Rico/Vieques/Culebra
21 / 1200 Tropical Storm Watch issued Central Bahamas
21 / 1500 Tropical Storm Warning modified to
Cabo Engano to Andres/Boca Chica, Dominican Republic
21 / 1500 Hurricane Watch discontinued All

Hurricane Maria 31
Date/Time (UTC) Action Location
21 / 2100 Tropical Storm Warning discontinued
Cabo Engano to Andres/Boca Chica, Dominican Republic
22 / 1200 Tropical Storm Watch changed to Tropical Storm Warning Central Bahamas
22 / 1500 Tropical Storm Warning discontinued
Puerto Plata to Northern DR/Haiti Border, Dominican Republic
22 / 1500 Hurricane Warning discontinued Cabo Engano to Puerto Plata, Dominican Republic
22 / 2100 Hurricane Warning changed to Tropical Storm Warning
Turks and Caicos Islands/Southeastern Bahamas
23 / 0900 Tropical Storm Warning discontinued All
24 / 2100 Tropical Storm Watch issued Surf City to North Carolina/Virginia Border
24 / 2100 Tropical Storm Watch issued Pamlico Sound
24 / 2100 Tropical Storm Watch issued Albemarle Sound
25 / 0900 Tropical Storm Watch changed to Tropical Storm Warning Pamlico Sound
25 / 0900 Tropical Storm Watch changed to Tropical Storm Warning Albemarle Sound
25 / 0900 Tropical Storm Watch modified to Duck to North Carolina/Virginia Border
25 / 0900 Tropical Storm Warning issued Cape Lookout to Duck
25 / 2100 Tropical Storm Watch discontinued All
25 / 2100 Tropical Storm Warning discontinued Cape Lookout to Duck
25 / 2100 Tropical Storm Warning issued Bogue Inlet to North Carolina/Virginia Border
27 / 1500 Tropical Storm Warning modified to
Ocracoke Inlet to North Carolina/Virginia Border
27 / 2100 Tropical Storm Warning modified to
Cape Hatteras to North Carolina/Virginia Border
28 / 0000 Tropical Storm Warning discontinued All
Hurricane Maria 32
Table 8b. Storm surge watch and warning summary for Hurricane Maria, 16–30 September 2017. Note: These are only issued for the Gulf and Atlantic coasts of the continental United States.
Date/Time (UTC) Action Location
24 / 2100 Storm Surge Watch issued Cape Lookout to Duck, North Carolina
26 / 1500 Storm Surge Watch changed to Storm Surge Warning Ocracoke Inlet to Cape Hatteras
27 / 1500 Storm Surge Watch discontinued west of Ocracoke Inlet
27 / 2100 Storm Surge Watch discontinued All
27 / 2100 Storm Surge Warning discontinued All
Hurricane Maria 33
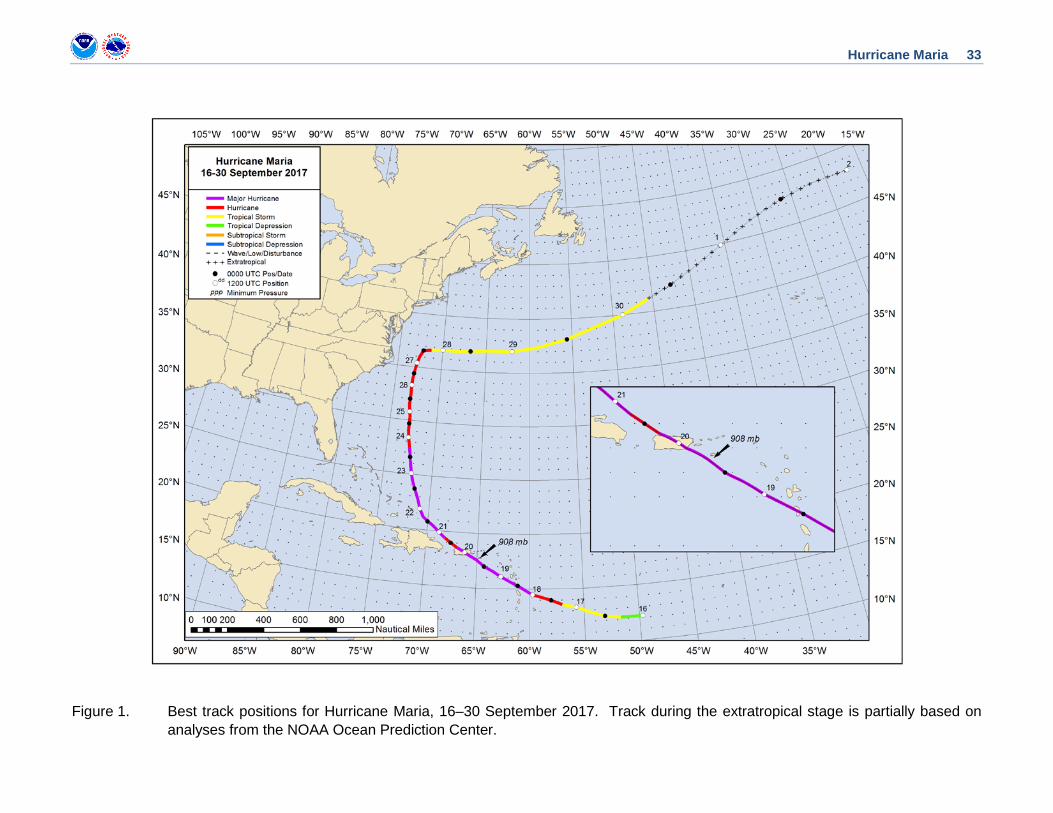
Figure 1. Best track positions for Hurricane Maria, 16–30 September 2017. Track during the extratropical stage is partially based on analyses from the NOAA Ocean Prediction Center.
Hurricane Maria 34
Figure 2. Selected wind observations and best track maximum sustained surface wind speed curve for Hurricane Maria, 16–30 September 2017. Aircraft observations have been adjusted for elevation using 90%, 80%, and 80% adjustment factors for observations from 700 mb, 850 mb, and 1500 ft, respectively. Dropwindsonde observations include actual 10 m winds (sfc), as well as surface estimates derived from the mean wind over the lowest 150 m of the wind sounding (LLM). Advanced Dvorak Technique estimates represent the Current Intensity at the nominal observation time. AMSU intensity estimates are from the Cooperative Institute for Meteorological Satellite Studies technique. Dashed vertical lines correspond to 0000 UTC, and solid vertical lines correspond to landfalls.
2030405060708090
100110120130140150160
9/15 9/17 9/19 9/21 9/23 9/25 9/27 9/29 10/1 10/3
BEST TRACKSat (TAFB)Sat (SAB)ADTAC (sfc)AC (flt->sfc)AC (DVK P->W)ScatterometerSurfaceDrop (sfc)Drop (LLM xtrp)AMSUAnalysis
Win
d Sp
eed
(kt)
Date (Month/Day)
Hurricane Maria16 - 30 September 2017
Hurricane Maria 35
Figure 3. Selected pressure observations and best track minimum central pressure curve for Hurricane Maria, 16–30 September 2017. Advanced Dvorak Technique estimates represent the Current Intensity at the nominal observation time. AMSU intensity estimates are from the Cooperative Institute for Meteorological Satellite Studies technique. KZC P-W refers to pressure estimates derived using the Knaff-Zehr-Courtney pressure-wind relationship. Dashed vertical lines correspond to 0000 UTC, and solid vertical lines correspond to landfalls.
910
920
930
940
950
960
970
980
990
1000
1010
9/14 9/16 9/18 9/20 9/22 9/24 9/26 9/28 9/30 10/2
BEST TRACKKZC P-WSat (TAFB)Sat (SAB)ADTAMSUAC (sfc)SurfaceAnalysis
Pres
sure
(mb)
Date (Month/Day)
Hurricane Maria16-30 September 2017
Hurricane Maria 36
Figure 4a. San Juan WSR-88D radar image of Hurricane Maria near peak intensity at 0301 UTC 20 September, showing the beginning of an eyewall replacement.
Hurricane Maria 37
Figure 4b. San Juan WSR-88D radar image of Hurricane Maria at 0950 UTC 20 September, just before landfall in Puerto Rico, showing the more dominant outer eyewall. This was the last image from the radar before it was destroyed.
Hurricane Maria 38
Figure 5. Estimated storm surge inundation (feet above ground level) based on an analysis of water level observations along the coasts of Puerto Rico and the U.S. Virgin Islands from Hurricane Maria. Image courtesy of the NHC Storm Surge Unit.
Hurricane Maria 39
Figure 6. Maximum water levels (feet) measured from tide gauges along the coasts of Puerto Rico and the U.S. Virgin Islands during Hurricane Maria. Water levels are referenced above Mean Higher High Water (MHHW), which is used as a proxy for inundation (above ground level) on normally dry ground along the immediate coastline. Asterisks denote incomplete data. Image courtesy of the NHC Storm Surge Unit.
Hurricane Maria 40
Figure 7. Maximum water levels (feet) measured from tide gauges along the coast of North Carolina during Hurricane Maria and areas covered by storm surge warnings (magenta) and watches (lavender). Water levels are referenced above Mean Higher High Water (MHHW), which is used as a proxy for inundation (above ground level) on normally dry ground along the immediate coastline. Image courtesy of the NHC Storm Surge Unit.
Hurricane Maria 41
Figure 8. Storm total rainfall (inches) from Hurricane Maria. Figure courtesy of David Roth, NOAA Weather Prediction Center.
Hurricane Maria 42
Figure 9. Maria’s damage in Dominica. Photo credits, clockwise from upper left: WIC News, responsibletravel.com, AFP/Getty Images, Tomás Ayuso/IRIN.
Hurricane Maria 43
Figure 10. The remnants of the San Juan WSR-88D radar after its destruction by Hurricane Maria. Photo credit: WFO San Juan.
Hurricane Maria 44
Figure 11. Maria’s damage in Puerto Rico. Damage to St. Croix is shown in the lower right panel. Photo credits, clockwise from upper left: U.S. Air Force, VOA News, Reuters/Jonathan Drake, Hector Retamal/AFP/Getty Images.
Hurricane Maria 45
(a)
(b)
(c)
(d)
Figure 12. Mean sea-level pressure (black contours, 1-hPa intervals) and 10-m winds (shading and vectors) from (a,c) GFS and (b,d) ECMWF forecasts valid at the time of genesis for Hurricane Maria (1200 UTC September 16). Panels (a) and (b) correspond to 96-h forecasts and (c) and (d) are 120-h forecasts. Red dots indicate the location of Maria’s center at the time of genesis.

Hurricane Maria 46
Figure 13. Mean official track forecast errors for Maria (black) and long-term (2012–2016) mean Atlantic basin track errors (red), in n mi.
Hurricane Maria 47
Figure 14. All official track forecasts for Maria from the time of genesis (1200 UTC 16 September) up to shortly before landfall in Puerto Rico (0000 UTC 20 September).
Hurricane Maria 48
Figure 15. Best track intensity (solid black) and official (dashed black) and model (solid colors) intensity forecasts of intensity for Hurricane Maria from 0600 UTC 18 September 2017.