Embed Size (px)
Citation preview
Atlantic Basin Seasonal Hurricane Prediction
Phil Klotzbach
Department of Atmospheric Science
Colorado State University
National Tropical Weather Conference
April 9, 2015
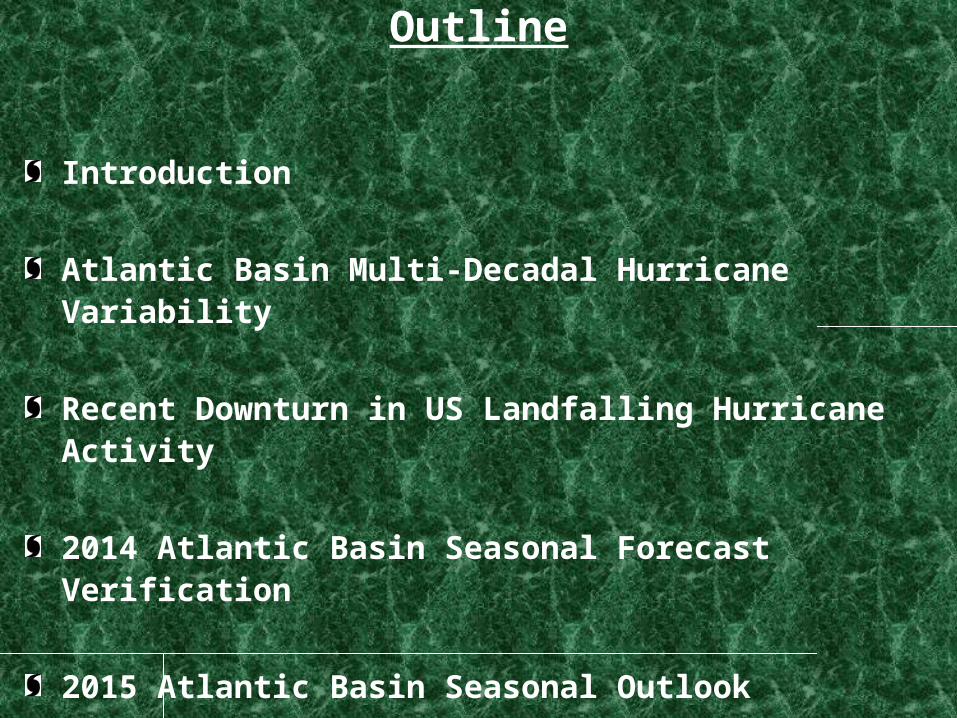
Outline
Introduction
Atlantic Basin Multi-Decadal Hurricane Variability
Recent Downturn in US Landfalling Hurricane Activity
2014 Atlantic Basin Seasonal Forecast Verification
2015 Atlantic Basin Seasonal Outlook


“It's tough to make predictions, especially about the future”
HOWEVER…
“You can see a lot by looking”
Yogi Berra

August – October SSTs: Ten Most Active – Ten Least Active Atlantic Hurricane Seasons Since 1950

b – La Niña
a – El Niño


1900-25 1926-69 1970-94 1995-14
Cat 3-4-5 13 28 10 32
13
28
10
32
Annual Number of 6 Hour Periods for Cat 3-4-5
Hurricanes


THC (or AMO)
STRONG
THC (or AMO)
WEAK

1 2
3
H
H
Courtesy of John Marshall (MIT)

1860 1900 1940 1980 2020
Goldenberg et al. (2001)


1915-1964 50 YEARS 23
MH
65
54
44
50
60
59
60
54
55
54
55
45
47
49
48
38
35
29
26
28 3
3
1965-2014 50 YEARS 9
MH
89
85
04
05 0
4
92
96
40% as frequent
U.S. MAJOR HURRICANE IMPACTS
21
19
65
93


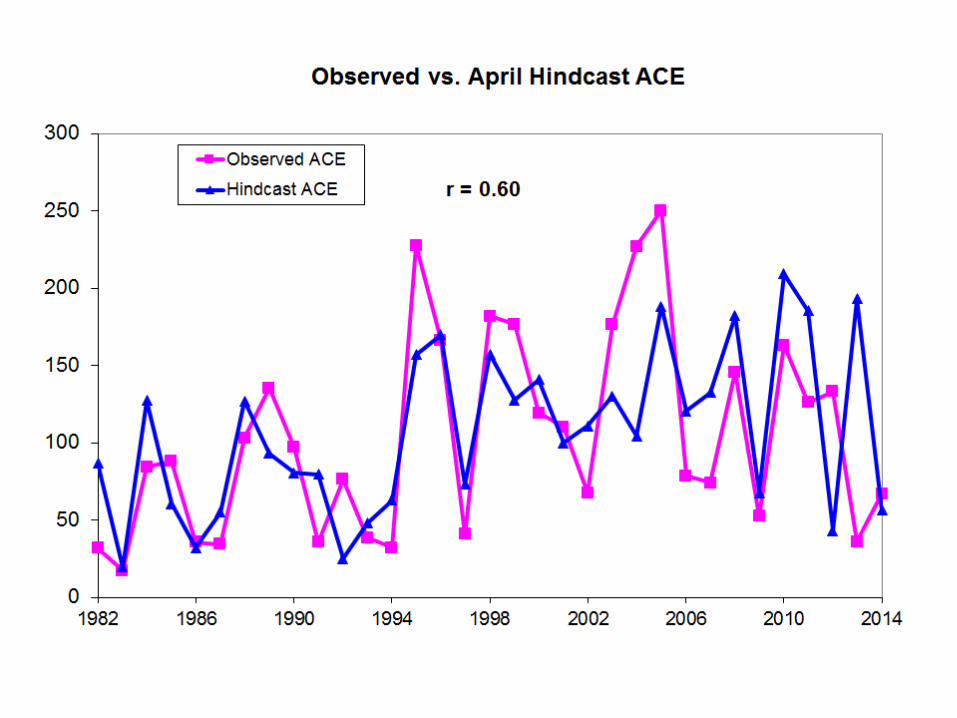
2014 Atlantic Hurricane Season Forecast Verification
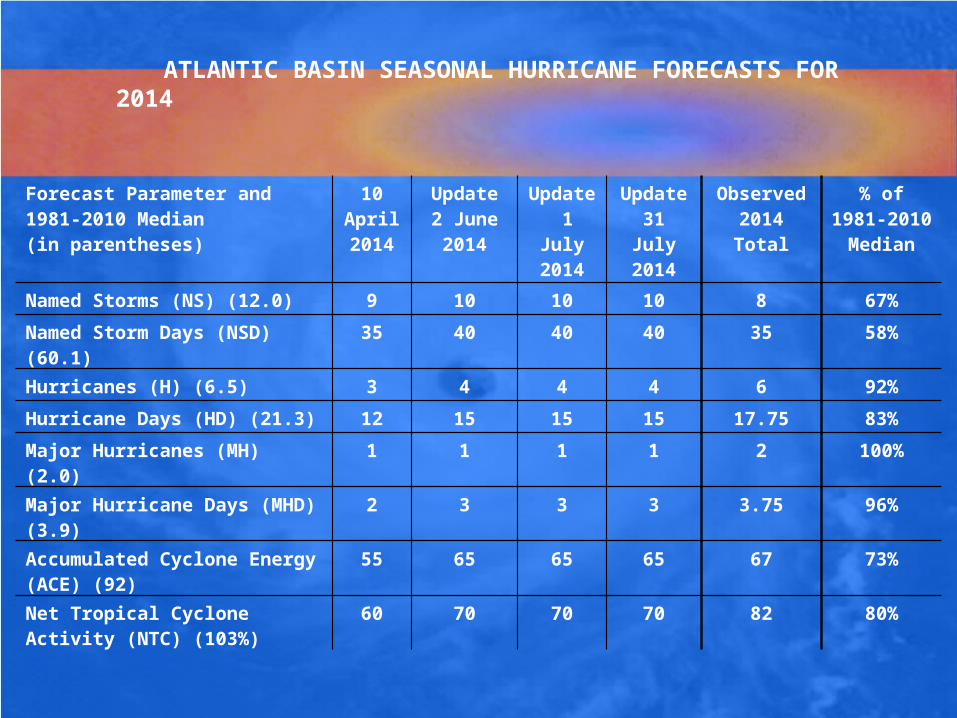
ATLANTIC BASIN SEASONAL HURRICANE FORECASTS FOR 2014
Forecast Parameter and 1981-2010 Median(in parentheses)
10 April 2014
Update2 June 2014
Update 1 July 2014
Update31 July
2014
Observed 2014 Total
% of 1981-2010
Median
Named Storms (NS) (12.0) 9 10 10 10 8 67%
Named Storm Days (NSD) (60.1) 35 40 40 40 35 58%
Hurricanes (H) (6.5) 3 4 4 4 6 92%
Hurricane Days (HD) (21.3) 12 15 15 15 17.75 83%
Major Hurricanes (MH) (2.0) 1 1 1 1 2 100%
Major Hurricane Days (MHD) (3.9) 2 3 3 3 3.75 96%
Accumulated Cyclone Energy (ACE) (92)
55 65 65 65 67 73%
Net Tropical Cyclone Activity (NTC) (103%)
60 70 70 70 82 80%


Relative Humidity Anomalies (600 mb) from mid-Aug to mid-Oct


2015 Atlantic Hurricane Season Initial Outlook

Forecast ParameterStatistical Forecast
Final Forecast
1981-2010 Median
Named Storms (NS) 7.4 7 12.0
Named Storm Days (NSD) 28.0 30 60.1
Hurricanes (H) 3.5 3 6.5
Hurricane Days (HD) 9.0 10 21.3
Major Hurricanes (MH) 0.7 1 2.0
Major Hurricane Days (MHD) 0.4 0.5 3.9
Accumulated Cyclone Energy (ACE) 38 40 92
Net Tropical Cyclone Activity (NTC) 44 45 103
2015 FORECAST AS OF 9 APRIL 2015
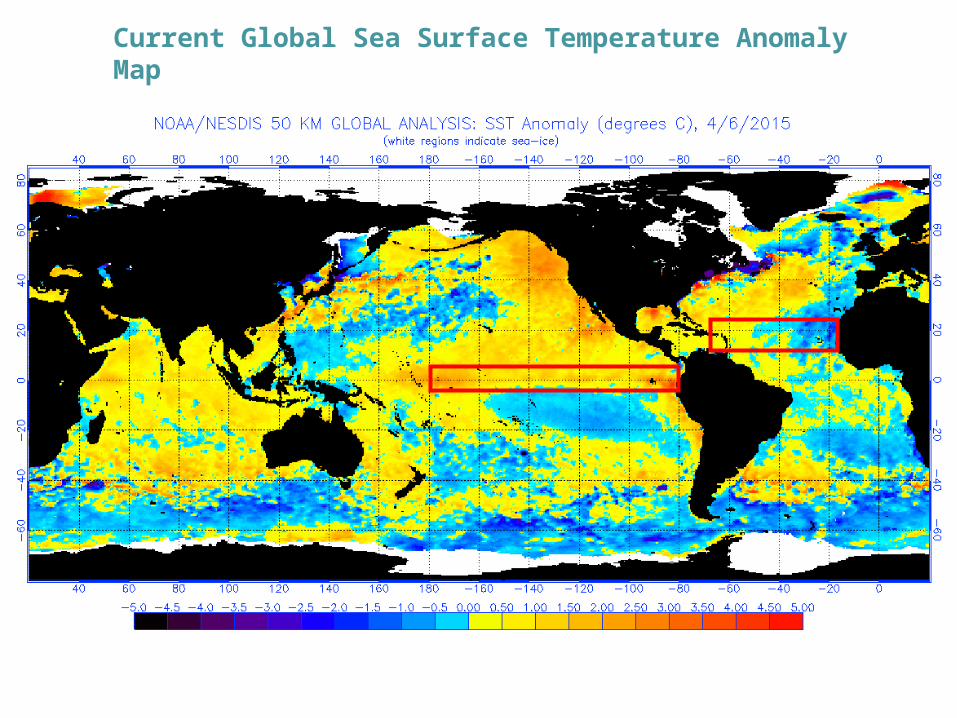
Current Global Sea Surface Temperature Anomaly Map

August – October SSTs: Ten Most Active – Ten Least Active Atlantic Hurricane Seasons Since 1950


El Niño
Neutral

El Niño
Latest Climate Forecast System Prediction

El Niño
La Niña


EQ.
New April Forecast Predictors
March SLP
Jan-Mar SST`
ECMWF SST Forecast
1`
4` 3
`
February-March SLP
2`

NS NSD H HD MH MHD ACE NTC
1957 8 38.00 3 21.00 2 6.50 84 86
1987 7 37.25 3 5.00 1 0.50 34 46
1991 8 24.25 4 8.25 2 1.25 36 58
1993 8 30.00 4 9.50 1 0.75 39 52
2014 8 35.00 6 17.25 2 3.50 66 81
MEAN 7.8 32.9 4.0 12.3 1.6 2.6 52 65
2015 Forecast 7 30 3 10 1 0.50 40 45
BEST ANALOG YEARS FOR 2015 (APRIL FORECAST)

2015 PROBABILITIES FOR AT LEAST ONE MAJOR (CATEGORY 3-4-5) HURRICANE LANDFALL IN
EACH OF THE FOLLOWING AREAS (20th CENTURY PROBABILITIES IN PARENTHESES)
2015 PROBABILITIES FOR AT LEAST ONE MAJOR (CATEGORY 3-4-5) HURRICANE LANDFALL IN
EACH OF THE FOLLOWING AREAS (20th CENTURY PROBABILITIES IN PARENTHESES)
1) Entire U.S. coastline – 28% (52%)
2) U.S. East Coast including Peninsula Florida – 15% (31%)
3) Gulf Coast from the Florida Panhandle westward to Brownsville – 15% (30%)
4) Caribbean (10-20°N, 60-88°W) – 22% (42%)
1) Entire U.S. coastline – 28% (52%)
2) U.S. East Coast including Peninsula Florida – 15% (31%)
3) Gulf Coast from the Florida Panhandle westward to Brownsville – 15% (30%)
4) Caribbean (10-20°N, 60-88°W) – 22% (42%)

Landfalling Hurricane Web Application
Landfalling Hurricane Web Application
Currently Available at the following URL:
Currently Available at the following URL:
In partnership with the GeoGraphics Laboratory – Bridgewater State University,
Bridgewater MA
In partnership with the GeoGraphics Laboratory – Bridgewater State University,
Bridgewater MA
http://www.e-transit.org/hurricanehttp://www.e-transit.org/hurricane

2015 Probabilities (20th Century Probabilities in Parentheses)
2015 Probabilities (20th Century Probabilities in Parentheses)
State Hurricane Impact Prob. MH Impact Prob.
Florida 27% (51%) 10% (21%)
Louisiana 15% (30%) 5% (12%)
Massachusetts 3% (7%) 1% (2%)
Mississippi 5% (11%) 2% (4%)
New York 3% (8%) 1% (3%)
North Carolina 14% (22%) 3% (8%)
Texas 16% (33%) 5% (12%)

2015 Probabilities (20th Century Probabilities in Parentheses)
2015 Probabilities (20th Century Probabilities in Parentheses)
Country/Island Hurricane within 100 Miles
MH within 100 Miles
The Bahamas 28% (51%) 15% (30%)
Cuba 28% (52%) 14% (28%)
Haiti 13% (27%) 6% (13%)
Jamaica 12% (25%) 5% (11%)
Mexico 32% (57%) 11% (23%)
Puerto Rico 14% (29%) 6% (13%)
US Virgin Islands 15% (30%) 6% (12%)
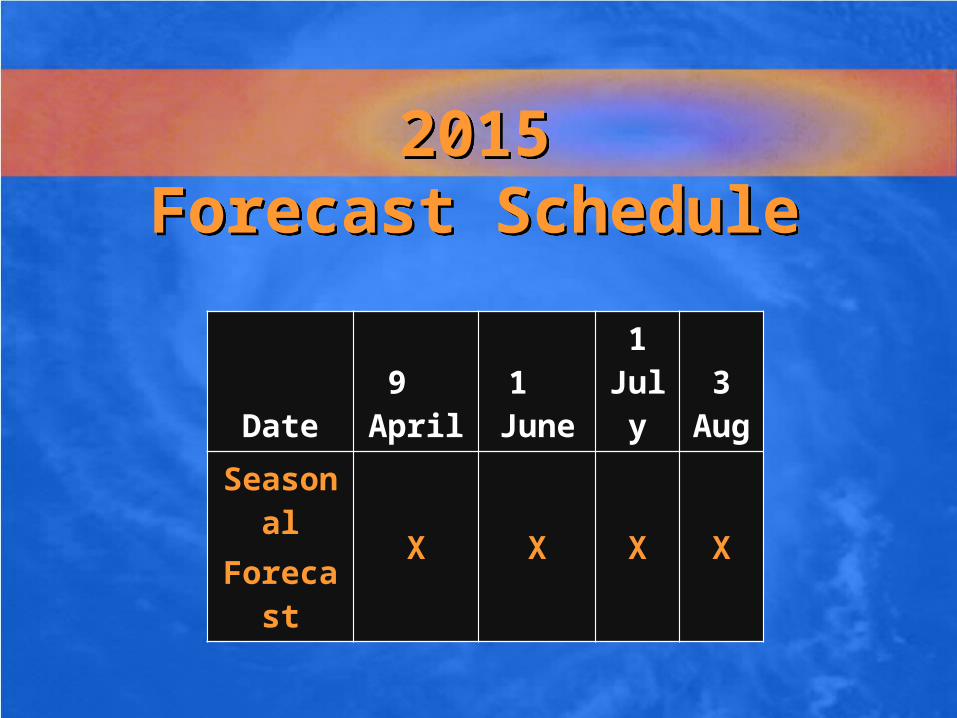
Date9
April1
June1
July3
Aug
SeasonalForecast
X X X X
2015Forecast Schedule
2015Forecast Schedule

Arago’s Admonition:
“Never, no matter what may be the progress
of science, will honest scientific men who
have regard for their reputations venture to
predict the weather.”
Arago’s Admonition:
“Never, no matter what may be the progress
of science, will honest scientific men who
have regard for their reputations venture to
predict the weather.”

Contact Info:
Phil Klotzbach
Email: [email protected]
Web: http://tropical.atmos.colostate.edu
Twitter: @philklotzbach
Facebook: CSU Tropical Meteorology Project
Contact Info:
Phil Klotzbach
Email: [email protected]
Web: http://tropical.atmos.colostate.edu
Twitter: @philklotzbach
Facebook: CSU Tropical Meteorology Project