Embed Size (px)
Citation preview
Partnership. Performance. avisonyoung.com
The Atlanta industrial market continued its momentum into the fourth quarter of 2019. Absorption and leasing activity remained strong, however new vacant space entering the inventory had a negative impact on the vacancy rate. Rental rates continue to rise, but at a slower pace than previously seen. Should preleasing activity in new construction projects increase, the market will stabilize in 2020.
Vacancy and Absorption The Atlanta industrial market recorded its 34th consecutive quarter of positive absorption in the fourth quarter of 2019. The market saw 4.8 million square feet (msf ) absorbed in the quarter, for a year-to-date total of 17.0 msf. While this is significant activity, 2019 is still behind the pace that was seen at this time in 2018. The Northeast submarket recorded the most absorption for the quarter with 1.7 msf, however, the largest move-in during the fourth quarter was Post Brands, absorbing 703,000 square
feet (sf ) at First Park Fairburn in the Airport/North Clayton submarket. This brought the Airport/North Clayton submarket to a fourth quarter total of 1.0 msf absorbed. Even with the strong absorption, the Atlanta industrial market recorded its second year-over-year vacancy increase at the end of 2019. The overall vacancy rate increased by 50 basis points (bps) year-over- year to finish the fourth quarter at 6.0%. This increase was due to 6.1 msf of new space entering the market, of which 5.3 msf was vacant. The warehouse market ended the quarter with a 6.0% vacancy rate as well, which was a 50 bps increase from the same period in 2018. The flex market vacancy rate continued its downward trend, dropping 40 bps year-over-year to 5.5%. The flex market should continue to see a decrease in vacancy as speculative construction remains at a minimum. Should the trend of low preleasing activity in new warehouse construction projects continue, then the overall vacancy rate will continue to rise.
6.0% Total market vacancy up 50 bps
year-over-year
6.0%Warehouse vacancy up 50 bps
year-over-year
21.2 MSF SF under construction in the fourth
quarter with 33.4% preleased
$4.69 PSFAverage asking rental rates up 3.3%
year-over-year
Quick Stats
Fourth Quarter 2019 / Industrial Market Report
Atlanta
Market Overview
Partnership. Performance. avisonyoung.com
Leasing ActivityLeasing activity in the fourth quarter of 2019 was the strongest since the fourth quarter of 2016. The market recorded 9.6 msf of new leases, bringing the year-to-date total to 29.8 msf. The Northeast submarket saw the most activity, recording 3.1 msf of signed leases. The largest lease signed in the fourth quarter was Goodyear Tire and Rubber Company at a 1.5-msf new construction project in the I-85 South submarket. The project is anticipated to break ground in the first quarter of 2020 and be completed by the first quarter of 2021. As companies such as Amazon and Home Depot continue to expand in the Atlanta market, the hope is they will look at the numerous speculative construction projects currently underway to help increase preleasing activity.
New ConstructionThe Atlanta industrial market currently has 21.2 msf under construction, which is on pace with the amount underway at the end of 2018. Out of the 21.2 msf 33.4% of the space is preleased, which is the highest preleasing activity seen since the second quarter of 2018. This increase is largely due to Amazon starting construction on a 2.8 msf fulfillment center that they will fully occupy. The market saw 6.1 msf of new space come online in the fourth quarter of 2019 for a year-to-date total of 21.7 msf. This is the largest yearly total of new inventory entering the market since 2006. As developers continue to announce large new construction projects, more landlords are starting to divide the space in their buildings to attract smaller tenants and lease up the property before it is completed.
Rental Rates Industrial average asking rental rates in metro Atlanta continue to see upward movement. The average asking rate ended the fourth quarter at $4.69 NNN per square foot (psf ), up 3.3% year-over-year. This is a slightly slower pace than seen earlier in 2019 and in 2018. The average warehouse rate rose by 2.6% to $4.38 NNN psf in the same period. Flex average asking rental rates recorded a significant increase, up 8.5% year-over-year, ending the quarter at $10.21 NNN psf. This surge was driven by the Stone Mountain submarket which saw rates increase 18% year-over-year. The increase is primarily due to older generation industrial space being transformed into creative, and more expensive, flex space.
Investment Sales The Atlanta industrial market recorded $550 million in investment sales during the fourth quarter of 2019 for a year-to-date total of $2.4 billion. This yearly total is 3.2% higher than what was sold in 2018. The largest individual sale of the quarter was Property Reserve, Inc purchasing the 1.0-msf Northeast 85 Logistics Center from Core5 Industrial Partners for $46.1 million.
Outlook Job growth remained strong in metro Atlanta during the fourth quarter. According to the Bureau of Labor Statistics, employment in the Atlanta metro area grew by more than 62,000 jobs between November 2018 and November 2019. This is a growth rate of 2.2%, well ahead of the 1.5% growth the U.S. is currently experiencing. Should the Atlanta industrial market gain some of these jobs, it could help lower the vacancy rate in 2020.
Fourth Quarter / Industrial Market ReportAtlanta
Leasing activity in new construction projects
needs to increase so the Atlanta market does not see a third consecutive
year-over-year increase in vacancy
Vacancy Trends
Absorption vs. Completions
SF Under Construction
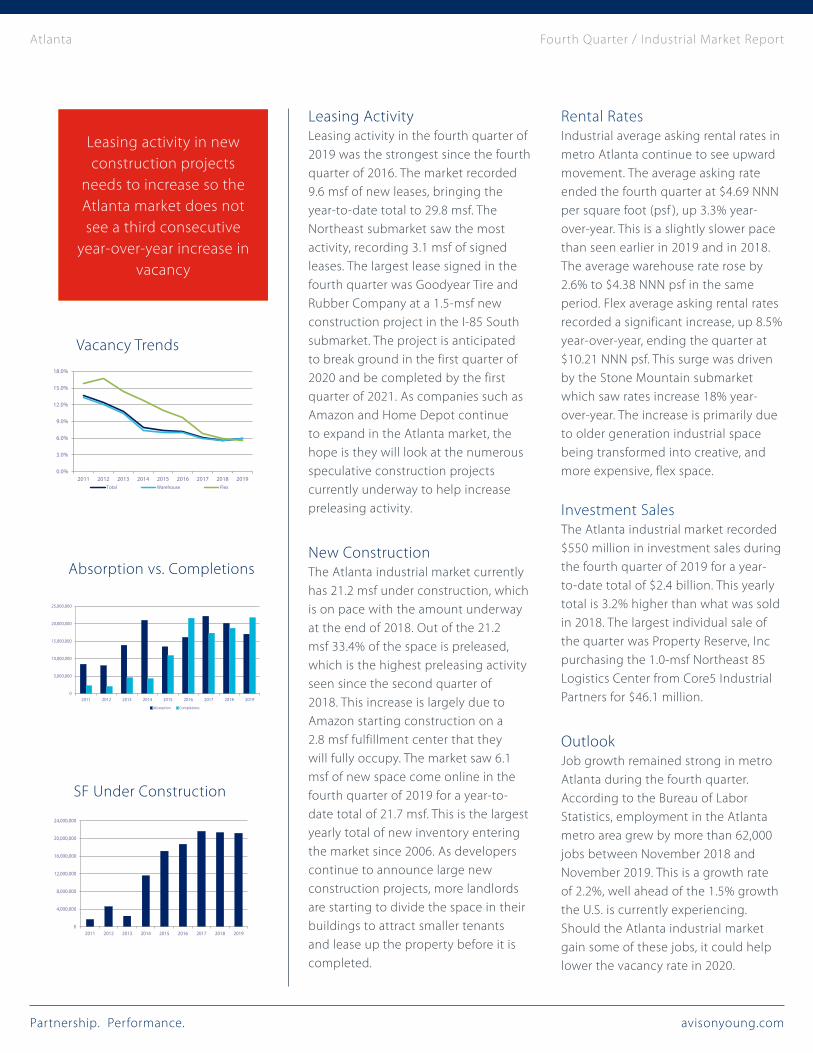
VacancyTotal Warehouse Flex
2011 13.6% 13.3% 15.8%2012 12.4% 12.0% 16.7%2013 10.8% 10.4% 14.3%2014 7.9% 7.4% 12.7%2015 7.4% 7.1% 10.9%2016 7.2% 7.0% 9.8%2017 6.10% 6.00% 6.8%2018 5.50% 5.50% 5.9%2019 6.0% 6.0% 5.5%
0.0%
3.0%
6.0%
9.0%
12.0%
15.0%
18.0%
2011 2012 2013 2014 2015 2016 2017 2018 2019Total Warehouse Flex
Absorption Completions2011 8,420,688 2,228,9832012 7,975,140 2,028,8682013 13,857,454 4,560,1432014 20,959,344 4,278,5682015 13,348,510 10,919,9752016 16,098,316 21,612,3772017 22,133,555 17,333,5862018 20,104,001 18,726,0352019 17,031,504 21,727,551
0
5,000,000
10,000,000
15,000,000
20,000,000
25,000,000
2011 2012 2013 2014 2015 2016 2017 2018 2019
Absorption Completions
SF Underway2011 1,648,1422012 4,548,4432013 2,424,2782014 11,507,8402015 17,128,3292016 18,670,0202017 21,580,5262018 213065132019 21,154,929
0
4,000,000
8,000,000
12,000,000
16,000,000
20,000,000
24,000,000
2011 2012 2013 2014 2015 2016 2017 2018 2019
Partnership. Performance. avisonyoung.com
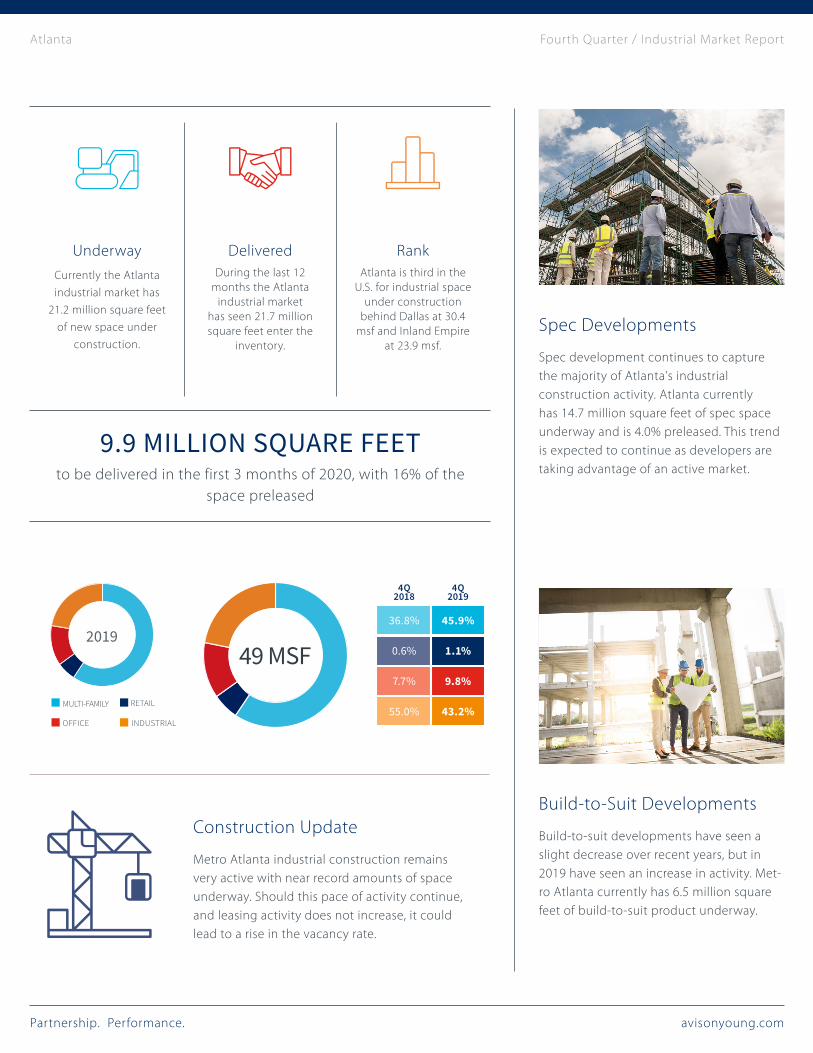
9.9 MILLION SQUARE FEETto be delivered in the first 3 months of 2020, with 16% of the
space preleased
2019
Spec Developments
Spec development continues to capture the majority of Atlanta's industrial construction activity. Atlanta currently has 14.7 million square feet of spec space underway and is 4.0% preleased. This trend is expected to continue as developers are taking advantage of an active market.
UnderwayCurrently the Atlanta industrial market has
21.2 million square feet of new space under
construction.
DeliveredDuring the last 12
months the Atlanta industrial market
has seen 21.7 million square feet enter the
inventory.
RankAtlanta is third in the
U.S. for industrial space under construction
behind Dallas at 30.4 msf and Inland Empire
at 23.9 msf.
MULTI-FAMILY RETAIL
OFFICE INDUSTRIAL
4Q2018
4Q2019
36.8% 45.9%
0.6% 1.1%
7.7% 9.8%
55.0% 43.2%
49 MSF
Construction Update
Metro Atlanta industrial construction remains very active with near record amounts of space underway. Should this pace of activity continue, and leasing activity does not increase, it could lead to a rise in the vacancy rate.
Build-to-Suit Developments
Build-to-suit developments have seen a slight decrease over recent years, but in 2019 have seen an increase in activity. Met-ro Atlanta currently has 6.5 million square feet of build-to-suit product underway.
Fourth Quarter / Industrial Market ReportAtlanta
Partnership. Performance. avisonyoung.com
Vacancy Will continue to increase as preleasing in new construction buildings remains
low.
Look for these three key trends to continue throughout 2020 in the Atlanta industrial market.
Trends to Watch
Rental RatesWill continue to rise as new
construction costs push rates up, but at a slower pace than 2019.
ConstructionWill remain near record high
amounts for space underway.
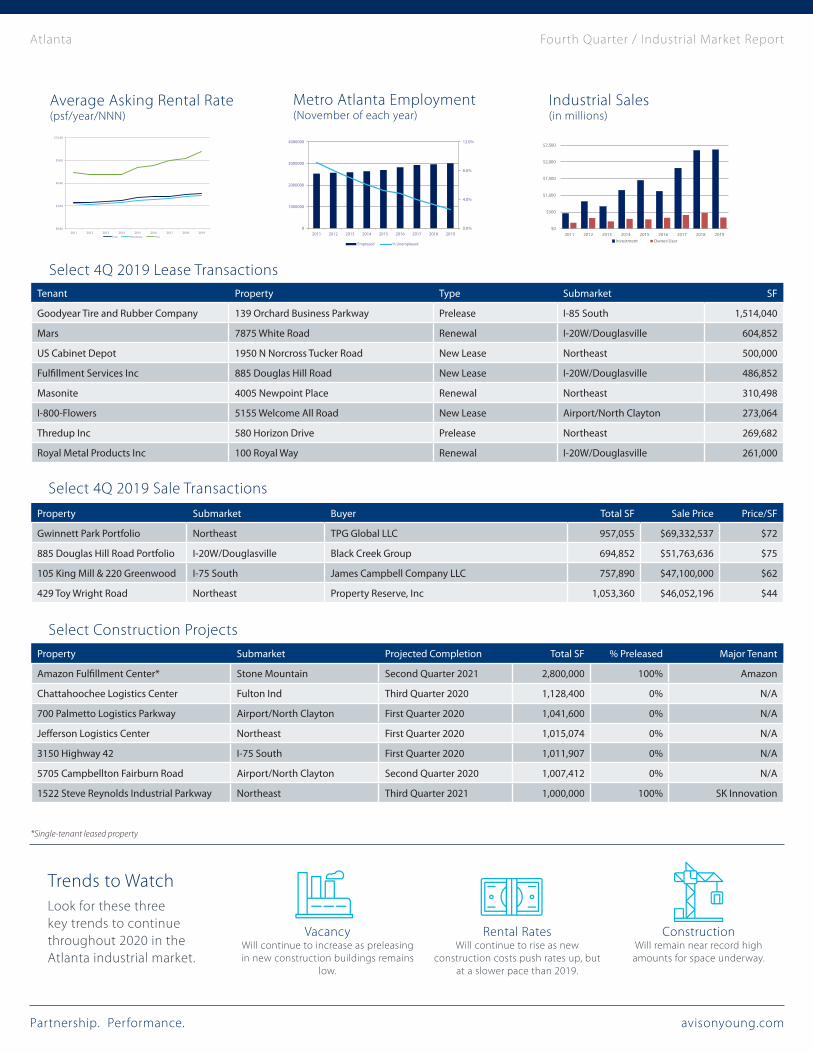
Average Asking Rental Rate (psf/year/NNN)
Industrial Sales (in millions)
Metro Atlanta Employment (November of each year)
Total Warehouse Flex2011 $3.51 $3.27 $7.352012 $3.43 $3.19 $7.202013 $3.60 $3.33 $7.202014 $3.73 $3.47 $7.212015 $4.06 $3.74 $8.122016 $4.23 $3.90 $8.272017 $4.25 $3.97 $8.992018 $4.54 $4.24 $9.222019 $4.69 $4.38 $10.21
$0.00
$3.00
$6.00
$9.00
$12.00
2011 2012 2013 2014 2015 2016 2017 2018 2019Total Warehouse Flex
Employed % Unemployed2011 2529284 9.1%2012 2574273 8.0%2013 2595806 7.0%2014 2642165 6.1%2015 2701791 5.2%2016 2828488 4.8%2017 2934487 4.00%2018 2966411 3.3%2019 3013566 2.6%
0.0%
4.0%
8.0%
12.0%
0
1000000
2000000
3000000
4000000
2011 2012 2013 2014 2015 2016 2017 2018 2019
Employed % Unemployed
Investment Owner/User2011 453,092,610 179,002,0532012 813,167,254 321,083,0732013 662,905,112 216,223,8472014 1,150,827,903 292,997,8302015 1,448,665,531 276,162,6552016 1,122,485,986 327,092,3192017 1,814,415,208 413,086,0602018 2,345,984,453 475,894,6292019 2,360,134,603 336,377,572
$0
$500
$1,000
$1,500
$2,000
$2,500
2011 2012 2013 2014 2015 2016 2017 2018 2019Investment Owner/User
Select 4Q 2019 Lease Transactions
Select 4Q 2019 Sale Transactions
Select Construction Projects
Tenant Property Type Submarket SF
Goodyear Tire and Rubber Company 139 Orchard Business Parkway Prelease I-85 South 1,514,040
Mars 7875 White Road Renewal I-20W/Douglasville 604,852
US Cabinet Depot 1950 N Norcross Tucker Road New Lease Northeast 500,000
Fulfillment Services Inc 885 Douglas Hill Road New Lease I-20W/Douglasville 486,852
Masonite 4005 Newpoint Place Renewal Northeast 310,498
I-800-Flowers 5155 Welcome All Road New Lease Airport/North Clayton 273,064
Thredup Inc 580 Horizon Drive Prelease Northeast 269,682
Royal Metal Products Inc 100 Royal Way Renewal I-20W/Douglasville 261,000
Property Submarket Projected Completion Total SF % Preleased Major Tenant
Amazon Fulfillment Center* Stone Mountain Second Quarter 2021 2,800,000 100% Amazon
Chattahoochee Logistics Center Fulton Ind Third Quarter 2020 1,128,400 0% N/A
700 Palmetto Logistics Parkway Airport/North Clayton First Quarter 2020 1,041,600 0% N/A
Jefferson Logistics Center Northeast First Quarter 2020 1,015,074 0% N/A
3150 Highway 42 I-75 South First Quarter 2020 1,011,907 0% N/A
5705 Campbellton Fairburn Road Airport/North Clayton Second Quarter 2020 1,007,412 0% N/A
1522 Steve Reynolds Industrial Parkway Northeast Third Quarter 2021 1,000,000 100% SK Innovation
Property Submarket Buyer Total SF Sale Price Price/SF
Gwinnett Park Portfolio Northeast TPG Global LLC 957,055 $69,332,537 $72
885 Douglas Hill Road Portfolio I-20W/Douglasville Black Creek Group 694,852 $51,763,636 $75
105 King Mill & 220 Greenwood I-75 South James Campbell Company LLC 757,890 $47,100,000 $62
429 Toy Wright Road Northeast Property Reserve, Inc 1,053,360 $46,052,196 $44
*Single-tenant leased property
Fourth Quarter / Industrial Market ReportAtlanta
© 2020 Avison Young - Atlanta, LLC. All rights reserved. E. & O.E.: The information contained herein was obtained from sources which we deem reliable and, while thought to be correct, is not guaranteed by Avison Young.
Properties
avisonyoung.com
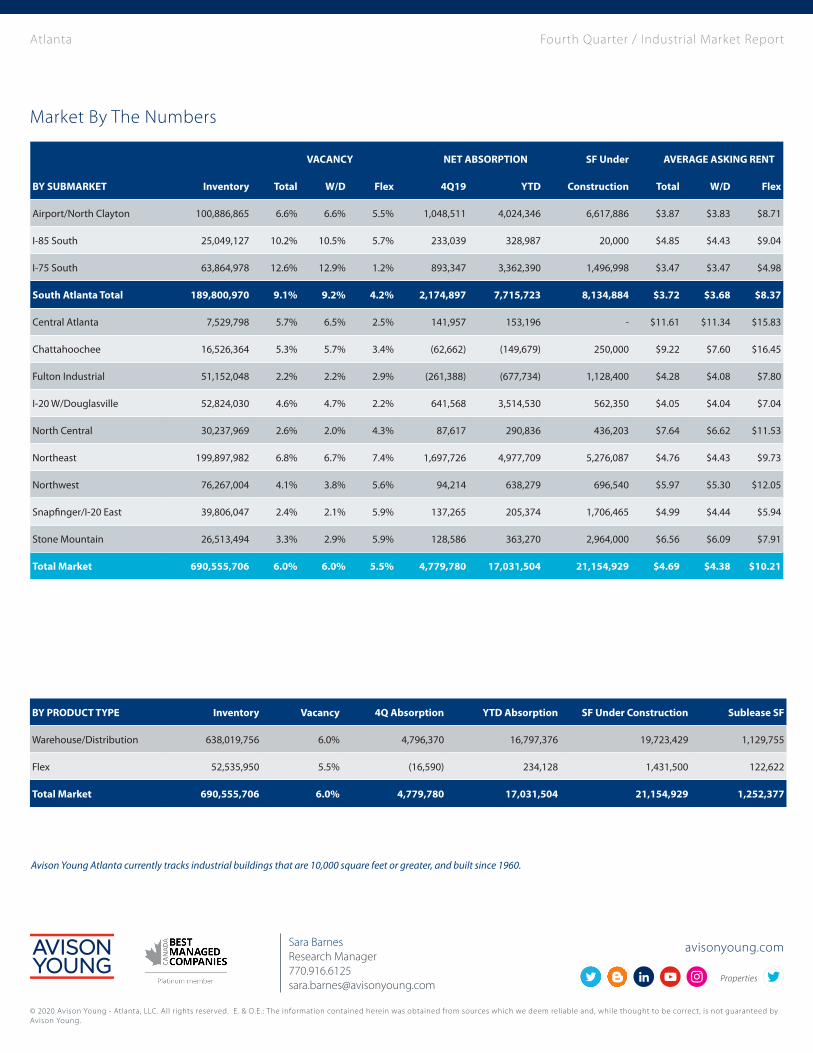
Market By The Numbers
Fourth Quarter / Industrial Market ReportAtlanta
Sara BarnesResearch Manager [email protected]
VACANCY NET ABSORPTION SF Under AVERAGE ASKING RENT
BY SUBMARKET Inventory Total W/D Flex 4Q19 YTD Construction Total W/D Flex
Airport/North Clayton 100,886,865 6.6% 6.6% 5.5% 1,048,511 4,024,346 6,617,886 $3.87 $3.83 $8.71
I-85 South 25,049,127 10.2% 10.5% 5.7% 233,039 328,987 20,000 $4.85 $4.43 $9.04
I-75 South 63,864,978 12.6% 12.9% 1.2% 893,347 3,362,390 1,496,998 $3.47 $3.47 $4.98
South Atlanta Total 189,800,970 9.1% 9.2% 4.2% 2,174,897 7,715,723 8,134,884 $3.72 $3.68 $8.37
Central Atlanta 7,529,798 5.7% 6.5% 2.5% 141,957 153,196 - $11.61 $11.34 $15.83
Chattahoochee 16,526,364 5.3% 5.7% 3.4% (62,662) (149,679) 250,000 $9.22 $7.60 $16.45
Fulton Industrial 51,152,048 2.2% 2.2% 2.9% (261,388) (677,734) 1,128,400 $4.28 $4.08 $7.80
I-20 W/Douglasville 52,824,030 4.6% 4.7% 2.2% 641,568 3,514,530 562,350 $4.05 $4.04 $7.04
North Central 30,237,969 2.6% 2.0% 4.3% 87,617 290,836 436,203 $7.64 $6.62 $11.53
Northeast 199,897,982 6.8% 6.7% 7.4% 1,697,726 4,977,709 5,276,087 $4.76 $4.43 $9.73
Northwest 76,267,004 4.1% 3.8% 5.6% 94,214 638,279 696,540 $5.97 $5.30 $12.05
Snapfinger/I-20 East 39,806,047 2.4% 2.1% 5.9% 137,265 205,374 1,706,465 $4.99 $4.44 $5.94
Stone Mountain 26,513,494 3.3% 2.9% 5.9% 128,586 363,270 2,964,000 $6.56 $6.09 $7.91
Total Market 690,555,706 6.0% 6.0% 5.5% 4,779,780 17,031,504 21,154,929 $4.69 $4.38 $10.21
BY PRODUCT TYPE Inventory Vacancy 4Q Absorption YTD Absorption SF Under Construction Sublease SF
Warehouse/Distribution 638,019,756 6.0% 4,796,370 16,797,376 19,723,429 1,129,755
Flex 52,535,950 5.5% (16,590) 234,128 1,431,500 122,622
Total Market 690,555,706 6.0% 4,779,780 17,031,504 21,154,929 1,252,377
Avison Young Atlanta currently tracks industrial buildings that are 10,000 square feet or greater, and built since 1960.