Embed Size (px)
Citation preview
World Review of Intermodal Transportation Research, Vol. 5, No. 2, 2014 149
Copyright © 2014 Inderscience Enterprises Ltd.
Development of electric vehicle: public perception and attitude, the Malaysian approach
Ataur Rahman* Faculty of Engineering, International Islamic University Malaysia, 50728 KL, Malaysia Email: [email protected] Email: [email protected] *Corresponding author
Rafia Afroz Faculty of Economics and Management Science, International Islamic University Malaysia, 50728 KL, Malaysia Email: [email protected]
Zahirul Alam Faculty of Engineering, International Islamic University Malaysia, 50728 KL, Malaysia Email: [email protected]
Abstract: The rising energy demand has compounded with fuel subsidies and a volatility of oil prices has set the transport sector on an unsustainable course and posed a threat to national energy security in Malaysia. Moreover, it contributes significantly to the green house gas (GHG) emission and causes health as well as environmental damages. Green transport is a feasible transportation technology capable of setting the transportation sector in a sustainable course. The focus of this study is to develop an electric car driven by an electrical motor powered by 84.6 kWh of LiFePO4 battery with an evaporative cooling battery thermal management system (EC-BThMS). The EC-BThMS has been able to keep the battery temperature in the range of 25°C to 40°C. The justification of the introduction of green vehicle was made by the investigation of public preference and attitude towards green transport. The results of the survey indicate that 54% of respondents seriously like to purchase environmental friendly green transport.
Keywords: electric transport; public perception and attitude; battery power pack; EC-BThMS; thermal sensor, Malaysia.
Reference to this paper should be made as follows: Rahman, A., Afroz, R., Alam, Z. (2014) ‘Development of electric vehicle: public perception and attitude, the Malaysian approach’, World Review of Intermodal Transportation Research, Vol. 5, No. 2, pp.149–167.
brought to you by COREView metadata, citation and similar papers at core.ac.uk
provided by The International Islamic University Malaysia Repository
150 A. Rahman et al.
Biographical notes: Ataur Rahman is a Professor in the Department of Mechanical Engineering, Faculty of Engineering, International Islamic University Malaysia since 1996. His research interests are green transportation system: EV/HEV, hybrid engine, intelligent power train for hybrid and electrical vehicle, intelligent steering system and traction control system, electromagnetic actuated CVT and intelligent air-cushion vehicle for swamp and peat terrain. He has worked in The University of Tokyo, Japan, as a Visiting Fellow on the development of integrated instrumentation systems for autonomous vehicles. He has published 120 journal articles including 60 ISI listed journal from his research work.
Rafia Afroz received her PhD in Environmental Planning and Management in 2004 from the University Putra Malaysia. She is an Associate Professor at the International Islamic University Malaysia since 2008. Before that, she was appointed as a Senior Lecturer in the University Malaysia Sarawak in 2007. She received the JSPS Postdoc Fellowship in the University of Tokyo in 2005. She has published more than 30 articles in journals and proceedings. Recently, she published one book entitled The Peat Swamp: Productivity, Traficability and Mechanization by Nova Science Publisher. Her area of research interest is environmental valuation, waste management, input output analysis and climate change.
Zahirul Alam is a Professor in the Department of Electrical and Computer Engineering, Faculty of Engineering, International Islamic University Malaysia since 2002. His research interests are green transportation system and control. He has published 200 journal articles from his research work.
1 Introduction
The environmental case for electric traction is the only proven viable transporting vehicle propulsion system that would not pollute the air. Numerous problems need to be solved before these quiet, eco-friendly vehicles can become nationally established. It's not enough to simply replace the combustion engine and fuel tank with an electric motor and battery. Several systems needs do to maintain the performance of the green transportation such as electric cars or buses. The components need to introduce with the green transportation system such as: thermal management system, motor mounting system, power controlling system, charging system and battery management system. Transmission loss is one of the critical issues for the transportation system especially for the pure electrical transport. Therefore, the proper motor mounting system needs to develop which will help to reduce the transmission loss and vibration.
During the peak load for vehicle traction and air conditioning system, battery pack needs to generate a high output within a very short time to meet the power. These momentary peak load periods generate powerful electrical currents, causing significant warming of the Li-ion cells due to internal resistance. Li-ion batteries can be used efficiently only within a specific temperature range of 20–40°C. At operating temperatures of 40°C and above, the battery life span is reduced. At very low
Development of electric vehicle: public perception and attitude 151
temperatures under –10°C battery performance declines and efficiency drops markedly. The allowable temperature gradient within a battery from cell to cell needs to restrict in the range of 5°C to 10°C. Therefore, significant importance should be given on thermal management system of Li-ion battery cells to achieve the desired temperature range and to increase the battery life span (Minton, 1986; Moreno, 2012; Husain, 2003).
Incomplete combustion of automobiles and light-duty trucks engines causes approximately 73.19% of Malaysia green house gas (GHG) emissions (Statistical Year Book of Malaysia, 2012). The growth in the number of vehicles in the country has been much faster than the growth in population (average annual growth rate of 2.5% in 1991 to 2009). Transportation sector is the second most energy consuming sector after industrial sector and accounts for about 40% of the total energy consumption in Malaysia. It is one of the most energy intensive sectors in the country and relies primarily on petroleum products, which in total accounts for nearly 98% of the total consumption in the sector. Road transport is the main energy consumption within the transportation sector. The share of road transport in the total energy consumption of the transport sector in 2008 was the highest at 80%, followed by air transport (11%), maritime transport (7%) and railways (3%) (Benson, 1982). The rising energy demand compounded with fuel subsidies and a volatility of oil prices has set the transport sector on an unsustainable course posing a threat to national energy security. The GHG causes the increase of global warming which lead to major climatic changes that affect the whole world, every single country and many other organisms. Automotive manufacturers are seeking to keep abreast of developing trends in electric vehicle (EV) technology could do little better than to follow the proceedings on the subject which have appeared the following Proton Green Mobility Challenge (PGMC) 2012, Society of Automotive Engineering (SAE) World Congresses in 2011, as well as studying the proceedings of the annual worldwide World Automotive Congress (FISITA) 2012 and electric vehicles (EVs) conferences. Advanced power systems and reduced vehicle road-loads are necessary in order to make significant gains in automobile energy intensity and zero emission. Up until now, only electric, low emission hybrid vehicles, and fuel cell powered vehicles are able to abide by the CARB regulations reported by Boretti and Watson (2009), Hodkinson and Fenton (2001), Jefferson and Barnard (2002), Sperling (1995), Westbrook (2001) and Wang (2005) and Mahlia et al. (2010). Thus, optimal electrical and hybrid electric vehicle (HEV) design is becoming a hot spot in recent years as a viable way to meet requirements on both vehicle performance and environment protection based on the study of Pesaran et al. (1997).
The aim of this study is to develop green transportation system for saving energy and emission free environment by investigating the public public perception and attitude on the development of green transportation system, developing a dynamic modelling and simulation on the discharging of the battery current for vehicle different load conditions, simulation on heat generation into the battery module for different dischraging current and delopment of battery cooling thermal management system for maintaining the battery temperature in the range of 25 to 35°C.
152 A. Rahman et al.
2 Public perception and attitude
This study conducted a personal survey included to measure the concern, awareness and perception of the respondents towards green transport. The survey is conducted in August 2012. A random sample of 200 is taken in the residential areas in Kuala Lumpur such as Selayang, Cheras, Ampang, Taman Jaya and Kuala Lumpur. This survey is conducted to investigate the justification of the development of green transport because it is very important to know about the knowledge, awareness and perception of the public if government wants to implement any development project.
The respondents of the study are asked whether they will like to purchase environmental friendly green transport or not. The results of the survey indicate that 54% of respondents state that they will seriously like to purchase environmental friendly green transport. This is a welcome attitude towards the development of electric vehicle (EVs) in Malaysia.
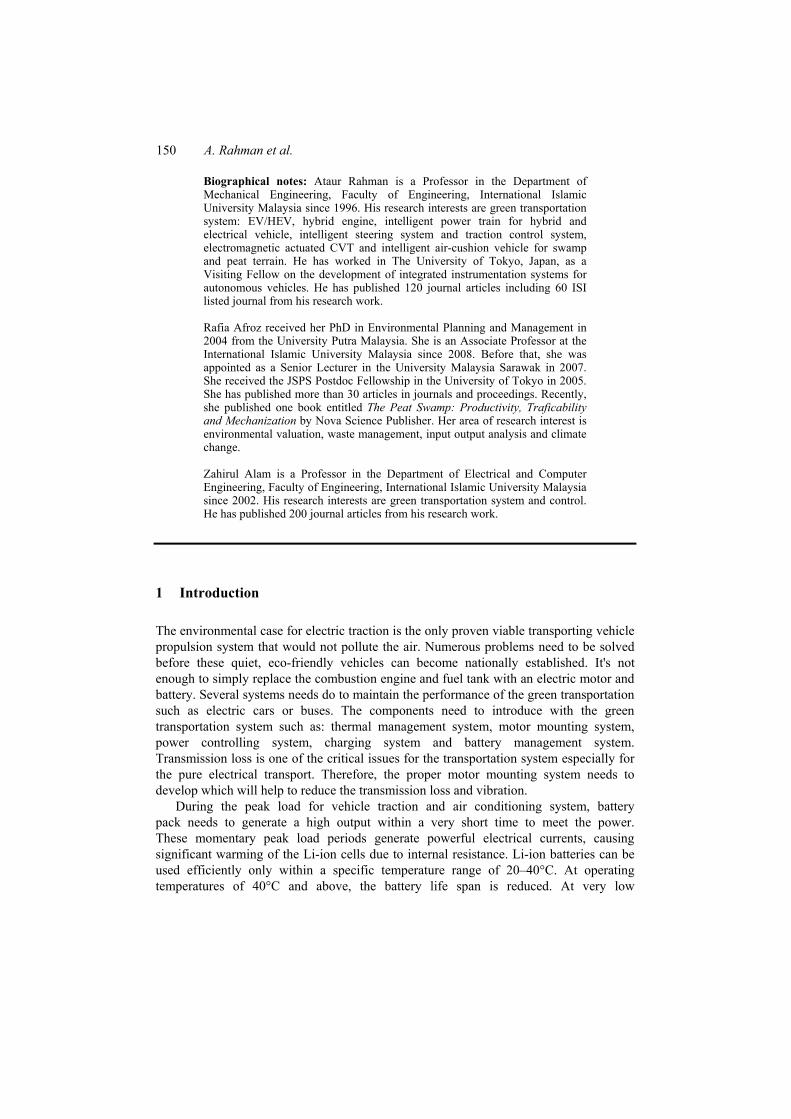
Figure 1 Concern about green transport (see online version for colours)
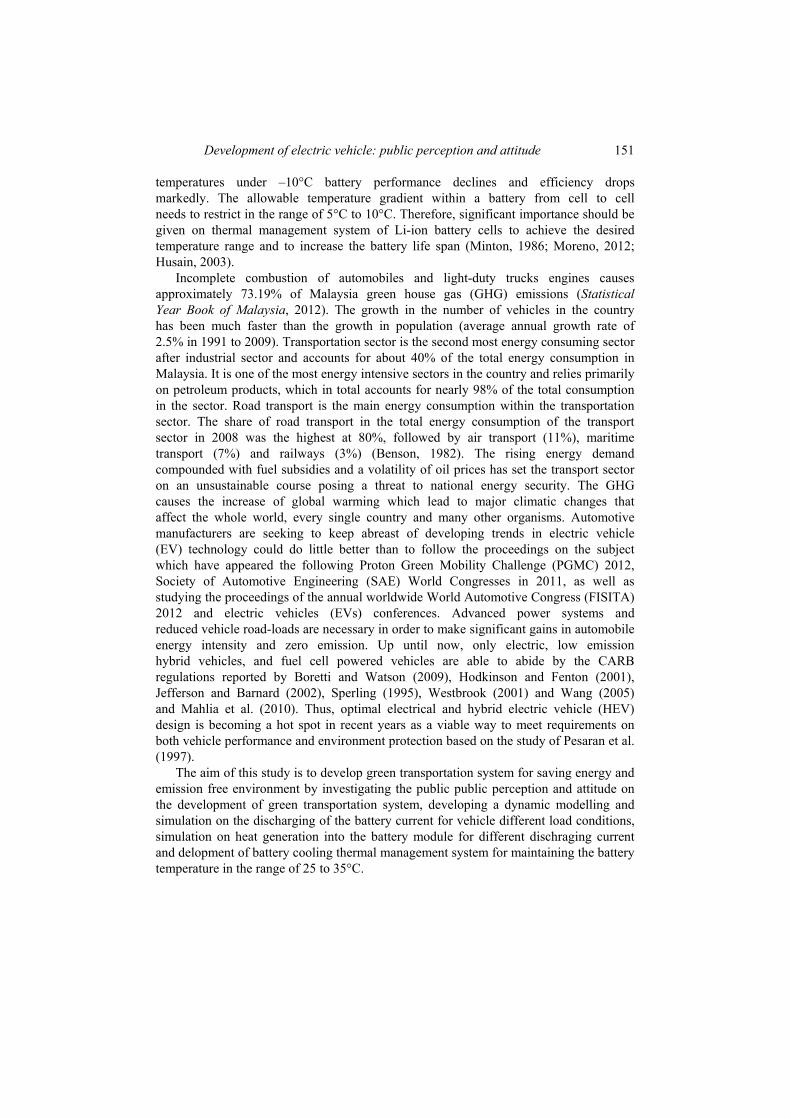
Figure 2 Awareness about green transport (see online version for colours)
The respondents of the study are also asked about their concern associated with the green transport. Figure 1 presents the results of the survey. It presents that 53.8% of the respondents consider battery range as the highest problem followed by high cost (23.6%)
Development of electric vehicle: public perception and attitude 153
while 12.2%, 10%, 10% and 8.1% of respondents are concerned about changing infrastructure, reliability, safety and performance respectively. The respondents of the study are asked about their awareness of the green transport. Figure 2 presents that highest number of respondents (42.1%) is familiar with plug in hybrid electric vehicles (PHEV) while 40.5% and 17% of the respondents is familiar with HEVs and electric vehicles (EVs) respectively.
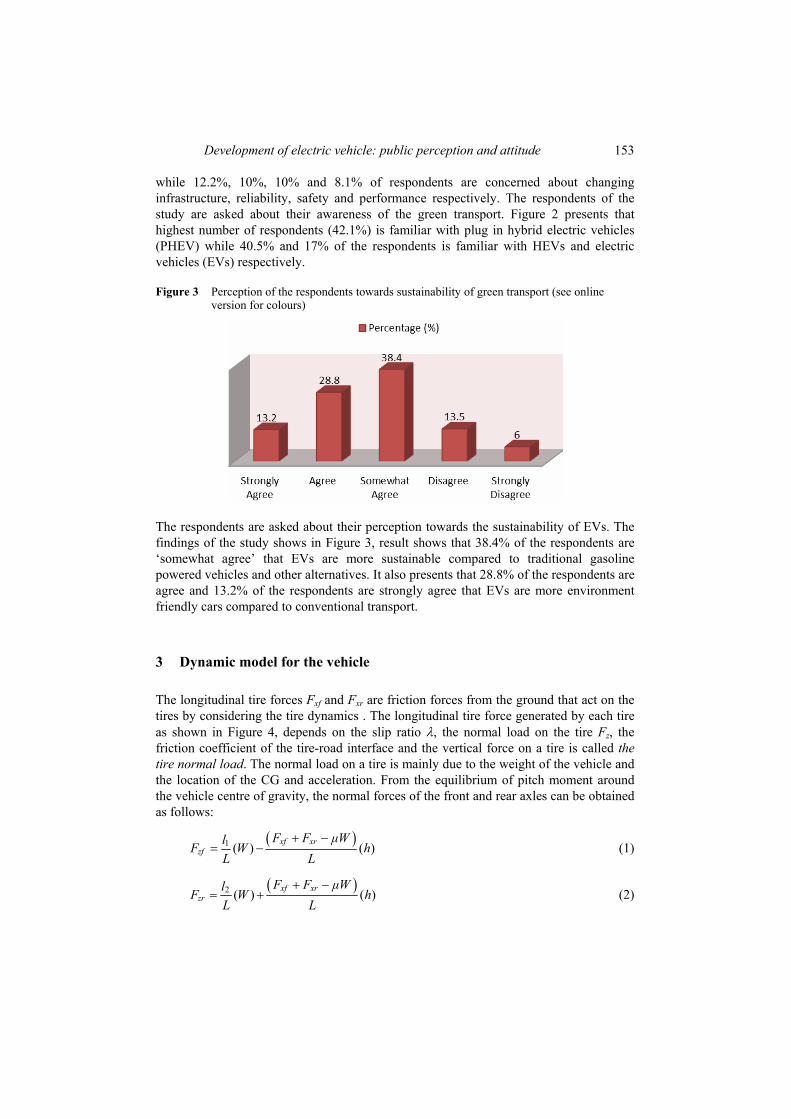
Figure 3 Perception of the respondents towards sustainability of green transport (see online version for colours)
The respondents are asked about their perception towards the sustainability of EVs. The findings of the study shows in Figure 3, result shows that 38.4% of the respondents are ‘somewhat agree’ that EVs are more sustainable compared to traditional gasoline powered vehicles and other alternatives. It also presents that 28.8% of the respondents are agree and 13.2% of the respondents are strongly agree that EVs are more environment friendly cars compared to conventional transport.
3 Dynamic model for the vehicle
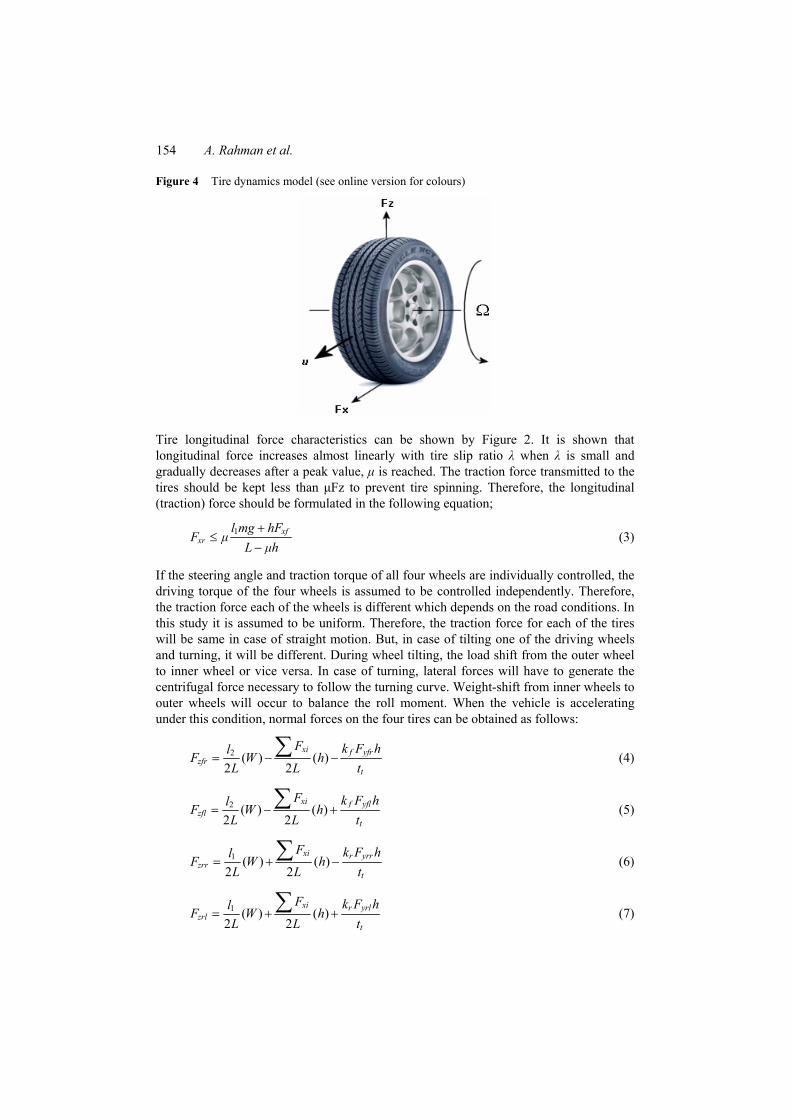
The longitudinal tire forces Fxf and Fxr are friction forces from the ground that act on the tires by considering the tire dynamics . The longitudinal tire force generated by each tire as shown in Figure 4, depends on the slip ratio O, the normal load on the tire Fz, the friction coefficient of the tire-road interface and the vertical force on a tire is called the tire normal load. The normal load on a tire is mainly due to the weight of the vehicle and the location of the CG and acceleration. From the equilibrium of pitch moment around the vehicle centre of gravity, the normal forces of the front and rear axles can be obtained as follows:
� �1 ( ) ( )xf xrzf
F F ȝWlF W hL L
� � � (1)
� �2 ( ) ( )xf xrzr
F F ȝWlF W hL L
� � � (2)
154 A. Rahman et al.
Figure 4 Tire dynamics model (see online version for colours)
Tire longitudinal force characteristics can be shown by Figure 2. It is shown that longitudinal force increases almost linearly with tire slip ratio Ȝ when Ȝ is small and gradually decreases after a peak value, ȝ is reached. The traction force transmitted to the tires should be kept less than ȝFz to prevent tire spinning. Therefore, the longitudinal (traction) force should be formulated in the following equation;
1 xfxr
l mg hFF ȝ
L ȝh�
d�
(3)
If the steering angle and traction torque of all four wheels are individually controlled, the driving torque of the four wheels is assumed to be controlled independently. Therefore, the traction force each of the wheels is different which depends on the road conditions. In this study it is assumed to be uniform. Therefore, the traction force for each of the tires will be same in case of straight motion. But, in case of tilting one of the driving wheels and turning, it will be different. During wheel tilting, the load shift from the outer wheel to inner wheel or vice versa. In case of turning, lateral forces will have to generate the centrifugal force necessary to follow the turning curve. Weight-shift from inner wheels to outer wheels will occur to balance the roll moment. When the vehicle is accelerating under this condition, normal forces on the four tires can be obtained as follows:
2 ( ) ( )2 2
xi f yfrzfr
t
F k F hlF W hL L t
� �¦ (4)
2 ( ) ( )2 2
xi f yflzfl
t
F k F hlF W hL L t
� �¦ (5)
1 ( ) ( )2 2
xi r yrrzrr
t
F k F hlF W hL L t
� �¦ (6)
1 ( ) ( )2 2
xi r yrlzrl
t
F k F hlF W hL L t
� �¦ (7)

Development of electric vehicle: public perception and attitude 155
where, kf and kr are lateral weight shift distribution ratio on the front and rear wheels respectively. The weight shift distribution ratio kr > kf as the front part of the vehicle will be nose up (squat) during acceleration. To propel the vehicle with traction torque of the rear wheel, the position of the CG from the rear wheels will be higher than from the front wheels (i.e., l2 >> l1). The vehicle as shown in Figure 1 is 2WD. Its rear driving wheel’s traction torque is maintained independently by using DC motor. During traction the nose will up which is called squat. Therefore, the weight shift distribution ratio on the rear wheel will be more than the front wheel. During traction (or acceleration), traction force for the rear wheels can be obtained by using the equations (7) and (8).
The lateral force of the vehicle for each of the tire can be computed of Rahman et al. (2012):
21
21
xflyfl
f
t
l mg F hvFk hgȡLt
�ª º « »« »�« »¬ ¼
(8)
2
1
21
xfryfr
f
t
l mg F hvFk hgȡLt
�ª º « »« »�« »¬ ¼
(9)
21
21
xrlyrl
r
t
v l mg F hFk hgȡLt
�ª º « »�« »
¬ ¼
(10)
21
21
xrryrr
r
t
v l mg F hFk hgȡLt
�ª º « »�« »
¬ ¼
(11)
The longitudinal force of the vehicle is the function of slippage. It is convenient to define a slip function � �Ȝ³v to obtain a composite force with any normal load and coefficient of
friction and drag force on slope can be estimated as;
� �� � sinx zF Ȝ ȝF W ș �³v (12)
3.1 Slip angle and longitudinal slip
The longitudinal and lateral forces generated by a tire are a function of the slip angle and longitudinal slip of the tire relative to the road. The slip depends on the dynamics of the vehicle and the tire/wheel and it also influences their dynamics through the friction force. The longitudinal slip of the tire is defined as a difference between the tire tangential speed and the speed of the axle relative to the road, which is represented by the following equation.
1 during braking
wx
rȦ uȜu�
(13)
156 A. Rahman et al.
2 during acceleration
wy
w
rȦ uȜrȦ�
(14)
where O is the longitudinal slip, r is the radius of the wheel, Ȧw is the angular velocity and u is the speed of the axle relative to the road. It is assumed and taken as convention
that u > 0 and 0 � ZR � u in vehicle braking. Thus, wx
rȦ uȜu�
is defined on the unit
interval of Ȝ = [0, 1], taking on the limiting values of Ȝ = 0 for free rolling (u = ȦR) and Ȝ = 1 for wheel lockup (ȦR = 0). In braking u > ȦR, while u < ȦR for vehicle acceleration. The definition of slip, along with the convention that ȦR � u allows for two possibilities for steady-state vehicle braking with non-zero initial speed:
1 finite rotation of the wheel while the vehicle decelerates
2 deceleration under lockup conditions.
Torque requirement for the vehicle to operate on the slope can be estimated by using equation of Rahman et al. (2012):
� � > @� �sinz wt șT ȜȝF W ș R � (15)
A total current needs drawn by the motor to meet the power demand of the vehicle can be estimated by using the following equation of Rahman et al. (2011):
> @sin ( )1,000
z
b m
ȜȝF W ș VI
V Ș�
u u
(16)
where V is the vehicle speed in km/h and Vb is the motor rating voltage in volts and Șm is the motor efficiency.
4 Power requirement to meet the car load
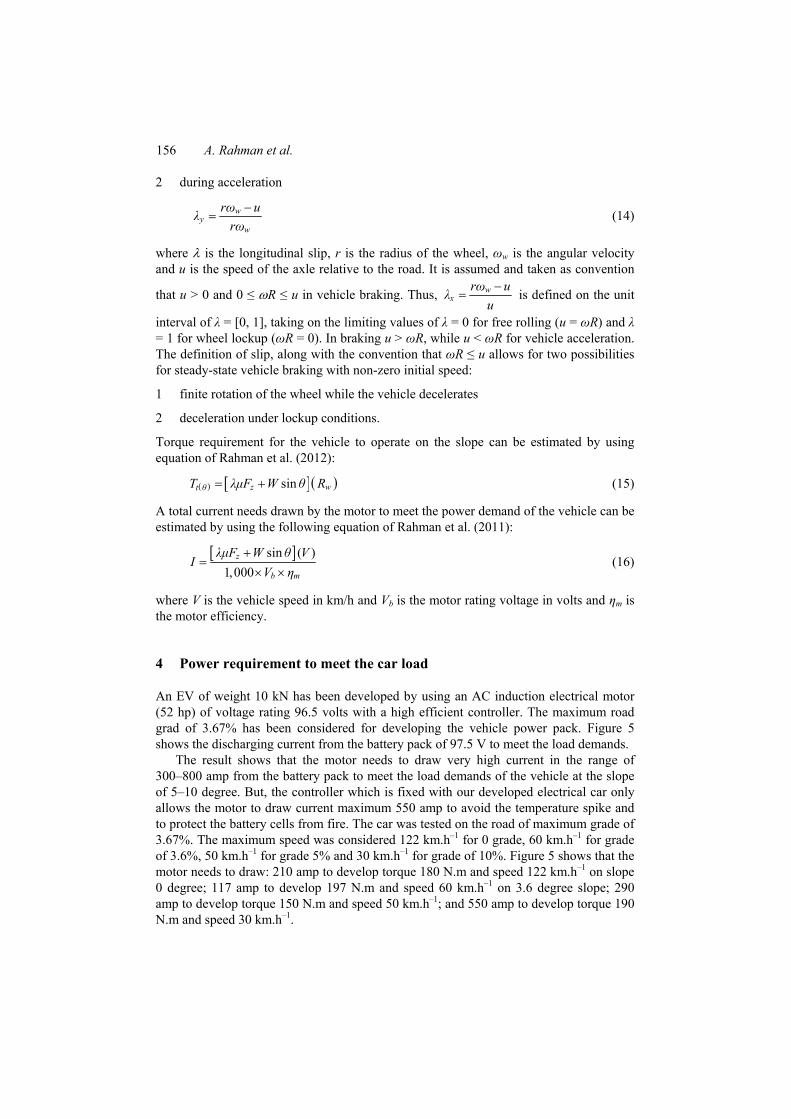
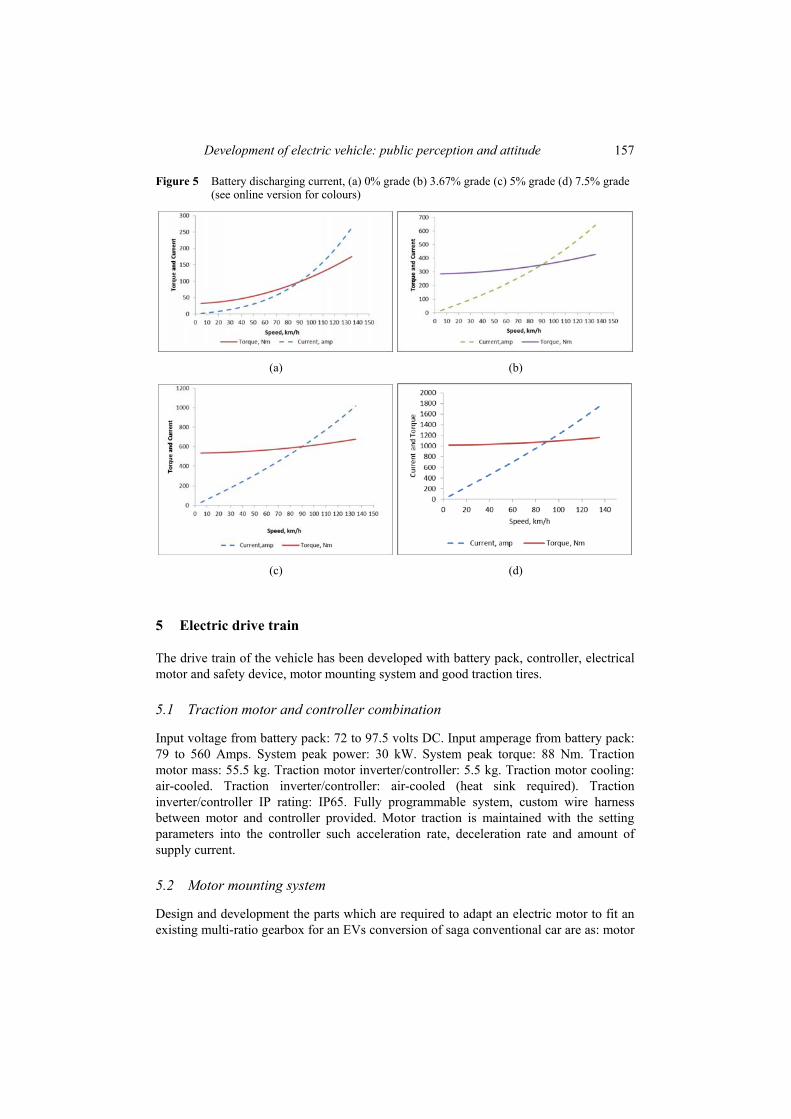
An EV of weight 10 kN has been developed by using an AC induction electrical motor (52 hp) of voltage rating 96.5 volts with a high efficient controller. The maximum road grad of 3.67% has been considered for developing the vehicle power pack. Figure 5 shows the discharging current from the battery pack of 97.5 V to meet the load demands.
The result shows that the motor needs to draw very high current in the range of 300–800 amp from the battery pack to meet the load demands of the vehicle at the slope of 5–10 degree. But, the controller which is fixed with our developed electrical car only allows the motor to draw current maximum 550 amp to avoid the temperature spike and to protect the battery cells from fire. The car was tested on the road of maximum grade of 3.67%. The maximum speed was considered 122 km.h–1 for 0 grade, 60 km.h–1 for grade of 3.6%, 50 km.h–1 for grade 5% and 30 km.h–1 for grade of 10%. Figure 5 shows that the motor needs to draw: 210 amp to develop torque 180 N.m and speed 122 km.h–1 on slope 0 degree; 117 amp to develop 197 N.m and speed 60 km.h–1 on 3.6 degree slope; 290 amp to develop torque 150 N.m and speed 50 km.h–1; and 550 amp to develop torque 190 N.m and speed 30 km.h–1.
Development of electric vehicle: public perception and attitude 157
Figure 5 Battery discharging current, (a) 0% grade (b) 3.67% grade (c) 5% grade (d) 7.5% grade (see online version for colours)
(a) (b)
(c) (d)
5 Electric drive train
The drive train of the vehicle has been developed with battery pack, controller, electrical motor and safety device, motor mounting system and good traction tires.
5.1 Traction motor and controller combination
Input voltage from battery pack: 72 to 97.5 volts DC. Input amperage from battery pack: 79 to 560 Amps. System peak power: 30 kW. System peak torque: 88 Nm. Traction motor mass: 55.5 kg. Traction motor inverter/controller: 5.5 kg. Traction motor cooling: air-cooled. Traction inverter/controller: air-cooled (heat sink required). Traction inverter/controller IP rating: IP65. Fully programmable system, custom wire harness between motor and controller provided. Motor traction is maintained with the setting parameters into the controller such acceleration rate, deceleration rate and amount of supply current.
5.2 Motor mounting system
Design and development the parts which are required to adapt an electric motor to fit an existing multi-ratio gearbox for an EVs conversion of saga conventional car are as: motor
158 A. Rahman et al.
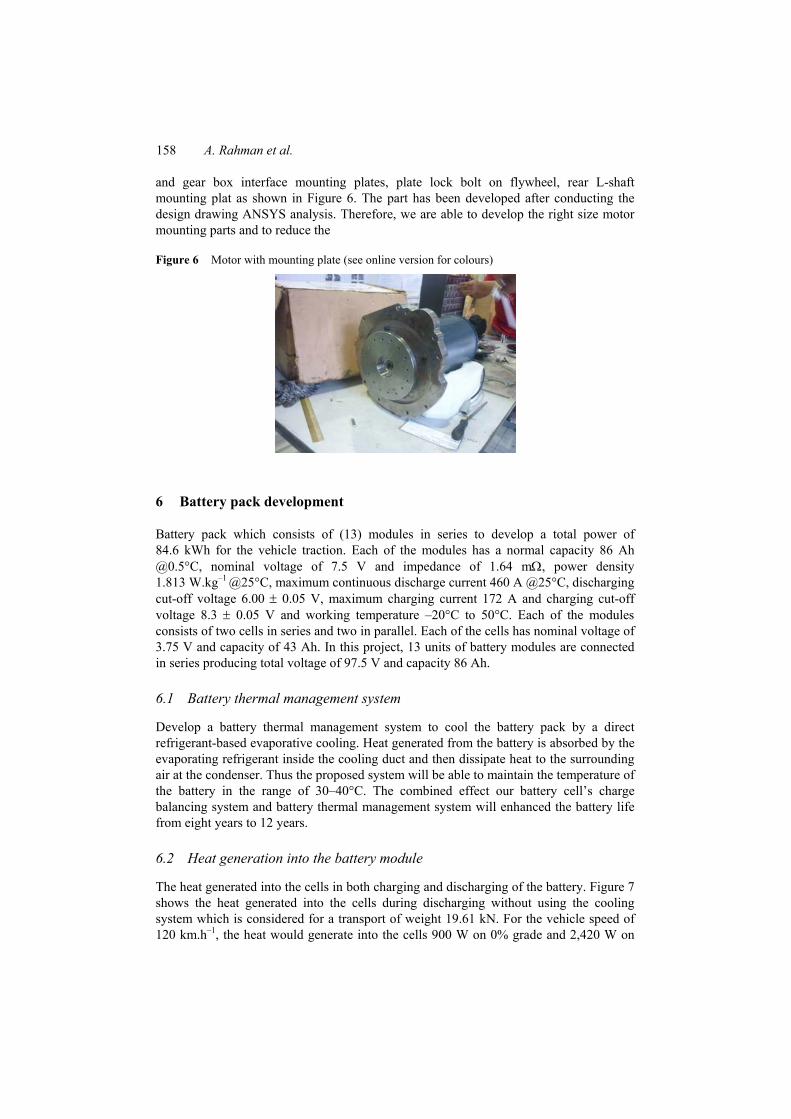
and gear box interface mounting plates, plate lock bolt on flywheel, rear L-shaft mounting plat as shown in Figure 6. The part has been developed after conducting the design drawing ANSYS analysis. Therefore, we are able to develop the right size motor mounting parts and to reduce the
Figure 6 Motor with mounting plate (see online version for colours)
6 Battery pack development
Battery pack which consists of (13) modules in series to develop a total power of 84.6 kWh for the vehicle traction. Each of the modules has a normal capacity 86 Ah @0.5°C, nominal voltage of 7.5 V and impedance of 1.64 m:, power density 1.813 W.kg–1 @25°C, maximum continuous discharge current 460 A @25°C, discharging cut-off voltage 6.00 r 0.05 V, maximum charging current 172 A and charging cut-off voltage 8.3 r 0.05 V and working temperature –20°C to 50°C. Each of the modules consists of two cells in series and two in parallel. Each of the cells has nominal voltage of 3.75 V and capacity of 43 Ah. In this project, 13 units of battery modules are connected in series producing total voltage of 97.5 V and capacity 86 Ah.
6.1 Battery thermal management system
Develop a battery thermal management system to cool the battery pack by a direct refrigerant-based evaporative cooling. Heat generated from the battery is absorbed by the evaporating refrigerant inside the cooling duct and then dissipate heat to the surrounding air at the condenser. Thus the proposed system will be able to maintain the temperature of the battery in the range of 30–40°C. The combined effect our battery cell’s charge balancing system and battery thermal management system will enhanced the battery life from eight years to 12 years.
6.2 Heat generation into the battery module
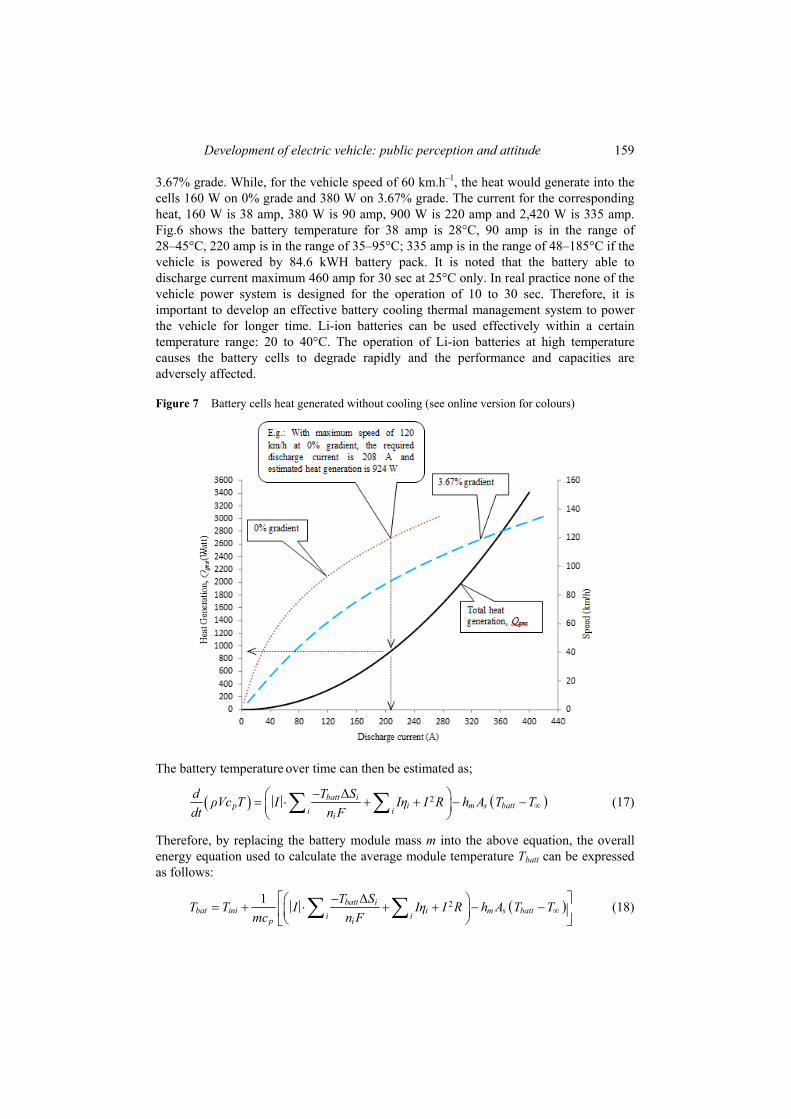
The heat generated into the cells in both charging and discharging of the battery. Figure 7 shows the heat generated into the cells during discharging without using the cooling system which is considered for a transport of weight 19.61 kN. For the vehicle speed of 120 km.h–1, the heat would generate into the cells 900 W on 0% grade and 2,420 W on
Development of electric vehicle: public perception and attitude 159
3.67% grade. While, for the vehicle speed of 60 km.h–1, the heat would generate into the cells 160 W on 0% grade and 380 W on 3.67% grade. The current for the corresponding heat, 160 W is 38 amp, 380 W is 90 amp, 900 W is 220 amp and 2,420 W is 335 amp. Fig.6 shows the battery temperature for 38 amp is 28°C, 90 amp is in the range of 28–45°C, 220 amp is in the range of 35–95°C; 335 amp is in the range of 48–185°C if the vehicle is powered by 84.6 kWH battery pack. It is noted that the battery able to discharge current maximum 460 amp for 30 sec at 25°C only. In real practice none of the vehicle power system is designed for the operation of 10 to 30 sec. Therefore, it is important to develop an effective battery cooling thermal management system to power the vehicle for longer time. Li-ion batteries can be used effectively within a certain temperature range: 20 to 40°C. The operation of Li-ion batteries at high temperature causes the battery cells to degrade rapidly and the performance and capacities are adversely affected.
Figure 7 Battery cells heat generated without cooling (see online version for colours)
The battery temperature over time can then be estimated as;
� � � �2ǻbatt ip i m s batti ii
d T SȡVc T I IȘ I R h A T Tdt n F f
�§ · � � � � �¨ ¸© ¹¦ ¦ (17)
Therefore, by replacing the battery module mass m into the above equation, the overall energy equation used to calculate the average module temperature Tbatt can be expressed as follows:
� �21 ǻbatt ibat ini i m s batti ip i
T ST T I IȘ I R h A T Tmc n F f
ª � º§ · � � � � � �« »¨ ¸© ¹¬ ¼¦ ¦ (18)
160 A. Rahman et al.
6.3 Cooling system for the battery pack
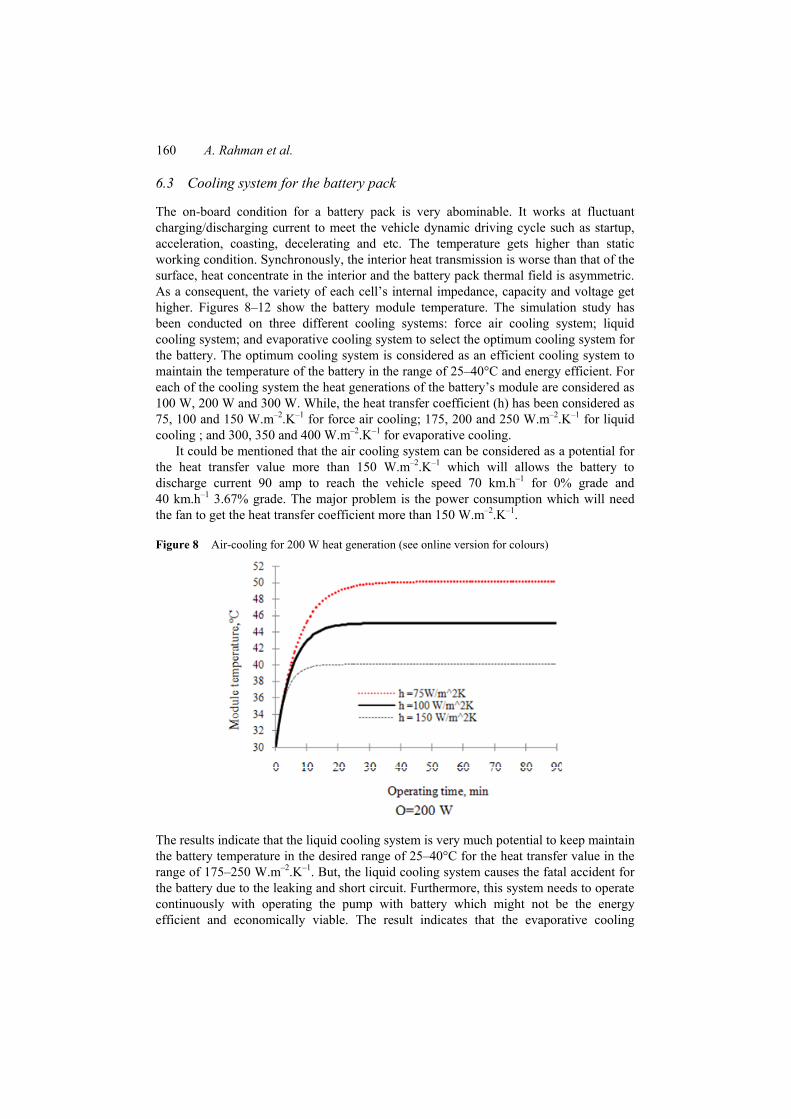
The on-board condition for a battery pack is very abominable. It works at fluctuant charging/discharging current to meet the vehicle dynamic driving cycle such as startup, acceleration, coasting, decelerating and etc. The temperature gets higher than static working condition. Synchronously, the interior heat transmission is worse than that of the surface, heat concentrate in the interior and the battery pack thermal field is asymmetric. As a consequent, the variety of each cell’s internal impedance, capacity and voltage get higher. Figures 8–12 show the battery module temperature. The simulation study has been conducted on three different cooling systems: force air cooling system; liquid cooling system; and evaporative cooling system to select the optimum cooling system for the battery. The optimum cooling system is considered as an efficient cooling system to maintain the temperature of the battery in the range of 25–40°C and energy efficient. For each of the cooling system the heat generations of the battery’s module are considered as 100 W, 200 W and 300 W. While, the heat transfer coefficient (h) has been considered as 75, 100 and 150 W.m–2.K–1 for force air cooling; 175, 200 and 250 W.m–2.K–1 for liquid cooling ; and 300, 350 and 400 W.m–2.K–1 for evaporative cooling.
It could be mentioned that the air cooling system can be considered as a potential for the heat transfer value more than 150 W.m–2.K–1 which will allows the battery to discharge current 90 amp to reach the vehicle speed 70 km.h–1 for 0% grade and 40 km.h–1 3.67% grade. The major problem is the power consumption which will need the fan to get the heat transfer coefficient more than 150 W.m–2.K–1.
Figure 8 Air-cooling for 200 W heat generation (see online version for colours)
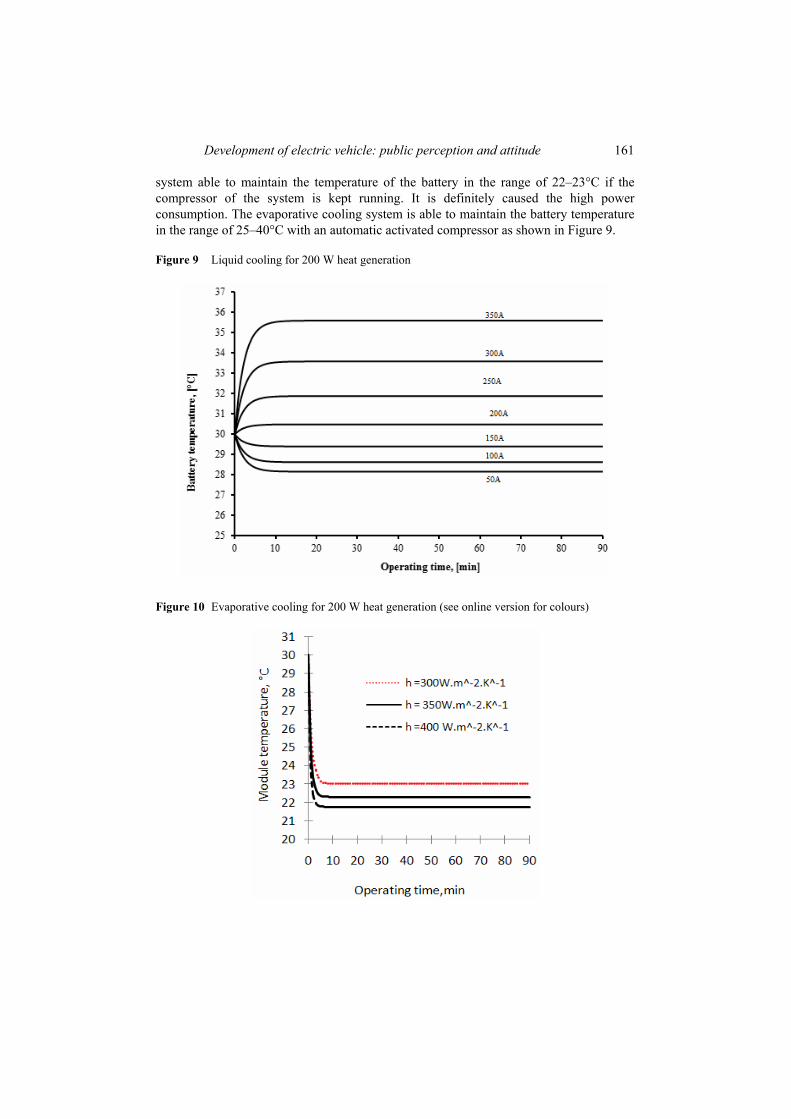
The results indicate that the liquid cooling system is very much potential to keep maintain the battery temperature in the desired range of 25–40°C for the heat transfer value in the range of 175–250 W.m–2.K–1. But, the liquid cooling system causes the fatal accident for the battery due to the leaking and short circuit. Furthermore, this system needs to operate continuously with operating the pump with battery which might not be the energy efficient and economically viable. The result indicates that the evaporative cooling
Development of electric vehicle: public perception and attitude 161
system able to maintain the temperature of the battery in the range of 22–23°C if the compressor of the system is kept running. It is definitely caused the high power consumption. The evaporative cooling system is able to maintain the battery temperature in the range of 25–40°C with an automatic activated compressor as shown in Figure 9.
Figure 9 Liquid cooling for 200 W heat generation
Figure 10 Evaporative cooling for 200 W heat generation (see online version for colours)
162 A. Rahman et al.
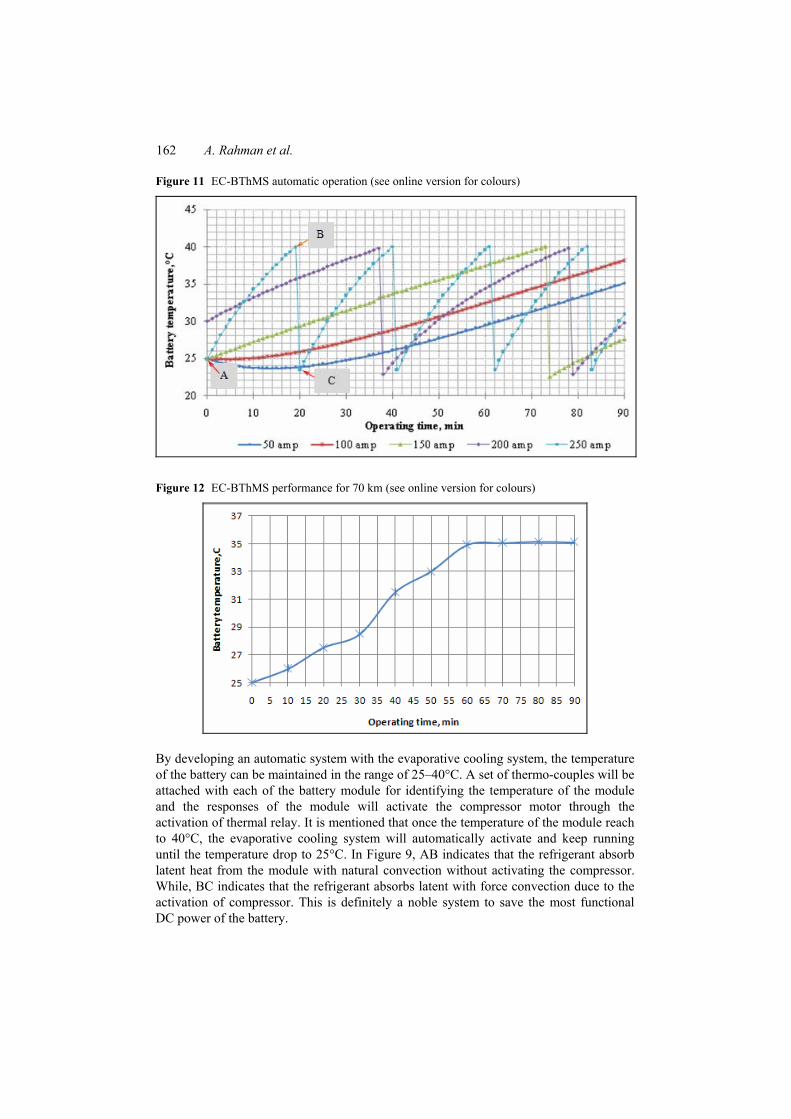
Figure 11 EC-BThMS automatic operation (see online version for colours)
Figure 12 EC-BThMS performance for 70 km (see online version for colours)
By developing an automatic system with the evaporative cooling system, the temperature of the battery can be maintained in the range of 25–40°C. A set of thermo-couples will be attached with each of the battery module for identifying the temperature of the module and the responses of the module will activate the compressor motor through the activation of thermal relay. It is mentioned that once the temperature of the module reach to 40°C, the evaporative cooling system will automatically activate and keep running until the temperature drop to 25°C. In Figure 9, AB indicates that the refrigerant absorb latent heat from the module with natural convection without activating the compressor. While, BC indicates that the refrigerant absorbs latent with force convection duce to the activation of compressor. This is definitely a noble system to save the most functional DC power of the battery.
Development of electric vehicle: public perception and attitude 163
6.4 Developed evaporative cooling system
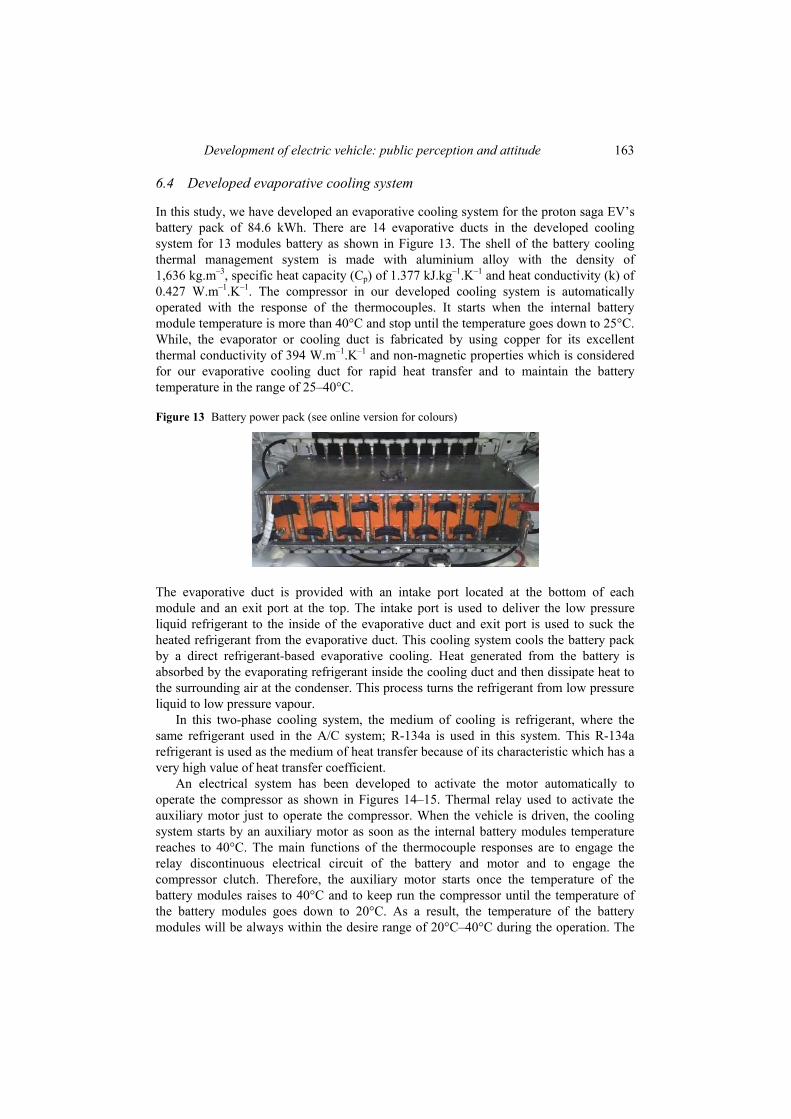
In this study, we have developed an evaporative cooling system for the proton saga EV’s battery pack of 84.6 kWh. There are 14 evaporative ducts in the developed cooling system for 13 modules battery as shown in Figure 13. The shell of the battery cooling thermal management system is made with aluminium alloy with the density of 1,636 kg.m–3, specific heat capacity (Cp) of 1.377 kJ.kg–1.K–1 and heat conductivity (k) of 0.427 W.m–1.K–1. The compressor in our developed cooling system is automatically operated with the response of the thermocouples. It starts when the internal battery module temperature is more than 40°C and stop until the temperature goes down to 25°C. While, the evaporator or cooling duct is fabricated by using copper for its excellent thermal conductivity of 394 W.m–1.K–1 and non-magnetic properties which is considered for our evaporative cooling duct for rapid heat transfer and to maintain the battery temperature in the range of 25–40°C.
Figure 13 Battery power pack (see online version for colours)
The evaporative duct is provided with an intake port located at the bottom of each module and an exit port at the top. The intake port is used to deliver the low pressure liquid refrigerant to the inside of the evaporative duct and exit port is used to suck the heated refrigerant from the evaporative duct. This cooling system cools the battery pack by a direct refrigerant-based evaporative cooling. Heat generated from the battery is absorbed by the evaporating refrigerant inside the cooling duct and then dissipate heat to the surrounding air at the condenser. This process turns the refrigerant from low pressure liquid to low pressure vapour.
In this two-phase cooling system, the medium of cooling is refrigerant, where the same refrigerant used in the A/C system; R-134a is used in this system. This R-134a refrigerant is used as the medium of heat transfer because of its characteristic which has a very high value of heat transfer coefficient.
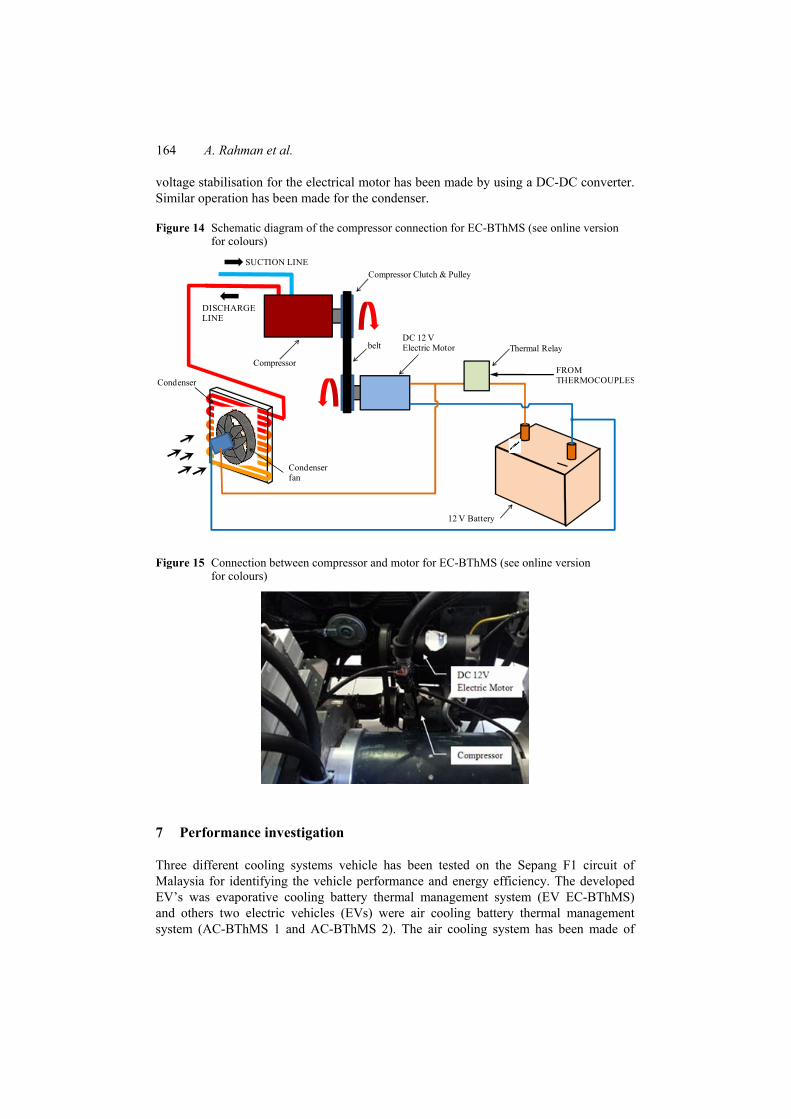
An electrical system has been developed to activate the motor automatically to operate the compressor as shown in Figures 14–15. Thermal relay used to activate the auxiliary motor just to operate the compressor. When the vehicle is driven, the cooling system starts by an auxiliary motor as soon as the internal battery modules temperature reaches to 40°C. The main functions of the thermocouple responses are to engage the relay discontinuous electrical circuit of the battery and motor and to engage the compressor clutch. Therefore, the auxiliary motor starts once the temperature of the battery modules raises to 40°C and to keep run the compressor until the temperature of the battery modules goes down to 20°C. As a result, the temperature of the battery modules will be always within the desire range of 20°C–40°C during the operation. The
164 A. Rahman et al.
voltage stabilisation for the electrical motor has been made by using a DC-DC converter. Similar operation has been made for the condenser.
Figure 14 Schematic diagram of the compressor connection for EC-BThMS (see online version for colours)
Compressor
Compressor Clutch & Pulley
beltDC 12 V Electric Motor
SUCTION LINE
DISCHARGE LINE
Condenserfan
Condenser
12 V Battery
Thermal Relay
FROMTHERMOCOUPLES
Figure 15 Connection between compressor and motor for EC-BThMS (see online version for colours)
7 Performance investigation
Three different cooling systems vehicle has been tested on the Sepang F1 circuit of Malaysia for identifying the vehicle performance and energy efficiency. The developed EV’s was evaporative cooling battery thermal management system (EV EC-BThMS) and others two electric vehicles (EVs) were air cooling battery thermal management system (AC-BThMS 1 and AC-BThMS 2). The air cooling system has been made of
Development of electric vehicle: public perception and attitude 165
AC-BThMS 1 with eight fans of each 20 W and AC-BThMS 2 with 12 fans of each 20 W.
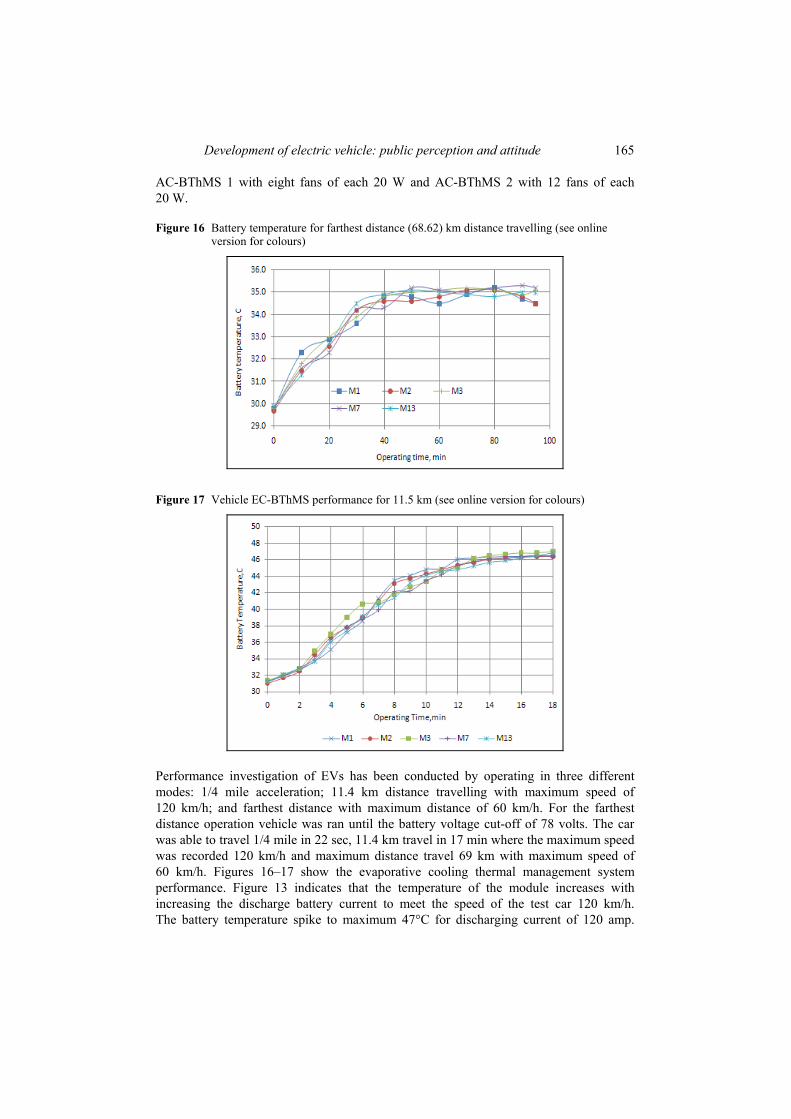
Figure 16 Battery temperature for farthest distance (68.62) km distance travelling (see online version for colours)
Figure 17 Vehicle EC-BThMS performance for 11.5 km (see online version for colours)
Performance investigation of EVs has been conducted by operating in three different modes: 1/4 mile acceleration; 11.4 km distance travelling with maximum speed of 120 km/h; and farthest distance with maximum distance of 60 km/h. For the farthest distance operation vehicle was ran until the battery voltage cut-off of 78 volts. The car was able to travel 1/4 mile in 22 sec, 11.4 km travel in 17 min where the maximum speed was recorded 120 km/h and maximum distance travel 69 km with maximum speed of 60 km/h. Figures 16–17 show the evaporative cooling thermal management system performance. Figure 13 indicates that the temperature of the module increases with increasing the discharge battery current to meet the speed of the test car 120 km/h. The battery temperature spike to maximum 47°C for discharging current of 120 amp.
166 A. Rahman et al.
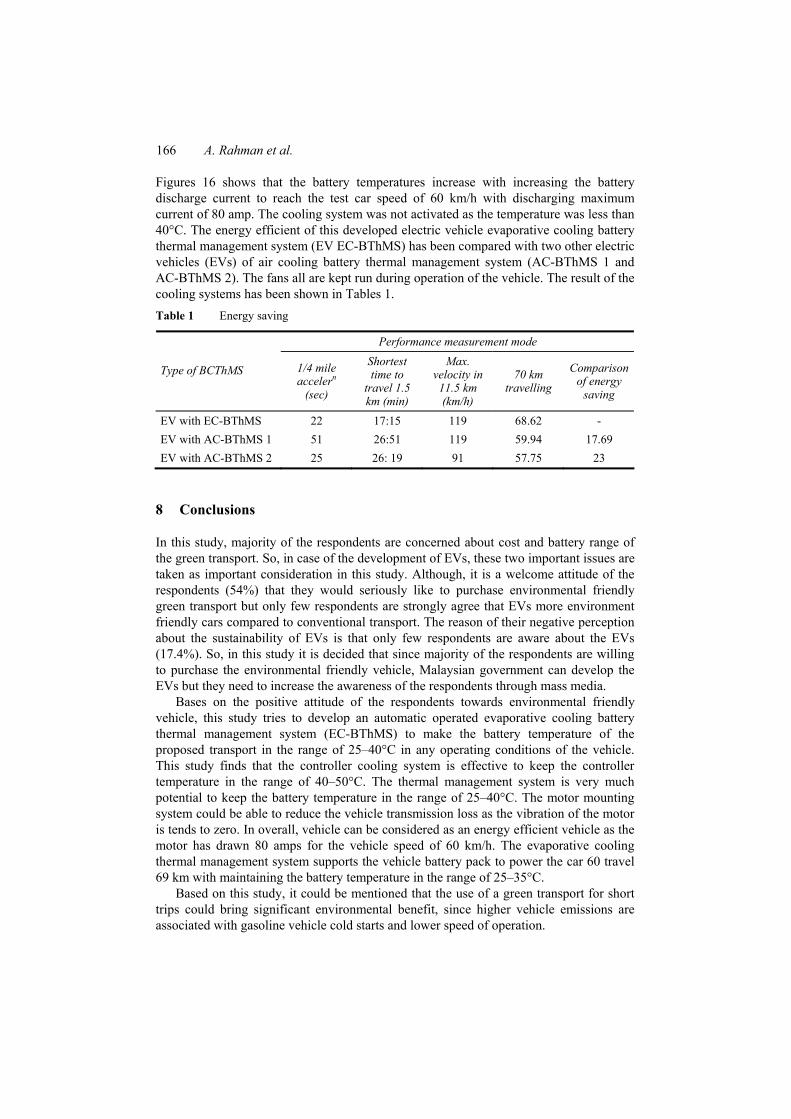
Figures 16 shows that the battery temperatures increase with increasing the battery discharge current to reach the test car speed of 60 km/h with discharging maximum current of 80 amp. The cooling system was not activated as the temperature was less than 40°C. The energy efficient of this developed electric vehicle evaporative cooling battery thermal management system (EV EC-BThMS) has been compared with two other electric vehicles (EVs) of air cooling battery thermal management system (AC-BThMS 1 and AC-BThMS 2). The fans all are kept run during operation of the vehicle. The result of the cooling systems has been shown in Tables 1. Table 1 Energy saving
Performance measurement mode
Type of BCThMS 1/4 mile accelern
(sec)
Shortest time to
travel 1.5 km (min)
Max. velocity in 11.5 km (km/h)
70 km travelling
Comparison of energy
saving
EV with EC-BThMS 22 17:15 119 68.62 - EV with AC-BThMS 1 51 26:51 119 59.94 17.69 EV with AC-BThMS 2 25 26: 19 91 57.75 23
8 Conclusions
In this study, majority of the respondents are concerned about cost and battery range of the green transport. So, in case of the development of EVs, these two important issues are taken as important consideration in this study. Although, it is a welcome attitude of the respondents (54%) that they would seriously like to purchase environmental friendly green transport but only few respondents are strongly agree that EVs more environment friendly cars compared to conventional transport. The reason of their negative perception about the sustainability of EVs is that only few respondents are aware about the EVs (17.4%). So, in this study it is decided that since majority of the respondents are willing to purchase the environmental friendly vehicle, Malaysian government can develop the EVs but they need to increase the awareness of the respondents through mass media.
Bases on the positive attitude of the respondents towards environmental friendly vehicle, this study tries to develop an automatic operated evaporative cooling battery thermal management system (EC-BThMS) to make the battery temperature of the proposed transport in the range of 25–40°C in any operating conditions of the vehicle. This study finds that the controller cooling system is effective to keep the controller temperature in the range of 40–50°C. The thermal management system is very much potential to keep the battery temperature in the range of 25–40°C. The motor mounting system could be able to reduce the vehicle transmission loss as the vibration of the motor is tends to zero. In overall, vehicle can be considered as an energy efficient vehicle as the motor has drawn 80 amps for the vehicle speed of 60 km/h. The evaporative cooling thermal management system supports the vehicle battery pack to power the car 60 travel 69 km with maintaining the battery temperature in the range of 25–35°C.
Based on this study, it could be mentioned that the use of a green transport for short trips could bring significant environmental benefit, since higher vehicle emissions are associated with gasoline vehicle cold starts and lower speed of operation.

Development of electric vehicle: public perception and attitude 167
References Benson, R.S. (1982) Thermodynamics and Gas Dynamics of Internal Combustion Engines, Vol. 1,
Clarendon Press, Oxford. Boretti, A.A. and Watson, H.C. (2009) ‘The lean burn direct-injection jet-ignition gas engine’,
International Journal of Hydrogen Energy, September, Vol. 34, No. 18, pp.7835–7841. Hodkinson, R. and Fenton, J. (2001) Lightweight Electric/Hybrid Vehicle Design, Reed
Educational and Professional Publishing Ltd 2001, Butterworth-Heinemann Linacre House, Jordan Hill, Oxford OX2 8DP, 225 Wildwood Avenue, Woburn, MA 01801-2041.
Husain, I. (2003) Electric and Hybrid Vehicles; Design Fundamentals, CRC Press, Florida, USA. Jefferson, C.M. and Barnard, R.H. (2002) Hybrid Vehicle Propulsion, WIT Press, UK. Mahlia, T.M.I., Tohno, S. and Tezuka, T. (2010) ‘History and current status of the motor vehicle
energy labeling and its implementation possibilities in Malaysia’, Renewable & Sustainable Energy Reviews, Vol. 16, No. 4, pp.1828–1844.
Minton, P.E. (1986) Handbook of Evaporation Technology, Noyes Publication, NJ, USA. Moreno, P.I.G. (2012) Two-Phase Cooling Technology for Power Electronic, National Renewable
Energy Laboratory, US. Pesaran, A.A., Vlahinos, A. and Burch, S.D. (1997) Thermal Performance of EV and HEV Battery
Modules and Packs, Center for Transportation Technologies and Systems, National Renewable Energy Laboratory, US.
Rahman, A., Hossain, A., Zahirulalam, A.H.M. and Mahbubur, R. (2012) ‘Fuzzy knowledge-based model for prediction of traction force of an electric golf car’, Journal of Terramechanics, Elsevier Publisher, Vol. 49, No. 1, pp.13–25.
Rahman, A., Mohiuddin, A.K.M. and Sany, I.I. (2011) ‘A study on the development of traction control system of a golf car’, Int. J. of Electrical and Hybrid Vehicle, Vol. 3, No. 1, pp.47–61.
Sperling, D. (1995) Future Drive: Electric Vehicles and Sustainable Transportation, Island Press, Washington DC, USA.
Statistical Year Book of Malaysia (2012) [online] http://www.statistics.gov.my/portal/download _Buku_Tahunan/files/BKKP/2012/pdf/TAB15.pdf (accessed March 2014).
Wang, L. (2005) Hybrid Electric Vehicle Design Based on a Multi-Objective Optimization Evolutionary Algorithm, Walter J. Karplus Summer Research Grant Report 2005.
Westbrook, M.H. (2001) The Electric Car: Development and Future of Battery, Hybrid and Fuel-Cell Cars, IEE Power and Energy Series 38, The Institute of Electrical Engineers, UK.