Embed Size (px)
Citation preview
Manuscript for special issue of EETRSE: Seabed Mapping in the 21st Century Conference 1
2
(a) Title: 3
Asymmetric ice-sheet retreat pattern around northern Scotland revealed by 4
marine geophysical surveys 5
6
(b) Authors: 7
Tom Bradwell, Martyn Stoker 8
9
(c) Authors’ address: 10
British Geological Survey, Murchison House, West Mains Road, EH9 3LA, UK 11
12
(d) Running Head: 13
Ice sheet retreat around Northern Scotland 14
15
16
17
18
19
20
21
22
23
24
25
26
27
1
Asymmetric ice-sheet retreat pattern around northern Scotland revealed by 1
marine geophysical surveys 2
3
4
Abstract 5
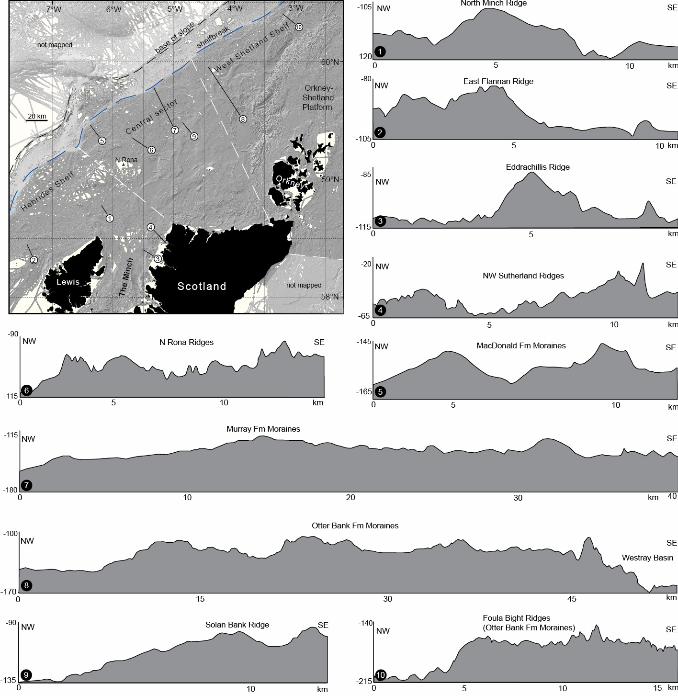
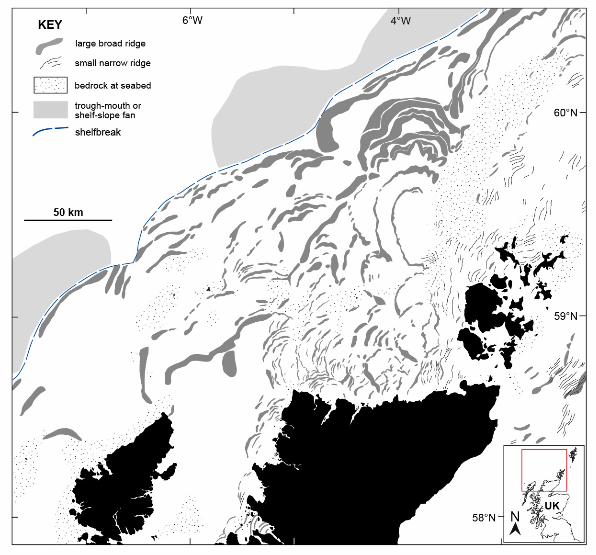
This study uses marine geophysical data, principally singlebeam and high-resolution multibeam echosounder 6 bathymetry, combined with seismic sub-bottom profiles, and existing Quaternary geological information, to 7 map the glacial geomorphology of a large area of seafloor (~50,000 km2) on the continental shelf around 8 northern Scotland, from west of Lewis to north of the Orkney Islands. Our new mapping reveals the detailed 9 pattern of submarine glacial landforms, predominantly moraines, relating to ice sheets that covered Scotland 10 and much of the continental shelf during the Late Weichselian glaciation and earlier in the Mid to Late 11 Pleistocene. The reconstructed retreat pattern based on geomorphological evidence highlights the large 12 number of different retreat stages and the asymmetric, non-uniform evolution of this ice sheet sector during 13 Late Weichselian deglaciation. Time-equivalent ice-front reconstructions show that marine sectors of the ice 14 sheet, such as the Minch, changed their geometry significantly, perhaps rapidly; whilst other sectors remained 15 relatively unchanged and stable. We suggest that this behaviour, governed principally by bed 16 topography/bathymetry and ice dynamics, led to re-organization of the Late Weichselian ice sheet as it 17 retreated back to two main ice centres: one in Western Scotland and the other over Orkney and Shetland. This 18 retreat pattern suggests relatively early deglaciation of NW Lewis (ca. 25 ka BP) and the mountains of far NW 19 Scotland – the latter possibly forming a substantial ice-free land corridor. Our reconstructions differ from most 20 previous syntheses, but are strongly supported by the independently mapped offshore Quaternary succession 21 and key onshore dating constraints. 22
23
24
Key words 25
British-Irish Ice Sheet, Late Weichselian, deglaciation, continental shelf, multibeam bathymetry 26
27
28
29
30
31
32
33
34
35
2
The rate and style of contemporary ice sheet retreat relates to a number of globally important 1
scientific and socio-economic questions (IPCC, 2013). Mapping and dating ice-sheet retreat, both 2
past and present, improves our understanding of how large ice masses dynamically respond to 3
internal and external forcing, such as glaciological, climatic and sea level perturbations. In turn, this 4
information can be used to better predict how present-day ice sheets will respond under future 5
different climatic and sea level scenarios. The former British-Irish Ice Sheet (BIIS) during the last 6
glacial cycle provides a relatively small but geospatially well constrained example of a mid-latitude 7
marine-influenced ice sheet which at its maximum was around one third the size of the present-day 8
West Antarctic Ice Sheet, or approximately equivalent to ~2 m of eustatic (global) sea level change 9
(Hubbard et al., 2009; Gibbard & Clark, 2011; Clark et al., 2012). 10
Although well studied, with over 100 years of literature on the topic, the geometry of the BIIS and its 11
deglaciation pattern in certain key sectors between the Last Glacial Maximum (LGM: ca. 25-30 ka BP) 12
and Greenland Stadial 1 (13-11.5 ka BP) are still uncertain (e.g. Sutherland, 1984; Gordon & 13
Sutherland, 1993; Evans et al., 2005; Chiverrell & Thomas, 2010). An insight into the distribution and 14
complexity of the Quaternary stratigraphic succession on the continental shelf to the north and west 15
of Scotland, as well as tentative ice limits, was established in the early 1990s as part of the BGS 16
regional offshore mapping programme of the UK Continental Shelf (Fyfe et al., 1993; Stoker et al., 17
1993). The resultant stratigraphic framework was based upon a combination of geophysical data 18
(seismic-reflection profiles), geological boreholes and shallow core material. The recent acquisition 19
of seabed imagery – combined with the legacy geophysical and geological datasets – has shed 20
important new light on the offshore extent and general retreat pattern of the ice sheet especially in 21
its northern and western sectors (Bradwell et al., 2008a; Dunlop et al., 2010; Stoker and Varming 22
2011, O Cofaigh et al., 2012; Howe et al., 2012; Stoker, 2013). Collation of the pre-existing landform 23
evidence (Clark et al., 2004) and dating constraints (Hughes et al., 2011) with new bedform mapping 24
across the British (Hughes et al., 2010) and Irish landmasses (Greenwood & Clark, 2009), and the 25
offshore landform evidence (Bradwell et al., 2008a) as well as some additional mapping, allowed 26
Clark et al. (2012) to produce an empirically based ice-sheet-wide reconstruction, with time slices 27
showing key stages of retreat. Their work is currently the best available synthesis of the 28
geomorphological evidence relating to the last BIIS, but is still only a generalised picture owing to 29
the low-resolution and variable coverage quality of the offshore datasets used. 30
In this paper we present a refinement of this picture for the NW sector. We use recently acquired 31
marine geophysical data, in the form of both singlebeam and multibeam echosounder, alongside 32
legacy seismic sub-bottom profiles, to map in detail the 3-D shape, distribution and internal 33
3
character of seabed features relating to the ice sheet that once covered northern Scotland. The 1
seabed glacial geomorphology is described and then interpreted – using geomorphological 2
principles, established landsystem models and reference to other published geological data – to 3
reconstruct a detailed and glaciologically plausible pattern of ice sheet retreat from the continental 4
shelf edge to the Scottish mainland. The resulting pattern differs from previous mapping, including 5
the interpretations presented by Bradwell et al. (2008a) and Clark et al. (2012), and opens up 6
questions about the style and retreat dynamics of deglaciation around northern Scotland and, by 7
implication, the palaeo-glaciology and palaeo-environment of the wider region. 8
9
1. Study Area 10
1.1 Geographical extent 11
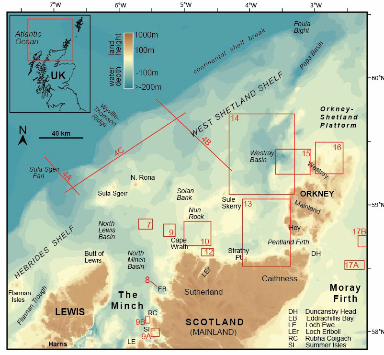
We focus on an area of the UK continental shelf around northern Scotland, where bathymetric data 12
coverage is exceptionally good and the Pleistocene seabed geomorphology is remarkably well 13
preserved. Specifically, the area comprises all the continental shelf within a box 310 km N-S by 330 14
km E-W, approximately centred on 59°N, 5°W (Fig. 1). The westward extent of the continental shelf 15
is defined by the shelfbreak, in this study approximated by the present-day 200 m water depth 16
contour. The study area also includes part of the mainland of Scotland, north of Loch Ewe, as well as 17
the islands of Orkney, Lewis and the small outlying islands and rocks of North Rona, Sula Sgeir and 18
Sule Skerry – although no onshore data has been analyzed in this study. The total area of continental 19
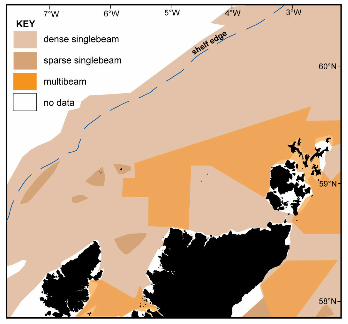
shelf seabed within the study is ca. 55,000 km2, of which >90% is covered by singlebeam bathymetry 20
data and ~45% is covered by recently acquired high-resolution multibeam data (Fig. 2). 21
22
1.2 Quaternary geology and glacial history 23
The Quaternary deposits and stratigraphy of the NW UK continental shelf are complex and difficult 24
to correlate across the whole region, largely owing to their irregular and patchy nature, and the lack 25
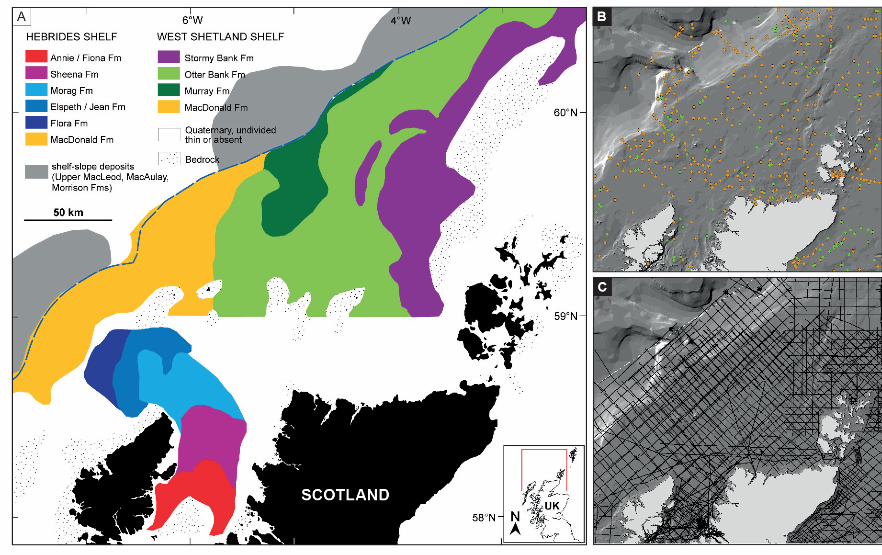
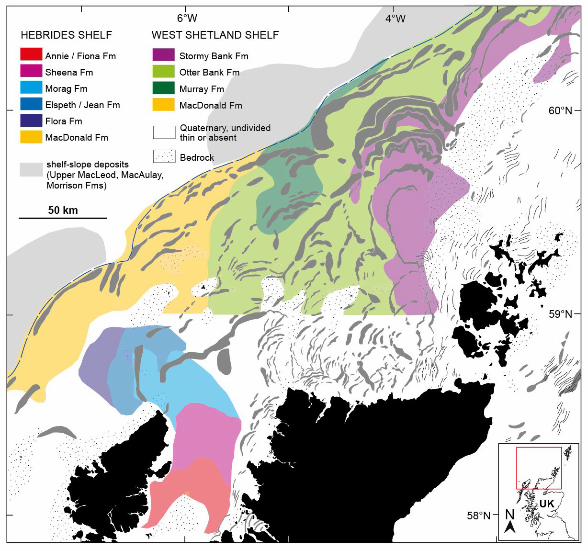
of well dated units. Stoker et al. (1993) summarised the Quaternary succession on the Hebrides and 26
West Shetland shelves based on numerous seismic reflection profiles, geological boreholes, and 27
other marine geophysical data collected by the BGS between the late 1960s and 1990 (Fig. 3). The 28
regional development of the Quaternary succession presented by Stoker et al. (1993) has since been 29
updated and summarised for both the Hebrides (Stoker, 2013) and West Shetland (Stoker and 30
Varming, 2011) regions, and work continues in order to rationalise the Quaternary stratigraphy 31
4
(Stoker et al., 2011a, b) as a basis to providing stratigraphic and geological context for seabed 1
geomorphological mapping studies and palaeo-environmental (palaeo-glaciological) reconstructions. 2
Generally speaking, the Plio-Pleistocene deposits on the Hebrides Shelf, north of the Outer Hebrides, 3
are thinner and less common than on shelf areas further south (e.g. Malin Shelf) and in the North 4
Sea sector. Seismic profiles from the northern Hebrides Shelf show an irregular glacial unconformity, 5
with overdeepened basins, cut into Mesozoic and Cenozoic strata, punctuated by locally upstanding 6
remnants of Pre-Cambrian basement rocks (e.g. Sula Sgeir High). It is in the deeper basins where 7
locally thick accumulations of Pleistocene sediments are preserved. Seismic records and boreholes 8
identify subglacial, ice contact (morainic), and proglacial (outwash) sediments overlain by 9
glaciomarine sediments within the main depocentres – the North Minch and North Lewis basins – 10
where the Quaternary sequence exceeds 100 m in places (Fyfe et al., 1993; Stoker et al., 1993; 11
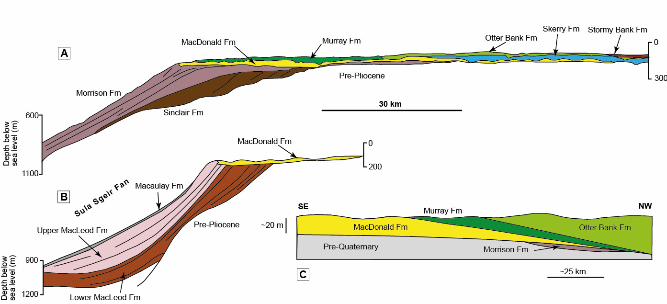
Stoker, 2013). These two large broad basins demarcate a wide bathymetric pathway, or cross-shelf 12
trough, which terminates on the continental slope, where in excess of 200m of Middle–Upper 13
Pleistocene glacially influenced sediments have accumulated on the Sula Sgeir Fan (Stoker, 1995) 14
(Figs. 1, 4). The location of this trough-mouth fan, in association with numerous diagnostic 15
geomorphological criteria onshore and offshore, led to the identification of a palaeo-ice stream in 16
this sector of the British-Irish ice sheet (Stoker and Bradwell, 2005; Bradwell et al., 2007). It is 17
thought that the Minch ice stream was a quasi-stable glaciological feature draining ca. 10,000–18
15,000 km2 of the BIIS via a convergent system of fast-flowing tributaries (Bradwell et al., 2007; 19
Bradwell, 2013); and was periodically active over the last 0.5 million years (Stoker and Bradwell, 20
2005; Stoker 2013) 21
Further north, the West Shetland Shelf has a generally similar Quaternary sediment architecture and 22
glacial history to the Hebrides Shelf further south (Stoker 1995; Stoker and Varming, 2011). 23
However, the mid-shelf is characterised by a number of thick partially overlapping diamicton-24
dominated sediment sequences forming moraine banks 30-50 m high and 3-6 km wide. Acoustically 25
well-layered ponded sediments, proved in cores to be glaciomarine sandy muds, occur between the 26
ridges. These large submarine moraines (or morainal banks), preserved on the seabed, are 27
interpreted to mark sequential stillstands or ice-front oscillations during overall south-eastward 28
retreat of the ice sheet across the shelf (Stoker and Holmes, 1991; Bradwell et al., 2008a). 29
Micropalaeontological data from shallow cores in the uppermost glacial diamicton suggest 30
deposition in water depths of less than 50 m (Stoker et al., 1993; Stoker and Varming, 2011). The 31
whole moraine complex, termed the Otter Bank Formation (Fig. 3, 4), has been shown from 32
seismostratigraphic correlations to be Late Weichselian (= Late Devensian) in age although the 33
5
sediments themselves remain undated (Stoker and Holmes, 1991). Importantly, this moraine system 1
is clearly visible on the singlebeam bathymetry NW of Orkney. The outer shelf and slope are 2
characterised by a thick wedge of Plio-Pleistocene sediments with prograding and aggrading 3
geometries. The uppermost semi-continuous ice-proximal debris-flow-dominated deposit forms the 4
Rona and Foula Wedges – interpreted as large coalescent glacigenic sediment fans fed by an ice 5
sheet margin reaching the shelf-edge west of Orkney and Shetland (Stoker 1995; Davison, 2005; 6
Stoker and Varming, 2011). 7
Close to the shelf edge, adjacent to the Sula Sgeir Fan large broad sediment ridges with iceberg-8
scoured surfaces have been mapped from seismic data as submarine moraine banks (Stoker, 1990, 9
2013; Stoker & Holmes, 1991) and stratigraphically defined as the MacDonald Formation (Stoker et 10
al., 1993; Stoker et al., 2011a). The largest of these MacDonald Formation moraines occurs at the 11
shelf edge in present-day water depths of ~200 m; it is a 20-30 m high ridge, up to 4 km wide with 12
low angle slopes, and extending laterally for 50 km. BGS seismic profiles show an acoustically 13
structureless unit makes up the bulk of the ridge, probably a glacial diamicton, although the ice-14
distal slope interdigitates with gently dipping accoustically layered units comprising the glacigenic 15
slope apron on the upper Sula Sgeir Fan (Stoker, 1990, 1995, 2013; Stoker et al., 1993) (Fig. 4). The 16
overall geometry and seismic character of the largest Macdonald Formation Moraine is similar to 17
subaqueous grounding zone features (wedges and morainal banks) seen elsewhere in glaciated shelf 18
settings (e.g. Shaw et al., 2006; Dowdeswell et al., 2008; Rydningen et al., 2013). This large moraine 19
is also visible in singlebeam echosounder bathymetry data. The MacDonald Formation moraines 20
were taken as evidence of widespread glaciation on the Hebrides Shelf during the Late Pleistocene 21
(Stoker and Holmes, 1991; Stoker et al., 1993, 1994). However, a more precise age and their 22
relationship with seabed moraines to the north and south remain unclear, though seismic-23
stratigraphic evidence indicates that their deposition pre-dates the moraines of the Otter Bank 24
Formation, which rest with angular discordance on the MacDonald Formation (Stoker and Holmes, 25
1991; Stoker et al., 1993). Despite this stratigraphic discordance, subsequent large-scale shelf-wide 26
seabed geomorphological mapping and the resulting reconstructions have tentatively correlated 27
these outer Hebrides Shelf moraines with others on outer West Shetland Shelf, ~150 km to the NE 28
(Bradwell et al., 2008a; Thomas and Chiverrell, 2010; Clark et al., 2012). Clearly, on the basis of 29
seabed imagery alone, the stratigraphic and chronological basis for these correlations remains 30
ambiguous. 31
32
33
6
1.3 Sea level history 1
Whether or not the last British-Irish ice sheet had large marine sectors, grounded below sea level, 2
during deglaciation is currently a topic of key interest (cf. Clark et al., 2012 Chiverrell et al., 2013; 3
Finlayson et al., 2014); one which impacts strongly on the style and dynamics of ice sheet retreat 4
(e.g. Alley et al., 2005; Schoof, 2012). At the time of Last Glacial Maximum, when Scotland was 5
covered by a Late Weichselian ice sheet, global eustatic sea level was around 110-130 m below 6
present (Lambeck, 1991, 1993; Peltier and Fairbanks, 2006). The relative sea level picture at this 7
time offshore western Scotland was complex and is not well constrained on the NW continental 8
shelf, but would have varied with distance from the main area of isostatic depression (Lambeck, 9
1993; Gordon and Sutherland, 1993). The apparent absence of raised marine (MIS 2) shorelines in 10
the Outer Hebrides (Dawson, 1984) indicates that sea levels were probably lower than today at ice-11
free times during much of the last glacial cycle. Numerical glacial rebound models predict that the 12
Isle of Lewis and the adjacent Hebrides Shelf have experienced relative sea levels below that of the 13
present day since c. 16 ka BP and probably since the global sea level minima (~26 ka BP) (Lambeck, 14
1991, 1993; Milne et al., 2006). Northern hemisphere ice sheet deglaciation produced rapidly rising 15
eustatic sea levels between ~14-8 ka BP, however there is no evidence for raised sea levels in the 16
Outer Hebrides even during the Holocene, suggesting that local crustal isostatic depression was 17
great enough to more than offset eustatic sea level changes in the peripheries of NW Scotland. A 18
similar setting is envisaged in Shetland where no raised shorelines have been identified (Sissons, 19
1987) and relative sea levels are thought to have risen continuously (if not smoothly) from 20
deglaciation to the present day (Lambeck, 1991; Shennan et al., 2006). During Late Weichselian ice 21
sheet deglaciation (~18-16 ka BP), modelled seawater depths across much of the continental shelf 22
around northern Scotland, between the Flannan Isles and Shetland, were 40 to 80 m lower than the 23
present day (Lambeck, 1991, 1993). However, as previously mentioned this sea level scenario varied 24
considerably with distance away from the centre of isostatic depression, with contemporaneous 25
relative sea level at the coastline (Cape Wrath, ~18-16 ka BP) being at or around the present-day 26
marine limit; whilst ~180 km further S in Skye and Arisaig, nearer the maximum isostatic depression, 27
relative sea levels were probably 20-40 m higher than present during the same time period 28
(Lambeck, 1991; Shennan et al., 2006). 29
30
31
32
7
2. Methods 1
Shelf-wide singlebeam echosounder bathymetric datasets were used in conjunction with high-2
resolution multibeam data to map the glacial geomorphology of a large area (c. 50,000 km2) of the 3
UK continental shelf. The singlebeam echosounder data is part of a global dataset, managed and 4
compiled by Olex AS (Trondheim) and licensed for scientific research. The multibeam echosounder 5
data was collected between 2006-2012 by various survey vessels under contract to the Maritime & 6
Coastguard Agency (MCA), and forms part of an ongoing UK-wide bathymetric survey programme 7
conducted on behalf of the UK Hydrographic Office (UKHO). Both datasets use global navigation 8
satellite systems (GNSS) for geo-spatial positioning. The singlebeam data has a positional accuracy of 9
10 m or less; vertical resolution ranges from 0.1 to 1 m. The dataset is more robust where multiple 10
soundings have been conducted in the same area. Bathymetric surfaces can only be viewed and 11
exported using the bespoke software which operates in Linux. The multibeam data is collected to 12
UKHO survey standard using high-precision GNSS data and has a positional accuracy of <0.5 m in xyz 13
and a resolution of <1 m. The final output data is made available at 5 m resolution. The bathymetric 14
data were processed and gridded at the British Geological Survey. Data manipulation and 15
visualisation were conducted in Fledermaus software, allowing full 3-D visualisation and 16
enhancement of bathymetric surfaces. High resolution geotiffs of the surface elevation data layers 17
were imported into ArcGIS 10.1 where geomorphological features were digitising manually using 18
bathymetric hillshade and slope models to aid accuracy. Specific details relating to geophysical data 19
acquisition are not detailed here but are available in the Reports of Survey, available on request 20
from MCA/UKHO or BGS/NERC. 21
22
3. Results 23
3.1 Seabed geomorphology 24
The digital bathymetric datasets around northern Scotland reveal well-preserved suites of seabed 25
landforms covering large parts of the continental shelf (Figs. 5, 6). This section systematically 26
describes the geomorphology of these landforms, principally their 3-D shape and spatial relationship 27
with other features. Where possible these descriptions incorporate other published and unpublished 28
geological information, principally BGS seismic sub-bottom profiles, marine cores and Quaternary 29
geological maps to examine substrate composition and aid landform interpretation. For 30
convenience, we subdivide the following Results section into 3 distinct geographical/bathymetric 31
8
areas: (i) The Minch and Hebrides Shelf; (ii) The Central sector; (iii) the West Shetland Shelf and 1
Orkney-Shetland Platform (Fig. 5). 2
3
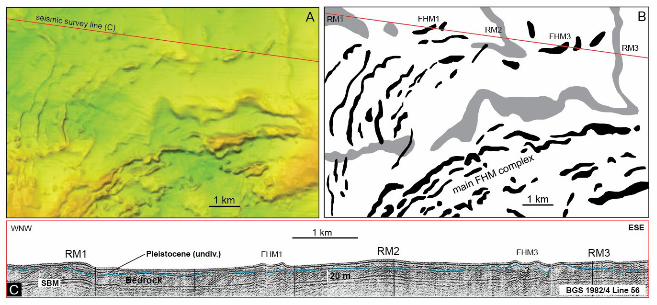
3.1.1 The Minch and Hebrides Shelf. Along the continental shelf edge in present-day water 4
depths of ~180-200 m and adjacent to the Sula Sgeir Fan the bathymetry data shows a single, 5
continuous, broad ridge gently arcuate to the SE, 3-5 km wide, 20-30 m high and up to 60 km long. 6
This is the largest, outermost MacDonald Formation moraine mapped at the shelfbreak and 7
previously described by Stoker (1990) and Stoker and Holmes (1991) (see 1.2 above). Three 8
morphologically similar, 10-15 km long, 2-5 km broad, arcuate ridges, are clearly visible 10-30 km to 9
the E (inboard) of the outermost moraine. These ridges are mapped from bathymetry data in the 10
same location as fragmentary seabed moraines were recorded on seismic profiles by Stoker et al. 11
(1993; Fig 77). As such, we interpret these outer shelf ridges collectively as broad subaqueous 12
moraines (or grounding-line features) part of the Middle–Upper Pleistocene MacDonald Formation, 13
with clear lateral extensions to the NE (Figs. 4-6) (see below, 3.1.2). 14
North of Lewis on the mid shelf in water depths of 100-120 m, are two large broad ridges trending 15
across the wide cross-shelf trough linking the Minch to the Sula Sgeir Fan. The outer ridge, which we 16
call the North Lewis Ridge, ranges in width from 2-5 km and has a maximum height of 20 m above 17
the surrounding sea floor. This discontinuous ridge is 40-50 km long; however, the singlebeam 18
bathymetry data is sparse in the central part of the ridge system, which consequently remains 19
undefined. The main ridge is curvilinear in form arcing round from a northerly orientation offshore 20
northernmost Lewis to an NE-SW orientation in its northern part, i.e. concave in planform towards 21
mainland Scotland. Bathymetric cross profiles show no preferred slope asymmetry (Fig. 5). Seismic 22
profiles show this region of seafloor is characterised by a featureless, in places acoustically 23
transparent unit, which correlates with a 20-m thick stiff foraminiferous clay proved in BGS borehole 24
77/08 (Fyfe et al., 1993). The inner broad ridge, which we here call the North Minch Ridge, is a well 25
imaged feature in the singlebeam data trending generally NE-SW between the North Lewis and 26
North Minch basins. This continuous ridge is 20-25 km long, 10-20 m high and 3-6 km wide, with 27
linear and curvilinear sections in planform. Singlebeam echosounder data show that the North 28
Minch Ridge is asymmetrical in cross profile in its central section with a steeper NW-facing (distal) 29
slope and a single broad crestline (Fig. 4). Bedrock does not outcrop in the vicinity of this ridge (BGS, 30
1989, 1994). BGS seismic profiles show a thick Quaternary succession in and around the North Lewis 31
Basin and BGS borehole 77/08 on the flank of the North Minch Ridge recovered >20 m of stiff pebbly 32
clay with arctic microfauna indicating glaciomarine sedimentation (Fyfe et al., 1993). Approximately 33
9
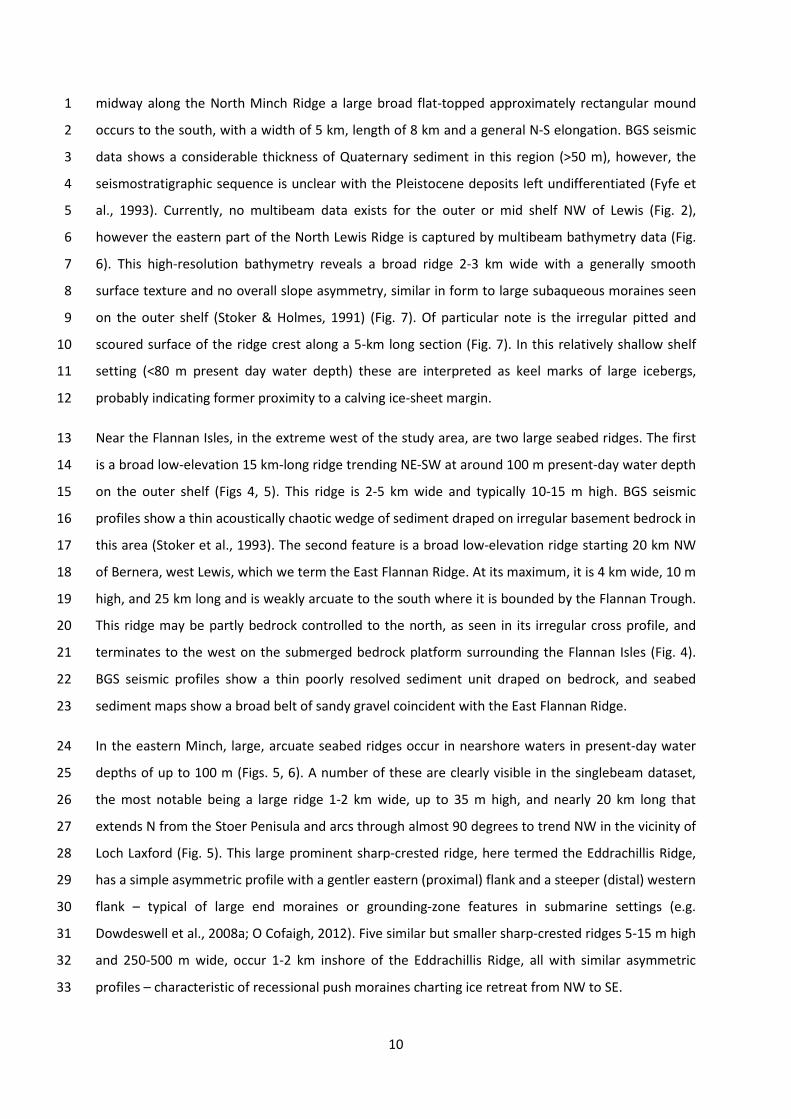
midway along the North Minch Ridge a large broad flat-topped approximately rectangular mound 1
occurs to the south, with a width of 5 km, length of 8 km and a general N-S elongation. BGS seismic 2
data shows a considerable thickness of Quaternary sediment in this region (>50 m), however, the 3
seismostratigraphic sequence is unclear with the Pleistocene deposits left undifferentiated (Fyfe et 4
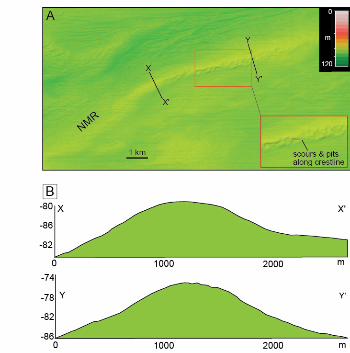
al., 1993). Currently, no multibeam data exists for the outer or mid shelf NW of Lewis (Fig. 2), 5
however the eastern part of the North Lewis Ridge is captured by multibeam bathymetry data (Fig. 6
6). This high-resolution bathymetry reveals a broad ridge 2-3 km wide with a generally smooth 7
surface texture and no overall slope asymmetry, similar in form to large subaqueous moraines seen 8
on the outer shelf (Stoker & Holmes, 1991) (Fig. 7). Of particular note is the irregular pitted and 9
scoured surface of the ridge crest along a 5-km long section (Fig. 7). In this relatively shallow shelf 10
setting (<80 m present day water depth) these are interpreted as keel marks of large icebergs, 11
probably indicating former proximity to a calving ice-sheet margin. 12
Near the Flannan Isles, in the extreme west of the study area, are two large seabed ridges. The first 13
is a broad low-elevation 15 km-long ridge trending NE-SW at around 100 m present-day water depth 14
on the outer shelf (Figs 4, 5). This ridge is 2-5 km wide and typically 10-15 m high. BGS seismic 15
profiles show a thin acoustically chaotic wedge of sediment draped on irregular basement bedrock in 16
this area (Stoker et al., 1993). The second feature is a broad low-elevation ridge starting 20 km NW 17
of Bernera, west Lewis, which we term the East Flannan Ridge. At its maximum, it is 4 km wide, 10 m 18
high, and 25 km long and is weakly arcuate to the south where it is bounded by the Flannan Trough. 19
This ridge may be partly bedrock controlled to the north, as seen in its irregular cross profile, and 20
terminates to the west on the submerged bedrock platform surrounding the Flannan Isles (Fig. 4). 21
BGS seismic profiles show a thin poorly resolved sediment unit draped on bedrock, and seabed 22
sediment maps show a broad belt of sandy gravel coincident with the East Flannan Ridge. 23
In the eastern Minch, large, arcuate seabed ridges occur in nearshore waters in present-day water 24
depths of up to 100 m (Figs. 5, 6). A number of these are clearly visible in the singlebeam dataset, 25
the most notable being a large ridge 1-2 km wide, up to 35 m high, and nearly 20 km long that 26
extends N from the Stoer Penisula and arcs through almost 90 degrees to trend NW in the vicinity of 27
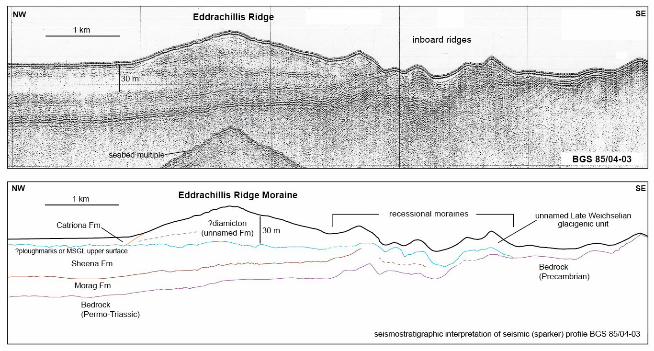
Loch Laxford (Fig. 5). This large prominent sharp-crested ridge, here termed the Eddrachillis Ridge, 28
has a simple asymmetric profile with a gentler eastern (proximal) flank and a steeper (distal) western 29
flank – typical of large end moraines or grounding-zone features in submarine settings (e.g. 30
Dowdeswell et al., 2008a; O Cofaigh, 2012). Five similar but smaller sharp-crested ridges 5-15 m high 31
and 250-500 m wide, occur 1-2 km inshore of the Eddrachillis Ridge, all with similar asymmetric 32
profiles – characteristic of recessional push moraines charting ice retreat from NW to SE. 33
10
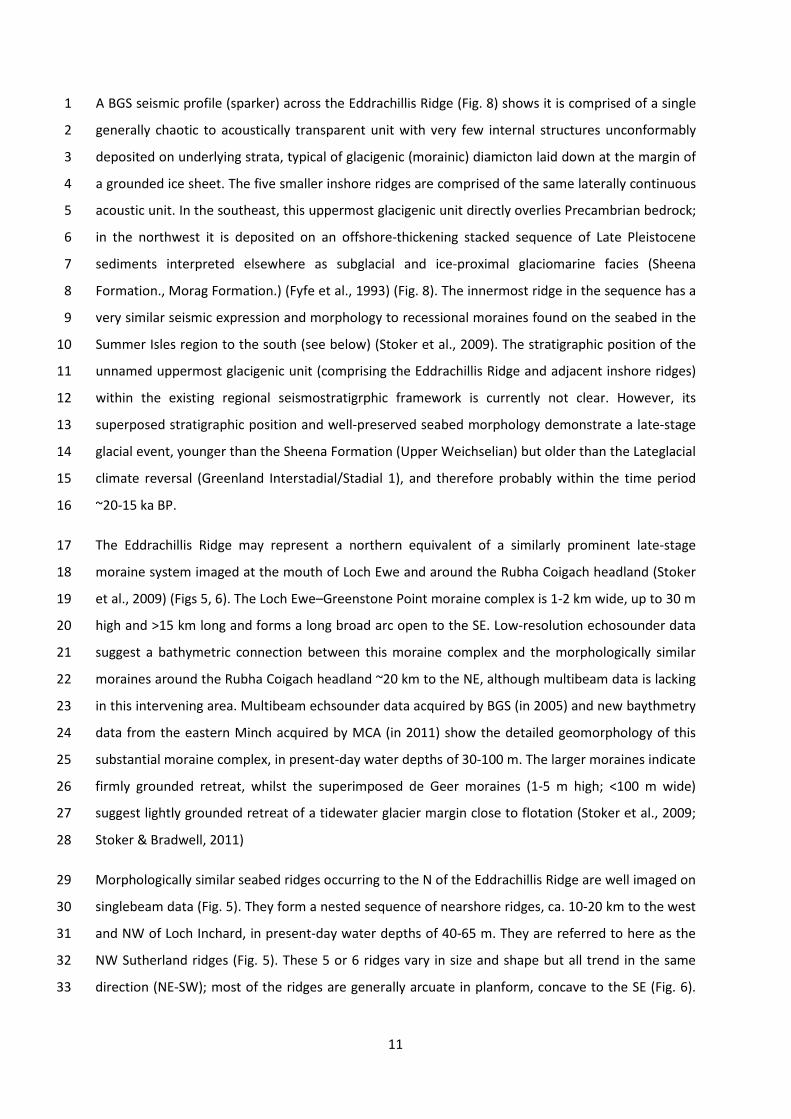
A BGS seismic profile (sparker) across the Eddrachillis Ridge (Fig. 8) shows it is comprised of a single 1
generally chaotic to acoustically transparent unit with very few internal structures unconformably 2
deposited on underlying strata, typical of glacigenic (morainic) diamicton laid down at the margin of 3
a grounded ice sheet. The five smaller inshore ridges are comprised of the same laterally continuous 4
acoustic unit. In the southeast, this uppermost glacigenic unit directly overlies Precambrian bedrock; 5
in the northwest it is deposited on an offshore-thickening stacked sequence of Late Pleistocene 6
sediments interpreted elsewhere as subglacial and ice-proximal glaciomarine facies (Sheena 7
Formation., Morag Formation.) (Fyfe et al., 1993) (Fig. 8). The innermost ridge in the sequence has a 8
very similar seismic expression and morphology to recessional moraines found on the seabed in the 9
Summer Isles region to the south (see below) (Stoker et al., 2009). The stratigraphic position of the 10
unnamed uppermost glacigenic unit (comprising the Eddrachillis Ridge and adjacent inshore ridges) 11
within the existing regional seismostratigrphic framework is currently not clear. However, its 12
superposed stratigraphic position and well-preserved seabed morphology demonstrate a late-stage 13
glacial event, younger than the Sheena Formation (Upper Weichselian) but older than the Lateglacial 14
climate reversal (Greenland Interstadial/Stadial 1), and therefore probably within the time period 15
~20-15 ka BP. 16
The Eddrachillis Ridge may represent a northern equivalent of a similarly prominent late-stage 17
moraine system imaged at the mouth of Loch Ewe and around the Rubha Coigach headland (Stoker 18
et al., 2009) (Figs 5, 6). The Loch Ewe–Greenstone Point moraine complex is 1-2 km wide, up to 30 m 19
high and >15 km long and forms a long broad arc open to the SE. Low-resolution echosounder data 20
suggest a bathymetric connection between this moraine complex and the morphologically similar 21
moraines around the Rubha Coigach headland ~20 km to the NE, although multibeam data is lacking 22
in this intervening area. Multibeam echsounder data acquired by BGS (in 2005) and new baythmetry 23
data from the eastern Minch acquired by MCA (in 2011) show the detailed geomorphology of this 24
substantial moraine complex, in present-day water depths of 30-100 m. The larger moraines indicate 25
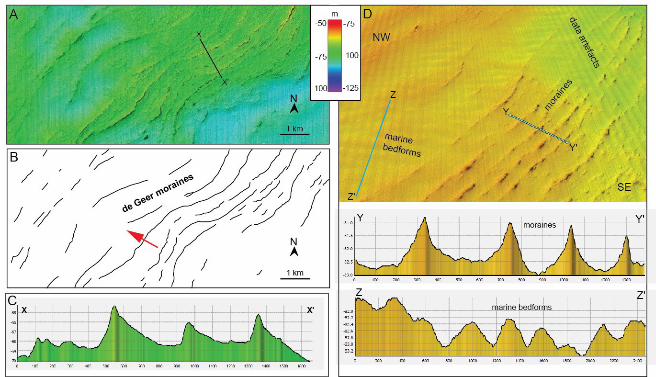
firmly grounded retreat, whilst the superimposed de Geer moraines (1-5 m high; <100 m wide) 26
suggest lightly grounded retreat of a tidewater glacier margin close to flotation (Stoker et al., 2009; 27
Stoker & Bradwell, 2011) 28
Morphologically similar seabed ridges occurring to the N of the Eddrachillis Ridge are well imaged on 29
singlebeam data (Fig. 5). They form a nested sequence of nearshore ridges, ca. 10-20 km to the west 30
and NW of Loch Inchard, in present-day water depths of 40-65 m. They are referred to here as the 31
NW Sutherland ridges (Fig. 5). These 5 or 6 ridges vary in size and shape but all trend in the same 32
direction (NE-SW); most of the ridges are generally arcuate in planform, concave to the SE (Fig. 6). 33
11
The outer ridges are broader and generally lower whilst the inner ridges are higher and better 1
defined; the innermost ridge is the most pronounced being <1000 m wide and rising 20 m from the 2
seabed. Most of the ridges have no overall slope asymmetry in cross profile (Fig. 5). The inner ridges 3
due west of the Sheigra headland when projected along trend would make landfall in the vicinity of 4
Sandwood Bay; the outermost ridges would make landfall further north in the vicinity of Cape Wrath 5
(Fig. 6). BGS seismic lines across this part of the eastern Minch show these sediment ridges to a have 6
a similar acoustic character to the Eddrachillis Ridge – with a single acoustically chaotic unit 7
unconformably overlying an irregular bedrock reflector, characteristic of diamicton-dominated end 8
moraines. Unfortunately, this group of well-developed ice-sheet moraines is outside the area 9
covered by existing multibeam data (Fig. 2), hence more detailed morphological information is 10
currently lacking. 11
All the nearshore moraines in the eastern Minch described in this section are relatively large, well 12
defined, morpho-stratigraphically equivalent features in similar water depths. We therefore suggest 13
they were broadly coeval in formation and informally assign these moraines to the Late Pleistocene 14
deglacial succession, stratigraphically older than the Assynt Glacigenic Formation (<16 ka BP) further 15
inshore and stratigraphically younger than the Fiona Formation–Loch Broom Till Formation (~20-25 16
ka BP) (Stoker and Bradwell, 2011). 17
In the south of the study area, from the Gairloch and Coigach headlands inshore to the heads of the 18
fjords (Loch Ewe, Loch Broom and Little Loch Broom) are numerous transverse seabed ridges in 19
water depths typically from 30 to 100 m (Fig. 9). This part of the eastern Minch known as the 20
Summer Isles region was surveyed with multibeam echosounder and sub-bottom acoustic profiling 21
by BGS in 2005, and over 100 seabed cores were recovered in separate scientific cruises in 2006 and 22
2009. The results of these data acquisitions have been the focus of detailed geomorphological and 23
geological studies (Stoker et al., 2006, 2009; Stoker & Bradwell, 2011). Over 50 seabed ridges have 24
been mapped in the area trending generally SSW-NNE and varying in length from 0.5 to 5 km; ridge 25
spacings typically range from 500 to 1000 m. There are 2 distinct sets: an older group of more 26
substantial ridges (5-15 m high; 80-150 m wide), and a younger group of smaller more delicate 27
ridges (2-5 m high; 30-50 m wide), superimposed on the earlier ridges (Fig. 9). Most ridges are 28
simple in planform consisting of linear sections; however some are more intricate in planform 29
describing intricate or zigzag patterns. Occasionally ridges continue to water depths of 100 m but in 30
basins and bathymetric deeps the ridges are notably absent. The larger ridges are typically 31
asymmetric in cross-profile, whilst the smaller more delicate ridges tend to be symmetrical. BGS 32
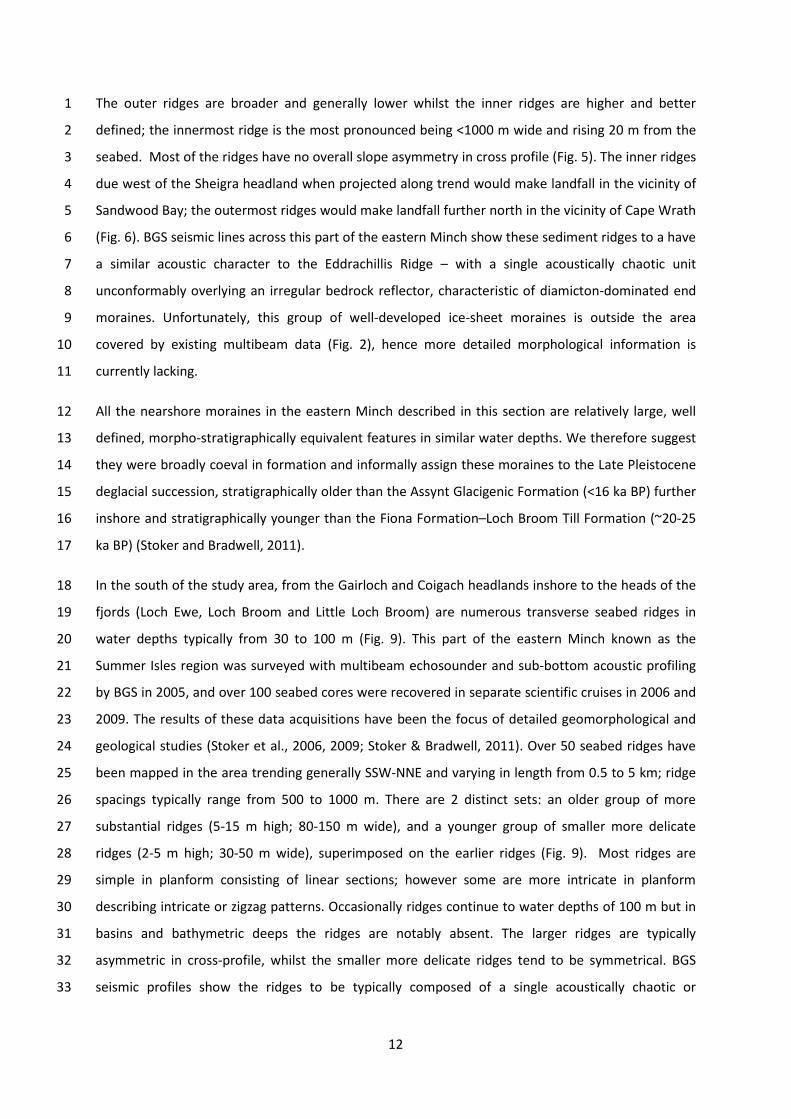
seismic profiles show the ridges to be typically composed of a single acoustically chaotic or 33
12
structureless unit draped unconformably on an irregular bedrock surface (Fig. 9). A core taken from 1
the flank of a seabed ridge recovered a massive, poorly sorted, sandy to muddy diamicton with 2
numerous striated clasts of non-local lithology (Stoker et al., 2009). The whole suite of seabed ridges 3
have been lithostratigraphically assigned to the Assynt Glacigenic Formation and are interpreted as 4
subaqueous moraines (and/or de Geer moraines), formed at the grounded, or partially buoyant, 5
tidewater margin of a retreating ice sheet (Stoker et al., 2006; Stoker et al., 2009). In places, around 6
the mouths of Loch Broom and Little Loch Broom these moraines have clear onshore counterparts 7
which have been studied and in places dated with terrestrial cosmogenic nuclides (~15 ka BP; 8
Bradwell et al., 2008b). 9
10
3.1.2 Central Sector. The seabed in the central sector of the study area is generally shallower, 11
more rugged and more topographically variable than the shelf areas to the SE and NW. The 12
bathymetry is punctuated by a number of large structural bedrock highs and platforms on the mid 13
shelf; these include the North Rona, Solan Bank, and Nun Rock-Sule Skerry Highs (Figs 1). Extensive 14
singlebeam data coverage and good multibeam data coverage exists for this part of the shelf 15
affording an excellent view of the seabed geomorphology (Fig. 5). The seabed in this central sector is 16
characterised by an abundance of seabed ridges, with over 100 mapped in this study. 17
Approximately 5-30 km from the shelf break, on the outer shelf, ~30-50 km NE of North Rona at 18
least four large, broad ridges extend semi-continuously for ~100 km in a NE-SW direction parallel to 19
the continental shelfbreak. They are typically between 3-4 km wide increasing in width (to 4-5 km) to 20
the NE with smooth subdued cross profiles (Fig. 5). The ridges are generally low-elevation features 21
ranging in height from 10-20 m. Overall the ridges are broadly arcuate in planform but with long 22
linear sections (Fig. 6). The exact plan morphology of the ridges is not easy to establish, even with 23
image enhancement, owing to their subdued form and the vertical resolution of the singlebeam 24
data. However, the new mapping is an improvement on that presented in Bradwell et al (2008a) and 25
gives a better impression of the lateral continuity and spatial inter-relationship of these ridges; for 26
example it is clear that the outermost fragmentary ridge is cut out or overprinted, at least in part, by 27
the adjacent inshore ridge (Fig. 6). BGS seismic profiles across this part of the outer shelf show 28
acoustically structureless or chaotic packages in the upper part of the sequence (<40 m thick) which 29
occasionally interdigitate with layered deposits near the shelf break. BGS seismostratigraphic 30
mapping supported by borehole evidence places these NE-SW trending broad ridges within the 31
Murray or MacDonald Formations (Stoker et al. 1993; BGS, 1994) – a Late Pleistocene suite of ice-32
proximal to glaciomarine sediments laid down prior to the Otter Bank Formation (Stoker and 33
13
Holmes, 1991). Whereas, spatial relationships revealed in the new bathymetry data (this study) 1
suggest that the inner three ridges can be traced onto the northernmost part of the Hebrides Shelf – 2
seemingly offering a potential correlation with the MacDonald Formation moraines at seabed – their 3
stratigraphic relationship (angular discordance) with other Pleistocene deposits must be taken into 4
consideration in any proposed reconstruction (Fig. 4). 5
Further inshore, on the mid shelf to the NE of North Rona, another group of seabed ridges are well 6
imaged on the singlebeam bathymetry. For convenience, we term these collectively the N Rona 7
Ridges (Fig. 5). Four large broad ridges interspersed with several smaller ridges occur in present day 8
water depths of 80-130 m, in a region of highly variable bathymetry including the North Rona Basin 9
and western part of the Solan Bank High (Figs 5, 6). The larger ridges are 2-4 km wide and 10-20 m 10
high; the smaller ridges are up to 2 km wide and of similar vertical relief (10-20 m). The North Rona 11
ridges arc round from a NE-SW trend to an E-W trend in their eastern parts and extend for ~50 km 12
on the mid shelf where they abut a larger feature (the Solan Bank Ridge) on the mid shelf. The inner 13
suite of ridges appear to fan out from the North Rona High, suggestive of topographic pinning; 14
whereas the outer suite of ridges are more shelf-edge parallel features (Fig. 6). Most of the ridges 15
comprise discontinuous sections with the longest continuous ridge extending for ca. 30 km. The 16
spacing between successive ridges is relatively close near the North Rona high, with six main seabed 17
ridges mapped in only 15 km of horizontal distance (Figs 5, 6). 18
Multibeam bathymetry covers only a small part of this area to the east of North Rona (Fig. 2), Here 19
the 3-D shape and smooth surface of the North Rona sediment ridges can be clearly seen as well as 20
their unconformable relationship with the underlying basement bedrock. These ridges have strong 21
morphological similarities with subaqueous moraines mapped elsewhere in the study area (e.g. in 22
the eastern Minch) and in other glaciated continental shelf settings (e.g. Shaw et al., 2006; Todd et 23
al., 2007; Dowdeswell et al., 2008). Unfortunately, this whole region is not well resolved in BGS 24
seismic lines as bedrock is near to seabed across much of the area and correlation of thin 25
discontinuous Pleistocene sequences is difficult (Fig. 3). However, BGS Quaternary geology maps and 26
offshore reports assign the Pleistocene deposits in this region to the Otter Bank Formation: a 27
heterogeneous glaciogenic unit comprising ice-proximal diamictons, glaciofluvial/deltaic gravelly 28
sands, and glaciomarine pebbly muds (Stoker et al., 1993; BGS, 1994). Interestingly, the narrower 29
innermost east-west trending North Rona moraine ridge seems to join, or be truncated by, a broader 30
NNE-SSW trending sediment ridge in shallow water projecting from the northern edge of the Solan 31
Bank High, but the exact morphological relationship remains unclear (Fig. 6). 32
14
A prominent NNE-SSW trending bathymetric high crosses the mid shelf between the submerged 1
bedrock high of the Solan Bank (60 m water depth) and the main Otter Bank Formation Moraines 2
(100-120 m water depth). This prominent 10-20 km wide, 80 km long feature is a structural bedrock 3
platform – referred to as the Solan Bank High. BGS investigations proved basement rocks of the 4
Lewisian complex at seabed on the Solan Bank and the adjacent Sule Skerry-Nun Rock high (Ritchie 5
et al., 2011). BGS borehole 77/07 recovered weathered basement rocks at shallow depth beneath 6
Tertiary and Neogene deposits on the spine of the Solan Bank High (Stoker et al., 1993). Although 7
predominantly a bedrock feature, seismic records show that the eastern portion of the platform is 8
capped by a thin Pleistocene sequence (Otter Bank Formation) which thickens to the northeast 9
(Stoker et al., 1993). We map a low broad NNE-SSW-trending sediment ridge along the length of the 10
eastern side of the Solan Bank High which we call the Solan Bank Ridge. It is 3-4 km wide and 11
generally rises only 10-15 m above the surrounding seafloor with low angle slopes and a very poorly 12
defined crestline (Fig. 6). However, its geometry is consistent with other subtle ice sheet moraines 13
seen on the mid and outer shelf. A morphologically similar broad, low ridge occurs on the northern 14
part of the Solan Bank High where the glacigenic Otter Bank Formation thickens forming more 15
pronounced moraines (morainal banks) (Stoker et al., 1993). 16
Inshore of the Solan Bank High, the number and density of seabed ridges increase considerably (Fig. 17
10). This area of rugged seafloor punctuated by numerous bedrock highs is well imaged in both the 18
singlebeam and multibeam data. The density of seabed ridges is typified in the area S of Solan Bank 19
around Nun Rock –a rugged basement high that reaches to within -30 m of present day sea level 20
(Figs. 1, 4). Detailed mapping of ridges in this region reveals numerous sediment ridges with complex 21
planform morphology and variable 3D shape (Figs. 10, 11). The ridges on this part of the shelf have 22
notably more variable geomorphology than the broad simple planform ridges seen on the outer and 23
mid shelf (Figs. 5, 6). Some show clear overprinting or superimposed relationships (Fig. 10). The 24
seabed ridges inshore of the Solan Bank High and around Nun Rock generally fall into 2 types: 25
broader, more substantial, ridges with widths ca. 200-1000 m and heights of 5-10 m; and narrow, 26
more delicate, ridges with widths ca. 100 m and heights of only 1-3 m above the surrounding 27
seafloor. The larger ridges have variable geomorphology, often with strongly arcuate sections and 28
numerous inflection points (Fig. 11). Ridge crests are generally broad and rounded; along-ridge 29
heights can vary; most are slightly asymmetric in cross-profile steeper on their shoreward (proximal) 30
side. They are also nearly always continuous features, with very few breaks or missing sections. By 31
contrast the smaller ridges tend to be simple in planform with linear or curvilinear sections and 32
rarely extend more than 2-3 km without a break. Ridge crests are sharper and better defined; 33
however slope asymmetry is often lacking. 34
15
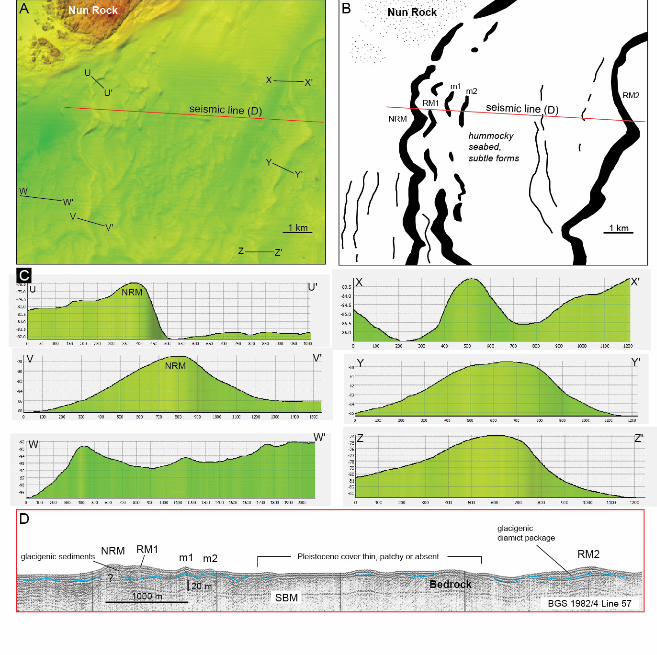
Immediately south of Nun Rock is an excellent example of one of the large continuous ridges found 1
in the central part of the shelf off northern Scotland (Fig. 11). The ridge starts in the shallow water 2
adjacent to Nun Rock and ends on the bedrock platform around Cape Wrath, traversing water 3
depths from -55 m to -95 m below present day sea level. Running almost due N-S and unbroken for 4
22 km, we term this the Nun Rock Ridge. The ridge ranges in width from ~250 to ~1000 m and 5
averages around 8-10 m in height. Bathymetric cross-profiles show that asymmetry is typical with 6
slope gradients of between 50:1 to 80:1 and a generally steeper east-facing slope (Fig. 11). The 7
continuous, well-defined morphology of this feature on the seabed is striking. In particular, the 8
arcuate, almost semi-circular, ridge sections concave to the E-SE; the numerous strong kinks or 9
inflections where the ridge direction changes by up to 90 degrees; and the irregular, multi-lobed, 10
overall planform of the ridge (Fig. 11). 11
The BGS seismostratigraphic framework is poorly developed in the nearshore region around NW 12
Scotland with most deposits defined simply as “Quaternary undifferentiated” (Fig. 4). This is largely 13
owing to the thin (<5-10 m) and patchy nature of the Pleistocene deposits on bathymetrically rough 14
seabed (BGS, 1989; Stoker et al., 1993). The Nun Rock Ridge is only poorly resolved on one or two 15
BGS seismic profiles (airgun and sparker), owing to its small size, but is composed of a structureless 16
acoustically transparent unit unconformably overlying highly reflective substrata interpreted as hard 17
(?crystalline) bedrock (Fig. 11). BGS borehole 72/34, situated on the flank of the ridge, proved 8.5 m 18
of grey silty, sandy, clay with ice-worn pebbles and occasional sand lenses typical of a glacial 19
diamicton, overlying bedrock (Stoker et al., 1993). Maps made from seabed sediment samples show 20
gravelly sands and gravels predominating on the highs (ridges) whereas sands predominate in the 21
basins (BGS, 1989). Taken collectively the morphological and geological evidence, combined with the 22
similarity to well-studied glacial features identified elsewhere on the seabed around NW Scotland 23
(e.g. Stoker et al., 2006, 2009), strongly favours the interpretation of the Nun Rock Ridge as a 24
prominent end moraine, relating to a stillstand or oscillation of a grounded ice sheet margin. 25
Immediately adjacent to this seabed moraine, 1-2 km E, another less continuous but comparably 26
sized ridge mirrors its planform shape with curves and inflection points in similar places along much 27
of its length (Fig. 11). Approximately 10 km E of this a further prominent seabed ridge occurs with 28
similar dimensions and characteristic curved-and-kinked morphology. Like the Nun Rock Moraine, 29
this broad-crested ridge is also asymmetric in cross-profile with east- and west-facing slope gradients 30
of 80:1 and 100:1 (Fig. 11). Based on their geomorphological similarity and spatial coherence with 31
the Nun Rock Moraine, we also interpret these substantial ridges as end moraines, part of a suite of 32
16
‘regional moraines’ imaged in multibeam bathymetry data charting the retreat of a grounded ice 1
sheet margin offshore northern mainland Scotland (Figs 6, 11). 2
The smaller, more delicate, ridges seen immediately W of the Nun Rock Moraine, form a different 3
suite of 4 (or possibly 5) ridges on the seabed. With wide spacings of 500-1000 m and heights of only 4
1-3 m, these ridges bear little similarity to marine (sediment transport) bedforms; their contextual 5
setting adjacent to, and between, ice sheet moraines suggest a Pleistocene age and origin. Although 6
geological and acoustic information about their composition is lacking, their morphological similarity 7
to small subaqueous transverse moraines (de Geer moraines), identified elsewhere in formerly 8
glaciated continental shelf settings, is strong (e.g. Ottesen & Dowdeswell, 2006; Todd et al., 2007; 9
Bradwell et al., 2008b). On this basis we map these suites of smaller ridges in the vicinity of Nun 10
Rock as de Geer-type moraines formed by incremental retreat of an ice-sheet grounding line over 11
time (e.g. Linden & Moller, 2005). The stratigraphic and temporal relationship between these 12
smaller moraines and the more substantial regional moraines is not clear, although there is a 13
suggestion in the multibeam data that the former overprint or truncate the latter in places. It is very 14
likely, judging by their good state of preservation, that all these moraines relate to the last (Late 15
Weichselian) BIIS. 16
17
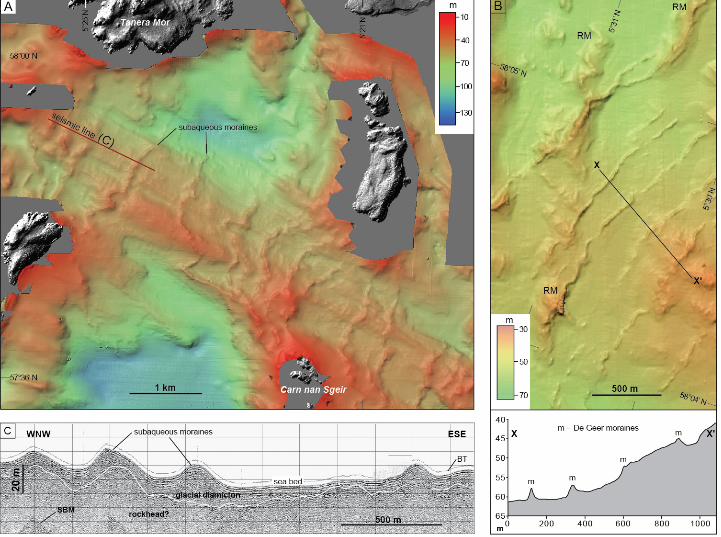
Multibeam echosounder data also reveals an irregular hummocky area of seabed geomorphology 18
with faint linear N-S orientated forms between the two large regional moraines (Fig. 11; RM1 and 19
RM2). Sub-bottom geophysical profiles show thin and patchy Pleistocene sediment cover with 20
bedrock at or close to seabed (Fig. 11); geological maps (BGS, 1989, 1984) show undifferentiated 21
Quaternary deposits in this area with gravelly seabed sediments predominating. It is likely that some 22
of the hummocks and discontinuous linear forms in the multibeam data may be glacigenic (morainic) 23
in origin. It is notable that a further 3 small, delicate, morphologically distinct, but discontinuous 24
ridges are seen with the same N-S orientation on the eastern margin of this hummocky area near 25
RM2. We interpret these small discontinuous ridges as de Geer moraines, part of the Nun Rock 26
moraines suite (described above). 27
28
The suite of regional moraines imaged between Cape Wrath and Nun Rock continue eastward at a 29
high angle to, in places almost perpendicular to, the present-day north coast of Sutherland (Fig. 6). A 30
notable deviation from this trend is offshore Faraidh Head, N of the mouth of Loch Eriboll in water 31
depths of 50-70 m, where large, morphologically similar, but more pronounced, transverse ridges 32
are seen to interrupt or overprint this regional pattern (Fig. 12). Interpreted as a subsequent suite of 33
ice-marginal landforms, the Faraidh Head moraines form a group of up to 10 discrete arcuate, but 34
17
laterally discontinuous, nested ridges. Their geomorphological and acoustic similarity with the Nun 1
Rock moraines, as well as their discontinuous concentric pattern, is strongly suggestive of a 2
grounded or partly grounded ice margin retreating from N to S – evidence of a locally sourced ice 3
mass in the mountains of NW Scotland (Fig. 12). The superimposition of one set of moraines on 4
another in this area suggests that a major local ice sheet/ice cap readvance occurred in NW 5
Sutherland, and furthermore that final retreat of this ice mass probably occurred under marine 6
conditions hence the preservation of both sets of landforms. 7
8
Further east in the central sector the singlebeam bathymetry data shows the suite of regional 9
moraines continuing adjacent to the north coast of Sutherland and Caithness (Fig. 6). The spatial 10
pattern of the ridges continues, with lobate or broadly arcuate planforms open to the E or SE. 11
Bathymetric cross profiles also show similar height and widths to the moraines in the vicinity of Nun 12
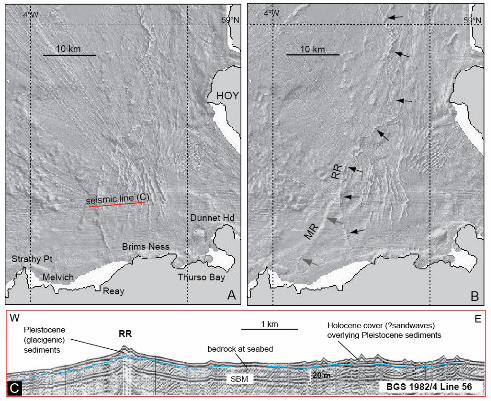
Rock and generally steeper east-facing slopes. In several places, between Faraidh Head and Dunnet 13
Head, these large moraines are truncated or overprinted by another set of equally substantial 14
seabed ridges; implying a subsequent phase of glacial advance-retreat. One notable ridge complex 15
highlights this relationship. A broad seabed sediment ridge can be seen extending offshore in an ENE 16
direction to the east of Strathy Point (Fig. 6). If projected onshore this ridge would make landfall in 17
the vicinity of Melvich Bay; hence we call this the Melvich Ridge. Approximately 15 km N of 18
Sandside (Reay) Bay, this broad subdued ridge is overprinted by another smaller, but more 19
prominent seabed ridge with a well-developed crestline (Fig. 13). This sharp-crested ridge forms a 20
wide arc stretching over 40 km from the Caithness coast, between Reay and Brims Ness, to 10 km W 21
of Hoy in Orkney. Good quality singlebeam bathymetry data shows that this ridge is 400 to 1000 m 22
wide and typically 10-20 m high with an unusual asymmetry, being generally steeper on its west-23
facing slopes. In places, the ridge crestline widens, bifurcates or splits into two well-defined ridges, 24
with one ridge set ~1 km inside the other (Fig. 13). At a point c. 10 km W of Rora Head on Hoy the 25
ridge sharply changes direction, and continues with the same distinctive sharp-crested morphology 26
in a northerly direction in present day water depths of 60-80 m. Unfortunately, this ridge is not well 27
imaged in existing seismic sub-bottom survey lines, although an airgun profile clearly shows the 28
twin-crested morphology of the ridge, its relatively high-angle slopes and asymmetry (steeper west-29
facing slopes) (Fig. 13). As elsewhere on the inner continental shelf, the 3-d morphology (e.g. height, 30
width, shape etc.) and geospatial similarity (e.g. spacing and trend) of the ridges between Faraidh 31
Head and Dunnet Head to other seabed moraines imaged elsewhere on the UK continental shelf 32
strongly suggest that they formed at the margin of a grounded ice sheet, probably during the Late 33
Weichselian period. We suggest that the superimposed Reay Ridge represents a notable and 34
18
spatially extensive moraine-forming event during overall ice-sheet retreat, when the ice sheet 1
margin underwent a significant readvance, in places beyond the position of older moraines (Fig. 13). 2
3-8 km east of the Reay Ridge are numerous closely spaced, prominent, sharp-crested seabed ridges 3
trending generally N-S, but with irregular spacings and occasionally branching planform (Fig. 13). The 4
ridges are 10-20 m high and up to 1000 m wide; some are symmetrical in cross profile whilst others 5
have strong asymmetry (both east-and west-facing) with asymptotic slopes. They are currently only 6
imaged in singlebeam, not multibeam, data. Their setting at the western entrance to the Pentland 7
Firth in a hydrographic region renowned for its strong tidal currents (Kenyon & Stride, 1970) suggest 8
that they are probably large-scale, mobile (but long-lived), sediment transport features (i.e. sand 9
waves). Similar features have been mapped as sand waves on the seabed between Orkney and the 10
Scottish mainland (Stoker et al., 1993). Seismic (airgun and sparker) profiles across this field of ridges 11
are equivocal, showing prismatic structureless sediment bodies unconformably overlying acoustically 12
bedded hard substrate (probably bedrock) (Fig. 13). However, the possibility that the ridges are 13
reworked, glacigenic features (end/de Geer moraines) or have a glacial sediment core, cannot be 14
ruled out at this time. 15
16
3.1.3 West Shetland Shelf and Orkney-Shetland Platform. Considerable previous work has 17
been done on characterising the seabed morphology, seismic architecture and Quaternary geology 18
of the West Shetland Shelf. The following section draws on this literature whilst summarising the 19
range of glacial landforms seen in the bathymetry data on the continental shelf around Orkney and 20
west of Shetland. 21
Adjacent to the shelfbreak in water depths of 160-200 m are a suite of ridges; two large broad ridges 22
and two smaller intervening ridges (Figs 5, 6). The longest of these extends semi-continuously for 23
>120 km, beyond the northern limit of the study area, in a NE-SW direction parallel to the 24
continental shelf edge. The broad ridges are the largest depositional features imaged on the 25
continental shelf, being typically between 3-5 km wide and ca. 20-30 m high; the two intervening 26
ridges are only 1-2 km wide (Fig. 6). All the ridges have smooth low-aspect cross profiles with very 27
broad almost imperceptible crests. NW-facing (distal) slopes tend to be slightly steeper than SE-28
facing (proximal) slopes, though the exact plan morphology of the ridges is not easy to establish, 29
even with image enhancement, owing to their subdued form. The ridges are part of a wider suite of 30
glacigenic deposits on the West Shetland Shelf identified in seismic data by Stoker & Holmes (1991) 31
and interpreted as ice-sheet end moraines. This whole suite of shelf-edge and mid-shelf moraines 32
19
form part of the Upper Pleistocene (Late Weichselian) Otter Bank Formation, as defined by Stoker et 1
al. (1993, 2011a). Further work on their acoustic character and internal architecture has been carried 2
out by Davison (2005). 3
New mapping of these moraine ridges from echosounder imagery (Fig. 6) shows their spatial 4
relationships more clearly; with the inner broad ridge abutting, and partially overprinting, the outer 5
ridge along the northernmost part of the shelf in the study area. The moraines appear to stop 6
abruptly where the shelf edge (200 m water-depth contour) makes a re-entrant inshore – known as 7
the Foula Bight (Fig. 1, 6). BGS seismic profiles across this part of the outer shelf show relatively thin 8
(<20 m thick) acoustically structureless or chaotic packages within the broad ridges (Otter Bank 9
Formation) passing laterally into layered deposits, part of the Morrison Formation on the West 10
Shetland Slope (Stoker et al., 1993; Stoker 1995; Davison, 2005). 11
Approximately 20 km to the SW, on the mid shelf, are another suite of large broad ridges, (~2-5 kms 12
wide; 20-50 m high) with concentric, arcuate or lobate morphology, some with zigzag or convoluted 13
plan forms. The whole suite has been interpreted as a complex of Late Weichselian ice-sheet end 14
moraines; the outermost ridges forming part of the Otter Bank Formation, the innermost forming 15
part of the Stormy Bank Formation (Stoker et al., 1993). The geomorphology and seismic 16
architecture of this sequence has been described previously in detail by Stoker & Holmes (1991), 17
Stoker et al., (1993) and Bradwell et al. (2008a). These seabed landforms are clear in the singlebeam 18
bathymetry and represent the densest clustering of large moraines on the continental shelf within 19
the study area (Figs 5, 6). Our mapping merely refines earlier work showing that there are 9 or 10 20
large nested ridges within 50 km horizontal distance; some of them showing clear overprinting 21
relationships. 22
Correlation of the outermost Otter Bank Formation moraines in this group with the large moraines 23
west of Shetland (Stoker & Holmes, 1991; Stoker et al., 1993) is possible based on 24
seismostratigraphical and geomorphological grounds. However, correlation of the inner moraines in 25
this group (Stormy Bank Formation) with ridge fragments on the West Shetland Shelf to the north 26
remains equivocal, as a large area of bedrock occurs at seabed in this area ~60°N (Fig. 6). 27
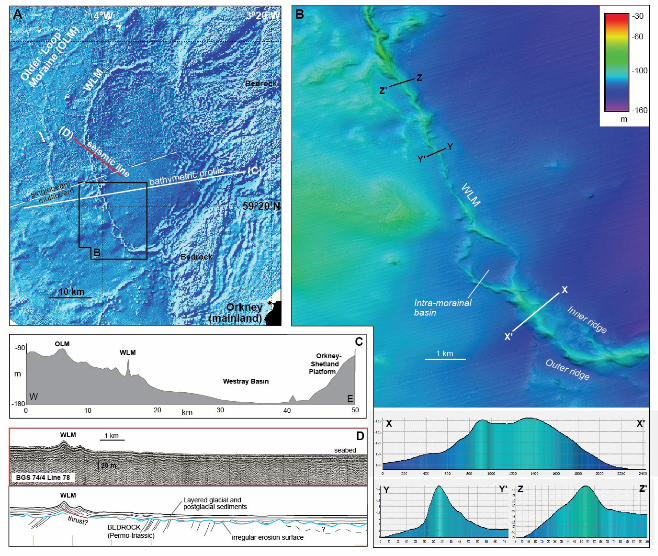
To the SE of the relatively shallow Otter Bank moraines (80-120 m water depth) the seabed deepens 28
inshore, reaching -180 m in the parts of the broad Westray Basin, before rising abruptly at the 29
Orkney-Shetland Platform (Fig. 14). A conspicuous well-defined ridge with a distinctive lobate or 30
looped pla form occurs in water depths of ca. 110-130 m on this adverse-sloping seabed, ~10 km to 31
the SE of the main Otter Bank-Stormy Bank moraine complex, described above. This ridge forms the 32
20
innermost (youngest) large regional moraine within the Otter Bank-Stormy Bank sequence; we call it 1
the Westray Loop Moraine (Fig. 14). This sharp-crested ridge forms a 70-km long loop with a 2
remarkable degree of morphological continuity. Good quality singlebeam and multibeam 3
bathymetry data shows that this ridge is 400 to 1600 m wide and typically 10-20 m high with strong 4
asymmetry, being notably steeper on its east-facing (proximal) slopes. In places, the ridge crestline 5
widens or splits into two well-defined ridges. Occasionally these ridge bifurcations enclose small 6
intra-ridge basins; one such notable basin is ~1 km2 in area (Fig. 14). In other places another small 7
fragmentary ridge is set back 1-3 km inside the main ridge complex. The ridge has been previously 8
interpreted by Bradwell et al. (2008a) as a lobate ice-sheet end moraine, possibly formed during a 9
dynamic (?rapid) oscillation of the ice margin. BGS seismic data across the double-crested moraine 10
would tend to support this interpretation with strong parallel sub-surface reflectors within the ridge 11
complex being truncated by a low-angle disruption plane at depth, interpreted here as a thrust (Fig. 12
14). Similar tectonic structures are often seen within contemporary thrust-block moraines, 13
commonly associated with surging behaviour (Evans and Rea, 2003). Inboard of the Westray Loop 14
Moraine, seismic reflection data show that the main part of the Westray Basin is covered in a 15
relatively thick (>20 m), acoustically layered, fill of glacial (?glaciomarine) and postglacial sediments 16
overlying a strongly undulating, probably glacially moulded, erosion surface (Fig. 14). 17
A large proportion of the seabed on the inner shelf around Orkney and Shetland consists of exposed 18
bedrock, with structurally juxtaposed Lewisian, Moine, Devonian and Permo-Triassic rocks (Stoker et 19
al., 1993; Ritchie et al., 2011). This exposed bedrock is clearly imaged and can be mapped from the 20
echosounder bathymetry imagery, with a rugged highly irregular surface in multibeam data and a 21
noisy chaotic seabed texture in singlebeam data (Fig. 14). Across this predominantly bedrock seabed, 22
numerous small sediment ridges are seen particularly around northern Orkney and in the Orkney-23
Shetland Channel. These ridges generally occur in shallower water depths (<120 m below present day 24
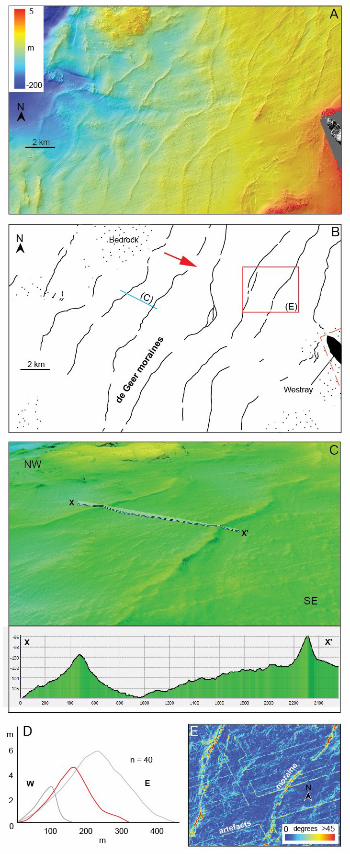
sea level) and are well developed, continuous, linear features. Excellent examples are seen 5-20 km 25
west of Westray on the gently sloping western flank of the Orkney-Shetland platform. Here a suite of 26
eight transverse ridges trend broadly NNE-SSW, in water depths of -120 to -60 m, with linear, 27
curvilinear or gently arcuate plan forms (Fig. 15). Most ridges can be traced semi-continuously for 20-28
30 km, although shorter ridge fragments <3-10 km in length also occur. Ridges are typically 100-300 m 29
wide and 1 to 5 m in height. Ridge spacings are fairly regular and in the range ~1000 to 3000 m. Most 30
ridges have simple crestlines, but one or two ridges bifurcate or display multiple crestlines. In cross-31
profile, ridge asymmetry is quite marked with almost 60% of moraine profiles (n = 40) showing a 32
steeper east-facing slope, although reversed asymmetry is noted locally (Fig. 15). Although no seismic 33
sub-bottom profiles across these features were examined, the ridges are clearly draped directly on 34
21
bedrock, corroborated by BGS seabed sediment maps, with little or no other Pleistocene deposits in 1
the vicinity. The distinct morphological similarity of these transverse ridges with subaqueous moraines 2
elsewhere strongly suggest that they are recessional moraines, probably de Geer moraines, deposited 3
by a grounded ice front terminating in water (e.g. Linden & Moller, 2005; Ottesen & Dowdeswell, 4
2006). Large, isolated sandbanks, presumed to be Holocene, with distinctive slope morphology and E-5
W orientation are also seen in the shallows (<50 m water depth) close to the coast of Westray (Fig. 6
16). 7
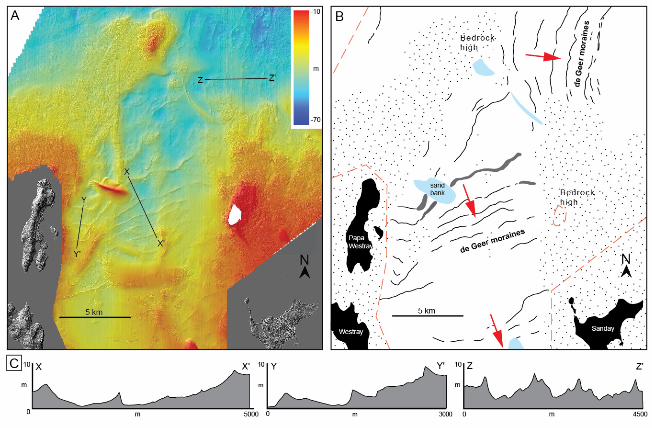
Other equivalent transverse seabed ridges, with similar dimensions and ridge spacings occur in the 8
waters around the Orkney Islands, particularly in North Sound between Westray and Sanday in 9
present-day water depths of 20 to 70 m (Fig. 16). Collectively we assign a common glacigenic 10
(morainic) origin to these suites of transverse ridges with similar 3-d morphology and dimensions. 11
Although the slope asymmetry may vary (steeper distal- vs proximal slope) as well as the absolute 12
dimensions, the de Geer-type moraines mapped on the Orkney-Shetland platform are easily 13
distinguished in multibeam bathymetry from more recently formed sandbanks, sand waves, or linear 14
bedrock structures (Fig. 16). Owing to the very thin and patchy distribution of Pleistocene deposits on 15
this part of the inner shelf, the Quaternary sequence around northern Orkney is undivided. However, 16
on the basis of the regional stratigraphic overview (Stoker et al., 1993) any glacigenic sediments in this 17
region are expected to fall within the Stormy Bank Formation (Stoker et al., 2011a, b). The steep-18
sided, fresh-looking form and good state of preservation of the Westray and North Sound moraines is 19
entirely consistent with a Late Weichselian age, though no absolute age constraints currently exist 20
(Figs. 15, 16). 21
Around 30 to 50 km to the east of the Pentland Firth, in relatively shallow water (60-80 m water 22
depth) to the SE of Orkney, are a number of seabed ridges and banks of differing scale and 23
morphology clearly imaged in both singlebeam and multibeam data (Figs. 5, 6, 17). The three largest 24
(and oldest) features are a collection of NE-SW trending low, broad, discontinous ridges and 25
mounds. The main ridge belts are 1-4 km wide and elevated only 5-10 m above the surrounding 26
seabed with gentle slopes and wide subtle, sometime multiple, crestlines (Fig. 6). These features 27
continue to the NE, outside the area covered by this study. Quaternary deposits in the area to the 28
east of Orkney and the outer Moray Firth are not well understood owing to the thin and patchy 29
nature of Pleistocene deposits; those that are defined in BGS maps and reports are left 30
undifferentiated (BGS, 2013). Furthermore, no formal correlation has yet been made between glacial 31
sediment sequences and landforms to the E of Orkney with those to the W of Orkney (e.g. Otter 32
Bank Formation, Stormy Bank Formation, etc) (Stoker et al., 1993; Andrews et al., 1990). 33
22
Superimposed, in places, on top of these broad ridges is a second set of more delicate NE-SW 1
trending transverse seabed ridges. These form suites of narrow closely spaced curvilinear ridges with 2
well-defined, sometimes bifurcating, crestlines. In one suite, approximately 40 km E of Duncansby 3
Head, 15 well-developed but discontinuous ridges are seen in a horizontal distance of ~10 km at the 4
extreme eastern edge of the study area (Fig. 17). The longest ridges can be traced laterally for ~20 5
km, although most are shorter and continuous over only 5-10 km or less. Most ridges occur within a 6
well-defined elevation threshold between 65 and 75 m below present day sea level; several ridges 7
terminate abruptly where the seabed deepens (>75 m water depth). Ridges are typically 100-200 m 8
wide and 1 to 5 m high; ridge spacings are in the range ~300 to 1000 m. In cross-profile, ridge 9
asymmetry is marked with most ridges possessing a steeper W or NW-facing slope, although 10
symmetrical and reversed asymmetry is noted in one or two cases (Fig. 17). No high-resolution 11
seismic lines were available for this area hence the internal sediment architecture could not be 12
examined. However, the co-spatial presence of (presumably Holocene) marine bedforms in the 13
multibeam data, with markedly different morphologies and orientations to both generations of 14
seabed ridges, suggest that the ridges are not related to present-day marine bedforming processes 15
(Fig. 17). This fact and the strong morphological similarity of the smaller transverse ridges to 16
subaqueous moraines elsewhere strongly suggest that they are Pleistocene glacigenic landforms, 17
probably de Geer moraines akin to those seen elsewhere around Orkney (cf. Figs, 15, 16). The 18
collective evidence suggests that they were deposited by a large ice mass terminating in shallow 19
water and retreating in a north-westerly direction back towards Orkney. The larger more subdued 20
ridges are probably older (?terrestrial) end moraine complexes deposited during an earlier stage of 21
firmly grounded ice sheet retreat and subsequently overprinted by De Geer moraines with a similar 22
orientation recording retreat of a lightly grounded (partly floating) tidewater ice-sheet margin. 23
24
4. Discussion 25
4.1 Ice sheet reconstructions from submarine glacial landforms 26
Previous work has shown the general pattern of ice-sheet moraines around Northern Scotland, 27
based solely on low-resolution echosounder bathymetry from the continental shelf (Bradwell et al., 28
2008a). The wider pattern of ice sheet retreat across the British Isles was subsequently proposed by 29
synthesizing all the available onshore and offshore geomorphological data (Clark et al., 2012). We 30
use the pattern of ice-marginal landforms, mapped here from singlebeam and new multibeam 31
echosounder data (Fig. 6) and supported by seismiostratigraphic interpretations and published 32
23
Quaternary geological information, to reconstruct in more detail the ice-sheet configuration around 1
northern Scotland at maximal extent and during deglaciation. Palaeo-ice margins are reconstructed 2
based on the position and orientation of ice-marginal landforms (i.e. moraines and grounding-zone 3
features) as done routinely in numerous palaeo-glaciological studies onshore and offshore (e.g. 4
Bennett and Boulton, 1993; Benn et al., 2003; O Cofaigh et al., 2012; Rydningen et al., 2013). 5
However, it is especially important that the stratigraphic relationships established between the 6
different moraine-bearing formations are fully considered when attempting to reconfigure the 7
palaeo-ice margins. Digitised crest lines, based on digital surface model data, or high points (where 8
no crest could be discerned) of mapped moraines were used to mark the position of the former ice 9
front. Adjacent, along strike, crest lines were then joined using a continuous line where they form 10
obvious chains, or coherent sequences; dashed lines were used where the interpretation is less 11
certain. For example, dashed lines show a sense of connectivity between seabed moraines where 12
extensive areas of bedrock are present at seabed or bathymetric data is lacking. Careful 13
consideration of the bathymetry/topography was made at all times to improve the glaciological 14
plausibility of reconstructed ice margins, especially when interpolating ice-margins over long 15
distances >20 km. In certain areas, where glacial landform evidence is absent or very complex and 16
difficult to interpret, no correlations with adjacent landforms were made. It should be remembered 17
that the resulting map of reconstructed palaeo-ice margins is only firmly constrained where data 18
coverage and landform evidence is good (see Figs. 2, 5). Interpolated ice margins are clearly open to 19
interpretation and we accept that other glaciologically plausible scenarios may exist. Furthermore, 20
these reconstructions are likely to be refined and clarified in places, given the large amount of 21
multibeam data becoming available from UK waters every year. Finally, no correlation with onshore 22
moraines has been attempted in this work, owing to time constraints and the variable quality and 23
vintage of Quaternary geological mapping in northern mainland Scotland and the Outer Hebrides 24
(Clark et al., 2004; Evans et al., 2005; BGS, 2012). However, it is hoped that improved onshore-25
offshore correlations will form the focus of future research. 26
27
4.2 Ice sheet retreat pattern and evolution 28
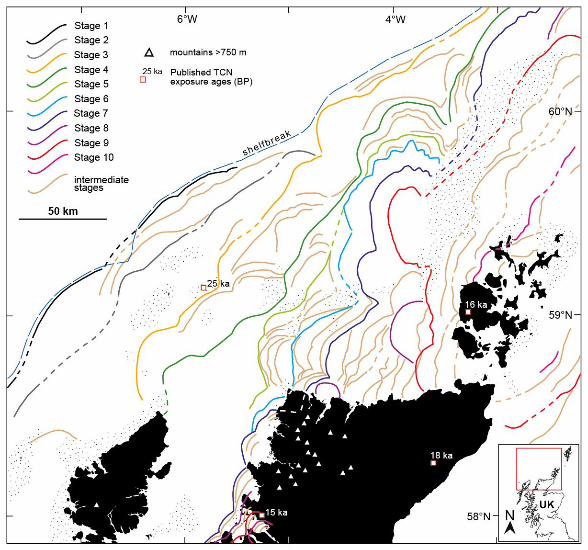
Our map of reconstructed ice margin positions around northern Scotland clearly shows the 29
variations in ice sheet extent and geometry over time (Fig. 18). The overall pattern represents a large 30
sector of the BIIS undergoing a widespread, but punctutated, size reduction – accompanied by 31
significant changes in geometry – as it retreats, reorganizes and ultimately disappears, in response 32
to internal and external drivers. These general findings echo those put forward by Bradwell et al. 33
(2008a), based solely on singlebeam bathymetry data; but our detailed findings in the NW sector 34
24
differ from the general 3-stage model we proposed in 2008 as well as some of the ‘timeslice’ 1
reconstructions of Clark et al. (2012). 2
3
Examining the geographical distribution of ice-marginal landforms more closely, a detailed pattern of 4
ice-sheet retreat emerges. Importantly, when combined with the distribution of Quaternary 5
(Pleistocene) deposits on the NW UK continental shelf, compiled independently from 6
seismostratigraphical evidence in the 1980s (Stoker et al., 1993), the pattern becomes more 7
coherent and is firmly supported within a lithostratigraphic (relative-chronological) framework (Fig. 8
18). The overall pattern depicted in Figure 18 is subdivided into 10 key stages outlined below: 9
• Stage 1 – Large shelf-edge moraines adjacent to the Sula Sgeir Fan (MacDonald Formation 10
moraines) indicate that grounded ice sheets extended across the Hebrides Shelf during the 11
Mid to Late Pleistocene (<0.45 Ma), but probably did not reach this far during the Late 12
Weichselian (MIS 2) (Stoker et al., 1993; Stoker, 2013). Morphologically similar shelf-edge 13
moraines occur on the outermost parts of the shelf in the Central sector and West of 14
Shetland (Murray and Otter Bank Formation moraines); however, the mapped stratigraphic 15
relationships between all three major units indicate that they are probably not directly time-16
equivalent (Figs. 3, 4). The combined morphological and seismostratigraphic evidence 17
suggests that at Stage 1 an extensive ice sheet fed the substantial continental-slope Sula 18
Sgeir Fan, via the Minch ice stream, depositing glacigenic debris flows and glaciomarine 19
muds (within the Macauley Fm., Upper Macleod Fm. and Morrison Fm) (e.g. Stoker et al., 20
1993; Stoker and Bradwell, 2005; Bradwell et al., 2007). This ice-sheet front probably also 21
extended as a marine-terminating margin at, or close, to the shelf edge from west of Lewis 22
(~58°N) to west of Shetland (>61°N) prior to MIS 2-3. Parts of the ice front may have 23
extended into deeper water as floating ice shelves especially where the indented 24
bathymetry of the shelfbreak potentially allowed the ice sheet to be laterally supported (e.g. 25
Wyville-Thomson Ridge). It is very likely that seabed moraine evidence for pre-Weichselian 26
ice-sheet margins north of ~60°N have been subsequently buried or removed by later 27
glaciations (see below). 28
• Stage 2 – Large moraines on the outer shelf in the Hebrides Shelf and Central sectors, 10-30 29
km inboard from the shelfbreak, record significant stillstands or oscillations of a pre-Late 30
Weichselian ice sheet margin. The innermost MacDonald Formation moraine on the 31
Hebrides Shelf extends to the NW for ~100 km, where it is truncated or overprinted by Otter 32
Bank Formation moraines (of Late Weichselian age) on the outer West Shetland shelf (Stage 33
3). To the NW of Lewis, the Stage 2 limit is uncertain. At this time the ice sheet probably still 34
25
formed a single coherent shelfbreak-parallel ice-sheet margin, near to its maximal position 1
(= Stage 1) at a time of greatly lowered eustatic sea levels. As with Stage 1, clear landform 2
evidence of this pre-Weichselian ice sheet retreat is lacking north of ~60°N. 3
• Stage 3 – Moraines on the mid shelf in the Hebrides and Central sectors (North Lewis Ridge 4
and N Rona Ridges) are correlated with moraines on the outer part of the West Shetland 5
shelf based on morphological and sesimostratigraphic grounds. We infer a broadly lobate 6
ice sheet margin stretching from NW of the Butt of Lewis to the North Rona High. These 7
moraines (or grounding-line features) probably relate to the Minch ice stream front as it 8
stabilized on prominent mid-shelf bathymetric highs. From here this ice sheet limit continues 9
~70 km NW to join with the outermost Otter Bank Fm moraines close to the shelfbreak at 10
~60°N. The ice-sheet configuration in Stage 3 is not a shelf-parallel one; the ice margin being 11
situated close to the present-day coastline in NW Lewis – which may have hosted ice-free 12
areas very early during deglaciation, consistent with sedimentological evidence of long-lived 13
periglacial conditions (e.g. at Galson Beach; Gordon & Sutherland, 1993) – but situated at or 14
close to the shelfbreak in the West Shetland sector. Shelf-wide seimostratigraphic 15
relationships suggest that this ice sheet configuration probably occurred during the Late 16
Weichselian Stadial (MIS 2-3), coeval with North Rona deglaciation ca. 25 ka BP (Everest et 17
al., 2013), when eustatic sea levels were still close to their eustatic (LGM) minimum. The 18
subsequent Stages (4-10) are all thought to be of MIS 2 age. 19
• Stage 4 – Large mid-shelf moraine complexes stretching from N Lewis to the West Shetland 20
Shelf are interpreted to mark a single (long-lived?) Late Weichselian (MIS 2) ice sheet 20-30 21
km margin inboard of Stage 3. We join the prominent North Minch Ridge moraine with the 22
Solan Bank Ridge and the outermost, nested, Otter Bank Formation moraine NW of Orkney, 23
which continues NW across the West Shetland Shelf for over 60 km. The ice sheet margin 24
depicted by Stage 4 is developing a more asymmetric form relative to the continental 25
shelfbreak, being ~75 km from the shelfbreak in the Hebrides Shelf sector but <20 km from 26
the shelfbreak on the West Shetland shelf in the extreme north. The ice sheet front was 27
probably stably situated on land close to the present-day coastline in western Lewis at this 28
time. Relative sea levels on the continental shelf NW of Britain at ~20-25 ka BP are poorly 29
constrained, but numerical glacio-isostatic models place them ca. 100 m below present on 30
the mid to outer shelf (Lambeck, 1991, 1993). The implication is that the ice sheet margin at 31
this time was probably grounded below sea level to the N of Lewis, in the Minch, and on the 32
shelf NW of Orkney, but perhaps terminated close to sea level in shallows or on low-lying 33
palaeo-islands in the central sector (around the Solan Bank high). It is likely that deglaciated 34
26
parts of the shelf W of Lewis and around North Rona would have also been dry land. We 1
suggest that the interaction between topography, relative sea level and ice-sheet grounding 2
dynamics would have been particularly important in determining the rate and style of ice 3
sheet retreat across the shelf at this time. 4
• Stage 5 – Many small and medium-sized moraines occur on the seabed in the central sector 5
inshore of the North Minch–Solan Bank Ridge. We draw a contiguous ice-sheet margin 6
joining the outermost of these, to the W of Cape Wrath, with a moraine system to the E of 7
the Solan Bank High. Unfortunately no firm connection can be made between this moraine 8
and those further N, owing to discontinuous landform evidence, but a link with one of the 9
large nested Otter Bank Formation moraines on the mid shelf is highly likely on 10
geomorphological and seismostratigraphical grounds. Stage 5 has no mapped equivalent in 11
the Minch or N of ~60°N where it has been subsequently truncated or removed by later 12
glacial advances (see below; Stages 6, 7). 13
• Stage 6 – The NW Sutherland moraines, to the N of the large Eddrachillis Ridge, are 14
projected to make landfall 5-10 km S of Cape Wrath. We join this ice sheet limit, across the 15
Cape Wrath headland, with the Nun Rock Moraine and its lateral equivalent to the N. We 16
continue this ice sheet margin, around the bathymetric Sule Skerry High, to the N where it 17
joins with one of the large nested Otter Bank/Stormy Bank Formation moraines on the mid 18
shelf, NW of Orkney. It is not currently possible to firmly trace the Stage 6 ice-sheet limit 19
beyond this point owing to the presence of bedrock at seabed across a large area. Relative 20
sea levels on the continental shelf at this time are not well constrained but were still 21
probably considerably lower (~100 m) than the present day (Lambeck, 1991), exposing 22
palaeo-islands in the Central sector and on the Hebrides Shelf. 23
• Stage 7 – The northern Minch, an area of ~2500 km2, is notably lacking in ice-marginal 24
landforms. The next suite of moraines encountered inshore of the North Minch Ridge, in the 25
Hebrides sector, is the major nearshore system defined by the substantial Eddrachillis Ridge 26
and Rubha Coigeach/Greenstone Point/Loch Ewe Moraine complexes. We interpolate a 27
multi-lobed ice sheet margin extending from SW of Loch Ewe (Wester Ross) to the vicinity of 28
Sandwood Bay, in NW Sutherland, where it makes landfall and probably continues across the 29
Cape Wrath headland. The Stage 7 time-equivalent moraine system in the central sector 30
cannot be firmly determined, owing to paucity of onshore data in far NW Sutherland, 31
however correlation with one of the regional moraines between Cape Wrath and Faraidh 32
Head (e.g. RM3, Fig. 12) is most glaciologically plausible. This palaeo-ice sheet margin 33
continues, with three strong inflections, for 150 km to the N until it joins the lobate nested 34
27
Otter Bank/Stormy Bank moraine complex NW of Orkney. No firm correlations can be made 1
N of this point, as moraines are not currently mapped across a large submarine bedrock area 2
on the western Orkney-Shetland Platform, but a continuation to morphologically similar 3
Stormy Bank Formation moraines on the West Shetland shelf is most likely. The NW sector 4
of the BIIS has a strongly asymmetric configuration in Stage 7 – with the ice-sheet margin 5
close to the present-day coastline in mainland NW Scotland, >120 km inshore from the 6
shelfbreak; ~50 km from the shelfbreak NW of Orkney; and only ~20 km from the shelfbreak 7
on the West Shetland Shelf. 8
• Stage 8 – This stage is defined only by a large lobate moraine complex that truncates (or 9
overprints) the sequence of several regional moraines (W of the Reay Moraine) running 10
broadly perpendicular to the north coast of mainland Scotland. It probably represents a 11
short-lived readvance of the ice sheet margin into deeper water west of Orkney. Time-12
equivalent moraines further N have most likely been removed by subsequent ice sheet 13
readvances (see Stage 9), although a prominent moraine ridge in the extreme NE of the 14
study area may relate to this stage. Stage 8 may also have a time-equivalent ice sheet 15
margin in the Summer Isles region where numerous seabed moraines record a period of 16
repeated stillstands/readvances during overall ice-sheet retreat prior to ~15 ka BP (Bradwell 17
et al., 2008b; Stoker et al., 2009); however, correlation cannot be confirmed with those 18
moraines to the N of mainland Scotland owing to a lack of chronological constraints. The 19
late-stage readvance (Faraidh Head) moraines offshore Loch Eriboll are also tentatively 20
placed in Stage 8 on the basis of glaciological plausibility (i.e. post-dates Stage 7), though 21
currently no published chronological data exist to confirm this. 22
• Stage 9 – Represented by the distinctive double-crested lobate Reay Moraine, offshore NW 23
Caithness, this palaeo-ice sheet margin records a relatively large, but possibly short-lived, 24
readvance of the ice sheet up to, and in places over, another prominent regional moraine. 25
Extending N for ~40 km, the Reay Moraine can be intermittently traced across a wide area of 26
bedrock seabed W of Orkney. We correlate the Reay Moraine with the morphologically 27
similar, double-crested, Westray Loop Moraine – the innermost Stormy Bank Formation 28
moraine, NW of Orkney – the distinctive lobate morphology and seismic architecture of 29
which is also highly suggestive of a dynamic short-lived readvance. Any substantial ice-sheet 30
readvance (>10 km) is likely to have removed landform evidence of earlier retreat stages in 31
this region, hence the general absence of Stage 8 and intermediate moraines on the West 32
Shetland Shelf and Orkney-Shetland Platform. Time-equivalent Stage 9 moraines to the E of 33
3°30’W are hard to identify with certainty, owing to a large area of bedrock-dominated 34
28
seabed, but a link to the innermost prominent Stormy Bank Formation moraine on the West 1
Shetland shelf is highly likely. To the SE of Orkney we infer an ice sheet margin, broadly 2
concave to the NW, based on the largest seabed moraines identified; this pattern is 3
suggestive of an ice mass centred on the higher ground of the Orkney-Shetland platform. 4
The pattern and morphology of the surrounding de Geer moraine fields strongly support this 5
Orkney-Shetland-centred ice sheet/ice cap geometry. Like Stage 8, Stage 9 may have a time-6
equivalent ice sheet margin in the Summer Isles region where numerous seabed moraines, 7
and their onshore counterparts, record a period of repeated stillstand/readvance during the 8
final stages of ice sheet decay in NW Scotland (Bradwell et al., 2008b; Stoker et al., 2009). 9
Taken collectively, the carefully reconstructed Stage 9 ice margins represent a considerable 10
reconfiguration during overall ice-sheet decay when the northern sector of the British-Irish 11
Ice Sheet had reorganized into large separate ice masses – one centred over Orkney and 12
Shetland, and one centred over the western Scottish Highlands – with an ice-free corridor 13
between. This is the first time this ice sheet configuration has been proposed for the BIIS. 14
• Stage 10 – Ice-marginal landforms on the Orkney-Shetland Platform are small, mostly de 15
Geer-type moraines, suggesting relatively rapid retreat of tidewater ice margins. Stage 10 16
marks one of numerous (?brief) stillstands during overall decay of the ice sheet/cap in its 17
final stages as a separate ice mass centred over Orkney and Shetland. The choice of de Geer 18
moraine to represent this stage is not important; we simply represent a notional stage 19
during final deglaciation – probably around 15-17 ka BP, as determined by TCN exposure 20
ages on Orkney (Phillips et al., 2008). The chosen ice-sheet margin can be traced from the 21
northern mainland of Orkney across the Westray Firth and linked with the prominent de 22
Geer moraines offshore Papa Westray that continue for ~20 km to the NE, and possibly join 23
with those in the Orkney-Shetland Channel. It is currently not possible to firmly identify 24
equivalent Stage 10 moraines to the east of Orkney, owing to a lack of moraine pattern 25
information close to shore. However, we propose that morphologically similar De Geer 26
moraines in comparable water depths to those NE of Papa Westray (<65 m) support this 27
overall pattern of ice-front retreat back towards Orkney. Broadly time-equivalent ice-sheet 28
moraines in the fjords of the Summer Isles region (~15 ka BP; Bradwell et al., 2008b; Stoker 29
et al., 2009) record late-stage ice sheet/ice cap oscillations attributed to the final stage of 30
marine-terminating glaciers in northern mainland Scotland. 31
32
We suggest that this 10-stage reconstruction of ice sheet retreat, with over 30 intermediate stages 33
(Fig. 18), represents the most detailed and glaciologically plausible pattern of ice sheet retreat for 34
29
the NW sector of the BIIS based on the currently available (Dec. 2013) marine geophysical and 1
geological data. This work refines those previous reconstructions presented for this region by 2
Bradwell et al. (2008a) and Clark et al. (2012). 3
4
5
4.3 Chronology 6
Very few absolute dates currently exist for the formation of the seabed moraine systems around 7
northern Scotland; addressing this forms one of the main objectives of the ongoing Britice-Chrono 8
research project (Clark et al., 2014). Notwithstanding this sparse chronology, most of the glacial 9
landforms identified (excluding Stages 1-2) are believed to relate to the last ice sheet to have 10
covered the British Isles (= Late Weischselian glaciation; ca. 32-15 ka BP) (in agreement with others: 11
e.g. Carr et al., 2006; Bradwell et al., 2008a; Sejrup et al., 2005, 2009; Chiverrell and Thomas, 2010; 12
Clark et al., 2012). We consider this premise to be supported by four key independent lines of 13
evidence: 14
1) Geomorphological preservation –– We consider it unlikely that ice-marginal features 15
(particularly small moraines) would have survived overriding by subsequent glaciation(s). 16
This implies that at least the younger, morphologically more delicate, moraines seen in 17
Stages 5-10, on the inner and mid shelf (Figs 6, 9-17), are almost certainly Late Weichselian 18
in age (<30 ka BP). 19
2) Seismostratigraphy –– Interpretation of shelf-wide seismic data in the 1970s to 1990s 20
shows a distribution and architecture of Pleistocene glacigenic deposits entirely consistent 21
with advance and retreat of an ice sheet to/from the continental shelf edge, at least on the 22
West Shetland Shelf, during the Late Weichselian (Figs. 3, 19) (Stoker et al., 1993; Fyfe et al., 23
1993; Stoker et al., 1994; Stoker, 2013). 24
3) Ice-rafted detritus (IRD) evidence –– Marine cores recovered from deep water SW of the 25
Barra-Donegal trough-mouth fan record a strong increase in ice-rafted detritus at ~29 ka BP, 26
peaking at 26.5 ka BP – interpreted to reflect the maximum calving flux from a proximal ice 27
sheet source (Peck et al., 2007; Scourse et al., 2009). This IRD peak is widely associated with 28
maximum stage shelf-edge BIIS glaciation on the Malin Shelf and southern Hebrides Shelf in 29
the Late Weichselian (MIS 2-3). 30
4) TCN age constraints –– A suite of terrestrial cosmogenic nuclide (TCN) analyses from 31
North Rona on the mid shelf date deposition of glacial boulders, and hence indicate ice sheet 32
overriding ca. 25 ka BP (Everest et al., 2013). These data constrain the period of maximum 33
Late Weichselian glaciation (post Stages 1 & 2) to between ~25 ka BP and the sharp IRD 34
30
increase at ~29 ka BP. It follows, based on this chronology, that Stage 3 moraines just 1
inshore of North Rona (and the subsequent Stages 4-10) must be younger than ~25 ka BP. 2
TCN exposure ages of ~15-17 ka BP from low-level sites on mainland Orkney (Phillips et al., 3
2008) constrain thinning and final decay (Stage 10) of a large ice mass, which we infer to 4
have been centred over Orkney and Shetland. Furthermore, TCN exposure ages from the 5
moraines in the Summer Isles region constrain final onshore retreat of a time-equivalent 6
large ice mass centred over W Scotland at ~15 ka BP (Bradwell et al., 2008b; Ballantyne et 7
al., 2009). 8
9
Owing to this relatively weak chronology, and the fact that it is currently the subject of a major 10
onshore and offshore research effort (Clark et al., 2014), we deliberately do not attempt to put our 11
reconstruction into a firm chronological context (i.e. by generating dated ‘timeslices’ or 12
‘isochrones’). However, we have used TCN exposure ages, where they exist, in key onshore localities 13
to place reconstructed palaeo-ice sheet limits within a chronological framework and provide 14
additional independent support for our empirically constrained ice-sheet retreat sequence (Fig. 18). 15
16
17
5. Summary, comparisons with previous work and some wider implications 18
The form and distribution of moraines on the seabed, seen in singlebeam data and seismic sub-19
bottom profiles and in more detail in multibeam data, have allowed a new detailed pattern of ice- 20
sheet retreat to be reconstructed for the continental shelf around northern Scotland. This pattern is 21
one of a shrinking ice sheet undergoing extensive, non-uniform, sector retreat and major 22
configuration change during decay. Our new reconstruction highlights that retreat was not simply 23
concentric but strongly asymmetric – focused in marine-influenced sectors, most notably the Minch, 24
where moraines are absent over ~2500 km2 of seabed. This evidence combined with the presence of 25
well-preserved seabed glacial lineations – ice-stream bedforms – in the central part of the Minch 26
(Stoker & Bradwell, 2005; Bradwell et al., 2007) suggests deglaciation may have occurred rapidly in 27
this vulnerable bathymetric setting (e.g. Alley et al., 2005; Dowdeswell et al., 2008; Pritchard et al., 28
2009). 29
The optimal reconstruction, based on newly available and collated existing data, depicts a single 30
coherent ice-sheet margin initially retreating across the continental shelf broadly from NW to SE in a 31
shelf-edge-parallel fashion (Stages 1-2, Fig. 18). However, it is very likely that these landforms relate 32
to a pre-Weichselian, Mid to Late Pleistocene glaciation of Britain (Stoker et al., 1993; Stoker, 2013). 33
31
Evidence of Late Weichselian glaciation (MIS 2) is seen in Stages 3 & 4 and the subsequent deglacial 1
stages (5-10). Raised marine sediments at Galson in NW Lewis, first recorded by Baden-Powell 2
(1938), have been interpreted to represent ice-free conditions throughout the last glaciation 3
(Sutherland & Walker, 1984), although this has been strongly challenged (Hall et al., 2003). Our new 4
reconstruction places the ice sheet margin onshore in NW Lewis at a very early stage during MIS 2 5
deglaciation (probably ~25 ka BP) – entirely consistent with Quaternary geological evidence for 6
periglacial conditions throughout much of the last glacial cycle (Gordon & Sutherland, 1993). 7
Following Stage 4, regional retreat patterns become focused in sectors – probably driven by changes 8
in bed topography, bathymetry and ice dynamics – with the main part of the Minch (58°-58.5° N) 9
deglaciating in an uninterrupted fashion, perhaps very rapidly, without the formation of moraines. 10
From this point onwards, the ice sheet configuration is substantially and irreversibly changed. With 11
the ice sheet margin close to the coastline in NW Scotland and large ice sheet lobes terminating on 12
the mid-shelf west of Orkney and Shetland (Stages 5-7, Fig. 18), the geometry is strongly asymmetric 13
with respect to the present-day coastline and continental shelfbreak. Continued ice sheet retreat, 14
and geometry change (accompanied by thinning) probably resulted in dynamic shifts in ice centres – 15
with a large ice centre focused over the Orkney-Shetland Platform and another large ice centre 16
dominating the West Scottish Highlands. We suggest that physical separation of these ice masses 17
probably occurred between Stages 7-9, with far NW Scotland (Cape Wrath to Foinaven) being 18
revealed relatively early as the ice sheets parted along the spine of high mountains (<750 m asl; Fig. 19
18). An ice-free corridor(s) connecting NE (Moray Firth) and NW mainland Scotland could have 20
occurred at this time. Continued recession of the northern ice centre was seemingly punctuated by 21
(?short-lived) readvances of the ice margin (Stage 9) before final decay of the ice mass occurred in 22
the vicinity of the Orkney Islands (Stage 10, Fig. 18) (ca. 15-17 ka BP; Phillips et al., 2008). A separate, 23
but relatively large local ice centre probably also existed on Shetland at this time (cf. Golledge et al., 24
2008; Hall, 2013). The currently available evidence suggest that the southern ice centre, focused 25
over the western Scottish Highlands, had retreated onshore by ~15 ka BP (Stage 10, Fig. 18), at least 26
in the Assynt, Summer Isles and Wester Ross regions (Bradwell et al., 2008b; Ballantyne et al., 2009); 27
whereafter its behaviour and final decay pattern is still the subject of debate (cf. Stoker et al., 2009; 28
Finlayson et al., 2011; Ballantyne & Stone, 2010). 29
In their comprehensive ice-sheet-wide summary, combining all relevant chronological and 30
geomorphological evidence, Clark et al. (2012) show schematic, albeit generalised, reconstructions 31
of ice-sheet retreat at key intervals during deglaciation (their Figs. 17, 18). Focusing on northern 32
Scotland they propose time-equivalent, contiguous, ice-sheet limits (isochrones) with some 33
similarities to the 3-stage reconstructions presented by Bradwell et al. (2008a) and the more 34
32
detailed multi-stage reconstructions presented here (Fig. 18). Most notable similarities are: the 1
shelf-edge configuration at maximum stage (isochrone ‘27 ka’ in Clark et al., 2012; but note the Pre-2
Weichselian age for Stages 1-2 (this study)); the general west to east retreat of ice on the Hebrides 3
and Shetland shelves, with proportionately more ice loss in the south relative to the north 4
(isochrones ‘27-17 ka’); the large open embayment in the Minch (isochrones ‘19-17 ka’); and the 5
presence of separate late-stage ice centres on Orkney (and Shetland) and mainland Scotland (by 6
isochrone ‘16 ka’). Where the reconstructions (Clark et al. 2012 and this study) significantly diverge, 7
however, is in the configuration changes that occur following their ‘isochrone 17 ka’ (broadly 8
equivalent to our Stage 4-5). We envisage that the ice sheet ‘unzipped’ along the spine of high 9
ground in NW Sutherland relatively early during deglaciation, radically altering the ice sheet 10
geometry of both subsequent ice centres (referred to hereafter as northern and southern ‘ice 11
sheets’). Moraine patterns suggest that this was followed by continued eastward retreat of the 12
northern ice sheet’s Atlantic margin, almost perpendicular to the north coast of mainland Scotland, 13
towards the Orkney-Shetland Platform (Stages 6-9). At the same time, the geological evidence 14
suggests the southern ice sheet’s margin remained relatively stable in the eastern Minch, close to 15
the present-day coastline (Stage 6-9), but that thinning and retreat from north to south forced the 16
terrestrial ice sheet margins back towards the main massifs of the Western Scottish Highlands. We 17
find no evidence for an ice sheet limit adjacent and parallel to the north coast of mainland Scotland 18
(cf. Clark et al., 2012; with this study, Fig. 18). These key differences in ice-sheet retreat geometry, 19
rate and style, between previously published work (Clark et al., 2012) and our new study, may be 20
vitally important when seeking to chronologically constrain and refine the pattern of British-Irish Ice 21
Sheet retreat using geological samples from onshore and offshore (e.g. using TCN, OSL, C-14, etc.). 22
Alongside others, we seek to test and develop these hypotheses – part of ongoing work into the rate 23
and style of marine-influenced ice-sheet decay around the British Isles. 24
25
26
6. Acknowledgments 27
This research was funded by BGS-NERC (Energy & Marine Geology Directorate) and is a scientific 28
contribution to the MAREMAP programme. Bob Gatliff, Alan Stevenson and John Howe are thanked 29
for organizing the conference (Seabed Mapping in the 21st century) and for inviting TB to contribute 30
to it. This work was largely undertaken prior to the start of the NERC-funded Britice-Chrono project, 31
but has benefitted subsequently from conversations with several consortium members (most 32
notably Chris Clark). We thank the journal reviewers for their comments and Rhys Cooper for 33
33
processing MBES data. Vicki Hammond is thanked for editing the final MS. Multibeam echosunder 1
data provided by MCA (UKHO) who are gratefully acknowledged. MCA survey data is Crown 2
Copyright. Singlebeam bathymetry data is from the Olex database, accessed under license by 3
BGS/NERC. Published with the permission of the Executive Director, BGS (NERC). 4
5
6
7
8
7. References 9
Alley, R.B., Clark, P.U., Huybrechts, P. & Joughin, I. 2005. Ice-sheet and sea-level changes. Science 10 310, 456-460. 11
Andrews, I.J., Long, D., Richards, P.C., Thomson, A.R., Brown, S., Chesher, J.A. & McCormac, M. 1990. 12 United Kingdom Offshore Regional Report: The Geology of the Moray Firth. London: HMSO for the 13 British Geological Survey. 93 pp. 14
Ballantyne, C.K., Schnabel, C., Xu, S. 2009: Readvance of the last British-Irish Ice Sheet during 15 Greenland Interstade 1 (GI-1): the Wester Ross readvance, NW Scotland. Quaternary Science 16 Reviews 28, 783-789. 17
Ballantyne, C.K. & Stone, J.O. 2010. Did large ice caps persist on low ground in NW Scotland during 18 the Lateglacial Interstade? Journal of Quaternary Science 27, 297-306. 19
Baden-Powell, D.F.W. 1938. On the glacial and interglacial marine beds of North Lewis. Geological 20 Magazine 75: 395-409. 21
Benn, D.I., Kirkbride, M.P., Owen, L.A. & Brazier, V. 2003. Glaciated valley landsystems. In Evans, 22 D.J.A. (ed.) Glacial Landsystems, 372-406. London: Arnold. 23
Bennett, M.R. & Boulton, G.S., 1993. Deglaciation of the Younger Dryas or Loch Lomond Stadial ice-24 field in the northern Highlands, Scotland. Journal of Quaternary Science 8, 133–146. 25
British Geological Survey (BGS), 1984. Orkney. Sea bed sediments and Quaternary geology. 26 1:250,000 map series. British Geological Survey, Keyworth, Nottingham. 27 28 British Geological Survey (BGS), 1989. Sutherland. Sea bed sediments and Quaternary geology. 29 1:250,000 map series. British Geological Survey, Keyworth, Nottingham. 30 31 British Geological Survey (BGS), 1994. Rona. Sea bed sediments and Quaternary geology. 1:250,000 32 map series. British Geological Survey, Keyworth, Nottingham. 33 34 British Geological Survey (BGS), 1995. Lewis. Sea bed sediments and Quaternary geology. 1:250,000 35 map series. British Geological Survey, Keyworth, Nottingham. 36 37 British Geological Survey (BGS), 2012. Bedrock and Superficial Geology of the United Kingdom. 38 DIGMAP50k. Digital geological map and database. British Geological Survey, Keyworth, Nottingham. 39
34
1 British Geological Survey (BGS), 2013. Bedrock and Quaternary Geology of the United Kingdom 2 Continental Shelf. DIGMAP50k. Digital geological map and database. British Geological Survey, 3 Keyworth, Nottingham. 4 5 Bradwell, T. 2013: Identifying palaeo-ice-stream tributaries on hard beds: mapping glacial bedforms 6 and erosion zones in NW Scotland. Geomorphology 201: 397-414. 7 8 Bradwell, T., Stoker, M.S., Golledge, N.R., Wilson, C.K., Merritt, J.W., Long, D., Everest, J.D., Hestvik, 9 O.B., Stevenson, A.G., Hubbard, A.L., Finlayson, A.G. & Mathers, H.E. 2008a. The northern sector of 10 the last British Ice Sheet: Maximum extent and demise. Earth-Science Reviews 88, 207–226. 11
Bradwell, T., Fabel, D., Stoker, M.S., Mathers, H., Mchargue, L. & Howe, J.A. 2008b. Ice caps existed 12 throughout the Lateglacial Interstadial in northern Scotland. Journal of Quaternary Science 23, 401–13 407. 14
Bradwell, T., Stoker, M. & Larter, R. 2007. Geomorphological signature and flow dynamics of the 15 Minch palaeo-ice stream, NW Scotland. Journal of Quaternary Science 22, 609-617. 16
Carr, S.J., Holmes, R., van der Meer, J.J.M., & Rose, J. 2006. The Last Glacial Maximum in the North 17 Sea Basin: micromorphological evidence of extensive glaciation. Journal of Quaternary Science 21: 18 131–153. 19
Chiverrell, R.C. & Thomas, G.S.P. 2010. Extent and timing of the Last Glacial Maximum (LGM) in 20 Britain and Ireland: a review. Journal of Quaternary Science 25: 535–549. 21
Chiverrell, R. C., Thrasher, I. M., Thomas, G. S. P., Lang, A., Scourse, J. D., van Landeghem, K. J. J., 22 Mccarroll, D., Clark, C. D., Cofaigh, C. Ó., Evans, D. J. A. & Ballantyne, C. K. 2013. Bayesian modelling 23 the retreat of the Irish Sea Ice Stream. Journal of Quaternary Science 28: 200–209. 24
Clark, C.D., Fabel, D., O’Cofaigh, C., Chiverrell, R., Scourse, J., Hindmarsh, R.C.A., Bradwell, T. & 25 25 others. 2014. BRITICE-CHRONO: Constraining rates and style of marine-influenced ice sheet decay. 26 Quaternary Revolutions: Quaternary Research Association, Annual Discussion Meeting, London. 27 Abstract Volume, p16. 28 29 Clark, C.D., Evans, D.J.A., Khatwa, A., Bradwell, T., Jordan, C.J., Marsh, S.H., Mitchell, W.A. & 30 Bateman, M.D., 2004. BRITICE: map and GIS database of landforms and features related to the last 31 British Ice Sheet. Boreas 33, 359–375. 32
Clark, C.D., Hughes, A.L.C., Greenwood, S.L., Jordan, C. & Sejrup, H.P. 2012. Pattern and timing of 33 retreat of the last British-Irish Ice Sheet. Quaternary Science Reviews 44, 112-146. 34
Davison, S., 2005. Reconstructing the Last Pleistocene (Late Devensian) Glaciation on the Continental 35 Margin of Northwest Britain. Unpublished PhD thesis. University ofEdinburgh. 36
Dawson, A.G. 1984. Quaternary sea-level changes in western Scotland. Quaternary Science Reviews 37 3, 345-368. 38
Dowdeswell, J.A., Ottesen, D., Evans, J., Ó Cofaigh, C. & Anderson, J.B., 2009. Submarine glacial 39 landforms and rates of ice-stream collapse. Geology 36, 819-822. 40
Dunlop, P., Shannon, R., McCabe, M., Quinn, R. & Doyle, E. 2010. Marine geophysical evidence for 41 ice sheet extension and recession on the Malin Shelf: New evidence for the western limits of the 42 British-Irish Ice Sheet. Marine Geology 276, 86-99. 43
35
Evans D.J.A., Clark C.D. & Mitchell W.A. 2005. The last British Ice Sheet: a review of the evidence 1 utilised in the compilation of the Glacial Map of Britain. Earth-Science Reviews 70: 253–312. 2
Evans, D.J.A. & Rea, B.R., 2003. Surging glacier landsystem. In Evans, D.J.A. (ed.) Glacial Landsystems, 3 259–289. London: Arnold. 4
Everest, J.D., Bradwell, T., Stoker, M.S. & Dewey, S. 2013. New age constraints for the maximum 5 extent of the last British-Irish Ice Sheet (NW Sector). Journal of Quaternary Science 28, 2-7. 6
Finlayson, A.G., Golledge, N.R., Bradwell., T. & Fabel., D. 2011. Evolution of a Lateglacial mountain 7 ice cap in Northern Scotland. Boreas 40, 536-554. 8
Finlayson, A., Fabel, D., Bradwell, T., Sugden, D.E. 2014. Growth and decay of a marine-terminating 9 sector of the last British-Irish Ice Sheet: a geomorphological reconstruction. Quaternary Science 10 Reviews 83, 28-45. 11
Fyfe, J.A., Long, D. & Evans, D. 1993. United Kingdom offshore regional report: the geology of the 12 Malin–Hebrides Sea area. London: HMSO for the British Geological Survey. 92pp. 13
Gibbard, P.L. & Clark, C.D. 2011. Pleistocene Glaciation Limits in Great Britain. Developments in 14 Quaternary Science 15, 75-93. 15
Golledge, N.R., Finlayson, A., Bradwell, T. & Everest, J.D., 2008. The last glaciation of Shetland, North 16 Atlantic. Geografiska Annaler 90A, 37–53. 17
Gordon, J.E. & Sutherland, D.G. 1993. Quaternary of Scotland. London: Chapman and Hall. 695pp. 18
Greenwood, S.L. & Clark, C.D., 2009. Reconstructing the last Irish Ice Sheet. 2: a geomorphologically 19 driven model of ice sheet growth, retreat and dynamics. Quaternary Science Reviews 28, 3101-3123. 20 21 Hall, A.M. 2013. The last glaciation of Shetland: local ice cap or invasive ice sheet? Norwegian 22 Journal of Geology 93, 229-242. 23 24 Hall, A.M., Peacock, J.D. & Connell, E.R. 2003. New data for the Last Glacial Maximum in Great 25 Britain and Ireland: a Scottish perspective on the paper by Bowen et al. (2002). Quaternary Science 26 Reviews 22, 1551–1554. 27 28 Howe, J.A., Dove, D., Bradwell, T. & Gaferia, J. 2012. Submarine gemorphology and glacial history of 29 the Sea of the Hebrides. Marine Geology 315-318, 64-76. 30 31 Hubbard, A., Bradwell, T., Golledge, N.R., Hall, A.M., Patton, H., Sugden, D.E.,Cooper, R., Stoker, 32 M.S., 2009. Dynamic cycles, ice streams and their impact on the extent, chronology and deglaciation 33 of the British-Irish Ice Sheet. Quaternary Science Reviews 28, 758-776. 34
Hughes, A.L.C., Clark, C.D., & Jordan, C.J. 2010. Subglacial bedform map of Britain. Journal of Maps 35 2010, 543-563. 36 37 Hughes, A.L.C., Greenwood, S.L. & Clark, C.D. 2011. Dating constraints on the Last British–Irish ice 38 sheet: a map and database. Journal of Maps 2011, 156-183. 39
IPCC, 2013. Climate Change 2013: The Physical Science Basis. Contribution of Working Group I to the 40 Fifth Assessment Report of the Intergovernmental Panel on Climate Change (eds.) Stocker, T.F. et al. 41 Cambridge: Cambridge University Press. 42
36
Kenyon, N.H. & Stride, A.H. 1970. The tide-swept continental shelf sediments between the Shetland 1 Isles and France. Sedimentology 14: 159-173. 2
Lambeck, K. 1991. Glacial rebound and sea-level change in the British Isles. Terra Nova 3: 379–389. 3
Lambeck K. 1993. Glacial Rebound of the British Isles—II. A high-resolution, high-precision model. 4 Geophysical Journal International 115: 960—990. 5
Lindén, M. & Möller, P., 2005. Marginal formation of De Geer moraines and their implications to the 6 dynamics of grounding-line recession. Journal of Quaternary Science 20, 113–133. 7
Milne, G.A., Shennan, I., Youngs, B.A.R., Waugh, A.I., Teferle, F.N., Bingley, R.M.,Bassett, S.E., 8 Cuthbert-Brown, C. & Bradley, S.L. 2006. Modelling the glacial isostatic adjustment of the UK region. 9 Philosophical Transactions of the Royal Society 364: 931–948. 10
O' Cofaigh, C. 2012. Ice sheets viewed from the ocean: the contribution of marien science to 11 understanding modern and past ice sheets. Philosophical Transactions of the Royal Society A 370, 12 5512-5539. 13
O' Cofaigh, C., Dunlop, P. & Benetti, S., 2012. Marine geophysical evidence for Late Pleistocene ice 14 sheet extent and recession off northwest Ireland, Quaternary Science Reviews 44, 147-159. 15
Ottesen, D. & Dowdeswell, J.A. 2006. Assemblages of submarine landforms produced by tidewater 16 glaciers in Svalbard. Journal of Geophysical Research 111, F01016. 17
Peck, V.L., Hall, I.R., Zahn, R., Grousset, F. & Hemming, S.R. 2007. The relationship of Heinrich events 18 and their European precursors over the past 60 ka BP: a multi-proxy ice-rafted debris provenance 19 study in the North East Atlantic. Quaternary Science Reviews 26, 862–875. 20
Peltier,W.R. & Fairbanks, R.G. 2006. Global glacial ice volume and Last Glacial Maximum duration 21 from an extended Barbados sea level record. Quaternary Science Reviews 25, 3322–3337. 22
Phillips, W.M., Hall, A.M., Ballantyne, C.K., Binnie, S., Kubik, P.W. & Freeman, S. 2008. Extent of the 23 last ice sheet in northern Scotland tested with cosmogenic 10Be exposure ages. Journal of 24 Quaternary Science 23, 101-107. 25
Pritchard, H.D., Arthern, R.J., Vaughan, D.G. & Edwards, L.A. 2009. Extensive dynamic thinning on the 26 margins of the Greenland and Antarctic ice sheets. Nature 461, 971-975. 27
Ritchie, J.D., Ziska, H., Johnson, H. & Evans, D. (eds.) 2011. Geology of the Faroe-Shetland Basin and 28 adjacent areas. British Geological Survey Research Report RR/11/01, Jarðfeingi Research Report 29 RR/11/01. 30
Rydningen,T.A., Vorren, T.O., Laberg, J.S. & Kolstad, V., 2013. The marine-based NW Fennoscandian 31 ice sheet: glacial and deglacial dynamics as reconstructed from submarine landforms. Quaternary 32 Science Reviews 86, 126–141. 33
Schoof, C. 2012. Marine ice sheet instability. Journal of Fluid Mechanics 698, 62-72. 34
Scourse, J.D., Haapaniemi, A.I., Colmenero-Hidalgo, E., Peck, V.L., Hall, I.R., Austin,W.E.N., Knutz, P.C. 35 & Zahn, R., 2009. Growth, dynamics and deglaciation of the last British-Irish ice sheet: the deep-sea 36 ice-rafted detritus record. Quaternary Science Reviews 28, 3066-3084. 37
Sejrup, H.P., Hjelstuen, B.O., Dahlgren, K.I.T., Haflidason, H., Kuijpers, A., Nygard, A.,Praeg, D., 38 Stoker, M.S. & Vorren, T.O., 2005. Pleistocene glacial history of the NW European continental 39 margin. Marine and Petroleum Geology 22, 1111–1129. 40
37

Sejrup, H.P., Nygard, A., Hall, A.M. & Haflidason, H., 2009. Middle and Late Weichselian (Devensian) 1 glaciation history of south-western Norway, North Sea and eastern UK. Quaternary Science Reviews 2 28, 370-380. 3
Shaw, J., Piper, D.J.W., Fader, G.B.J., King, E.L., Todd, B.J., Bell, T., Batterson, M.J. & Liverman,D.G.E., 4 2006. A conceptual model of the deglaciation of Atlantic Canada. Quaternary Science Reviews 25, 5 2059–2081. 6
Shennan, I., Bradley, S.,Milne, G., Brooks, A., Bassett, S. & Hamilton, S. 2006. Relative sea-level 7 changes, glacial isostatic modelling and ice-sheet reconstructions from the British Isles since the Last 8 Glacial Maximum. Journal of Quaternary Science 21, 585–599. 9
Sissons, J.B. 1987. Shorelines and Isostasy in Scotland. In Smith, D.E. and Dawson, A.G. (eds.) 10 Shorelines and Isostasy, 209-225. London: Academic Press. 11
Stoker, M.S. 1990. Glacially influenced sedimentation on the Hebridean slope, northwestern 12 United Kingdom continental margin. In Dowdeswell, J.A. & Scourse, J.D. (eds.) Glacimarine 13 Environments: Processes and Sediments. 349-362. London: Geological Society of 14 London, Special Publication 53. 15
Stoker,M.S. 1995. The influence of glacigenic sedimentation on slope-apron development on the 16 continental margin off Northwest Britain. In Scrutton, R.A., Stoker, M.S., Shimmield, G.B., Tudhope, 17 A.W. (eds.) The Tectonics, Sedimentation and Paleoceanography of the North Atlantic Region, 159–18 177. London: Geological Society of London, Special Publications. 19
Stoker, M.S. 2013. Cenozoic sedimentary rocks. In: Hitchen, K, Johnson, H. & Gatliff, R.W. (eds) 20 Geology of the Rockall Basin and adjacent areas. British Geological Survey Research Report 21 RR/12/03. 22
Stoker, M.S. & Holmes, R. 1991. Submarine end-moraines as indicators of Pleistocene ice-limits off 23 north-west Britain. Journal of the Geological Society, London 148, 431-434. 24
Stoker, M.S. & Bradwell, T. 2005. The Minch palaeo-ice stream, NW sector of the British-Irish ice 25 sheet. Journal of the Geological Society, London 162, 425-428. 26
Stoker, M.S. & Bradwell, T. 2011. The Quaternary Geology of the Summer Isles Region. Sheet 27 Explanation. Keyworth: British Geological Survey. 36pp. 28
Stoker, M.S. & Varming, T. 2011. Cenozoic (sedimentary). In: Ritchie, J.D., Ziska, H., Johnson, H. & 29 Evans, D. (eds.) Geology of the Faroe-Shetland Basin and adjacent areas. British Geological Survey 30 Research Report RR/11/01, Jarðfeingi Research Report RR/11/01. 31
Stoker, M.S., Hitchen, K. & Graham, C.G. 1993. United Kingdom offshore regional report: the geology 32 of the Hebrides and West Shetland shelves, and adjacent deep-water areas. London: HMSO for the 33 British Geological Survey. 150pp. 34
Stoker, M.S., Leslie, A.B., Scott, W.D., Briden, J.C., Hine, N.M., Harland, R., Wilkinson, I.P., Evans, D. & 35 Ardus, D.A. 1994. A record of late Cenozoic stratigraphy, sedimentation and climate change from the 36 Hebrides Slope, NE Atlantic Ocean. Journal of the Geological Society, London, 151, 235–249. 37
Stoker, M.S., Bradwell, T., Wilson, C., Harper, C., Smith, D. & Brett, C. 2006. Pristine fjord landsystem 38 revealed on the seabed in the Summer Isles region, NW Scotland. Scottish Journal of Geology, 42: 39 89-99. 40
38
Stoker, M.S., Bradwell, T., Howe, J.A., Wilkinson, I.M. & Mcintyre, K. 2009. Lateglacial ice cap 1 dynamics in NW Scotland: evidence from the fjords. Quaternary Science Reviews 28, 3161-3184. 2
Stoker, M.S., Balson, P.S., Long, D. & Tappin, D.R. 2011a. An overview of the lithostratigraphical 3 framework for the Quaternary deposits on the United Kingdom continental shelf. British Geological 4 Survey Research Report, RR/11/03. Keyworth: British Geological Survey. 5
Stoker, M.S., McMillan, A.A. & Waters, C.N. 2011b. Quaternary Stratigraphical Chart: Northern 6 Britain. British Geological Survey. 7
Sutherland, D.G. 1984. The Quaternary deposits and landforms of Scotland and the neighbouring 8 shelves: a review. Quaternary Science Reviews 3, 157–254. 9
Sutherland, D.G. & Walker, M.J.C. 1984. A Late Devensian ice-free area and possible interglacial site 10 on the Isle of Lewis, Scotland. Nature 309, 701-703. 11
Todd, B.J., Valentine, P.C., Longva, O. & Shaw, J. 2007. Glacial landforms on German Bank, Scotian 12 Shelf: evidence for Late Wisconsinan ice-sheet dynamics and implications for the formation of De 13 Geer moraines. Boreas 36, 148–169. 14
15
16
17
18
19
20
21
22
23
24
25
26
27
28
29
30
31
32
39
Figure captions 1
Figure 1: Extent of study area in northern United Kingdom, showing general topography and 2 bathymetry around northern Scotland. Bathymetry coloured to emphasise depth variations on the 3 continental shelf; water depths off the continental shelf (>200 m) are not shown. Bathymetric 4 features in italic font; islands and headlands in roman font. 5
6
Figure 2: Echosounder bathymetry data coverage on the UK continental shelf within the study area 7 (as of December 2013). Both singlebeam and multibeam data sets were used in this work. 8 Singlebeam echosounder data are part of a global dataset managed and compiled by Olex AS 9 (Norway) and licensed for scientific research. Multibeam echosounder data were primarily collected 10 by the Maritime and Coastguard Agency between 2005 and 2011 and form part of ongoing UK 11 Hydrographic Office surveys in UK waters. 12
13
Figure 3: (A). Distribution of Quaternary Formations on the NW UK Continental shelf, determined 14 from seismostratigraphy and seabed cores (modified from Stoker et al., 1993). Where the 15 Quaternary succession is thin, patchy or cannot be resolved in seismic profiles it remains 16 undifferentiated; this results in some artificial boundaries. Inset maps show (B) available marine 17 geophysical data and (C) seabed cores on which these original interpretations were made. Black lines 18 are single channel seismic profiles mostly collected by the British Geological Survey between 1970 19 and 1990. Green dots are existing BGS boreholes (variable depth penetration, typically 20-300 m); 20 orange dots are BGS vibrocores (max. 6 m penetration). 21
22
Figure 4: Quaternary stratigraphy of the (A) West Shetland Shelf and (B) Hebrides Shelf, derived 23 from seismic profiles (from Stoker et al., 1993). (C) Schematic showing stratigraphic relationship 24 between Pleistocene units on the mid-outer shelf, highlighting their angular discordance. See Figure 25 1 for lines of section. 26
27
Figure 5: Bathymetry of study area. Image (top left) shows shelf-wide digital surface model 28 compiled from various bathymetric datasets (singlebeam and multibeam); surface model is hill-29 shaded with illumination from the NW. These data have been used to map the seabed glacial 30 geomorphology around northern Scotland in detail. Bathymetric transects (1-10) show cross-profile 31 (2D) morphology of selected ridges on the continental shelf (named and described in this study). 32 Long dashed lines show boundaries between 3 sub-areas, defined for convenience: (i) The Minch 33 and Hebrides Shelf; (ii) Central Sector (iii); West Shetland Shelf and Orkney-Shetland Platform. 34
35
Figure 6: Distribution of all ice-marginal landforms mapped in this study on the NW UK continental 36 shelf. Areas of bedrock at seabed also shown. For more detailed geomorphology of sub-areas see 37 Figures 6-15. 38
40
1
Figure 7: (A) Hill-shaded multibeam bathymetry data, and (B) bathymetric cross profiles of North 2 Minch Ridge on the mid shelf, ~40 km NW of Cape Wrath, in present-day water depths ca. 80 m. 3 Note the irregular pitted surface, suggestive of iceberg keel marks and scours. Contains Maritime 4 and Coastguard Agency MBES data. 5
6
Figure 8: BGS sparker profile (upper panel) and seismostratigraphic interpretation (lower panel) of 7 the Eddrachillis Ridge, eastern part of the Minch. This large 30-40 m high ridge and the smaller 8 ridges inboard to the SE have not been formally defined within the existing Quaternary stratigraphic 9 framework. The collective evidence suggests they are relatively late-stage (MIS2) subaqueous 10 moraines recording grounded ice-sheet margin oscillations offshore mainland NW Scotland. For line 11 of section see Figure 1. 12
13
Figure 9: Seabed moraines in the Summer Isles region, NW Scotland (mapped and studied 14 previously by Stoker et al., 2006, 2009; Bradwell et al., 2008). (A) Hill-shaded multibeam bathymetric 15 image showing suite of transverse ridges (moraines) between Tanera Mor and Carn nan Sgeir. 16 [Multibeam echosounder data acquisition by BGS]. (B) Hill-shaded multibeam bathymetric image of 17 seabed moraines ~10 km NW of Tanera Mor. Note the small delicate De Geer moraines (m) 18 overprinting the larger (older) set of regional moraines (RM). Location of bathymetric profile (lower 19 panel) shown by line. (C) BGS seismic reflection (boomer) profile of subaqueous moraines between 20 Tanera Mor and Carn nan Sgeir. Note the asymmetric cross profile. Rockhead/diamicton contact 21 mapped where acoustically resolvable. Line of seismic profile shown in A. SBM – seabed multiple; BT 22 – bottom tracking pulse (modified from Bradwell et al., 2008). 23
24
Figure 10: Seabed moraines in the central sector, SW of Nun Rock High. (A) Hill-shaded multibeam 25 bathymetry data showing area of dense seabed ridges interpreted as ice-sheet moraines. (B) Outline 26 goemorphological map of seabed ridges. Note how the morphology of ZZM (zigzag moraine) 27 overprints adjacent (older) ridges, suggesting a readvance of the ice sheet margin. (C) Hill-shaded 28 greyscale bathymetric surface model, illuminated from the NW, used to map ridge morphology and 29 crestlines in detail. (D) Bathymetric cross profiles of closely spaced, well developed seabed moraines 30 SW of Nun Rock; profile lines shown in A. For bathymetric colour ramp see Fig. 7. Contains Maritime 31 and Coastguard Agency MBES data. 32
33
Figure 11: Seabed moraines in the central sector, S of Nun Rock High. (A) Hill-shaded multibeam 34 bathymetric image showing suites of transverse ridges between Nun Rock and Cape Wrath. (B) 35 Outline geomorphological map of ridges (large and small) interpreted as ice sheet moraines; stipple 36 is bedrock at seabed. NRM – Nun Rock Moraine; RM – regional moraines 1; m1, m2 – smaller 37 recessional moraines. (C) Bathymetric transects perpendicular to ridge crests showing cross profile 38 (2D) morphology of selected ridges. Depths and distances in metres. (D) BGS seismic reflection 39
41
(airgun) profile across seabed moraines S of Nun Rock. Line of profile shown in A & B. Note the 1 Pleistocene sediment package thickening in the vicinity of the Nun Rock moraine; sediment cover is 2 thin or absent in places to the east. For bathymetric colour ramp see Fig. 7. Contains Maritime and 3 Coastguard Agency MBES data. 4
5
Figure 12: Seabed moraines off the Sutherland coast due N of Faraidh head. (A) Hill-shaded 6 multibeam bathymetric image showing the area of complex multi-phase glacial geomorphology. (B) 7 Outline geomorphological map of transverse seabed ridges interpreted as ice-marginal landforms 8 (moraines). Larger, older ridges (grey) are regional moraines (RM) relating to ice sheet retreat 9 generally from west to east; smaller, younger ridges (black, FHM) relate to a later phase of advance 10 and retreat of an ice mass sourced to the S, in NW Sutherland. (C) BGS seismic reflection (airgun) 11 profile across seabed moraines off Faraidh Head. Line of survey shown in A & B. Pleistocene 12 sediment package is locally up to 20 m thick in ridges although sequence is undivided. Exact 13 stratigraphic relationship between Regional Moraines and Faraidh Head Moraines is uncertain owing 14 to low resolution of airgun profile; however, geomorphology shows the latter, more pronounced, 15 ridges superimposed on the former, broader ridges, in places. FHM – Faraidh Head Moraines; RM – 16 Regional Moraines; SBM – Seabed multiple. For bathymetric colour ramp see Fig. 6. Contains 17 Maritime and Coastguard Agency MBES data. 18
19
Figure 13: Seabed moraines off the N Caithness coast. (A & B) Hill-shaded singlebeam echosounder 20 bathymetric images (Olex dataset); arrows highlight prominent arcuate sediment ridge (RR) abutting 21 or overprinting older more subdued forms (MR). (A) Illuminated from the NE; (B) illuminated from 22 the NW. (C) BGS seismic reflection (airgun) profile across seabed offshore Caithness. Line of survey 23 shown in A perpendicular to crest of ridges. Note the Pleistocene sediment package thickening to 24 form a distinctive double crested ridge – the Reay Moraine. Steep-sided transverse sediment ridges 25 to the E are similar to large Holocene sandwaves seen elsewhere on the continental shelf; although 26 seismic reflection data suggest some may be draped over Pleistocene (glacial) sediment cores. RR – 27 Reay Ridge; MR – Melvich Ridge; SBM – Seabed multiple. 28
29
Figure 14: Seabed moraines on the mid-shelf NW of Orkney. (A) Hill-shaded echosounder 30 bathymetric surface model illuminated from the NW; dashed line shows join between singlebeam 31 and multibeam data. (B) Hill-shaded multibeam bathymetry data showing the prominent Westray 32 Loop Moraine (WLM) complex in detail (area of image shown in A). (Lower panel) Bathymetric 33 profiles perpendicular to ridge complex showing different cross profile (2D) morphology of moraine 34 at various points. Depths and distances in metres. (C) Regional bathymetric transect showing depth 35 profile of mid-shelf. Note the reverse (inshore deepening) slope and location of main moraine 36 complexes. (D) BGS seismic reflection (sparker) profile across Westray Loop Moraine and adjacent 37 basin. Line of seismic profile shown in A. Note the disrupted reflectors within the moraine ridge – 38 possible evidence of glaciotectonic deformation. Contains Maritime and Coastguard Agency MBES 39 data. 40
42
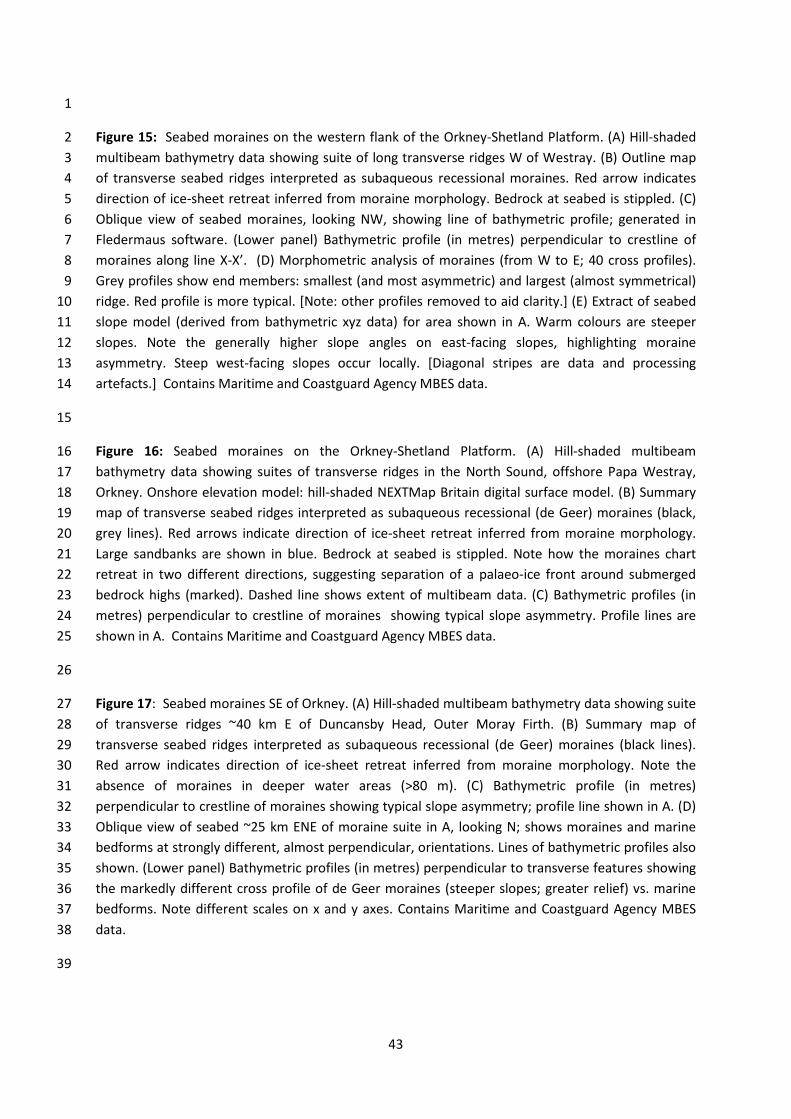
1
Figure 15: Seabed moraines on the western flank of the Orkney-Shetland Platform. (A) Hill-shaded 2 multibeam bathymetry data showing suite of long transverse ridges W of Westray. (B) Outline map 3 of transverse seabed ridges interpreted as subaqueous recessional moraines. Red arrow indicates 4 direction of ice-sheet retreat inferred from moraine morphology. Bedrock at seabed is stippled. (C) 5 Oblique view of seabed moraines, looking NW, showing line of bathymetric profile; generated in 6 Fledermaus software. (Lower panel) Bathymetric profile (in metres) perpendicular to crestline of 7 moraines along line X-X’. (D) Morphometric analysis of moraines (from W to E; 40 cross profiles). 8 Grey profiles show end members: smallest (and most asymmetric) and largest (almost symmetrical) 9 ridge. Red profile is more typical. [Note: other profiles removed to aid clarity.] (E) Extract of seabed 10 slope model (derived from bathymetric xyz data) for area shown in A. Warm colours are steeper 11 slopes. Note the generally higher slope angles on east-facing slopes, highlighting moraine 12 asymmetry. Steep west-facing slopes occur locally. [Diagonal stripes are data and processing 13 artefacts.] Contains Maritime and Coastguard Agency MBES data. 14
15
Figure 16: Seabed moraines on the Orkney-Shetland Platform. (A) Hill-shaded multibeam 16 bathymetry data showing suites of transverse ridges in the North Sound, offshore Papa Westray, 17 Orkney. Onshore elevation model: hill-shaded NEXTMap Britain digital surface model. (B) Summary 18 map of transverse seabed ridges interpreted as subaqueous recessional (de Geer) moraines (black, 19 grey lines). Red arrows indicate direction of ice-sheet retreat inferred from moraine morphology. 20 Large sandbanks are shown in blue. Bedrock at seabed is stippled. Note how the moraines chart 21 retreat in two different directions, suggesting separation of a palaeo-ice front around submerged 22 bedrock highs (marked). Dashed line shows extent of multibeam data. (C) Bathymetric profiles (in 23 metres) perpendicular to crestline of moraines showing typical slope asymmetry. Profile lines are 24 shown in A. Contains Maritime and Coastguard Agency MBES data. 25
26
Figure 17: Seabed moraines SE of Orkney. (A) Hill-shaded multibeam bathymetry data showing suite 27 of transverse ridges ~40 km E of Duncansby Head, Outer Moray Firth. (B) Summary map of 28 transverse seabed ridges interpreted as subaqueous recessional (de Geer) moraines (black lines). 29 Red arrow indicates direction of ice-sheet retreat inferred from moraine morphology. Note the 30 absence of moraines in deeper water areas (>80 m). (C) Bathymetric profile (in metres) 31 perpendicular to crestline of moraines showing typical slope asymmetry; profile line shown in A. (D) 32 Oblique view of seabed ~25 km ENE of moraine suite in A, looking N; shows moraines and marine 33 bedforms at strongly different, almost perpendicular, orientations. Lines of bathymetric profiles also 34 shown. (Lower panel) Bathymetric profiles (in metres) perpendicular to transverse features showing 35 the markedly different cross profile of de Geer moraines (steeper slopes; greater relief) vs. marine 36 bedforms. Note different scales on x and y axes. Contains Maritime and Coastguard Agency MBES 37 data. 38
39
43
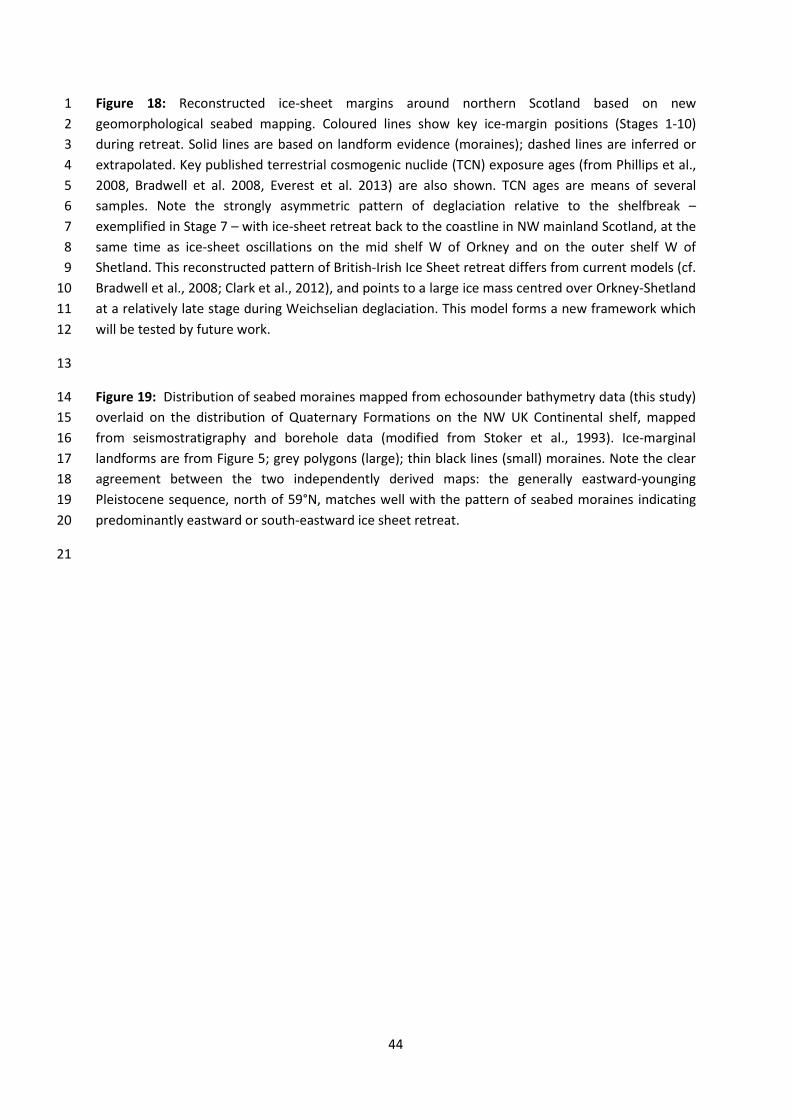
Figure 18: Reconstructed ice-sheet margins around northern Scotland based on new 1 geomorphological seabed mapping. Coloured lines show key ice-margin positions (Stages 1-10) 2 during retreat. Solid lines are based on landform evidence (moraines); dashed lines are inferred or 3 extrapolated. Key published terrestrial cosmogenic nuclide (TCN) exposure ages (from Phillips et al., 4 2008, Bradwell et al. 2008, Everest et al. 2013) are also shown. TCN ages are means of several 5 samples. Note the strongly asymmetric pattern of deglaciation relative to the shelfbreak – 6 exemplified in Stage 7 – with ice-sheet retreat back to the coastline in NW mainland Scotland, at the 7 same time as ice-sheet oscillations on the mid shelf W of Orkney and on the outer shelf W of 8 Shetland. This reconstructed pattern of British-Irish Ice Sheet retreat differs from current models (cf. 9 Bradwell et al., 2008; Clark et al., 2012), and points to a large ice mass centred over Orkney-Shetland 10 at a relatively late stage during Weichselian deglaciation. This model forms a new framework which 11 will be tested by future work. 12
13
Figure 19: Distribution of seabed moraines mapped from echosounder bathymetry data (this study) 14 overlaid on the distribution of Quaternary Formations on the NW UK Continental shelf, mapped 15 from seismostratigraphy and borehole data (modified from Stoker et al., 1993). Ice-marginal 16 landforms are from Figure 5; grey polygons (large); thin black lines (small) moraines. Note the clear 17 agreement between the two independently derived maps: the generally eastward-younging 18 Pleistocene sequence, north of 59°N, matches well with the pattern of seabed moraines indicating 19 predominantly eastward or south-eastward ice sheet retreat. 20
21
44