Embed Size (px)
Citation preview
‘Stunted Growth’ in Small Firms: How to Turn Them Round and Unleash Their Potential
Carmine Bianchi Department of Management, Faculty of Political Sciences,
University of Palermo, Palermo, Italy
[email protected] http://www.unipa.it/~bianchi - www.ced4.it
Graham W. Winch
University of Plymouth Business School, Plymouth,
United Kingdom [email protected]
Abstract The phenomenon of ‘dwarf’ or ‘stunted’ small and micro firms (in Italian nanismo aziendale) is recognised in the small business literature. These are firms that have survived through many years, maybe many generations, providing their owners with acceptable returns and lifestyles, but have remained very small. They might therefore represent potential lost opportunities for owners and, given the importance of the SME sector, local employment and economies. A system dynamics model replicating the basic no-growth, cyclical behaviour attributed to “stunted” SMEs is firstly analysed. Alternative policies arising from different entrepreneurial views and aimed at changing behaviour to one of stability or steady growth, are then tested and analysed. In this relatively simple form, the model does link behaviours to system structure and could support individual entrepreneurs in understanding the reasons for dwarfism in their firm and the potential for unleashing growth. It could also form the basis for a more detailed model to support the identification and evaluation of strategic alternatives in individual firms. Keywords: Resource-Based View; Strategy Processes; Stunted Growth; Business Dwarfism, System Dynamics
2
Introduction The ‘stunted-growth’ enterprise or ‘dwarf business’ situation (in Italian nanismo aziendale) is a phenomenon recognised in the small business literature. These terms are applied to small companies that have survived for many years and may well have provided their owners with a satisfactory lifestyle (and cannot therefore be judged as unsuccessful), but despite having the potential to grow into larger companies they have remained very small. Some of the reasons for this have been examined in a case study analysis of eleven such firms completed by Bianchi et al. (2003), and include the level of entrepreneur’s inclination to change the business status quo, and the consistency of strategic business assets. Companies that under-perform in this way fail to improve the earnings possibilities for their owners and do not offer the wealth generation and employment opportunities for their local communities. Given the recognised importance of small firms in local economies and the failure rates of new firm start-ups and associated difficulties in developing long-term sustainable businesses, this latter disbenefit is an important loss. A system dynamics model has been constructed which reflects the strategic resource management and decision-making identified in Bianchi’s work as typical of such firms. The use of simulation models in this way enables theories about the reasons for business dwarfism to be tested by creating models which replicate the behaviour of actual organisations through the generation of ‘reference behaviours’ - the characteristic shapes of graphs (timepaths) of key variables over time. Once the possible drivers and decision-making that have lead to dwarfism have been identified, further experiments with the model can investigate possible changes in a stunted business’ policies or practices which would offer routes to business growth.
Why and how do firms become ‘Stunted’ or ‘Dwarf’ Businesses? The term business dwarfism (in Italian nanismo aziendale) has been widely adopted in recent times in the Italian political and socio-economic debate, in order to characterise a kind of marginal business and entrepreneurial behaviour which seems to eschew growth. Such firms may well be ‘successful’ in the sense that they have survived over many years, maybe multiple generations of family ownership, and have been profitable or at least have provided the owner entrepreneurs with what they consider an adequate quality of life. However, these firms may well have had significant growth potential, but the owners have unaware or unconcerned that the firms remained small, or ‘stunted’, and growth potential has not been realised. ‘Dwarf’ firms are commonly characterised (Russo 1988) as those small and micro businesses whose structure and management routines have been kept unchanged over several decades, in terms of: structure (e.g. product portfolio, strategic product positioning, organisation, number of employees, production capacity, geographical markets), processes, and relational systems. This views seems to be founded on the premise that such firms are somehow affected by some ‘structural disease’ and that, therefore, support systems and tax incentives could be put in place to cure the disease. This might work for owner-entrepreneurs whose firms are stunted despite their best efforts and, but is unlikely to have any impact for owner-entrepreneurs who for lifestyle reasons have happily settled for being small – for example as long as the firm provides reasonable employment for all immediate family members then no need for growth is recognised.
3
Holmes and Zimmer (1994) consider the link between availability of finance and growth and hence distinguish Growth Capped from Growth SMEs. In Growth Capped, growth is sought and the firm develops and implements plans to achieve it. However, growth will only be financed by additional equity inputs of the existing owners or trading bank debt. Where new equity from outside sources is not an option, such firms have internal limits to growth. On the other hand, the latter kind of firms which seek and acquire external capital sources are able to change and grow. Two critical factors identified by Brown and Kirchhoff (1997) are: perceived environmental munificence – how benign and exploitable they perceive the environment to be and resource acquisition self-efficacy – the willingness and ability to acquire strategic resources. Nonetheless, Gibson (2002) asserts that “the notion that firms may have a capped growth objective is evident in many areas” and ascribes this behaviour to the fact that in many micro and small firms, owner-entrepreneurs take actions that suggest they are concerned with maintaining a stable business, and that growth if it risks loss of stability is rejected as an objective. Perren (1997), in an empirical study aimed at understanding growth and non-growth motivations for entrepreneurs defined a number of critical factors, including
owner’s growth motivation,
expertise and capability in growth, management
access to strategic resources,
demand for products or services. This author also found that non-growth firms tend to shared a common set of negative motivations towards growth amongst their owners, and even that these effects are particularly pronounced in a growing market. Modelling strategic resource dynamics in dwarf businesses. Bianchi et al. (2003) suggested a set of possible dwarf business structures based on feedback thinking and structural diagrams reflecting a resource-based view of the firm (see, for example, Amit & Schoemaker 1993; Dierickx & Cool, 1989; Warren 2002). In this paper, we describe the further development of a simple quantitative model (Bianchi & Winch, 2005) based around the strategic resource structures identified in Bianchi et al. The model is intended to enable light to be shed on the way that managerial behaviour as captured in the model, including reflections of attitudes and motivations towards growth achievement or otherwise, impact on company performance. By simulating small firm behaviour, the critical links can be established between the management of strategic resources and owner-manager attitudes with stunted growth in a firm so that the phenomenon can be better understood. At a practical level, entrepreneurs who are unaware of the possibility of these factors stunting growth might appreciate that growth is an option with possible benefits, and could reinforce the specific factors in play for those already aware of missed growth opportunities. Finally, the model could then used to investigate alternate, growth-based behaviours that could lead to improved decision-making. This use of this form of modelling to support learning and understanding of SME behaviour and to support entrepreneurs in decision-making and policy formulation is well established by the current authors as discussed below and by others. (See, for example, the Special issue of the System Dynamics Review, on Small Medium Enterprises 2002). The major structure that leads to stunted growth identified by Bianchi and his co-workers relates to the accumulation of a company’s strategic assets, and specifically the balance between processes that run such assets down and those that build them up (Bianchi et al.
4
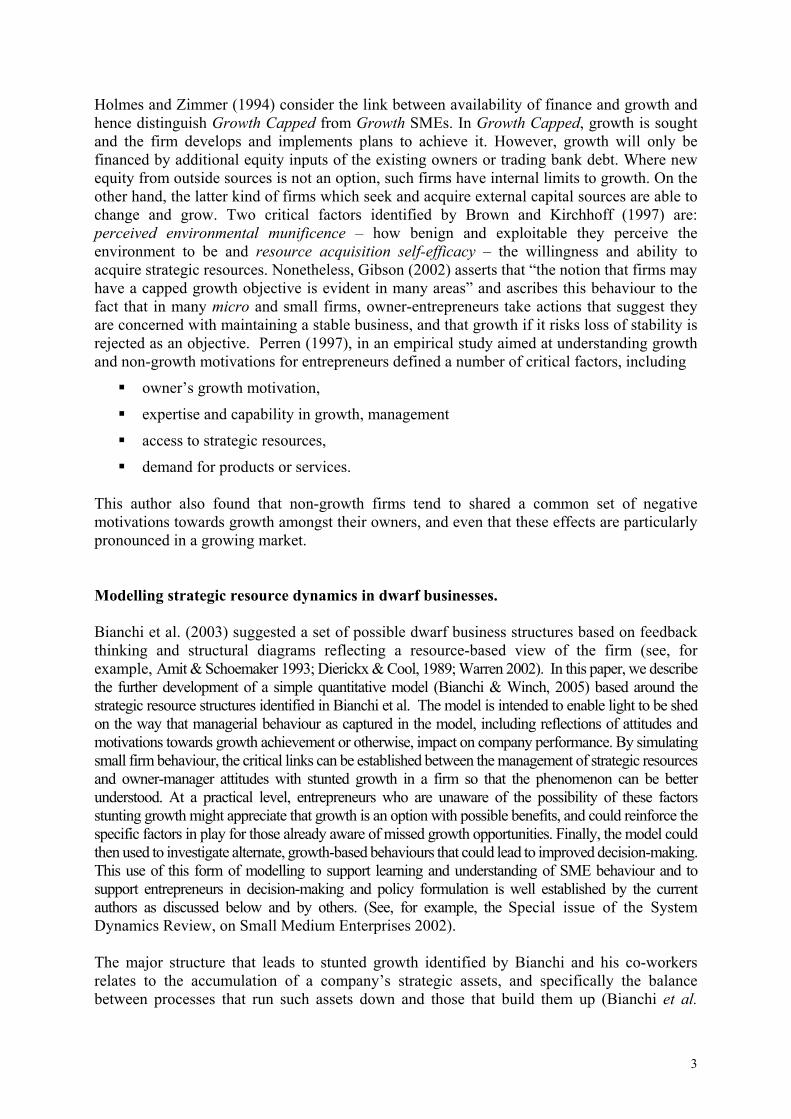
2003). This is a very basic structure, originally identified by Forrester (1961), and is the key to organisation success. In this context, the term strategic assets is a catch-all terms and includes a range of different assets or resources critical to the success of a firm – financial assets, customer base, knowledge, product range, product and/or service quality. (Figure 1.)
Figure 1 – Key Structure of Strategic Assets There are two key loops. Loop B reflects that strategic assets are not immortal, and can be lost over time through a variety of processes – plant can deteriorate, customers can be lost, quality relative to competitors falls if they have a better product development programme. Loop A reflects that the firm probably has a target for the strategic assets, hopefully explicit but maybe only loosely in mind, and will take remedial action if the assets fall, or fall significantly, below that target. On its own loop, B will tend to drive assets down to zero, while loop A will attempt to control the assets at or around the target. In a firm that is not actively seeking growth and perhaps where the entrepreneur is focused on day-to-day operations, then resources might be expected to fall away over time (Bianchi 2002). It is most likely that such enterprises do not have a very active programme of replacing lost assets, so the asset loss could go on for a period of time. Of course, dwarf firms are not firms that fail, so it is inevitable that at some point the dwarf firm owner-entrepreneur will recognises that the asset position has deteriorated, maybe to a point where normal operations are threatened, and will take remedial action. Thus over a period of time dominance switches between the two loops and an oscillatory pattern of falling and recovering strategic assets will be observed. This pattern suggests that the firm could survive at modest levels of activity but
G A P
S trateg ic assets
R e-acquisitionof strateg ic
assets
A-
+
+
S tra teg ic asse ts lo ss
B-
D esired strateg ic
assets
+
T im e to lo se s trateg ic assets
+
-
G A P
S trateg ic assets
R e-acquisitionof strateg ic
assets
A-
+
+
S tra teg ic asse ts lo ss
B-
D esired strateg ic
assets
+
T im e to lo se s trateg ic assets
+
-
5
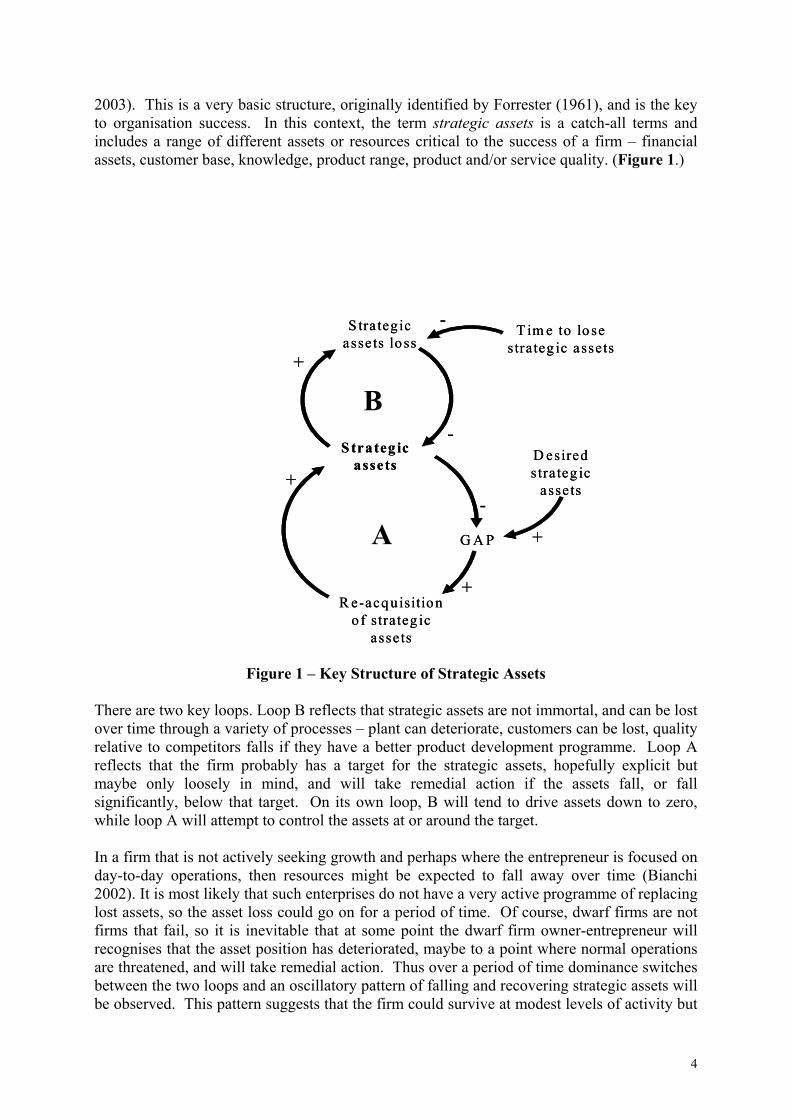
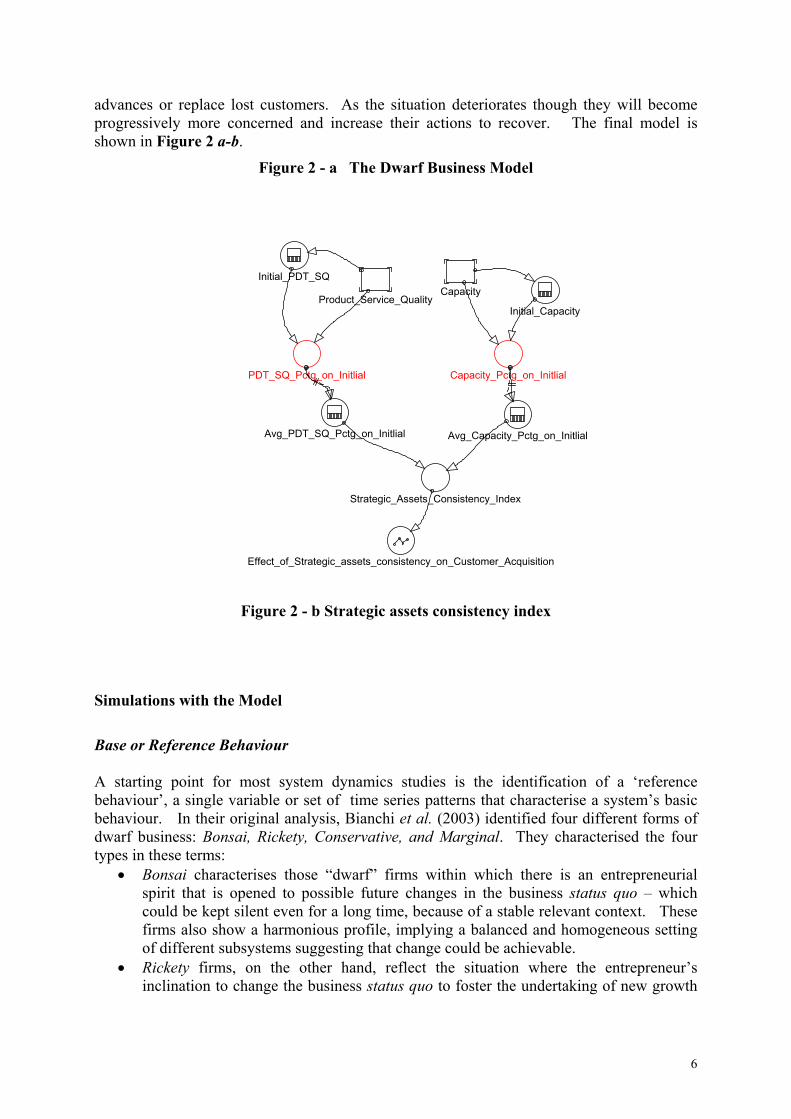
would find that breaking out and moving to growth mode requires purposeful changes in operating policies. The simulator is designed to reflect a set of critical interacting assets to establish that this kind of oscillatory behaviour can be produced by this double loop structure. The model includes stocks or levels of four important strategic assets – financial assets, the quality of a firm’s products or services, production capacity (e.g. in terms of human resources and/or machinery) and the firm’s customer base. Each of these assets has an outflow reflecting loss or deterioration of the asset and an inflow reflecting that actions can be taken to build them up. Direct action in terms of product/service R&D and enhancement, more active sales efforts with promotions, and recruitment or plant acquisition, for example, are feasible for the latter three assets. However, for the financial assets the in-flow depends on actions in the other three that lead to increased sales revenues and income. In this model it is assumed that the owner’s attention would mainly be on the financial assets, and more specifically on expected dividends, and it is here that the model assumes targets are set and remedial action is triggered when dividends (based on perceived income) dip to an unacceptable level. The model thus reflects a management process whereby, if it is decided that the dividends (based on perceived income) are unacceptably low, the firm will increase activities to enhance product/service quality, as well as capacity, and will increase its efforts to win new customers to restore assets to the desired level. This will be likely to improve the income rate and hence to dividends. Further, the link from Quality to Customer Base also indicates that the model includes a mechanism that makes it easier to win and retain customers if the firm’s quality is relatively higher than its competitors. Likewise, both investments in Quality and Capacity affect the productivity of the firm’s efforts and ability to win new customers through the Strategic Assets Consistency Index. This variable tries to reflect the extent to which investments in both sets of strategic assets impacting on commercial policies are balanced enough to sustain stability or steady growth. In other words, if the firm were to try to foster commercial policies by mainly investing in only one of the two above strategic assets, this would result in an unbalanced and unsatisfactory support to its efforts, and therefore could undermine the customer base. This model also associates costs with the adopted policies aiming to affect the strategic assets endowment over time in order to pursue the desired level of dividends. The decision processes are set up in the model to reflect what is believed about managers in such firms. If the perceived dividends are above or close to their target, then they will be pretty relaxed and will make no great efforts to match competitors’ quality
FINANCIAL SUB-SYSTEM
COMMERCIAL SUB-SYSTEM
CAPACITY SUB-SYSTEM
QUALITY SUB-SYSTEM
Product_Service_Quality_increase
Customer_acquisition Customers_loss
Product_Service_Quality_decrease
Dividends
Capacity_loss
Capacity_loss_reaction_timeProduct_Service_Quality
Customer_acquisition_effort
Dividends_Gap_Pctg
Effect_of_Strategic_assets_consistency_on_Customer_Acquisition
Product_Service_Quality_costsUnit_PDT_Service_Quality_costs
Ability_to_win_Customers
Avg_Product_Service_Quality_Loss
Capacity
Dividends_Gap_Pctg
Desired_DividendsAvg_Des_Growth_rate
Desired_Annual_Growth_rate
Commercial_costsSales_revenues
Unit_contrib_marg_on_sales
Perceived_Income
Relative_PS_Quality
Customer_base
Equity
Perceived_Dividends
Cust_base_loss_reaction_time
Income
Unit_Commercial_costs
Normal_desired_Dividends
Avg_unit_Capacity_costs
Capacity_Acquisition
Avg_Capacity_Loss
Effect_of_Comm_effort_on_Cust_acquisition
Average_Customer_Loss
Capacity_costs
Product_Service_Quality_increase
PDT_SQ_loss_reaction_time
Avg_Commercial_effort
Avg_Capacity_Acquisition_effort
Capacity_Acquisition
Avg_PDT_Service_effort
Effect_of_Tchn_policies_effort_on_PDT_Quality_increase
Competitors_Avg_PDT_Service_Quality
Effect_of_Acquisition_effort_on_Capacity
Dividends_Gap_Pctg
6
advances or replace lost customers. As the situation deteriorates though they will become progressively more concerned and increase their actions to recover. The final model is shown in Figure 2 a-b.
Figure 2 - a The Dwarf Business Model
Figure 2 - b Strategic assets consistency index
Simulations with the Model
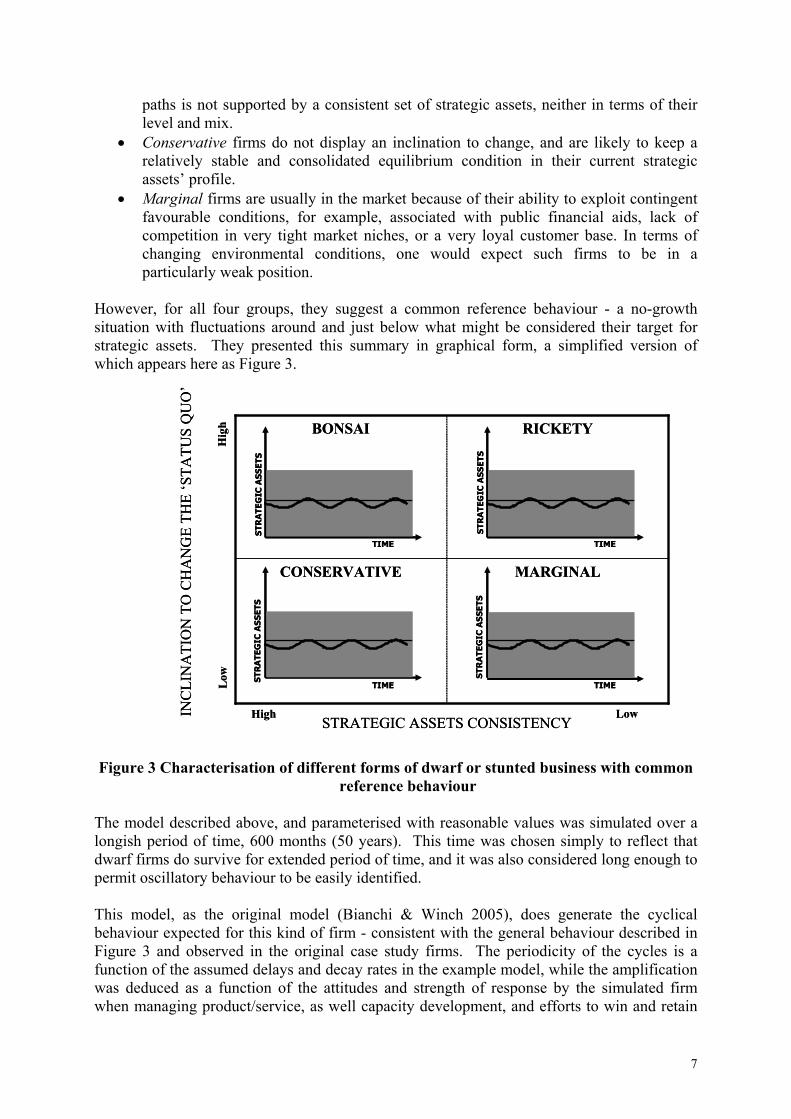
Base or Reference Behaviour A starting point for most system dynamics studies is the identification of a ‘reference behaviour’, a single variable or set of time series patterns that characterise a system’s basic behaviour. In their original analysis, Bianchi et al. (2003) identified four different forms of dwarf business: Bonsai, Rickety, Conservative, and Marginal. They characterised the four types in these terms:
• Bonsai characterises those “dwarf” firms within which there is an entrepreneurial spirit that is opened to possible future changes in the business status quo – which could be kept silent even for a long time, because of a stable relevant context. These firms also show a harmonious profile, implying a balanced and homogeneous setting of different subsystems suggesting that change could be achievable.
• Rickety firms, on the other hand, reflect the situation where the entrepreneur’s inclination to change the business status quo to foster the undertaking of new growth
Initial_Capacity
Capacity
Capacity_Pctg_on_Initlial
Avg_Capacity_Pctg_on_Initlial
PDT_SQ_Pctg_on_Initlial
Avg_PDT_SQ_Pctg_on_Initlial
Strategic_Assets_Consistency_Index
Effect_of_Strategic_assets_consistency_on_Customer_Acquisition
Initial_PDT_SQ
Product_Service_Quality
7
paths is not supported by a consistent set of strategic assets, neither in terms of their level and mix.
• Conservative firms do not display an inclination to change, and are likely to keep a relatively stable and consolidated equilibrium condition in their current strategic assets’ profile.
• Marginal firms are usually in the market because of their ability to exploit contingent favourable conditions, for example, associated with public financial aids, lack of competition in very tight market niches, or a very loyal customer base. In terms of changing environmental conditions, one would expect such firms to be in a particularly weak position.
However, for all four groups, they suggest a common reference behaviour - a no-growth situation with fluctuations around and just below what might be considered their target for strategic assets. They presented this summary in graphical form, a simplified version of which appears here as Figure 3. Figure 3 Characterisation of different forms of dwarf or stunted business with common
reference behaviour The model described above, and parameterised with reasonable values was simulated over a longish period of time, 600 months (50 years). This time was chosen simply to reflect that dwarf firms do survive for extended period of time, and it was also considered long enough to permit oscillatory behaviour to be easily identified. This model, as the original model (Bianchi & Winch 2005), does generate the cyclical behaviour expected for this kind of firm - consistent with the general behaviour described in Figure 3 and observed in the original case study firms. The periodicity of the cycles is a function of the assumed delays and decay rates in the example model, while the amplification was deduced as a function of the attitudes and strength of response by the simulated firm when managing product/service, as well capacity development, and efforts to win and retain
STRATEGIC ASSETS CONSISTENCY
MARGINALCONSERVATIVE
RICKETYBONSAI
TIME
STR
AT E
GIC
AS
SE T
S
TIMETIME
TIME
STR
ATE
GIC
AS
SET
S
Hig
hL
ow
LowHigh
STR
ATE
GIC
AS
SET
S
ST R
ATE
GIC
AS
SET
S
INC
LIN
ATI
ON
TO
CH
AN
GE
THE
‘STA
TUS
QU
O’
STRATEGIC ASSETS CONSISTENCY
MARGINALCONSERVATIVE
RICKETYBONSAI
TIME
STR
AT E
GIC
AS
SE T
S
TIMETIME
TIME
STR
ATE
GIC
AS
SET
S
Hig
hL
ow
LowHigh
STR
ATE
GIC
AS
SET
S
ST R
ATE
GIC
AS
SET
S
INC
LIN
ATI
ON
TO
CH
AN
GE
THE
‘STA
TUS
QU
O’
8
customers. Should the functions that represent these latter factors be changed then the amplification changed accordingly, for example, a less relaxed reaction to perceived financial resource gap being below the target results in smaller oscillations closer to the target figures. The more reactive response portrayed by the model suggests that the oscillations are destined to die out over time. This might be the case if the operating environment were perfectly constant over the period; however, perturbations, or changes in the environment are likely to trigger further oscillations.
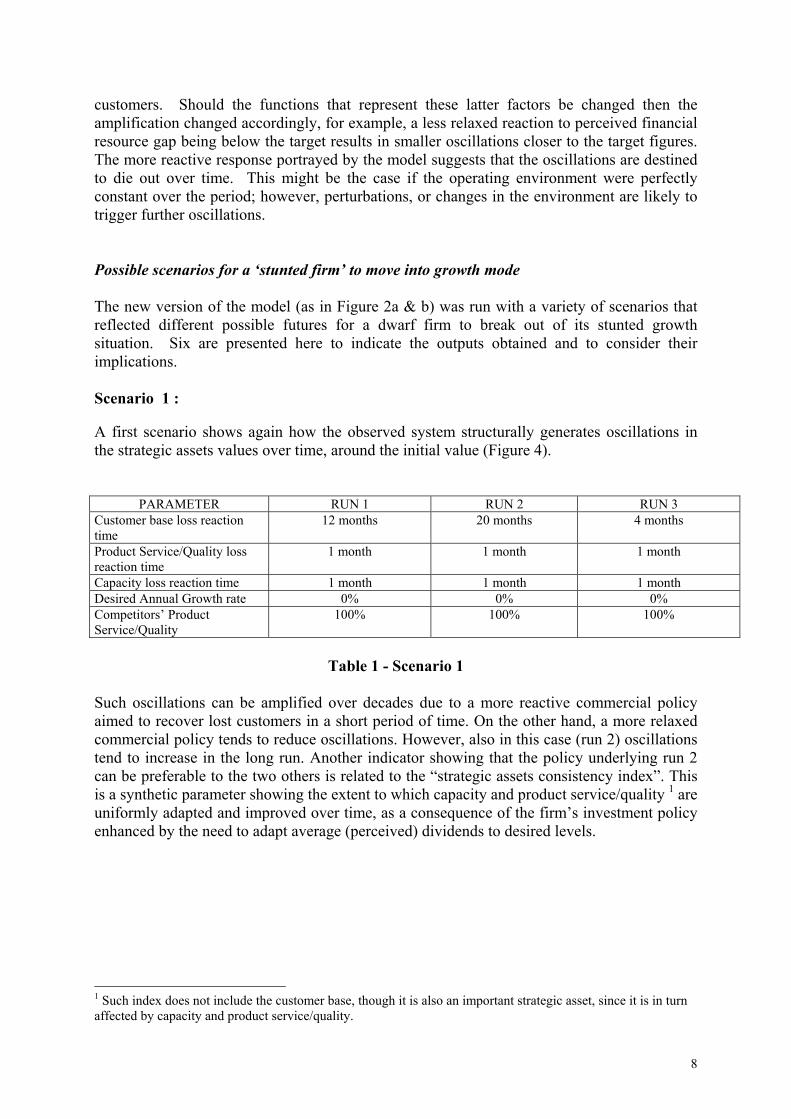
Possible scenarios for a ‘stunted firm’ to move into growth mode The new version of the model (as in Figure 2a & b) was run with a variety of scenarios that reflected different possible futures for a dwarf firm to break out of its stunted growth situation. Six are presented here to indicate the outputs obtained and to consider their implications. Scenario 1 : A first scenario shows again how the observed system structurally generates oscillations in the strategic assets values over time, around the initial value (Figure 4).
PARAMETER RUN 1 RUN 2 RUN 3 Customer base loss reaction time
12 months 20 months 4 months
Product Service/Quality loss reaction time
1 month 1 month 1 month
Capacity loss reaction time 1 month 1 month 1 month Desired Annual Growth rate 0% 0% 0% Competitors’ Product Service/Quality
100% 100% 100%
Table 1 - Scenario 1
Such oscillations can be amplified over decades due to a more reactive commercial policy aimed to recover lost customers in a short period of time. On the other hand, a more relaxed commercial policy tends to reduce oscillations. However, also in this case (run 2) oscillations tend to increase in the long run. Another indicator showing that the policy underlying run 2 can be preferable to the two others is related to the “strategic assets consistency index”. This is a synthetic parameter showing the extent to which capacity and product service/quality 1 are uniformly adapted and improved over time, as a consequence of the firm’s investment policy enhanced by the need to adapt average (perceived) dividends to desired levels. 1 Such index does not include the customer base, though it is also an important strategic asset, since it is in turn affected by capacity and product service/quality.
9
Figure 4 Scenario 1 behaviours
Scenario 2 :
A second scenario shows again an unstable system, characterised by fluctuations in the strategic assets values, generated by the entrepreneur’s policies.
PARAMETER RUN 1 RUN 2 RUN 3 Customer base loss reaction time
24 months 24 months 24 months
Product Service/Quality loss reaction time
24 months 24 months 1 month
Capacity loss reaction time 1 month 24 months 24 months Desired Annual Growth rate 0% 0% 0% Competitors’ Product Service/Quality
100% 100% 100%
Table 2 Scenario 2
Months
Cus
tom
er b
ase
0 100 200 300 400 500 60050
100
150
200
123 1
2
3
1
2
3
12
3
1 2
3
12
3
12
3
Months
Pro
duct
/Ser
vice
Qua
lity
0 100 200 300 400 500 600
0,45
0,50
0,55
0,60
0,65
123
12
3 1
2
3
12
3
12
3 1
2
3
1
2
3
Months
Per
ceiv
ed D
ivid
ends
0 100 200 300 400 500 60010.000
20.000
30.000
40.000
123 1
2
3
12
3
1
2
3
1
2
3
1 2
3
1
3
Months
Cap
acity
0 100 200 300 400 500 600
100
150
123
12
3 1
2
3
12
3
12
3 1
2
3
1
2
3
Months
Stra
tegi
c as
sets
cons
iste
ncy
inde
x
0 100 200 300 400 500 600
0,9
1,0
1,1
123 1
2
3
1
2
3
1
2
3
1
23 1
2
3
1
2
Months
Equ
ity
0 100 200 300 400 500 6001.000.000
2.000.000
3.000.000
4.000.000
1 23
1 23
123
1 23
123
123
1
10
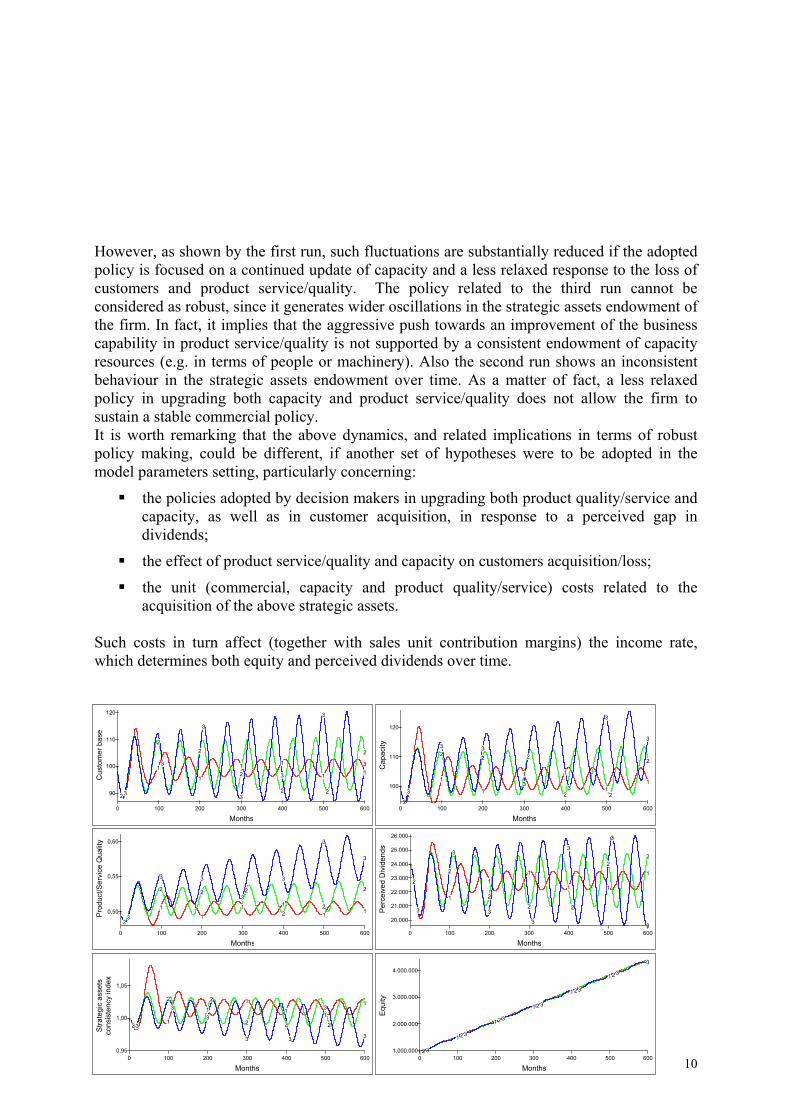
However, as shown by the first run, such fluctuations are substantially reduced if the adopted policy is focused on a continued update of capacity and a less relaxed response to the loss of customers and product service/quality. The policy related to the third run cannot be considered as robust, since it generates wider oscillations in the strategic assets endowment of the firm. In fact, it implies that the aggressive push towards an improvement of the business capability in product service/quality is not supported by a consistent endowment of capacity resources (e.g. in terms of people or machinery). Also the second run shows an inconsistent behaviour in the strategic assets endowment over time. As a matter of fact, a less relaxed policy in upgrading both capacity and product service/quality does not allow the firm to sustain a stable commercial policy. It is worth remarking that the above dynamics, and related implications in terms of robust policy making, could be different, if another set of hypotheses were to be adopted in the model parameters setting, particularly concerning:
the policies adopted by decision makers in upgrading both product quality/service and capacity, as well as in customer acquisition, in response to a perceived gap in dividends;
the effect of product service/quality and capacity on customers acquisition/loss;
the unit (commercial, capacity and product quality/service) costs related to the acquisition of the above strategic assets.
Such costs in turn affect (together with sales unit contribution margins) the income rate, which determines both equity and perceived dividends over time.
Months
Cus
tom
er b
ase
0 100 200 300 400 500 600
90
100
110
120
1
23
1
2
3
1
2
3
12
3
1
2
3 1
2
3
1
2
3
Months
Pro
duct
/Ser
vice
Qua
lity
0 100 200 300 400 500 600
0,50
0,55
0,60
12
3
1
2
3
1
2
3
1
23
12
3
12
3
1
2
3
Months
Per
ceiv
ed D
ivid
ends
0 100 200 300 400 500 600
20.000
21.000
22.000
23.000
24.000
25.000
26.000
1
2
3
1
2
3
1
2
3
1
2
3
1
2
3
1
2
3
1
2
3
Months
Cap
acity
0 100 200 300 400 500 600
100
110
120
1
2
3
1
23
1
2
3
1
2
3
1
23 1
2
3
1
2
3
Months
Stra
tegi
c as
sets
cons
iste
ncy
inde
x
0 100 200 300 400 500 6000,95
1,00
1,05
123
1
23 1
2
3
1
2
3
1
2
3
1
2
31
3
Months
Equ
ity
0 100 200 300 400 500 6001.000.000
2.000.000
3.000.000
4.000.000
123
123
1 23
123
1 23
123
3
11
Figure 5 Scenario 2 Behaviours
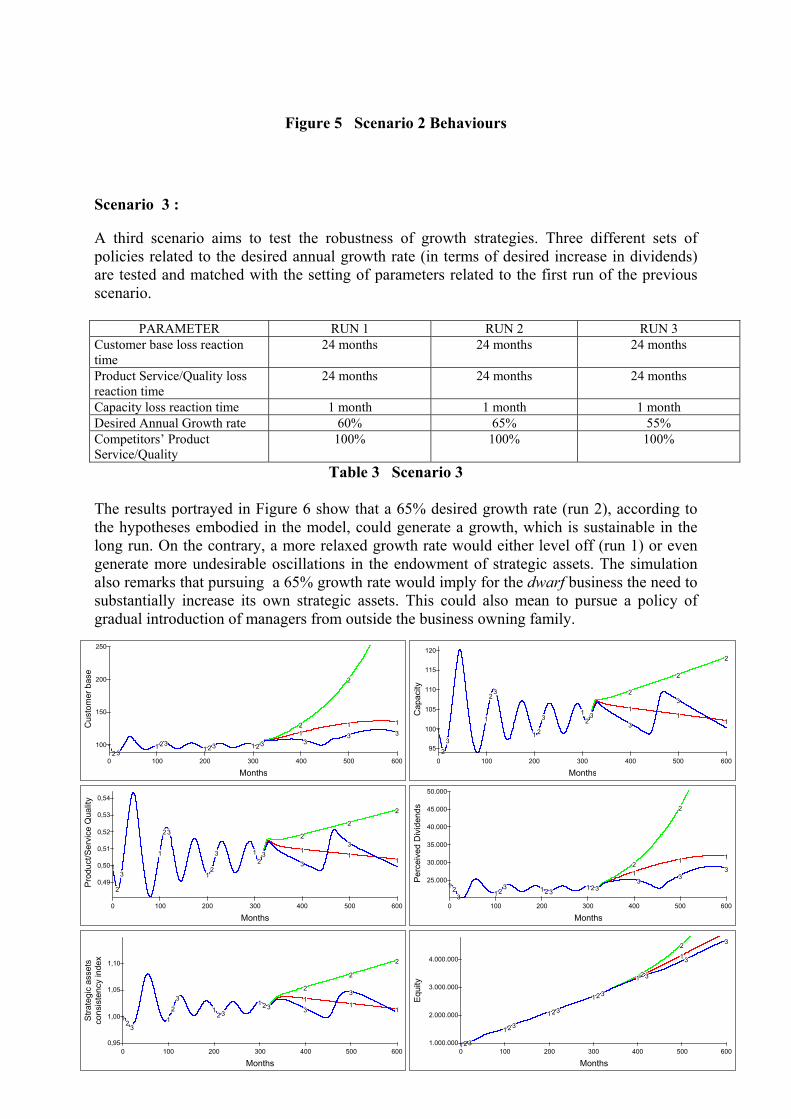
Scenario 3 : A third scenario aims to test the robustness of growth strategies. Three different sets of policies related to the desired annual growth rate (in terms of desired increase in dividends) are tested and matched with the setting of parameters related to the first run of the previous scenario.
PARAMETER RUN 1 RUN 2 RUN 3 Customer base loss reaction time
24 months 24 months 24 months
Product Service/Quality loss reaction time
24 months 24 months 24 months
Capacity loss reaction time 1 month 1 month 1 month Desired Annual Growth rate 60% 65% 55% Competitors’ Product Service/Quality
100% 100% 100%
Table 3 Scenario 3 The results portrayed in Figure 6 show that a 65% desired growth rate (run 2), according to the hypotheses embodied in the model, could generate a growth, which is sustainable in the long run. On the contrary, a more relaxed growth rate would either level off (run 1) or even generate more undesirable oscillations in the endowment of strategic assets. The simulation also remarks that pursuing a 65% growth rate would imply for the dwarf business the need to substantially increase its own strategic assets. This could also mean to pursue a policy of gradual introduction of managers from outside the business owning family.
Months
Cus
tom
er b
ase
0 100 200 300 400 500 600
100
150
200
250
123
123123 1 23
12
3
1
2
3
13
Months
Pro
duct
/Ser
vice
Qua
lity
0 100 200 300 400 500 600
0,49
0,50
0,51
0,52
0,53
0,54
1
2
3
1
23
12
3 12
3 1
2
31
2
3
1
2
Months
Per
ceiv
ed D
ivid
ends
0 100 200 300 400 500 600
25.000
30.000
35.000
40.000
45.000
50.000
123 12
3 1231 23
12
3
1
2
3
1
3
Months
Cap
acity
0 100 200 300 400 500 600
95
100
105
110
115
120
1
23
1
23
1 2
31
23
1
2
31
2
3
1
2
Months
Stra
tegi
c as
sets
cons
iste
ncy
inde
x
0 100 200 300 400 500 6000,95
1,00
1,05
1,10
12
31
23
123
1231
2
31
2
3
1
2
Months
Equ
ity
0 100 200 300 400 500 6001.000.000
2.000.000
3.000.000
4.000.000
123
123
123
12 3
123
12
3
3
12
Figure 6 Scenario 3 Behaviours
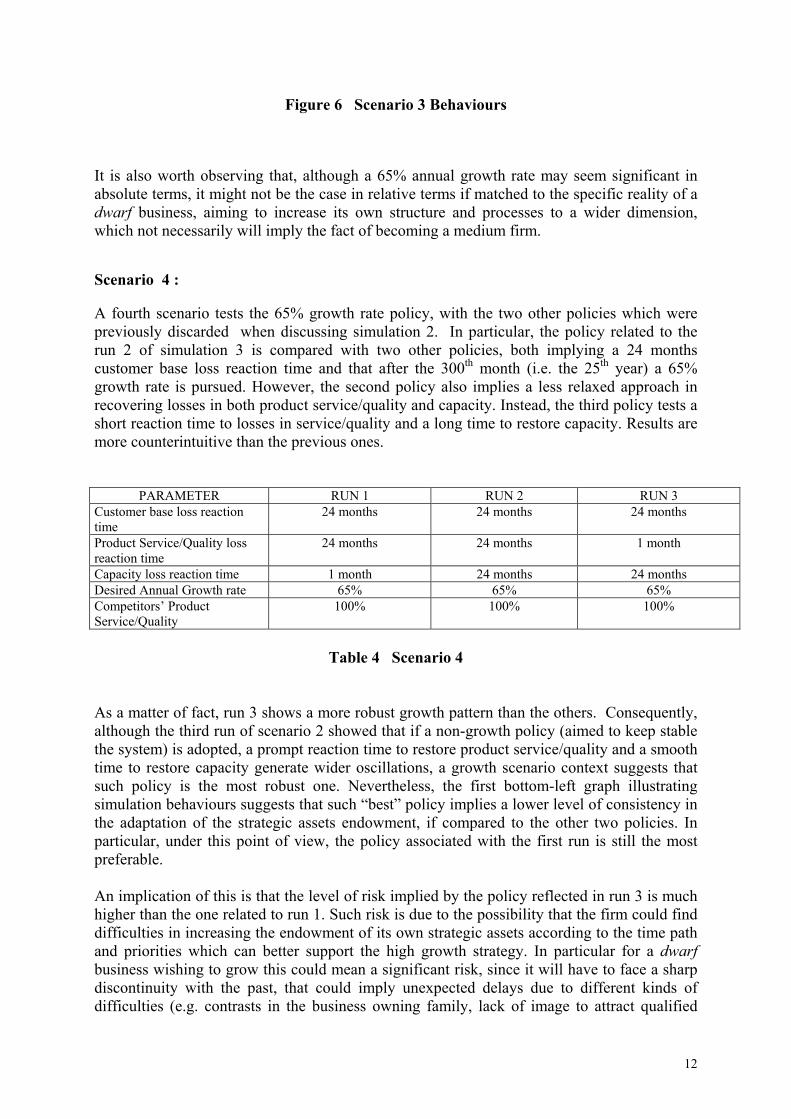
It is also worth observing that, although a 65% annual growth rate may seem significant in absolute terms, it might not be the case in relative terms if matched to the specific reality of a dwarf business, aiming to increase its own structure and processes to a wider dimension, which not necessarily will imply the fact of becoming a medium firm. Scenario 4 : A fourth scenario tests the 65% growth rate policy, with the two other policies which were previously discarded when discussing simulation 2. In particular, the policy related to the run 2 of simulation 3 is compared with two other policies, both implying a 24 months customer base loss reaction time and that after the 300th month (i.e. the 25th year) a 65% growth rate is pursued. However, the second policy also implies a less relaxed approach in recovering losses in both product service/quality and capacity. Instead, the third policy tests a short reaction time to losses in service/quality and a long time to restore capacity. Results are more counterintuitive than the previous ones.
PARAMETER RUN 1 RUN 2 RUN 3
Customer base loss reaction time
24 months 24 months 24 months
Product Service/Quality loss reaction time
24 months 24 months 1 month
Capacity loss reaction time 1 month 24 months 24 months Desired Annual Growth rate 65% 65% 65% Competitors’ Product Service/Quality
100% 100% 100%
Table 4 Scenario 4
As a matter of fact, run 3 shows a more robust growth pattern than the others. Consequently, although the third run of scenario 2 showed that if a non-growth policy (aimed to keep stable the system) is adopted, a prompt reaction time to restore product service/quality and a smooth time to restore capacity generate wider oscillations, a growth scenario context suggests that such policy is the most robust one. Nevertheless, the first bottom-left graph illustrating simulation behaviours suggests that such “best” policy implies a lower level of consistency in the adaptation of the strategic assets endowment, if compared to the other two policies. In particular, under this point of view, the policy associated with the first run is still the most preferable. An implication of this is that the level of risk implied by the policy reflected in run 3 is much higher than the one related to run 1. Such risk is due to the possibility that the firm could find difficulties in increasing the endowment of its own strategic assets according to the time path and priorities which can better support the high growth strategy. In particular for a dwarf business wishing to grow this could mean a significant risk, since it will have to face a sharp discontinuity with the past, that could imply unexpected delays due to different kinds of difficulties (e.g. contrasts in the business owning family, lack of image to attract qualified
13
managers and other resources). The above thoughts could suggest the opportunity of undertaking a more relaxed and cautious policy, such as the one associated with run 2.
Figure 7 Scenario 4 Behaviours Scenario 5 :
A fifth scenario tests the three growth rate policies analysed in the previous one, in the light of a new context: an increase of rivals’ competitiveness in which product service/quality level is increased from 100% (parity) to 150% (competitive advantage) from the 300th month. Results confirm the analysis previously done. In this case, furthermore, the levels of product service/quality and capacity are higher and more stable than in the previous ones. Similar remarks can be referred to the strategic assets consistency index.
PARAMETER RUN 1 RUN 2 RUN 3
Customer base loss reaction time
24 months 24 months 24 months
Product Service/Quality loss reaction time
24 months 24 months 1 month
Capacity loss reaction time 1 month 24 months 24 months Desired Annual Growth rate 65% 65% 65% Competitors’ Product Service/Quality
150% 150% 150%
Table 5 Scenario 5
A possible explanation of this is that responding to threats arising from competitors’ policies can result in a factor stabilising the business system. This can allow a dwarf business to either
Months
Cus
tom
er b
ase
0 100 200 300 400 500 600
100
150
200
250
123
1 23 1
23 12
312
3
1
2
3
Months
Pro
duct
/Ser
vice
Qua
lity
0 100 200 300 400 500 600
0,50
0,55
0,60
12
31
2
3
1
2
3
1
23 1
2
3
1
2
3
1
2
3
MonthsP
erce
ived
Div
iden
ds
0 100 200 300 400 500 600
20.000
30.000
40.000
50.000
123 1
2 3 1 23
12 3
1
23
1
Months
Cap
acity
0 100 200 300 400 500 600
100
110
120
1
2
3
1
23
1
2
3
1
2
3
12
3
12
3
1
3
Months
Stra
tegi
c as
sets
cons
iste
ncy
inde
x
0 100 200 300 400 500 6000,95
1,00
1,05
1,10
123 1
23 1
23 1
2
3
12
3
1
2
3
1
2
3
Months
Equ
ity
0 100 200 300 400 500 6001.000.000
2.000.000
3.000.000
4.000.000
5.000.000
6.000.000
7.000.000
123123
123123
123
12
3
1
3
14
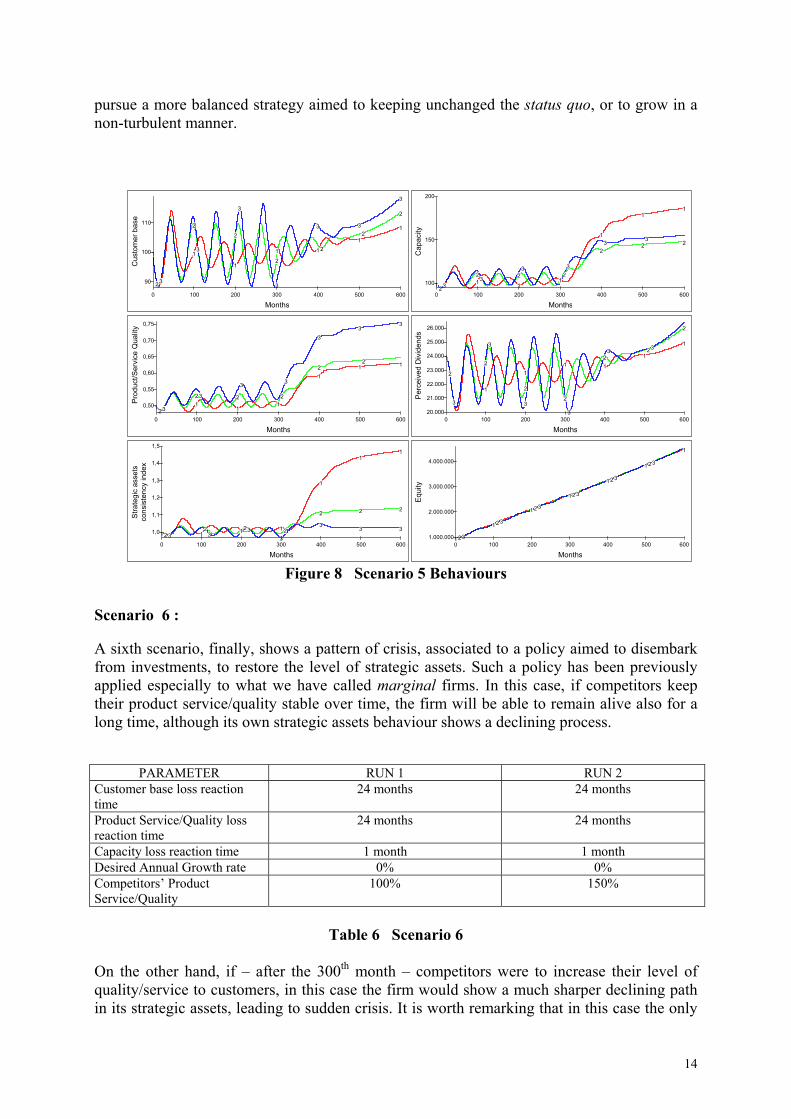
pursue a more balanced strategy aimed to keeping unchanged the status quo, or to grow in a non-turbulent manner.
Figure 8 Scenario 5 Behaviours
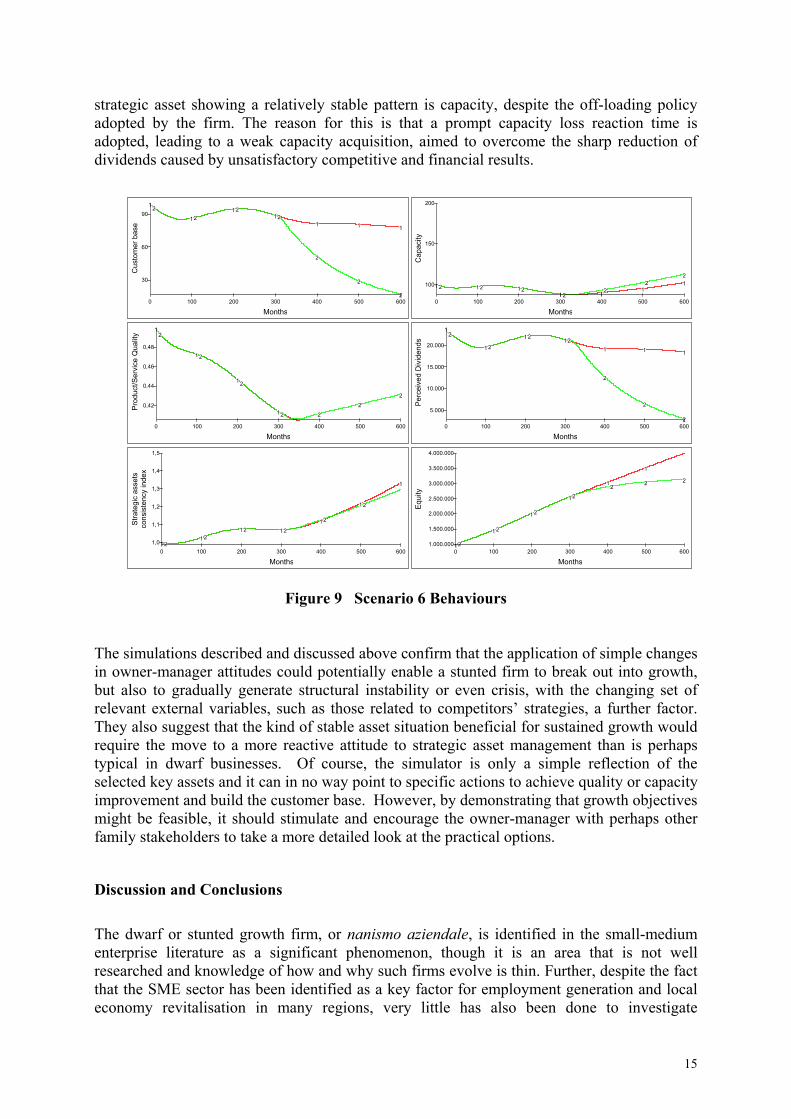
Scenario 6 : A sixth scenario, finally, shows a pattern of crisis, associated to a policy aimed to disembark from investments, to restore the level of strategic assets. Such a policy has been previously applied especially to what we have called marginal firms. In this case, if competitors keep their product service/quality stable over time, the firm will be able to remain alive also for a long time, although its own strategic assets behaviour shows a declining process.
PARAMETER RUN 1 RUN 2
Customer base loss reaction time
24 months 24 months
Product Service/Quality loss reaction time
24 months 24 months
Capacity loss reaction time 1 month 1 month Desired Annual Growth rate 0% 0% Competitors’ Product Service/Quality
100% 150%
Table 6 Scenario 6
On the other hand, if – after the 300th month – competitors were to increase their level of quality/service to customers, in this case the firm would show a much sharper declining path in its strategic assets, leading to sudden crisis. It is worth remarking that in this case the only
Months
Cus
tom
er b
ase
0 100 200 300 400 500 600
90
100
110
1
23
1
2
3
1
2
3
1
2
3
1 2
3
12
3 1
2
3
Months
Pro
duct
/Ser
vice
Qua
lity
0 100 200 300 400 500 600
0,50
0,55
0,60
0,65
0,70
0,75
123
123
1
2
3
12
312
3
12
3
1
3
MonthsP
erce
ived
Div
iden
ds0 100 200 300 400 500 600
20.000
21.000
22.000
23.000
24.000
25.000
26.000
1
2
3
1
2
3
1
2
3
1
2
3
12
31
231
2
Months
Cap
acity
0 100 200 300 400 500 600
100
150
200
123 1
23
1
23
12
3
1
23
1
23
1
2
Months
Stra
tegi
c as
sets
cons
iste
ncy
inde
x
0 100 200 300 400 500 600
1,0
1,1
1,2
1,3
1,4
1,5
123 12
3 123 1 23
1
2
3
1
2
3
1
2
3
Months
Equ
ity
0 100 200 300 400 500 6001.000.000
2.000.000
3.000.000
4.000.000
1 23
123
12 3
123
123
123
1
15
strategic asset showing a relatively stable pattern is capacity, despite the off-loading policy adopted by the firm. The reason for this is that a prompt capacity loss reaction time is adopted, leading to a weak capacity acquisition, aimed to overcome the sharp reduction of dividends caused by unsatisfactory competitive and financial results.
Figure 9 Scenario 6 Behaviours
The simulations described and discussed above confirm that the application of simple changes in owner-manager attitudes could potentially enable a stunted firm to break out into growth, but also to gradually generate structural instability or even crisis, with the changing set of relevant external variables, such as those related to competitors’ strategies, a further factor. They also suggest that the kind of stable asset situation beneficial for sustained growth would require the move to a more reactive attitude to strategic asset management than is perhaps typical in dwarf businesses. Of course, the simulator is only a simple reflection of the selected key assets and it can in no way point to specific actions to achieve quality or capacity improvement and build the customer base. However, by demonstrating that growth objectives might be feasible, it should stimulate and encourage the owner-manager with perhaps other family stakeholders to take a more detailed look at the practical options.
Discussion and Conclusions The dwarf or stunted growth firm, or nanismo aziendale, is identified in the small-medium enterprise literature as a significant phenomenon, though it is an area that is not well researched and knowledge of how and why such firms evolve is thin. Further, despite the fact that the SME sector has been identified as a key factor for employment generation and local economy revitalisation in many regions, very little has also been done to investigate
Months
Cus
tom
er b
ase
0 100 200 300 400 500 600
30
60
9012
121 2
121
2
1
2
1
2
Months
Pro
duct
/Ser
vice
Qua
lity
0 100 200 300 400 500 600
0,42
0,44
0,46
0,48
12
12
12
12 2
2
2
Months
Per
ceiv
ed D
ivid
ends
0 100 200 300 400 500 600
5.000
10.000
15.000
20.000
12
1 2
1212
1
2
1
2
1
2
Months
Cap
acity
0 100 200 300 400 500 600
100
150
200
12 12 1212 12 1
2 12
Months
Stra
tegi
c as
sets
cons
iste
ncy
inde
x
0 100 200 300 400 500 6001,0
1,1
1,2
1,3
1,4
1,5
121 2
12 1 212
12
1
Months
Equ
ity
0 100 200 300 400 500 6001.000.000
1.500.000
2.000.000
2.500.000
3.000.000
3.500.000
4.000.000
1 2
12
12
12
12
1
2 2
16
sustainable policies to unleash the potential of stunted firms. Firms in such circumstances might be failing to maximise the income and wealth creation potential for the owners and mean that the local economy and employment prospects are also constrained. Of course it is also recognised that in many cases the owners are not unhappy with this situation and the firm has provided a satisfactory income and lifestyle, maybe through a number of generations of family ownership. However, as the case-studies in Bianchi et al. (2003) also pointed out, there may be changing environmental conditions or changes in ownership that demand that a firm move into a growth mode. In practical terms therefore, there are potentially three challenges facing the owners of a dwarf firm: Enlightening owner-managers that their firms may be in a stunted growth situation and
that there could consequently be opportunities for moving the firms forward. (Though, of course, with the rider that individual owners might not wish to embark on that path).
Assisting owner managers who might wish to break out in understanding why the constraint has historically occurred, in identifying the possible constraining mechanism(s), and where there is potential to break out by modifying strategic targets and attitudes.
Identifying and evaluating specific actions and strategic alternatives for achieving growth in the key strategic assets.
The model described in this paper is directed towards the first two of these roles, the last would require a more detailed model calibrated to a specific firm. Although only a simple model, it does include sufficient detail to enable it to replicate the expected cyclical behaviour of dwarf firms, and to reflect the structures that lead to the ebb and flow of strategic assets. It can also show how the firm is constrained from achieving any form of sustained, stable growth in a way that is likely to be meaningful to entrepreneurs. This paper has described a set of scenarios showing how it could be used to examine particular changes that might enable a firm to achieve growth in the future. Thus, it is argued, this paper demonstrates the potential of using a simulator such as this in the first two roles. For the simulator to be fully functional as an insight model, it could benefit from even further refinement, in particular the further enhancement of the model by the addition of additional mechanisms to represent the management of other strategic assets that might be relevant for a wider range of firms, for example knowledge-base, company image, or network contacts, and the related analysis of the behavioural impacts. Such a generic model could then be used with owner-managers, maybe in a collective situation like a workshop or small business organisation event, initially to raise the issue of whether they are all achieving the growth potential of their firms and to highlight the constraining factors. A further role for this simulator would be to support the efforts of economic development agencies, small-firm training and advisory organisations, and consultants who support SME development. An entrepreneur who might want a more detailed model tailored to his/her own firm’s circumstances could be provided with this option. This could be achieved through two paths. The first would be through the commissioning of the tailoring of this base model into a company-specific model by the addition of mechanism appropriate to its products/services, distribution channels, target markets, access to incentives and support, and so on, and the parameterisation of the model to its own data. The second, and probably more economical,
17
route could be through the development of a generic model which can be easily parameterised to an individual firm through an easy to use interface. As mentioned earlier, this latter concept has been shown feasible and effective in other research (Winch 2000; Winch and Arthur 2002). In summary, these results add significantly to the understanding of this particular aspect of growth dynamics in small firms. A type of model has been described which could assist policy makers and small firm support agencies in identifying strategies for support initiatives and training that will help small business avoid the pitfalls that lead to dwarfism and achieve their growth potential. More directly, the simulator, in its present form or in a more refined version, could be used to help small companies understand why their stunted nature means they might be missing opportunities for enhancing the owners’ revenues and net worth. Further, it could suggest possible ways forward to release them from the factors that are constraining their growth. For younger firms, it might help them understand how to avoid falling into this situation in the first place.
REFERENCES Amit R. and Schoemaker P. (1993), Strategic Assets and Organizational Rent Strategic Management
Journal, 14, pp. 33-46 Arthur D. and Winch G.W. (1999), Extending Model Validity Concepts and Measurements in
System Dynamics Proceedings of the 1999 International System Dynamics Society Conference, Wellington, N.Z..
Bianchi C. (2002), Introducing SD Modelling into Planning & Control Systems to Manage SMEs’ Growth: a Learning-oriented Perspective, in: Bianchi C. (ed.), Systems Thinking and System Dynamics in Small-Medium Enterprises, Special issue of the System Dynamics Review, 18(3) pp. 315-338
Bianchi C., Raimondi L. and Fasone V. (2003), Structural Growth Disengagement and Entrepreneurship in Small and Micro-Firms: Mapping Pathologies and Physiologies of Business “Dwarfism” in a Dynamic Resource-Based View, Proceedings of the First AGSE International Entrepreneurship Research Exchange, Melbourne, February.
Bianchi C., Winch G.W. (2005), Unleashing Growth Potential in ‘Stunted’ SMEs: Insights from Simulator Experiments, AGSE Conference Proceedings, Melbourne,
Brown T. E. and Kirchhoff B. A. (1997), The Effects of Resource Availability and Entrepreneurial Orientation on Firm Growth, Frontiers of Entrepreneurship Research (http://www.babson.edu/entrep/fer/papers97/kirtchoff/kir1.htm)
Dierickx I and Cool K., (1989). Asset Stock Accumulation and Sustainability of Competitive Advantage. Management Science, 35, (12), pp.1504-1511
Forrester J. W. (1961). Industrial Dynamics, Productivity Press, Portland Gibson B., (2002). Submission to the Committee’s Inquiry into Small Business Employment Issues,
Senate Employment Workplace Relations and Education References Committee, Submission n. 77, Small Business Employment (http://www.aph.gov.au/senate/committee/eet_ctte/smallbus_employ/submissions/sub077.doc)
Holmes S. and Zimmer I. , (1994). The Nature of the Small Firm: Understanding the Motivations of Growth and non-growth Oriented Owners, Australian Journal of Management, 19 (1), pp. 97-120
Perren L., (1997). The Growth of Micro-Enterprises, XX ISBA National Conference, Belfast Rapporto ISAE – 4th Report, (2003). Le Previsioni per l’economia Italiana [Forecasting on the Italian
Economy], (http://www.isae.it/rt_24072003_cs.pdf)
18
Russo G., (1988). Fenomeno del Nanismo e Politica degli Incubators [The “Dwarfism” Phenomenon and Incubators Policy], Proceedings of the Workshop on : “Formazione e Sviluppo di Nuove Imprese” [Education and new business Growth, S. Miniato, Pisa, November
Warren K, (2002) Competitive Strategy Dynamics Chichester: John Wiley & Sons Winch G.W. (2000) The Need for New Thinking in Times of Major Change: Frameworks for
Support and a New Device, Proceedings of the British Academy of Management Conference (BAM2000), Edinburgh.
Winch G.W. and Arthur D. (2002) User-parameterised Generic Models: a Solution to the Conundrum of Modelling Access for SMEs?, Special issue on Small Medium Enterprises - System Dynamics Review, 18:3, 2002


![Nitrogen, phosphorus and zinc enhance Maize hybrid productivity … · 2016-12-29 · [16, 17]. Zn deficiency causes stunted growth, slow cell division, susceptibility to disease](https://img.pdfslide.us/doc/110x75/5f5150aae5f918157102baab/nitrogen-phosphorus-and-zinc-enhance-maize-hybrid-productivity-2016-12-29-16.jpg)