Embed Size (px)
Citation preview
ASSOCIATIONS BETWEEN NEUROMOTOR AND NEUROCOGNITIVE
FUNCTIONING IN ADULTS WITH SCHIZOTYPAL PERSONALITY DISORDER
Felicia D. Reynolds, B.A.
Thesis Prepared for the Degree of
MASTER OF SCIENCE
UNIVERSITY OF NORTH TEXAS
May 2004
APPROVED:
Craig S. Neumann, Major Professor and Chair Ernest H. Harrell, Committee Member Kenneth W. Sewell, Committee Member and
Director of Clinical Training Linda L. Marshall, Interim Chair of the Department
of Psychology Sandra L. Terrell, Interim Dean of the Robert B.
Toulouse School of Graduate Studies
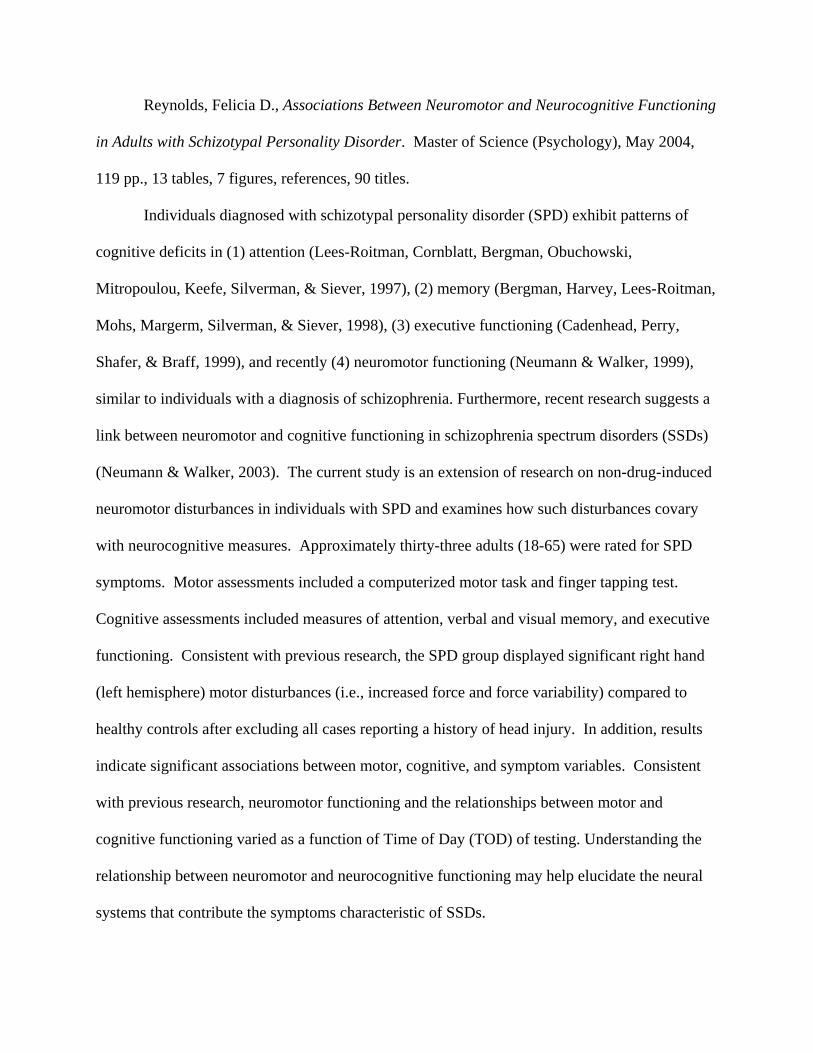
Reynolds, Felicia D., Associations Between Neuromotor and Neurocognitive Functioning
in Adults with Schizotypal Personality Disorder. Master of Science (Psychology), May 2004,
119 pp., 13 tables, 7 figures, references, 90 titles.
Individuals diagnosed with schizotypal personality disorder (SPD) exhibit patterns of
cognitive deficits in (1) attention (Lees-Roitman, Cornblatt, Bergman, Obuchowski,
Mitropoulou, Keefe, Silverman, & Siever, 1997), (2) memory (Bergman, Harvey, Lees-Roitman,
Mohs, Margerm, Silverman, & Siever, 1998), (3) executive functioning (Cadenhead, Perry,
Shafer, & Braff, 1999), and recently (4) neuromotor functioning (Neumann & Walker, 1999),
similar to individuals with a diagnosis of schizophrenia. Furthermore, recent research suggests a
link between neuromotor and cognitive functioning in schizophrenia spectrum disorders (SSDs)
(Neumann & Walker, 2003). The current study is an extension of research on non-drug-induced
neuromotor disturbances in individuals with SPD and examines how such disturbances covary
with neurocognitive measures. Approximately thirty-three adults (18-65) were rated for SPD
symptoms. Motor assessments included a computerized motor task and finger tapping test.
Cognitive assessments included measures of attention, verbal and visual memory, and executive
functioning. Consistent with previous research, the SPD group displayed significant right hand
(left hemisphere) motor disturbances (i.e., increased force and force variability) compared to
healthy controls after excluding all cases reporting a history of head injury. In addition, results
indicate significant associations between motor, cognitive, and symptom variables. Consistent
with previous research, neuromotor functioning and the relationships between motor and
cognitive functioning varied as a function of Time of Day (TOD) of testing. Understanding the
relationship between neuromotor and neurocognitive functioning may help elucidate the neural
systems that contribute the symptoms characteristic of SSDs.

ACKNOWLEDGEMENTS
Thanks to Craig Neumann for his dedication, support, and guidance in the completion of
this project.
ii
TABLE OF CONTENTS
Page LIST OF TABLES………………………………………………………………………………...v LIST OF FIGURES…….…………………………………..…………………………………….vi CHAPTER
1. INTRODUCTION..……………………………….………………………………..…..1 Neurocognitive Functioning in Schizophrenia Spectrum Disorders Neuromotor Functioning in Schizophrenia Spectrum Disorders Theories of the Relationship Between Motor and Cognitive Functioning Neuromotor and Cognitive Studies Neuromotor Functioning and Symptomotology Current Study Hypotheses
2. METHOD……..………………………………………………………………………21
Participants Procedures
Measures
3. RESULTS…………………………………………………………………………….41
Demographic Data Group Effects for Cognitive Functioning
Group Effects for Motor Functioning Family History of Psychopathology and Cognitive, Motor, and Symptom
Variables Time of Day and Cognitive Functioning Time of Day and Motor Functioning History of Head Injury and Cognitive, Motor, and Symptom Variables Schizotypal Symptoms and Cognitive Functioning Schizotypal Symptoms and Left Hand Motor Functioning Schizotypal Symptoms and Right Hand Motor Functioning Left Hand Motor Functioning and Cognitive Functioning Right Hand Motor Functioning and Cognitive Functioning Regression Analyses
4. DISCUSSION…………………………………………………………………….….63
Integration of Results Implications Limitations
iii

Future Directions
APPENDICES………………………………………………………………………..………….86 REFERENCES…………………………………………………………………………..……..110
iv

LIST OF TABLES
Table Page 1. Demographic Data of Participants……..……………………………………………….87 2. Descriptive Statistics for Cognitive Variables Based on SCID-II Interviews……………88 3. Descriptive Statistics for Motor Variables for Left Hand Based on SCID-II
Interviews………………………………………………………………………………...89 4. Descriptive Statistics for Motor Variables for Right Hand Based on SCID-II
Interviews………………………………………………………………………………...90
5. Descriptive Statistics for Motor Variables by TOD based on SCID-II Interviews………91 6. Descriptive Statistics for Motor Variables Based on SCID-II Interviews
(No Head Injury Sample)…………………………………………………………….…..92
7. Correlations Between Schizotypal Symptoms & Cognitive Performance……………….93 8. Correlations Between Schizotypal Symptoms & Left Hand Motor Performance………..94 9. Correlations Between Schizotypal Symptoms & Right Hand Motor Performance………95 10. Correlations Between Left Hand Motor Variables and Cognitive Variables……………96 11. Correlations Between Right Hand Motor Variables and Cognitive Variables………….97 12. Correlations Between Motor Variables and Cognitive Variables Controlling
for TOD…………………………………………………………………………….…….98
13. Correlations Between TOD, Head Injury, and Family History of Psychopathology with Motor, Cognitive, and Symptom Variables…………………………………………99
v
LIST OF FIGURES Figure Page 1. Motor Responses as a Function of Group and TOD (AM)………………………… ….101 2. Motor Responses as a Function of Group and TOD (PM)………………… ………….102 3. Motor Overflow as a Function of Group and TOD……………………………………103 4. Motor Responses as a Function of TOD – SPD Sample……………………………….104 5. Motor Responses as a Function of TOD – HC Sample………………………………...105 6. Motor Overflow as a Function of Group……………………………………………….106 7. Motor Responses as a function of Group (No Head Injury Sample)………….………..107
vi
CHAPTER 1
INTRODUCTION
Individuals meeting diagnostic criteria for schizotypal personality disorder (SPD) have
shown biological and cognitive characteristics similar to those of patients with schizophrenia
(Siever, 1992). For instance, those with SPD have similar patterns of cognitive deficits in
attention and executive functioning as patients with schizophrenia (Cadenhead, Perry, Shafer, &
Braff, 1999; Lees-Roitman, Cornblatt, Bergman, Obuchowski, Mitropoulou, Keefe, Silverman,
and Siever, 1997; Lenzenweger, Cornblatt, & Putnick, 1991). Moreover, they are presumed to
be at increased risk for developing schizophrenia (Gottesman, 1990). However, research with
individuals with SPD does not involve many of the confounds that are noted in studies involving
individuals with schizophrenia such as medication effects, institutionalization, or acute psychotic
symptomotology. Although SPD might represent a milder variant or precursor of schizophrenia,
both have been shown to exist within the same spectrum of schizophrenia related disorders
(Gottesman, 1991).
Research has demonstrated that SPD shares a common familial etiology with
schizophrenia and other schizophrenia spectrum disorders (SSD) (e.g., schizoaffective,
schizophreniform disorder). Numerous studies have found an increased prevalence of SPD in
relatives of probands with schizophrenia verses matched controls. Similarly, it has been shown
that relatives of probands with SPD have a significantly elevated risk for schizophrenia. Kendler
and Walsh (1995) examined the impact of a parental diagnosis of SPD on the risk for psychiatric
disorders in siblings of probands with schizophrenia or SSDs. They found that a parental
diagnosis of SPD significantly increased the risk for schizophrenia in siblings of schizophrenia
1
probands. However, a parental diagnosis of SPD did not predict risk for major depression,
bipolar disorder, or anxiety disorders in siblings. Thus, the presence of SPD in relatives may
increase vulnerability to schizophrenia and other SSDs.
A strong genetic link between SPD and schizophrenia has also been established in the
literature. The landmark Danish Adoption Study of Schizophrenia originally begun by Kety and
colleagues found a higher prevalence of schizophrenia and “borderline” schizophrenia among
biological relatives of adoptees with schizophrenia than in the biological relatives of controls
(see Kety, 1988 for a review; Kety, Wender, Jacobsen, Ingraham, Jansson, Faber, & Kinney,
1994). Kendler, Gruenberg, and Strauss (1981) reevaluated the interviews of relatives from the
Copenhagen sample of the Danish Adoption Study and found that the prevalence of SPD was
significantly higher in the biological relatives of adoptees with schizophrenia than in the
biological relatives of controls. In addition, the researchers did not find a single case of SPD
among the adoptive relatives of individuals with schizophrenia.
While these studies demonstrate a genetic link between SPD and schizophrenia, familial-
environmental factors have also been implicated in the expression of the diathesis for
schizophrenia (Tienari, Wynne, Moring, Lahti, Naarala, Sorri, Wahlberg, Saarento, Seitamaa,
Kaleva, & Laksy, 1994). Tienari et al. (1994) found that adopted-away offspring of individuals
with schizophrenia had significantly higher rates of schizophrenia and SSDs than matched
controls (adopted- away offspring of individuals without schizophrenia). However, adopted-
away offspring of individuals with schizophrenia and matched controls (adopted- away offspring
of individuals without schizophrenia) reared in disturbed familial environments had significantly
higher rates of psychopathology than adoptees reared in healthy familial environments. Thus,
2

genetic, familial, and environmental factors appear to contribute to the expression of
schizophrenia and SSDs in at-risk individuals.
Neurocognitive Functioning in SSDs
From schizophrenia’s initial conceptualization (Bleuler, 1911; Kraeplin, 1919), problems
in cognitive functioning have been a defining feature of this disorder. Thus, neuropsychological
studies have continued to focus on the cognitive deficits associated with SSDs. The goal of these
studies, in conjunction with brain imaging studies, is to elucidate the underlying structural and
functional brain abnormalities that may be associated with this spectrum of disorders (Kremen,
Seidman, Pepple, Lyons, Tsuang, & Faraone, 1994). To date, there is substantial evidence for
impairments in attention, memory, and executive functioning in individuals with SSDs.
There is extensive research demonstrating impairments in attention in patients with
schizophrenia, as well as those at risk for schizophrenia (Braff, 1993; also see Maruff & Currie,
1996 and Gourovitch & Goldberg, 1996 for a review). Attention deficits in at-risk populations
(e.g., offspring with a biological relative with schizophrenia) suggest that impairments in
attention are a neuropsychological risk indicator of a genetic liability for schizophrenia (Braff,
1993; Cornblatt & Keilp, 1994; Kremen et al. 1994; Mirsky, Ingraham, & Kugelmass, 1995;
Nuechterlein & Dawson, 1984). Findings from the New York High-Risk Project offer evidence
that impaired attention may be an early biobehavioral marker for the genetic liability to later
develop schizophrenia. Specifically, children with a parent diagnosed with schizophrenia show
attention deficits that are significantly associated with later adolescent and adult maladjustment
(Erlenmeyer-Kimling & Cornblatt, 1992).
Impairment in attention sensitivity (i.e., ability to discriminate target from non-target
stimuli), as measured by the Continuous Performance Test (CPT), has been established as a key
3

risk indicator for the genetic susceptibility to schizophrenia (Cornblatt & Keilp, 1994).
Moreover, the results suggest that particular patterns in attentional abnormalities may be specific
to psychosis and schizophrenia. Cornblatt, Lenzenweger, and Erlenmeyer-Kimling (1989)
studied CPT attention profiles of individuals with schizophrenia and affectively disordered
patients. Individuals with schizophrenia displayed attention deficits in detecting both four-digit
numbers and abstract shapes, and thus showed a profile of low hit rates and high random
commission (false positive) error rates. In contrast, the affectively disturbed individuals
displayed impairment only on the shapes task and made a high number of false-alarm
commission errors. In addition, Nuechterlein (1983) reported that the offspring of women with
schizophrenia scored lower on the CPT d’ factor (an attentional sensitivity ratio involving hits to
non-hits) when compared to normal controls, children of mothers with non-psychotic psychiatric
disorders, or boys with attention deficit disorder.
Typically, the standard X and AX versions of the CPT have been sufficient in detecting
performance deficits in individuals with schizophrenia. The X and AX CPT, developed by
Rosvold and colleagues in 1956, consists of two tasks. In the first task, the subject is instructed
to respond whenever the letter X appears on the screen. In the second task, the subject is
instructed to respond to the letter X only when it is preceded by the letter A. The AX CPT is
useful for detecting gross levels of attentional impairment. However, the difficulty level of the
CPT becomes more important when studying attention impairments in populations that are at
risk for, but do not manifest a diagnosis of schizophrenia (see Cornblatt & Keilp, 1994 for a
review). The CPT-Identical Pairs (Cornblatt, 1998; Cornblatt & Keilp, 1994; Erlenmeyer-
Kimling & Cornblatt, 1992) task is considered to be a more challenging, and thus more sensitive
measure of attentional deficits. Stimuli are displayed more rapidly (50 msec verses 250 msec)
4

and the target response is constantly changing (i.e. a target is defined as any two successive
identical stimuli).
The attentional impairments of non-psychotic at-risk populations appear to be subtler,
and thus, it is necessary to increase the difficulty level of the attentional measure in order to tap
problems in attentional processes. Studies that have utilized the CPT-IP have consistently found
attention deficits in unaffected offspring of parents with schizophrenia, unaffected siblings of
patients with schizophrenia, and individuals with SPD (see Cornblatt & Keilp, 1994 for a review;
Erlenmeyer-Kimling & Cornblatt, 1992; Nuechterlein & Dawson, 1984). Mirsky et al. (1995)
compared the attention skills of adult offspring of parents with schizophrenia, patients with
schizophrenia, and healthy controls. They found that adult offspring of a parent with
schizophrenia exhibited impairments in attention intermediate to patients with schizophrenia and
healthy controls. Measures of sustained attention (as indexed by the CPT), ability to focus
attention, and ability to execute a response (as indexed by Digit Symbol Substitution of the
WAIS-R, the Stroop Test, and the Trail Making Test) provided the best discrimination between
the three groups. Mirsky et al. (1995) proposed that the focus/execute element of attention is
controlled by superior temporal and parietal cortical brain regions, as well as the basal ganglia
(This and other similar proposals will be discussed further below).
Subtle, yet significant, sustained attention deficits including lower overall hit rate and
lower attentional sensitivity (d’) have been found among subjects with SPD compared to healthy
controls (Lenzenweger et al., 1991). However, the two groups did not differ in response bias or
false alarm rate. Lees-Roitman et al. (1997) also found that subjects with SPD performed
significantly worse overall on the CPT-IP than both subjects with other personality disorders and
healthy controls. In addition, subjects with borderline, histrionic, and compulsive personality
5
disorder did not differ significantly in their performance on the CPT-IP compared to healthy
controls; suggesting that sustained attention deficits may be specific to SPD and other SSDs.
Individuals with SPD exhibited impairments in attention similar to, but not as severe, as
those seen in individuals with schizophrenia. As such, Lees-Roitman and colleagues (1997)
proposed a continuum of attentional impairment, with attentional deficits worsening from
healthy controls through individuals with other personality disorders and from individuals with
SPD to those diagnosed with schizophrenia. Moreover, studies of high-risk populations,
schizophrenia, and SPD suggest specificity of attention deficits in SSDs and that this specific
attentional profile varies with severity of the disorder. Furthermore, Cornblatt and Keilp (1994)
theorize that impaired attention in individuals with a biological vulnerability to schizophrenia
may result in difficulties processing subtle and complex interpersonal cues, which could lead to
stressful and unsuccessful social interactions. Over time, emergence of social deficits may lead
to active avoidance of social situations and relationships that is one core feature of SSDs. In
support of this theory, Green (1996) found significant correlations between vigilance (as indexed
by d’), social problem solving, and social skill acquisition.
In addition to attention deficits, extensive research has documented impairments in
memory in individuals with schizophrenia and SSDs. A meta-analytic study found that deficits
in verbal and nonverbal memory were among the most significant cognitive variables
discriminating individuals with schizophrenia from healthy controls. Although verbal and
nonverbal memory deficits were comparable in magnitude across studies, nonverbal memory
effects were more heterogeneous across studies suggesting that nonverbal memory deficits may
be a less reliable finding than verbal memory deficits (Heinrichs & Zakzanis, 1998) or that other
factors may play a role in determining nonverbal memory functioning (D’Reaux, Neumann, &
6

Rhymer, 2000). In Gourovitch and Goldberg’s (1996) review of memory functioning in
individuals with schizophrenia, they report that impairment in memory processes occurs during
various stages including encoding, consolidation, retrieval, and recognition of information.
Compared to healthy controls, individuals with schizophrenia show marked deficits in learning
over trials, and impaired ability to recall stories, recurring digits, verbal paired associates, and
geometric designs (Goldberg & Gold, 1995; Gourovitch & Goldberg, 1996; Saykin, Gur, Gur,
Mozley, Mozley, Resnick, Kester, & Stafaniak, 1991). Gold, Randolph, Carpenter, Goldberg,
and Wienberger (1992) found that subjects with schizophrenia were impaired in recall ability,
use of semantic cues during free recall, recognition memory, and they tended to make more prior
list and non-list intrusions compared to healthy controls. Thus, the literature clearly delineates
disproportionate memory impairments in both acute and chronic patients with schizophrenia
beyond that which can be accounted for by premorbid intelligence and general cognitive
functioning (see Chen & McKenna, 1996 for more).
Similar to other areas of cognitive functioning, deficits in memory functioning in
individuals with SPD also appear to be intermediate to individuals with schizophrenia and
healthy controls. Cadenhead et al. (1999) found that subjects with SPD performed intermediate
to subjects with schizophrenia and healthy controls on measures of verbal and nonverbal
recognition memory (as indexed by the Recognition Memory Test) and verbal working memory
(as indexed by Letter Number Span), with moderate to large effect sizes separating the three
groups. In addition, compared to healthy controls, individuals with SPD have been shown to
learn significantly fewer words, display less semantic clustering, and make more intrusion errors
when provided with semantic cues during an orally presented word list task (Voglmaier,
Seidman, Salisbury, & McCarley, 1997). However, in this second study, the groups did not
7

differ in retention rate, number of intrusion errors made during free recall, or number of
perseverative errors. Voglmaier et al. (1997) suggest that these findings indicate deficits in
encoding and retrieval processes in individuals with SPD.
Extending previous findings, Voglmaier, Seidman, Niznikiewicz, Dickey, Shenton, and
McCarley (2000) found that individuals with SPD exhibited decrements in performance relative
to healthy controls with respect to verbal short-term retention and learning word lists over
repeated trials. Interestingly, the SPD and control groups’ performance did not differ on the
nonverbal counterparts of these tasks. No differences were found between the SPD and
comparison groups on measures of verbal (digit span) and nonverbal (spatial span) supraspan
learning as well as verbal and nonverbal long-term memory retention.
Furthermore, studies comparing subjects with SPD, schizophrenia, and other personality
disorders suggest that impairment in memory functioning may be specific to the schizophrenia
spectrum. Bergman, Harvey, Lees-Roitman, Mohs, Marder, Silverman, & Siever (1998) found
evidence of deficits in encoding and serial verbal learning in subjects with SPD compared to
subjects with other personality disorders. Although no differences were found between the two
groups in overall retention of information or semantic clustering, subjects with SPD learned
significantly fewer words over trials and learned information at a slower rate compared to
subjects with other personality disorders. In other research, subjects with SPD have also been
shown to exhibit deficits in visuospatial working memory compared to healthy controls and
subjects with a non-schizophrenia related personality disorder (Lees-Roitman, Mitropoulou,
Keefe, Silverman, Serby, Harvey, Reynolds, Mohs, & Siever, 2000). Compared to previous data
collected on patients with schizophrenia, Lees-Roitman et al. (2000) contend that the subjects
8
with SPD display memory deficits similar to, but not as severe as, impairments associated with
the schizophrenia sample.
In addition to dysfunctions of attention and memory, impairments in executive or higher-
order cognitive functioning are among the most frequently observed neurocognitive deficits in
individuals with schizophrenia, biological relatives of individuals with schizophrenia, and
individuals with SSDs (Cannon, Zorilla, Shtasel, Gur, Gur, Marco, Moberg, & Price, 1994;
Goldberg & Gold, 1995; Gourovitch & Goldberg, 1996; Kremen et al., 1994; Saykin et al.,
1991). Meta-analyses reveal moderately large impairments in executive functioning as indexed
by impaired Wisconsin Card Sort Test (WCST) performance among individuals with
schizophrenia compared to healthy controls (Heinrichs & Zakzanis, 1998). Gold, Carpenter,
Randolph, Goldberg, & Weinberger (1997) found that individuals with schizophrenia achieved
fewer categories and made more perseverative errors on the WCST compared to normal controls.
Furthermore, performance on the WCST has been shown to correlate with long-term social
functioning and negative symptoms in individuals with schizophrenia (Breier, Schreiber, Dyer,
& Picknar, 1991). Similarly, WCST performance is associated with community functioning
outcome in patients with schizophrenia across studies (Green, 1996).
Not surprisingly, research has shown that individuals with SPD have similar deficits in
executive functioning as individuals with schizophrenia, albeit in more attenuated form. It is
well documented that subjects with SPD complete significantly fewer concept categories and
make more perseverative responses on the WCST relative to healthy controls (Gooding, Kwapil,
Tallent, 1999; Voglmaier et al., 1997). In fact, subjects with SPD perform intermediate to
subjects with schizophrenia and matched controls in number of categories completed and number
of perseverative responses on the WCST (Cadenhead et al., 1999; Trestman, Keefe,
9
Mitropoulou, Harvey, deVegvar, Lees-Roitman, Davidson, Aronson, Silverman, & Siever,
1995). Trestman et al. (1995) found that adults with SPD committed more perseverative errors
and completed fewer categories compared to healthy controls and individuals with other
personality disorders. Similar findings have also been documented in adolescents with SPD
using a modified and simpler version of the WCST (Diforio, Walker, Kestler, 2000). Thus, these
studies further support the view that SPD and schizophrenia share a common neurocognitive
profile and these cognitive deficits can be viewed as variants on the same continuum of
pathology. While the majority of neuropsychological studies of SSDs have focused on cognitive
functioning, an emerging area of research has begun to highlight aspects of neuromotor
functioning in these disorders.
Neuromotor Functioning in SSDs
Motor disturbances are seen in schizophrenia (Vrtunski, Simpson, & Meltzer, 1989) and
SPD (Neumann & Walker, 1999), though past research has focused more on involuntary, rather
than voluntary movements in schizophrenia. Moreover, awareness of the motor side effects of
neuroleptic drugs and the methodological difficulties involved in quantitative measurement of
motor functioning have been contributing factors to limited research in this area. However,
recent research has highlighted a link between neuromotor and neurocognitive functioning
(D’Reaux et al., 2000; Graybiel, 1997; Middleton & Strick, 2000; Walker, 1994). Thus,
problems in neuromotor abilities may be important in further understanding SSDs (Neumann &
Walker, 1996).
Individuals with schizophrenia exhibit voluntary motor disturbances unrelated to
neuroleptic drug treatment including neurological soft signs such as lack of motor coordination,
difficulty following movement sequences, desynchronized tapping, and muscle force instability
10
(Caligiuri & Lohr, 1994; Manschreck, Maher, Waller, Ames, & Latham, 1985). Notably, motor
dysfunction has been found to precede the clinical onset of schizophrenia by many years, thus
motor functioning assessments may be useful in identifying individuals at risk for developing
schizophrenia (Rosso, Bearden, Hollister, Gasperoni, Sanchez, Hadley, & Cannon, 2000;
Walker, Savoie, & Davis, 1994). Based on observations of childhood home movies, Walker et
al. (1994) found that children who later developed schizophrenia exhibited significantly more
neuromotor abnormalities (i.e., neurological soft signs such as perceptual-motor dysfunction,
movement abnormalities, and motor coordination problems) compared to healthy siblings,
children who developed affective disorders in adulthood, healthy siblings of patients with
affective disorders, and subjects with no family history of mental illness. More specifically,
compared to healthy siblings, children who later developed schizophrenia in adulthood exhibited
significantly greater frequencies of abnormal hand postures (prolonged fisting, hyperextension of
the fingers, and wrist hyperflexion), associated reactions (movement in the contralateral arm
during unimanual activity), and choreoathetoid movements of the upper limbs (co-occurrence of
rapid, jerky, involuntary movements and slow, writhing movements) (Walker, 1994). In
addition, Walker and her colleagues found that children who developed schizophrenia in
adulthood displayed significantly poorer motor skills (e.g., dissociation of movement, gait,
alignment, smoothness of transitional movements, etc.) compared to healthy siblings and
children who developed affective disorders in adulthood. Thus, premorbid neuromotor
dysfunction appears to be more prominent in schizophrenia than affective disorders. In addition,
diagnostic group comparisons were only significant in the first two years of life indicating that
this period may be critical in the manifestation of neuromotor dysfunction in at-risk children.
11
Although there appears to be a normative diminution in the rate and severity of overt
neurological soft signs with development, more subtle motor disturbances persist throughout the
course of schizophrenia (see Walker, 1994 and Neumann & Walker, 1996 for a review).
Research has shown that neuromotor dysfunction occurs at a higher rate in schizophrenia than
other psychiatric disorders. In addition, neuromotor abnormalities are negatively correlated with
age of onset of schizophrenia, and positively correlated with premorbid impairment, poorer
prognosis, and symptom severity (see Walker, 1994 for a review).
Research on the underlying neuropathology of movement disorders has provided insight
into the origins of movement abnormalities in schizophrenia. For example, the tremors,
hypertonicity, bradykinesia, and akinesia manifested in Parkinson’s disease are associated with
reduced dopamine activity in the basal ganglia. The hypotonicity and choreic movements seen
in Huntington’s disease are associated with an imbalance in dopadrenergic, cholinergic, and
GABA-ergic systems. Administration of L-dopa to patients with Parkinson’s and Huntington’s
disease produces concomitant production of dyskinesias such as choreoathetosis in patients with
Parkinson’s disease and exacerbation of choreic movements in patients with Huntington’s
disease. In addition to hyperactive dopamine systems, subcortical lesions of the basal ganglia are
associated with abnormal movements. Thus, basal ganglia dysfunction has been implicated in
the dyskinesias noted above and may play a role in the neuromotor dysfunctions evident in
schizophrenia (see Walker, 1994 for a review).
According to King (1991), individuals with schizophrenia have problems learning and
performing complex tasks due to a fundamentally impaired ability to integrate sensory and motor
processes. While research has shown that individuals with SSDs have disturbances in higher
cognitive, executive processing as manifested by impairments in planning and organization, the
12

neuropsychological tests used to assess these processes do not allow one to separate the relative
contribution of the cognitive and motor components involved in such processes. Reaction time
measurements have typically been used to index attentional functioning, however, reaction time
consists of both motor and cognitive functioning (Walker & Green, 1982). In an attempt to
separate the cognitive component from the measurement of motor functioning, some
investigators have developed instrumental motor tasks that assess motor pressure and stability
separately from reaction time (Caligiuri & Lohr, 1994; Neumann & Walker, 1999; Vrtunski et
al., 1989).
Vrtunski et al. (1989) examined fine motor control in individuals with schizophrenia
indexed by a single button press response to a cognitive task involving classification of two
auditory stimuli (sounds and spoken words) into one of two categories. For sounds, subjects
were required to discriminate between “flats” and “chirps,” and for words, subjects were
required to semantically classify the words as either “living” or “nonliving.” Compared to
psychiatric and normal control groups, individuals with schizophrenia (both medicated and non-
medicated) exhibited increased response latency, reduced baseline motor steadiness, use of
excessive force, increased response duration, and increased contralateral motor overflow
(movement of a non-responding hand). Response latencies to words (which required an
encoding process) were longer than those to sounds (which required a simple sensory
discrimination). Contralateral motor overflow and variability of baseline steadiness were
significantly greater for individuals with schizophrenia during the word condition. These results
lend further support for an interaction between fine motor control and higher cognitive
functioning involved in encoding and processing information.
13
Neumann and Walker (1999) used a computerized motor assessment similar to Vrtunski
et al. (1989) that assessed reaction time, movement time, force and force variability,
commissions, and motor overflow. They found that adults with SPD displayed greater
contralateral motor overflow as well as increased and more variable force compared to adults
with or without other personality disorders. Consistent with past research, this motor
performance profile is similar to the motor performance profiles of individuals with
schizophrenia. This study also found a positive correlation between schizophrenia spectrum
symptoms and mean force in both hands and force variability in the right hand. Interestingly, it
was primarily motor deficits in the right hand that distinguished the SPD group from other adults
with or without other personality disorders. This latter finding suggests that the SPD group had
problems primarily in left hemisphere functioning, the region of the brain that has been shown to
be associated with verbal memory functioning in individuals with schizophrenia (Mozley, Gur,
Gur, Mozley, & Alavi, 1996).
In a follow-up study, Neumann and Walker (2003) employed the same instrumental
motor task to examine the motor profiles of adolescents with or without SPD. Consistent with
their earlier study with adults, they found that adolescents with SPD showed greater and more
variable force in both hands, increased movement time in the left hand, and a greater number of
total omissions. In addition, disturbance in motor functioning, specifically variability in motor
force, was significantly correlated with perseverations on the Modified Wisconsin Card Sort
Test. Given that research has linked abnormal movements and dyskinesias with structural
impairments of the basal ganglia as well as hyperactivation of the dopamine system, these
findings further implicate the direct role of subcortical motor regions in higher-order cognition in
14

adolescents with SPD. Furthermore, these results are consistent with a recent
neuropsychological theory in concept learning (Ashby & Waldron, 2000).
Theories of the Relationship Between Motor and Cognitive Functioning
The theoretical and research findings above suggest that subcortical motor regions may
be involved in producing the cognitive and psychiatric features of the SSDs. With the help of
advances in pharmacology research such as dopamine receptor antagonists and drugs like
clozapine, the basal ganglia have become a target for study in an attempt to elucidate the etiology
of schizophrenia (Graybiel, 1997). The basal ganglia are a collection of subcortical structures
including the globus pallidus, the caudate nucleus, and the putamen that together form the
striatum. Essentially, it is a collection of neurons that project to the motor and prefrontal areas of
the frontal lobes, and have traditionally been thought to be important for controlling motor
responses (Graybiel, 1997).
Historically, the only area of the cerebral cortex that was thought to be the target of basal
ganglia and cerebellar output were those areas involved in the initiation and control of
movement. However, Alexander, Delong, and Strick (1986) have proposed that, in addition to
the motor cortex, the basal ganglia target specific areas of the premotor and prefrontal cortex.
Anatomical and physiological studies have supported the theory of functionally segregated basal-
ganglia-thalamocortical pathways that link the basal ganglia with the cortex. These parallel
circuits include a motor circuit, oculomotor circuit, dorsolateral prefrontal circuit, lateral
orbitofrontal circuit, and the anterior cingulated circuit. Each of these pathways receives input
from the cortex which sends partially overlapping projections to designated areas of the striatum.
These striatal regions then send converging projections through the globus pallidus and
substantia nigra to a specific region of the thalamus. The thalamocortical projection loops back
15

to one of the sources of corticostriate input and completes the circuit (Alexander et al., 1986; see
also Middleton & Strick, 2000).
This arrangement suggests that the basal ganglia are involved in motor planning,
predictive motor control, motor sequencing, motor learning, actions involving motivational and
cognitive drive, as well as other cognitive and limbic functions (Graybiel, Aosaki, Flaherty, &
Kimura, 1994; Middleton & Strick, 2000). Moreover, disturbance of movement and cognition
are both associated with damage to the basal ganglia and brain nuclei interconnected with this
area such as those present in Parkinson’s disease and Huntington’s disease (Graybiel et al.,
1994). Parkinson’s disease begins with pathological changes in the sensorimotor regions of the
striatum resulting in motor abnormalities and some higher order deficits. Huntington’s disease is
associated with pathological changes in associative regions of the striatum such as the anterior
caudate, and this is linked with cognitive disturbances at onset. These regions of the striatum
send input to the output nuclei of the basal ganglia. Investigators have proposed that abnormal
functioning of the basal ganglia circuits with different cortical areas may be responsible for the
symptoms characteristic of these diseases (Middleton & Strick, 2000). For instance, Middleton
and Strick (2000) report evidence that the motor, affective, cognitive, and perceptual
disturbances associated with schizophrenia can be produced by altering the substantia nigra pars
reticulata. They postulate that the symptoms of schizophrenia may be the result of abnormal
output from the substantia nigra to oculomotor, cingulated/orbitofrontal, dorsolateral prefrontal,
and temporal regions of the cortex. Graybiel (1997) concurs that abnormal basal ganglia
circuitry may contribute to the symptoms of schizophrenia.
Imaging has also shown a link between areas of the brain associated with neuromotor
functioning and cognition. In particular, dopamine transmission within the basal ganglia is
16
important to attention performance (see Cornblatt & Keilp, 1994 for a review). In addition, PET
scans of never-medicated patients with schizophrenia show reduced lateralized metabolic activity
within the basal ganglia during performance of the CPT; suggesting a link between poor CPT
performance and basal ganglia dysfunction in schizophrenia (Buchbaum, Nuechterlein, Haier,
Wu, Sicotte, Hazlett, Asarnow, Potkin, Guich, 1990, as cited in Cornblatt & Keilp, 1994).
Recently, Ashby and Waldron (2000) proposed a neuropsychological theory to explain
category learning deficits such as those present in schizophrenia. The theory postulates two
separate, but competing implicit and explicit category learning systems. For example, the
Wisconsin Card Sort Test instructs the subject to sort cards according to a rule and maintain
sorting by that rule until receiving feedback that the rule has changed. The Ashby and Waldron
model of category learning postulates that the selection process is mediated by the anterior
cingulate and prefrontal cortex, that the shifting process is mediated within the basal ganglia, and
that both processes are facilitated by the release of dopamine from the substantia nigra and
ventral tegmental area that acts as a reward signal. In sum, an emerging area of research in
neuroscience has laid the ground work for linking motor and cognitive processes, which may
help in further understanding the neuropathology involved in SSDs.
Neuromotor and Cognitive Functioning Studies
Walker, Lewine and Neumann (1996) studied the relations among childhood neuromotor,
affective, and behavior characteristics for a sample of individuals with schizophrenia and their
healthy siblings. Using childhood home movies and retrospective versions of the Child Behavior
Checklist, the findings revealed significant correlations between left-side neuromotor
dysfunction and heightened scores on the attention problems factor on the Child Behavior
17
Checklist. In related research, Neumann and Walker (1996) found that childhood attention
problems predicted motor functioning in adult patients with schizophrenia.
Although the CPT is thought to measure sustained attention, motoric factors such as
visual-motor coordination and motor control appear to influence performance on this task given
the requirement to respond manually to a target stimulus. For example, in the case of detecting a
target stimulus, the subject must detect the target, process the information, and execute the motor
response. With respect to a non-target stimulus, the subject must inhibit a motor response. Thus,
it is plausible that motor deficits, in addition to attention deficits, contribute to poor performance
on the CPT (Walker & Green, 1982). Walker and Green (1982) investigated the relationship
between motor proficiency and performance on the CPT in individuals with schizophrenia and
affective psychoses. They found significant correlations between motor performance and
reaction time and omission errors suggesting that motor proficiency contributes to the speed of
responding as well as the likelihood of detecting a target stimulus. They propose that in some
cases, omission error rates may reflect motor coordination deficits rather than the failure to
detect a target stimulus.
In part because of the limitations discussed above, research in the associations between
cognitive and motor functioning has not been explored until recently. D’Reaux et al. (2000)
found a significant correlation between attention and motor functioning. They found that digits
forward and backward on the WAIS-R Digit Span subtest and d’ on the CPT were significantly
correlated with finger tapping in adults with schizophrenia and normal controls.
Individuals with schizophrenia, especially those that exhibit predominantly negative
symptoms, exhibit impaired ability to appropriately identify and discriminate the facial
expressions of others and this may result in ineffective social interactions (Silver & Shlomo,
18

2001). Notably, Silver and Shlomo (2001) found that the ability to identify facial emotions but
not discriminate between them correlated with cognitive and motor functioning rather than
negative symptoms in individuals with schizophrenia. Furthermore, the relationship between
motor functioning (as indexed by finger tapping rate) and identification of facial emotions was
not related to the extrapyramidal side effects of medication. Investigators also discovered a
significant relationship between identification of facial emotion and visual retention. Thus,
Silver and Shlomo (2001) report that facial emotion identification shares a common mechanism
with visual reproduction and the ability to make rapid motor movements and that impaired
perceptual and speed related processes might underlie the deficiency in perception of emotion.
These findings are consistent with Dworkin, Cornblatt, Friedmann, Kaplansky, Lewis, Rinaldi,
Shilliday, and Erlenmeyer-Kimling (1993) who reported that early childhood neuromotor
problems predicted affective flattening and early childhood attention deficits predicted social
deficits in adolescents at risk for schizophrenia.
Neuromotor Functioning and Symptomotology
The majority of the research that has explored the relationship between motor functioning
and symptom correlates in individuals with schizophrenia has reported that motor disturbances
are related to negative symptoms (Manschreck et al., 1985). Caligiuri and Lohr (1994), on the
other hand, found that individuals who had problems maintaining steady-state control of muscle
of force also exhibited more positive symptoms. They concluded that past research in this area
employed integrative, complex, cognitively demanding stimuli verses simple maintenance of
force steadiness while tracking a predictable target. Thus, the link between negative symptoms
and voluntary motor control may depend largely on the level of frontal lobe activation required
to perform the motor task. Neumann and Walker (1999) found that greater and more variable
19
motor force correlated with the severity of both positive and negative SPD symptoms. However,
in a study of adolescents with SPD, Neumann and Walker (2003) found that increased and more
variable motor force correlated only with negative symptoms, not positive symptoms. In sum,
significant associations between motor functioning and the symptoms of SSDs is clearly evident,
though the exact nature of such associations remains unclear and in need of further research.
Current Study Hypotheses
Based on the literature reviewed, the present study hypothesized that adults with SPD
would display a motor performance profile similar to that demonstrated by adults with
schizophrenia and SPD, as well as adolescents with SPD. Specifically, adults with SPD would
show greater mean force, greater force variability, and more contralateral motor overflow when
compared to the control group. It was also hypothesized that increased motor force and force
variability would positively correlate with SPD symptoms, but that only force variability would
significantly correlate with WCST perseverations. In addition, this study examined the nature of
the associations between the motor data and the cognitive tasks, though no a priori hypotheses
were posited. Finally, the SPD subjects were expected to perform more poorly on measures of
attention, memory, and executive functioning, compared to those not meeting SPD criteria.
20
CHAPTER 2
METHOD
Participants
It was anticipated that results would yield moderate to large effect sizes, based on
previous research, and thus, more modest sample sizes would be sufficient. Based on this
analysis, approximately 33 participants (ages 18-60) were recruited through newspaper
announcements (Fort Worth Star Telegram, 10/31/2002; Dallas Observer 3/2003) and the
University of North Texas undergraduate population. The newspaper announcement described
the symptoms of schizotypal personality disorder (SPD) in lay terms and read as follows:
Researchers at UNT are seeking adults (between 18-60 years) to participate in a
neuropsychological assessment of personality and behavior. If two or more of the
following questions apply to you, you may be eligible to receive a research assessment at
no cost. Do you tend to feel uncomfortable around other people? Are you able to sense
things that most people cannot? Have you ever had paranormal experiences (e.g. ESP,
UFOs, etc)? Do movies, TV programs, or other people’s conversations sometimes have
special meaning for you? If you think you qualify for this research project, please call
Felicia Reynolds at 972-365-4580, or after 5pm, Dr. Craig Neumann, Dept. of
Psychology, 940-565-3788. Respondents to the announcements were screened via telephone interviews in order to assess that
they were free from major DSM-IV Axis I mental illnesses (e.g. chronic history of substance
abuse, psychosis, significant head injury, neurological illness, or other cognitive disorders) other
than manifesting symptoms of SPD. Respondents who reported a history of head injury in
21

response to direct questioning during the telephone interview were queried for detailed
information regarding the nature and severity of the injury (i.e., elapsed time since injury, loss of
consciousness, hospitalization). Only the respondents who reported “mild” head injury with no
loss of consciousness or hospitalization were included in the study. During the interview, the
researcher explained the basic purpose of the study and confidentiality of research records.
Respondents who qualified for the study were scheduled to participate based on their availability.
However, all participants were assessed either in the morning (9:00 a.m. to 12:00 pm) or the
afternoon (12:00 p.m. to 3:00 p.m.). Benefits to the participants included a detailed research
summary of their performance relative to their peers. Participants received the reports by mail
and were given the option of contacting the experimenter for further explanation. Furthermore,
the reports detailed contact information for various mental health referral agencies to be used at
the participant’s discretion. Participants generally found their participation and follow-up reports
to be helpful given that they often are not able to discuss their unique experiences openly with
others.
Procedures
The present study was conducted in a private laboratory room in Terrill Hall at the
University of North Texas. All participants were met individually for completion of the
assessment. Approximately 3 hours was required to complete the assessment. Participants either
began testing at 9:00 a.m. or 12:00 p.m. Informed consent was obtained from each participant
prior to participation in the study. Following informed consent, participants were asked if they
were aware of a personal family history of general psychopathology (i.e., schizophrenia-
spectrum disorders, depression, substance abuse, etc.). Several subjects spontaneously reported
that they were aware of other family members who reported similar unique experiences (i.e.,
22
ESP, visions, psychic abilities, etc.). The experimenter queried each participant for further
information if they reported any knowledge of a family history of general psychopathology or
unusual experiences.
Following these initial procedures, participants completed the Structured Clinical
Interview for DSM-IV Personality Disorders questionnaire (SCID-II-Q) (First, Gibbon, Spitzer,
Williams, & Benjamin, 1997) and the Schizotypal Personality Questionnaire-Brief (SPQ-B)
(Raine & Benishay, 1995). These self-report questionnaires were followed by the Structured
Clinical Interview for Personality Disorders (SCID-II) (First et al., 1997). Following completion
of the interviews, participants completed the cognitive and motor assessment which included the
following measures in the specified order: (1) Instrumental Motor task, (2) Logical Memory I,
(3) Visual Reproduction I, (4) Finger Tapping Test, (5) WCST-CV2, (6) Spatial Span, (7)
Logical Memory II, (8) Visual Reproduction II, (9) CPT-IP, (10) Digit Span, (11) Letter-Number
Sequencing, (12) WRAT-3 Reading, and (13) Handedness Questionnaire.
Based on the information derived from the structured diagnostic interview, participants
were classified into two groups. Individuals who met diagnostic criteria for schizotypal
personality disorder (SPD) comprised one group (SCID-II criteria ≥ 5), and individuals who did
not meet criteria for SPD (SCID-II criteria ≤ 4) comprised the healthy control group (HC).
Diagnostic reliability was monitored throughout the course of data collection via supervision
with the primary investigator.
Measures
Structured Clinical Interview for DSM-IV Personality Disorders (SCID-II) and SCID-II
Questionnaire (SCID-II-Q)
23
The SCID-II and SCID-II-Q (First et al., 1997) was administered in order to diagnose
DSM-IV personality disorders. The SCID-II-Q was administered first as a screen for an Axis II
disorder. The SCID-II-Q is composed of one item per diagnostic criterion and parallels the
SCID-II in content and sequencing of criteria. The questionnaire asks participants to answer
each question either “yes” or “no” according to how they have usually felt or behaved over the
past several years. Based on the endorsed criteria on the SCID-II-Q and the interviewer’s
judgment, follow-up questions from the SCID-II were asked for each of the disorders that
appeared to meet minimum or full criteria for an Axis II disorder. Results from the diagnostic
interviews aided in classifying participants into two groups; participants meeting DSM-IV
diagnostic criteria for schizotypal personality disorder constituted the SPD group, and the
remaining participants comprised the healthy control group (HC). The SCID-II is organized by
personality disorder with standard questions corresponding to specific DSM-IV diagnostic
criteria. Each criteria is rated on a 3-point scale: 1 = absent or false, 2 = subthreshold, and 3 =
threshold or true. If the participant responds affirmatively, they are subsequently queried to
provide examples.
Rogers (2001) reviewed the reliability and validity studies that have been published on
the SCID-II and SCID-II-Q across various settings and translations. Test-retest reliability
coefficients for the SCID-II-Q with a three-day interval are strong (median kappas range from
.70 to .85). After adjusting cut scores, agreement between the SCID-II and SCID-II-Q on
categorical diagnoses is moderate (median kappa = .56). Modest agreement was found between
the Personality Disorder Examination and the SCID-II-Q for probable/definite diagnoses
(median kappa = .38). Thus, the SCID-II-Q appears to be a useful screen for personality
disorders.
24

With respect to the SCID-II, interrater reliability estimates for symptoms range from .84
to .89, with interrater reliability coefficients for current diagnoses ranging .67 to .91. In addition,
test-retest reliability coefficients based on an interval of less than two weeks are moderate
(median kappas range from .49 to .62). In terms of concurrent validity, studies yield a moderate
convergence between the SCID-II and the Personality Disorder Examination (unweighted grand
mean kappa = .43). Offering preliminary evidence of construct validity, factor analysis of the
SCID-II yielded 12 factors, with two-thirds of the symptoms loading on the predicted personality
disorder (Torgersen, Skre, Onstad, Edvardsen, & Kringlen, 1993 as cited in Rogers, 2001).
Overall, the SCID-II has good reliability and validity, and it appears to be useful in evaluating
current personality disorders.
Schizotypal Personality Disorder – Brief (SPQ-B)
The SPQ-B (Raine & Benishay, 1995) was administered as an additional diagnostic tool.
Based on the SPQ, the SPQ-B is a brief, 22 item self-report scale based on the DSM-IV
diagnostic criteria for SPD. Each item on the SPQ-B may be answered with either a “yes” or
“no” response and each question that is answered affirmatively receives a score of 1. Subjects
with SPD are expected to score within the top 10% of the distribution of scores of the SPQ-B
(score of 17 or more). However, it is suggested that researchers develop stricter (e.g. 5%) or
more conservative (e.g.15%) high-low cut off scores when defining extreme groups in their
studies (Raine & Banishay, 1995). The SPQ-B is comprised of three subscales: Cognitive-
Perceptual (made up of 8 items assessing ideas of reference, magical thinking, unusual
perceptual experiences, and paranoid ideation), Interpersonal Deficits (made up of 8 items
assessing lack of close friends, blunted affect, social anxiety, and paranoid ideation), and
Disorganization (made up of 6 items assessing odd behavior and odd speech).
25

Acceptable reliability and validity has been established for the SPQ-B. Alpha
coefficients are .80 (Total Score), .72 (Cognitive-Perceptual), .78 (Interpersonal Deficits), and
.75 (Disorganized). Intercorrelations between the SPQ-B factors and the longer SPQ are .94
(Total Score), .89 (Cognitive-Perceptual), .90 (Interpersonal Deficits), and .90 (Disorganized).
Internal reliabilities and intercorrelations replicated well in an independent sample. Test-retest
reliability coefficients ranged from .86 to .95 with a two-month interval between administrations.
Criterion validity was assessed with the SPQ-B and the SCID-II and yielded intercorrelations of
.60 (Total Score), .73 (Cognitive-Perceptual), .55 (Interpersonal Deficits), and .37
(Disorganized) (Raine & Benishay, 1995).
Symptom Scales
Symptom scales were computed to measure positive and negative signs using the items
from the SCID-II. Items that comprised the positive and negative symptom composites were
based on factor analyses previously published in the literature (Neumann & Walker, 1999;
2003). Appendix C specifies the SCID-II interview items included in the positive and negative
symptom composites. The Total Symptom scale represents the summed scores across all of the
SCID-II SPD items. Symptom clusters including cognitive-perceptual, interpersonal, and
disorganized symptoms were also computed based on the factor analysis of the SPQ-B (Raine &
Benishay, 1995). The Total Symptom cluster for the SPQ-B represents the summed scores
across the three subscales.
Instrumental Motor Task
A main feature of the study was the use of a novel computerized motor task that assesses
multiple aspects of motor functioning and yields a motor performance profile. The motor task
has been described in more detail in a previous report (Neumann & Walker, 1999). The motor
26

task utilizes pressure-sensitive buttons fitted to force transducers that send the analog signals
from the response buttons to the computer for data storage (A.L. Design, Buffalo, NY). The
sensitivity of the buttons is 1 centinewton (cn). The two buttons are firmly secured on a board,
30cm from the edge of the table and 30cm between the buttons. A colored monitor is located
15cm behind the buttons at eye level for the seated subject. Two squares are presented on the
monitor, one above each button, and depression of the highly pressure-sensitive buttons control
the color of the two squares. Depression of the buttons to the ‘resting’ threshold of 50 cn of
pressure (i.e., between 0.07 – 0.2 millivolts) is required to change the corresponding color box
from green to blue. A blue color box means that the subject is within the acceptable range of
pressure; red means that they are applying too much pressure, and green means that they are
applying too little pressure. The subject must maintain appropriate pre-stimulus force for
approximately 1s before the response trial will begin. There is a brief period of practice trials
prior to each condition and they may be repeated if necessary. Participants are instructed to
respond to the stimuli as quickly as possible. Button pressure is amplified and converted to
digital data via a Keithley A/D converter. A response is defined as depression upon the buttons
that exceeds 2-standard deviations above the baseline pressure maximum (i.e., 0.2 + 2sd
millivolts). Pressure levels are recorded every 5 milliseconds (msec), and the mean and standard
deviation will be computed.
The task requires a response to real words in a series of lexical stimuli that contains both
words and nonsense syllables. Each stimulus is presented for 3 seconds. Responses are assessed
with both unimanual and bimanual conditions. In the unimanual condition, the participant is
required to maintain pressure on one response key until a target stimulus was presented. Upon
detecting a target stimulus, the participant is required to release pressure off the first (start)
27

button, depress the adjacent button, and then re-establish pressure threshold on the first (start)
button. There are a total of 40 trials. The participant uses the right hand for 20 trials and the left
hand for the other 20 trials. In the bimanual condition, the participant must maintain the pressure
threshold on both response buttons, but press only one of the keys when a target stimulus is
presented. Prior to each trial, the response hand is cued by the presentation of the word “right”
or “left” above each button respectively. Half of the trials cue the right hand, and the other half
cue the left hand. The right and left hand trials are randomly interspersed.
Eight motor indices are computed from the motor responses for both the left hand (LH)
and right hand (RH) by averaging across all individual trials. Reliability of the motor task was
established and reported by Neumann and Walker (1999) and Cronbach's alpha coefficients are
presented in parentheses for each motor index: (1) mean force equals the mean of applied force
during a response to a target stimulus, (LH=0.75, RH=0.80), (2) Mean force variability equals
the standard deviation of mean force during a response to the target stimulus (LH=0.67,
RH=0.71), (3) Motor overflow is indexed by the mean correlation between the change in
pressure exerted by the non-responding hand and the responding hand during the bimanual
condition. This correlation is computed from the simultaneous pressure values of the two hands,
sampled every 5 msec for the duration of the participant’s response to the stimulus. The higher
the correlation coefficient, the greater the amount of force exerted by the non-responding hand in
conjunction with the responding hand (LH=0.82, RH=0.89), (4) Travel time (i.e., movement
time) equals the elapsed time between release of the start button and depression of the response
button in the unimanual condition, (5) Reaction time is indexed by the elapsed time between the
onset of the target stimulus and release of the start button in the unimanual condition. In the
bimanual condition, reaction time is indexed by the elapsed time between the onset of the target
28
stimulus and an increase in pressure on the response button that exceed 1-standard deviation
above the baseline pressure, (6) Omissions, (7) Commissions, and (8) Response duration is
indexed in the bimanual condition by the elapsed time between the increase in pressure on the
response button that exceeds 1-standard above the baseline pressure and the return to baseline
pressure following the response.
Four motor composite scores were computed from the motor indices for the left (LH) and
right hand (RH). Left hand unimanual mean force and left hand bimanual mean force were
summed to create the LH Motor Force Composite (i.e., total motor response force). Likewise,
left hand mean force variability was summed across the unimanual and bimanual conditions
creating a LH Motor Force Variability Composite (i.e., total motor response force variability). A
RH Motor Force Composite and RH Motor Variability Composite were calculated in the same
way using right hand force and force variability for both conditions.
In addition to the motor composites, several analyses were conducted using the before
mentioned motor indices. In general, these eight indices were computed for each condition (i.e.,
unimanual and bimanual). Furthermore, force and force variability were computed for baseline,
prestimulus, and the actual motor response to the target.
Finger Tapping Test
Motor speed was assessed using the Finger Tapping Test (FTT) for both hands
(Halstead-Reitan Neuropsychological Battery; Reitan & Wolfson, 1993). Participants were
asked to tap a key with their index finger as quickly as possible for five 10-second trials. The
device recorded the number of taps for each trial, and the score for each hand was averaged over
the five trials.
29

The FTT appears to be a reliable measure for both healthy subjects and individuals with
neurological impairment. Test-retest reliability coefficients for normal subjects range from .71
to .94 (Gill et al., 1986; Bornstein, Baker, & Douglass, 1987; Ruff & Parker, 1993 as cited in
Lezak, 1995). Test-retest reliability coefficients for clinical samples (alcohol/trauma,
schizophrenia, vascular disorders) with an interval range of 4 to 469 weeks were in the .64 to .87
range (Goldstein & Watson, 1989 as cited in Lezak, 1995).
Hand Preference Questionnaire
To identify variations in hand preference, an 8-item hand preference questionnaire (Peters
& Servos, 1989) was administered in which participants were asked to rate the frequency with
which they use their left and right hand for various tasks (e.g. write, hammer, throw) on a 5-point
scale (1=always left, 2=usually left, 3=both, 4=usually right, 5=always right). Participants who
responded with scores of 1, 2, or 3 for at least 7 of the first 8 items were classified as consistent
left-handers (CLH). Participants who responded with scores of 4 or 5 for two or more of the
eight items were classified as inconsistent left-handers (ILH).
Using this classification system, Peters and Servos (1989) found that subdividing left-
handers yielded subgroups with reliably different performance patterns. Specifically, CLHs
exhibited greater strength in the left hand, while ILHs exhibited greater strength in the right
hand. Although ILHs showed greater right-hand preference for activities requiring strength than
left-hand preference, they performed better with the left hand on tasks that required fine motor
skills. Furthermore, ILHs behaved like right-handers in their allocation of attention to the two
hands during concurrent performance. Overall, CLHs behaved like the mirror image of right-
handers, whereas ILHs showed dissociations between strength, fine motor skill, and attentional
30
asymmetries. However, when left-handers are treated as a combined group, the between hand
asymmetries cancel out. These results support the validity of this classification system.
Continuous Performance Test – Identical Pairs
The Continuous Performance Test – Identical Pairs Version (CPT-IP) was administered
to measure sustained attention (Cornblatt, 1998; Cornblatt & Keilp, 1994; Erlenmeyer-Kimling
& Cornblatt, 1992). In this task, participants were instructed to keep their finger pressed down on
the left mouse button and to release the button upon identifying a target as quickly as possible.
A target is defined as the second stimulus in any pair of identical stimuli. The CPT-IP consists
of two independent sets of stimuli: shapes and four-digit numbers. For each condition, a series of
150 trials is presented on the monitor screen for 50ms with a 950ms delay between stimuli.
Thirty target pairs and thirty “catch trials” (similar, but not identical, successive stimuli) are
embedded within the 150 trials in each condition of the task. The remaining ninety trials are
dissimilar and randomly presented.
The dependent measures include hits, hit-reaction time, d’, beta, errors of omission, and
errors of commission. Hits are defined as correct responses to target stimuli. Hit-reaction time is
the average response time (ms) for all correct responses. The d’ is a measure of the participant’s
attentional capacity or ability to discriminate between targets and non-targets. Beta (typically
expressed as natural logB) is an index of the participant’s response bias or tendency to under or
over-respond to stimuli. A low logB indicates an impulsive response style; by over responding,
the participant is maximizing hits but making more errors. Errors of omissions are misses or the
number of target stimuli to which the participant failed to respond. Errors of commission are the
number of non-target stimuli to which the participant responded to as a target.
31

The shapes condition taps visual attention, while the digits condition taps verbal
attention. The two conditions are thought to correspond to right and left hemispheric processing
respectively. Both conditions have been matched for difficulty level and error variance, and
thus, differences in performance between the two conditions can be assumed to result from
differences in verbal or visual processing. SPECT images obtained during performance of the
CPT-IP suggest that the verbal and spatial conditions are associated with predictable changes in
cerebral activation. Preliminary studies have shown that normal subjects exhibit greater left-
sided activity during the digits condition and greater right-sided activity during the shapes
condition. In contrast, depressed patients only exhibit performance deficits during the shapes
condition suggesting right hemisphere dysfunction. Furthermore, patients with SSDs as well as
individuals at risk for schizophrenia are impaired on both verbal and spatial tasks indicating
processing deficits in both left and right hemispheres (Cornblatt, 1998; Cornblatt & Keilp, 1994).
Alpha coefficients for hit rate and d’ range from .69 to.89 indicating acceptable internal
consistency (Cornblatt & Keilp, 1994; Erlenmeyer-Kimling & Cornblatt, 1992). Test-retest
reliability coefficients (1 1⁄2 year interval) for the CPT-IP d’ ranged from .56 to .73 for 120
normal subjects (Cornblatt, Risch, Faris, Friedman, & Erlenmeyer-Kimling, 1988, as cited in
Cornblatt & Keilp, 1994).
Digit Span
Auditory memory and attention was assessed using the Digit Span (DS) subtest of the
Wechsler Adult Intelligence Scale - Third Edition (WAIS-III; Wechsler, 1997a). The task is
divided into two parts including Digits Forward (DS-Forward) and Digits Backward (DS-
Backward). In the forward version, digits are presented in strings ranging in length from two to
nine digits, while string length ranges from one to eight digits during DS-Backward. For DS-
32
Forward, the examiner reads aloud each string of numbers which the examinee then repeats
verbatim. DS-Backward entails repeating each string in reverse sequence. Each pair of DS
strings receives a score of 2, 1, or 0, and testing is discontinued after failure of two consecutive
trials of the same length.
Developers of the Wechsler tests and researchers agree that DS functions as a measure of
both short-term memory and attention (Sattler, 1992; Wechsler, 1997a). When divided into its
separate sections, DS-Forward is considered a purer measure of focused attention, although rote
memory is also considered a skill tested by the forward task. DS-Backward, on the other hand,
allows for better measurement of working memory: the ability to mentally manipulate
information. Exploratory and confirmatory factor analyses of the WAIS-III support a four factor
structure with Letter-Number Sequencing, Arithmetic, and DS loading on the Working Memory
factor. Comparison of the pattern loadings of these three subtests indicates that DS has the
highest factor loading on the Working Memory factor, and thus accounts for greater variability
than either Letter-Number Sequencing or Arithmetic. Interfactor correlations between DS and
the Working Memory factor are .76 (for ages 16-19), .79 (for ages 20-34), .72 (for ages 35-54),
and .68 (for ages 55-74) (Wechsler, 1997a).
With respect to psychometrics, split-half reliability coefficients for ages 18 to 64 range
from .90 to .93. Test-retest stability coefficients for ages 16 to 74 range from .83 to .89. In
terms of criterion-related validity, the WAIS-III DS subtest correlates strongly with DS of the
WAIS-R (r = .82) and WISC-III (r = .73). Convergent validity studies support the validity of the
Working Memory Index as a measure of attention. Correlations between the Working Memory
Index of the WAIS-III and other measures of attention yielded coefficients of .66
(Attention/Concentration Index of the Wechsler Memory Scale-Revised), -.37 (Trail Making
33

Test Part A of the Halstead-Reitan Neuropsychological Battery), -.65 (Trail Making Test Part B),
and .65 (Attention/Mental Control Index of the MicroCog) (Wechsler, 1997a).
Letter-Number Sequencing
To further assess auditory working memory, the Letter-Number Sequencing (LNS)
subtest of the WAIS-III was administered (WAIS-III; Wechsler, 1997a). In this task, a group of
numbers and letters are presented orally, and the participant must simultaneously track and orally
repeat the sequence with the numbers in ascending order and the letters in alphabetical order.
In terms of reliability, split-half reliability coefficients range from .77 to .88 for
individuals age 18 to 64. Test-retest stability coefficients range from .70 to .80 for ages 16 to 74.
As previously noted, LNS loads on the Working Memory factor of the WAIS-III. Interfactor
correlations between LNS and the Working Memory factor of the WAIS-III are .79 (for ages 16-
19), .70 (for ages 20-34), .71 (for ages 35-54), and .60 (for ages 55-74). Furthermore,
correlations between the Working Memory Index of the WAIS-III and other measures of
memory yielded coefficients of .15 (Memory Index of the MicroCog), .09 (California Verbal
Learning Test-Short Delay Recall), and .16 (California Verbal Learning Test-Long Delay
Recall). In addition, correlations between the Working Memory Index of the WAIS-III and the
Wechsler Memory Scale-Revised yielded coefficients of .40 (WMS-R General Memory Index),
.33 (WMS-R Verbal Memory Index), and .34 (WMS-R Delayed Memory Index). The
magnitude of these correlations suggests that working memory is different from learning
efficiency, episodic memory, and delayed recall (Wechsler, 1997a).
Spatial Span
The Spatial Span (SS) subtest of the Wechsler Memory Scale-3rd Edition (WMS-III;
Wechsler, 1997b) was administered as a measure of visual memory and attention. This subtest is
34
divided into two parts, Spatial Span-Forward (SS-F) and Spatial Span-Backward (SS-B). This
task utilizes a three-dimensional board upon which stationary blue cubes are interspersed and
labeled with numerals from the examiner’s side of the board, unseen to the examinee. In the
forward version, the examinee is required to mimic strings of sequenced movements (ranging in
length from two to nine) presented initially by the examiner. The backward version requires that
the examinee mimic the strings in reverse sequence. Each pair of SS strings receives a score of 2,
1, or 0, and testing is discontinued after failure of two consecutive trials of the same length.
In terms of psychometrics, split-half reliability coefficients range from .73 to .85 for ages
18 to 64 and the test-retest stability coefficients for ages 16 to 89 range from .71 to .72. The
Working Memory Index of the WMS-III is comprised of two subtests: LNS (identical to LNS of
the WAIS-III) and SS. Correlations between the Working Memory Index of the WMS-III and
other measures of memory yielded coefficients of .42 (Memory Index of the MicroCog), .26
(California Verbal Learning Test-Short Delay Recall), and .07 (California Verbal Learning Test-
Long Delay Recall). Correlations between the Working Memory Index of the WMS-III and the
Wechsler Memory Scale-Revised yielded coefficients of .29 (WMS-R General Memory Index),
.29 (WMS-R Visual Memory Index), and .17 (WMS-R Delayed Memory Index). In addition, a
.67 correlation exists between the Working Memory Index of the WMS-III and the Spatial
Processing Index of the MicroCog. Correlations between the Working Memory Index of the
WMS-III and other attention measures resulted in coefficients of .48 (WAIS-R Digit Span), .73
(WMS-R Attention/Concentration Index), and .85 (MicroCog Attention/Concentration Index)
(Wechsler, 1997b).
35
Logical Memory
Verbal memory was measured using the Logical Memory (LM I & II) subtest of the
Wechsler Memory Scale – 3rd Edition (WMS-III; Wechsler, 1997b). This test consists of two
orally presented stories. Participants’ verbal recall is measured immediately after each story is
presented and after a 25 to 35 minute delay. The verbal memory score consists of the total
number of story items recalled from both the immediate and delayed recall portions of the test.
For ages 18 to 64, split-half reliability coefficients for LM I and LM II Recall Total Score
ranged from .85 to .90 and .73 to .84 respectively. Test-retest stability coefficients for ages 16-
89 range from .74 to .77 (LM I Recall Total Score) and .76 (LM II Recall Total Score). LM I
and Verbal Paired Associates I comprise the Auditory Immediate Index of the WMS-III.
Correlations between the Auditory Immediate Index of the WMS-III and other measures of
memory resulted in coefficients of .75 (WMS-R Verbal Memory Index), .73 (WMS-R General
Memory Index), .52 (California Verbal Learning Test – Short Delay Recall), .40 (California
Verbal Learning Test – Long Delay Recall), and .71 (MicroCog Memory Index). Likewise, LM
II and Verbal Paired Associates II comprise the Auditory Delayed Index of the WMS-III.
Correlations between the Auditory Delayed Index of the WMS-III and other measures of
memory resulted in similarly high coefficients of .70 (WMS-R Verbal Memory Index), .70
(WMS-R General Memory Index), .77 (WMS-R Delayed Memory Index), .63 (California Verbal
Learning Test- Short Delay Recall), .50 (California Verbal Learning Test – Long Delay Recall),
and .57 (MicroCog Memory Index) (Wechsler, 1997b).
Visual Reproduction
Visual memory was assessed using the Visual Reproduction (VR I and VR II) subtests of
the WMS-III (WMS-III; Wechsler, 1997b). A series of simple designs are presented for 10
36

seconds. Immediately following presentation of each design, the participant is asked to draw the
design from memory. Approximately 25 to 35 minutes following the immediate recall portion of
the test, the subject is asked to draw as many designs as he/she can recall.
Reliability estimates for VR I and VR II were computed based on generalizability theory.
The generalizability coefficients for ages 16 to 89 ranged from .72 to .84 (VR I Recall Total
Score) and .70 to .82 (VR II Recall Total Score). Test-retest reliability coefficients for ages 16-
89 range from .60 to .71 for VR I and VR II Recall Total Score. VR I and VR II are
supplemental tests and validity estimates are not reported in the WMS-III technical manual
(Wechsler, 1997b).
Wisconsin Card Sort Test: Computerized Version-2 Research Edition (WCST- CV2)
The WCST-CV2 (Heaton, Curtiss, & Tuttle, 1993) was administered to assess frontal
lobe functioning, abstract reasoning/concept formation, and perseverative responding. In this
task, four stimulus cards and two identical sets of 64 response cards are presented on a computer
monitor and the participants are instructed to sort the response cards to one of the four stimulus
cards according to an unspecified, alternating principle (color, form, number, color, form,
number). The sorting principle changes after the participant has successfully completed ten
consecutive matches. The participant is not told that the sorting principle has changed, but is
expected to deduce that the previous sorting principle is no longer correct based on the feedback
from the computer as to the correct placement of a card (either ‘right’ or ‘wrong’ is flashed on
the screen depending upon the subject’s response). The test is discontinued once the participant
has either completed six full categories (with a minimum of 60 responses) or the entire set of 128
response cards. The WCST-CV2 yields several scores: number of trails administered, total
correct, total errors, perseverative responses, perseverative errors, nonperseverative errors,
37
categories completed, trials to complete the first category, conceptual level responses (based on
the presence of three or more consecutively correct responses), categories completed, failure to
maintain set, and learning to learn (the change in percentage of errors over the course of
consecutive categories).
The WCST has been used extensively as a research and clinical tool to measure executive
functioning in patients with schizophrenia, seizure disorders, multiple sclerosis, Parkinson’s
disease, and brain damage. Studies of children, adolescents, and adults from these populations
show impaired WCST performance compared to healthy individuals (Heaton, Chelune, Talley,
Kay, & Curtiss, 1993; Lezak, 1995). More specifically, patients with schizophrenia and SSDs
exhibit impaired WCST profiles compared to healthy individuals (Cadenhead, Perry, Shafer, &
Braff, 1999; Heinrichs & Zakzanis, 1998; Voglmaier, Seidman, Salisbury, & McCarley, 1997).
Overall, the reliability and validity of the WCST as a measure of executive functioning has been
substantiated in the literature (Heaton et al., 1993).
The current study employed the computerized version of the WCST to increase reliability
in accuracy and ease of administration and scoring. Fortuny and Heaton (1996) report that no
significant differences exist between performance on the WCST-CV and the manual
administrations of the WCST in a sample of 119 neurologically healthy subjects. However, they
found that the computerized version resulted in greater number of trials needed to complete the
first category. In addition, Hellman, Green, Kern, and Christenson (1992) found equivalence in
performance between the manual and computer administrations of the WCST in a group of
psychiatric inpatients.
38
Wide Range Achievement Test-Third Edition (WRAT-3) Reading
It is well-established that individuals with schizophrenia and SSDs exhibit deficits in
general intellectual ability that may potentially confound findings of neurocognitive deficits in
this population (see Goldberg & Gold, 1995 and Heinrichs & Zakzanis, 1998 for a review). To
control for general intellectual deficits, the WRAT-3 Reading subtest-Tan Form (Wilkinson,
1993) was administered as an estimate of general ability or IQ. The Reading subtest is a word
recognition task in which participants are asked to pronounce up to 42 words out of context.
Alpha coefficients for the Reading subtest (Tan Form) range from .89 to .93 for ages 17
to 64. Test-retest reliability coefficients yielded a correlation of .96; however, it should be noted
that the sample consisted of individuals between the ages of 6 and 16. Wilkinson (1993) reports
a moderate relationship between the WRAT-3 and intellectual functioning. Specifically, for ages
16 to 63, validity studies yield correlations between the WRAT-3 Reading and WAIS-R
Vocabulary subtest (r = .62), Verbal Scale (r = .63), Performance Scale (r = .31), and Full Scale
(r = .53) in the moderate range. Correlations between the combined Reading score (both Tan
and Blue forms) of the WRAT-3 and other tests of achievement such as the Total Reading
subtest of the California Test of Basic Skills – 4th Edition (.69), Total Reading of the California
Achievement Test – Form E (.72), and Total Reading of the Stanford Achievement Test (.87)
were moderately high given significant differences between the tests. However, these and other
construct validity studies reported by Wilkinson (1993) were based on a normative sample of
individuals age 8 to 16 and thus may be limited in their generalizability to the current study.
Overall, the WRAT-3 Reading test appears to provide an adequate estimate of intellectual
functioning. Given the nature of schizophrenia and its typical onset in late adolescence and early
adulthood, academic achievement is often abated. Thus, investigators support the use of oral
39

reading and spelling tests over the use of educational attainment or IQ for matching purposes as
the latter may lead to inaccurately low estimates of general ability in this population (Heinrichs
& Zakzanis, 1998).
40

CHAPTER 3
RESULTS
Demographic Data
Demographic data for the subjects including gender, ethnicity, family history of
psychopathology, history of head injury, and time of day the participants were assessed are
presented in Table 1. Chi-square analyses were conducted and revealed that the two groups did
not differ significantly in terms of gender, χ2 (1, N = 33) = .349, p > .05, and ethnicity, χ2 (2, N =
33) = 1.334, p > .05. The mean age of the schizotypal personality group (SPD) was 43.33 years
(SD = 15.01) and the mean age of the healthy control (HC) was 38.86 years (SD = 14.54). An
independent t-test was conducted to determine if the groups differed significantly in terms of age
and a statistically significant difference between the groups was not found, t (31) = -.841, p >
.05. Differences between groups in general intellectual ability (as estimated by the Wide Range
Achievement Test – 3rd Edition Reading Scaled Score; WRAT-3) were found to be non-
significant, t (31) = -.095, p > .05. Furthermore, the SPD group did not significantly differ from
the HC group with respect to handedness, χ2 (1, N = 33) = 2.601, p > .05. In addition, the groups
did not differ significantly with respect to self-reported family history of general
psychopathology, χ2 (1, N = 33) = 2.357, p > .05. However, the groups significantly differed in
terms of the time of day that they were assessed, χ2 (1, N = 33) = 4.164, p = .04. Significantly
more HC participants were evaluated in the afternoon (n = 13) compared to the SPD group (n =
3). With respect to morning assessments, the two groups consisted of approximately the same
number of participants (see Table 1). The groups approached a conventional level of statistical
41
difference with respect to self-reported history of minor head injury, χ2 (1, N = 33) = 2.910, p =
.08, two-tailed (see Table 1).
Group Effects for Cognitive Functioning
Descriptive statistics including means and standard deviations for the cognitive variables
were computed for each group and are presented in Table 2. Means and standard deviations for
the motor variables are presented in Table 3 (left hand performance) and Table 4 (right hand
performance).
To address the present study’s hypotheses, initial analyses of group effects were
computed via separate multivariate analyses of variance (MANOVAs) using the cognitive
variables as dependent variables and diagnostic group as an independent variable. MANOVAs
were conducted separately for commensurate variable domains. A MANOVA was conducted in
order to compare the SPD and HC group in terms of their performance on the verbal and visual
memory measures (Logical Memory I & II, Visual Reproduction I & II). Inconsistent with our
hypothesis, the findings reveal that significance for the overall model was not met, based on
Wilks’ Lambda = .789, F (4, 28) = 1.877, p = .142. However, follow-up univariate analyses
were conducted using one-tailed independent t-tests. Unexpectedly, when compared to the HC
group, the SPD group displayed significantly better performance on a measure of immediate
verbal memory (Logical Memory I), t (31) = -1.714, p ≤ .05. The effect size for this analysis
approached moderate strength (.29), suggesting that the results are statistically meaningful.
There was a 38% chance that a significant difference between groups would be detected if it
existed.
A second MANOVA was conducted in order to examine group differences on all
attention measures including Continuous Performance Test-Identical Pairs (CPT-IP), Digit Span
42

(DS), Spatial Span (SS), and Letter-Number Sequencing variables (LNS) (see Table 2). The
overall model was non-significant, Wilks’ Lambda = .031, F (31, 1) = .998, p = .675. Consistent
with our hypothesis, however, univariate analyses revealed that the SPD group performed
significantly poorer on a measure of nonverbal attention and memory (Spatial Span Forward)
compared to the HC group, t (31) = 1.736, p ≤ .05. The effect size for this analysis approached
moderate strength (.30), suggesting that the results are statistically meaningful. There was a 39%
chance that a significant difference between groups would be detected if it existed.
A third MANOVA was conducted to test for differences between the two groups on
measures of executive functioning (Wisconsin Card Sort Test: Computerized Version 2; WCST-
CV2). Failing to support our hypothesis, findings indicate that the overall model was not
significant, Wilks’ Lambda = .423, F (11, 14) = 1.737, p = .164. Univariate analyses did not
reveal significant group differences in WCST-CV2 performance.
Group Effects for Motor Functioning
MANOVA’s were also conducted to ascertain if group differences existed for left- and
right hand motor performance separately. The overall model including all left hand motor
variables from the Instrumental Motor Task and Finger Tapping Test (see Table 3) was non-
significant, Wilks’ Lambda = .01, F (28, 1) = 3.596, p = .398. However, univariate analyses
reveal that the SPD group exhibited significantly less left hand force during the motor response
in the unimanual condition compared to the HC group, t (29) = 1.700, p ≤ .05. The effect size
for this analysis approached moderate strength (.35), suggesting that the results are statistically
meaningful. There was a 48% chance that a significant difference between groups would be
detected if it existed. This finding failed to support our hypothesis that the SPD group would
exhibit greater mean force, force variability, and motor overflow.
43

The overall MANOVA including all right hand motor variables from the Instrumental
Motor Task and Finger Tapping Test was also non-significant, Wilks’ Lambda = .026, F (28, 1)
= 1.331, p = .607. Univariate analyses reveal that the SPD group displayed greater right hand
motor overflow compared to the HC group, t (31) = -2.453, p = .02. Figure 6 illustrates this
finding. The effect size for this analysis approached moderate strength (.42), suggesting that the
results are statistically meaningful. There was a 65% chance that a significant difference
between groups would be detected if it existed. This finding supported our hypothesis that the
SPD group would exhibit greater motor overflow. However, our predictions that the SPD group
would exhibit greater mean force and greater force variability were not supported.
The above-mentioned analyses were also computed using a more liberal diagnostic group
cut-off score. That is, participants reporting 4 or more SPD criteria on the Structured Clinical
Interview for DSM-IV Personality Disorders (SCID-II) were placed in the SPD group.
Participants reporting 3 or fewer SPD criteria on the SCID-II were placed in the HC group.
Using a more liberal diagnostic group cut-off score did not, however, result in significant
differences in the overall pattern of results.
Family History of Psychopathology and Cognitive, Motor, and Symptom Variables
Family history of general psychopathology was analyzed as a possible factor that may
have contributed to our failure to fully replicate SPD and HC group differences in motor
functioning. As previously mentioned, the two groups did not differ in terms of a family history
of general psychopathology. Independent t-tests were conducted within each diagnostic group to
explore for differences in motor functioning between participants with or without a self-reported
family history of psychopathology. Within the SPD group, no significant differences in motor
44
functioning were found. Likewise, no significant differences were found between HC
participants with or without a self-reported history of general psychopathology.
Correlation analyses examining the associations between family history of
psychopathology and motor variables are displayed in Table 13. Family history of
psychopathology did not significantly correlate with motor functioning.
Correlation analyses examining the associations between family history of
psychopathology and cognitive variables are displayed in Table 13. With respect to attentional
functioning, family history of psychopathology correlated with decreased attentional sensitivity
(d’) to verbal targets (r = -.29, p ≤ .05), decreased verbal hit rate (r = -.32, p ≤ .05), and
decreased nonverbal hit rate (r = -.35, p ≤ .05). With respect to executive functioning, family
history of psychopathology correlated with increased total errors on the WCST-CV2 (r = .46, p ≤
.01), perseverative responses (r = .32, p ≤ .05), and perseverative errors (r = .36, p ≤ .05).
Likewise, family history of psychopathology correlated with decreased conceptual level
responses (r = -.42, p ≤ .01), decreased categories completed (r = -.40, p ≤ .01), and decreased
learning ability (r = -.33, p ≤ .05).
As displayed in Table 13, correlation analyses revealed that family history of
psychopathology correlated with SPD symptoms reported on the Schizotypal Personality
Questionnaire-Brief Version (SPQ-B) and the SCID-II, r = .40, p ≤ .01 and r = .43, p ≤ .01,
respectively.
Time of Day of Testing (TOD) and Cognitive Functioning
Given that significantly more HC participants compared to SPD participants were
evaluated in the afternoon, analyses were conducted to explore if TOD significantly contributed
to our findings. Thus, MANOVAs were conducted using the cognitive and motor variables as
45
dependent variables and time of day of testing (TOD) and diagnostic group as independent
variables. MANOVAs were conducted separately for commensurate variable domains. A 2
(Group) x 2 (TOD) MANOVA was conducted using the verbal and visual memory measures
(Logical Memory I & II, Visual Reproduction I & II). Although the results revealed a non-
significant main effect for TOD (Wilks’ lambda = .881, F (4, 26) = .881, p = .489), the results
showed a significant main effect for group, Wilks’ Lambda = .677, F (4, 26) = 3.678, p = .03.
Furthermore, results revealed a significant interaction effect between diagnostic group and TOD,
indicating that they function together to affect memory performance, Wilks’ Lambda = .639, F
(4, 26) 3.678, p = .017. Univariate analyses failed to reveal significant group, TOD, or group by
TOD effects for the verbal and visual measures.
A second 2 (Group) x 2 (TOD) MANOVA was conducted using all attention measures
including CPT-IP, Digit Span, Spatial Span, and Letter-Number Sequencing variables (see Table
2). Results revealed non-significant main effects for group (Wilks’ Lambda = .016, F (29, 1) =
2.089, p = .506) and TOD (Wilks’ Lambda = .036, F (29, 1) = .915, p = .696). Furthermore, the
group by TOD interaction was also non-significant, Wilks’ Lambda = .030, F (29, 1) = 1.126, p
= .646. Univariate analyses failed to reveal significant group, TOD, or group by TOD effects for
the attention measures.
A third 2 (Group) x 2 (TOD) MANOVA was conducted using the executive functioning
measures including the WCST-CV2 variables (see Table 2). Results revealed non-significant
main effects for group (Wilks’ Lambda = .476, F (11, 12) = 1.199, p = .378) and TOD (Wilks’
Lambda = .630, F (11, 12) = .641, p = .766). Furthermore, the group by TOD interaction was
also non-significant, Wilks’ Lambda = .543, F (11, 12) = .919, p = .552. Univariate analyses
failed to reveal significant group, TOD, or group by TOD effects for WCST-CV2 variables.
46

In addition, correlation analyses examined the associations between TOD and cognitive
functioning and the results are displayed in Table 13. A correlation was found between
afternoon assessments (P.M.) and decreased reaction time to verbal targets (r = .32, p ≤ .05) and
increased reaction time to nonverbal targets (r = .35, p ≤ .05). Morning assessments (A.M.) were
found to be associated with poorer performance on a measure of verbal memory (Letter-Number
Sequencing, r = .36, p ≤ .05). With respect to executive functioning, a negative correlation was
found between TOD and WCST-CV2 performance. Specifically, A.M. assessments were
associated with increased perseverative errors, r = -.30, p ≤ .05.
TOD and Motor Functioning
Separate 2 (Group) x 2 (TOD) MANOVA’s were also conducted using the left- and right
hand motor performance measures. Means and standard deviations for left and right hand motor
variables are presented in Table 5. The 2 x 2 MANOVA using left hand motor variables from
the Instrumental Motor Task and Finger Tapping Test (see Table 3) revealed non-significant
main effects for group (Wilks’ Lambda = .081, F (26, 1) = .439, p = .857) and TOD (Wilks’
Lambda = .025, F (26, 1) = 1.510, p = .577). Univariate analyses did not reveal a significant
main effect for group for left hand total response force, force variability, or motor overflow.
However, univariate analyses revealed a significant TOD main effect for left hand total response
force variability (LH Motor Force Variability Composite), F (1) = 5.043, p = .03. Examination
of the means revealed that, when collapsed across diagnostic group, participants tested in the
morning exhibited greater total response force variability compared to participants tested in the
afternoon (A.M. M = .260 (.09), n= 14; P.M., M = .206 (.08) n = 16). This effect is illustrated in
Figure 1 and 2.
47
The 2 (Group) x 2 (TOD) MANOVA interaction for left hand motor functioning fell
short of significance, univariate analyses did not reveal significant group by TOD interactions for
left hand force, F (1) = .914, p ≥ .05, or left hand force variability, F (1) = .653, p ≥ .05. These
findings are illustrated in Figures 1 and 2. Furthermore, as illustrated in Figure 3, univariate
analyses did not reveal significant group by TOD interactions for left hand motor overflow, F (1)
= .03, p ≥ .05.
The 2 x 2 MANOVA using right hand motor variables from the Instrumental Motor Task
and Finger Tapping Test (see Table 3) revealed non-significant main effects for group (Wilks’
Lambda = .008, F (26, 1) = 4.818, p = .348) and TOD (Wilks’ Lambda = .007, F (26, 1) = 5.386,
p = .330). Furthermore, the group by TOD interaction was also non-significant, Wilks’ Lambda
= .013, F (26, 1) = 2.946, p = .435. However, univariate analyses indicated a significant group
main effect for right hand motor overflow, F (1) = 7.529, p ≤ .01. As illustrated in Figure 6, SPD
participants exhibited significantly greater motor overflow (M = .11 (.18), n = 12) compared to
HC participants (M = -.05 (.17) n = 18) collapsed across TOD.
Although the 2 (Group) x 2 (TOD) MANOVA interaction for right hand motor
functioning fell short of significance, univariate analyses revealed a significant group by TOD
interaction for right hand total response force variability (RH Motor Force Variability
Composite), F (1) = 4.530, p = .04. As illustrated in Figure 1, the SPD group (M = .39 (.15), n =
9) displayed significantly greater right hand force variability during A.M. assessments compared
to the HC group (M = .29 (.07), n = 6), t (11.80) = -1.74, p ≤ .05. As illustrated in Figure 2, no
significant differences were found in right hand force variability between the SPD (M = .22 (.11),
n = 3) and HC (M = .32 (.10), n = 12) groups during P.M. testing, t (13) = 1.55, p = .07. As
presented in Figure 4, the SPD group exhibited greater right hand force variability during the
48
A.M. assessments (M = .39 (.15), n = 9) compared to P.M. assessments (M = .22 (.11), n = 3), t
(10) = 1.810, p ≤ .05. In contrast, the HC participants tested in the A.M. (M = .29 (.07), n = 6)
did not significantly differ from those tested in the P.M. (M = .32 (.10), n = .12) with respect to
right hand total response force variability, t (16) = -.694, p ≥ .05. This finding is displayed in
Figure 5. In addition, univariate analyses failed to reveal significant group by TOD interaction
for right hand motor overflow, F (1) = .35, p ≥ .05. However, as illustrated in Figure 3, the SPD
group (M = .07 (.18), n = 9) tended to exhibit greater right hand motor overflow during the A.M.
compared to the HC group (M = -.06 (.15), n =8), t (15) = -1.61, p = .06. Furthermore, the SPD
group exhibited greater right hand motor overflow during P.M. assessments compared to the HC
group, t (14) = -2.23, p ≤ .01. Univariate analyses did not reveal significant group by TOD
interactions for right hand force, F (1) = 2.868, p ≥ .05.
Correlation analyses examined the associations between TOD and motor functioning and
the results are displayed in Table 13. A negative correlation was found between TOD and left
hand total response motor force variability (LH Motor Force Variability Composite), r = -.31, p
≤ .05. Thus, greater force variability in the left hand was associated with A.M. assessments.
History of Head Injury and Cognitive, Motor, and Symptom Variables
Given that the groups tended to differ with respect to history of head injury, analyses
were conducted to determine if this variable dramatically affected our results. All cases with a
self-reported history of head injury were excluded (SPD, n = 4; HC, n = 2). Means and standard
deviations are displayed in Table 6. Group differences are also illustrated in Figure 7.
No significant differences were found between groups for left hand total response force
and force variability (LH Motor Composites). Although not meeting conventional levels of
significance, the SPD group displayed greater left hand motor overflow compared to the HC
49

group, t (25) = -1.44, p = .08. One-tailed independent samples t-tests were conducted and
revealed that the SPD group exhibited significantly greater right hand total response force and
force variability (RH Motor Composites) compared to the HC group, t (22) = -1.98, p ≤ .05 and t
(9.91) = -1.74, p ≤ .05, respectively. The SPD group also displayed greater right hand motor
overflow compared to the HC group, t (25) = -2.42, p ≤ .01. In addition to being statistically
different, these results are also meaningful as evidenced by the moderate effect sizes (RH force,
.39; RH force variability, .40; RH motor overflow, .43).
Correlation analyses were conducted to examine the associations between self-reported
head injury and motor variables and are displayed in Table 13. History of head injury was found
to be correlated with decreased right hand total response force (r = -.54, p ≤ .001) and force
variability (r = -.53, p ≤ .001), as well as left hand total response force (r = -.430, p ≤ .01) and
force variability (r = -.35, p ≤ .05). In addition, history of head injury was associated with
decreased left hand finger tapping speed, r = -.44, p ≤ .05.
Correlation analyses were conducted to examine the associations between self-reported
head injury and cognitive variables and are displayed in Table 13. With respect to attentional
functioning, correlations were found between history of head injury and decreased attentional
sensitivity (d’) to nonverbal targets (r = -.32, p ≤ .05), decreased verbal hit rate (r = -.40, p ≤
.01), and decreased nonverbal hit rate (r = -.50, p ≤ .001). Likewise, history of head injury was
associated with decreased nonverbal attention and memory as evidenced by a negative
correlation between head injury and Spatial Span, r = -.30, p ≤ .05. A correlation was also found
between history of head injury and decreased conceptual ability (r = -.32, p ≤ .05) on the WCST-
CV2. However, history of head injury was found to be associated with decreased tendency to
lose set (r = -.36, p ≤ .05) on the WCST-CV2.
50

Additional analyses were conducted to examine if the groups differed with respect to
symptom ratings after the head injury cases were excluded. Findings reveal that the SPD group
reported significantly more SPD symptoms on the SPQ-B compared to the HC group, t (25) = -
2.71, p ≤ .01. Likewise, the SPD group reported significantly greater SPD symptoms on the
SCID-II, t (25) = -5.82, p ≤ .001. Finally, the SPD group reported significantly more Paranoid
Personality Disorder (PD) symptoms on the SCID-II, t (8.17) = -2.04, p ≤ .05. Correlation
analyses were consistent with the above findings and are displayed in Table 13. Significant
correlations were found between history of head injury and SPD symptoms on the SPQ-B (r =
.38, p ≤ .01), SPD symptoms on the SCID-II (r = .41, p ≤ .01), Paranoid PD symptoms on the
SCID-II (r = .30, p ≤ .05), and Borderline PD symptoms on the SCID-II (r = .57, p ≤ .05).
Schizotypal Symptoms and Cognitive Functioning
Pearson correlation coefficients were computed to analyze the associations between SPD
symptoms and cognitive performance. See Table 7 for a quick review of these correlations.
Although most correlations fell short of conventional levels of significance, several correlations
were modest to moderate in size. Based on the total sample, the cognitive-perceptual cluster of
symptoms assessed via the SPQ-B positively were associated with visual memory delayed recall,
r = .30, p ≤ .05. Specifically, increases in cognitive-perceptual disturbances were associated
with enhanced delayed recall of visual information.
A positive correlation was found between SPD positive symptoms (as indexed by the
SCID-II) and CPT-IP Log Beta (Numbers), r = .31, p ≤ .05. Thus, participants exhibited a more
cautious response style (under-responding) as positive symptoms increased. The cognitive
symptom cluster (r = -.30, p ≤ .05) and total symptoms (r = -.30, p ≤ .05) on the SPQ-B were
negatively correlated with CPT-IP False Alarms-Numbers. Thus, fewer commissions on the
51

verbal attention task were associated with increased cognitive-perceptual disturbances and total
SPD symptoms.
A positive correlation was found between negative SPD symptoms and CPT d’ (Shapes),
r = .30, p ≤ .05. Thus, as negative symptoms increase, nonverbal attentional capacity increases
as well. However, results also indicated that deficits in nonverbal memory and attention (as
indexed by Spatial Span) were related to negative symptoms, r = -.29, p ≤ .05. Negative
correlations were found between CPT-IP reaction time for verbal targets and cognitive-
perceptual symptoms (r = -.36, p ≤ .05) and total symptoms (r = -.29, p ≤ .05) as indexed by the
SPQ-B. Similarly, negative correlations were found between CPT-IP reaction time for nonverbal
targets and cognitive (r = -.39, p ≤ .01), interpersonal (r = -.42, p ≤ .01), disorganized (r = -.47, p
≤ .01), and total symptoms (r = -.53, p ≤ .01) assessed via the SPQ-B.
SPD positive symptoms (r = -.32, p ≤ .05) and total symptoms (r = -.37, p ≤ .05) as rated
by the SCID-II were negatively correlated with WCST-CV2 conceptual level responses. Total
SPD symptoms as rated by the SPQ-B were negatively correlated with WCST-CV2 conceptual
level responses, r = -.37, p ≤ .05. Similarly, total SPD symptoms as rated by the SCID-II
interview (r = -.33, p ≤ .05) and the SPQ-B (r = -.45, p ≤ .01) were negatively correlated with
WCST-CV2 learning slope. The disorganized cluster of symptoms assessed via the SPQ-B were
negatively correlated with concept level (r = -.37, p ≤ .05), categories achieved (r = -.31, p ≤
.05), and learning slope (r = -.42, p ≤ .05). In addition, the interpersonal cluster of symptoms
assessed via the SPQ-B were negatively correlated with conceptual level (r = .30, p ≤ .05) and
learning slope (r = -.45, p ≤ .01). Thus, positive, disorganized, interpersonal, and total SPD
symptoms are linked to deficits in conceptual ability and deficits in learning ability.
Disorganized symptoms were positively correlated with total errors on the WCST-CV2 (r = .32,
52

p ≤ .05). Although not meeting conventional levels of significance, perseverative errors on the
WCST-CV2 appeared to be associated with disorganized symptoms (r = .27, p ≤ .07).
Schizotypal Symptoms and Left Hand Motor Functioning
Pearson correlation coefficients were computed to analyze the associations between SPD
symptoms and left hand motor functioning. See Table 8 for a quick review of these correlations.
Total motor response force and force variability (LH Motor Composites) as well as left hand
finger tapping did not significantly correlate with SPD symptoms. However, left hand
unimanual motor response force was negatively correlated with negative symptoms on the SCID-
II, r = -.30, p ≤ .05. Positive symptoms and cognitive-perceptual symptoms were negatively
correlated with left hand baseline force (r = -.35, p ≤ .05; r = -.42, p ≤ .01 respectively) and
baseline force variability (r = -.37, p ≤ .05; r = -.41, p ≤ .01 respectively). Likewise, positive
symptoms and cognitive-perceptual symptoms were negatively correlated with left hand
unimanual prestimulus force (r = -.38, p ≤ .01; r = -.47, p ≤ .01 respectively) and unimanual
prestimulus force variability (r = -.30, p ≤ .05; r = -.43, p ≤ .01 respectively). Disorganized
symptoms (r = -.34, p ≤ .05) and total symptoms (r = -.30, p ≤ .05) assessed via the SPQ-B were
also negatively correlated with left hand unimanual prestimulus force variability. As presented
in Table 8, bimanual prestimulus force and force variability in the responding and non-
responding hands were also negatively correlated with SPD symptoms.
In contrast to the above findings linking SPD symptoms with decreased force and force
variability in the left hand, a positive correlation was found between negative symptoms and
bimanual prestimulus force variability in left hand, r = .35, p ≤ .05. Negative SPD symptoms
were found to be positively correlated with increased left hand bimanual response duration (r =
.29, p ≤ .05) and increased left hand motor overflow (r = .29, p ≤ .05). Finally, negative
53

symptoms were positively correlated with number of omissions (r = .52, p ≤ .01) while
disorganized symptoms were negatively correlated with number of omissions (r = -.29, p ≤ .05).
Schizotypal Symptoms and Right Hand Motor Functioning
Pearson correlation coefficients were computed to analyze the associations between SPD
symptoms and right hand motor functioning. See Table 9 for a quick review of these
correlations. Negative symptoms were positively correlated with increased and more variable
motor force in right hand responses. Specifically, negative symptoms were positively correlated
with total motor response force variability (RH Motor Force Variability Composite) (r = .30, p ≤
.05), unimanual motor response force (r = .33, p ≤ .05), and unimanual motor response force
variability (r = .42, p ≤ .05) in the right hand. Similarly, interpersonal, disorganized, and total
symptoms assessed via the SPQ-B were positively correlated with increased right hand
unimanual prestimulus force variability (r = .37, p ≤ .05; r = .37, p ≤ .05; r = .36, p ≤ .05,
respectively).
Negative symptoms were positively correlated with increased right hand response
duration (r = .32, p ≤ .05) and increased number of commission (r = .59, p ≤ .01). Total
symptoms assessed via the SCID-II were positively correlated with increased travel time (r = .31,
p ≤ .05) and travel time variability (r = .38, p ≤ .05). Interpersonal symptoms were also
positively correlated with more variable travel time, r = .32, p ≤ .05. In addition, interpersonal
symptoms were correlated with deficits in right hand motor speed, r = -.31, p ≤ .05.
Positive (r = -.36, p ≤ .05) and total symptoms (r = -.30, p ≤ .05) assessed via the SCID-II
as well as cognitive-perceptual symptoms on the SPQ-B (r = -.46, p ≤ .01) were negatively
correlated with bimanual prestimulus force variability in the left hand during right hand
responses. Cognitive-perceptual symptoms were also negatively correlated with bimanual
54
prestimulus force in the right hand, r = -.40, p ≤ .01. Negative symptoms were negatively
correlated with travel time variability, r = -.39, p ≤ .01.
In general, results suggest that right hand (left hemisphere) motor disturbances (i.e.,
increased and more variable motor force) appear to be most associated with negative SPD
symptoms as well as interpersonal and disorganized symptoms. However, it should be noted that
positive symptoms and cognitive-perceptual symptoms appear to be associated with decreased
force in the right hand during bimanual tasks and decreased force variability in the non-
responding hand (left hand) during right hand responses.
Left Hand Motor Functioning and Cognitive Functioning
Pearson correlations were computed to examine the relationships between left hand
motor functioning and cognitive functioning. See Table 10 for a quick review of these
correlations. In terms of memory functioning, decreased left hand unimanual motor force (LM I,
r = .33, p ≤ .05) and bimanual motor force variability (LM I, r = .34, p ≤ .05; LM II, r = .36, p ≤
.05) were positively correlated with deficits in verbal memory performance. Similarly, deficits
in working memory (as indexed by Digit Span - Backward) were found to positively correlate
with decreased unimanual motor response force (r = .37, p ≤ .05) and force variability (r = .35, p
≤ .05) in the left hand. These findings are also consistent with the pattern of correlations
between Digit Span –Backward and total motor response force (r = .36, p ≤ .05) and force
variability (r = .34, p ≤ .05) (LH Motor Composites). Deficits in nonverbal memory and
attention (as indexed by Spatial Span - Forward) were positively correlated with decreased total
motor response force (r = .43, p ≤ .01) and force variability (r = .40, p ≤ .01) as well as decreased
bimanual motor response force (r = .38, p ≤ .05) and force variability (r = .39, p ≤ .05) in the left
hand. Decreased left hand finger tapping speed was associated with deficits in nonverbal
55
memory and attention as evidenced by the positive correlations between the Finger Tapping Test
(FTT) and Spatial Span tasks (SS-Forward, r = .43, p ≤ .01; SS-Total, r = .39, p ≤ .05). Thus,
decreased force and force variability and decreased finger tapping speed in the left hand appear
to be linked to deficits in memory performance.
Results also indicate significant relationships between the WCST-CV2 performance and
left hand motor functioning. Specifically, increased total motor response force and force
variability (LH Motor Composites) were positively correlated with total errors (r = .35, p ≤ .05)
and perseverative responses (r = .38, p ≤ .05; r = .31 p ≤ .05 respectively) on the WCST-CV2.
Increased total motor response force (LH Motor Force Composite) was negatively correlated
with perseverative errors (r = -.38, p ≤ .05). Decreased left hand finger tapping speed was also
negatively correlated with total errors (r = -.34, p ≤ .05) and number of trials to complete the first
category (r =-.45, p ≤ .01). Thus, decreased left hand finger tapping speed is associated with
greater total errors and greater number of trials required to complete the first category.
Decreased left hand finger tapping speed was also associated with deficits in conceptual ability (r
= .30, p ≤ .05) and fewer categories completed (r = .33, p ≤ .05).
With respect to CPT-IP performance, significant relationships were found between
attention and left hand motor functioning. For example, decreased total motor response force
(LH Motor Force Composite) was correlated with decreased hit rate for verbal (r = .30, p ≤ .05)
and nonverbal targets (r = .29, p ≤ .05). Increased left hand motor force is associated with an
impulsive response style (over-responding) as evidenced by the negative correlation between
Log Beta and total motor response force (Log Beta -Numbers, r = -.33, p ≤ .05) and bimanual
motor response force (Log Beta - Numbers, r = -.30, p ≤ .05; Log Beta – Shapes, r = -.37, p ≤ .05
56

Decreased left hand motor force variability was associated with decreased hit rate for
nonverbal targets as evidenced by the positive correlations between hits rate (shapes) and total
motor response force variability (LH Motor Force Variability Composite) (r = .36, p ≤ .05) and
bimanual motor response force variability (r = .39, p ≤ .05). Bimanual motor force variability
was also positively correlated with d’ (numbers); decreased force variability in the left hand was
associated with deficits in verbal attentional capacity.
A single negative correlation was found between increased left hand motor response
force variability and hit rate for nonverbal targets (r = -.36, p ≤ .05). This finding suggests that
more variable motor force in the left hand is linked to deficits in ability to reliably detect
nonverbal targets.
Correlations between left hand motor overflow and cognitive performance did not meet
conventional levels of significance. However, several correlations approached significance (see
Table 8). Specifically, there appear to be trends in the relationships between increased left hand
motor overflow and deficits in nonverbal memory (Spatial Span, r = -.28, p ≤ .07), difficulty
maintaining set (WCST-CV2, r = .29, p ≤ .07), decreased nonverbal attentional capacity (d’
shapes, r = -.26, p ≤ .07), greater nonverbal commissions (FA-Shapes, r = .27, p ≤ .07), and
faster reaction time to nonverbal commissions (RT FA- Shapes, r = -.28, p ≤ .05).
Correlations between FTT and CPT-IP variables suggest significant associations between
left hand motor speed and attentional functioning. Specifically, decreased left hand finger
tapping speed was positively correlated with deficits in verbal and nonverbal attentional capacity
(d’ numbers, r = .43, p ≤ .01; d’ shapes, r = .43, p ≤ .05) and decreased hit rate for verbal (r =
.54, p ≤ .01) and nonverbal targets (r = .47, p ≤ .01). Likewise, results indicated that decreased
57
left hand finger tapping speed was associated with greater verbal commissions (r = -.38, p ≤ .05)
and a longer reaction time to detect verbal targets (r = -.49, p ≤ .05).
Left Hand Motor Functioning and Cognitive Functioning Controlling for TOD
Given the significant TOD by group interaction for motor functioning, partial correlation
analyses were conducted to examine the associations between left hand motor functioning (i.e.,
LH Motor Composites, Motor Overflow, and FTT) and cognitive functioning after controlling
for TOD. Results from these analyses are presented in Table 12. With respect to memory
functioning, decreased left hand force was correlated with deficits in working memory (Digit
Span – Backward, r = .39, p ≤ .05) and deficits in visual memory and attention (Spatial Span, r =
.40, p ≤ .05). Similar patterns were found between left hand force variability and memory
functioning (Digit Span – Backward, r = .42, p ≤ .01; Spatial Span, r = .44, p ≤ .01). Left hand
motor overflow was found to be associated with deficits in visual memory and attention (Spatial
Span, r = -.37, p ≤ .05). In addition, decreased motor speed was correlated with deficits in visual
memory and attention (Spatial Span and FTT, r = .49, p ≤ .01).
With respect to executive functioning, a single partial correlation between left hand
motor variables and WCST-CV2 variables was found to be significant after controlling for TOD.
Specifically, increased left hand motor overflow was associated with increased conceptual
ability, r = .36, p ≤ .05.
Significant correlations were found between left hand motor functioning and attention
after controlling for TOD. Greater left hand motor force was associated with a more impulsive
response style (over-responding) on the CPT-IP (Log Beta, r = -.33, p ≤ .05). A relationship
between greater left hand force variability and greater nonverbal hit rate was also found, r = .38,
p ≤ .05. Although not meeting conventional levels of significance, a trend was found in the
58
association between greater left hand force variability and decreased nonverbal attentional
sensitivity (d’), r = .28, p ≤ .07. Greater left hand motor overflow was correlated with decreased
nonverbal attentional sensitivity (d’) and increased nonverbal false alarms, r = -.33, p ≤ .05 and r
= .35, p ≤ .05, respectively. Decreased left hand finger tapping speed was correlated with several
measures on the CPT-IP. Specifically, decreased motor speed was found to be associated with
decreased verbal and nonverbal attentional sensitivity, a more cautious response style (log beta),
decreased verbal and nonverbal hit rate, greater verbal false alarms, and longer reaction time to
targets (see Table 12 for correlation coefficients).
Right Hand Motor Functioning and Cognitive Functioning
Pearson correlations were computed to examine the relationships between right hand
motor functioning and cognitive functioning. See Table 11 for a quick review of these
correlations. Analyses revealed significant correlations between enhanced memory performance
and increased right hand motor response force (LM II, r = .34, p ≤.05; Digit Span, r = .34, p ≤
.05) and force variability (LM II, r = .33, p ≤ .05; Digit Span, r = .36, p ≤ .05). Increased right
hand motor overflow was negatively correlated with a measure of working memory (Digits Span
– Backward, r = -.29, p ≤ .05). Decreased right hand finger tapping speed was associated with
deficits in verbal memory and attention (Digit Span – Forward, r = .41, p ≤ .01; Digit Span –
Total, r = .45, p ≤ .01).
With respect to executive functioning, a significant correlation was found between
increased right hand bimanual motor response force and increased conceptual level ability (r =
.35, p ≤ .05). Increased right hand motor overflow was significantly correlated with increased
total errors (r = .37, p ≤ .05), increased perseverative responses (r = .30, p ≤ .05), increased
perseverative errors (r = .29, p ≤ .05), and increased number of trial required to complete the first
59
category (r = .35, p ≤ .05). Thus, increased right hand motor overflow appears to be associated
with deficits in executive functioning. In contrast, reduced right hand finger tapping speed was
negatively correlated with total errors (r = -.53, p ≤ .01), perseverative responses (r = -.42, p ≤
.01), perseverative errors (r = -.42, p ≤ .01), and number of trials to complete the first category (r
= -.53, p ≤ .01). Decreased right hand finger tapping speed was also positively correlated with
conceptual level (r = .36, p ≤ .05) and number of categories completed (r = .47, p ≤ .01).
Therefore, decreased right hand motor speed appears to be associated with deficits in executive
functioning.
Correlation analyses revealed significant associations between attentional functioning and
right hand motor functioning. For example, increased total motor response force (RH Motor
Force Composite) is related to increased hit rate for nonverbal targets (r = .30, p ≤ .05) and faster
reaction time to nonverbal targets (r = -.30, p ≤ .05). Increased right hand motor overflow is
associated with decreased nonverbal log betas (r = -.39, p ≤ .01), or a more impulsive response
style (over-responding). Increased right hand motor overflow was also positively correlated with
nonverbal commissions (r = .32, p ≤ .05). In addition, significant correlations were found
between reduced right hand finger tapping speed and decreased verbal and nonverbal attentional
capacity (d’ numbers and shapes, r = .47, p ≤ .01), decreased hit rate for verbal and nonverbal
targets (r’s = .39, p ≤ .01), and greater verbal and nonverbal commissions (False Alarms –
Numbers, r = -.49, p ≤ .01; False Alarms – Shapes, r = -.42, p ≤ .01).
Right Hand Motor Functioning and Cognitive Functioning Controlling for TOD
Given the significant TOD by group interaction for motor functioning, partial correlation
analyses were conducted to examine the associations between right hand motor functioning (i.e.,
RH Motor Composites, Motor Overflow, and FTT) and cognitive functioning after controlling
60

for TOD. Results from these analyses are presented in Table 12. Right hand force, force
variability, and motor overflow did not significantly correlate with memory functioning.
However, decreased right hand finger tapping speed was correlated with deficits in working
memory (Digit Span – Total, r = .45, p ≤ .01).
Performance on the WCST-CV2 was also correlated with motor functioning in the right
hand. Greater right hand force was found to be associated with fewer categories completed (r = -
.35, p ≤ .05) and difficulty maintaining set (r = .34, p ≤ .05). Similar patterns were found
between right hand force variability and categories completed (r = -.33, p ≤ .05) and failure to
maintain set (r = .34, p ≤ .05). Right hand motor overflow did not significantly correlate with
performance on the WCST-CV2. However, significant associations were found between
reduced right hand motor speed and greater errors (r = -.40, p ≤ .05), greater perseverations (r = -
.35, p ≤ .05), and decreased number of categories completed (r = .37, p ≤ .05) on the WCST-
CV2.
Measures of attention were not found to significantly correlate with right hand force and
force variability. However, greater right hand motor overflow was found to be associated with a
more impulsive response style (Log Beta, r = -.45, p ≤ .01). The most significant relationships
between attention and motor functioning after controlling for TOD were found between right
hand FTT and CPT-IP variables. Decreased right hand motor speed was correlated with
decreased verbal and nonverbal attentional sensitivity, decreased verbal and nonverbal hit rate,
greater false alarms, and longer reaction time to verbal targets (see Figure 12 for correlation
coefficients).
61

Regression Analyses
Stepwise multiple regression analyses were performed in order to determine the extent to
which specific motor variables predict SPD symptoms. Four separate regression analyses were
conducted to examine the predictive power of right or left hand motor variables on positive or
negative symptoms. Predictor variables included right hand (or left hand) total motor response
force and force variability (Motor Composites), motor overflow, and finger tapping speed.
Regressions showed that neither right nor left hand motor variables significantly predicted
positive or negative SPD symptoms. These results are not surprising given the non-significant
zero-order correlations between these motor variables and symptom scores.
62
CHAPTER 4
DISCUSSION
Integration of Results
The purpose of the present study was to investigate neuromotor and neurocognitive
functioning in adults with schizotypal personality disorder (SPD). Specifically, the study aimed
to replicate Neumann and Walker’s (1999) finding that adults with SPD display neuromotor
disturbances such as greater and more variable motor force and motor overflow compared to
healthy controls. In addition, the present study investigated the associations between symptom
ratings, neuromotor functioning, and neurocognitive functioning in adults with SPD.
Cognitive Functioning
Individuals diagnosed with SPD have been shown to have patterns of cognitive deficits
in (1) attention (Lees-Roitman, Cornblatt, Bergman, Obuchowski, Mitropoulou, Keefe,
Silverman, & Siever, 1997), (2) memory (Bergman, Harvey, Lees-Roitman, Mohs, Marder,
Silverman, & Siever, 1998), and (3) executive functioning (Cadenhead, Perry, Shafer, & Braff,
1999). Consistent with previous research, our study revealed that positive and negative
symptoms were correlated with deficits in concept formation and increased perseverations on the
Wisconsin Card Sort Test: Computerized Version 2 (WCST-CV2; see Heinrichs & Zakzanis,
1998 for a review). Thus, SPD participants were expected to perform more poorly on measures
of attention, memory, and executive functioning, compared to those not meeting SPD criteria.
In partial support of this hypothesis and previous research, the SPD group performed
significantly poorer on a measure of nonverbal memory and attention (Spatial Span) compared to
the healthy control (HC) group. However, the SPD and HC group did not significantly differ in
63
their performance on measures of executive functioning (WCST-CV2) and attention (Continuous
Performance Test – Identical Pairs (CPT-IP). In fact, the SPD group performed significantly
better than the HC group on a measure of immediate verbal memory (Logical Memory I). These
findings are obviously inconsistent with research that frequently finds deficits in attention,
memory, and executive functioning in schizophrenia spectrum disorders (SSDs). However,
differences between SPD and control groups on measures of cognitive functioning are not
always found. Voglmaier, Seidman, Niznikiewicz, Dickey, Shenton, and McCarley (2000) did
not find significant differences between SPD and control groups on measures of verbal and
nonverbal memory. Interestingly, Voglmaier et al. (2000) recruited participants from the
community rather than a clinical setting. Thus, heterogeneity in cognitive functioning found
across studies investigating SPD may be partially attributed to the level of cognitive functioning
in community verses clinical samples.
Time of day (TOD) of cognitive testing has been shown to influence cognitive
functioning. Morton and Kershner (1993) found that learning-disabled and healthy children
showed differences on neuropsychological tests as a function of TOD. May, Hasher, and
Stoltzfus (1993) found that older adults (> 60 years) demonstrated peak memory performance
during morning assessments, whereas younger adults (18-22 years) performed at their peak
during afternoon assessments. Recently, Ryan, Hatfield, and Hofstetter (2002) found that the
TOD effect in older adults (> 65 years) could be mediated by nonspecific changes in level of
arousal (i.e., caffeine). TOD also appears to be associated with variation in cognitive
performance in individuals with schizophrenia. D’Reaux, Neumann, and Rhymer (1999) found
that healthy controls exhibited better verbal memory and attention performance during afternoon
(P.M.) compared to morning assessments (A.M.); whereas patients with schizophrenia exhibited
64
better visual memory performance during afternoon compared to morning assessments. Thus,
optimal cognitive performance occurs during afternoon (versus morning) assessments.
Given that significantly more HC participants compared to SPD participants were
assessed in the afternoon in the present study, analyses were conducted to explore whether TOD
significantly contributed to our findings. Exploratory analyses did not find that TOD
significantly contributed to differences between groups in cognitive functioning. It should be
noted, however, that these results are tenuous given the unbalanced sample sizes between groups
by TOD. Therefore, correlation analyses were conducted and revealed that better verbal memory
and executive functioning (i.e., decreased perseverations) was associated with afternoon (P.M.)
assessments. On the other hand, P.M. assessments were found to be associated with slower
reaction times on an attention task. Thus, our results partially replicate findings that optimal
cognitive performance occurs during the afternoon (D’Reaux et al., 1999); however, our results
suggest that attention deficits (i.e., decreased reaction time) are linked to afternoon assessments.
Slower reaction times on the attention task may reflect some sort of TOD effect in motor
functioning (Walker & Green, 1982). This idea is supported by the finding that the SPD group
exhibited greater and more variable motor force during A.M. assessments compared to P.M.
assessments.
In addition to TOD, self-reported history of general psychopathology also appears to be
associated with cognitive functioning. Specifically, family history of psychopathology was
found to be correlated with deficits in attention including decreased attentional sensitivity and hit
rate. Furthermore, correlations were found between family history of psychopathology and
executive functioning including greater errors, greater perseverations, and deficits in conceptual
ability. Finally, family history of psychopathology and SPD symptoms were associated. Thus,
65

results indicate a relationship between family history of psychopathology, SPD symptoms, and
deficits in cognitive functioning. These results are not surprising given the extensive research on
the biological etiology of SSDs and the common neurocognitive profile that at-risk individuals
share with family members who manifest the disorder (see Kendler & Walsh, 1995).
Furthermore, investigators have found some evidence suggesting that participants with SPD who
report a family history of schizophrenia differ in symptomotology from those without a family
history of schizophrenia (see Torgersen, Ednardsen, Oien, Onstad, Skre, Lygren, & Kringlen,
2002). Specifically, Torgensen et al. (2002) found that negative SPD symptoms characterized
the SPD group with a family history of schizophrenia while positive SPD symptoms
characterized the SPD group without a family history of schizophrenia. Using a brief
neuropsychological battery, Condray and Steinhauer (1992) found that individuals diagnosed
with SPD who have a family history of schizophrenia exhibited impaired comprehension of
grammatical structures compared to the non-familial SPD group. However, further research
comparing the neurocognitive profiles of individuals diagnosed with SPD with and without a
family history of schizophrenia (familial vs. non-familial SPD) is minimal.
Although TOD and family history of psychopathology may have contributed to the
current findings, significant correlations were found between self-reported history of head injury
and cognitive functioning. Deficits in attention including decreased attentional sensitivity and
hit rate were found to be associated with a history of mild head injury. Likewise, a history of
mild head injury was correlated with deficits in nonverbal memory. Although history of mild
head injury was correlated with poor conceptual ability on an executive functioning measure,
mild head injury was found to be associated with decreased tendency to lose mental set. This
later finding may be a function of the severity and localization of the head injury. It is possible
66
that the participants in the study who reported a history of mild head injury did not display the
more severe impairments in frontal lobe functioning characteristic of some head injury patients
due to the nature of their injury and their potential for developing compensatory skills. In
addition to correlating with cognitive functioning, associations between history of mild head
injury and symptoms of SPD, Paranoid Personality Disorder, and Borderline Personality
Disorder were also found suggesting a significant relationship between history of head injury and
DSM-IV Cluster A and B symptomotology in the current sample.
Symptoms and Cognitive Functioning
As previously mentioned, the SPD group performed significantly poorer on a measure of
visual memory and attention (Spatial Span) compared to the HC group. Consistent with this
finding, negative symptoms correlated with deficits in visual memory and attention. These
findings are consistent with research that shows links between SSD symptomotology and visual
memory deficits (Bergman et al., 1998; Cadenhead et al., 1999; Goldberg & Gold, 1995;
Gourovitch & Goldberg, 1996; Saykin, Gur, Gur, Mozely, Mozley, Resnick, Kester, &
Stafaniak, 1991). In contrast, cognitive-perceptual symptoms correlated with enhanced visual
memory.
The finding that the SPD group performed significantly better than the HC group on a
measure of immediate verbal memory (Logical Memory I) is consistent with correlation analyses
that reveal positive trends between enhanced immediate verbal memory and increased cognitive-
perceptual, disorganized, and total symptoms. This finding is surprising given extensive
research that has documented impairments in verbal memory in SSDs (Bergman et al., 1998;
Cadenhead et al., 1999; Goldberg & Gold, 1995; Gourovitch & Goldberg, 1996; Saykin et al.,
1991). However, as previously mentioned, this may be a function of recruiting from relatively
67
higher functioning participants in the community verses relatively lower functioning clinical
samples.
Negative symptoms were correlated with increased attentional sensitivity to nonverbal
targets (d’). This finding is surprising given previous research that shows that subtle, yet
significant, sustained attention deficits including lower attentional sensitivity (d’) have been
found among subjects with SPD compared to healthy controls (Lees-Roitman et al., 1997;
Lenzenweger, Cornblatt, & Putnick, 1991). However, findings that show associations between
negative symptoms and increased attentional sensitivity to nonverbal stimuli may suggest that
individuals with SPD may be hypervigilant to nonverbal social cues which may lead to the
emergence of social deficits, unsuccessful social interactions, or active avoidance of social
situations and relationships. Cognitive-perceptual, disorganized, and interpersonal symptoms
were correlated with faster reaction times to stimuli on an attention task. Positive symptoms
appear to be associated with a more cautious response style as noted by the positive correlation
between CPT-IP Log Beta and positive symptoms. A cautious response style (or tendency to
under-respond) to stimuli often results in fewer responses to non-targets. Consistent with this
finding, cognitive-perceptual symptoms were correlated with decreased number of commissions
on the attention task. Once again, these findings were unexpected given that studies utilizing the
CPT-IP have consistently found attention deficits in individuals with SSDs (Braff, 1993;
Cornblatt & Keilp, 1994; Gourovitch & Goldberg, 1996; Maruff & Currie, 1996; Nuechterlein &
Dawson, 1984). However, it should be noted that the participants in the current study were
relatively high functioning, and this likely contributed to non-significant group differences with
respect to attention and memory functioning.
Although group differences were non-significant, significant associations between
68
executive functioning and symptom ratings were found. Positive and interpersonal symptoms
were associated with deficits in executive functioning such as decreased conceptual and learning
ability. Likewise, disorganized symptoms were negatively correlated with decreased conceptual
and learning ability and increased total errors and perseverations. These findings are consistent
with previous evidence that SSD symptomotology is associated with executive functioning
deficits (Cadenhead et al., 1999; Cannon, Zorilla, Shtasel, Gur, Gur, Marco, Moberg, & Price,
1994; Goldberg & Gold, 1995; Gooding, Kwapil, & Tallent, 1999; Gourovitch & Goldberg,
1996; Kremen, Seidman, Pepple, Lyons, Tsuang, & Faraone, 1994; Saykin et al., 1991;
Trestman, Keefe, Mitropoulou, Harvey, deVegvar, Less-Roitman, Davidson, Aronson,
Silverman, & Siever, 1995; Voglmaier, Seidman, Salisbury, & McCarley, 1997). Furthermore,
performance on the WCST has been shown to correlate with negative symptoms in individuals
with schizophrenia (Brier, Schreiber, Dyer, & Pickar, 1991). These findings have important
implications because WCST performance has been shown to be associated with long-term social
functioning (Breier et al., 1991) and community functioning in patients with schizophrenia
across studies (Green, 1996).
Neuromotor Functioning
An emerging area of research has begun to highlight aspects of neuromotor functioning
in SSDs (Caligiuri & Lohr, 1994; Neumann & Walker, 1999, 2003; Vrtunski, Simpson, &
Meltzer, 1989). Attempting to replicate findings from the Neumann and Walker (1999; 2003)
studies, the present study hypothesized that adults with SPD would display a motor performance
profile similar to that demonstrated by adults with schizophrenia and SPD, as well as adolescents
with SPD. Specifically, adults with SPD would show greater mean force, greater force
variability, and more contralateral motor overflow when compared to healthy controls.
69

Results fail to support the hypothesis that the SPD group would exhibit greater and more
variable motor force compared to healthy controls. In fact, analyses of group differences
indicate that the SPD group exhibited significantly less left-hand force during the unimanual
motor response. However, the hypothesis that the SPD group would exhibit greater motor
overflow than the HC group was supported, but only for right hand (left hemisphere) motor
functioning.
Based on the previously mentioned evidence that TOD impacts cognitive functioning,
exploratory analyses were conducted to ascertain if our failure to replicate the Neumann and
Walker (1999) findings was possibly due to changes in motor performance as a function of TOD.
These analyses indicate that when controlling for TOD, the SPD and HC groups did not differ in
terms of force, force variability, and motor overflow in the left hand. However, when collapsed
across diagnostic groups, participants exhibited greater left hand force variability in the A.M.
compared to the P.M. This pattern was also evident in the negative correlation between TOD
and left hand force variability. The TOD by Group interaction was non-significant for left hand
force, force variability, and motor overflow.
With respect to the right hand, the SPD group exhibited greater motor overflow compared
to the HC group collapsed across TOD. A main effect for TOD for right hand force, force
variability, and motor overflow was not found; however, a significant Group by TOD interaction
existed for right hand force variability. Specifically, the SPD exhibited greater right hand motor
force variability compared to HC during A.M., but not P.M. assessments. In addition, the SPD
group displayed greater right hand force variability during A.M. compared to P.M. assessments.
This pattern was not found for HC participants. In addition to the greater right hand force
variability displayed by the SPD compared to the HC group during A.M. assessments, the SPD
70
group exhibited greater right hand motor overflow during P.M. assessments compared to the HC
group. It should be noted that a trend was found toward the SPD group exhibiting greater right
hand motor overflow compared to the HC group during A.M. assessments as well.
Thus, the discrepancy between findings is partially a function of TOD. It should be noted
that Neumann and Walker (1999) only assessed motor functioning in the afternoon. They found
that SPD participants displayed greater and more variable motor force in the right hand
compared to the HC group. The current study found that the SPD group displayed greater right
hand motor overflow compared to the HC group. However, compared to healthy controls, the
SPD group displayed greater force variability in the right hand only during A.M. assessments. A
potential explanation for the TOD by Group interaction could be attributed to factors that vary
with circadian rhythms such as cortisol levels (Rao, Strebel, Halaris, Gross, Braunig, Huber, &
Marler, 1995; Shepherd, 1994). Cortisol levels naturally decline over the course of the day;
however, patients with schizophrenia often do not display this expected decline and thus exhibit
elevated afternoon cortisol levels compared to healthy controls (Kaneko, Yokoyama, Hoshino,
Takahagu, Murata, Watanabe, & Kumashiro, 1992; van Cauter, Linkowski, Kerkofs, Hubain,
L’Hermite-Baleriaux, Leclercq, Brasseur, Copinschi, & Mendlewicz, 1991). The relationship
between motor functioning and cortisol levels has not been extensively studied. However,
Neumann and Walker (1999) found that motor overflow in both hands significantly positively
correlated with afternoon cortisol levels and that afternoon cortisol levels were correlated with
negative symptoms in participants with SPD. Thus, a relationship between motor functioning,
cortisol levels, and symptoms likely exists. The current study findings that the SPD group
compared to the HC group displayed greater right hand force variability during the A.M., but not
the P.M. may be related to elevated cortisol levels during A.M. Regardless, it remains unclear
71

why our study failed to find the same pattern of motor disturbance in the P.M. given that cortisol
levels remain elevated in the afternoon compared to the natural decline in levels in healthy
controls.
Although results indicate a relationship between family history of psychopathology, SPD
symptoms, and deficits in cognitive functioning, family history of psychopathology did not
correlate with motor functioning. However, another possible contributing factor to our findings
is the impact of head injury on motor functioning. Correlation analyses revealed that a history of
mild head injury was correlated with decreased force and force variability in both hands.
Interestingly, after excluding all participants who reported a history of head injury from analyses,
results revealed that the SPD group exhibited right hand motor disturbances including
significantly greater and more variable motor force and greater motor overflow compared to the
HC group. The SPD group tended to display greater left hand motor overflow, but this finding
was not statistically significant. Thus, it appears that history of head injury, perhaps even more
than TOD, dramatically affected our results.
Neuromotor Functioning and Symptoms
It was hypothesized that increased motor force and force variability would positively
correlated with SPD symptoms. As expected, results indicate that motor functioning is
significantly associated with SPD symptoms.
Specifically, with respect to the left hand (right hemisphere) motor functioning, negative
symptoms correlated with greater prestimulus force variability in the left hand during bimanual
tasks and decreased left hand mean force during unimanual tasks. Negative symptoms were also
associated with greater motor overflow, greater number of omissions, and greater response
duration. In contrast, positive symptoms were correlated with decreased force and force
72

variability. Cognitive-perceptual symptoms were associated with decreased force and force
variability in the left-hand. Disorganized symptoms were associated with decreased prestimulus
force variability and decreased number of commissions. In general, left hand (right hemisphere)
motor disturbances (i.e., decreased force and force variability) are associated with positive,
disorganized, and cognitive-perceptual SPD symptoms while negative symptoms are linked to
greater force and force variability, motor overflow, and response duration.
With respect to the right hand (left hemisphere) motor functioning, negative symptoms
were associated with greater and more variable force (i.e., unimanual force and force variability,
total response force variability), greater commissions, greater response duration, and greater
variability in movement time. Interpersonal symptoms were associated with greater force
variability (i.e., unimanual and bimanual prestimulus force), decreased finger tapping speed, and
greater variability in movement time. Disorganized symptoms were associated with greater
unimanual prestimulus force variability. With respect to right hand motor functioning, positive
symptoms correlated with decreased prestimulus force variability in the left hand when the right
hand responded to a target. Cognitive-perceptual symptoms were associated with decreased
force in the right hand and decreased force variability in the left hand when the right hand
responded to a target during the bimanual task.
In general, right hand (left hemisphere) motor disturbances (i.e., increased force and force
variability, decreased motor speed, greater commissions, greater response duration, and variable
movement time) appear to be associated with negative, interpersonal, and disorganized SPD
symptoms. Cognitive-perceptual symptoms, in contrast, are associated with decreased force and
force variability in the right hand.
Current findings indicating that positive symptoms are associated with decreased force
73
and force variability in the left hand (right hemisphere) is inconsistent with Neumann and
Walker’s (1999, 2003) findings that greater and more variable motor force correlated with the
severity of symptoms. Our findings might suggest that under-activation of subcortical motor
centers may be linked to positive symptoms and disturbances in right-hemisphere cortical areas.
In fact, some researchers have suggested that right hemisphere dysfunction may be associated
with SPD (Goodarzi, Wykes, & Hemsley, 2000; Platek, Gallup, & Gordon, 2002). However,
cognitive-perceptual disturbances as indexed by the SPQ-B were associated with decreased force
and force variability in both hands. Given that the items on the cognitive-perceptual scale of the
SPQ-B are similar in nature to positive SPD symptoms, under-activation of subcortical motor
centers may be linked to global cortical dysfunction, rather than lateralized to the right
hemisphere.
On the other hand, our finding that negative symptoms were associated with increased
force and force variability in both hands is consistent with Neumann and Walker’s (2003)
investigation with adolescents which found correlations between increased and more variable
motor force with negative symptoms, not positive symptoms. Likewise, the majority of the
research that has explored the relationship between motor functioning and symptom correlates in
individuals with schizophrenia has reported that motor disturbances are related to negative
symptoms (Manschreck, Maher, Waller, Ames, & Latham, 1985).
Extending previous findings of the relationship between motor force and SPD symptoms,
the current study found associations between negative symptoms and greater motor overflow,
omissions, and duration in the left hand. In addition, negative symptoms were associated with
greater commissions, response duration, and variability in movement time in the right-hand.
Deficits in interpersonal functioning were found to be associated with greater force variability,
74

decreased finger tapping speed, and greater variability in movement time in the right hand.
Neuromotor and Cognitive Functioning
In addition to findings suggesting that SPD symptoms are associated with neurocognitive
and neuromotor disturbances, the present study also found evidence suggesting that disturbances
in neuromotor functioning are associated with neurocognitive functioning. Specifically, deficits
in verbal, visual, and working memory were found to be associated with decreased unimanual
motor force and bimanual force variability in the left-hand (right hemisphere). In addition,
decreased left hand total response motor force and force variability (LH Motor Composites) and
deceased left hand finger tapping speed (FTT) were found to be associated with verbal and
visual memory. The correlations remained significant after controlling for TOD effects. In fact,
stronger relationships between these variables were noted after controlling for TOD effects.
With respect to right hand (left hemisphere) motor functioning, greater motor overflow
correlated with deficits in verbal memory, but this correlation was no longer significant after
controlling for TOD. Decreased right hand finger tapping speed correlated with deficits in
verbal and visual memory and these correlations remained after controlling for TOD.
In general, attention deficits including decreased hit rate and a more cautious response
style (under-responding) were found to be related to decreased force and force variability in the
left hand (LH Motor Composites). These correlations remained significant after controlling for
TOD. Although previously only trends, greater left hand motor overflow was found to
significantly correlate with decreased attentional sensitivity and greater false alarms after
controlling for TOD. With respect to the right hand (left hemisphere), decreased hit rate to
nonverbal targets and longer reaction time to verbal targets was associated with decreased total
motor force in the right hand (RH motor Force Composite); however, these correlations were no
75
longer significant after controlling for TOD. Greater right hand motor overflow significantly
correlated with a more impulsive response style (over-responding) and the strength of this
relationship was stronger after controlling for TOD.
Finally, disturbances in motor speed in both hands correlated with deficits in attention
and stronger associations were revealed after controlling for TOD. Specifically, decreased
motor speed was associated with decreased attentional sensitivity, decreased hit rate, more false
alarms, and longer reaction time. The finding that decreased motor speed correlated with
decreased attentional sensitivity is consistent with previous research (D’Reaux et al, 2000).
Findings linking disturbances in attention and motor dysfunction are consistent with previous
research. For example, significant correlations between left-side neuromotor dysfunction and
attention problems in childhood have been reported in adults who later developed schizophrenia
compared to their healthy siblings (Walker, Lewine, & Neumann, 1996). Similarly, Neumann
and Walker (1996) found that childhood attention problems predicted motor functioning in adult
patients with schizophrenia. Walker and Green (1982) found significant correlations between
motor performance, reaction time, and omission errors on the CPT suggesting that motor
proficiency contributes to the speed of responding as well as the likelihood of detecting a target
stimulus. They propose that in some cases, omission error rates (i.e., decreased hit rate) may
reflect motor coordination deficits rather than the failure to detect a target stimulus. Our findings
that decreased motor force and force variability and decreased motor speed correlated with
decreased hit rate offer support to Walker and Green’s (1982) hypothesis.
Significant correlations were found between executive functioning deficits and motor
disturbances. Specifically, greater and more variable motor force in the left hand (LH Motor
Force Composite) was significantly correlated with increased total errors and perseverations on
76
the WCST-CV2. Decreased motor speed in the left hand was associated with greater total errors
and deficits in conceptual ability (i.e., decreased conceptual level response, fewer categories
completed, and greater trials required to complete first category). However, these relationships
did not remain significant after controlling for TOD. After controlling for TOD, only one
significant correlation was found between left hand motor functioning and WCST-CV2; greater
left hand motor overflow correlated with greater conceptual ability on the WCST-CV2. With
respect to right hand (left hemisphere) motor functioning, motor overflow was correlated with
greater total errors, perseverations, and number of trials required to complete the first category.
After controlling for TOD, the relationship between motor overflow and deficits in executive
functioning was no longer significant. However, greater and more variable motor force in the
right hand (RH Motor Composites) was correlated with deficits in executive functioning (i.e.,
fewer categories completed and failure to maintain set). Similarly, Neumann and Walker (2003)
found that increased variability in motor force in both hands correlated with WCST
perseverations. Decreased right hand finger tapping speed was found to be associated with
greater total errors, greater perseverations, and deficits in conceptual ability (i.e., decreased
conceptual level response, fewer categories completed, and greater trials required to complete
first category). These relationships remained significant after controlling for TOD.
Overall, significant associations between cognitive and neuromotor functioning exist.
However, the significance and strength of these associations varies depending on whether or not
analyses control for TOD. Thus, associations between motor and cognitive functioning exist, but
with respect to the current study, the relationships appear to be confounded partially as a function
of TOD.
Regression Analyses
77

Stepwise multiple regression analyses were performed in order to determine the extent to
which left and right hand force, force variability, motor overflow, and finger tapping predict SPD
symptoms. The analyses revealed that the motor variables did not significantly predict
symptoms. Given the impact of TOD and history of head injury on motor functioning and
symptoms, it is not surprising that these analyses were non-significant.
Implications
An emerging area of research has begun to highlight the role that neuromotor functioning
plays in SSDs. Historically, investigators have focused on involuntary, rather than voluntary
motor functioning in schizophrenia. Furthermore, the motor side effects associated with
neuroleptic drugs and the lack of quantitative measurement of motor functioning have
contributed to our lack of knowledge in this area. There is an extensive body of literature that
has established that neurological soft signs such as lack of motor coordination, desynchronized
tapping, and motor force instability are associated with SSDs (Caligiuri & Lohr, 1994;
Manschreck et al., 1985; Rosso, Bearden, Hollister, Gasperoni, Sanchez, Hadley, & Cannon,
1994; Walker, Savoie, & Davis, 1994). Subtle motor disturbances persist across the lifespan in
individuals with SSDs and these motor disturbances are related to younger age of onset,
premorbid impairment, poorer prognosis, and symptom severity (see Walker, 1994 for a review).
Once TOD and history of head injury is accounted for, the present study findings are
consistent with investigations that utilize an instrumental motor task to study motor functioning
in SSDs (Caligiuri & Lohr, 1994; Neumann & Walker, 1999, 2003; Vrtunski et al., 1989).
Consistent with the Neumann and Walker (1999) study, the current study only found evidence
for increased and more variable motor force in the right hand. Neumann and Walker (1999)
found that right hand motor disturbances distinguished the SPD group from the rest of the
78

sample. These findings suggest that left hemisphere functioning is compromised in SPD.
Furthermore, greater and more variable motor force can be viewed as markers of excessive
neuromotor activity within this population. In fact, Muller, Roder, Schuierer and Klein (2002)
found that finger tapping speed was associated with overactivation in the basal ganglia in non-
medicated patients with schizophrenia compared to medicated patients.
It has been posited that voluntary motor disturbances such as force and force variability
reflect involuntary dyskinesias (Caligiuri & Lohr, 1994, Neumann & Walker, 2003). Supporting
this hypothesis, investigators have found that individuals with SPD display more spontaneous
involuntary movements compared to healthy controls and individuals with schizoid personality
disorder (Cassidy, Adami, Moran, Kunkel, & Thaker, 1998; Walker, Lewis, Loewy, & Paylo,
1999).
Instrumental motor tasks have been developed out of a need to separate cognition from
the measurement of motor functioning. The instrumental motor task used in the current study
requires a response to lexical stimuli. Thus, a cognitive component exists in the paradigm.
However, the motor indices we examine (i.e., force and force variability) are not as strongly
related to general cognitive functioning as others (i.e., reaction time). In fact, Neumann and
Walker (2003) found that reaction time negatively correlated with estimated intelligence. In
contrast, force and force variability did not significantly correlate with intelligence. Although it
is unlikely that an instrumental motor task can completely separate the cognitive component
from the motor assessment, some motor variables are less related to general cognitive ability
than others. Thus, assessment of motor functioning using motor indices such as force and force
variability may result in a more valid assessment of pure motor functioning. Understanding how
specific neurocognitive processes reflect both motor and cognitive disturbances may change the
79

way researchers and practitioners conceptualize and use neuropsychological measures.
Meehl (1989) proposed that neuromotor signs are relatively more direct manifestations of
biological vulnerability than are cognitive and socio-emotional factors. Early neuromotor
problems have also been shown to predict later problems in affect regulation and cognition
(Dworkin, Cornblatt, Friedman, & Kaplansky, 1993; Neumann & Walker, 1996). Furthermore,
motor dysfunction has been found to precede the clinical onset of schizophrenia by many years,
thus motor functioning assessments may be useful in identifying individuals at risk for
developing schizophrenia (Rosso et al., 2000; Walker et al., 1994) as well as help foster
rehabilitative therapies for altering cognitive functioning via improvements in motor functioning.
Recently, researchers have found that neurological soft sign scores (NSS), specifically motor
coordination and sequencing, appeared to be the strongest differentiator (compared to
neurocognitive measures) between patients with schizophrenia who remain symptomatic despite
neuroleptic drug treatment (non-responders) and those that appear to improve with neuroleptic
treatment (relative responders) (Smith, Kadewari, Rosenberger, & Bhattacharyya, 1999). Thus,
it is plausible that motor functioning may predict treatment response, although longitudinal
studies need to be conducted to support this hypothesis. If supported, motor tasks may help
identify patients who will or will not respond to treatment. Furthermore, Smith et al. (1999)
suggest that their data may provide clues to identifying different brain regions responsible for the
pathogenesis of relative treatment responders verses non-responders.
Research investigating the associations between cognitive and motor functioning in SSDs
has not been explored until recently. In fact, neuroscience research has laid the ground work for
linking motor and cognitive processes (Alexander, DeLong, & Strick, 1986; Ashby & Waldron,
2000; Graybiel, Aosaki, Flaherty, & Kimura, 1994; Middleton & Strick, 2000). Several
80

investigators have detailed the role that subcortical centers (previously thought to control
primarily motor processes) play in higher cognitive processes. Graybiel (1997) has proposed
that the basal ganglia are involved in motor planning as well as the regulation of cognitive
pattern generators associated with action-oriented cognitions via cortico-basal ganglia loops
which link, for example, the caudate nucleus with the prefrontal cortex. Graybiel (1997)
suggests that damage to the basal ganglia circuits connected to forebrain structures involved in
cognitive planning, goal-directed behavior, and monitoring of intentions may be involved in the
generation of schizophrenia symptoms (see also Frith, 1992; Walker, 1994). Middleton and
Strick (2000) report evidence that the motor, affective, cognitive, and perceptual disturbances
associated with schizophrenia can be produced by altering these subcortical-cortical pathways.
Furthermore, using the WCST to demonstrate their model, Ashby and Waldron (2000)
proposed a neuropsychological theory to explain category learning deficits such as those present
in schizophrenia. Their theory postulates that the selection of explicit cognitive rules (i.e., sorting
rules) is mediated by the anterior cingulate and prefrontal cortex, that the category shifting
process (i.e., from color to shape) is mediated within the basal ganglia (which feedback to the
prefrontal cortex via the thalamus), and that both processes are facilitated by the release of
dopamine from the substantia nigra and ventral tegmental area acting as a reward signal. This
model outlines a specific relationship between the basal ganglia and the cortex in the
coordination of higher cognitive processes. The theoretical and research findings above suggest
that subcortical motor regions may be involved in producing the cognitive and psychiatric
features of the schizophrenia spectrum disorders.
Our findings highlight a functional relationship between subcortical motor and cortical
regions of the brain consistent with the models proposed by Graybiel (1997) and Ashby and
81
Waldron (2000). Specifically, subcortical motor regions may be involved in producing the
cognitive and psychiatric features of the schizophrenia spectrum disorders. In fact, structural and
functional neuroimaging studies reveal evidence for atrophy and lower metabolic rates in the
cerebellum of patients with schizophrenia (see Smith et al., 1999 for a review). Understanding
the relationship between neuromotor and neurocognitive functioning may help elucidate the
neural systems that contribute to the symptoms characteristic of schizophrenia spectrum
disorders. For example, Silver and Shlomo (2001) report that facial emotion identification
shares a common mechanism with visual reproduction and the ability to make rapid motor
movements and that impaired perceptual and speed related processes might underlie the
deficiency in perception of emotion resulting in ineffective social interactions.
Assuming our motor measures reflect basal ganglia functioning, our data appear to
support the Ashby and Waldron (2000) model. These results may aid in hypothesizing how
problems in subcortical-cortical pathways might result in psychotic symptoms (fixed delusions,
paranoia, avolition) as well as the cognitive deficits (attention, memory, coordination and
switching of thoughts) involved in SSDs. In conclusion, our data suggest that subcortical areas
may be as important as cortical areas in examining the etiology of SSDs.
Limitations
A primary limitation of the present study is the relatively small sample size, albeit an
acceptable size for research with clinical populations. The majority of the participants were
recruited via newspaper announcements in the Dallas-Fort-Worth Metroplex. Approximately
half way through data collection, a newspaper article publicized the study on Halloween. Given
the nature of the article and the focus on supernatural phenomena, it is possible this recruitment
procedure resulted in sample bias. Thus, it is possible that participants recruited through this
82

newspaper article have different symptom, motor and cognitive profiles.
Another limitation of the current study is the failure to control for TOD of testing. Group
by TOD interaction analyses are tenuous given that only three SPD participants were tested in
the afternoon. However, the motor and cognitive correlations controlling for TOD compared to
the correlations that do not control for TOD reveal that this variable likely impacted our findings.
Furthermore, previous research has indicated that TOD affects cognitive functioning in patients
with schizophrenia (D’Reaux et al., 2000). Our study offers preliminary evidence that TOD also
affects motor functioning in individuals with SPD.
Another limitation of the current study was the use of self-report in the identification of
participants with a family history of psychopathology. The range of reported family history of
psychopathology was variable. Participants reported both independently verifiable and alleged
diagnoses of depression, schizophrenia, and substance abuse in their first-degree relatives.
Several participants also reported having single or multiple family members who report having
unusual experiences (i.e., bodily illusions, magical thinking, experiences with the supernatural,
etc.). Thus, the family history of psychopathology variable was used in the current study as a
crude measure of vulnerability to psychopathology. However, inherent limitations to this
approach include the lack of independently verified presence or absence of family history and the
failure to account for single vs. multiple family members reported to have psychopathology.
History of head injury was found to significantly affect our results. However, like family
history of psychopathology, participants were identified based on self-report only. The
investigator attempted to gather specific information regarding the nature of the injury (i.e.,
severity, localization, loss of consciousness, hospitalization, follow-up evaluation.) However,
several participants were poor historians. Thus, identification of individuals with a history of
83

head injury may have resulted in false negatives or false positives, potentially reducing the effect
of this variable on the study’s findings. Finally, the current study conducted a large number of
analyses, potentially capitalizing on chance and increasing the likelihood of committing a Type I
error.
Future Directions
The present study warrants replication. Specifically, the robustness of the associations
between motor and cognitive functioning should be evaluated. One assumption of the current
study is that the instrumental motor task and Finger Tapping Test reflect basal ganglia
functioning. Functional brain imaging studies would test this assumption. In addition, future
studies should include TOD of testing as a factor in repeated measures designs to understand
how cognitive and motor performance varies over the course of the day. Moreover, it would be
interesting to incorporate measures of arousal such as cortisol levels to investigate the possible
role of TOD and arousal level on motor and cognitive functioning. Physiological mechanisms
that fluctuate on circadian rhythm schedules may help explain the heterogeneous nature of
neurocognitive functioning as well as neuromotor functioning in SSDs.
The current study investigated the associations between cognitive and motor functioning
across the entire sample. With a larger sample size, it would be interesting to examine the
similarities and differences between the covariance matrices between groups (i.e., do the motor
and cognitive variables covary in the same way for each group). Although the regression
analyses in the current study were non-significant, future studies should investigate how well the
cognitive and motor variables predict SPD symptoms. In addition, factor analytic studies should
be conducted to determine if different subtypes of SPD exist and if these subtypes exhibit
different symptom, cognitive, and motor profiles. Such findings may help explain the
84

heterogeneity in symptoms, cognitive functioning and motor functioning represented in the
literature.
Neuromotor and neurocognitive disturbances predate the emergence of psychosis (Rosso
et al., 2000). Future studies should investigate the ecological validity and utility of motor
assessments in identifying at-risk individuals. Moreover, longitudinal studies should be
conducted to investigate if motor functioning predicts treatment response. Rehabilitative
therapies that incorporate motor functioning should be developed and evaluated for their ability
to alter cognitive functioning via improvements in motor functioning.
Based on previous research and the current study’s findings, understanding the
relationship between disturbances in neuromotor and neurocognitive functioning may shed light
on the disturbed neural circuitry underlying SSDs. Furthermore, subcortical motor centers and
prefrontal cortical areas appear to operate together in the control of higher-order cognitive
functioning. Thus, if disruptions in frontal and subcortical circuits are both implicated in the
pathogenesis of SSDs, altering these subcortical-cortical pathways may help reduce the motor,
cognitive, emotional, and perceptual disturbances that are a hallmark of SSDs.
85

APPENDIX A
Tables
86

Table 1 Demographic Data of Participants SPD HC N N Gender Male 4 5 Female 8 16 Ethnicity Caucasian 11 18 African American 1 1 Hispanic 0 2 Handedness Left Hand Dominant 0 4 Right Hand Dominant 12 17 TOD of Testing A.M. 9 8 P.M. 3 13 Family Hx of Psychopathology No 6 16 Yes 6 5 Head Injury No 8 19 Yes 4 2 Note. Grouping of participants is based on SCID-II Interview ratings. Participants meeting 5 or more diagnostic criteria for SPD were grouped in the SPD group.
87
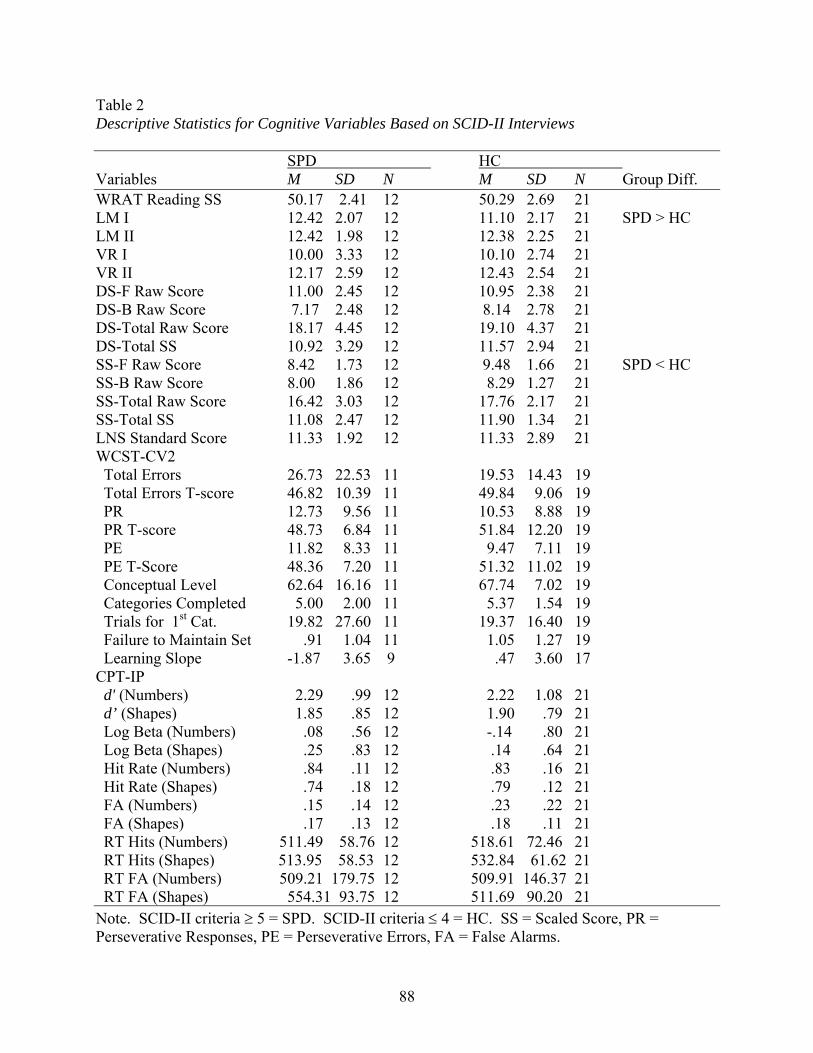
Table 2 Descriptive Statistics for Cognitive Variables Based on SCID-II Interviews SPD HC Variables M SD N M SD N Group Diff. WRAT Reading SS 50.17 2.41 12 50.29 2.69 21 LM I 12.42 2.07 12 11.10 2.17 21 SPD > HC LM II 12.42 1.98 12 12.38 2.25 21 VR I 10.00 3.33 12 10.10 2.74 21 VR II 12.17 2.59 12 12.43 2.54 21 DS-F Raw Score 11.00 2.45 12 10.95 2.38 21 DS-B Raw Score 7.17 2.48 12 8.14 2.78 21 DS-Total Raw Score 18.17 4.45 12 19.10 4.37 21 DS-Total SS 10.92 3.29 12 11.57 2.94 21 SS-F Raw Score 8.42 1.73 12 9.48 1.66 21 SPD < HC SS-B Raw Score 8.00 1.86 12 8.29 1.27 21 SS-Total Raw Score 16.42 3.03 12 17.76 2.17 21 SS-Total SS 11.08 2.47 12 11.90 1.34 21 LNS Standard Score 11.33 1.92 12 11.33 2.89 21 WCST-CV2 Total Errors 26.73 22.53 11 19.53 14.43 19 Total Errors T-score 46.82 10.39 11 49.84 9.06 19 PR 12.73 9.56 11 10.53 8.88 19 PR T-score 48.73 6.84 11 51.84 12.20 19 PE 11.82 8.33 11 9.47 7.11 19 PE T-Score 48.36 7.20 11 51.32 11.02 19 Conceptual Level 62.64 16.16 11 67.74 7.02 19 Categories Completed 5.00 2.00 11 5.37 1.54 19 Trials for 1st Cat. 19.82 27.60 11 19.37 16.40 19 Failure to Maintain Set .91 1.04 11 1.05 1.27 19 Learning Slope -1.87 3.65 9 .47 3.60 17 CPT-IP d' (Numbers) 2.29 .99 12 2.22 1.08 21 d’ (Shapes) 1.85 .85 12 1.90 .79 21 Log Beta (Numbers) .08 .56 12 -.14 .80 21 Log Beta (Shapes) .25 .83 12 .14 .64 21 Hit Rate (Numbers) .84 .11 12 .83 .16 21 Hit Rate (Shapes) .74 .18 12 .79 .12 21 FA (Numbers) .15 .14 12 .23 .22 21 FA (Shapes) .17 .13 12 .18 .11 21 RT Hits (Numbers) 511.49 58.76 12 518.61 72.46 21 RT Hits (Shapes) 513.95 58.53 12 532.84 61.62 21 RT FA (Numbers) 509.21 179.75 12 509.91 146.37 21 RT FA (Shapes) 554.31 93.75 12 511.69 90.20 21 Note. SCID-II criteria ≥ 5 = SPD. SCID-II criteria ≤ 4 = HC. SS = Scaled Score, PR = Perseverative Responses, PE = Perseverative Errors, FA = False Alarms.
88

Table 3 Descriptive Statistics for Motor Variables (mV and ms) for the Left Hand Based on SCID-II Interviews SPD HC Variables M SD N M SD N Group Diff. BaselineForce .12 0.02 12 0.12 0.02 19 Force Variability 0 .01 0.00 12 0.01 0.00 190 Force Variability (s.e.) .02 0.01 12 0.02 0.01 19 Prestimulus Force(unimanual) .12 0.03 12 0.12 0.02 19 Force Variability(uni) 0.01 0.00 12 0.02 0.01 19 Force Variability (s.e) (uni) 0.02 0.01 12 0.03 0.01 19 Force (bimanual) LH .08 0.02 12 0.09 0.02 21 Force Variability (bi) LH .01 0.01 12 0.02 0.02 21 Force (bi) RH .10 0.03 12 0.10 0.02 21 Force Variability (bi) RH .03 0.01 12 0.03 0.01 21 0 Motor Response Force (unimanual) .25 0.09 12 0.31 0.10 19 SPD < HC Force Variability (uni) .12 0.05 12 0.15 0.06 190 Force (bimanual) .32 0.12 11 0.31 0.10 21 Force Variability (bi) .11 0.08 11 0.08 0.06 21 Response Duration (bi) 587.25 490.25 11 667.58 372.26 21 Response TotalForce .57 0.17 11 0.62 0.17 19 Force Variability .22 0.08 11 0.24 0.10 19 Motor Overflow .15 0.24 12 0.05 0.21 21 Omissions .75 2.00 12 0.95 1.22 19 Travel Time 687.78 131.57 12 610.38 161.98 19 Travel Time Variability 115.31 27.93 1 145.72 118.15 19 Finger Tapping TestLeft index finger 44.38 8.30 12 46.43 6.82 21 0 Note. SCID-II criteria ≥ 5 = SPD. SCID-II criteria ≤ 4 = HC. * Motor overflow represents the mean correlation of applied pressure between two hands during all left- or right-hand responses; the greater the positive correlation, the more overflow in the non-responding hand.
89
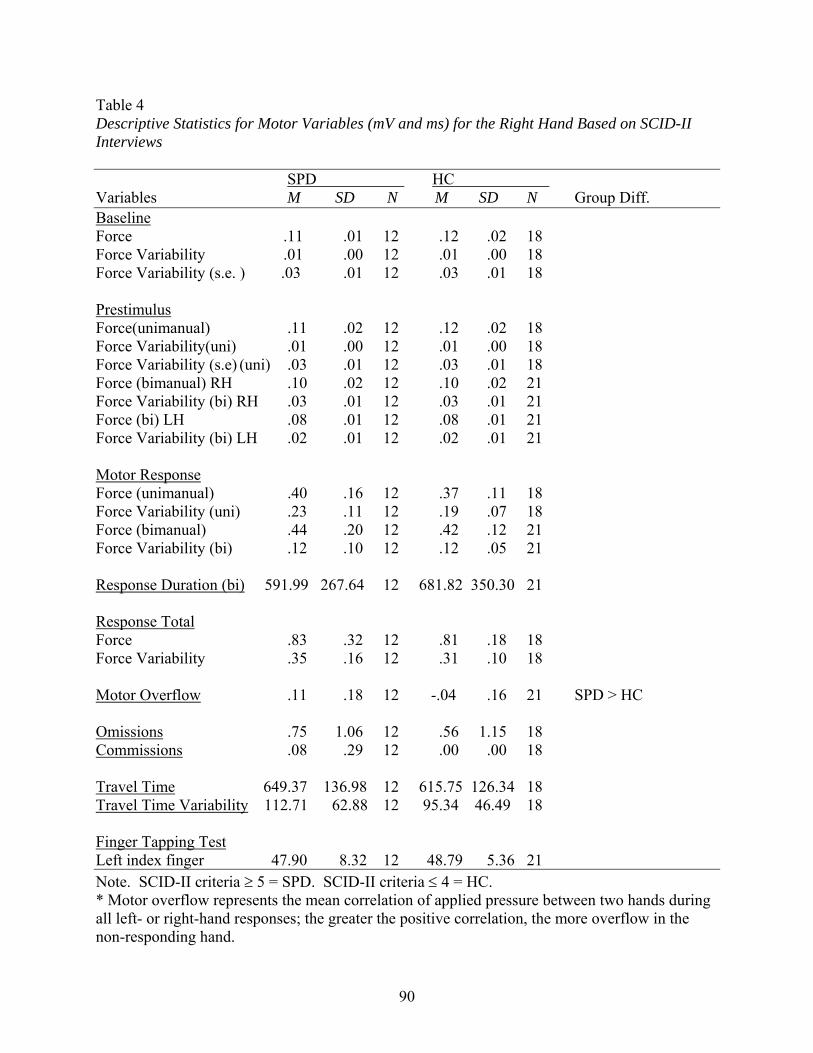
Table 4 Descriptive Statistics for Motor Variables (mV and ms) for the Right Hand Based on SCID-II Interviews SPD HC Variables M SD N M SD N Group Diff. BaselineForce 0.11 0.01 12 0.12 0.02 180 Force Variability 0.01 0.00 12 0.01 0.00 180 Force Variability (s.e. ) 0.03 0.01 12 0.03 0.01 180 Prestimulus Force(unimanual) 0 .11 0.02 12 0.12 0.02 180 Force Variability(uni) .01 0.00 12 0.01 0.00 180 Force Variability (s.e) (uni) .03 0.01 12 0.03 0.01 180 Force (bimanual) RH .10 0.02 12 0.10 0.02 210 Force Variability (bi) RH .03 0.01 12 0.03 0.01 21 Force (bi) LH .08 0.01 12 0.08 0.01 21 Force Variability (bi) LH .02 0.01 12 0.02 0.01 210 0 Motor Response Force (unimanual) .40 0.16 12 0.37 0.11 180 Force Variability (uni) .23 0.11 12 0.19 0.07 18 Force (bimanual) .44 0.20 12 0.42 0.12 210 Force Variability (bi) .12 0.10 12 0.12 0.05 21 0 Response Duration (bi) 591.99 267.64 12 681.82 350.30 21 Response TotalForce .83 0.32 12 0.81 0.18 180 Force Variability .35 0.16 12 0.31 0.10 180 Motor Overflow .11 0.18 12 -.04 0.16 21 SPD > HC Omissions .75 1.06 12 0.56 1.15 18 Commissions .08 0.29 12 0.00 0.00 18 0 Travel Time 649.37 136.98 12 615.75 126.34 18 Travel Time Variability 112.71 62.88 12 95.34 46.49 18 Finger Tapping TestLeft index finger 47.90 8.32 12 48.79 5.36 21 Note. SCID-II criteria ≥ 5 = SPD. SCID-II criteria ≤ 4 = HC. * Motor overflow represents the mean correlation of applied pressure between two hands during all left- or right-hand responses; the greater the positive correlation, the more overflow in the non-responding hand.
90

Table 5 Descriptive Statistics for Motor Variables by TOD Based on SCID-II Interviews SPD HC Variables M SD N M SD N LH Force A.M. .61 .17 8 .64 .19 6 P.M. .44 .14 3 .61 .16 13 LH Force Var. A.M. .25 .07 8 .27 .12 6 P.M. .14 .03 3 .22 .08 13 LH Motor Overflow A.M. .15 .25 9 .00 .21 8 P.M. .15 .29 3 .07 .21 13 RH Force A.M. .91 .31 9 .78 .15 6 P.M. .61 .28 3 .82 .20 12 RH Force Var A.M. .39 .15 9 .29 .07 6 P.M. .22 .11 3 .32 .10 12 RH Motor Overflow A.M. .07 .18 9 -.06 .15 8 P.M. .21 .18 3 -.03 .16 13 Note. SCID-II criteria ≥ 5 = SPD. SCID-II criteria ≤ 4 = HC. LH = Left Hand, RH = Right Hand.
91

Table 6 Descriptive Statistics for Motor Variables Based on SCID-II Interviews (No Head Injury Sample) SPD HC HC Variables M SD N M SD N Group Diff. LH Force 0.64 0.14 8 0.63 0.17 17 LH Force Variability 0.25 0.08 8 0.24 0.10 17 LH Motor Overflow 0.19 0.27 8 0.05 0.22 19 RH Force 0.99 0.25 8 0.82 -.17 16 SPD > HC RH Force Variability 0.42 0.13 8 0.33 0.08 16 SPD > HC RH Motor Overflow 0.14 0.18 8 -.02 0.14 19 SPD > HC Note. SCID-II criteria ≥ 5 = SPD. SCID-II criteria ≤ 4 = HC. LH = Left Hand, RH = Right Hand.
92
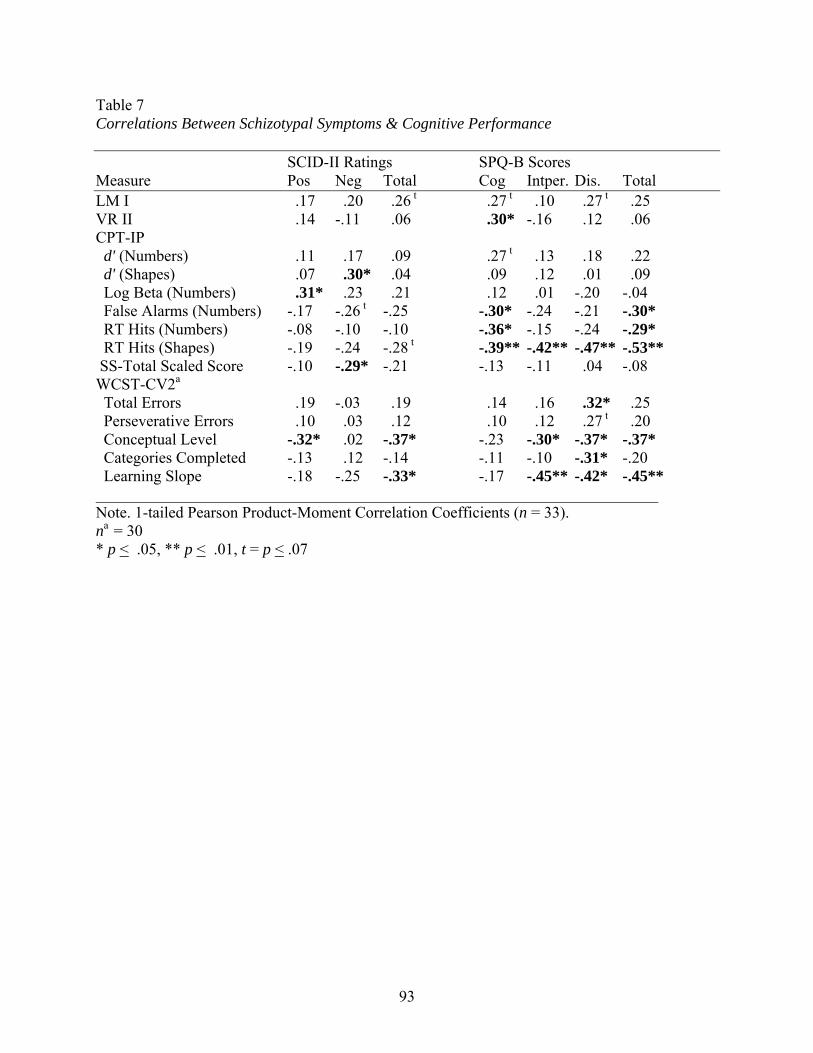
Table 7 Correlations Between Schizotypal Symptoms & Cognitive Performance SCID-II Ratings SPQ-B Scores Measure Pos Neg Total Cog Intper. Dis. Total LM I 0.17 0.20 0.26 t 0.27 t 0.10 0.27 t 0.25
VR II 0.14 -.11 0.06 0.30* -.16 0.12 0.06 CPT-IP d' (Numbers) 0.11 0.17 0.09 0.27 t 0.13 0.18 0.22 d' (Shapes) 0.07 0.30* 0.04 0.09 0.12 0.01 0.09 Log Beta (Numbers) 0.31* 0.23 0.21 0.12 0.01 -.20 -.04 False Alarms (Numbers) -.17 -.26 t -.25 -.30* -.24 -.21 -.30* RT Hits (Numbers) -.08 -.10 -.10 -.36* -.15 -.24 -.29* RT Hits (Shapes) -.19 -.24 -.28 t -.39** -.42** -.47** -.53** SS-Total Scaled Score -.10 -.29* -.21 -.13 -.11 0.04 -.08 WCST-CV2a
Total Errors 0.19 -.03 0.19 0.14 0.16 0.32* 0.25 Perseverative Errors 0.10 0.03 0.12 0.10 0.12 0.27 t 0.20 Conceptual Level -.32* 0.02 -.37* -.23 -.30* -.37* -.37* Categories Completed -.13 0.12 -.14 -.11 -.10 -.31* -.20 Learning Slope -.18 -.25 -.33* -.17 -.45** -.42* -.45** Note. 1-tailed Pearson Product-Moment Correlation Coefficients (n = 33). na = 30 * p < .05, ** p < .01, t = p < .07
93
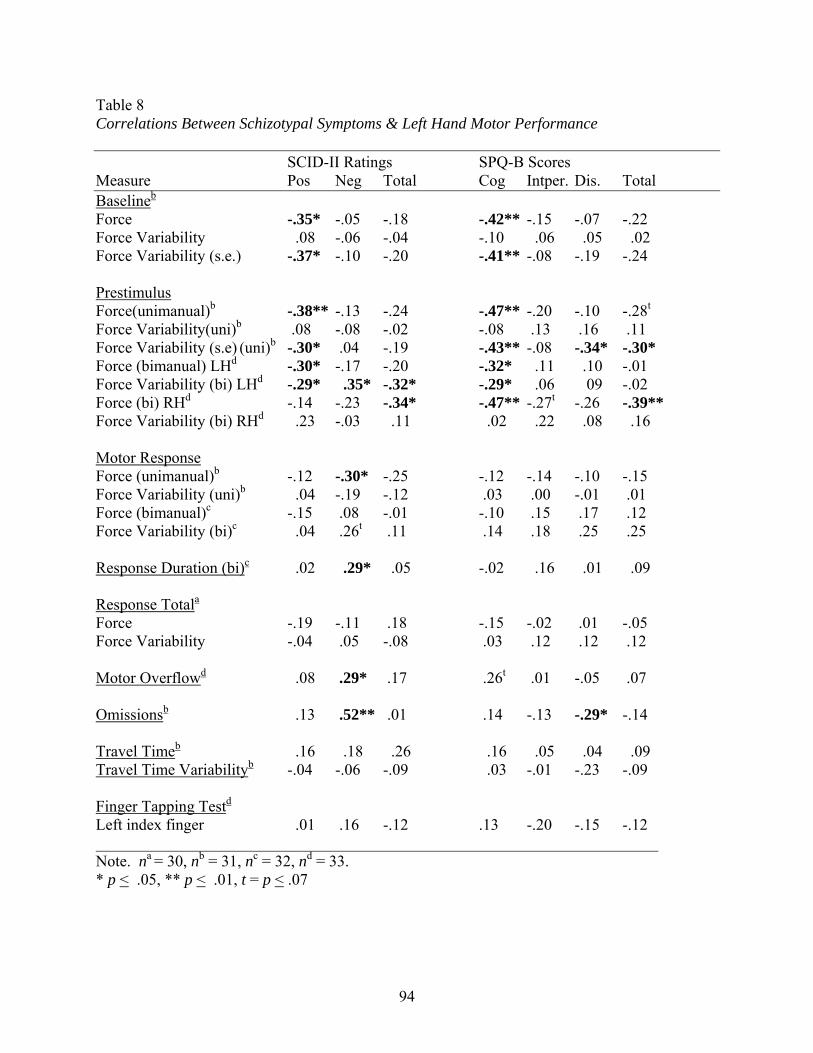
Table 8 Correlations Between Schizotypal Symptoms & Left Hand Motor Performance SCID-II Ratings SPQ-B Scores Measure Pos Neg Total Cog Intper. Dis. Total Baselineb
Force -.35* -.05 -.18 -.42** -.15 -.07 -.22 Force Variability 0.08 -.06 -.04 -.10 .06 .05 .02 Force Variability (s.e.) -.37* -.10 -.20 -.41** -.08 -.19 -.24 Prestimulus Force(unimanual)b -.38** -.13 -.24 -.47** -.20 -.10 -.28t
Force Variability(uni)b .08 -.08 -.02 -.08 .13 .16 .11 Force Variability (s.e) (uni)b -.30* .04 -.19 -.43** -.08 -.34* -.30* Force (bimanual) LHd -.30* -.17 -.20 -.32* 0.11 0.10 -.01 Force Variability (bi) LHd -.29* 0.35* -.32* -.29* 0.06 0.09 -.02 Force (bi) RHd -.14 -.23 -.34* -.47** -.27t -.26 -.39** Force Variability (bi) RHd 0.23 -.03 0.11 0.02 0.22 0.08 0.16 Motor Response Force (unimanual)b -.12 -.30* -.25 -.12 -.14 -.10 -.15 Force Variability (uni)b 0.04 -.19 -.12 .03 .00 -.01 .01 Force (bimanual)c -.15 .08 -.01 -.10 .15 .17 .12 Force Variability (bi)c 0.04 .26t .11 .14 .18 .25 .25 Response Duration (bi)c 0.02 0.29* 0.05 -.02 0.16 0.01 0.09 Response Totala
Force -.19 -.11 .18 -.15 -.02 .01 -.05 Force Variability -.04 .05 -.08 .03 .12 .12 .12 Motor Overflowd 0.08 .29* .17 .26t .01 -.05 .07 Omissionsb 0.13 .52** .01 .14 -.13 -.29* -.14 Travel Timeb 0.16 0.18 0.26 0.16 0.05 0.04 0.09 Travel Time Variabilityb -.04 -.06 -.09 0.03 -.01 -.23 -.09 Finger Tapping Testd
Left index finger 0.01 .16 -.12 .13 -.20 -.15 -.12 Note. na = 30, nb = 31, nc = 32, nd = 33. * p < .05, ** p < .01, t = p < .07
94
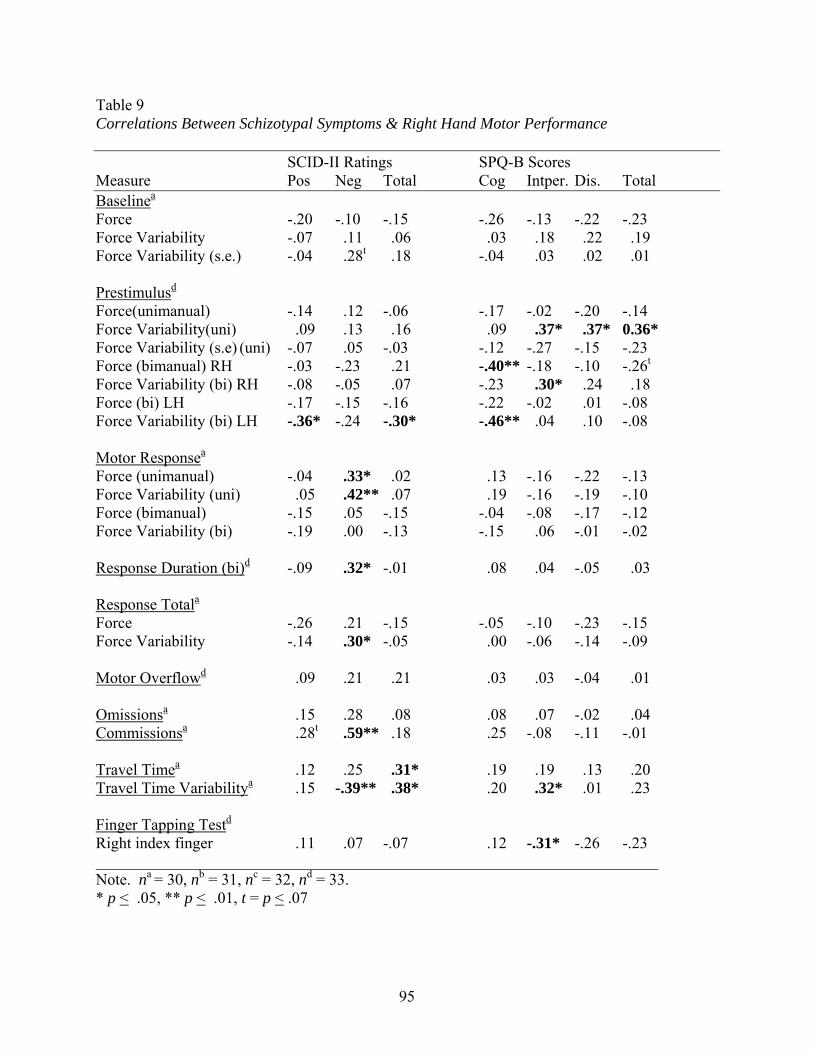
Table 9 Correlations Between Schizotypal Symptoms & Right Hand Motor Performance SCID-II Ratings SPQ-B Scores Measure Pos Neg Total Cog Intper. Dis. Total Baselinea
Force -.20 -.10 -.15 -.26 -.13 -.22 -.23 Force Variability -.07 0.11 0.06 0.03 0.18 0.22 0.190 Force Variability (s.e.) -.04 0.28t 0.18 -.04 0.03 0.02 0.01 Prestimulusd
Force(unimanual) -.14 0.12 -.06 -.17 -.02 -.20 -.14 Force Variability(uni) 0.09 0.13 0.16 0.09 0.37* 0.37* 0.36* Force Variability (s.e) (uni) -.07 0.05 -.03 -.12 -.27 -.15 -.23 Force (bimanual) RH -.03 -.23 0.21 -.40** -.18 -.10 -.26t Force Variability (bi) RH -.08 -.05 0.07 -.23 0.30* 0.24 0.18 Force (bi) LH -.17 -.15 -.16 -.22 -.02 0.01 -.08 Force Variability (bi) LH -.36* -.24 -.30* -.46** 0.04 0.10 -.08 Motor Responsea
Force (unimanual) -.04 0.33* 0.02 0.13 -.16 -.22 -.13 Force Variability (uni) 0.05 0.42** 0.07 0.19 -.16 -.19 -.100 Force (bimanual) -.15 0.05 -.15 -.04 -.08 -.17 -.12 Force Variability (bi) -.19 0.00 -.13 -.15 0.06 -.01 -.02 Response Duration (bi)d -.09 0.32* -.01 0.08 0.04 -.05 0.03 Response Totala Force -.26 0.21 -.15 -.05 -.10 -.23 -.15 Force Variability -.14 0.30* -.05 0.00 -.06 -.14 -.09 Motor Overflowd 0.09 0.21 0.21 0.03 0.03 -.04 0.010 Omissionsa 0.15 0.28 0.08 0.08 0.07 -.02 0.04 Commissionsa 0.28t 0.59** 0.18 0.25 -.08 -.11 -.01 Travel Timea 0.12 0.25 0.31* 0.19 0.19 0.13 0.20 Travel Time Variabilitya 0.15 -.39** 0.38* 0.20 0.32* 0.01 0.23 Finger Tapping Testd
Right index finger 0.11 0.07 -.07 0.12 -.31* -.26 -.23 Note. na = 30, nb = 31, nc = 32, nd = 33. * p < .05, ** p < .01, t = p < .07
95

Table 10 Correlations Between Left Hand Motor Variables and Cognitive Variables Motor
Respn Force (uni)
Motor Respn Force Var. (uni)
Motor Respn Force (bi)
Motor Respn Force Var. (bi)
Total Respn Force
Total Respn Force Var.
Motor Overflow
FTT
LMI 0.33*f -.19f. 0.15g 0.34*g -.05e 0.07e 0.01h 0.20hLM II -.10f -.05f 0.26t
g 0.36*g 0.15e 0.17e 0.08h 0.08hVR I 0.07f 0.03f 0.00g 0.01g 0.10e -.03e 0.21h 0.13hVR II -.12f -.04f 0.03g 0.04g -.06e -.05e 0.00h 0.12hDS-B Raw Score 0.37*f 0.35*f 0.17g 0.11g 0.36*e .34*e -.13h 0.26t
hDS-Tot Raw Score 0.18f 0.20f 0.16g 0.03g 0.23e 0.19e -.17h 0.26t
hDS-Tot Scaled Score 0.15f 0.15f 0.18g 0.02g 0.23e 0.15e -.17h 0.26t
hSS-F Raw Score 0.15f 0.19f 0.43**g 0.40**g 0.38*e 0.39*e -.28t
h 0.43**hSS-Tot Raw Score 0.16f 0.19f 0.28t
g 0.19g 0.28te 0.26e -.24h 0.39*h
SS-Tot Scaled Score 0.19f 0.17f 0.26g 0.12g 0.28te 0.18e 0.11h 0.20h
WCST-CV2 Total Errors -.07d 0.01d -.11d -.01d -.19c -.12d 0.13e -.34*eTotal Errors T-Score 0.19d 0.13d 0.26d -.11d 0.35*d 0.29t
d -.17e 0.30*ePR -.07d 0.04d -.02d 0.16d -.07d 0.08d 0.04e -.13ePR (T-Score) 0.28t
d 0.27d 0.29td 0.04d 0.38*d 0.31*d -.20e 0.18e
PE -.09d 0.01d -.03d 0.14d -.10d 0.05d 0.05e -.13ePE (T-Score) 0.28t
d 0.24d 0.28td 0.01d -.38*d 0.28t
d -.18e 0.15eConceptual Level -.06d -.12d -.02d -.10d 0.04d -.02d -.03e 0 .30*eCategories Compl. 0.02d 0.02d 0.09d 0.10d 0.12d 0.18d -.16e 0 .33*eTrials for 1st Cat. 0.09d 0.10d -.08d -.13d -.07d -.18d -.26e -45**eFail to Maintain Set 0.04d -.03d 0.03d -.04d 0.07d 0.07d 0.29t
e 0.01eLearning Slope 0.06d -.02d -.15a -.23a -.07d -.21d 0.14a -.13a CPT-IP d’ (Numbers) 0.16f 0.29*f .13g .10g .22e .25e .02h .43**hd’ (Shapes) -.08f 0.08f .21g .23g .14e .25e -.26t
h .43**hLog Beta (Numbers) -.23f -.15f -.30*g -.16g -.33*e -.19e -.01h -.28t
hLog Beta (Shapes) 0.01f 0.01f -.37*g -.27g -.24e -.21e -.03h -.03hHit Rate (Numbers) 0.19f 0.24f .25g .22g .30*e .29t
e .05h .54**hHit Rate (Shapes) -.02f .06f .39*g -.36*g .29*e .36*e -.22h .47**hFA (Numbers) -.12f -.22f -.05g -.16g -.14e -.27t
e -.05h -.38*hFA (Shapes) 0.06f -.08f .08g -.03g .03e -.09e .27t
h -.26th
RT Hit (Numbers) -.15f -.28tf -.21g -.18g -.23e -.24e -.14h -.49**h
RT FA (Shapes) -.28tf -.27t
f -.06g -.06g -.19e -.16e -.28th .14h
Note. 1-tailed Pearson Product-Moment Correlation Coefficients. FA = False Alarms * p < .05, ** p < .01, t = p < .07. na
= 26, nb = 27, nc = 28, nd = 29, ne = 30, nf = 31, ng = 32, nh =33.
96
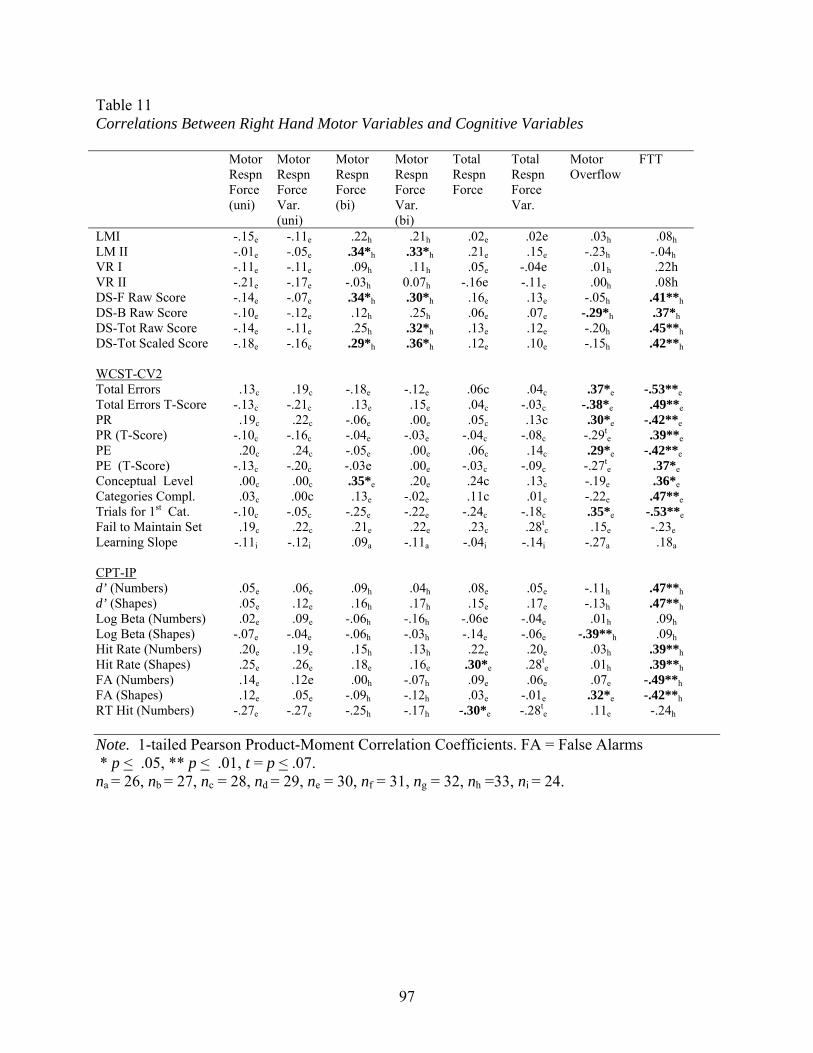
Table 11 Correlations Between Right Hand Motor Variables and Cognitive Variables Motor
Respn Force (uni)
Motor Respn Force Var. (uni)
Motor Respn Force (bi)
Motor Respn Force Var. (bi)
Total Respn Force
Total Respn Force Var.
Motor Overflow
FTT
LMI -.15e -.11e 0.22h 0.21h 0.02e 0.02e 0.03h 0.08hLM II -.01e -.05e 0.34*h 0.33*h 0.21e 0.15e -.23h -.04hVR I -.11e -.11e 0.09h 0.11h 0.05e -.04e 0.01h 0.22h VR II -.21e -.17e -.03h 0.07h -.16e -.11e 0.00h 0.08h DS-F Raw Score -.14e -.07e 0.34*h 0.30*h 0.16e 0.13e -.05h 0.41**hDS-B Raw Score -.10e -.12e 0.12h 0.25h 0.06e 0.07e -.29*h 0.37*hDS-Tot Raw Score -.14e -.11e 0.25h 0.32*h 0.13e 0.12e -.20h 0.45**hDS-Tot Scaled Score -.18e -.16e 0.29*h 0.36*h 0.12e 0.10e -.15h 0.42**h WCST-CV2 Total Errors 0.13c 0.19c -.18e -.12e 0.06c 0.04c 0.37*e -.53**eTotal Errors T-Score -.13c -.21c 0.13e 0.15e 0.04c -.03c -.38*e 0.49**ePR 0.19c 0.22c -.06e 0.00e 0.05c 0.13c 0.30*e -.42**ePR (T-Score) -.10c -.16c -.04e -.03e -.04c -.08c -.29t
e 0.39**ePE 0.20c 0.24c -.05e 0.00e 0.06c 0.14c 0.29*e -.42**ePE (T-Score) -.13c -.20c -.03e 0.00e -.03c -.09c -.27t
e 0.37*eConceptual Level 0.00c 0.00c 0.35*e 0.20e 0.24c 0.13c -.19e 0.36*eCategories Compl. 0.03c 0.00c 0.13e -.02e 0.11c 0.01c -.22e 0.47**eTrials for 1st Cat. -.10c -.05c -.25e -.22e -.24c -.18c 0.35*e -.53**eFail to Maintain Set 0.19c 0.22c 0.21e 0.22e 0.23c 0.28t
c 0.15e -.23eLearning Slope -.11i -.12i 0.09a -.11a -.04i -.14i -.27a .18a CPT-IP d’ (Numbers) 0.05e 0.06e 0.09h 0.04h 0.08e 0.05e -.11h .47**hd’ (Shapes) 0.05e 0.12e 0.16h 0.17h 0.15e 0.17e -.13h .47**hLog Beta (Numbers) 0.02e 0.09e -.06h -.16h -.06e -.04e 0.01h .09hLog Beta (Shapes) -.07e -.04e -.06h -.03h -.14e -.06e -.39**h .09hHit Rate (Numbers) 0.20e 0.19e 0.15h 0.13h 0.22e 0.20e 0.03h .39**hHit Rate (Shapes) 0.25e 0.26e 0.18e 0.16e 0.30*e 0.28t
e 0.01h .39**hFA (Numbers) 0.14e 0.12e 0.00h -.07h 0.09e 0.06e 0.07e -.49**hFA (Shapes) 0.12e 0.05e -.09h -.12h 0.03e -.01e 0.32*e -.42**hRT Hit (Numbers) -.27e -.27e -.25h -.17h -.30*e -.28t
e 0.11e -.24h Note. 1-tailed Pearson Product-Moment Correlation Coefficients. FA = False Alarms * p < .05, ** p < .01, t = p < .07. na
= 26, nb = 27, nc = 28, nd = 29, ne = 30, nf = 31, ng = 32, nh =33, ni = 24.
97
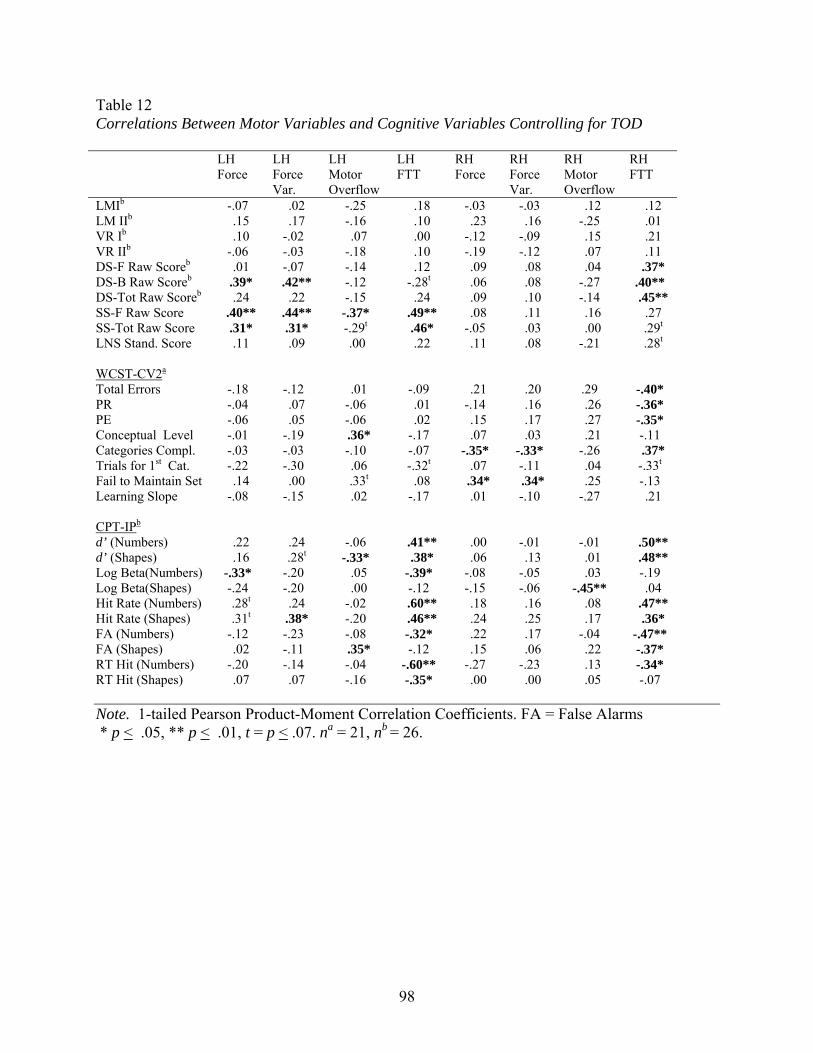
Table 12 Correlations Between Motor Variables and Cognitive Variables Controlling for TOD LH
Force LH Force Var.
LH Motor Overflow
LH FTT
RH Force
RH Force Var.
RH Motor Overflow
RH FTT
LMIb -.07 0.02 -.25 0.18 -.03 -.03 0.12 0.12 LM IIb 0.15 0.17 -.16 0.10 0.23 0.16 -.25 0.01 VR Ib 0.10 -.02 0.07 0.00 -.12 -.09 0.15 0.21 VR IIb -.06 -.03 -.18 0.10 -.19 -.12 0.07 0.11 DS-F Raw Scoreb 0.01 -.07 -.14 0.12 0.09 0.08 0.04 0.37* DS-B Raw Scoreb 0.39* 0.42** -.12 -.28t 0.06 0.08 -.27 .40** DS-Tot Raw Scoreb 0.24 0.22 -.15 0.24 0.09 0.10 -.14 0.45** SS-F Raw Score 0.40** 0.44** -.37* 0.49** 0.08 0.11 0.16 0.27 SS-Tot Raw Score 0.31* 0.31* -.29t 0.46* -.05 0.03 0.00 0.29t
LNS Stand. Score 0.11 0.09 000.00.00 0.22 0.11 0.08 -.21 0.28t
WCST-CV2a Total Errors -.18 -.12 0.01 -.09 0.21 0.20 .29 -.40* PR -.04 0.07 -.06 0.01 -.14 0.16 0.26 -.36* PE -.06 0.05 -.06 0.02 0.15 0.17 0.27 -.35* Conceptual Level -.01 -.19 0.36* -.17 0.07 0.03 0.21 -.11 Categories Compl. -.03 -.03 -.10 -.07 -.35* -.33* -.26 0.37* Trials for 1st Cat. -.22 -.30 0.06 -.32t 0.07 -.11 0.04 -.33t
Fail to Maintain Set 0.14 0.00 0.33t 0.08 0.34* 0.34* 0.25 -.13 Learning Slope -.08 -.15 0.02 -.17 0.01 -.10 -.27 0.21 CPT-IPb d’ (Numbers) 0.22 0.24 -.06 0.41** 0.00 -.01 -.01 .50** d’ (Shapes) 0.16 0.28t -.33* 0.38* 0.06 0.13 0.01 0.48** Log Beta(Numbers) -.33* -.20 0.05 -.39* -.08 -.05 0.03 -.19 Log Beta(Shapes) -.24 -.20 0.00 -.12 -.15 -.06 -.45** 0.04 Hit Rate (Numbers) 0.28t 0.24 -.02 0.60** 0.18 0.16 0.08 0.47** Hit Rate (Shapes) 0.31t 0.38* -.20 0.46** 0.24 0.25 0.17 0.36* FA (Numbers) -.12 -.23 -.08 -.32* 0.22 0.17 -.04 -.47** FA (Shapes) 0.02 -.11 0.35* -.12 0.15 0.06 0.22 -.37* RT Hit (Numbers) -.20 -.14 -.04 -.60** -.27 -.23 0.13 -.34* RT Hit (Shapes) 0.07 0.07 -.16 -.35* 0.00 0.00 0.05 -.07 Note. 1-tailed Pearson Product-Moment Correlation Coefficients. FA = False Alarms * p < .05, ** p < .01, t = p < .07. na = 21, nb = 26.
98

Table 13 Correlations Between TOD, Head Injury, and Family History of Psychopathology with Motor, Cognitive, and Symptom Variables Measure TOD Head Injury Family Hx Motor LH Forcea -.14 -.43** -.10 LH Force Variabilitya -.31* -.35* 0.03 LH Motor Overflowd 0.01 -.05 -.17LH FTTd 0.00 -.44** -.20 RH Forcea -.19 -.54** -.16 RH Force Variabilitya -.20 -.53** -.07 RH Motor Overflowd 0.01 -.14 -.11 0 RH FTTd 0.00 -.24 -.14 Cognitive LM Id -.10 -.16 -.04 LM IId -.04 -.13 0.05 VR Id 0.11 -.12 0.14 VR IId 0.07 -.03 0.11 SS-Totald 0.11 -.30* 0.13 LNS Standard Scored 0.36* 0.09 -.09 WCST-CV2a
Total Errors -.26 0.02 0.46** PR -.27t -.14 0.32* PE -.30* -.14 0.36* Conceptual Level 0.07 -.32* -.42** Categories Completed 0.11 -.02 -.40* Failure to Maintain Set 0.06 -.36* 0.00 Learning Slope 0.14 0.00 -.33* CPT-IPd
d' (Numbers) -.02 -.20 -.29* d’ (Shapes) 0.13 -.32* -.16 Hit Rate (Numbers) -.15 -.40** -.32* Hit Rate (Shapes) 0.07 -.50** -.35* RT Hits (Numbers) 0.32* 0.26t -.09 RT Hits (Shapes) 0.35* 0.01 -.14 Symptomsd
SPQ- Total -.46** 0.38* 0.40** SCID-SPD Total -.19 0.41** 0.43** Borderline -.01 0.57** 0.14 Paranoid -.26 0.30* 0.25t
Schizoid -.11 -.10 -.10 Note. PR = Perseverative Responses, PE = Perseverative Errors; LH = Left Hand, RH= Right Hand; na = 30, nb = 31, nc = 32, nd = 33; * p < .05, ** p < .01, t = p < .07
99

APPENDIX B
Figures
100
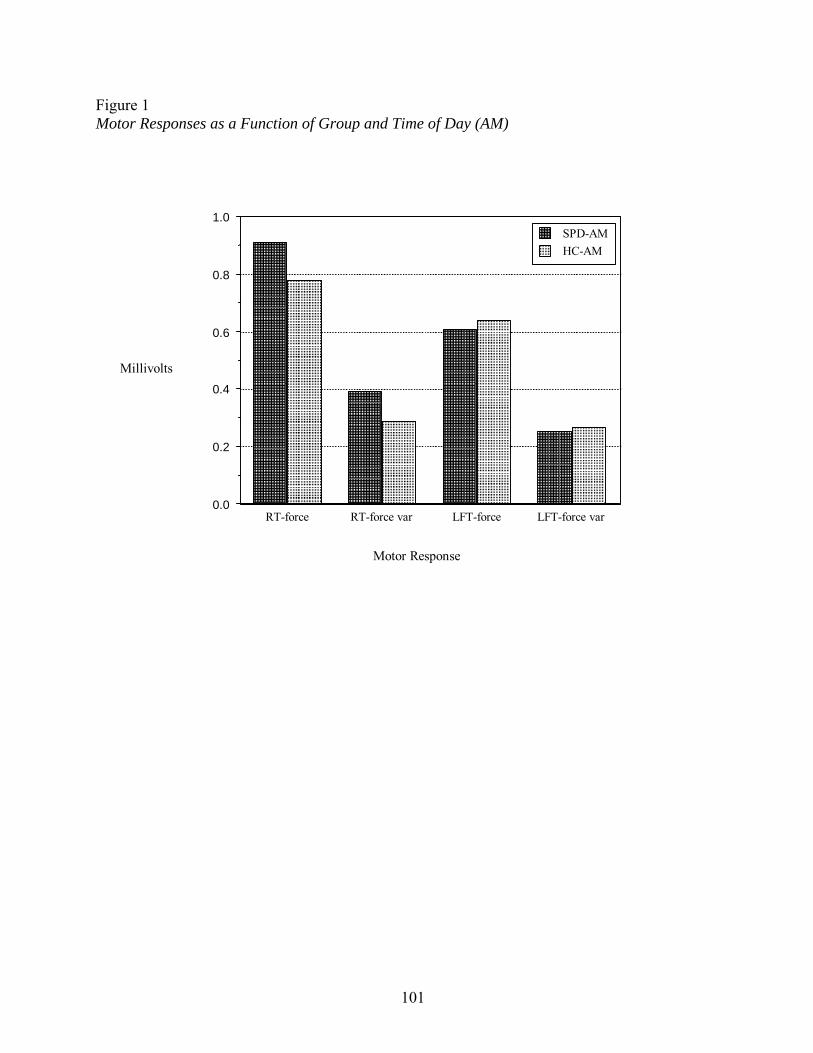
Figure 1 Motor Responses as a Function of Group and Time of Day (AM)
RT-force RT-force var LFT-force LFT-force var 0.0
0.2
0.4
0.6
0.8
1.0 SPD-AM HC-AM
Motor Response
Millivolts
101

Figure 2 Motor Responses as a Function of Time of Day (PM)
RT-force RT-force var LFT-force LFT-force var 0.0
0.2
0.4
0.6
0.8
1.0 SPD-PM HC-PM
Motor Response
Millivolts
102

Figure 3 Motor Overflow as a Function of Group and Time of Day
RT rspn-Overflow LFT rspn-Overflow-0.3
-0.2
-0.1
0.0
0.1
0.2
0.3
SPD.AMSPD.PMHC.AMHC.PM
Motor Overflow
Overflow (Millivolts)
103
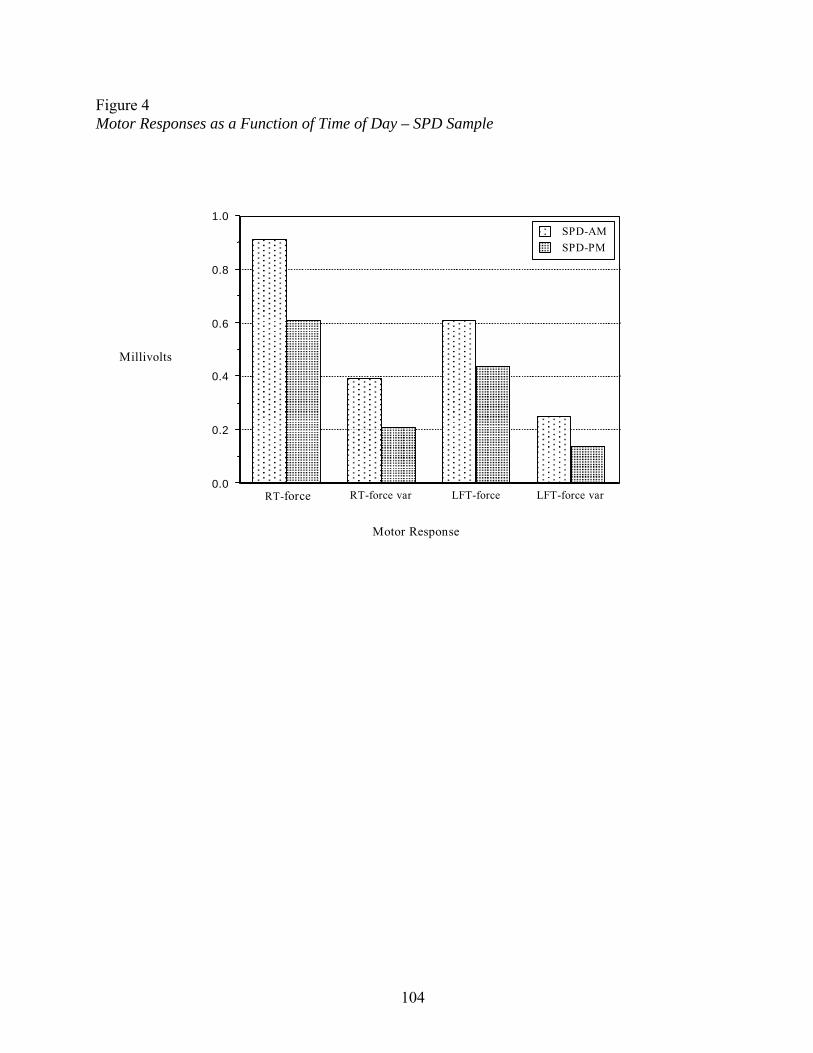
Figure 4 Motor Responses as a Function of Time of Day – SPD Sample
RT-force RT-force var LFT-force LFT-force var 0.0
0.2
0.4
0.6
0.8
1.0 SPD-AM SPD-PM
Motor Response
Millivolts
104
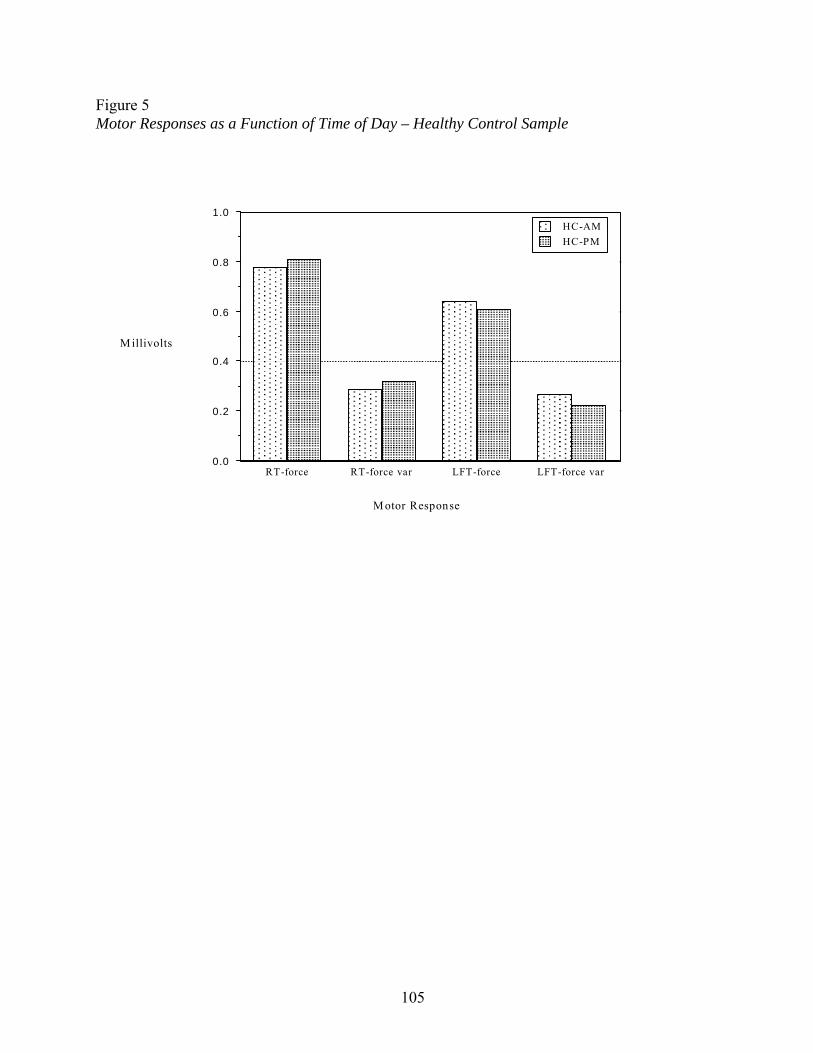
Figure 5 Motor Responses as a Function of Time of Day – Healthy Control Sample
RT-force RT-force var LFT-force LFT-force var 0.0
0.2
0.4
0.6
0.8
1.0 HC-AM HC-PM
M otor Response
M illivolts
105
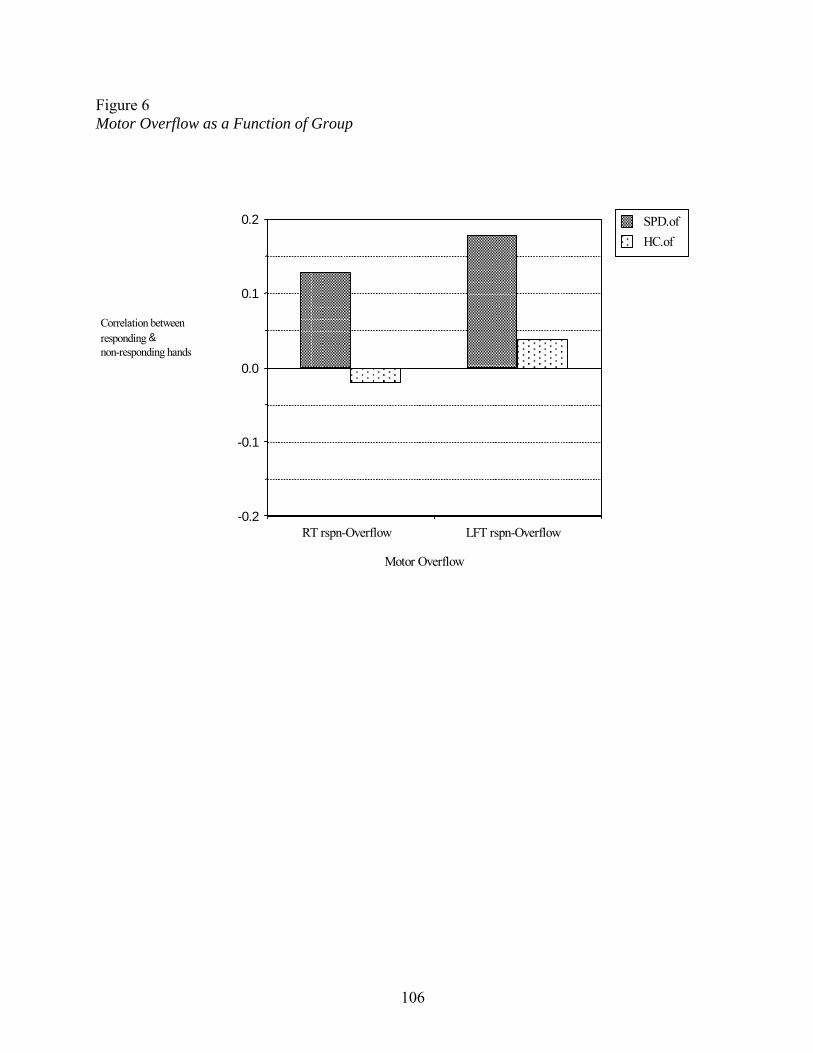
Figure 6 Motor Overflow as a Function of Group
RT rspn-Overflow LFT rspn-Overflow-0.2
-0.1
0.0
0.1
0.2 SPD.ofHC.of
Motor Overflow
Correlation between responding & non-responding hands
106
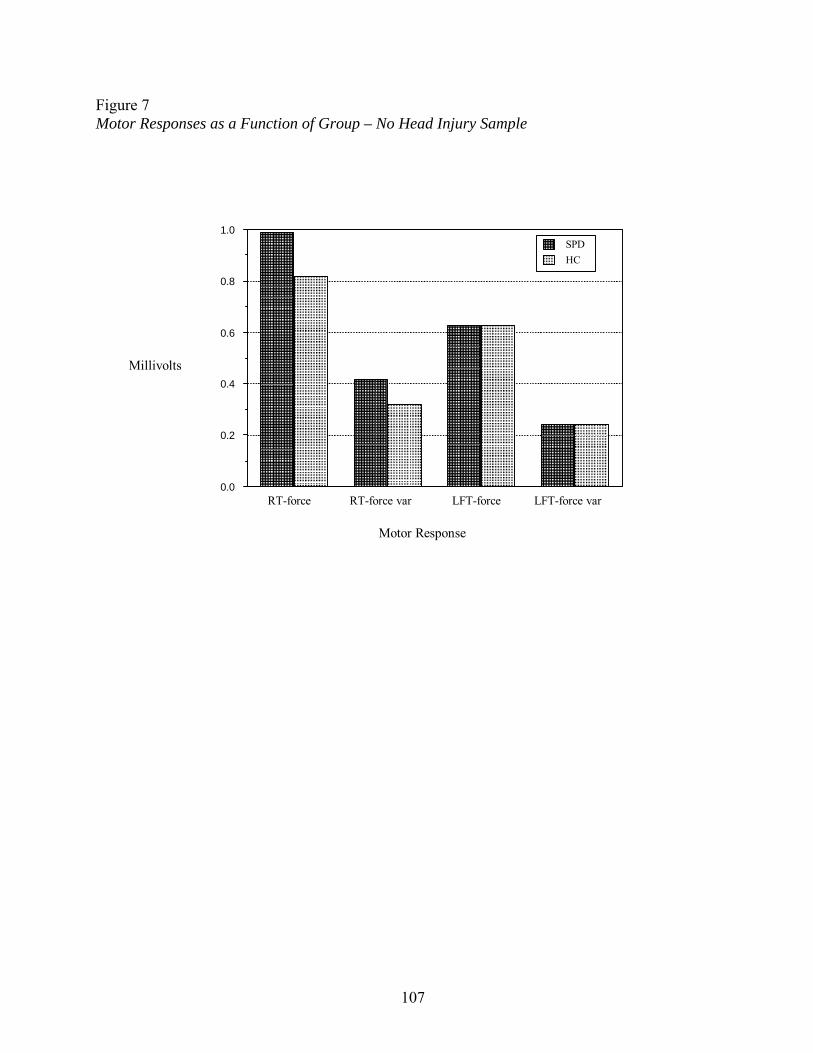
Figure 7 Motor Responses as a Function of Group – No Head Injury Sample
RT-force RT-force var LFT-force LFT-force var 0.0
0.2
0.4
0.6
0.8
1.0 SPD HC
Motor Response
Millivolts
107

APPENDIX C
108

Appendix C
SPD-Positive Symptom Items from the SCID-II Ideas of reference
49. Have you often felt that the way things are arranged have special significance for you?
50. Do you often get the feeling that things that have no special meaning to most people are really meant to give you a message?
51. When you are around people, do you often get the feeling that you are being watched or stared at?
Odd Beliefs/Magical Thinking 52. Have you ever felt that you could make things happen just by making a wish or thinking
about them? 53. Have you ever had experiences with the supernatural, astrology, seeing the future, UFOs,
ESP? 54. Do you believe that you have a “sixth sense” that allows you to know and predict things
that others can’t? Unusual perceptual experiences
55. Do you often mistake objects or shadows for people, or noises for voices? 56. Have you ever had the sense that some person or force is around you, even though you
cannot see anyone? 57. Do you often see auras or energy fields around people?
SPD-Negative Symptom Items from the SCIDII Lack of close friends or confidants
58. Are there very few people that you’re really close to outside of your family? 59. Do you often feel nervous when you are with other people?
Neither desires nor enjoys close relationships (from Schizoid section) 60. Do you not need close relationships with other people, like family or friends?
Solitary activities
61. Would you rather do things alone than with other people? Little, if any, interest in having sexual experiences with others
62. Could you be content without being sexually involved with another person? Emotional coldness, detachment, or flattened affectivity
65. Do you never seem to have really strong feelings, like being very angry or very happy?
109
REFERENCES
Alexander, G.E., DeLong, M.R., & Strick, P.L. (1986). Parallel organization of functionally
segregated circuits linking basal ganglia and cortex. Annual Review of Neuroscience, 9,
357-381.
Ashby, F.G., & Waldron, E.M. (2000). The neuropsychological bases of category learning.
Current Directions in Psychological Science, 9, 10-14.
Bergman, A., Harvey, P., Lees Roitman, S., Mohs, R., Marder, D., Silverman, J., & Siever, L.
(1998). Verbal learning in schizotypal personality disorder. Schizophrenia Bulletin, 24,
635-641.
Bleuler, E. (1911/1950). Dementia Praecox or the Group of Schizophrenics. New York:
International Universities Press.
Braff, D.L. (1993). Information processing and attention dysfunctions in schizophrenia.
Schizophrenia Bulletin, 19, 233-259.
Breier, A., Schreiber, J., Dyer, J., & Pickar, D. (1991). National Institute of Mental Health
longitudinal study of chronic schizophrenia. Archives of General Psychiatry, 48, 239-
246.
Caligiuri, M.P., & Lohr, J.B. (1994). A disturbance in the control of muscle force in neuroleptic-
naïve schizophrenic patients. Biological Psychiatry, 35, 104-111.
Cadenhead, K.S., Perry, W., Shafer, K., & Braff, D.L. (1999). Cognitive functions in schizotypal
personality disorder. Schizophrenia Research, 37, 123-132.
Cannon, T., Zorrilla, L., Shtasel, D., Gur, R.E., Gur, R.C., Marco, E., Moberg, P., Price, A.
(1994). Neuropsychological functioning in siblings discordant for schizophrenia and
healthy volunteers. Archives of General Psychiatry, 51, 651-661.
110
Cassidy, S.L., Adami, H., Moran, M., Kunkel, R., & Thaker, G.V. (1998). Spontaneous
dyskinesia in subjects with schizophrenia spectrum personality. American Journal of
Psychiatry, 155, 70-75.
Chen, E., & McKenna, P. (1996). Memory dysfunctions in schizophrenia. In C. Pantelis, H.
Nelson, & T. Barnes (Eds.), Schizophrenia: A Neuropsychological Perspective (pp. 107-
124). John Wiley & Sons Ltd.
Condray, R., & Steinhauer, S. (1992). Schizotypal personality disorder in individuals with and
without schizophrenic relatives: Similarities and contrasts in neurocognitive and clinical
functioning. Schizophrenia Research, 7, 33-41.
Cornblatt, B. A. (1998). Continuous Performance Task – Identical Pairs Version: Program
Guide. New York: BioBehavioral Technologies, Inc.
Cornblatt, B.A., & Keilp, J.G. (1994). Impaired attention, genetics, and the pathophysiology of
schizophrenia. Schizophrenia Bulletin, 20, 31-46.
Cornblatt, B.A., Lenzenweger, M.F., & Erlenmeyer-Kimling, L. (1989). The Continuous
Performance Test, Identical Pairs Version: II. Contrasting attentional profiles in
schizophrenic and depressed patients. Psychiatry Research, 29, 65-85.
Diforio, D., Walker, E., & Kestler, L. (2000). Executive functions in adolescents with
schizotypal personality disorder. Schizophrenia Research, 42, 125-134.
D’Reaux, R.A., Neumann, C.S., & Rhymer, K.N. (1999). Time of day of testing and
neuropsychological performance of schizophrenic patients and healthy controls.
Schizophrenia Research, 45, 157-167.
Dworkin, R.H., Cornblatt, B.A., Friedmann, R., & Kaplansky, L., Lewis, J.A., Rinaldi, A.,
Shilliday, C., & Erlenmeyer-Kimling, L. (1993). Childhood precursors
111
of affective vs. social deficits in adolescents at risk for schizophrenia. Schizophrenia
Bulletin, 19, 563-577.
Erlenmeyer-Kimling, L., & Cornblatt, B. (1992). A summary of attentional findings in the New
York high-risk project. Journal of Psychiatric Research, 26, 405-426.
First, M.B., Gibbon, M., Spitzer, R.L., Williams, J.B., & Benjamin, L. (1997). The Structured
Clinical Interview for DSM-IV Axis II Personality Disorders (SCID-II). Washington, DC:
American Psychiatric Press.
Frith, C.D. (1992). The Cognitive Neuropsychology of Schizophrenia. Hove, U.K.: Lawrence
Erlbaum Associates LTD.
Fortuny, L. A., & Heaton, R. K. (1996). Standard versus computerized administration of the
Wisconsin Card Sorting Test. The Clinical Neuropsychologist, 10 (4), 419-424.
Gold, J.M., Randolph, C., Carpenter, C., Goldberg, T., & Weinberger, D. (1992). Forms of
memory failure in schizophrenia. Journal of Abnormal Psychology, 101, 487-494.
Gold, J.M., Carpenter, C., Randolph, C., Goldberg, T., & Weinberger, D. (1997). Auditory
working memory and Wisconsin Card Sorting Test performance in schizophrenia.
Archives of General Psychiatry, 54, 159-165.
Goldberg, T., & Gold, J. (1995). Neurocognitive functioning in patients with schizophrenia. In
F. Bloom & D. Kupfer (Eds.), Psychopharmacology: The Fourth Generation of
Progress (pp. 1245- 1257).New York: Raven Press.
Goodarzi, M., Wykes, T., & Hemsley, D. (2000). Cerebral lateralization of global-processing in
people with schizotypy. Schizophrenia Research, 45, 115-121.
Gooding, D., Kwapil, T., & Tallent, K. (1999). Wisconsin card sorting test deficits in schizotypic
individuals. Schizophrenia Research, 40, 201-209.
112
Gottesman, I.I. (1990). Schizophrenia Genesis. New York, NY: W.H. Freeman & Company.
Gourovitch, M., & Goldberg, T. (1996). Cognitive deficits in schizophrenia: Attention, executive
functions, memory, and language processing. In C. Pantelis, H. Nelson, & T. Barnes
(Eds.), Schizophrenia: A Neuropsychological Perspective (pp. 71-86). John Wiley &
Sons Ltd.
Graybiel, A.M. (1997). The basal ganglia and cognitive pattern generators. Schizophrenia
Bulletin, 23, 459-469.
Graybiel, A.M., Aosaki, T., Flaherty, A.W., & Kimura, M. (1994). The basal ganglia and
adaptive motor control. Science, 265, 1826-1831.
Green, M. (1996). What are the functional consequences of neurocognitive deficits in
schizophrenia? American Journal of Psychiatry, 153, 321-330.
Heaton, R. K., Chelune, G.J., Talley, J.L., Kay, G.G., & Curtiss, G. (1993). Wisconsin Card
Sorting Test Manual: Revised and expanded. Odessa, FL: Psychological Assessment
Resources.
Heaton, R. K., Curtiss, G., & Tuttle, K. (1993). Wisconsin Card Sorting Test: Computer Version-
2: Research edition. Odessa, FL: Psychological Assessment Resource.
Heinrichs, R.W., & Zakzanis, K.K. (1998). Neurocognitive deficit in schizophrenia: A
quantitative review of the evidence. Neuropsychology, 12, 426-445.
Hellman, S.G., Green, M.F., & Kern, R.S., Christenson, C. D. (1992). Comparison of card and
computer versions of the Wisconsin Card Sorting Test for psychotic patients,
International Journal of Methods in Psychiatric Research, 2, 151-155.
Kaneko, M., Yokoyama, F., Hoshino, Y. Takahagu, K., Murata, S., Watanabe, M., &
Kumashiro, H. (1992). Hypothalamic pituitary adrenal axis function in chronic
113

schizophrenia: association with clinical features. Neuropsychobiology, 25, 1-7.
Kendler, K., Gruenberg, A, & Strauss, J. (1981). An independent analysis of the Copenhagen
sample of the Danish Adoption Study of schizophrenia. Archives of General Psychiatry,
38, 982-984.
Kendler, K.S., & Walsh, D. (1995). Schizotypal personality disorder in parents and the risk for
schizophrenia in siblings. Schizophrenia Bulletin, 21, 47-52.
Kety, S.S. (1988). Schizophrenic illness in the families of schizophrenic adoptees: Findings from
the Danish national sample. Schizophrenia Bulletin, 14, 217-222.
Kety, S.S., Wender, P., Jacobsen, B., Ingraham, L., Jansson, L., Faber, B., & Kinney, D. (1994).
Mental illness in the biological and adoptive relatives of schizophrenic adoptees.
Archives of General Psychiatry, 51, 442-455.
King, D.J. (1991). Psychomotor dysfunction in schizophrenia. In S. Steinhauer, & J. Gruzelier
(Eds.), Neuropsychology, psychophysiology, and information processing. Handbook of
schizophrenia: Vol.5 (pp. 273-301). New York, NY: Elsevier Science.
Kraeplin, E. (1919/1971). Dementia Praecox and Paraphrenia. New York: Krieger.
Kremen, W.S., Seidman, L.J., Pepple, J.R., Lyons, M.J., Tsuang, M.T., & Faraone, S.V. (1994).
Neuropsychological risk indicators for Schizophrenia: a review of family studies.
Schizophrenia Bulletin, 20, 103-119.
Lees-Roitman, S., Cornblatt, B., Bergman, A, Obuchowski, M., Mitropoulou, V., Keefe, R.,
Silverman, J., & Siever, L. (1997). Attentional functioning in schizotypal personality
disorder. American Journal of Psychiatry, 154, 655-660.
Lees-Roitman, S., Mitropoulou, V., Keefe, R., Silverman, J., Serby, M., Harvey, P., Reynolds,
D., Mohs, R., & Siever, L. (2000). Visuospatial working memory in schizotypal
114

personality disorder patients. Schizophrenia Research, 41, 447-455.
Lenzenweger, M.F., Cornblatt, B.A., & Putnick, M. (1991). Schizotypy and sustained attention.
Journal of Abnormal Psychology, 100, 84-89.
Lezak, M. D. (1995). Neuropsychological assessment (3rd ed.). New York: Oxford University
Press.
Manschreck, T.C., Maher, B.A., Waller, N.G., Ames, D., & Latham, C.A. (1985). Deficient
motor synchrony in schizophrenic disorders: Clinical correlates. Biological Psychiatry,
20, 990-1002.
Maruff, P., & Currie, J. (1996). Neuropsychology of visual attentional deficits in schizophrenia.
In C. Pantelis, H. Nelson, & T. Barnes (Eds.), Schizophrenia: A Neuropsychological
Perspective (pp. 87-105). John Wiley & Sons Ltd.
May, C.P., Hasher, L., & Stoltzfus, E.R. (1993). Optimal time of day and the magnitude of age
differences in memory. Psychological Science, 4, 326-330.
Middleton, F.A., & Strick, P.L. (2000). Basal ganglia and cerebellar loops: motor and cognitive
circuits. Brain Research Reviews, 31, 236-250.
Mirsky. A.F., Ingraham, L.J., & Kugelmass, S. (1995). Neuropsychological assessment of
attention and its pathology in the Israeli cohort. Schizophrenia Bulletin, 21, 193-204.
Morton, L.L., & Kershner, J.R. (1993). Time of day and attentional-order influences on dichotic
processing of digits in learning disabled and normal achieving children. International
Journal of Neuroscience, 71, 51-61.
Mozley, L., Gur, R.C., Gur, R.E., Mozley, P.D., & Alavi, A. (1996). Relationships between
verbal memory performance and the cerebral distribution of flurodeoxyglucose in
patients with schizophrenia. Biological Psychiatry, 40, 443-451.
115
Muller, J.L., Roder, C.H., Schuierer, G., & Klein, H. (2002). Motor-induced brain activation in
cortical, subcortical and cerebellar regions in schizophrenic inpatients: A whole brain
fMRI fingertapping study. Progress in Neuropsychopharmacology and Biological
Psychiatry, 26, 421-426.
Neumann, C.S., & Walker, E.F. (1996). Childhood neuromotor soft signs, behavior problems,
and adult psychopathology. In T.H. Ollendick & R.J. Prinz (Eds.), Advances in Clinical
Child Psychology (pp. 173-203). New York: Plenum Press.
Neumann, C.S., & Walker, E.F. (1999). Motor dysfunction in schizotypal personality disorder.
Schizophrenia Research, 38, 159-168.
Neumann, C.S., & Walker, E.F. (2003). Neuromotor functioning in adolescents with schizotypal
personality disorder: associations with symptoms and neurocognition. Schizophrenia
Bulletin, 29, 285-298.
Nuechterlein, K. (1983). Signal detection in vigilance tasks and behavioral attributes among
offspring of schizophrenic mothers and among hyperactive children. Journal of
Abnormal Psychology, 92, 4-28.
Nuechterlein, K., & Dawson, M. (1984). Information processing and attentional functioning in
the developmental course of schizophrenic disorders. Schizophrenia Bulletin, 10, 160-
203.
Peters, M., & Servos, P. (1989). Performance of subgroups of left-handers and right-handers.
Canadian Journal of Psychology, 43, 341-358.
Platek, S., Gallup, M., & Gordon, G. (2002). Self-face recognition is affected in schizotypal
personality disorder. Schizophrenia Research, 57, 81-86.
Raine, A., & Benishay, D. (1995). The SPQ-B: A brief screening instrument for schizotypal
116
personality disorder. Journal of Personality Disorders, 9, 346-355.
Rao, M.L., Strebel, B., Halaris, A., Gross, G., Braunig, P., Huber, G., & Marler, M. (1995).
Circadian rhythm of vital signs, norepinephrine, epinephrine, thyroid hormones, and
cortisol in schizophrenia. Psychiatry Research, 57, 21-39.
Reitan, R. M., & Wolfson, D. (1993). The Halstead Reitan Neuropsychological Test Battery.
Tucson, AZ: Neuropsychology Press.
Rogers, R. (2001). Handbook of Diagnostic and Structured Interviewing. London/New York:
The Guilford Press.
Rosso, I., Bearden, C., Hollister, J., Gasperoni, T., Sanchez, L., Hadley, T., & Cannon, T. (2000).
Childhood neuromotor dysfunction in schizophrenia patients and their unaffected
siblings: A prospective cohort study. Schizophrenia Bulletin, 26, 367-377.
Ryan, L., Hatfield, C., & Hofstetter, M. (2002). Caffeine reduces time of day effects on memory
performance in older adults. Psychological Science, 13, 68-71.
Sattler, J.M. (1992). Assessment of Children. Revised and Updated Third Edition. San Diego:
Jerome M. Sattler, Publisher, Inc.
Saykin, A., Gur, R.C., Gur, R.E., Mozley, D., Mozley, L., Resnick, S., Kester, B., & Stafaniak,
P. (1991). Neuropsychological function in schizophrenia. Archives of General
Psychiatry, 48, 618-624.
Shepherd, G.M. (1994). Neurobiology. Third Edition. New York: Oxford University Press.
Siever, L.J. (1992). Schizophrenia spectrum personality disorders. American Psychiatric Press
Review of Psychiatry, 11, 25-42.
Silver, H., & Shlomo, N. (2001). Perception of facial emotions in chronic schizophrenia does not
correlate with negative symptoms but correlates with cognitive and motor dysfunction,
117
Schizophrenia Research, 52, 265-273.
Smith, R.C., Kadewari, R.P., Rosenberger, J.R., & Bhattacharyya, A. (1999). Nonresponding
schizophrenia: differentiation by neurological soft signs and neuropsychological tests.
Schizophrenia Bulletin, 25, 813-825.
Tienari, P., Wynne, L., Moring, J., Lahti, I., Naarala, M., Sorri, A., Wahlberg, K., Saarento, O.,
Seitamaa, M., Kaleva, M., & Laksy, K. (1994). The Finnish adoptive family study of
schizophrenia implications for family research. British Journal of Psychiatry, 164, 20-26.
Torgersen, S., Edvardsen, J., Oien, P., Onstad, S., Skre, I., Lygren, S., & Kringlen, E. (2002).
Schizotypal personality disorder inside and outside the schizophrenia spectrum.
Schizophrenia Research, 54, 33-38.
Trestman, R., Keefe, R., Mitropoulou, V., Harvey, P., deVegvar, M., Lees Roitman, S.,
Davidson, M., Aronson, A., Silverman, J., & Siever, L. (1995). Cognitive function and
biological correlates of cognitive performance in schizotypal personality disorder.
Psychiatry Research, 59, 127-136.
van Cauter, E., Linkowski, P., Kerkofs, M., Hubain, P., L’Hermite-Baleriaux, M., Leclercq, R.,
Brasseur, M., Copinschi, G., & Mendlewicz, J. (1991). Circadian and sleep-related
endocrine rhythms in schizophrenia. Archives of General psychiatry, 48, 348- 356.
Voglmaier, M., Seidman, L., Salisbury, D., & McCarley, R. (1997). Neuropsychological
dysfunction in schizotypal personality disorder: A profile analysis. Biological Psychiatry,
41, 530-540.
Voglmaier, M., Seidman, L., Niznikiewicz, M., Dickey, C., Shenton, M., McCarley, R. (2000).
Verbal and nonverbal neuropsychological test performance in subjects with schizotypal
personality disorder. American Journal of Psychiatry, 157, 787-793.
118
Vrtunski, P.B., Simpson, D.M., & Meltzer, H.Y. (1989). Voluntary movement dysfunction in
schizophrenics. Biological Psychiatry, 25, 529-539.
Walker, E.F. (1994). Developmentally moderated expressions of the neuropathology underlying
schizophrenia. Schizophrenia Bulletin, 20, 453-480.
Walker, E.F., & Green, M. (1982). Motor proficiency and attentional-task performance by
psychotic patients. Journal of Abnormal Psychology, 4, 261-268.
Walker, E.F., Lewine, R., Neumann, C. (1996). Childhood behavioral characteristics and
adult brain morphology in schizophrenia. Schizophrenia Research, 22, 93-101.
Walker, E.F., Lewis, N., Loewy, R., & Palyo, S. (1999). Motor functioning and
psychopathology. Development and Psychopathology, 11, 509-523.
Walker, E.F., Savoie, T., & Davis, D. (1994). Neuromotor precursors of schizophrenia.
Schizophrenia Bulletin, 20, 441-451.
Wechsler, D. (1997a). Manual for the Wechsler Adult Intelligence Scale. (3rd ed.). San Antonio,
TX: The Psychological Corporation.
Wechsler, D. (1997b). Manual for the Wechsler Memory Scale. (3rd Edition). San Antonio, TX:
The Psychological Corporation.
Wilkinson, G. S. (1993). The Wide Range Achievement Test 3: Administration Manual.
Wilmington, DE: Wide Range, Inc.
119