Embed Size (px)
Citation preview
Review ArticleAssociation between HLA-DQ Gene Polymorphisms andHBV-Related Hepatocellular Carcinoma
Jingzhu Lv,1 Tao Xu,2,3,4 Zhongqing Qian,5,6 and Hongtao Wang5,6
1Department of Biochemistry and Molecular Biology, Bengbu Medical College, Bengbu 233003, China2Department of Clinical Laboratory, Bengbu Medical College, Bengbu, Anhui 233030, China3Department of Microbiology and Immunology, Medical School of Southeast University, Nanjing, Jiangsu 210009, China4Clinical Testing and Diagnose Experimental Center of Bengbu Medical College, Bengbu, Anhui 233030, China5Department of Immunology, Bengbu Medical College, Bengbu Anhui 233030, China6Anhui Key Laboratory of Infection and Immunity, Bengbu Medical College, Bengbu Anhui 233030, China
Correspondence should be addressed to Hongtao Wang; [email protected]
Received 27 March 2017; Revised 23 May 2017; Accepted 8 June 2017; Published 6 July 2017
Academic Editor: Tatsuya Toyokawa
Copyright © 2017 Jingzhu Lv et al. This is an open access article distributed under the Creative Commons Attribution License,which permits unrestricted use, distribution, and reproduction in any medium, provided the original work is properly cited.
Hepatocellular carcinoma (HCC) is one of the most common causes of cancer-related mortality worldwide. Host gene variants mayinfluence hepatitis B virus- (HBV-) related HCC. Human leukocyte antigens (HLA) play an important role in presenting virusantigens to immune cells that are responsible for the clearance of virus-infected cells and tumor cells. Previous studies haveinvestigated the HLA-DQ (rs2856718 and rs9275572) polymorphisms that may be associated with the development of HBV-related HCC. However, the results are controversial or inconclusive. Hence, we conducted a meta-analysis to derive a moreprecise estimation of the associations. A total of 6 articles were used to evaluate the effect of the two polymorphisms on the riskof HBV-related HCC. Odds ratios (ORs) and 95% confidence intervals (95% CIs) were calculated. We found that rs2856718 andrs9275572 in HLA-DQ significantly decreased HBV-related HCC in total population, especially in Chinese, but not in SaudiArabian. Further validation of our results in larger populations and different ethnicities are required.
1. Introduction
Primary liver cancer is one of the six most common cancersand the second largest cause of cancer deaths worldwide(746,000 cases or 9.1% of all cancer deaths), especially inundeveloped countries [1, 2]. Approximately 75% of livercancers occur in Asia, whereas China alone accounts formore than 50% of all cases [3]. Globally, the vast majorityof histologic types of primary liver cancers (approximately80%) are hepatocellular carcinoma (HCC), a malignanttumor arising from hepatocytes, the liver’s parenchymal cells[4]. It is estimated that 75%–85% of HCC patients are attrib-utable to chronic infections with hepatitis B virus (HBV),especially in Asian populations and particularly in Chinese[5]. Besides HBV infection, other extrinsic factors, such asalcohol, smoking, physical inactivity, chemical exposure,and poor dietary habits, are also involved in developingHCC [6]. However, only a small fraction of infected patients
can progress to HCC during their lifetime. So intrinsic fac-tors, such as genetic mutations, may be vital for tumor devel-opment [7, 8]. Furthermore, genetic epidemiology points outthat genetic polymorphisms of genes involving in differentprocesses of carcinogenesis may also play an important roleto determine individual susceptibility to HCC and improvethe prevention and treatment of this cancer [9–11].
Human leukocyte antigen (HLA) has been identified tobe associated with regulating the immune response to HBVinfection and clinical outcomes [12]. HLA-DQs are highlypolymorphic especially in exon 2, which codes for antigen-binding sites. The single-nucleotide polymorphism (SNP)rs2856718 locates in the intergenic region between HLA-DQA2 and HLA-DQB1. Hu et al.’s study showed thatHLA-DQ rs2856718 significantly decreased the host HCCrisk [13]. The SNP rs9275572 locates between HLA-DQAand HLA-DQB on 6p21.32. A recent genome-wide associa-tion study (GWAS) indicated that the HLA-DQ rs9275572
HindawiGastroenterology Research and PracticeVolume 2017, Article ID 7150386, 11 pageshttps://doi.org/10.1155/2017/7150386
polymorphism was significantly associated with HCV-related HCC in Japanese population [14]. Chen et al.’s studyfound that HLA-DQ rs9275572 polymorphism may have aprotective impact on HBV-related HCC [15].
Previous studies have assessed the association betweenHLA-DQ (rs2856718 and rs9275572) polymorphisms andHBV-related HCC susceptibility, but the results of previousstudies are inconsistent and inconclusive [13, 15–19].Therefore, we performed a comprehensive meta-analysis toderive a more precise estimation of the relationship betweenHLA-DQ (rs2856718 and rs9275572) polymorphisms andHBV-related HCC risk. To the best of our knowledge, thisis the first meta-analysis to analyze the association of theHLA-DQ (rs2856718 and rs9275572) polymorphisms withHBV-related HCC risk.
2. Material and Methods
2.1. Search Strategy. To identify relevant studies, we system-atically searched PubMed, EMBASE, Google Scholar andChina National Knowledge Infrastructure (CNKI) data-bases. The search strategy was based on a combinationof “HLA-DQ,” “hepatitis B virus,” or “HBV”; “Hepatocellularcarcinoma,” “HCC,” or “liver cancer”; “polymorphism” or“SNP”; and “rs2856718” or “rs9275572” (up to March 27,2017). The languages of the reviewed articles were limitedto English and Chinese. In addition, references of retrievedarticles were also screened.
2.2. Inclusion and Exclusion Criteria. The following criteriawere necessary for inclusion in the meta-analysis: (1) acase-control study that had investigated the genetic risk ofHBV-related HCC in relation to HLA-DQ rs2856718 orrs9275572, (2) original papers containing independent data,(3) the study that provided the available genotype
frequencies, (4) the study that provided sufficient informa-tion for calculating the pooled odds ratios (ORs) with 95%confidence intervals (CIs), and (5) the genotype distributionof a control group that are consistent with the Hardy-Weinberg equilibrium (HWE).
Exclusion criteria were as follows: (1) case-only studies,(2) review articles, (3) repetitive reports, and (4) lack of geno-type frequency data. In addition, if multiple studies had over-lapping data, only the most recent version was used.
2.3. Data Extraction. The following data were independentlyextracted from each study by two authors (Jingzhu Lv andTao Xu): the first author’s name, year of publication, coun-try, genotyping method, number of cases and controls,genotype, and allele frequency. After extraction, data werereviewed and compared by the two independent investiga-tors. Any disagreements were resolved by discussion withthe third investigator.
2.4. Statistical Analysis. All statistical analyses were per-formed using Stata software version 12.0 (Stata Corporation,College Station, TX). The Hardy-Weinberg equilibriumtest in the control group was undertaken using the χ2-test(P < 0 05 was considered as significant disequilibrium inthe control group). Odds ratios (ORs) with 95% confidenceintervals (95% CIs) were used to estimate the strengthof the association between HLA-DQ (rs2856718 andrs9275572) polymorphisms and HBV-related HCC. Thepooled ORs were obtained from combination of singlestudies by homozygote comparison, heterozygote compari-son, dominant and recessive models, and allele comparison,respectively. The significance of pooled ORs was assessedby the Z test, and PZ < 0 05was considered as the significancethreshold. Based on the heterogeneity test, the pooled ORwas calculated using the fixed (PH ≥ 0 05, I2≤ 50%) or
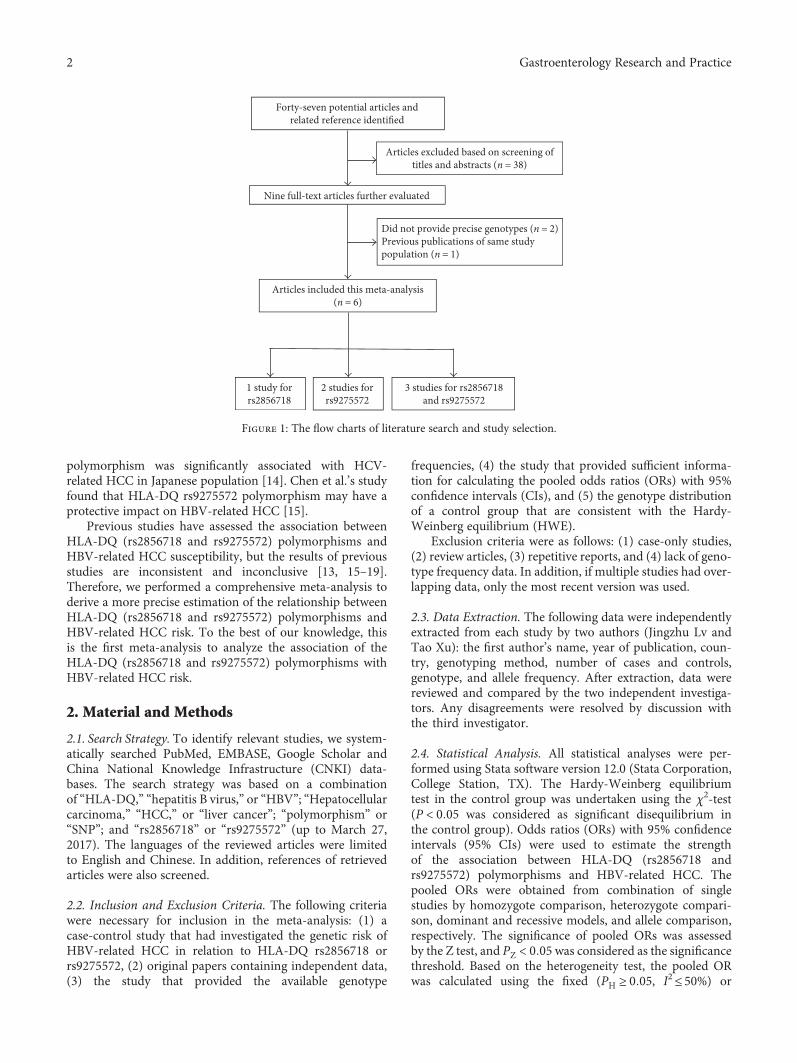
Forty-seven potential articles andrelated reference identified
Articles excluded based on screening oftitles and abstracts (n = 38)
Did not provide precise genotypes (n = 2)Previous publications of same studypopulation (n = 1)
Nine full-text articles further evaluated
Articles included this meta-analysis(n = 6)
1 study forrs2856718
2 studies forrs9275572
3 studies for rs2856718and rs9275572
Figure 1: The flow charts of literature search and study selection.
2 Gastroenterology Research and Practice
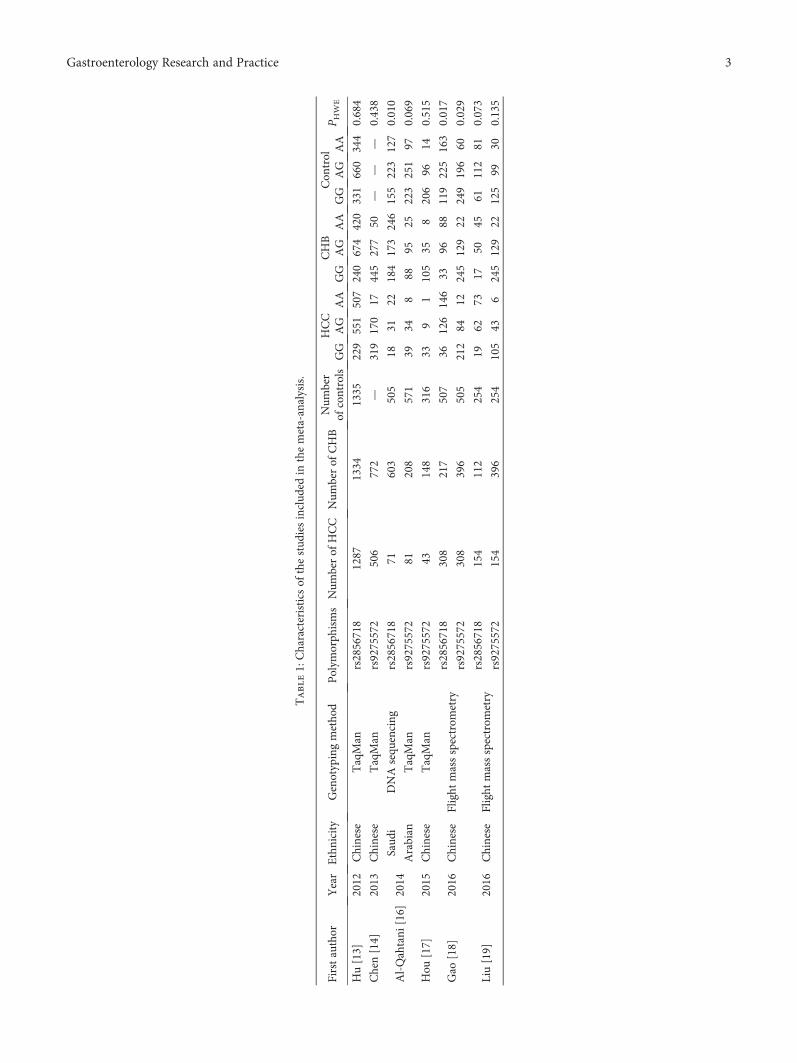
Table1:Characteristics
ofthestud
iesinclud
edin
themeta-analysis.
Firstauthor
Year
Ethnicity
Genotypingmetho
dPolym
orph
isms
Num
berof
HCC
Num
berof
CHB
Num
ber
ofcontrols
HCC
CHB
Con
trol
P HWE
GG
AG
AA
GG
AG
AA
GG
AG
AA
Hu[13]
2012
Chinese
TaqMan
rs2856718
1287
1334
1335
229
551
507
240
674
420
331
660
344
0.684
Chen[14]
2013
Chinese
TaqMan
rs9275572
506
772
—319
170
17445
277
50—
——
0.438
Al-Qahtani
[16]
2014
Saud
iDNAsequ
encing
rs2856718
71603
505
1831
22184
173
246
155
223
127
0.010
Arabian
TaqMan
rs9275572
81208
571
3934
888
9525
223
251
970.069
Hou
[17]
2015
Chinese
TaqMan
rs9275572
43148
316
339
1105
358
206
9614
0.515
Gao
[18]
2016
Chinese
Flight
massspectrom
etry
rs2856718
308
217
507
36126
146
3396
88119
225
163
0.017
rs9275572
308
396
505
212
8412
245
129
22249
196
600.029
Liu[19]
2016
Chinese
Flight
massspectrom
etry
rs2856718
154
112
254
1962
7317
5045
61112
810.073
rs9275572
154
396
254
105
436
245
129
22125
9930
0.135
3Gastroenterology Research and Practice
random (PH < 0 05, I2> 50%) effect models. Sensitivityanalysis was carried out to identify the effect of data fromeach study on the pooled ORs. Finally, publication biaswas assessed using Egger’s test, and PE < 0 05 was consid-ered statistically significant.
3. Results
3.1. Characteristics of the Included Studies. A total of 47potentially relevant articles published up to March 27, 2017were systematically identified in PubMed, EMBASE, GoogleScholar, and CNKI. The flow chart that summarized the liter-ature review process and the specific reasons for any exclu-sion from the meta-analysis are shown in Figure 1. In the
end, 6 articles that met the inclusion criteria were includedin the meta-analysis of 1 study for HLA-DQ rs2856718, 2studies for HLA-DQ rs9275572, and 3 studies for HLA-DQrs2856718 and HLA-DQ rs9275572 [13, 15–19]. Characteris-tics of all eligible articles are shown in Table 1. Of the 6articles, 4 articles including 1820 cases, 2266 CHB, and2601 controls evaluated the association between HLA-DQrs2856718 and HBV-related HCC risk, while 5 studies evalu-ated the association between the HLA-DQ rs9275572and HBV-related HCC risk (1092 cases, 1920 CHB,and 1646 controls).
3.2. Meta-Analysis of the Association between HLA-DQrs2856718 and HBV-Related HCC Risk. The potential
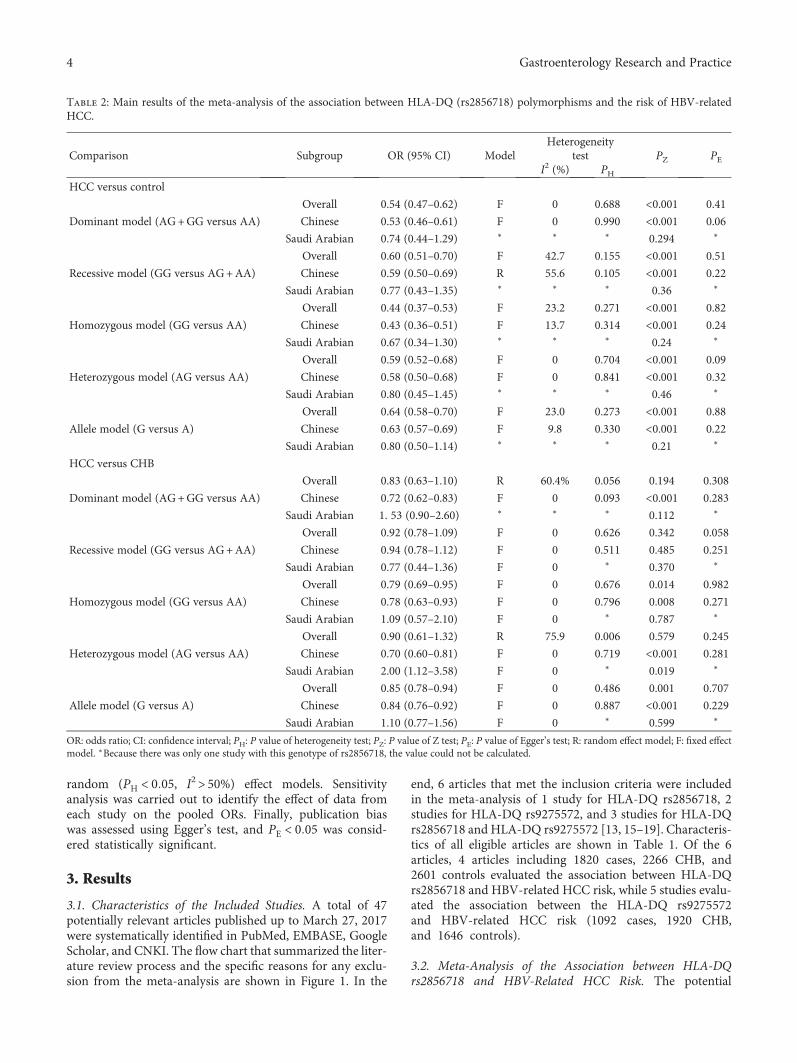
Table 2: Main results of the meta-analysis of the association between HLA-DQ (rs2856718) polymorphisms and the risk of HBV-relatedHCC.
Comparison Subgroup OR (95% CI) ModelHeterogeneity
test PZ PEI2 (%) PH
HCC versus control
Dominant model (AG+GG versus AA)
Overall 0.54 (0.47–0.62) F 0 0.688 <0.001 0.41
Chinese 0.53 (0.46–0.61) F 0 0.990 <0.001 0.06
Saudi Arabian 0.74 (0.44–1.29) ∗ ∗ ∗ 0.294 ∗
Recessive model (GG versus AG+AA)
Overall 0.60 (0.51–0.70) F 42.7 0.155 <0.001 0.51
Chinese 0.59 (0.50–0.69) R 55.6 0.105 <0.001 0.22
Saudi Arabian 0.77 (0.43–1.35) ∗ ∗ ∗ 0.36 ∗
Homozygous model (GG versus AA)
Overall 0.44 (0.37–0.53) F 23.2 0.271 <0.001 0.82
Chinese 0.43 (0.36–0.51) F 13.7 0.314 <0.001 0.24
Saudi Arabian 0.67 (0.34–1.30) ∗ ∗ ∗ 0.24 ∗
Heterozygous model (AG versus AA)
Overall 0.59 (0.52–0.68) F 0 0.704 <0.001 0.09
Chinese 0.58 (0.50–0.68) F 0 0.841 <0.001 0.32
Saudi Arabian 0.80 (0.45–1.45) ∗ ∗ ∗ 0.46 ∗
Allele model (G versus A)
Overall 0.64 (0.58–0.70) F 23.0 0.273 <0.001 0.88
Chinese 0.63 (0.57–0.69) F 9.8 0.330 <0.001 0.22
Saudi Arabian 0.80 (0.50–1.14) ∗ ∗ ∗ 0.21 ∗
HCC versus CHB
Dominant model (AG+GG versus AA)
Overall 0.83 (0.63–1.10) R 60.4% 0.056 0.194 0.308
Chinese 0.72 (0.62–0.83) F 0 0.093 <0.001 0.283
Saudi Arabian 1. 53 (0.90–2.60) ∗ ∗ ∗ 0.112 ∗
Recessive model (GG versus AG+AA)
Overall 0.92 (0.78–1.09) F 0 0.626 0.342 0.058
Chinese 0.94 (0.78–1.12) F 0 0.511 0.485 0.251
Saudi Arabian 0.77 (0.44–1.36) F 0 ∗ 0.370 ∗
Homozygous model (GG versus AA)
Overall 0.79 (0.69–0.95) F 0 0.676 0.014 0.982
Chinese 0.78 (0.63–0.93) F 0 0.796 0.008 0.271
Saudi Arabian 1.09 (0.57–2.10) F 0 ∗ 0.787 ∗
Heterozygous model (AG versus AA)
Overall 0.90 (0.61–1.32) R 75.9 0.006 0.579 0.245
Chinese 0.70 (0.60–0.81) F 0 0.719 <0.001 0.281
Saudi Arabian 2.00 (1.12–3.58) F 0 ∗ 0.019 ∗
Allele model (G versus A)
Overall 0.85 (0.78–0.94) F 0 0.486 0.001 0.707
Chinese 0.84 (0.76–0.92) F 0 0.887 <0.001 0.229
Saudi Arabian 1.10 (0.77–1.56) F 0 ∗ 0.599 ∗
OR: odds ratio; CI: confidence interval; PH: P value of heterogeneity test; PZ: P value of Z test; PE: P value of Egger’s test; R: random effect model; F: fixed effectmodel. ∗Because there was only one study with this genotype of rs2856718, the value could not be calculated.
4 Gastroenterology Research and Practice
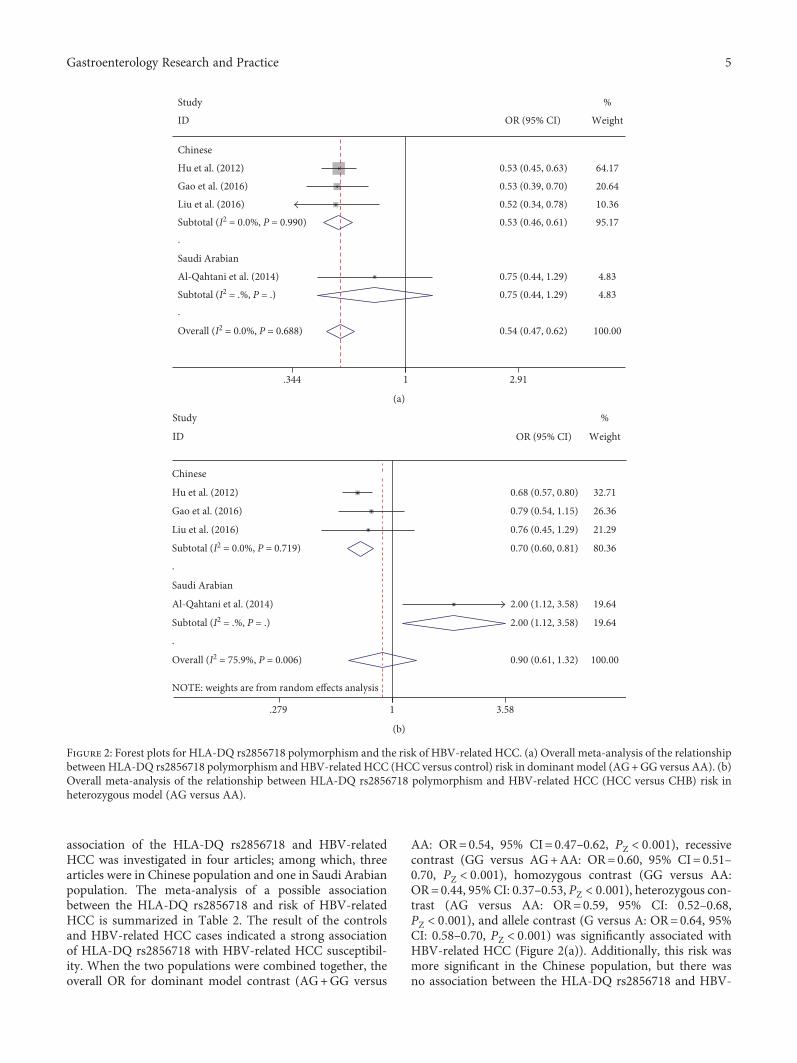
association of the HLA-DQ rs2856718 and HBV-relatedHCC was investigated in four articles; among which, threearticles were in Chinese population and one in Saudi Arabianpopulation. The meta-analysis of a possible associationbetween the HLA-DQ rs2856718 and risk of HBV-relatedHCC is summarized in Table 2. The result of the controlsand HBV-related HCC cases indicated a strong associationof HLA-DQ rs2856718 with HBV-related HCC susceptibil-ity. When the two populations were combined together, theoverall OR for dominant model contrast (AG+GG versus
AA: OR=0.54, 95% CI= 0.47–0.62, PZ < 0 001), recessivecontrast (GG versus AG+AA: OR=0.60, 95% CI= 0.51–0.70, PZ < 0 001), homozygous contrast (GG versus AA:OR=0.44, 95% CI: 0.37–0.53, PZ < 0 001), heterozygous con-trast (AG versus AA: OR=0.59, 95% CI: 0.52–0.68,PZ < 0 001), and allele contrast (G versus A: OR=0.64, 95%CI: 0.58–0.70, PZ < 0 001) was significantly associated withHBV-related HCC (Figure 2(a)). Additionally, this risk wasmore significant in the Chinese population, but there wasno association between the HLA-DQ rs2856718 and HBV-
.
.
Overall (I2 = 0.0%, P = 0.688)
Al-Qahtani et al. (2014)
ID
Liu et al. (2016)
Saudi Arabian
Gao et al. (2016)
Subtotal (I2 = 0.0%, P = 0.990)
Subtotal (I2 = .%, P = .)
Hu et al. (2012)
Chinese
Study
0.54 (0.47, 0.62)
0.75 (0.44, 1.29)
OR (95% CI)
0.52 (0.34, 0.78)
0.53 (0.39, 0.70)
0.53 (0.46, 0.61)
0.75 (0.44, 1.29)
0.53 (0.45, 0.63)
100.00
4.83
Weight
10.36
20.64
95.17
4.83
64.17
%
1.344 2.91
(a)
NOTE: weights are from random effects analysis
.
.
Overall (I2 = 75.9%, P = 0.006)
Subtotal (I2 = .%, P = .)
ID
Liu et al. (2016)
Hu et al. (2012)
Al-Qahtani et al. (2014)
Subtotal (I2 = 0.0%, P = 0.719)
Gao et al. (2016)
Saudi Arabian
Chinese
Study
0.90 (0.61, 1.32)
2.00 (1.12, 3.58)
OR (95% CI)
0.76 (0.45, 1.29)
0.68 (0.57, 0.80)
2.00 (1.12, 3.58)
0.70 (0.60, 0.81)
0.79 (0.54, 1.15)
100.00
19.64
Weight
21.29
32.71
19.64
80.36
26.36
%
1.279 3.58
(b)
Figure 2: Forest plots for HLA-DQ rs2856718 polymorphism and the risk of HBV-related HCC. (a) Overall meta-analysis of the relationshipbetween HLA-DQ rs2856718 polymorphism and HBV-related HCC (HCC versus control) risk in dominant model (AG+GG versus AA). (b)Overall meta-analysis of the relationship between HLA-DQ rs2856718 polymorphism and HBV-related HCC (HCC versus CHB) risk inheterozygous model (AG versus AA).
5Gastroenterology Research and Practice
related HCC susceptibility in Saudi Arabian population.When the controls were CHB patients, only GG versus AAand G versus A of HLA-DQ rs2856718 were significantlyassociated with the risk of HBV-related HCC. However, sub-group analysis by ethnicity showed that HLA-DQ rs2856718AG genotype had a significantly increased risk of HBV-related HCC among Saudi Arabian population (AG versusAA: OR=2.00, 95% CI: 1.12–3.58, PZ = 0 019) (Figure 2(b)).
3.3. Meta-Analysis of the Association between HLA-DQrs9275572 and HBV-Related HCC Risk. Five studies reporteda potential association between HLA-DQ rs9275572 poly-morphism and HBV-related HCC risk with evidence from1092 cases and 3566 controls (the healthy group and CHB
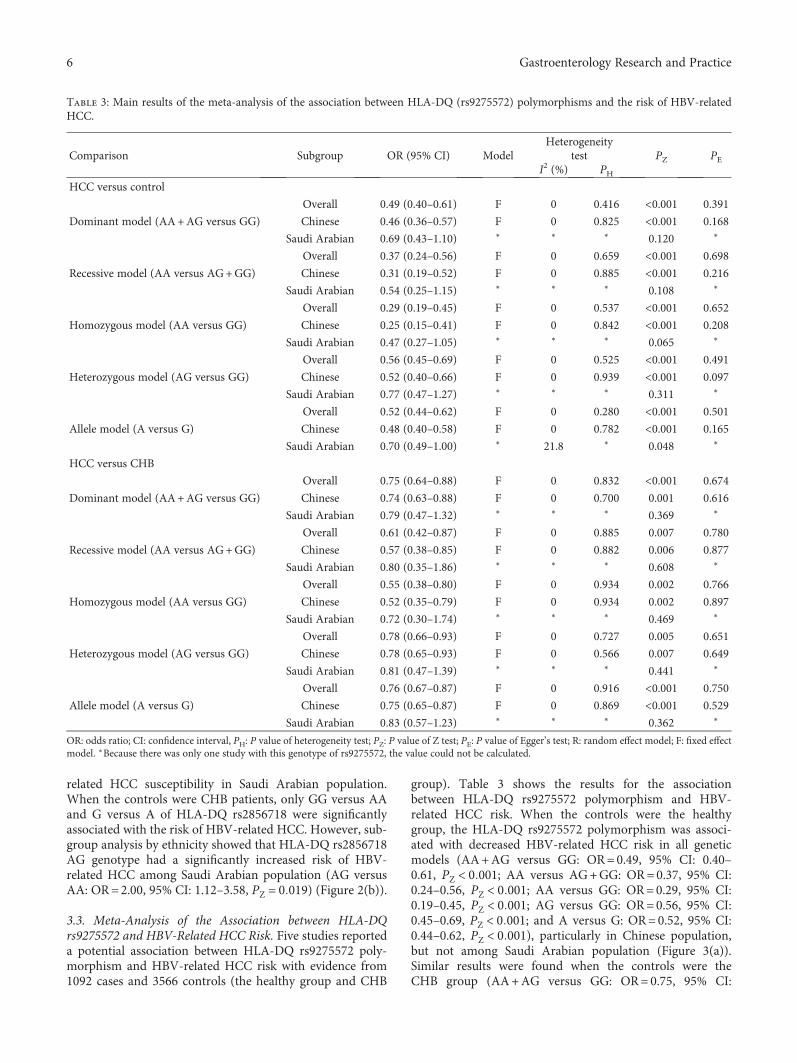
group). Table 3 shows the results for the associationbetween HLA-DQ rs9275572 polymorphism and HBV-related HCC risk. When the controls were the healthygroup, the HLA-DQ rs9275572 polymorphism was associ-ated with decreased HBV-related HCC risk in all geneticmodels (AA+AG versus GG: OR=0.49, 95% CI: 0.40–0.61, PZ < 0 001; AA versus AG+GG: OR=0.37, 95% CI:0.24–0.56, PZ < 0 001; AA versus GG: OR=0.29, 95% CI:0.19–0.45, PZ < 0 001; AG versus GG: OR=0.56, 95% CI:0.45–0.69, PZ < 0 001; and A versus G: OR=0.52, 95% CI:0.44–0.62, PZ < 0 001), particularly in Chinese population,but not among Saudi Arabian population (Figure 3(a)).Similar results were found when the controls were theCHB group (AA+AG versus GG: OR=0.75, 95% CI:
Table 3: Main results of the meta-analysis of the association between HLA-DQ (rs9275572) polymorphisms and the risk of HBV-relatedHCC.
Comparison Subgroup OR (95% CI) ModelHeterogeneity
test PZ PEI2 (%) PH
HCC versus control
Dominant model (AA+AG versus GG)
Overall 0.49 (0.40–0.61) F 0 0.416 <0.001 0.391
Chinese 0.46 (0.36–0.57) F 0 0.825 <0.001 0.168
Saudi Arabian 0.69 (0.43–1.10) ∗ ∗ ∗ 0.120 ∗
Recessive model (AA versus AG+GG)
Overall 0.37 (0.24–0.56) F 0 0.659 <0.001 0.698
Chinese 0.31 (0.19–0.52) F 0 0.885 <0.001 0.216
Saudi Arabian 0.54 (0.25–1.15) ∗ ∗ ∗ 0.108 ∗
Homozygous model (AA versus GG)
Overall 0.29 (0.19–0.45) F 0 0.537 <0.001 0.652
Chinese 0.25 (0.15–0.41) F 0 0.842 <0.001 0.208
Saudi Arabian 0.47 (0.27–1.05) ∗ ∗ ∗ 0.065 ∗
Heterozygous model (AG versus GG)
Overall 0.56 (0.45–0.69) F 0 0.525 <0.001 0.491
Chinese 0.52 (0.40–0.66) F 0 0.939 <0.001 0.097
Saudi Arabian 0.77 (0.47–1.27) ∗ ∗ ∗ 0.311 ∗
Allele model (A versus G)
Overall 0.52 (0.44–0.62) F 0 0.280 <0.001 0.501
Chinese 0.48 (0.40–0.58) F 0 0.782 <0.001 0.165
Saudi Arabian 0.70 (0.49–1.00) ∗ 21.8 ∗ 0.048 ∗
HCC versus CHB
Dominant model (AA+AG versus GG)
Overall 0.75 (0.64–0.88) F 0 0.832 <0.001 0.674
Chinese 0.74 (0.63–0.88) F 0 0.700 0.001 0.616
Saudi Arabian 0.79 (0.47–1.32) ∗ ∗ ∗ 0.369 ∗
Recessive model (AA versus AG+GG)
Overall 0.61 (0.42–0.87) F 0 0.885 0.007 0.780
Chinese 0.57 (0.38–0.85) F 0 0.882 0.006 0.877
Saudi Arabian 0.80 (0.35–1.86) ∗ ∗ ∗ 0.608 ∗
Homozygous model (AA versus GG)
Overall 0.55 (0.38–0.80) F 0 0.934 0.002 0.766
Chinese 0.52 (0.35–0.79) F 0 0.934 0.002 0.897
Saudi Arabian 0.72 (0.30–1.74) ∗ ∗ ∗ 0.469 ∗
Heterozygous model (AG versus GG)
Overall 0.78 (0.66–0.93) F 0 0.727 0.005 0.651
Chinese 0.78 (0.65–0.93) F 0 0.566 0.007 0.649
Saudi Arabian 0.81 (0.47–1.39) ∗ ∗ ∗ 0.441 ∗
Allele model (A versus G)
Overall 0.76 (0.67–0.87) F 0 0.916 <0.001 0.750
Chinese 0.75 (0.65–0.87) F 0 0.869 <0.001 0.529
Saudi Arabian 0.83 (0.57–1.23) ∗ ∗ ∗ 0.362 ∗
OR: odds ratio; CI: confidence interval, PH: P value of heterogeneity test; PZ: P value of Z test; PE: P value of Egger’s test; R: random effect model; F: fixed effectmodel. ∗Because there was only one study with this genotype of rs9275572, the value could not be calculated.
6 Gastroenterology Research and Practice
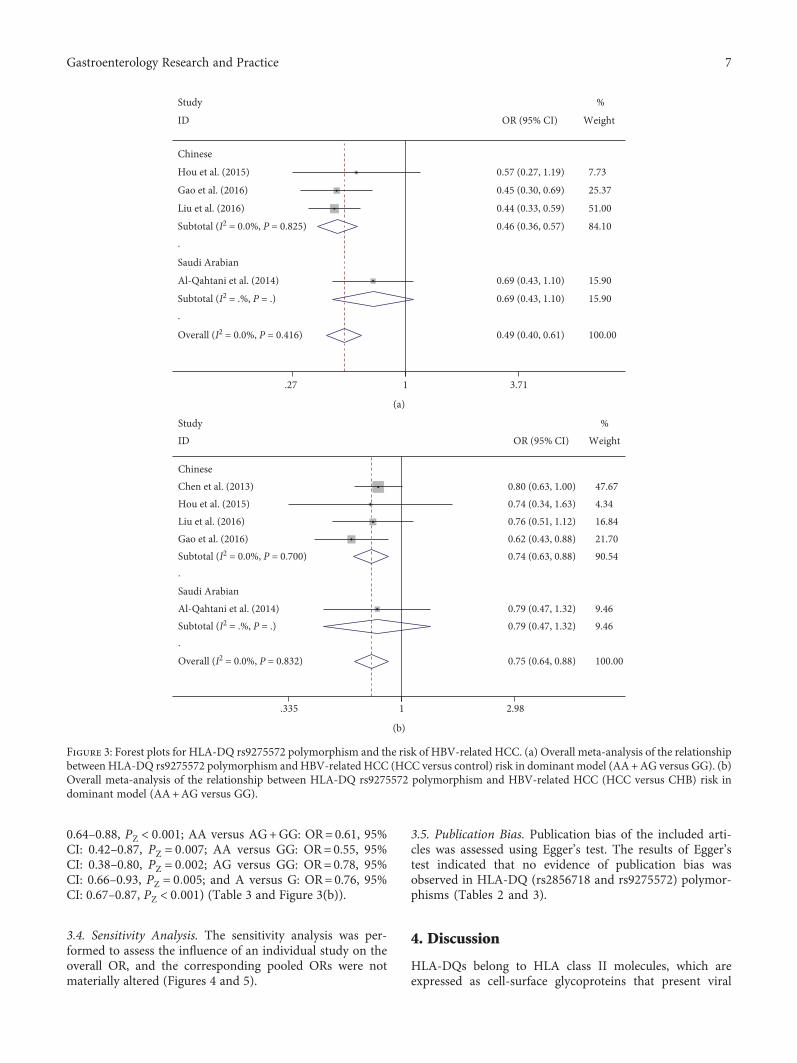
0.64–0.88, PZ < 0 001; AA versus AG+GG: OR=0.61, 95%CI: 0.42–0.87, PZ = 0 007; AA versus GG: OR=0.55, 95%CI: 0.38–0.80, PZ = 0 002; AG versus GG: OR=0.78, 95%CI: 0.66–0.93, PZ = 0 005; and A versus G: OR=0.76, 95%CI: 0.67–0.87, PZ < 0 001) (Table 3 and Figure 3(b)).
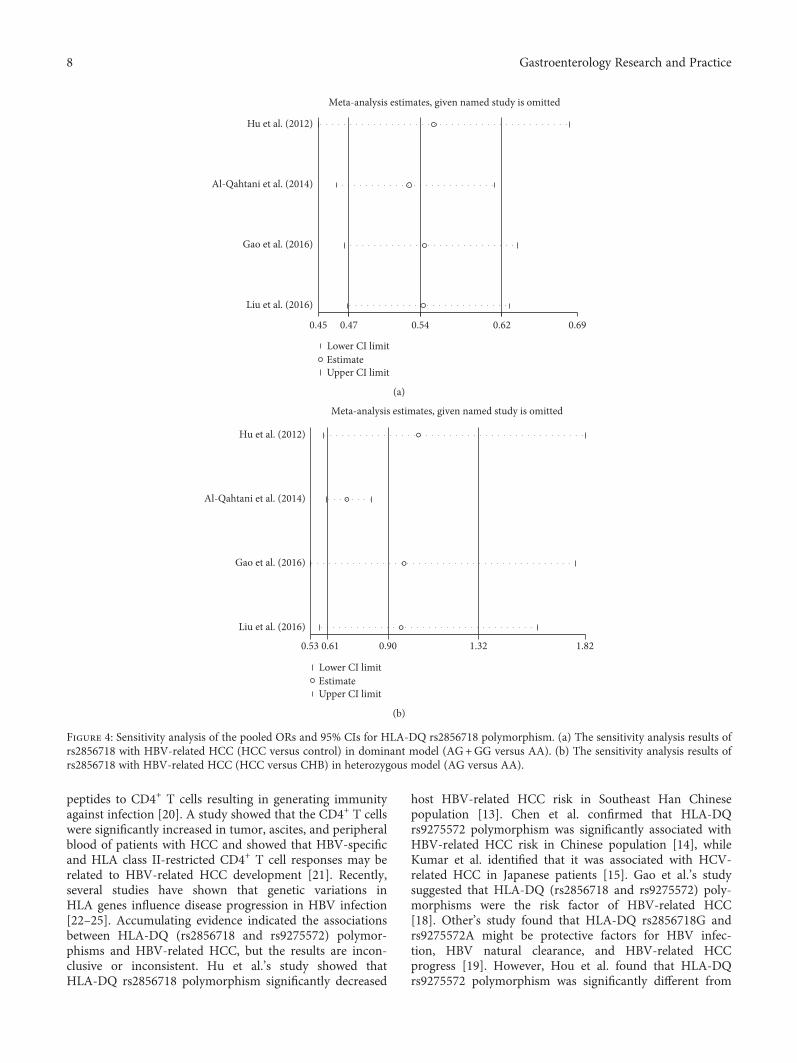
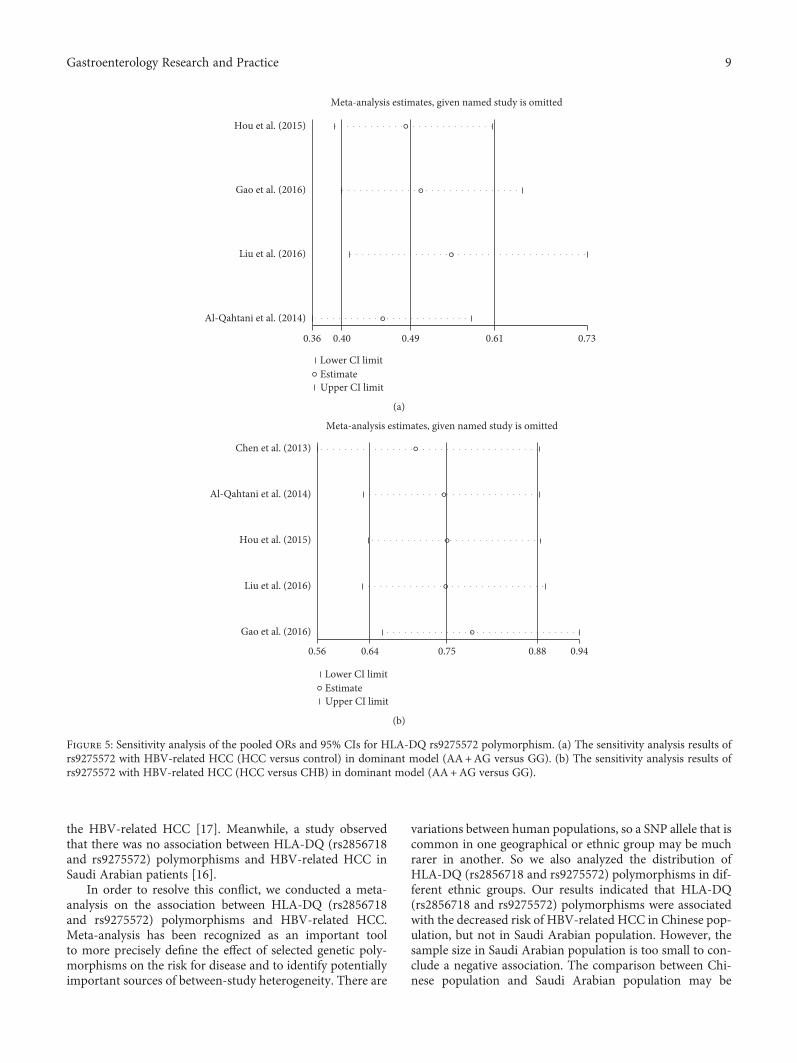
3.4. Sensitivity Analysis. The sensitivity analysis was per-formed to assess the influence of an individual study on theoverall OR, and the corresponding pooled ORs were notmaterially altered (Figures 4 and 5).
3.5. Publication Bias. Publication bias of the included arti-cles was assessed using Egger’s test. The results of Egger’stest indicated that no evidence of publication bias wasobserved in HLA-DQ (rs2856718 and rs9275572) polymor-phisms (Tables 2 and 3).
4. Discussion
HLA-DQs belong to HLA class II molecules, which areexpressed as cell-surface glycoproteins that present viral
.
.
Overall (I2 = 0.0%, P = 0.416)
Subtotal (I2 = 0.0%, P = 0.825)
Liu et al. (2016)
Hou et al. (2015)
Subtotal (I2 = .%, P = .)
Al-Qahtani et al. (2014)
ID
Study
Gao et al. (2016)
Chinese
Saudi Arabian
0.49 (0.40, 0.61)
0.46 (0.36, 0.57)
0.44 (0.33, 0.59)
0.57 (0.27, 1.19)
0.69 (0.43, 1.10)
0.69 (0.43, 1.10)
OR (95% CI)
0.45 (0.30, 0.69)
100.00
84.10
51.00
7.73
15.90
15.90
Weight
%
25.37
1.27 3.71
(a)
.
.
Overall (I2 = 0.0%, P = 0.832)
ID
Chen et al. (2013)
Gao et al. (2016)
Subtotal (I2 = .%, P = .)
Subtotal (I2 = 0.0%, P = 0.700)
Al-Qahtani et al. (2014)
Hou et al. (2015)Liu et al. (2016)
Saudi Arabian
Chinese
Study
0.75 (0.64, 0.88)
OR (95% CI)
0.80 (0.63, 1.00)
0.62 (0.43, 0.88)
0.79 (0.47, 1.32)
0.74 (0.63, 0.88)
0.79 (0.47, 1.32)
0.74 (0.34, 1.63)0.76 (0.51, 1.12)
100.00
Weight
47.67
21.70
9.46
90.54
9.46
4.3416.84
%
1.335 2.98
(b)
Figure 3: Forest plots for HLA-DQ rs9275572 polymorphism and the risk of HBV-related HCC. (a) Overall meta-analysis of the relationshipbetween HLA-DQ rs9275572 polymorphism and HBV-related HCC (HCC versus control) risk in dominant model (AA+AG versus GG). (b)Overall meta-analysis of the relationship between HLA-DQ rs9275572 polymorphism and HBV-related HCC (HCC versus CHB) risk indominant model (AA+AG versus GG).
7Gastroenterology Research and Practice
peptides to CD4+ T cells resulting in generating immunityagainst infection [20]. A study showed that the CD4+ T cellswere significantly increased in tumor, ascites, and peripheralblood of patients with HCC and showed that HBV-specificand HLA class II-restricted CD4+ T cell responses may berelated to HBV-related HCC development [21]. Recently,several studies have shown that genetic variations inHLA genes influence disease progression in HBV infection[22–25]. Accumulating evidence indicated the associationsbetween HLA-DQ (rs2856718 and rs9275572) polymor-phisms and HBV-related HCC, but the results are incon-clusive or inconsistent. Hu et al.’s study showed thatHLA-DQ rs2856718 polymorphism significantly decreased
host HBV-related HCC risk in Southeast Han Chinesepopulation [13]. Chen et al. confirmed that HLA-DQrs9275572 polymorphism was significantly associated withHBV-related HCC risk in Chinese population [14], whileKumar et al. identified that it was associated with HCV-related HCC in Japanese patients [15]. Gao et al.’s studysuggested that HLA-DQ (rs2856718 and rs9275572) poly-morphisms were the risk factor of HBV-related HCC[18]. Other’s study found that HLA-DQ rs2856718G andrs9275572A might be protective factors for HBV infec-tion, HBV natural clearance, and HBV-related HCCprogress [19]. However, Hou et al. found that HLA-DQrs9275572 polymorphism was significantly different from
0.45 0.540.47 0.62 0.69
Hu et al. (2012)
Al-Qahtani et al. (2014)
Gao et al. (2016)
Liu et al. (2016)
Meta-analysis estimates, given named study is omitted
Lower CI limitEstimateUpper CI limit
(a)
0.53 0.900.61 1.32 1.82
Hu et al. (2012)
Al-Qahtani et al. (2014)
Gao et al. (2016)
Liu et al. (2016)
Meta-analysis estimates, given named study is omitted
Lower CI limitEstimateUpper CI limit
(b)
Figure 4: Sensitivity analysis of the pooled ORs and 95% CIs for HLA-DQ rs2856718 polymorphism. (a) The sensitivity analysis results ofrs2856718 with HBV-related HCC (HCC versus control) in dominant model (AG+GG versus AA). (b) The sensitivity analysis results ofrs2856718 with HBV-related HCC (HCC versus CHB) in heterozygous model (AG versus AA).
8 Gastroenterology Research and Practice
the HBV-related HCC [17]. Meanwhile, a study observedthat there was no association between HLA-DQ (rs2856718and rs9275572) polymorphisms and HBV-related HCC inSaudi Arabian patients [16].
In order to resolve this conflict, we conducted a meta-analysis on the association between HLA-DQ (rs2856718and rs9275572) polymorphisms and HBV-related HCC.Meta-analysis has been recognized as an important toolto more precisely define the effect of selected genetic poly-morphisms on the risk for disease and to identify potentiallyimportant sources of between-study heterogeneity. There are
variations between human populations, so a SNP allele that iscommon in one geographical or ethnic group may be muchrarer in another. So we also analyzed the distribution ofHLA-DQ (rs2856718 and rs9275572) polymorphisms in dif-ferent ethnic groups. Our results indicated that HLA-DQ(rs2856718 and rs9275572) polymorphisms were associatedwith the decreased risk of HBV-related HCC in Chinese pop-ulation, but not in Saudi Arabian population. However, thesample size in Saudi Arabian population is too small to con-clude a negative association. The comparison between Chi-nese population and Saudi Arabian population may be
0.36 0.490.40 0.61 0.73
Hou et al. (2015)
Gao et al. (2016)
Liu et al. (2016)
Al-Qahtani et al. (2014)
Meta-analysis estimates, given named study is omitted
Lower CI limit Estimate Upper CI limit
(a)
0.56 0.750.64 0.88 0.94
Chen et al. (2013)
Al-Qahtani et al. (2014)
Hou et al. (2015)
Liu et al. (2016)
Gao et al. (2016)
Meta-analysis estimates, given named study is omitted
Lower CI limit Estimate Upper CI limit
(b)
Figure 5: Sensitivity analysis of the pooled ORs and 95% CIs for HLA-DQ rs9275572 polymorphism. (a) The sensitivity analysis results ofrs9275572 with HBV-related HCC (HCC versus control) in dominant model (AA+AG versus GG). (b) The sensitivity analysis results ofrs9275572 with HBV-related HCC (HCC versus CHB) in dominant model (AA+AG versus GG).
9Gastroenterology Research and Practice
imbalanced as a result of the sample size. Therefore, the find-ings of this study should be validated in the future through apopulation-based study.
As a meta-analysis of observational studies, there aresome limitations. Firstly, we did not have original data forall studies to adjust estimates and perform a more preciseanalysis, including gender, age, drinking, smoking, lifestyle,body mass index, and so on. Secondly, the number of pub-lished studies was not sufficiently large for a comprehensiveanalysis. Thirdly, the interaction of gene-gene and of gene-environment has not been evaluated owing to the absenceof original data. Therefore, more studies are needed to getmore reliable results.
In conclusion, the current meta-analysis suggested thatHLA-DQ (rs2856718 and rs9275572) polymorphisms wereassociated with HBV-related HCC risk among Chinese pop-ulation. Taken together, our study suggested that HLA-DQloci are candidate susceptibility regions that have somemarker SNPs (rs2856718 and rs9275572) for HBV-relatedHCC in Chinese population.
Conflicts of Interest
The authors declare that they have no conflicts of interest.
Acknowledgments
This work was supported by Anhui Provincial NaturalScience Research Project of University (KJ2013A188,KJ2014A164, and KJ2016A472), International Science andTechnology Cooperation Project-Key Research and Develop-ment Program of Anhui Province (1604b0602026), andNational Natural Science Foundation of China (81570011).
References
[1] R. L. Siegel, K. D. Miller, and A. Jemal, “Cancer statistics,2015,” CA: A Cancer Journal for Clinicians, vol. 65, no. 1,pp. 5–29, 2015.
[2] J. Ferlay, D. M. Parkin, M. P. Curado et al., Cancer Incidence infive Continents, Volumes I to X: IARC CANCER Base No. 10,2014, http://ci5.iarc.fr.
[3] K. A. McGlynn, J. L. Petrick, and W. T. London, “Global epi-demiology of hepatocellular carcinoma: an emphasis on demo-graphic and regional variability,” Clinics in Liver Disease,vol. 19, no. 2, pp. 223–238, 2015.
[4] K. A. McGlynn and W. T. London, “The global epidemiologyof hepatocellular carcinoma: present and future,” Clinics inLiver Disease, vol. 15, no. 2, pp. 223–243, 2011.
[5] D. M. Parkin, F. Bray, J. Ferlay, and P. Pisani, “Global cancerstatistics, 2002,” CA: A Cancer Journal for Clinicians, vol. 55,pp. 74–108, 2005.
[6] V. A. McCormack and P. Boffetta, “Today’s lifestyles, tomor-row’s cancers: trends in lifestyle risk factors for cancer inlow- and middle-income countries,” Annals of Oncology,vol. 22, no. 11, pp. 2349–2357, 2011.
[7] J. D. Yang and L. R. Roberts, “Hepatocellular carcinoma: aglobal view,” Nature Reviews Gastroenterology & Hepatology,vol. 7, no. 8, pp. 448–458, 2010.
[8] M. J. Bouchard and S. Navas-Martin, “Hepatitis B and C virushepatocarcinogenesis: lessons learned and future challenges,”Cancer Letters, vol. 305, no. 2, pp. 123–143, 2011.
[9] Y. Zheng, J. Huang, M. Zhan et al., “Genetic variants in theKDR gene is associated with the prognosis of transarterial che-moembolization treated hepatocellular carcinoma,” TumorBiology, vol. 35, no. 11, pp. 11473–11481, 2014.
[10] K. Ye, S. Chang, J. Li, X. Li, Y. Zhou, and Z. Wang, “A func-tional and protein-protein interaction analysis of neuroepithe-lial cell transforming gene 1 in hepatocellular carcinoma,”Tumor Biology, vol. 35, no. 11, pp. 11219–11227, 2014.
[11] Y. Lu, Z. Wu, Q. Peng et al., “Role of IL-4 gene polymorphismsin HBV-related hepatocellular carcinoma in a Chinese popula-tion,” PloS One, vol. 9, no. 10, article e110061, 2014.
[12] R. Singh, R. Kaul, A. Kaul, and K. Khan, “A comparativereview of HLA associations with hepatitis B and C viral infec-tions across global populations,”World Journal of Gastroenter-ology, vol. 13, no. 12, pp. 1770–1787, 2007.
[13] L. Hu, X. Zhai, J. Liu et al., “Genetic variants in human leuko-cyte antigen/DP-DQ influence both hepatitis B virus clearanceand hepatocellular carcinoma development,” Hepatology,vol. 55, no. 5, pp. 1426–1431, 2012.
[14] K. Chen, W. Shi, Z. Xin et al., “Replication of genome wideassociation studies on hepatocellular carcinoma susceptibilityloci in a Chinese population,” PloS One, vol. 8, no. 10, articlee77315, 2013.
[15] V. Kumar, N. Kato, Y. Urabe et al., “Genome-wide associationstudy identifies a susceptibility locus for HCV-induced hepa-tocellular carcinoma,” Nature Genetics, vol. 43, no. 5,pp. 455–458, 2011.
[16] A. A. Al-Qahtani, M. R. Al-Anazi, A. A. Abdo et al., “Associa-tion between HLA variations and chronic hepatitis B virusinfection in Saudi Arabian patients,” PloS One, vol. 9, no. 1,article e80445, 2014.
[17] S. H. Hou, J. Hu, Y. Zhang, Q. L. Li, and J. J. Guo, “Effects ofinteraction between genetic variants in human leukocyte anti-gen DQ and granulysin genes in Chinese Han subjects infectedwith hepatitis B virus,”Microbiology and Immunology, vol. 59,no. 4, pp. 209–218, 2015.
[18] X. Gao, W. Liu, X. Zhang et al., “Genetic polymorphism ofHLA-DQ confers susceptibility to hepatitis B virus-relatedhepatocellular carcinoma: a case-control study in Han popula-tion in China,” Tumor Biology, vol. 37, no. 9, pp. 12103–12111,2016.
[19] W. X. Liu, X. L. Zhang, X. Gao, L. Yang, B. Li, and D. Liu,“Association between HLA-DQ gene polymorphisms and dif-ferent outcomes of hepatitis B virus infection,” Chinese Journalof Epidemiology, vol. 37, no. 3, pp. 384–388, 2016, (Chinese).
[20] G. Diaz, M. Amicosante, D. Jaraquemada et al., “Functionalanalysis of HLA-DP polymorphism: a crucial role for DP betaresidues 9, 11, 35, 55, 56, 69, and 84-87 in T cell allorecognitionand peptide binding,” International Immunology, vol. 15,no. 5, pp. 565–576, 2003.
[21] L. A. Ormandy, T. Hillemann, H. Wedemeyer, M. P. Manns,T. F. Greten, and F. Korangy, “Increased populations of regu-latory T cells in peripheral blood of patients with hepatocellu-lar carcinoma,” Cancer Research, vol. 65, no. 6, pp. 2457–2464,2005.
[22] L. Wang, Z. Q. Zou, and K. Wang, “Clinical relevance of HLAgene variants in HBV infection,” Journal of ImmunologyResearch, vol. 2016, Article ID 9069375, 7 pages, 2016.
10 Gastroenterology Research and Practice
[23] S. W. Chang, C. S. Fann, W. H. Su et al., “A genome-wide asso-ciation study on chronic HBV infection and its clinical pro-gression in male Han-Taiwanese,” PloS One, vol. 9, no. 6,article e99724, 2014.
[24] S. Li, J. Qian, Y. Yang et al., “GWAS identifies novel suscepti-bility loci on 6p21.32 and 21q21.3 for hepatocellular carci-noma in chronic hepatitis B virus carriers,” PLoS Genetics,vol. 8, no. 7, article e1002791, 2012.
[25] D. K. Jiang, J. Sun, G. Cao et al., “Genetic variants in STAT4and HLA-DQ genes confer risk of hepatitis B virus-relatedhepatocellular carcinoma,” Nature Genetics, vol. 45, no. 1,pp. 72–75, 2013.
11Gastroenterology Research and Practice

Submit your manuscripts athttps://www.hindawi.com
Stem CellsInternational
Hindawi Publishing Corporationhttp://www.hindawi.com Volume 2014
Hindawi Publishing Corporationhttp://www.hindawi.com Volume 2014
MEDIATORSINFLAMMATION
of
Hindawi Publishing Corporationhttp://www.hindawi.com Volume 2014
Behavioural Neurology
EndocrinologyInternational Journal of
Hindawi Publishing Corporationhttp://www.hindawi.com Volume 2014
Hindawi Publishing Corporationhttp://www.hindawi.com Volume 2014
Disease Markers
Hindawi Publishing Corporationhttp://www.hindawi.com Volume 2014
BioMed Research International
OncologyJournal of
Hindawi Publishing Corporationhttp://www.hindawi.com Volume 2014
Hindawi Publishing Corporationhttp://www.hindawi.com Volume 2014
Oxidative Medicine and Cellular Longevity
Hindawi Publishing Corporationhttp://www.hindawi.com Volume 2014
PPAR Research
The Scientific World JournalHindawi Publishing Corporation http://www.hindawi.com Volume 2014
Immunology ResearchHindawi Publishing Corporationhttp://www.hindawi.com Volume 2014
Journal of
ObesityJournal of
Hindawi Publishing Corporationhttp://www.hindawi.com Volume 2014
Hindawi Publishing Corporationhttp://www.hindawi.com Volume 2014
Computational and Mathematical Methods in Medicine
OphthalmologyJournal of
Hindawi Publishing Corporationhttp://www.hindawi.com Volume 2014
Diabetes ResearchJournal of
Hindawi Publishing Corporationhttp://www.hindawi.com Volume 2014
Hindawi Publishing Corporationhttp://www.hindawi.com Volume 2014
Research and TreatmentAIDS
Hindawi Publishing Corporationhttp://www.hindawi.com Volume 2014
Gastroenterology Research and Practice
Hindawi Publishing Corporationhttp://www.hindawi.com Volume 2014
Parkinson’s Disease
Evidence-Based Complementary and Alternative Medicine
Volume 2014Hindawi Publishing Corporationhttp://www.hindawi.com