Embed Size (px)
Citation preview

DOI: 10.1161/CIRCULATIONAHA.112.120402
1
Association Between Coronary Vascular Dysfunction and Cardiac Mortality
in Patients with and without Diabetes Mellitus
Running title: Murthy et al.; Coronary vascular function in diabetes
Venkatesh L. Murthy, MD, PhD1,2; Masanao Naya, MD, PhD1; Courtney R. Foster, BS, CNMT3;
Mariya Gaber, MLA3; Jon Hainer, BSc3; Josh Klein, BA3; Sharmila Dorbala, MD, MPH1,3;
Ron Blankstein, MD1,2; Marcelo F. Di Carli, MD1,2,
1Noninvasive Cardiovascular Imaging Program, Depts of Medicine and Radiology; 2Division of
Cardiovascular Medicine; 3Division of Nuclear Medicine and Molecular Imaging,
Brigham and Women’s Hospital, Boston, MA
Address for Correspondence:
Marcelo F. Di Carli, M.D.
Brigham & Women’s Hospital
ASB-L1 037C
75 Francis St
Boston, MA 02115
Tel: (617) 732-6291
Fax: (617) 582-6056
E-mail:[email protected]
Journal Subject Codes: [7] Chronic ischemic heart disease; [32] Nuclear cardiology and PET; [87] Coronary circulation; [190] Type 2 diabetes
Ron Blankstein, MD1,2; Marcelo F. Di Carli, MD1,2,
1NoNoNoninininnvasasivivi ee CaCardrdioi vascular Imagig ngg Programm, DDeepts of Mediccininine ananddd RaR diology; f 2Division of
Cardiovaaascccullaarr MMMededicicicinine;e 3DDDivvvisssionn off Nuuucclleaar r r MeMeMedidicicinnee aaandd MMMololeececuulularar IIImamamagigiinggg,
BrB igigighahaham m m anand dd WoWoWomememen’n’n sss HoHoHospsppititalalal, BoBooststoonon,,, MAMAMA
Add f C d
by guest on May 30, 2018
http://circ.ahajournals.org/D
ownloaded from
by guest on M
ay 30, 2018http://circ.ahajournals.org/
Dow
nloaded from
by guest on May 30, 2018
http://circ.ahajournals.org/D
ownloaded from
by guest on M
ay 30, 2018http://circ.ahajournals.org/
Dow
nloaded from
by guest on May 30, 2018
http://circ.ahajournals.org/D
ownloaded from
by guest on M
ay 30, 2018http://circ.ahajournals.org/
Dow
nloaded from
DOI: 10.1161/CIRCULATIONAHA.112.120402
2
Abstract:
Background - Diabetes increases the risk of adverse cardiac outcomes and is considered a
coronary artery disease (CAD) equivalent. We examined whether coronary vascular dysfunction,
an early manifestation of CAD, accounts for increased risk among patients with diabetes
compared to non-diabetics.
Methods and Results - 2783 consecutive patients (1172 diabetics and 1611 non-diabetics)
underwent quantification of coronary flow reserve (CFR=stress divided by rest myocardial blood
flow) by PET and were followed for a median of 1.4 years (Q1-Q3: 0.7-3.2). The primary
endpoint was cardiac death. Impaired CFR (below the median) was associated with an adjusted
3.2 and 4.9-fold increase in the rate of cardiac death for diabetics and non-diabetics, respectively
(p=0.0004). Addition of CFR to clinical and imaging risk models improved risk discrimination
both diabetics and non-diabetics (c-index: 0.77 to 0.79, p=0.04, and 0.82 to 0.85, p=0.03,
respectively). Diabetic patients without known CAD with impaired CFR experienced a rate of
cardiac death comparable to that for non-diabetic patients with known CAD (2.8 vs 2.0%/year,
P=0.33). Conversely, diabetics without known CAD and preserved CFR had very low annualized
cardiac mortality, which was similar to patients without known CAD or diabetes and normal
stress perfusion and systolic function (0.3 vs. 0.5%/year, P=0.65).
Conclusions - Coronary vasodilator dysfunction is a powerful, independent correlate of cardiac
mortality among both diabetics and non-diabetics and provides meaningful incremental risk
stratification. Among diabetic patients without CAD, those with impaired CFR have event rates
comparable to patients with prior CAD while those with preserved CFR have event rates
comparable to non-diabetics.
Key words: coronary disease; diabetes mellitus; imaging; myocardial perfusion imaging
endpoint was cardiac death. Impaired CFR (below the median) was associated witth h anan aadjjussteted
3.2 and 4.9-fold increase in the rate of cardiac death for diabetics and non-diabeteticicics,s,, rrresesspepepectctctivivivelele yyy
p=0.0004). Addition of CFR to clinical and imaging risk models improved risk discrimination
bobooththth ddiaiabeetitiicscscs andnd nnonon-ddiaiabeb ticscs ((c-inded x:x: 00.7777 toto 00.79,, pp=00.04,, aaandnn 00.8.82 2 to 00.885,5, pp=00.003,3,
eeespppectively).) Diiaiabbbeticcc pppatieenenttsts witithohouuut kknownwnwn CADADAD wwititith h h imimimppaiirreedd CFRFRFR exxpxpeeriencncceedd aaa rraate ofoff
cardrdiaiaiaccc dededeaatathh cocoompmpmparararababablelele tto ththhatatat fffoor nononn d-d-diaiaiabebebetiticcc papapatitit enenntststs wwwititithhh knknknoowown nn CACACAD D (2(2(2 8.88 vvs 2.22 0%0%0%/y/y/yeaeaearr,r,
P=0.33).) Cononveversrselely,y, ddiaiai bebetititicscs wwitiithohoh ututt kkknonownwn CCCADADD anand dd prpresesererveved d d CFCFCFR RR hahah d d veveryry llowow annualizezedd
by guest on May 30, 2018
http://circ.ahajournals.org/D
ownloaded from

DOI: 10.1161/CIRCULATIONAHA.112.120402
3
Introduction
Despite advances in medical therapy, cardiovascular disease remains the leading cause of
mortality among patients with diabetes mellitus1. Indeed, diabetes has been classified as a
coronary heart disease equivalent2. For any degree of myocardial ischemia on non-invasive
testing, diabetics are at considerably higher risk of cardiac mortality than those without diabetes3.
This may be due in part to a higher prevalence of high-risk coronary anatomy among diabetics4.
However, the absence of myocardial ischemia on noninvasive testing in patients with diabetes
does not necessarily identify a lower risk cohort5. This may be related, at least in part, to the
observation that diffuse coronary vascular dysfunction in diabetes precedes overt
atherosclerosis6. Abnormalities of vascular dysfunction may help identify additional high-risk
populations for therapy who are missed by current risk stratification methods. Indeed, there is
growing, consistent evidence that impaired coronary vascular function is associated with adverse
prognosis7–10. However, the link between coronary vascular dysfunction and adverse outcomes
has been established in predominantly non-diabetic populations. Whether the strength of these
associations is maintained in the setting of diabetes is unknown.
This study was designed to test the hypothesis that the presence of impaired coronary
vasodilator function helps explain the observed excess risk of cardiac mortality among patients
with diabetes and to compare the strength of this association with non-diabetics.
Methods
Study Population
All patients referred for rest/stress cardiac PET at the Brigham & Women’s Hospital (Boston,
MA) between January 1, 2006 and June 30, 2010 were included in this study, excluding those
whose images were missing or uninterpretable due to poor image quality (n=254). In cases of
atherosclerosis6. Abnormalities of vascular dysfunction may help identify additiiooonalala hhhigiggh-h-h riririssksk
populations for therapy who are missed by current risk stratification methods. Indeed, there is
grgrowowwinining,g, ccconono ssisttenenent t evidence that impaired corononnararyy vascular funnccctionn iiiss s associated with adverse
progggnon sis7–1100. HoHoHowweweveveer,, tthehehe lllininnk k bbebettwtweeeenn cooorooonarryy vvasscscuululaarr dddysysfufuncnctitiionoon aandndd aaadvdveeersesee ooutttccocomememes
hahas ss bebebeenene eestststabaablilisshsheeded iinn pprprededoomominininanananttltly y nonoon-n-n-dddiabababetetticic ppoopopulululatatatiooonsnsn . WhWhWhetettheheherr ththhee ststs rereengngngthth off f ththeeesee e
associations iisss mamamaininintatat ininineded iiinn n ththeee seses ttttttining g g ofofof dddiaiaabebeb tetet s ss isisi uunknknknononownwnwn...
by guest on May 30, 2018
http://circ.ahajournals.org/D
ownloaded from
DOI: 10.1161/CIRCULATIONAHA.112.120402
4
repeat PET scans during the study period, only the earliest evaluable study was included. Patients
with diabetes were identified by interview, medical records and laboratory results (hemoglobin
A1c 6.5% or fasting plasma glucose 126 mg/dl). A combined analysis of all of the diabetic
and non-diabetic patients in this study was previously published11. The study was approved by
the Partners Healthcare Institutional Review Board and conducted in accordance with
institutional guidelines.
Risk Factor Assessment
Demographic factors and key elements of the patients’ history including risk factors and
medication use were ascertained at the time of the study by patient interview and review of
medical records. Diabetic nephropathy was identified based on medical records and laboratory
results (urine total protein 500 mg/dl, spot urine albumin/creatine ratio 30 mcg/mg or 24 hour
urine albumin 30 mg). Microalbuminuria was identified based on spot urine albumin/creatine
ratio 30 mcg/mg or 24 hour urine albumin 30 mg). Diabetic neuropathy and retinopathy were
identified from medical records.
Positron Emission Tomographic Imaging
Patients were studied using a whole body PET-CT scanner (Discovery RX or STE LightSpeed
64, GE Healthcare, Milwaukee, WI) after an overnight fast. Patients refrained from caffeine and
methylxanthine containing substances and drugs for 24 hours prior to their scans. Myocardial
blood flow (MBF) was measured during rest and peak stress using 82Rubidium as a perfusion
tracer, as described previously12. Briefly, after transmission imaging and beginning with the
intravenous bolus administration of 82Rubidium (1,480-2,200 MBq), list mode images were
acquired for seven minutes. Then, a standard intravenous infusion of dipyridamole, adenosine,
regadenoson or dobutamine was given. At peak stress, a second dose of 82Rubidium was injected
medical records. Diabetic nephropathy was identified based on medical records aaand dd lalaaboboborararatototoryry
esults (urine total protein 500 mg/dl, spot urine albumin/creatine ratio 30 mcg/mg or 24 hour
urrininnee e alalalbububumimiminnn 303030 mmg). Microalbuminuria was iiidddennntified based ononn spopoott t uuurine albumin/creatine
aatioo o 30 mcgg/m/mmg orr 2224 4 hohohoururur uuuririnenee aaalblbumummin 330 mmmggg). DiDiDiababeteticici nnneuuuroopapaathhhy y anananddd reretitit nononoppaathhhyy wewewere
ddenenentititifififieded fffrororomm mememedidicacal l rerecocordrdr s.ss
Positron Emimiissssssioioonnn ToToTomomom grgrgrapapa hihih cc c ImImImagagaginininggg
by guest on May 30, 2018
http://circ.ahajournals.org/D
ownloaded from
DOI: 10.1161/CIRCULATIONAHA.112.120402
5
and images were recorded in the same manner. The average radiation exposure per study was 4.6
mSv13,14. Heart rate, blood pressure, and 12-lead electrocardiogram were recorded at baseline
and every minute during and after pharmacological stress.
Image Analysis
Semiquantitative Analysis of Myocardial Perfusion
Semi-quantitative 17-segment visual interpretation of the gated myocardial perfusion images was
performed by experienced observers using a standard 5-point scoring system15,16. Summed rest
(SRS) and stress scores (SSS) were calculated as the sum of individual segmental scores on the
respective images, and their difference was recorded as summed difference score (SDS). These
were converted to percentages of left ventricular myocardium by dividing by the maximum
score, i.e. 68. For each of these variables, higher scores reflect larger areas of myocardial
ischemia and/or scar.
Left Ventricular Systolic Function
Rest and stress LV ejection fraction (LVEF) were calculated from gated myocardial perfusion
images using commercially available software. Left ventricular ejection fraction reserve was
considered present when LVEF increased from rest to stress.
Quantitative Myocardial Blood Flow and Flow Reserve
Absolute MBF (in ml/g/min) was computed from the dynamic rest and stress imaging series
using commercially available software (Corridor4DM; Ann Arbor, Michigan) and previously
validated methods12,17. Automated factor analysis was used to generate blood pool (arterial input
function) and tissue time-activity curves18. Regional and global rest and peak stress MBF were
calculated by fitting the 82Rubidium time-activity curves to a two-compartment tracer kinetic
model as described previously17. Per-patient global coronary flow reserve (CFR) was calculated
were converted to percentages of left ventricular myocardium by t dividing by the e mamaaxixiimumumum m m
core, i.e. 68. For each of these variables, higher scores reflect larger areas of myocardial
sschchhemememiiaia aaandndnd//or r scscscarar.
LLefftft Ventricululaarr SSysystotolililicc c FuFuFunncnctitiiononon
ReReststs aaandndn sstrtrtreseesss LVLVLV eejejeectttioion n frfrfracacctttioioion nn (L(LLVEVEVEF)F)F) wwwerere eee ccacalccculullatatateeded fffroror mmm gggatata eeed mmyoyoyocacacardrddiaiaialll pepeerfffususioioonn mm
mages usingngg cccomomommemem rcrcrciaiai lllyyy avavavaiaiailalalablblleee sososoftftftwawawarerere.. LeLeL ftftf vvvennntrtrt icicicululu ararar eeejejectctc ioioion n n frfrfracacactitiononon rrreseseserere ve was
by guest on May 30, 2018
http://circ.ahajournals.org/D
ownloaded from

DOI: 10.1161/CIRCULATIONAHA.112.120402
6
as the ratio of absolute MBF at stress over rest for the entire left ventricle. Quantitation of MBF
was performed post hoc by four operators in randomly allocated blocks of approximately fifty
patients. Prior to flow quantification, the intra-class correlation coefficient for CFR among these
four readers on a training set was 0.94 (95% CI 0.88-0.98), indicating excellent reproducibility.
Assessment of Outcomes
The primary outcome was death from any cardiac cause. Patients who died from non-cardiac
causes were censored. Vital status of all patients was ascertained by integrating data from the
Social Security Death Index, the National Death Index and the Partners Healthcare Research
Patient Data Registry. Cause of death was determined by blinded adjudication of hospital records
and death certificates. Early revascularization (within 90 days) was ascertained from the Partners
Healthcare Research Patient Data Registry and hospital records. Mortality from any cause was
used as a secondary endpoint.
Statistical Analysis
Statistical significance was assessed using Wilcoxon tests, Fisher exact and chi-square tests for
continuous, dichotomous and categorical variables, respectively. Two sided p-values < 0.05 were
considered significant. All statistical analyses were performed using SAS 9.3 (SAS Institute Inc.,
Cary, NC).
Multivariable Modeling
The Cox proportional hazards model19 was used to assess the impact of CFR on cardiac mortality
after controlling for the effects of critical covariates. A series of models were developed starting
with the Duke Clinical Score, an index of CAD likelihood and prognosis based on clinical
covariates20. Rest LVEF, combined extent and severity of scar and ischemia, stress-induced
LVEF augmentation (LVEF reserve) and CFR (dichotomized separately at the median values for
and death certificates. Early revascularization (within 90 days) was ascertained frfrrommm tthehehe PPPararartntnere s
Healthcare Research Patient Data Registry and hospital records. Mortality from any cause was
ussededd aaasss aa sesesecocoondddararary y endpoint.
SStStatattisi tical Annalallysysysiss
StStatatatisisstititicacall sisisiggngnififiiicaanancecee wwwasas aaassss esesesseseseddd usussinnngg g WiWiWilclclcoxoxxoonn ttteestststs,s,s, FFisisisheheher exexexacacctt aanand dd chchchi-i-i sqsqsquuauareee teeseststs foorr
continuous, didiichchchotottomomomououous ananand d d caaatetetegogoorricccalala vvvararariaiaiablblb eseses,, , rerer spppececectitit vevevelylyly. .. TwTwwo o o sisisidededed dd p-p-vavavalululueseses < 0.05 werree
by guest on May 30, 2018
http://circ.ahajournals.org/D
ownloaded from
DOI: 10.1161/CIRCULATIONAHA.112.120402
7
diabetics, 1.6, and non-diabetics, 1.9) were then sequentially incorporated into the model. In
order to investigate the effects of absolute peak stress MBF, we generated additional models
containing absolute stress MBF instead of CFR. The models were examined for the validity of
the proportional hazards assumption (using time-dependent covariates, standardized score
process plots and the Kolmogorov-type supremum test) and for additive value, taking care to
avoid over-fitting. Survival was plotted using direct adjusted survival probabilities21 from the
Cox survival model.
To assess for biases introduced by early revascularization, analyses were repeated
censoring all patients who underwent early revascularization22. In an exploratory analysis, we
considered the effect of any revascularization, including those >90 days after the PET scan, as a
time-dependent covariate.
Assessment of Incremental Value
Incremental prognostic value of CFR was assessed with the likelihood ratio test to determine the
improvement in prediction power of each sequential Cox model. The Harrell c-index23 and Nam-
D’Agostino calibration statistic24 were calculated for each model. The potential impact of CFR
on risk stratification was assessed by net reclassification improvement (NRI)25 at 2-years using
threshold annual rates of cardiac mortality of 1% and 3%, derived from the ACC/AHA
guidelines for management of chronic stable angina26.
Analysis of Annualized Event Rates
In order to assess the relative prognostic impact of diabetes with that of prior CAD, four groups
were constructed: (1) patients with known prior CAD (history of revascularization or myocardial
infarction) but free of diabetes, (2) patients with diabetes without history of CAD with impaired
CFR, (3) patients with diabetes without history of CAD with preserved CFR and (4) patients
considered the effect of any revascularization, including those >90 days after thehe PPETETET ssscacacan,n,n, aas s a
ime-dependent covariate.
AsAssesesessssssmemementntnt ooof InInnccrcremental Value
nncrrreme ental prprogoggnnooststicici vvvalalalueueue ooof f CFCFCFRR R wawawas asssseeesseedd wittth h ththeee lliikekellihhohoododd raaatioioo teesest t tototo dddeteteeermmiminnee ttthe
mmprprprovovovememenenenttt inin pprreredidicctiioion n popoowewewerrr ofofof eeaacach hh sesesequuuenene tttiaalal CCCoxoxx mmmododdelele .. ThThTheee HaHaHarrrrelelll l cc-c-ininndededex233 aandndn NNNaamam-
D’Agostino ccalala ibibi rararatititiononn sstaaatititistststicic242424 wwwerere e e cacacalclcl ulululatatatededed fffororr eacacach h h momomodededel.ll TTThehehe pppotototenenentitialalal iiimpmpmpacaca t of CFR
by guest on May 30, 2018
http://circ.ahajournals.org/D
ownloaded from
DOI: 10.1161/CIRCULATIONAHA.112.120402
8
without diabetes or CAD with normal scans (no perfusion abnormality at stress and rest LVEF
50%). Poisson regression was performed to compute annualize cardiac mortality rates adjusted
for Duke clinical risk score, combined extent and severity of scar and ischemia, rest LVEF and
early revascularization. The hypothesis that diabetes carries CAD equivalent risk only among
patients with decreased CFR was evaluated by comparing annualized cardiac mortality for
groups 1 versus 2, 1 versus 3, and 3 versus 4.
Results
Patient Characteristics
A total of 2783 consecutive patients (1172 with and 1611 without diabetes) met inclusion and
exclusion criteria during the study period and were followed for a median of 1.4 years (first and
third quartiles: 0.7-3.2 years). Baseline characteristics are given in Table 1. The most common
indications for testing were evaluation for chest pain, dyspnea, or their combination.
Approximately half of all studies were normal by semi-quantitative visual analysis.
Patient Outcomes
Mortality from any cause occurred in 279 patients, of which 137 (49.1%) were due to cardiac
causes (Table 2). Kaplan-Meier estimated three-year cardiac mortality was 11.6 and 5.8% for
patients with and without diabetes, respectively (p=0.0003).
The annualized rate of cardiac death increased with increasing extent and severity of
perfusion abnormalities (Figure 1) and was consistently higher for diabetics than non-diabetics
(P=0.02). Furthermore, regardless of ischemia and scar extent, or LVEF, impaired vs. preserved
CFR separated higher and lower risk subgroups in both diabetics and non-diabetics, including
among those with visually normal PET scans (Figure 2).
A total of 2783 consecutive patients (1172 with and 1611 without diabetes) met t inininclclclusssioioion nn ananandd d
exclusion criteria during the study period and were followed for a median of 1.4 years (first and
hhirirrddd quququararrtititilelelesss: 00 7.7.7-3-3.2 years). Baseline characteeriririststiics are given ininn Taablblblee e 1. The most common
nndiiicac tions for r teteestttinngg wewewererere eeevavvaluluatata iioionn ffoor chchheeest ppaaiinn, dydydyspspnnenea,a, ooor ththeieiirrr ccoombmbmbinininatatioioionn.n.
ApAppprprp oxoxoximimatatateleely y hhhallflf oofff aalall l sts uududieieesss wewew reree nnnororormmamal ll bybyby semememi-i-quququaanantitititatat ttitivevee vvvisissuaaal l anananalalalysysysiisis..
Patient Outctcomomomeseses
by guest on May 30, 2018
http://circ.ahajournals.org/D
ownloaded from

DOI: 10.1161/CIRCULATIONAHA.112.120402
9
Unadjusted Correlates of Cardiac Mortality Among Diabetics
Impaired CFR was associated with 6.0-fold (95%CI 3.2-11.0, p<0.0001) and 8.9-fold (95%CI
3.8-20.8, p<0.0001) increased rates of cardiac death among diabetics and non-diabetics,
respectively. Other significant correlates of increased rate of cardiac death included age, male
gender, BMI and prior CAD. Chest pain as a reason for testing and obesity were associated with
a decreased cardiac mortality, possibly reflecting confounding, although other explanations have
also been proposed27. As in prior studies, dyspnea was associated with increased cardiac
mortality among diabetics28, perhaps in part due to a slightly lower LVEF among diabetics with
dyspnea, 54% [Q1-Q3: 40-65%], compared to those without, 56% [Q1-Q3:47-64%], (p=0.053).
Dyspnea was not associated with increased cardiac mortality among non-diabetics. In addition, a
decrease in rest LVEF, as well as increasing burden of scar, ischemia or their combination on
semi-quantitative visual analysis were all significantly associated with increased cardiac
mortality in both patient cohorts.
Multivariable Survival Analysis and Incremental prognostic Value
A series of multivariable models were then constructed to assess the incremental value of CFR
after adjustment for critical covariates known to be associated with increased risk of cardiac
mortality for diabetics and non-diabetics (Table 3). Among diabetics, addition of CFR to a
model including the clinical risk, early revascularization, rest LVEF, a history of nephropathy
and retinopathy, LVEF reserve and the combined extent of ischemia and scar was associated
with a significant increase in global 2 and decrease in Akaike information criterion, indicating
improved model fit and a significant increase in the c-index from 0.77 to 0.79 (p=0.04).
Compared to those with preserved CFR, the fully-adjusted hazard ratio of impaired for cardiac
death was 3.2 (95% CI 1.7-6.2, p=0.0004) (Figure 3). Although the inclusion of peak stress
Dyspnea was not associated with increased cardiac mortality among non-diabeticiccs. IIn adadaddididitititionono , a
decrease in rest LVEF, as well as increasing burden of scar, ischemia or their combination on
eemimimi-q-q-quuauantntntitititaaativve ee vvivisual analysis were all signifficicicananntly associatedd wwith h h ininincrc eased cardiac
mmorrtrtality in bototh hh pppatitiieeent t t cocoohohohorrtrts.s
MuMuMultlttivivivarariaiaablblble e SSuSurrvrvivivvalall AAnaaalylylysisisisss anaandd d InInncrcrcremmmenenentaaal l pprprogogognnnostststicicc VVValalalueuee
A series of mumuultlttivivvararariaiai blblble e momomodedd lslsls wwwererere thththenenen ccconononststtruruructctcteded tttooo asasasseseessssss thehehe iiincncncrererememem ntntntalalal vvvalalalueuu of CFR
by guest on May 30, 2018
http://circ.ahajournals.org/D
ownloaded from

DOI: 10.1161/CIRCULATIONAHA.112.120402
10
MBF alone added incremental prognostic information, the use of CFR resulted in a significantly
better model fit (global 2 of 97.3 vs. 110.6, respectively).
Similarly, for non-diabetics, addition of CFR to a model containing the clinical risk, early
revascularization, rest LVEF, LVEF reserve and the combined extent of ischemia and scar
improved model fit and c-statistic (0.82 to 0.85, P=0.03). The fully adjusted hazard ratio for
cardiac death of impaired CFR was 4.9 (95%CI 2.0-11.5, p=0.0004).
Risk Reclassification
For both diabetics and non-diabetics, addition of CFR to the model resulted in the
reclassification of approximately 1 in 3 patients across clinically relevant categories of risk
(Tables 4-5, NRI 0.171 and 0.214, respectively). More than half of patients at intermediate risk,
between 1 and 3% annual cardiac mortality, were reclassified (NRI of 0.657 and 0.897 for
diabetics and non-diabetics, respectively). Importantly, diabetic and non-diabetic patients who
were downward reclassified from intermediate risk experienced 0.2 and 0.0% annualized cardiac
mortality, respectively (Supplemental Figures 1&2). Improvements in risk reclassification were
also noted after addition of CFR among patients considered low and high risk on the basis of
clinical risk and traditional stress imaging findings.
All-Cause Mortality
Analyses were repeated using mortality from any cause as a secondary outcome and the results
were similar. After adjustment for clinical risk and traditional stress imaging findings, impaired
CFR remained a significant correlate of mortality for both diabetics and non-diabetics and was
associated with 2.0 and 3.4-fold increased rates of death, respectively (p<0.001). Addition of
CFR improved c-indices for both diabetics (p=0.008) and non-diabetics (p=0.03) and with
favorable risk reclassification (Supplemental Table 1).
Tables 4-5, NRI 0.171 and 0.214, respectively). More than half of patients at inntttermrmmededediaiaatetete rrrisisk,,
between 1 and 3% annual cardiac mortality, were reclassified (NRI of 0.657 and 0.897 for
diiababbeteteticicicss ananandd d noon-n-n-didid abetics, respectively). Impororrtatat nnntly, diabetic aandnn nnononon-d-diabetic patients who
wwerrere downwararddd reeecllasasssiiifififiededed fffrrorom m ininntetermrmmediiaattee rissksk expppeererieiencncceded 0.22 aandnn 00.0.00%%% anannunnualalalizizizeddd ccaraardddiac
momoortrtr alalalititi y,y,y, rrresesespepecctctivvvelelyyy ((SuSupppplelememementntn alall FFFigigiguuureseses 11&2&2& ).). IImpmpmprorovevevemmementntnts s iinin rrrisisk kk rereeclclasasasssisificccattitiononn wwwere e
also noted aftftererer aaddddddititi ioioon nn offf CCCFFFR R R amamamonono g g g papapatititienenentstst ccconononsisidedeererered dd lololow w w anannd d d hihih ghghgh rrrisisi k k ononon ttthehehe bbasis of
by guest on May 30, 2018
http://circ.ahajournals.org/D
ownloaded from
DOI: 10.1161/CIRCULATIONAHA.112.120402
11
Comparison of patients with and without Diabetes mellitus
We sought to determine whether the presence of preserved CFR could separate diabetic patients
without known CAD with favorable prognosis (i.e. comparable to patients without CAD or
diabetes and with normal myocardial perfusion and systolic function) from those with
unfavorable prognosis (i.e. comparable to patients with known CAD with or without diabetes).
Adjusted annualized cardiac mortality was highest in patients with known CAD and diabetes and
lowest among patients with neither diabetes nor known CAD (Figure 4). Diabetic patients
without known CAD showed different annual cardiac mortality rates depending on their CFR.
Those with preserved CFR had a very low annual cardiac mortality that was comparable to
patients without diabetes or CAD with normal stress perfusion and systolic function (0.3 vs.
0.5%/year, respectively, p=0.65) and markedly lower than patients with known CAD (0.3 vs.
2.0%/year, respectively, p=0.015). In contrast, adjusted annualized cardiac mortality in diabetics
without known CAD who exhibited impaired CFR was comparable to that for non-diabetic
patients with known CAD (2.8 vs. 2.0%/year, p=0.33).
Discussion
This study demonstrates that the presence of coronary vascular dysfunction, as assessed by PET,
is an independent correlate of cardiac and all-cause mortality among patients with diabetes
mellitus as well as non-diabetics. We observed that inability to appropriately augment
myocardial blood flow in response to stress identified diabetics and non-diabetics with
substantially higher cardiac mortality (7.6 vs. 1.3%/year and 4.2 vs. 0.4%/year, respectively, both
p<0.0001). Furthermore, identification of coronary vasodilatory dysfunction improved risk
stratification beyond comprehensive clinical assessment, LV systolic function and semi-
patients without diabetes or CAD with normal stress perfusion and systolic funcctitiionnn (0.0.0.3 3 3 vsvsvs..
0.5%/year, respectively, p=0.65) and markedly lower than patients with known CAD (0.3 vs.
2..0%0%%/y/y/yeaear,rr, rreespeeectctctivively, p=0.015). In contrast, adadadjujusted annualizeed dd caarrdididiaac mortality in diabetics
wwithhhouo t knowwn n CACACAD D whwhwhoo exexexhihihibibiteteedd d imimmpppaireeed CFRRR wwaass ccomommppapararaablble too thhaat t fofofor r nonon-n-n dididiababa etetetiicic
papatititienenntstst wwititith h h knknowowown n CACACAD D (222.8.8. vvvsss. 222.0.0%/%/%/yeyeyeaaar, p=p=p 000.3333)).).
by guest on May 30, 2018
http://circ.ahajournals.org/D
ownloaded from
DOI: 10.1161/CIRCULATIONAHA.112.120402
12
quantitative measures of myocardial ischemia and scar. Indeed, quantitative estimation of
coronary vasodilator reserve in this cohort was able to improve risk stratification in more than
half of both diabetic and non-diabetic patients with intermediate risk based on clinical risk
factors and traditional stress imaging findings. Importantly, diabetic patients without known
CAD with impaired coronary vascular function experienced a rate of cardiac death comparable
to, and possibly higher than that for non-diabetic patients with known CAD. Conversely, the rate
of cardiac death in diabetic patients without known CAD was very low in the presence of
relatively preserved coronary vascular function. These findings may, in part, account for the
inconsistent relationship between diabetes and cardiac risk reported in the literature30–33.
Noninvasive measures of coronary vasodilator reserve integrate the hemodynamic effects
of focal epicardial coronary stenosis, the fluid dynamic effects of diffuse atherosclerosis and the
presence of coronary microvascular dysfunction. As a result, the observed relationship between
impaired coronary flow reserve and prognosis may be due to any or all of these factors
combined. Patients with diabetes may be more likely to have advanced multi-vessel epicardial
coronary disease34. Additionally, diffuse, albeit non-obstructive, atherosclerosis seen in diabetics
is known to be associated with vascular dysfunction35. Finally, microvascular dysfunction is
more prevalent among those with diabetes6. The increased prevalence of all three of these
factors, namely multi-vessel epicardial disease, diffuse disease and microvascular dysfunction,
among diabetics may account, in part, for the relatively worse prognosis of impaired CFR among
diabetics compared with non-diabetics.
Impaired vasomotor function among diabetics may be due to the adverse effects of
hyperglycemia6 and insulin resistance36 on vascular endothelium. Additionally, diabetes
promotes inflammation which also has adverse effects on vascular health37. Similarly, autonomic
Noninvasive measures of coronary vasodilator reserve integrate the hemomoodydydynanamimimicc c efefeffeffects
of focal epicardial coronary stenosis, the fluid dynamic effects of diffuse atherosclerosis and the
prresessenenenccece ooof f f cooroonananaryry microvascular dysfunctionnn.. AsAs a result, the oboo seervrvveeded relationship between
mmppapaired corononararryy flflowow rrresesesererrvevve aandndnd pprrrogggnosssisss maaayy be dduueue ttto ananyyy ooror aallllll oof f ththhesesee fafafactcttororo sss
coombmbmbininineded.. PaPaPatitienenntsss wwiitithh h didiabbbeteteteseses mmmayay bbe ee momomoreee llikikkelelly y totot hhhavavave e adada vvavancncncededd mmmululltitit -v-vvesessesesell l epeppicccararddiialll
coronary disseaeaasesee343434.. AdAdAddidid tionononalaa lyyy,,, dididifffff ususse,e,e aaalblblbeieie t t t nononon-n-n obobstststruruructctctivivve,e,e, aaththhererrosososclclclerererosossisisis ssseeeeeen n n in diabeticsss
by guest on May 30, 2018
http://circ.ahajournals.org/D
ownloaded from

DOI: 10.1161/CIRCULATIONAHA.112.120402
13
dysfunction has been associated with both increased risk38 and impaired coronary vascular
function39. Coronary flow-reserve measures integrate the adverse effects on the vasculature due
to all of these pathways which may also be relevant to non-diabetics.
Among diabetics without apparent myocardial ischemia or scar on visual evaluation of
myocardial perfusion images, 63% had preserved CFR. Among these patients, cardiac mortality
occurred at an extremely low rate (0.4%/year), comparable to rates for non-diabetic patients with
visually normal scans in our study and previously reported in the literature. Thus the excess
cardiac mortality seen in diabetic patients with visually normal stress testing is due to a relatively
small subgroup of these patients who also have severely impaired coronary vasodilator function.
Conversely, the extremely high cardiac mortality rates (3.5%/year) seen in those diabetics
despite the absence of overt ischemia or scar, suggests that patients with diffuse epicardial
atherosclerosis and/or microvascular dysfunction carry a prognosis comparable to those with
obstructive epicardial stenosis. This observation was confirmed by comparing adjusted
annualized cardiac mortality among all diabetics without history of CAD who had preserved
CFR, including those with abnormal scans, with non-diabetics without CAD, myocardial scar,
ischemia or systolic dysfunction, showing that diabetes itself in the absence of vasodilator
dysfunction is not associated with excess cardiac mortality. This finding has implications for the
classification of diabetes as a coronary disease risk equivalent2. Specifically, only among
diabetics with impaired vascular function is prognosis comparable to non-diabetic patients with
known CAD. Differing levels of vascular health among previously studied cohorts may account
for inconsistencies in the relative mortality rates of diabetics without CAD and non-diabetics
with CAD30–33. The therapeutic implications of the observation that diabetics with impaired CFR
have “CAD-equivalent” rates of cardiac death while those diabetics with preserved CFR have
Conversely, the extremely high cardiac mortality rates (3.5%/year) seen in those e ddidiababa eteteticicics ss
despite the absence of overt ischemia or scar, suggests that patients with diffuse epicardial
attheheerororosscsclelelerororosisis s ananndd/d/or microvascular dysfunctiononn caarry a prognossisisi comommppaparable to those with
obbststtrur ctive eppicicaaardddialall steteenononosisisiss.s. TThhihiss s obobbsseervaaatiioon wwwaaas cccononnfifirmrmrmeded bbyyy cocompmpmpararininingg g adaddjujujuststs ededed
annnnunualalalizizi ededd cccaarardidiacacc mmooorttaalilityy aammmonononggg alalll l dididiabababetticicics s wiwiwiththouououttt hihihistttororo y y y ofoff CCCADADAD wwhohoho hhadadd pppreesseserrvrvededd rrr
CFR, includiingngng tthohohoseses wwwiti h h abababnonoormrmrmalalal scacacansnsns,, wiwiwiththth nnnononon-d-diaiaabebebetititicscscs wwwiti hohohoututut CCCADADAD,, mymymyocococararardid al scar,
by guest on May 30, 2018
http://circ.ahajournals.org/D
ownloaded from
DOI: 10.1161/CIRCULATIONAHA.112.120402
14
extremely favorable prognosis is uncertain and deserves further investigation. Specifically,
whether impaired CFR can identify diabetics who will benefit from aspirin or other medical
interventions with conflicting evidence among diabetics may warrant further exploration.
The current study is a single-center, non-randomized, observational study and carries all
of the inherent limitations of that study design. As such, it is likely that some amount of residual
confounding remains, despite careful adjustment for clinically relevant covariates. On the other
hand, compared to data derived from patients selectively enrolled in a randomized trial, these
data, with very limited exclusion criteria, may be more representative of patients seen in routine
clinical practice. Follow-up was relatively limited and with longer observation periods, the
favorable prognosis of those with preserved CFR may not prove to be durable. Finally, we are
not able to evaluate the downstream impact of CFR on patient management decisions as referring
clinicians were not informed of CFR results in clinical reports. However, this reduces bias in
estimates of CFR effect size introduced by subsequent treatment decisions based on this result.
Conclusion
In summary, among both patients with and without diabetes, assessment of coronary vasodilator
function provides incremental risk stratification beyond routine measures of clinical risk,
including estimates of LV systolic function and the extent and severity of myocardial ischemia
and scar, and results in a meaningful risk reclassification of 1 in 3 patients with known or
suspected CAD. Furthermore, the nearly two thirds of diabetic patients without overt myocardial
ischemia or scar who also have relatively preserved coronary vasodilator capacity have an
extremely low rate of cardiac mortality (0.4%/year). The presence of abnormal CFR identified
diabetic patients without overt CAD who experience a rate of cardiac death at least as high as
favorable prognosis of those with preserved CFR may not prove to be durable. FFiininalala lylyy,, wewewe aaarere
not able to evaluate the downstream impact of CFR on patient management decisions as referring
cllininniciciciaiaiansns wwwerre nononottt ini formed of CFR results in ccclllinini iiical reports. HoHooweveveerr,r, this reduces bias in
estiimmam tes of CCFRFRFR eeefffffeecct sisisizeze iiinntntrrododduucuceedd bby ssusubbbseqqquuenttt ttrrereatattmmementntt dddeccisisi ioi nsns bbbaasaseded ooon n n thththis rrresesululu tt.t
Conclusion
by guest on May 30, 2018
http://circ.ahajournals.org/D
ownloaded from

DOI: 10.1161/CIRCULATIONAHA.112.120402
15
(and possibly higher than) that for non-diabetic patients with known CAD. These findings may
provide a pathophysiologic explanation for the inconsistencies in studies comparing mortality
rates of diabetics without CAD and non-diabetics with CAD.
Funding Sources: The study was funded in part by grants from the National Institutes of Health
(RC1 HL101060-01 and T32 HL094301-01A1).
Conflict of Interest Disclosures: Dr. Di Carli receives research grant support from Toshiba.
References:
1. Grundy SM, Benjamin IJ, Burke GL, Chait A, Eckel RH, Howard BV, Mitch W, Smith SC, Sowers JR. Diabetes and Cardiovascular Disease�: A Statement for Healthcare Professionals From the American Heart Association. Circulation. 1999;100:1134-1146.
2. Expert Panel on Detection, Evaluation, and Treatment of High Blood Cholesterol in Adults. Executive Summary of the Third Report of the National Cholesterol Education Program (NCEP) Expert Panel on Detection, Evaluation, and Treatment of High Blood Cholesterol in Adults (Adult Treatment Panel III). JAMA. 2001;285:2486 -2497.
3. Giri S, Shaw LJ, Murthy DR, Travin MI, Miller DD, Hachamovitch R, Borges-Neto S, Berman DS, Waters DD, Heller GV. Impact of Diabetes on the Risk Stratification Using Stress Single-Photon Emission Computed Tomography Myocardial Perfusion Imaging in Patients With Symptoms Suggestive of Coronary Artery Disease. Circulation. 2002;105:32-40.
4. Rajagopalan N, Miller TD, Hodge DO, Frye RL, Gibbons RJ. Identifying high-risk asymptomatic diabetic patients who are candidates for screening stress single-photon emission computed tomography imaging. J Am Coll Cardiol. 2005;45:43-49.
5. Shaw L, Iskandrian A. Prognostic value of gated myocardial perfusion SPECT. J Nucl Cardiol. 2004;11:171-185.
6. Di Carli MF, Janisse J, Ager J, Grunberger G. Role of chronic hyperglycemia in the pathogenesis of coronary microvascular dysfunction in diabetes. J Am Coll Cardiol. 2003;41:1387-1393.
7. Murthy VL, Naya M, Foster CR, Hainer J, Gaber M, Di Carli G, Blankstein R, Dorbala S, Sitek A, Pencina MJ, Di Carli MF. Improved Cardiac Risk Assessment With Noninvasive Measures of Coronary Flow Reserve. Circulation. 2011;124:2215-2224.
8. Herzog BA, Husmann L, Valenta I, Gaemperli O, Siegrist PT, Tay FM, Burkhard N, Wyss
1. Grundy SM, Benjamin IJ, Burke GL, Chait A, Eckel RH, Howard BV, Mitch WW, , , SmSmSmitith h SCSC, ,,Sowers JR. Diabetes and Cardiovascular Disease�: A Statement for Healthcare PPProrofefef sssssioioionananalslls From the American Heart Association. Circulation. 1999;100:1134-1146.
2. Expxpert Paanen l onon DDetection, Evaluation, and Trreatment of High Bloood d Cholesterol in Adults. Exxecececutututiviviveee SuSuSummmmmararary y of the Third Report of the NNNaattiional Cholestererrol EEdududucac tion Program (NCEP)ExExxpepepert Panelell on n DeDeD tetectctctioioion,n,n, EEvavaalululuatata ioioon,n,, aaandndd TTrereaatmmmeent ofofof HHHigigigh BBlBlooooood d ChChCholo esesteteterororoll l inin AAdududultlttsssAAddudult Treatmemennnt PPPananele IIIIIIIII)).). JAJAJAMAMAMA... 20200001;288585:2488866 -24949497.7.
3.. GGGiriririi i S,S,S, SSShahahaww LJLJLJ, , , MMuurrtthyhy DDDR,R,R, TTTrararavivinnn MIMIMI,, , MiMiMilllleeer DDDDDD, HHHaacachahahamommovivivitctct hh h R,R,R, BBBororo gegeges-s--NNNetooo SSS,,Bermrmanan DDS,S WWata errss DDD, HeH llllerer GGV.V Impmpacact t ofof DDiabeteteses oon n ththee RiRisksk SStrt atitifificacatitionon UUsisingg SStrtrese s s Single-Photoon n n EmEmEmisisissisiononon CComomompupuutetetedd TTTomommogogograraraphphphy y y MyMyMyococararardididialalal PPPerererfuuusisis ononon IIImamamagigingngng iiin n n PaPaP tients WithhhddSySympmptotomsms SSuguggegeststivivee ofof CCororononararyy ArArteteryry DDisiseaeasese CiCircrcululatatioionn 20200202;1;10505:3:322-4040
by guest on May 30, 2018
http://circ.ahajournals.org/D
ownloaded from
DOI: 10.1161/CIRCULATIONAHA.112.120402
16
CA, Kaufmann PA. Long-Term Prognostic Value of 13N-Ammonia Myocardial Perfusion Positron Emission Tomography: Added Value of Coronary Flow Reserve. J Am Coll Cardiol. 2009;54:150-156.
9. Tio RA, Dabeshlim A, Siebelink H-MJ, de Sutter J, Hillege HL, Zeebregts CJ, Dierckx RAJO, van Veldhuisen DJ, Zijlstra F, Slart RHJA. Comparison Between the Prognostic Value of Left Ventricular Function and Myocardial Perfusion Reserve in Patients with Ischemic Heart Disease. J Nucl Med. 2009;50:214-219.
10. Ziadi MC, deKemp RA, Williams KA, Guo A, Chow BJW, Renaud JM, Ruddy TD, Sarveswaran N, Tee RE, Beanlands RSB. Impaired Myocardial Flow Reserve on Rubidium-82 Positron Emission Tomography Imaging Predicts Adverse Outcomes in Patients Assessed for Myocardial Ischemia. J Am Coll Cardiol. 2011;58:740-748.
11. Di Carli MF, Murthy VL. Cardiac PET/CT for the evaluation of known or suspected coronary artery disease. Radiographics. 2011;31:1239-1254.
12. El Fakhri G, Sitek A, Guerin B, Kijewski MF, Di Carli MF, Moore SC. Quantitative Dynamic Cardiac 82Rb PET Using Generalized Factor and Compartment Analyses. J Nucl Med. 2005;46:1264-1271.
13. Senthamizhchelvan S, Bravo PE, Esaias C, Lodge MA, Merrill J, Hobbs RF, Sgouros G, Bengel FM. Human Biodistribution and Radiation Dosimetry of 82Rb. J Nucl Med. 2010;51:1592-1599.
14. Senthamizhchelvan S, Bravo PE, Lodge MA, Merrill J, Bengel FM, Sgouros G. Radiation Dosimetry of 82Rb in Humans Under Pharmacologic Stress. J Nucl Med. 2011;52:485-491.
15. Machac J, Bacharach SL, Bateman TM, Bax JJ, Beanlands R, Bengel F, Bergmann SR, Brunken RC, Case J, Delbeke D, DiCarli MF, Garcia EV, Goldstein RA, Gropler RJ, Travin M, Patterson R, Schelbert HR. Positron emission tomography myocardial perfusion and glucose metabolism imaging. J Nucl Cardiol. 2006;13:e121-151.
16. Cerqueira MD, Weissman NJ, Dilsizian V, Jacobs AK, Kaul S, Laskey WK, Pennell DJ, Rumberger JA, Ryan T, Verani MS. Standardized Myocardial Segmentation and Nomenclature for Tomographic Imaging of the Heart: A Statement for Healthcare Professionals From the Cardiac Imaging Committee of the Council on Clinical Cardiology of the American Heart Association. Circulation. 2002;105:539-542.
17. El Fakhri G, Kardan A, Sitek A, Dorbala S, Abi-Hatem N, Lahoud Y, Fischman A, Coughlan M, Yasuda T, Di Carli MF. Reproducibility and Accuracy of Quantitative Myocardial Blood Flow Assessment with 82Rb PET: Comparison with 13N-Ammonia PET. J Nucl Med. 2009;50:1062-1071.
18. Sitek A, Gullberg GT, Huesman RH. Correction for ambiguous solutions in factor analysis using a penalized least squares objective. IEEE Trans Med Imaging. 2002;21:216-225.
12. El Fakhri G, Sitek A, Guerin B, Kijewski MF, Di Carli MF, Moore SC. Quantititatatatitit veve Dynamic Cardiac 82Rb PET Using Generalized Factor and Compartment Analyysseses.s.s JJ J NuNuNuclclcl MMMeed.2005;46:1264-1271.
13. Senthamizhchelvan S, Bravo PE, Esaias C, Lodge MA, Merrill J, Hobbs RF, Sgouros G,Beengngngelelel FFFM.M.M. HHHummmaanan Biodistribution and Radiatioioonn DDosimetry of 882Rb.b.. J J J Nucl Med. 2020010100;5;51:1 155929292-159599.9.
1441 . SeS nthamiizhcchheeelvaann S, BBBraraavoo PPE,E, LLLoodgee MMMA, MMMerrrilililll l J,J,J, BBBenggegell FMMM, SgSgououuroos GGG. RRaadadiiatioonon DoDoosisiimemem trt y y ofofof 8822RRbb b inin HHHumumaanans ss UnUnUndededer PhPhhararrmamamacocololooggigic StSttreresssss. J J J NNuNuclclcl MMMededd. 2020201111;5;5222:444855-449491.1.
151515. MMMa hhchac JJJ, , BBBa hhcharachhh SLSLSL,, BBBattteman n TMTMTM, , BBBax JJJJJJ, BBeBeananllla ddnds R,R,R, BBBengegeg lll F,F,F, BBBergmgmg ann SRSRSR, BrBrununkekenn RCRCC,, CaCaC sese JJJ,, DeDDelblbekekkee D,D, DDDiCiiCararllili MMMF,F,F GGGararcciaia EEV,VV, GGGollolddsdsteteinini RRRA,A,A GGGroroplplerer RRRJ,J, TTraravivinn M,M,
by guest on May 30, 2018
http://circ.ahajournals.org/D
ownloaded from

DOI: 10.1161/CIRCULATIONAHA.112.120402
17
19. Cox DR. Regression Models and Life-Tables. J R Stat Soc Series B Stat Methodol. 1972;34:187-220.
20. Pryor DB, Shaw L, McCants CB, Lee KL, Mark DB, Harrell FE, Muhlbaier LH, Califf RM. Value of the History and Physical in Identifying Patients at Increased Risk for Coronary Artery Disease. Ann Intern Med. 1993; 118:81 -90.
21. Nieto FJ, Coresh J. Adjusting Survival Curves for Confounders: A Review and a New Method. Am Journal of Epidemiol. 1996; 143:1059 -1068.
22. Hachamovitch R, Di Carli MF. Methods and Limitations of Assessing New Noninvasive Tests: Part II: Outcomes-Based Validation and Reliability Assessment of Noninvasive Testing. Circulation. 2008; 117:2793-2801.
23. Harrell FE Jr, Lee KL, Mark DB. Multivariable prognostic models: issues in developing models, evaluating assumptions and adequacy, and measuring and reducing errors. Stat Med. 1996; 15:361-387.
24. D’Agostino RB, Nam B-H. Evaluation of the Performance of Survival Analysis Models: Discrimination and Calibration Measures [Internet]. In: Balakrishnan N, Rao CR, editors. Advances in Survival Analysis. Elsevier; 2003 [cited 2012 Jul 24]. p. 1-25.Available from: http://www.sciencedirect.com/science/article/pii/S0169716103230017
25. Pencina MJ, D’ Agostino Sr RB, D’ Agostino Jr RB, Vasan RS. Evaluating the added predictive ability of a new marker: From area under the ROC curve to reclassification and beyond. Stat Med. 2008;27:157-172.
26. Gibbons RJ, Chatterjee K, Daley J, Douglas JS, Fihn SD, Gardin JM, Grunwald MA, Levy D, Lytle BW, O’Rourke RA, Schafer WP, Williams SV, Ritchie JL, Cheitlin MD, Eagle KA, Gardner TJ, Garson A Jr, Russell RO, Ryan TJ, Smith SC Jr. ACC/AHA/ACP-ASIM guidelines for the management of patients with chronic stable angina: a report of the American College of Cardiology/American Heart Association Task Force on Practice Guidelines (Committee on Management of Patients With Chronic Stable Angina). J Am Coll Cardiol. 1999;33:2092-2197.
27. Romero-Corral A, Montori VM, Somers VK, Korinek J, Thomas RJ, Allison TG, Mookadam F, Lopez-Jimenez F. Association of bodyweight with total mortality and with cardiovascular events in coronary artery disease: a systematic review of cohort studies. The Lancet. 2006;368:666-678.
28. Zellweger MJ, Hachamovitch R, Kang X, Hayes SW, Friedman JD, Germano G, Pfisterer ME, Berman DS. Prognostic relevance of symptoms versus objective evidence of coronary artery disease in diabetic patients. Eur Heart J. 2004;25:543-550.
29. Steyerberg EW, Pencina MJ. Reclassification Calculations for Persons With Incomplete Follow-up. Ann Intern Med. 2010;152:195-196.
30. Haffner SM, Lehto S, Rönnemaa T, Pyörälä K, Laakso M. Mortality from coronary heart
24. D’Agostino RB, Nam B-H. Evaluation of the Performance of Survival Anallysysysisisis MMModododelelels:s:s: Discrimination and Calibration Measures [Internet]. In: Balakrishnan N, Rao CRR, edededitititororors.ss. Advances in Survival Analysis. Elsevier; 2003 [cited 2012 Jul 24]. p. 1-25.Available from: http://www.sciencedirect.com/science/article/pii/S0169716103230017
25255. PPePencn inna a MMMJ,, D’D’ AAgogoststinino o SrSr RRB,B, DD’ AgAgosostitinono JJrr RBB, , VaVasan n RSRSR . EvEvalaluatitingng tthehe addddeded pprredddictive abibililitytyty ooof a aa neneeww w mamamarkrkrkererr: FrFrF omomom areeea unddederr thhhee ROROROCCC cucuurvrvve e totoo reecclaassssssififificicatatatioioi n nn anannd d dbeeb yoyoond. Stat Meddd. 200008;;27:7:1515157-7 171722.
2626. GiGiGibbbbbboononss RJRJJ,, ChChChatattttete jrjrjeeee KK,, DaDaDalleley J,J DDDoououglglglasa JJJSSS, FFFihihhn nn SDSDSD,, GaGarddrdiinin JJJM,MM, GGrurunwnwnwalald d MAMAMA,, LeLeL vyvy DDD, LLL ttytllle BBBWW,W, OOO’R’R’Rou kkrke RARARA, , SSSchhhafffer WPWPWP, , WiWiWilllllliiiams SVSVSV, , RiRiRitttchihihie JLJLJL,,, ChChCh iieitltltliiin MMMD,D,D, EEEagagllle KKKAAA, GaGardrdnenerr TJTJ,, GaGaG rsrsonon AAA JJJr,r, RRRusussesellll RRROO,O, RRRyayan n TJTJTJ,, SmSmititthh h SCSCC JJr.r. AAACCCC/A/A/AHAHAHA///AACACP-P-P ASASSIMIMIM gguiuidedelilinenesss
by guest on May 30, 2018
http://circ.ahajournals.org/D
ownloaded from

DOI: 10.1161/CIRCULATIONAHA.112.120402
18
disease in subjects with type 2 diabetes and in nondiabetic subjects with and without prior myocardial infarction. N Engl J Med. 1998;339:229-234.
31. Schramm TK, Gislason GH, Køber L, Rasmussen S, Rasmussen JN, Abildstrøm SZ, Hansen ML, Folke F, Buch P, Madsen M, Vaag A, Torp-Pedersen C. Diabetes Patients Requiring Glucose-Lowering Therapy and Nondiabetics With a Prior Myocardial Infarction Carry the Same Cardiovascular Risk. Circulation. 2008;117:1945-1954.
32. Bulugahapitiya U, Siyambalapitiya S, Sithole J, Idris I. Is diabetes a coronary risk equivalent? Systematic review and meta-analysis. Diabet Med. 2009;26:142-148.
33. Wannamethee SG, Shaper AG, Whincup PH, Lennon L, Sattar N. Impact of Diabetes on Cardiovascular Disease Risk and All-Cause Mortality in Older Men: Influence of Age at Onset, Diabetes Duration, and Established and Novel Risk Factors. Arch Intern Med. 2011;171:404-410.
34. Ertek S, Cicero AF, Cesur M, Akcil M, Kayhan TA, Avcioglu U, Korkmaz ME. The severity of coronary atherosclerosis in diabetic and non-diabetic metabolic syndrome patients diagnosed according to different criteria and undergoing elective angiography. Acta Diabetol. 2010;48:21-27.
35. Nahser PJ, Brown RE, Oskarsson H, Winniford MD, Rossen JD. Maximal Coronary Flow Reserve and Metabolic Coronary Vasodilation in Patients With Diabetes Mellitus. Circulation. 1995;91:635-640.
36. Quiñones MJ, Hernandez-Pampaloni M, Schelbert H, Bulnes-Enriquez I, Jimenez X, Hernandez G, De La Rosa R, Chon Y, Yang H, Nicholas SB, Modilevsky T, Yu K, Van Herle K, Castellani LW, Elashoff R, Hsueh WA. Coronary vasomotor abnormalities in insulin-resistant individuals. Ann. Intern Med. 2004;140:700-708.
37. Sundell J, Rönnemaa T, Laine H, Raitakari OT, Luotolahti M, Nuutila P, Knuuti J. High-sensitivity C-reactive protein and impaired coronary vasoreactivity in young men with uncomplicated type 1 diabetes. Diabetologia. 2004;47:1888-1894.
38. Young LH, Wackers FJT, Chyun DA, Davey JA, Barrett EJ, Taillefer R, Heller GV, Iskandrian AE, Wittlin SD, Filipchuk N, Ratner RE, Inzucchi SE. Cardiac outcomes after screening for asymptomatic coronary artery disease in patients with type 2 diabetes: the DIAD study: a randomized controlled trial. JAMA. 2009;301:1547-1555.
39. Di Carli MF, Bianco-Batlles D, Landa ME, Kazmers A, Groehn H, Muzik O, Grunberger G. Effects of Autonomic Neuropathy on Coronary Blood Flow in Patients With Diabetes Mellitus. Circulation. 1999;100:813-819.
of coronary atherosclerosis in diabetic and non-diabetic metabolic syndrome patieentnts s s didiagagnonosesed according to different criteria and undergoing elective angiography. Acta Diabeetotoolll. 20020101010;4;4;48:8:8:22121-27.
35. Nahser PJ, Brown RE, Oskarsson H, Winniford MD, Rossen JD. Maximal Coronary FlowReeseseervrvrveee anananddd MeMeM ttatabobob lic Coronary Vasodilation iinn n PaPaP tients With DiD abetettesess Mellitus. Circulation. 1919995955;9;91:1 6335-5-5-6440.0.
3663 . QuQQ iñoness MJJJ, HHerrnanaanddeezez--P-Pamampapalooonnii M,, SSScheeelbbbert t H,H,H, BBBuullnees-s-EEnriquququezez I, , Jiimeeeneneez z X,X, HeHeernrnnanana dedez z G,G,G, DDee LLaLa RRRoososa a R,R,R, CCChohohonn n YY,Y, YYYanannggg H,H,H, NNNicchchooolaasas SSSB,B,, MMMododdililleveve skskky y TT,T, YYYu u K,K,K, VVaanan HHererrleee KKCCaststellellalalaninini LLLW,W, EEEllalashshhoffoffff RR,R HHssueueuehh h WAWA. CoCoCorororonanaryry vvasasomommototoror aabnnorormamalililitititieses iin n inininssusulilin-n-rere isisi tststananttt ndididi iividddu llals. AAnAnn. III tntern n MMMedd.d. 2220000004;4;4;1414140:0:0:70707000-0-70707088.8.
by guest on May 30, 2018
http://circ.ahajournals.org/D
ownloaded from

DOI: 10.1161/CIRCULATIONAHA.112.120402
19
Table 1. Patient Characteristics
Variable Non-Diabetics (N=1611)
Diabetics (N=1172)
All Patients (N=2783)
p-Value
Demographics Age (y) 64.3 [55.3-76] 65.4 [57.3-74.1] 64.8 [56.1-75.2] 0.63 Male gender 747 (46.4) 586 (50) 1333 (47.9) 0.06 Hispanic 134 (8.3) 169 (14.4) 303 (10.9) <0.0001 Race <0.0001 White 1134 (70.4) 628 (53,6) 1762 (63.3) Black 208 (12.9) 245 (20.9) 453 (16.3) Other/Unknown 269 (16.7) 299 (25.5) 568 (20.41) Risk Factors BMI (kg/m2) 27.5 [24.4-32.3] 30.9 [26.5-37.6] 28.8 [25.1-34.4] <0.0001 BMI 30 kg/m2 548 (34) 656 (56) 1204 (43.3) <0.0001 Hypertension 1207 (74.9) 1064 (90.8) 2271 (81.6) <0.0001 Dyslipidemia 966 (60) 887 (75.7) 1853 (66.6) <0.0001 Family history of CAD 471 (29.2) 285 (24.3) 756 (27.2) 0.004 Tobacco Use 175 (10.9) 119 (10.2) 294 (10.6) 0.57 Duke Clinical Risk (%) 37.8 [14-74.4] 61.7 [28-86.7] 47.9 [18.7-81.1] <0.0001 Diabetes Complications Retinopathy 0 (0) 85 (7.3) 85 (3.1) <0.0001 Nephropathy 0 (0) 178 (15.2) 178 (6.4) <0.0001 Microalbuminuria 53 (3.3) 206 (17.6) 259 (9.3) <0.0001 Neuropathy 0 (0) 157 (13.4) 157 (5.6) <0.0001 Diabetes Control HbA1c Unknown 1356 (84.2) 577 (49.2) 1933 (69.5) <0.0001 HbA1c 5.8 [5.6-6.1] 7.1 [6.4-8.4] 6.5 [5.9-7.7] <0.0001 Medications Aspirin 911 (56.5) 794 (67.7) 1705 (61.3) <0.0001 -adrenergic blockers 940 (58.3) 822 (70.1) 1762 (63.3) <0.0001 Cholesterol agents 880 (54.6) 843 (71.9) 1723 (61.9) <0.0001 Insulin 0 (0) 443 (37.8) 443 (15.9) <0.0001 Oral hypoglycemic agents 3 (0.2) 281 (24) 284 (10.2) <0.0001 Ca-channel blockers 303 (18.8) 318 (27.1) 621 (22.3) <0.0001 ACE inhibitors 514 (31.9) 590 (50.3) 1104 (39.7) <0.0001 Nitrates 160 (9.9) 196 (16.7) 356 (12.8) <0.0001 Diuretics 476 (29.5) 549 (46.8) 1025 (36.8) <0.0001 Indications Chest Pain 753 (46.7) 553 (47.2) 1306 (46.9) 0.82 Dyspnea 457 (28.4) 395 (33.7) 852 (30.6) 0.003 Post-MI 136 (8.4) 115 (9.8) 251 (9) 0.23 Pre-operative 251 (15.6) 157 (13.4) 408 (14.7) 0.12 Cardiovascular History Any prior CAD 569 (35.3) 606 (51.7) 1175 (42.2) <0.0001 Recent MI ( 30 days) 156 (9.7) 160 (13.7) 316 (11.4) 0.001 Remote MI (>30 days) 248 (15.4) 263 (22.4) 511 (18.4) <0.0001 Prior PCI 286 (17.8) 326 (27.8) 612 (22) <0.0001 Prior CABG 160 (9.9) 209 (17.8) 369 (13.3) <0.0001 Cerebrovascular Disease 82 (5.1) 88 (7.5) 170 (6.1) 0.01 Peripheral Vascular Disease 83 (5.2) 98 (8.4) 181 (6.5) 0.0008 Early Revascularization ( 90 days post-PET)
120 (7.4) 115 (9.8) 235 (8.4) 0.03
Duke Clinical Risk (%) 37.8 [14-74.4] 61.7 [28-86.7] 47.9 [18.7-81.1] <<0.0.00000101 Diabetes Complications Retinopathy 0 (0) 85 (7.3) 85 (3.1) <0<0<0.00.0000000111 Nephropathy 0 (0) 178 (15.2) 178 (6.4) <0.0001 Microalbuminuria 53 (3.3) 206 (17.6) 259 (9.3) <0.0001
NNeueuroroopapapathhy y y 0 (0) 157 (13.4) 11157575 (5.6) <0.0001 DiDiiabababeetetese CCConono ttroll
HHHbbA1c Unknkknoownwnwn 1313565656 (((8484 2.2.2)) ) 577777 (4(4(499.9.2)2 1193939333 (669.9.5)5)5) <<<0.0..00000001010 HHHbA1c 5.5..8 8 [[5..66-6.111] 7.11 [6[6[6.44--8- .44. ]] 6.66.5 5 [[5.999-7-7-7.7.7]] <0<00.0.00000 111
MeMeMedid cations AAAspspspiririn 9199111 (5(556.6.5)5)5) 7799494 ((67677.77))) 171770055 ((6616 .33.3) ) <<0<0.0.00000111
-aa-adrdrdrenenenererergigic c blblblococockkekersrsrs 94940 0 (5(5(588.8.3)3)3) 88222222 (((77070 11.1))) 171717626262 ((63633 3.3.3)) ) <0<0<0.0.00000000111CCChohoholelelestststerererololol aaagegegentntntsss 888888000 (5(5(5444.6)6)6) 888434343 (((717171 99.9))) 171717232323 (((616161 99.9))) <0<0<0 00.0000000111
Insulin 000 (0(0(0))) 4444 333 (3(3(37.7.7.8)8)8 444434343 (((15151 .9.99))) <0.0001 OO ll hh ll ii t 33 (0(0 22)) 282811 (2(24)4) 228484 ((1010 22)) 0<0 00000011
by guest on May 30, 2018
http://circ.ahajournals.org/D
ownloaded from

DOI: 10.1161/CIRCULATIONAHA.112.120402
20
Imaging Parameters Rest LVEF 60 [50-67] 56 [45-64] 58 [48-66] <0.0001 Stress-induced LVEF 1283 (79.6) 864 (73.7) 2147 (77.1) 0.0003 Ischemia + Scar (%) 0 [0-8.8] 2.9 [0-14.7] 0 [0-10.3] <0.0001 Ischemia (%) 0 [0-2.9] 0 [0-7.4] 0 [0-5.9] <0.0001 Scar (%) 0 [0-1.5] 0 [0-4.4] 0 [0-2.9] <0.0001 Global CFR 1.87 [1.43-2.35] 1.58 [1.24-2] 1.73 [1.34-2.22] <0.0001 Stress Global MBF (ml/g/min)
1.97 [1.37-2.73] 1.6 [1.12-2.19] 1.8 [1.23-2.52] <0.0001
Rest Global MBF (ml/g/min) 1.04 [0.81-1.35] 0.96 [0.74-1.31] 1.01 [0.78-1.33] <0.0001 Impaired CFR 852 (52.9) 600 (51.2) 1452 (52.2) 0.4
Continuous variables are presented as median (first and third quartiles). Dichotomous variables are presented as number (%). Patients whose LVEF at stress was greater than that at rest were considered to have positive stress-induced increase in LVEF. BMI = body mass index. ACE = angiotensin converting enzyme. MI = myocardial infarction. CAD = coronary artery disease. HbA1c = Hemoglobin A1c. PCI = percutaneous coronary intervention. CABG = coronary artery bypass graft. LVEF = left ventricular ejection fraction. CFR = coronary flow reserve. MBF = myocardial blood flow.
Table 2. Causes of Death
Cause of Death Impaired CFR (n=600)
Preserved CFR (n=572)
All Patients (n=1172) p-Value
Diabetics Cardiac, n (%/year) 66 (7.6) 12 (1.3) 78 (4.3) <0.0001 Any Cause, n (%/year) 104 (11.9) 34 (3.5) 138 (7.5) <0.0001
Non-Diabetics Impaired CFR (n=852)
Preserved CFR (n=759)
All Patients (n=1611) p-Value
Cardiac, n (%/year) 53 (4.2) 6 (0.4) 59 (2.3) <0.0001 Any Cause, n (%/year) 117 (9.3) 24 (1.8) 141 (5.4) <0.0001
Table 2. Causes of Death
Cause of Death Impaired CFR (n=600)
Preserved CFR (n=572)
All Patients (n=1172) p-Value
Diababeteteticicics s s CCCararardidiaca , n n (%(%(%/yyeaear)r) 66 (7.6) ) 12 ((1.3) 778 8 (4.3) ) <0.0001 AAAnny Causee, nn (%(%(%/y/y/yeaeaar)r)r) 101004 4 4 (1(1(11.9)9)9) 334 44 (3(3(3 5.5.5) ) ) 13131388 (77.5.55))) <0<0<0 0.0.0000000111
NoNoNon-n--DiDiD aba eticcss s Immmpapap iireedd CFRFRFR (n(n==8=8525252)))
PPrPresessererervveveddd CCCFRR (n(n( =7=7=759559) )
AAlll PaPattiiennntss (((n==1=1616111)1)1) p--VaValuluue
CCarardididiac, , n n (%%/y/yea )r)r) 53 (((4.44.222)) 66 (0(0(0.4.4))) 5959 (((2.2 3)3) <0.0.00000101 AAAny CCCause,, n (%(%(%/y/y/year)r)r) 11111177 7 (9(9(9 33.3))) 242424 (((111.8)8)8) 111414141 (((555.4)4)4) <<000.000000010101
by guest on May 30, 2018
http://circ.ahajournals.org/D
ownloaded from
DOI: 10.1161/CIRCULATIONAHA.112.120402
21
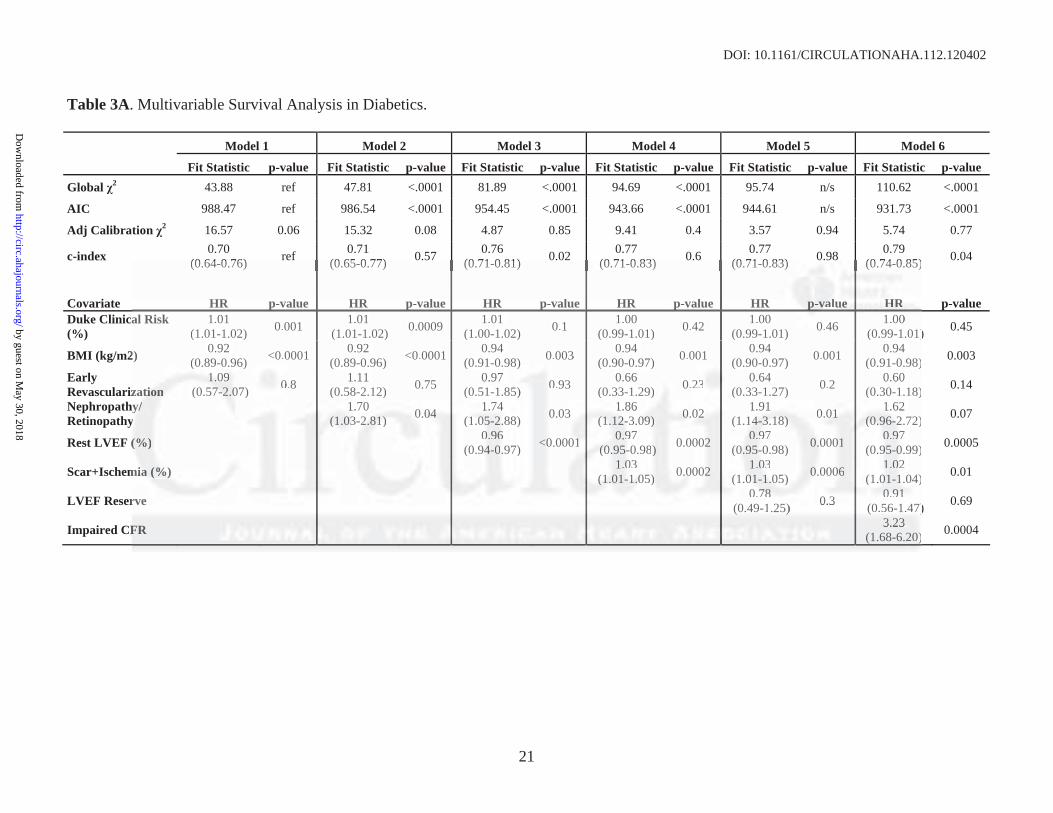
Table 3A. Multivariable Survival Analysis in Diabetics. Model 1 Model 2 Model 3 Model 4 Model 5 Model 6
Fit Statistic p-value Fit Statistic p-value Fit Statistic p-value Fit Statistic p-value Fit Statistic p-value Fit Statistic p-value Global 2 43.88 ref 47.81 <.0001 81.89 <.0001 94.69 <.0001 95.74 n/s 110.62 <.0001
AIC 988.47 ref 986.54 <.0001 954.45 <.0001 943.66 <.0001 944.61 n/s 931.73 <.0001
Adj Calibration 2 16.57 0.06 15.32 0.08 4.87 0.85 9.41 0.4 3.57 0.94 5.74 0.77
c-index 0.70 (0.64-0.76) ref 0.71
(0.65-0.77) 0.57 0.76 (0.71-0.81) 0.02 0.77
(0.71-0.83) 0.6 0.77 (0.71-0.83) 0.98 0.79
(0.74-0.85) 0.04
Covariate HR p-value HR p-value HR p-value HR p-value HR p-value HR p-value Duke Clinical Risk (%)
1.01 (1.01-1.02) 0.001 1.01
(1.01-1.02) 0.0009 1.01 (1.00-1.02) 0.1 1.00
(0.99-1.01) 0.42 1.00 (0.99-1.01) 0.46 1.00
(0.99-1.01) 0.45
BMI (kg/m2) 0.92 (0.89-0.96) <0.0001 0.92
(0.89-0.96) <0.0001 0.94 (0.91-0.98) 0.003 0.94
(0.90-0.97) 0.001 0.94 (0.90-0.97) 0.001 0.94
(0.91-0.98) 0.003
Early Revascularization
1.09 (0.57-2.07) 0.8 1.11
(0.58-2.12) 0.75 0.97 (0.51-1.85) 0.93 0.66
(0.33-1.29) 0.23 0.64 (0.33-1.27) 0.2 0.60
(0.30-1.18) 0.14
Nephropathy/ Retinopathy 1.70
(1.03-2.81) 0.04 1.74 (1.05-2.88) 0.03 1.86
(1.12-3.09) 0.02 1.91 (1.14-3.18) 0.01 1.62
(0.96-2.72) 0.07
Rest LVEF (%) 0.96 (0.94-0.97) <0.0001 0.97
(0.95-0.98) 0.0002 0.97 (0.95-0.98) 0.0001 0.97
(0.95-0.99) 0.0005
Scar+Ischemia (%) 1.03 (1.01-1.05) 0.0002 1.03
(1.01-1.05) 0.0006 1.02 (1.01-1.04) 0.01
LVEF Reserve 0.78 (0.49-1.25) 0.3 0.91
(0.56-1.47) 0.69
Impaired CFR 3.23 (1.68-6.20) 0.0004
(0.64-0.76) (0.65-0.77) (0.71-0.81) (0.71-0.83) (0.71-0.83) (0(0.7.74-4-0.0 85)
HR p-value HR p-value HR p-value HR p-value HR pp-v-valala ueueue HHHRR R al Risk 1.01
(1.01-1.02) 0.001 1.01 (1.01-1.02) 0.0009 1.01
(1.00-1.02) 0.1 1.00 (0.99-1.01) 0.42 1.00
(0.99-1.01) 0.46 1.00 (0.99-1.01)
2) 0.92 (0( .89-0.0 969 ) <0.0001 0.92
(0.89-0.96) <0.0001 0.94 (0.91-0.98) ) 0.003 0.94
(0.90-0.97) 0.001 0.94 (0.90-0.97) 0.001 0.94
(0.91-0.98)
zzatattioioionn111.090909
(0. 75757-2-2- 00.07) 0.0 8 1.11 (0.58-2.12) 0.75 0.97
(0.51-1.85) ) 0.93 0.66 (0.33-1.29) 0.2323 0.64
(0.33-1.27) 0.2 0.60 (0.30-1.18)
hhy/y/y/ y y 1.1.700
(1(1( 0.03-3-3 2.2.2.818181)) ) 0.0.040404 1.1.7474 (1(1 0.0.05-55 ..2 8888) ) 0.03 1.1 86
(1(1(1.1. 2-2-2-3.090909))) 0.00 02022 1.1.9191 (1.1.14-4-4-3.3.3.181818)) ) 0.0.01011 1.1.6262
(0(0(0.9.96-6-2.2 72)
(%(( )) 0.00 6696 (0.94-44 ..0 97) 0<0< .0 000111 0.97979
(((0.0.0 95-0- .9 ))8 0.00 220 0..97979 0(0.9. -5-5-0.98) .0 000 100 0.0 7979
(0 99.95-0.00 99)
imimia a a %%(%) ) 1.0300 (1(1(1.0.0 -1-1.1.1 05050 ))) 0..0000 220 1.0300
(1(1 0.0.01-1 1.1.0505) ) 0.0.0 00 600 1.1 2020 (1(1 0.0.01- .11 040 )
rve 00.787878 ((0.49-1.25)5) 0.0.3 3 000.919191
((0.0 565 -1.447)7
FR 3.23 (1.68-6. 020))
by guest on May 30, 2018
http://circ.ahajournals.org/D
ownloaded from

DOI: 10.1161/CIRCULATIONAHA.112.120402
22
Table 3B. Multivariable Survival Analysis in Non-Diabetics. Model 1 Model 2 Model 3 Model 4 Model 5 Fit Statistic p-value Fit Statistic p-value Fit Statistic p-value Fit Statistic p-value Fit Statistic p-value Global 2 48.08 ref 86.44 <0.0001 93.99 0.006 93.99 0.96 112.11 <0.0001 AIC 781.22 ref 744.86 <0.0001 739.31 0.02 741.31 N/S 725.19 <0.0001 Adj Calibration 2 9.90 0.36 5.61 0.78 12.49 0.19 13.31 0.15 8.84 0.45 c-index 0.75 ref 0.80 0.1 0.82 0.02 0.82 0.4 0.85 0.03 Covariate HR p-value HR p-value HR p-value HR p-value HR p-value Duke Clinical Risk (%)
1.02 (1.02-1.03) <0.0001
1.02 (1.01-1.03) 0.0007
1.01 (1.00-1.02) 0.01
1.01 (1.00-1.02) 0.02
1.01 (1.00-1.02) 0.03
BMI (kg/m2) 0.93
(0.88-0.98) 0.004 0.95
(0.91-1.00) 0.05 0.95
(0.90-1.00) 0.05 0.95
(0.90-1.00) 0.05 0.95
(0.90-1.00) 0.05 Early Revascularization
0.96 (0.43-2.15) 0.92
0.71 (0.32-1.59) 0.4
0.50 (0.21-1.17) 0.11
0.50 (0.21-1.17) 0.11
0.48 (0.21-1.12) 0.09
Rest LVEF (%) 0.95
(0.94-0.97) <0.0001 0.96
(0.94-0.98) <0.0001 0.96
(0.94-0.98) <0.0001 0.97
(0.95-0.99) 0.0006
Scar+Ischemia (%) 1.03
(1.01-1.04) 0.006 1.03
(1.01-1.04) 0.008 1.02
(1.00-1.04) 0.01
LVEF Reserve
0.99
(0.55-1.77) 0.96 1.06
(0.59-1.88) 0.85
Impaired CFR
4.85
(2.04-11.54) 0.0004 Summary of characteristics of nested models. *P-values for fit statistics are for comparison of each model to the next simpler model (e.g. model 5 vs. model 4). C-indices and calibration statistics are calculated for 2-year event data. Global 2 = likelihood ratio chi-squared statistic for the entire model. AIC = Akaike Information Criterion. LVEF = left ventricular ejection fraction. CFR = coronary flow reserve.
HR p-value HR p-value HR p-value HR p-value e HRHRH pp-v
cal Risk 1.02 (1.02-1.03) <0.0001
1.02 (1.01-1.03) 0.0007
1.01 (1.00-1.02) 0.01
1.01 (1.00-1.02) 0.02
1.1.010101 (1.00-1.02) 0.
2)0.93
(0.88-0.98) 0.0040.95
(0.91-1.00) 0.050.95
(0.90-1.00) 0.050.95
(0.90-1.00) 0.050.95
(0.90-1.00) 0.
izzatatioioionn0.0.969
(((0.0.0.43434 -2- .1 )5)5) 0.92 0.71
(0.32-1.59) 0.40.0 505050
(0 2.2.21-11 .1 17) 0.11 0.500
(0(0.2. 1-1.1.171717)) ) 0.11 0.48
(0.21-1.12) 0.
(%(( ) ) 0.0.9595
(0(0( .9.94-4-4-0.0.0.979797))) <0<0<0.0.0.000001110.0 696
(0(0.9 -44 .0 989 ) <0<0<0 0.0.000000 10.9696
(0.00.949494-0-0 9.9.98)8)8) <<0.0..000000010101 0.979
((0.0.959595 0-0-0.9.99)9)9) 0.0
mimm a (%( ) 1.0. 33
(1.0 -11 .1 040 ) 00.0.0000 6 61.0303
1(1.0. 1-1.0400 ) .0 000 8 .1.1 202
((1.1 0000-1 0. 4) 0.
errveveve 0.99
0(0.5.55-5-5 1.1.7777 ) 0.96969 ..1 606
(0( .59-99 .1 8888) ) 0.
CFRR 44.4.858585
(22 0.04-4 111 5.54)4) 00.00characteristics of neststed models. *P-values for fit statistics are for r coc mpparison of each model ttoo ththe next simplp er momodel (e.gg. model 5 vs. model 4)). C-indices and ca iil bcalculated for 2-yeararr eeveveventntnt dddatatata.a.a GGGloolobabab ll l 2 = lllikikikelelelihihi oodd d raraatitio o chchi-sqsqquauau rered d d sts atatisistitic c fofofor r ththhe e enenentit ere mmmododod lell. . AIAIA C CC == AkA aiaikekeke IIInfnfnforro mmmatatatioioion n CrCrittiterere iioion.n. LLVEVEVEF F F = left ventricular eeej
RR == cocororonanaryry ffloloww rereseservrvee
by guest on May 30, 2018
http://circ.ahajournals.org/D
ownloaded from
DOI: 10.1161/CIRCULATIONAHA.112.120402
23
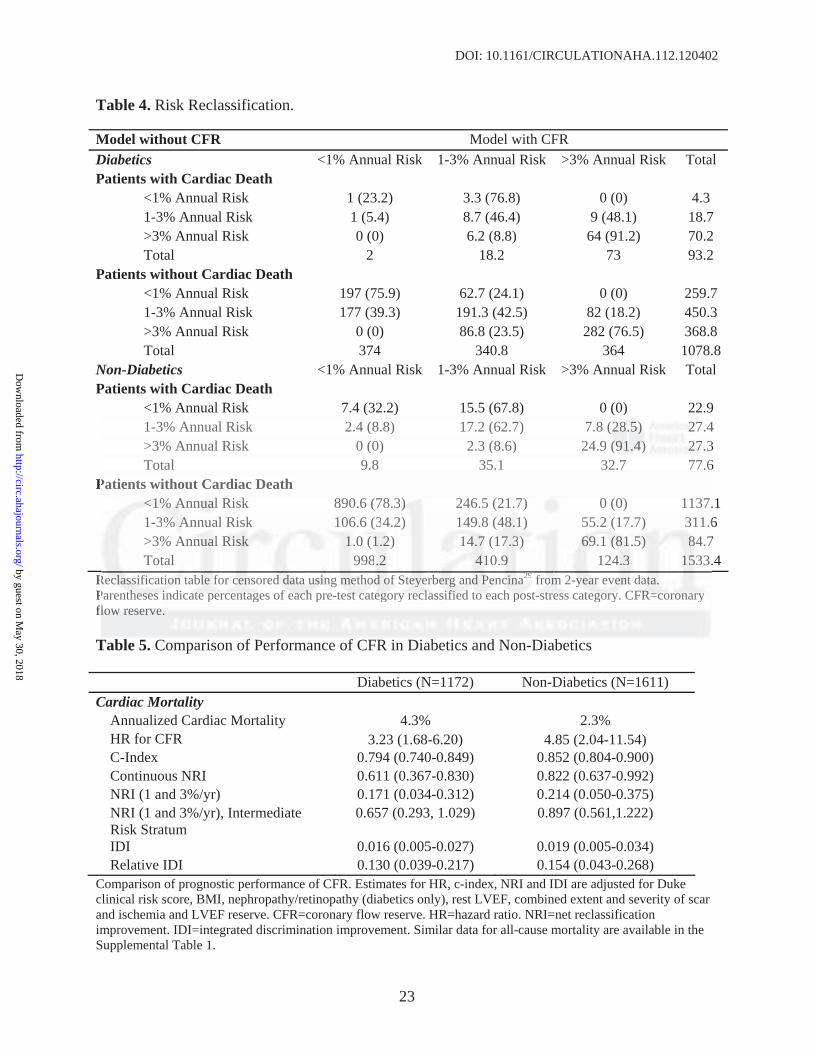
Table 4. Risk Reclassification.
Model without CFR Model with CFR Diabetics <1% Annual Risk 1-3% Annual Risk >3% Annual Risk Total Patients with Cardiac Death <1% Annual Risk 1 (23.2) 3.3 (76.8) 0 (0) 4.3 1-3% Annual Risk 1 (5.4) 8.7 (46.4) 9 (48.1) 18.7 >3% Annual Risk 0 (0) 6.2 (8.8) 64 (91.2) 70.2 Total 2 18.2 73 93.2 Patients without Cardiac Death <1% Annual Risk 197 (75.9) 62.7 (24.1) 0 (0) 259.7 1-3% Annual Risk 177 (39.3) 191.3 (42.5) 82 (18.2) 450.3 >3% Annual Risk 0 (0) 86.8 (23.5) 282 (76.5) 368.8 Total 374 340.8 364 1078.8 Non-Diabetics <1% Annual Risk 1-3% Annual Risk >3% Annual Risk Total Patients with Cardiac Death <1% Annual Risk 7.4 (32.2) 15.5 (67.8) 0 (0) 22.9 1-3% Annual Risk 2.4 (8.8) 17.2 (62.7) 7.8 (28.5) 27.4 >3% Annual Risk 0 (0) 2.3 (8.6) 24.9 (91.4) 27.3 Total 9.8 35.1 32.7 77.6 Patients without Cardiac Death <1% Annual Risk 890.6 (78.3) 246.5 (21.7) 0 (0) 1137.1 1-3% Annual Risk 106.6 (34.2) 149.8 (48.1) 55.2 (17.7) 311.6 >3% Annual Risk 1.0 (1.2) 14.7 (17.3) 69.1 (81.5) 84.7 Total 998.2 410.9 124.3 1533.4 Reclassification table for censored data using method of Steyerberg and Pencina29 from 2-year event data. Parentheses indicate percentages of each pre-test category reclassified to each post-stress category. CFR=coronary flow reserve. Table 5. Comparison of Performance of CFR in Diabetics and Non-Diabetics
Diabetics (N=1172) Non-Diabetics (N=1611) Cardiac Mortality Annualized Cardiac Mortality 4.3% 2.3% HR for CFR 3.23 (1.68-6.20) 4.85 (2.04-11.54) C-Index 0.794 (0.740-0.849) 0.852 (0.804-0.900) Continuous NRI 0.611 (0.367-0.830) 0.822 (0.637-0.992) NRI (1 and 3%/yr) 0.171 (0.034-0.312) 0.214 (0.050-0.375) NRI (1 and 3%/yr), Intermediate
Risk Stratum 0.657 (0.293, 1.029) 0.897 (0.561,1.222)
IDI 0.016 (0.005-0.027) 0.019 (0.005-0.034) Relative IDI 0.130 (0.039-0.217) 0.154 (0.043-0.268) Comparison of prognostic performance of CFR. Estimates for HR, c-index, NRI and IDI are adjusted for Duke clinical risk score, BMI, nephropathy/retinopathy (diabetics only), rest LVEF, combined extent and severity of scar and ischemia and LVEF reserve. CFR=coronary flow reserve. HR=hazard ratio. NRI=net reclassification improvement. IDI=integrated discrimination improvement. Similar data for all-cause mortality are available in the Supplemental Table 1.
( ) ( ) ( )1-3% Annual Risk 2.4 (8.8) 17.2 (62.7) 7.8 (2(2288.8.5)5)5) 22277.4>3% Annual Risk 0 (0) 2.3 (8.6) 24.99 (9(9(91.11.4)4)4) 22277.7 333Total 9.8 35.1 32.7 77.6
Patients without Cardiac Death <<<1%1%1% AAAnnnuauaall RiR sk 890.6 (78.3))) 246.5 (21.7) 0 (0) 1137.1-33% %% AAAnnunualal RRisisk k 101 6.6.6 6 (3(34.4.2)2) 114949.8 ((48488.11) ) 5555.2.2 ((1717.77) ) 31311.6>3%% AAnnnnnuauaual RiRiRisksk 11.0.0 ((11.1 22)2) 1144.4 77 7 (1(117.77 3)3)) 66699.9.11 (8(8(81.1.1 5)5)5) 8884.7Total 998.2 4110.999 1244.3. 1155333.
ReReclclclasasssisis fificaatitiononon ttabablle fforor cccennnsosorer d d d daaatatata uuusisisingng mmmeetethohooddd oofof SSteteeyeyeerbrberere g g g ananndd PePePencnccininaaa29 ffrroomm m 2-2-yyeyeaarar eeveveentntnt daatta.. PPareentnthehehesesesesss iinindidicacattete pperercece tntntagagees oof f eaeaachchch ppre-teeststst cccatategege oory y rere lclclasassisiifififi deded tto o eaeachhh pposost-t- tststreressss ccatategeggorororyy. CCFRFRFR=c=cororononararyy lllowowow rrreseseserererveveve.
by guest on May 30, 2018
http://circ.ahajournals.org/D
ownloaded from
DOI: 10.1161/CIRCULATIONAHA.112.120402
24
Figure Legends:
Figure 1. Effect of Diabetes and Perfusion Abnormalities on Cardiac Mortality. Unadjusted
annualized cardiac mortality in categories of total extent of myocardial ischemia and scar for
patients with and without diabetes. Even after accounting for the extent and severity of ischemia
and scar, patients with diabetes experienced higher rates of cardiac mortality than those without
diabetes.
Figure 2. Effects of CFR and Traditional MPI Findings on Cardiac Mortality. Unadjusted
annualized cardiac mortality for patients with diabetes (panels A-D) and without (panels E-H)
by in categories of total extent of myocardial ischemia and scar (panels A&E), total extent of
myocardial ischemia (panels B&F), total extent of myocardial scar (panel C&G) or left
ventricular ejection fraction (panels E&H) and impaired (red) versus preserved CFR (blue). The
annual rate of cardiac death increased with increasing extent of ischemia and scar, decreasing
LVEF and CFR. Importantly, lower CFR was consistently associated with higher rates of cardiac
mortality regardless of the level of ischemia, scar extent or LVEF.
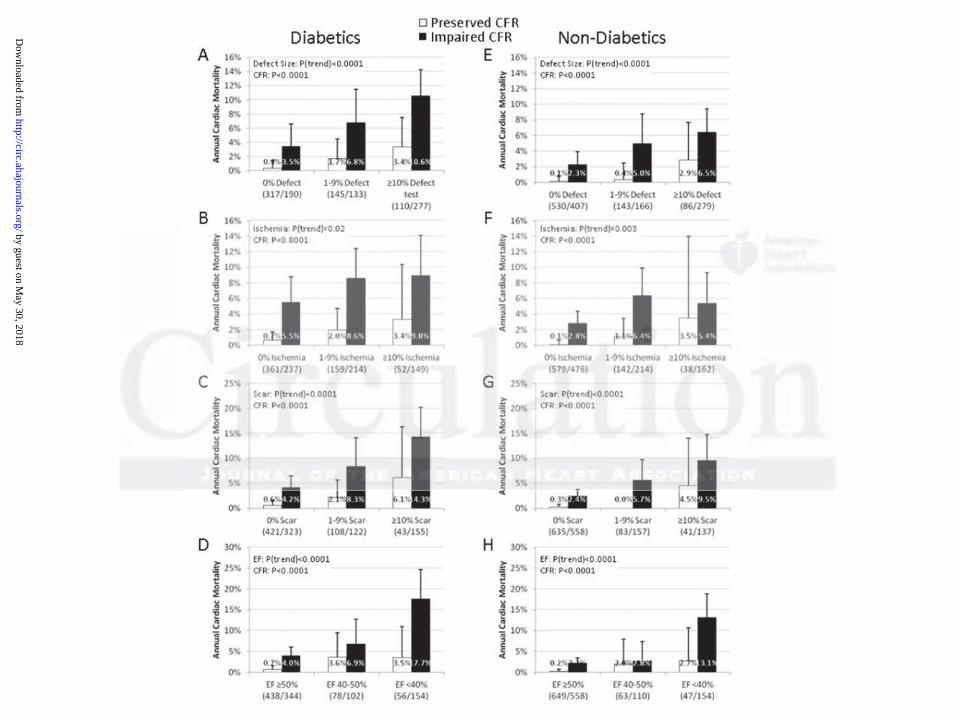
Figure 3. Cardiac Mortality Incidence of cardiac mortality for patients with diabetes (panels
A&B) and without diabetes (panels C&D), with impaired (red) or preserved (blue) coronary
flow reserve (CFR) presented in Kaplan-Meier form (panel A&C) showing significantly
increased cardiac mortality with impaired CFR (p<0.0001) which continued after adjustment21
for Duke clinical risk score, BMI, nephropathy/retinopathy, early revascularization, rest left
annualized cardiac mortality for patients with diabetes (panels A-D) and withoututt (papp nenenelslss EEE-H--H) )
by in categories of total extent of myocardial ischemia and scar (f panels A&E), total extent of
mymyyoococararardididialalal iiissscheheemmimiaa (panels B&F), total extent tt ofofo myocardial sccaraa (papaannenel C&G) or left
vvenntntrir cular ejecectititionnn fffrraactcttioioionn n (((ppapaneneelslss EE&&&H) anannd immmpppairrrededd ((rrredd)d) vvverrsuuss pprpresesererrvevved d CFCFCFR R R ((b( lululue))e).. TTThe
annnnunualalal rratatee e ofofof ccaarrddidiacac deeaeathth iiincncn rrreaeaeasesesed d wiwiwiththth iiincccrerer aaasiinng g exxxtetetennnt oooff iiiscscchehehemmmiaa anannd dd scscs ararr,, dddeccrreaeaasisinnng ff
LVEF and CCFRFRFR. . ImImImpopoportrttanantltltly,y,y, lowowowererr CCFRFRFR wwwasasas cccononnsisis ssstetentntntlylyly aaassssssococociaii teteed d d wiwiw ththth hhhigiggheheher r r rararatetet s of cardiaacc
by guest on May 30, 2018
http://circ.ahajournals.org/D
ownloaded from

DOI: 10.1161/CIRCULATIONAHA.112.120402
25
ventricular ejection fraction (LVEF), extent of myocardial ischemia and scar and LVEF reserve
(panel B; p=0.0004). HR = hazard ratio.
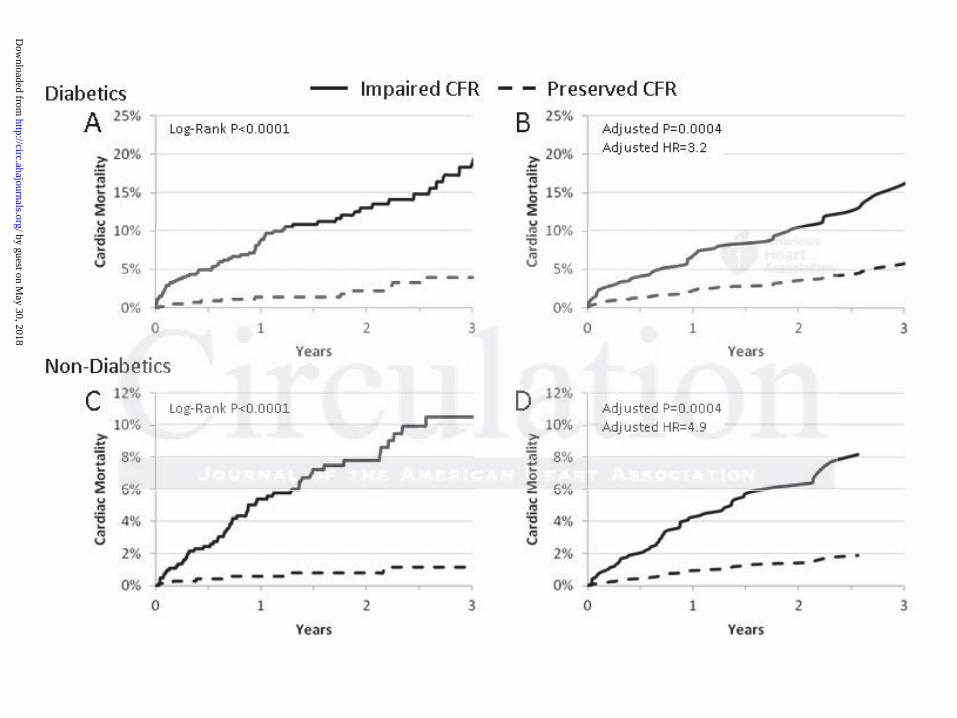
Figure 4. Annualized Cardiac Mortality Among Patients with Diabetes or CAD. Adjusted
cardiac mortality among patients with coronary artery disease (CAD,i.e. history of coronary
revascularization or myocardial infarction) without diabetes (orange), diabetic patients without
CAD who have impaired CFR (red), diabetic patients without CAD who have preserved CFR
(blue) and patients without diabetes or CAD with normal scans (no scar, ischemia or left
ventricular dysfunction, green) presented as survival curves (panel A) and annualized cardiac
mortality rates (panel B). Data for patients with CAD and diabetes are also presented for
comparison (purple).
mortality rates (panel B). Data for patients with CAD and diabetes are also presseneenteteed d fofofor rr
comparison (purple).
by guest on May 30, 2018
http://circ.ahajournals.org/D
ownloaded from

Sharmila Dorbala, Ron Blankstein and Marcelo F. Di CarliVenkatesh L. Murthy, Masanao Naya, Courtney R. Foster, Mariya Gaber, Jon Hainer, Josh Klein,
and without Diabetes MellitusAssociation Between Coronary Vascular Dysfunction and Cardiac Mortality in Patients with
Print ISSN: 0009-7322. Online ISSN: 1524-4539 Copyright © 2012 American Heart Association, Inc. All rights reserved.
is published by the American Heart Association, 7272 Greenville Avenue, Dallas, TX 75231Circulation published online August 23, 2012;Circulation.
http://circ.ahajournals.org/content/early/2012/08/23/CIRCULATIONAHA.112.120402World Wide Web at:
The online version of this article, along with updated information and services, is located on the
http://circ.ahajournals.org/content/suppl/2012/08/23/CIRCULATIONAHA.112.120402.DC1Data Supplement (unedited) at:
http://circ.ahajournals.org//subscriptions/
is online at: Circulation Information about subscribing to Subscriptions:
http://www.lww.com/reprints Information about reprints can be found online at: Reprints:
document. Permissions and Rights Question and Answer available in the
Permissions in the middle column of the Web page under Services. Further information about this process isOnce the online version of the published article for which permission is being requested is located, click Request
can be obtained via RightsLink, a service of the Copyright Clearance Center, not the Editorial Office.Circulation Requests for permissions to reproduce figures, tables, or portions of articles originally published inPermissions:
by guest on May 30, 2018
http://circ.ahajournals.org/D
ownloaded from

SUPPLEMENTAL MATERIAL
ASSOCIATION BETWEEN CORONARY VASCULAR DYSFUNCTION AND CARDIAC MORTALITY IN PATIENTS WITH AND WITHOUT DIABETES MELLITUS Venkatesh L. Murthy, M.D., Ph.D.; Masanao Naya, M.D., Ph.D.; Courtney R. Foster, B.S., C.N.M.T; Mariya Gaber, M.L.A.; Jon Hainer, B.Sc.; Josh Klein, B.A., Sharmila Dorbala, M.D., M.P.H.; Ron Blankstein, M.D.; Marcelo F. Di Carli, M.D.
From the (1) Noninvasive Cardiovascular Imaging Program (VLM, MN, SD, RB, MDC), Departments of Medicine and Radiology; (2) Division of Cardiovascular Medicine (VLM, RB, MDC), (3) Division of Nuclear Medicine and Molecular Imaging (CRF, MG, JH, JK, SD, MDC), Brigham and Women’s Hospital, Boston, MA
Short Title: Murthy, et al. Coronary vascular function in diabetes Correspondence to: Marcelo F. Di Carli, M.D. Brigham & Women’s Hospital ASB-L1 037C 75 Francis St Boston, MA 02115 Email: [email protected] Phone: (617) 732-6291 Fax: (617) 582-6056

Supplement to Murthy, et al. Coronary vascular function in diabetes
CIRCULATIONAHA/2012/120402/R1
SUPPLEMENTAL TABLE 1. MULTIVARIABLE SURVIVAL ANALYSIS (NON-DIABETICS) Diabetics (N=1172) Non-Diabetics
(N=1611) All-Cause Mortality Annualized Mortality 7.5% 5.4% HR for CFR 2.03 (1.34-3.08) 3.42 (2.17-5.38) C-Index 0.778 (0.736-0.819) 0.775 (0.736-0.814) Continuous NRI 0.503 (0.312-0.701) 0.678 (0.519-0.826) NRI (2 and 6%/yr) 0.126 (0.052-0.207) 0.197 (0.110-0.288) NRI (2 and 6%/yr), Intermediate
Risk Stratum 0.535 (0.263-0.822) 0.406 (0.185-0.628)
IDI 0.012 (0.004-0.020) 0.029 (0.021-0.038) Relative IDI 0.089 (0.028-0.146) 0.286 (0.197-0.387)
Comparison of prognostic performance of CFR. Estimates for HR, c-index, NRI and IDI are adjusted for Duke clinical risk score, BMI, nephropathy/retinopathy (diabetics only), rest LVEF, combined extent and severity of scar and ischemia and LVEF reserve. CFR=coronary flow reserve. HR=hazard ratio. NRI=net reclassification improvement. IDI=integrated discrimination improvement.
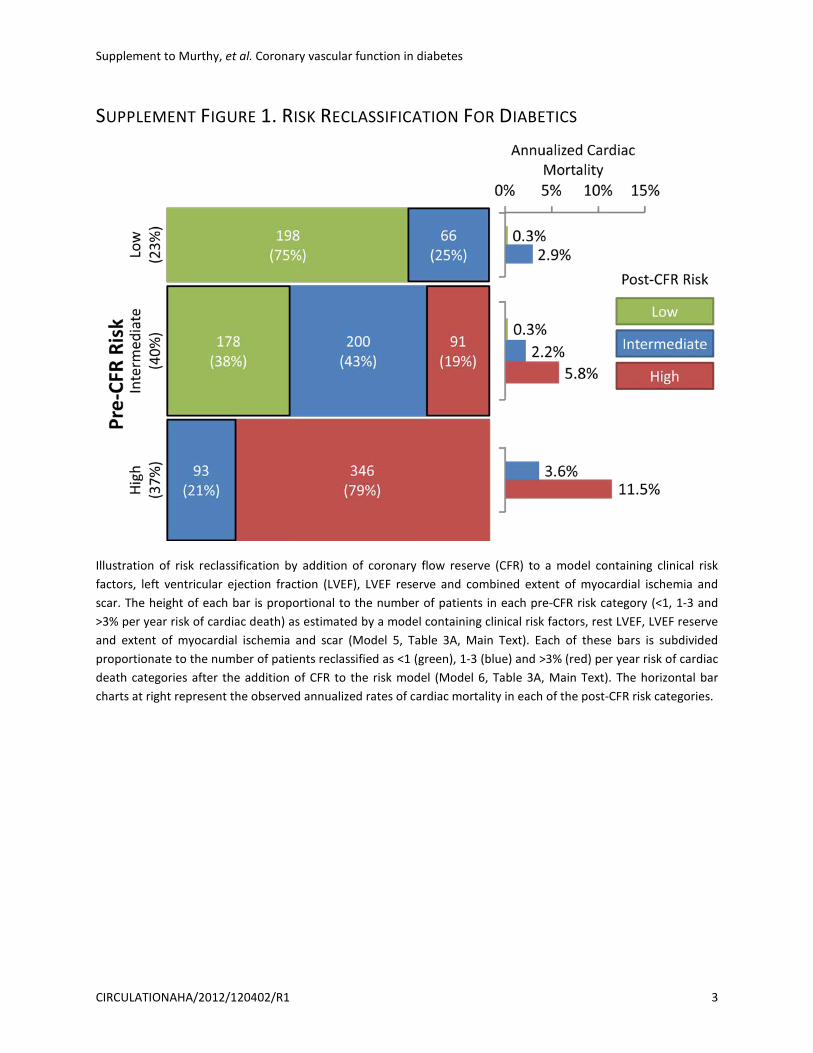
Supplement to Murthy, et al. Coronary vascular function in diabetes
CIRCULATIONAHA/2012/120402/R1 3
SUPPLEMENT FIGURE 1. RISK RECLASSIFICATION FOR DIABETICS
Illustration of risk reclassification by addition of coronary flow reserve (CFR) to a model containing clinical risk factors, left ventricular ejection fraction (LVEF), LVEF reserve and combined extent of myocardial ischemia and scar. The height of each bar is proportional to the number of patients in each pre-CFR risk category (<1, 1-3 and >3% per year risk of cardiac death) as estimated by a model containing clinical risk factors, rest LVEF, LVEF reserve and extent of myocardial ischemia and scar (Model 5, Table 3A, Main Text). Each of these bars is subdivided proportionate to the number of patients reclassified as <1 (green), 1-3 (blue) and >3% (red) per year risk of cardiac death categories after the addition of CFR to the risk model (Model 6, Table 3A, Main Text). The horizontal bar charts at right represent the observed annualized rates of cardiac mortality in each of the post-CFR risk categories.

Supplement to Murthy, et al. Coronary vascular function in diabetes
CIRCULATIONAHA/2012/120402/R1 4
SUPPLEMENT FIGURE 2. RISK RECLASSIFICATION FOR NON-DIABETICS
Illustration of risk reclassification by addition of coronary flow reserve (CFR) to a model containing clinical risk factors, left ventricular ejection fraction (LVEF), LVEF reserve and combined extent of myocardial ischemia and scar. The height of each bar is proportional to the number of patients in each pre-CFR risk category (<1, 1-3 and >3% per year risk of cardiac death) as estimated by a model containing clinical risk factors, rest LVEF, LVEF reserve and extent of myocardial ischemia and scar (Model 4, Table 3B, Main Text). Each of these bars is subdivided proportionate to the number of patients reclassified as <1 (green), 1-3 (blue) and >3% (red) per year risk of cardiac death categories after the addition of CFR to the risk model (Model 5, Table 3B, Main Text). The horizontal bar charts at right represent the observed annualized rates of cardiac mortality in each of the post-CFR risk categories.