Embed Size (px)
Citation preview

Early View
Original article
Association between body mass index and
mortality in hospitalised patients with community-
acquired pneumonia
Richard Y. Kim, Connor Glick, Stephen Furmanek, Julio A. Ramirez, Rodrigo Cavallazzi
Please cite this article as: Kim RY, Glick C, Furmanek S, et al. Association between body mass
index and mortality in hospitalised patients with community-acquired pneumonia. ERJ Open
Res 2021; in press (https://doi.org/10.1183/23120541.00736-2020).
This manuscript has recently been accepted for publication in the ERJ Open Research. It is published
here in its accepted form prior to copyediting and typesetting by our production team. After these
production processes are complete and the authors have approved the resulting proofs, the article will
move to the latest issue of the ERJOR online.
Copyright ©ERS 2021. This article is open access and distributed under the terms of the
Creative Commons Attribution Non-Commercial Licence 4.0.

TITLE: Association between body mass index and mortality in hospitalized patients with community-acquired
pneumonia
AUTHOR LIST: Richard Y. Kim1, Connor Glick
2, Stephen Furmanek
2, Julio A. Ramirez
2, Rodrigo Cavallazzi
1
AUTHOR AFFILIATIONS: 1. University of Louisville School of Medicine, Department of Medicine, Division
of Pulmonary, Critical Care, and Sleep Disorders Medicine, Louisville, Kentucky 40202. 2. University of Louisville
School of Medicine, Department of Medicine, Division of Infectious Diseases, Louisville, Kentucky 40202.
WORD COUNT:
Abstract Word Count: 249
Main Body Word Count: 2827 (excluding abstract, acknowledgements and references)
RUNNING HEAD: Obesity and Community Acquired Pneumonia

Abstract
The obesity paradox postulates that increased body mass index (BMI) is protective in certain patient populations.
We aimed to investigate the association of BMI and different weight classes with outcomes in hospitalized patients
with community-acquired pneumonia (CAP).
This cohort study is a secondary data analysis of the University of Louisville Pneumonia Study database, a
prospective study of hospitalized adult patients with CAP from June of 2014 to May of 2016 in Louisville, KY. BMI
as a predictor was assessed both as a continuous and categorical variable. Patients were categorized as weight
classes based on WHO definitions: BMI < 18.5 (underweight), BMI of 18.5 to < 25 (normal weight), BMI of 25.0 to
<30 (overweight), BMI of 30 to < 35 (obesity class I), BMI of 35 to < 40 (obesity class II), and BMI ≥ 40 (obesity
class III). Study outcomes, including time to clinical stability, length of stay, clinical failure, and mortality, were
assessed in hospital, at 30-days, at 6-months, and at 1-year. Clinical failure was defined as the need for noninvasive
ventilation, invasive ventilation, or vasopressors within 1 week of admission. Patient characteristics and crude
outcomes were stratified by BMI categories, and generalized additive binomial regression models were performed to
analyze the impact of BMI as a continuous variable on study outcomes adjusting for possible confounding variables.
7449 patients were included in the study. Median time to clinical stability was 2 days for every BMI group. There
was no association between BMI as a continuous predictor and length of stay <5 days (2=1.83, EDF=2.74,
p=0.608). Clinical failure was highest in the class III obesity group, and higher BMI as a continuous predictor was
associated with higher odds of clinical failure. BMI as a continuous predictor was significantly associated with 30-
day (2=39.97, EDF=3.07, p<0.001), 6-month (
2=89.42, EDF=3.44, p<0.001) and 1-year (
2=83.97, EDF=2.89,
p<0.001) mortalities. BMI ≤24.14 was a risk factor whereas BMI ≥26.97 was protective for mortality at 1-year. The
incremental benefit of increasing BMI plateaued at 35.
We found a protective benefit of obesity on mortality in CAP patients. However, we uniquely demonstrate that the
association between BMI and mortality is not linear, and no incremental benefit of increasing BMI levels is
observed in those with obesity classes II and III.

INTRODUCTION
Background
The obesity paradox postulates that increased body mass index (BMI) is protective in certain patient
populations, particularly the elderly and those with chronic diseases [1, 2]. The link between BMI and mortality is
well established in medical literature with disease specific impacts on mortality. Obese individuals are known to
have a significantly higher risk of all-cause mortality when compared to normal weight individuals [3, 4] Frasca
stated, “In general, obesity decreases both the health span and lifespan, increases premature mortality and
significantly increases global healthcare costs” [5].
The effect that BMI has on pneumonia and mortality, however, remains controversial. Literature exists on both
sides of the argument to support and deny a positive effect of obesity on pneumonia and mortality. Some studies
have identified an increased mortality risk in obese patients with pneumonia with H1N1 and more recently SARS-
CoV-2.[6-10] However, other studies have shown a mortality benefit in obese patients with CAP. One meta-analysis
performed by Nie et al suggested that obese individuals, though at higher risk for developing pneumonia, may have
a lower mortality risk[11]. Several studies have also corroborated the “obesity paradox” and its positive effects on
mortality in CAP[5, 12]. Despite these differences, it is generally accepted that underweight individuals are at
increased risk of developing and dying from CAP [13-15].
Furthermore, current literature on the long-term mortality outcomes of obesity in CAP is limited, with most
studies limited to short-term follow-up (less than 30 days) [12, 16, 17]. To our knowledge, there is only one study
that investigates and demonstrates the mortality benefits of obesity in CAP over a longer time period [18]. Secondly,
the studies on the mortality benefits of obesity in CAP stratified patients based primarily on only 4 BMI categories:
underweight, normal, overweight, and obese. Current medical literature fails to specify the degree of mortality
benefit in CAP in different classes of obesity or the continuous spectrum of BMI.
Thus, we aimed to investigate the association of BMI with mortality in hospitalized patients being treated for
CAP in hospital, at 30-days, at 6 months, and at 1 year. We further investigated the effect of different classes of
obesity and the continuous spectrum of BMI on the risk of mortality in patients with CAP.
METHODS
Study design and study population

This cohort study is a secondary data analysis of the University of Louisville Pneumonia Study (ULPS)
database. ULPS was a prospective observational study of all hospitalized adult patients with CAP from June 1st,
2014 to May 31st, 2016 in the city of Louisville [19]. Data were prospectively collected by research associates from
the division of infectious diseases at the University of Louisville, and quality control was performed.
Inclusion and Exclusion criteria
Patients were diagnosed with CAP if criteria 1, 2, and 3 were met: (1) presence of a new pulmonary
infiltrate on chest radiograph and/or chest computed tomography scan at the time of hospitalization, defined by a
board-certified radiologist’s reading; (2) at least 1 of the following: new cough or increased cough or sputum
production, fever >37.8°C (100.0°F) or hypothermia <35.6°C (96.0°F), changes in leukocyte count (leukocytosis:
>11000 cells/μL; left shift: >10% band forms/mL; or leukopenia: <4000 cells/μL); (3) no alternative diagnosis at the
time of hospital discharge that justified the presence of criteria 1 and 2. Patients were excluded if they were under
the age of 18 years, did not have a valid Louisville address, did not possess a valid Social Security Number, or came
from the correction system.[19, 20]
BMI Category Definitions
Patients were placed into the following categories based upon BMI: underweight, normal weight,
overweight, and obese. Underweight individuals had a BMI < 18.5. Normal weight individuals had a BMI of 18.5 to
< 25. Overweight individuals had a BMI of 25.0 to <30. Obese individuals had a BMI of 30.0 or higher. Patients
within the obese class were further subclassified into class I, class II, and class III. Class I obese individuals had a
BMI between 30 and < 35. Class II obese individuals had a BMI between 35 and < 40. Class III obese individuals
had a BMI 40. These classifications are consistent with the World Health Organization BMI classifications [21].
Study variables
All patients were analyzed based on 4 main study outcome variables. Patient demographics were analyzed
and include age, sex, and race. CAP patients were also categorized based on eight main comorbidities. Vital signs
and laboratory values on admission were also included in our statistical analysis. Lastly, severity of disease was also

investigated based on the different clinical findings, such as altered mental status, pleural effusion, need for
intensive care unit, need for vasopressors, and need for ventilatory support.
Study outcomes
Time of clinical stability (TCS): A patient was defined as clinically stable the day that the following four
criteria were met: (1) improved cough and shortness of breath, (2) lack of fever for at least 8 hours, (3) improving
leukocytosis (decreased at least 10% from the previous day), and (4) tolerating oral intake with adequate
gastrointestinal absorption. Patients were evaluated daily within the first 7 days of hospitalization to determine the
day when clinical stability was reached. Time to clinical stability was dichotomized as within three days (early
stability) and after three days (late stability).
Length of stay (LOS): Length of stay was defined in days and calculated for each patient as the day of
discharge minus the day of admission. Length of stay was dichotomized as within five days (early discharge) and
after five days (late discharge).
Clinical failure: Clinical failure was defined as the need for noninvasive ventilation, invasive ventilation, or
vasopressors within 1 week of admission.
Mortality: All-cause mortality was assessed during hospitalization, at 30 days after admission (early), at 6
months after admission (mid), and at 1 year (late) after admission. Mortality was assessed either through EMR
records or vital statistics records from the Kentucky Department for Public Health Office of Vital Statistics.
Statistical Analysis
Baseline categorical explanatory variables were summarized as frequencies and percentages. Continuous
variables were summarized as means and standard deviations. Differences in baseline patient characteristics between
obese and non-obese patients were analyzed using a chi-squared test, Fisher’s exact test, or Mann-Whitney U test
when appropriate and warranted. Differences between obese and non-obese patients’ TCS and LOS were analyzed
with the Kaplan-Meier method, and log-rank tests were applied to evaluate differences between both groups.
Generalized additive model (GAM) regression with dichotomous outcomes were performed with smooth curves
produced. Generalized additive models are similar to generalized linear models, but instead of producing a
coefficient estimate for continuous predictor variables, they may allow smooth curves to model the association of

predictor and outcome. For this analysis, all smoothed curves are plotted against the log odds of receiving an
outcome with 95% confidence intervals. This way, BMI could be used to predict categorical outcomes in manner
that does not require a linear relationship; the log odds, taken from a smoothed curve, represent the BMI’s piece of
the regression equation. Potentially confounding variables adjusted for were age, race, sex, history of cancer, history
of congestive heart failure, history of stroke, history of renal disease, history of liver disease, history of chronic
obstructive pulmonary disease, smoking history, nursing home residence, presence of pleural effusion on chest x-ray
or CT scan, altered mental status at admission, and heart rate, respiratory rate, temperature, systolic blood pressure,
blood urea nitrogen, serum sodium, serum glucose, and hematocrit on admission. P-values < 0.05 were considered
statistically significant.
RESULTS
Patient Characteristics
Our study included 7449 patients. Of these, 46.2% were male; 7% were underweight, 32% were normal
weight, 26% were overweight, and 35.1% were obese. The obese patients were further stratified into class I (17%),
II (9%), and III (10%) based on definitions established by WHO [21]. Patient characteristic results for
demographics, comorbidities, physical exam findings, and disease severity can be seen in table 1. Interestingly,
frequency of the need for intensive care was highest in the class III obesity group (20%) and lowest in the
underweight (16%), overweight (16%) and class II obesity groups (16%). Furthermore, frequency of the need for
ventilatory support was highest in the class III obesity group (19%) and lowest in both the normal weight and
overweight groups (12%).
Time to Clinical Stability
The median days to clinical stability was 2 days, which was the same amongst all classes. The percentage
of patients with time to clinical stability ≤ 3 days was similar between all groups (see table 2). Using BMI as a
continuous predictor and adjusted for confounders, BMI was not significantly associated with time to clinical
stability ≤ 3 days (2=1.18, EDF=1.00, p=0.278). See figure 1 and supplementary tables S1a and S1b.
Length of Stay

The median length of stay was 5 days in all groups except for the class II obesity group, which was 4 days.
These differences, however, were not deemed clinically significant (see table 2). The percentage of patients whose
length of stay was <5 days was lowest in the underweight group and highest in the class II obesity group. Using
BMI as a continuous predictor and adjusted for confounders, BMI was not associated with length of stay <5 days
(2=1.83, EDF=2.74, p=0.608), due to significant overlap in the smoothed curve of log odds and confidence interval
on both above and below 0 (see figure 2 and tables S2a and S2b).
Clinical Failure
The percentage of patients who were deemed a clinical failure was highest in the class III obesity group and
lowest in the normal weight group (see table 2). Using BMI as a continuous predictor and adjusted for confounders,
higher BMI was significantly associated with higher odds of clinical failure (2=28.08, EDF=1.00, p<0.001, see
figure 3 and tables S3a and S3b). Based on the smoothed curve and 95% confidence interval, BMI was protective at
BMI ≤27.78 as the curve and confidence interval corresponded to a log odds of clinical failure entirely below 0.
Also based on the smoothed curve, BMI becomes a risk factor at BMI ≥28.59 as the smoothed curve and confidence
interval are entirely above 0.
Mortality
The percentage of CAP patients who died was highest in the underweight group and lowest in the class II
and III obesity groups for all time points (see table 2). After adjusting for confounding variables, BMI as a
continuous predictor was not significantly associated with in-hospital mortality (see tables S4a and 4Sb) but was
significantly associated with 30-day (2=39.97, EDF=3.07, p<0.001, see tables S5a and S5b), 6-month (
2=89.42,
EDF=3.44, p<0.001, see tables S6a and S6b) and 1-year (2=83.97, EDF=2.89, p<0.001, see tables S7a and S7b)
mortalities. For mortality at 30 days, BMI ≤22.93 was a risk factor as the smoothed curve and 95% confidence
interval for the log odds remain entirely above 0. BMI was protective between 26.57 and 38.69, as the smoothed
curve and 95% confidence interval for the log odds are entirely below 0. For mortality at 6 months, BMI ≤23.74 was
similarly a risk factor for mortality and BMI between 26.97 and 49.19 was protective. For mortality at 1 year,
BMI ≤24.14 was a risk factor for mortality and BMI ≥26.97 was protective. See figure 4.

DISCUSSION
Our study demonstrates that obesity is associated with decreased mortality in patients with CAP. Our
comprehensive analysis of obesity adds to the literature the fact that after patients reach class II obesity, there is no
incremental benefit of increasing BMI. The degree of the observed benefit is not linear as the magnitude of the
protective benefit of an increased BMI plateaus at a BMI of 35 (end spectrum of class I obesity). In other words,
class II/III obesity would not confer additional benefit compared to class I, but class I/II/III would confer a benefit
compared to a normal BMI. Another important aspect of this study is the long-term follow-up. In fact, obesity did
not have a statistically significant benefit on in-hospital mortality; however, mortality benefits of increased BMI
were observed at all other follow-up periods. We found no relationship between obesity and time to clinical stability
or length of stay. Interestingly, obesity was associated with an increased risk of clinical failure, although this did not
translate into increased in-hospital mortality.
Our findings support Nie et al’s metanalysis who found that obese individuals with CAP have lower
mortality risk despite increased risk of infection [11]. Chen performed a similar study looking at CAP patients
followed over periods of 30-day, 6 months and 1 year. They also found a mortality benefit in obese patients,
particularly at 1 year follow up [22]. Braun showed a similar mortality benefit of obesity in 763 CAP patients
followed over 6 years[18]. Taken together, these studies indicate that obesity is associated with better outcomes in
patients with CAP and point to the same direction as out study. The generalized additive model with smooth curves
provided by our study allows for a nuanced assessment of this association, which is not linear.
Theories have attempted to explain the obesity paradox; however, no clear explanation has been proven to
explain the counterintuitive benefits obesity may have on mortality in certain populations. It has been proposed that
a link between the effects of obesity on the body’s immune system and inflammatory state may provide a benefit on
long-term prognosis during acute infection [7, 8]. Obesity represents a chronic state of inflammation, which affects
both pro and anti-inflammatory biomarkers that may provide some survival benefit. For example, tumor necrosis
factor (TNF), a proinflammatory cytokine and marker of pneumonia severity, is believed to be dampened by the
increased number of TNF receptors produced by adipose tissue [9, 10]. Other adipokines, inflammatory cytokines
released by adipocytes, have also shown to play a role in the immune-regulatory response to infections. One such
adipokine, leptin, modulates the T-cell response and is a protective component of the immune system. Also,

adiponectin has anti-inflammatory properties and may possibly decrease inflammation in the lungs [11, 12]. Our
study suggests that the possible beneficial effects are obtained once patients reach class I obesity.
Another theory attempting to explain the obesity paradox involves the amount of lean muscle mass. Obese
individuals have more lean muscle mass in addition to increased adiposity and thus have decreased mortality.
Marquis postulates that loss of body mass is indicative of poorer prognosis and higher mortality. Individuals with
higher degree of protein degradation, as in that seen in systemic inflammation, may lead to a depletion of essential
amino acids necessary for immune defense and tissue regeneration [23]. In addition, muscle mass is found to be
inversely proportional to risk of death. Abramowitz et al found that the effect of BMI on mortality is attenuated after
adjusting for muscle mass [24]. Expanding on this argument, individuals with central adiposity but a normal BMI
are found to have higher mortality [25, 26]. Considering this data, we can speculate that individuals with obesity
class I may have decreased mortality due to an increase in muscle mass. Moving from class I to increasing obesity
classes may not increase muscle mass further, hence may not offer additional survival benefit.
In our study, patients with obesity were younger and presented with lower severity illness as demonstrated
by lower proportion of pneumonia severity index classes IV and V. These findings could also explain why patients
with obesity had decreased long-term mortality. This association was present after adjustment for age and other
variables that reflect severity of illness. However, residual confounding can remain even after adjustment in
regression models. Interestingly, Singanayagam et al performed a cohort study in 1079 patients with CAP. In their
cohort, there was no difference in severity of illness upon admission and in the immediate need for mechanical
ventilation or vasopressor support between patients with obesity and non-obese patients with CAP. Despite that,
obesity was associated with decreased 30-day mortality in multivariate analysis.[27]
Our study has several strengths and limitations. One main strength of our study, as previously mentioned,
was that we were able to study the effects of obesity on mortality in a large cohort of CAP patients. We were also
able to investigate this population over time from in hospital to 1-year post discharge. Most studies to date are
limited to 30 days. Thirdly, the prevalence of obesity in the studied population (35.1%) is similar to that seen in the
United States, (39.8%) adding to the generalizability of the study’s findings across the US population[28]. Our study
was able to demonstrate the mortality effect of increased BMI in patients affected by CAP over different classes of
obesity, which had not been done with previous studies to date. One limitation is the lack of patients in the extremes
of BMI. Furthermore, we did not specify causes of mortality over the 1 year follow- up. Thirdly, despite the patient

obesity demographics reflecting that of the United States, our study is limited only to the city of Louisville,
Kentucky. A fourth limitation is that we did not measure muscle mass.
The results of our study suggest that future studies that evaluate obesity and mortality need to stratify
obesity in different classes. It further suggests that the definition of a “healthy” weight may need to be reevaluated.
Though the mortality benefit of obesity in CAP is observed in the medical literature, the actual physiologic
mechanism remains in question. Future studies evaluating the actual physiologic mechanisms should focus on
specific obesity classes. Though unknown, factors such as lean body mass and distribution of adiposity may
contribute to the physiologic mechanisms involved in the obesity paradox. The differential impact of obesity on
outcomes according to different etiologies of pneumonia should also be further explored, particularly in view of the
COVID-19 pandemic. In conclusion, we found a protective benefit of obesity on mortality in CAP patients.
However, we uniquely demonstrate that the association between BMI and mortality is not linear, and no incremental
benefit of increasing BMI levels is observed in those with obesity classes II and III.
REFERENCES
1. Hainer V, Aldhoon-Hainerova I. Obesity paradox does exist. Diabetes Care 2013: 36 Suppl 2: S276-281.
2. Mazimba S, Holland E, Nagarajan V, Mihalek AD, Kennedy JLW, Bilchick KC. Obesity paradox in group
1 pulmonary hypertension: analysis of the NIH-Pulmonary Hypertension registry. Int J Obes (Lond) 2017: 41(8):
1164-1168.
3. Flegal KM, Kit BK, Orpana H, Graubard BI. Association of all-cause mortality with overweight and
obesity using standard body mass index categories: a systematic review and meta-analysis. JAMA 2013: 309(1): 71-
82.
4. Prospective Studies C, Whitlock G, Lewington S, Sherliker P, Clarke R, Emberson J, Halsey J, Qizilbash
N, Collins R, Peto R. Body-mass index and cause-specific mortality in 900 000 adults: collaborative analyses of 57
prospective studies. Lancet 2009: 373(9669): 1083-1096.
5. Frasca D, McElhaney J. Influence of Obesity on Pneumococcus Infection Risk in the Elderly. Front
Endocrinol (Lausanne) 2019: 10: 71.
6. Vaillant L, La Ruche G, Tarantola A, Barboza P, InVS fteita. Epidemiology of fatal cases associated with
pandemic H1N1 influenza 2009. Eurosurveillance 2009: 14(33): 19309.

7. Fezeu L, Julia C, Henegar A, Bitu J, Hu FB, Grobbee DE, Kengne A-P, Hercberg S, Czernichow S.
Obesity is associated with higher risk of intensive care unit admission and death in influenza A (H1N1) patients: a
systematic review and meta-analysis. Obesity Reviews 2011: 12(8): 653-659.
8. Fisher-Hoch SP, Mathews CE, McCormick JB. Obesity, diabetes and pneumonia: the menacing interface of
non-communicable and infectious diseases. Tropical Medicine & International Health 2013: 18(12): 1510-1519.
9. Investigators AI, Webb SA, Pettila V, Seppelt I, Bellomo R, Bailey M, Cooper DJ, Cretikos M, Davies AR,
Finfer S, Harrigan PW, Hart GK, Howe B, Iredell JR, McArthur C, Mitchell I, Morrison S, Nichol AD, Paterson
DL, Peake S, Richards B, Stephens D, Turner A, Yung M. Critical care services and 2009 H1N1 influenza in
Australia and New Zealand. The New England journal of medicine 2009: 361(20): 1925-1934.
10. Seidu S, Gillies C, Zaccardi F, Kunutsor SK, Hartmann-Boyce J, Yates T, Singh AK, Davies MJ, Khunti
K. The impact of obesity on severe disease and mortality in people with SARS-CoV-2: A systematic review and
meta-analysis. Endocrinol Diabetes Metab 2020: e00176.
11. Nie W, Zhang Y, Jee SH, Jung KJ, Li B, Xiu Q. Obesity survival paradox in pneumonia: a meta-analysis.
BMC Med 2014: 12: 61.
12. Corrales-Medina VF, Valayam J, Serpa JA, Rueda AM, Musher DM. The obesity paradox in community-
acquired bacterial pneumonia. Int J Infect Dis 2011: 15(1): e54-57.
13. Lee J, Kim K, Jo YH, Lee JH, Kim J, Chung H, Hwang JE. Severe thinness is associated with mortality in
patients with community-acquired pneumonia: a prospective observational study. Am J Emerg Med 2015: 33(2):
209-213.
14. Torres A, Peetermans WE, Viegi G, Blasi F. Risk factors for community-acquired pneumonia in adults in
Europe: a literature review. Thorax 2013: 68(11): 1057-1065.
15. Atamna A, Elis A, Gilady E, Gitter-Azulay L, Bishara J. How obesity impacts outcomes of infectious
diseases. Eur J Clin Microbiol Infect Dis 2017: 36(3): 585-591.
16. Chalmers JD, Mandal P, Singanayagam A, Akram AR, Choudhury G, Short PM, Hill AT. Severity
assessment tools to guide ICU admission in community-acquired pneumonia: systematic review and meta-analysis.
Intensive care medicine 2011: 37(9): 1409-1420.
17. Kahlon S, Eurich DT, Padwal RS, Malhotra A, Minhas-Sandhu JK, Marrie TJ, Majumdar SR. Obesity and
outcomes in patients hospitalized with pneumonia. Clin Microbiol Infect 2013: 19(8): 709-716.

18. Braun N, Hoess C, Kutz A, Christ-Crain M, Thomann R, Henzen C, Zimmerli W, Mueller B, Schuetz P.
Obesity paradox in patients with community-acquired pneumonia: Is inflammation the missing link? Nutrition 2017:
33: 304-310.
19. Ramirez JA, Wiemken TL, Peyrani P, Arnold FW, Kelley R, Mattingly WA, Nakamatsu R, Pena S, Guinn
BE, Furmanek SP, Persaud AK, Raghuram A, Fernandez F, Beavin L, Bosson R, Fernandez-Botran R, Cavallazzi R,
Bordon J, Valdivieso C, Schulte J, Carrico RM, University of Louisville Pneumonia Study G. Adults Hospitalized
With Pneumonia in the United States: Incidence, Epidemiology, and Mortality. Clin Infect Dis 2017: 65(11): 1806-
1812.
20. Peyrani P, Arnold FW, Bordon J, Furmanek S, Luna CM, Cavallazzi R, Ramirez J. Incidence and Mortality
of Adults Hospitalized With Community-Acquired Pneumonia According to Clinical Course. Chest 2020: 157(1):
34-41.
21. WHO. Physical status: the use and interpretation of anthropometry. Report of a WHO Expert Committee.
WHO Technical Report Series 854. Geneva: World Health Organization. [cited; Available from:
22. Chen J, Wang J, Jiang H, Li MC, He SY, Li XP, Shen D. Lower long-term mortality in obese patients with
community-acquired pneumonia: possible role of CRP. Clinics (Sao Paulo) 2019: 74: e608.
23. Marquis K, Debigare R, Lacasse Y, LeBlanc P, Jobin J, Carrier G, Maltais F. Midthigh muscle cross-
sectional area is a better predictor of mortality than body mass index in patients with chronic obstructive pulmonary
disease. Am J Respir Crit Care Med 2002: 166(6): 809-813.
24. Abramowitz MK, Hall CB, Amodu A, Sharma D, Androga L, Hawkins M. Muscle mass, BMI, and
mortality among adults in the United States: A population-based cohort study. PLoS One 2018: 13(4): e0194697.
25. Sahakyan KR, Somers VK, Rodriguez-Escudero JP, Hodge DO, Carter RE, Sochor O, Coutinho T, Jensen
MD, Roger VL, Singh P, Lopez-Jimenez F. Normal-Weight Central Obesity: Implications for Total and
Cardiovascular Mortality. Ann Intern Med 2015: 163(11): 827-835.
26. Braun N, Gomes F, Schutz P. "The obesity paradox" in disease--is the protective effect of obesity true?
Swiss Med Wkly 2015: 145: w14265.
27. Singanayagam A, Singanayagam A, Chalmers JD. Obesity is associated with improved survival in
community-acquired pneumonia. Eur Respir J 2013: 42(1): 180-187.

28. Hales CM, Carroll MD, Fryar CD, Ogden CL. Prevalence of obesity and severe obesity among adults:
United States, 2017–2018. 2020.
ROLE OF THE FUNDING SOURCE
Study was supported primarily by the Division of Infectious Diseases, University of Louisville, Kentucky. The
parent study was given partial support by Pfizer Inc.
CONFLICT OF INTEREST
All authors declared no conflict of interest in relation to the main objective of this work.
AUTHOR CONTRIBUTIONS
Design of the study – Julio Ramirez
Statistical Analysis – Stephen Furmanek and Connor Glick
Writing – Richard Y Kim, Julio Ramirez, Connor Glick, Stephen Furmanek, and Rodrigo Cavallazzi
Critical Review – Rodrigo Cavallazzi
All authors have reviewed and approved the final version of the manuscript.

Table 1: Patient characteristics on hospital admission
Variable
Underweight
BMI < 18.5
Normal weight
18.5 ≤ BMI < 25
Overweight
25 ≤ BMI < 30
Obese class I
30 ≤ BMI < 35
Obese class II
35 ≤ BMI < 40
Obese class III
40 ≤ BMI
Total Study Population
Pneumonia, Frequency(%) 545 (7) 2357 (32) 1932 (26) 1250 (17) 654 (9) 711 (10)
Demographics
Age, Median(IQR)* 75 [62,85] 72 [58,84] 70 [57,80] 67 [56,77] 62 [52,73] 58 [47,67]
Male sex, Frequency(%) 213 (39) 1199 (51) 1004 (52) 566 (45) 255 (39) 206 (29)
Race, Frequency(%)
Black 107 (20) 374 (16) 326 (17) 277 (22) 161 (25) 230 (32)
White 434 (80) 1940 (82) 1574 (82) 965 (77) 482 (74) 477 (67)
Other 4 (1) 43 (2) 32 (2) 8 (1) 11 (2) 4 (1)
Social and Medical History Frequency (%)
Smoking history
Current smoker 198 (36) 774 (33) 584 (30) 390 (31) 201 (31) 196 (28)
History of smoking 182 (33) 867 (37) 759 (39) 468 (37) 245 (38) 239 (34)
Non-smoking history 165 (30) 716 (30) 589 (31) 392 (31) 208 (32) 276 (39)
Chronic obstructive pulmonary disease 318 (58) 1068 (45) 857 (44) 574 (46) 311 (48) 347 (49)
Renal disease 114 (21) 699 (30) 564 (29) 396 (32) 194 (30) 218 (31)
Congestive heart failure 125 (23) 594 (25) 540 (28) 408 (33) 208 (32) 249 (35)
Neoplastic disease 105 (19) 390 (17) 242 (13) 130 (10) 67 (10) 56 (8)
Nursing home resident 98 (18) 385 (16) 248 (13) 125 (10) 58 (9) 73 (10)
Stroke 67 (12) 312 (13) 277 (14) 153 (12) 72 (11) 75 (11)
Liver disease 33 (6) 188 (8) 126 (7) 87 (7) 49 (8) 45 (6)
Physical Exam Findings Median (IQR)
Heart rate (Beats/Minute) 109 [93,122] 106 [92,120] 105 [91,119] 105 [90,119] 105 [93,117] 104 [90,118]
Respiratory rate (Breaths/Minute) 22 [20,28] 22 [20,27] 22 [20,27] 22 [20,27] 22 [20,26] 23 [20,27]
Systolic blood pressure (mmHg) 110 [95,132] 112 [96,130] 115 [99,133] 119 [102,138] 120 [105,141] 122 [105,141]
Temperature (Degrees Fahrenheit) 98.8 [98.2,99.7] 98.9 [98.2,100.2] 99.0 [98.2,100.6] 99.0 [98.4,100.4] 99.0 [98.4,100.2] 99.0 [98.3,100.0]
Hematocrit (percent) 34 [30,39] 35 [31,39] 36 [32,40] 36 [32,40] 37 [33,41] 37 [33,40]
Serum sodium (mEq/L) 136 [133,140] 137 [134,140] 137 [134,140] 137 [134,140] 137 [135,140] 138 [135,140]
Blood urea nitrogen (mg/dL) 19 [13,30] 20 [14,31] 19.5 [14,29] 19 [13,28] 18 [13,28] 17 [12,28]
Serum glucose (mg/dl) 130 [107,168] 134 [110,177] 142 [114,193] 153 [119,211] 156 [119,227] 159 [121,237]
Severity of Disease Frequency (%)
Pneumonia severity index risk class IV/V 379 (70) 1578 (67) 1193 (62) 710 (57) 333 (51) 323 (45)
Altered mental status 125 (23) 500 (21) 380 (20) 190 (15) 111 (17) 101 (14)
Pleural effusion 187 (34) 849 (36) 624 (32) 383 (31) 180 (28) 184 (26)
Need for intensive care 86 (16) 420 (18) 314 (16) 211 (17) 104 (16) 140 (20)
Need for vasopressors 14 (3) 71 (3) 61 (3) 34 (3) 12 (2) 21 (3)
Need for ventilatory support 69 (13) 282 (12) 232 (12) 170 (14) 97 (15) 137 (19)
*IQR: Interquartile range

Table 2: Study outcomes according to weight classes
Variable
Underweight
BMI < 18.5
Normal weight
18.5 ≤ BMI < 25
Overweight
25 ≤ BMI < 30
Obese class I
30 ≤ BMI < 35
Obese class II
35 ≤ BMI < 40
Obese class III
40 ≤ BMI
Total Study Population
Pneumonia, Frequency(%) 545 (7) 2357 (32) 1932 (26) 1250 (17) 654 (9) 711 (10)
Outcomes Median (IQR)
Time to clinical stability 2 [1,4] 2 [1,4] 2 [1,4] 2 [1,3] 2 [1,4] 2 [1,4]
< 4 days, Frequency(%) 371 (68.1) 1714 (72.7) 1411 (73.0) 947 (75.8) 468 (71.6) 531 (74.7)
Length of stay 5 [3,9] 5 [3,8] 5 [3,8] 5 [3,8] 4 [3,7] 5 [3,8]
< 5 days, Frequency(%) 222 (40.7) 1072 (45.5) 852 (44.1) 598 (47.8) 328 (50.2) 343 (48.2)
Clinical failure, Frequency(%) 127 (23.3) 516 (21.9) 433 (22.4) 290 (23.2) 155 (23.7) 196 (27.6)
Mortality, Frequency(%)
In-Hospital 46 (8.4) 170 (7.2) 104 (5.4) 52 (4.2) 28 (4.3) 29 (4.1)
30-Day 116 (21.8) 375 (16.2) 204 (10.7) 105 (8.6) 50 (7.7) 50 (7.1)
6-Month 218 (41.2) 667 (28.8) 404 (21.2) 204 (16.6) 89 (13.8) 91 (12.9)
1-Year 260 (49.3) 859 (37.3) 526 (27.7) 280 (22.9) 113 (17.6) 135 (19.1)
*IQR: Interquartile range

Legends for figures:
Figure 1. Early time to clinical stability (≤ 3 days) according to body mass index in hospitalized patients with
community-acquired pneumonia.
Figure 2. Short length of stay (< 5 days) according to body mass index in hospitalized patients with community-
acquired pneumonia.
Figure 3. Clinical failure according to body mass index in hospitalized patients with community-acquired
pneumonia.
Figure 4. Mortality according to body mass index in hospitalized patients with community-acquired pneumonia.


Supplementary material
Table of Contents
Title: Survival Incremental Benefit Does Not Extend Beyond Class I Obesity in Hospitalized Patients with
Community-Acquired Pneumonia
Authors: Richard Y. Kim, Connor Glick, Stephen Furmanek, Julio A. Ramirez, Rodrigo Cavallazzi
Abbreviations and definitions…………………………………………………………………………………………….2
Tables S1a and S1b…………………………………………………………………………………………………………….3
Tables S2a and S2b…………………………………………………………………………………………………………….4
Tables S3a and S3b…………………………………………………………………………………………………………….5
Tables S4a and S4b…………………………………………………………………………………………………………….6
Tables S5a and S5b…………………………………………………………………………………………………………….7
Tables S6a and S6b…………………………………………………………………………………………………………….8
Tables S7a and S7b…………………………………………………………………………………………………………….9

Abbreviations and definitions
GAM – Generalized additive model
Beta – the slope estimate from the parametric portion of the GAM; the change in log-odds of receiving
the outcome given a change in the variable
OR – the odds ratio, or exponentiated slope term
95% CI LB – Lower bound of the 95% confidence interval of the OR
95% CI UB – Upper bound of the 95% confidence interval of the OR
Edf – Effective degrees of freedom of the smoothed function for the variables in the GAM. Degrees of
freedom are penalized in a GAM based on the smoothed function
– The Chi-Squared statistic associated with each smoothed function

Tables S1a and S1b. Generalized additive model assessing the effect of variables on time to clinical
stability (≤ 3 days) in hospitalized patients with community-acquired pneumonia.
Table S1a.
Beta OR 95% CI LB 95% CI UB p-value
Sex 0.08 1.08 0.96 1.21 0.185
White -0.21 0.81 0.70 0.94 0.005
Other race -0.14 0.87 0.54 1.42 0.582
Altered mental status -0.55 0.58 0.50 0.66 <0.001
Cancer -0.18 0.84 0.71 0.98 0.027
CHF -0.05 0.95 0.84 1.08 0.463
Stroke -0.01 0.99 0.84 1.17 0.914
Renal disease -0.01 0.99 0.86 1.14 0.919
Liver disease -0.01 0.99 0.80 1.23 0.946
COPD -0.19 0.82 0.73 0.93 0.002
Nursing home resident -0.31 0.73 0.62 0.86 <0.001
Smoking history 0.02 1.02 0.88 1.18 0.804
Non-smoking history 0.00 1.00 0.85 1.17 0.952
Glucose 0.00 1.00 1.00 1.00 0.745
Pleural effusion -0.15 0.86 0.76 0.97 0.013
Table S1b.
Edf p-value
Age 1.60 1.20 0.553
Heart rate 3.80 27.24 <0.001
Respiratory rate 6.83 82.85 <0.001
Systolic blood pressure 6.52 45.92 <0.001
Temperature 5.66 11.46 0.116
BMI 1.00 1.18 0.278
Blood urea nitrogen 2.75 27.34 <0.001
Sodium 2.89 8.66 0.048
Hematocrit 2.54 10.02 0.024
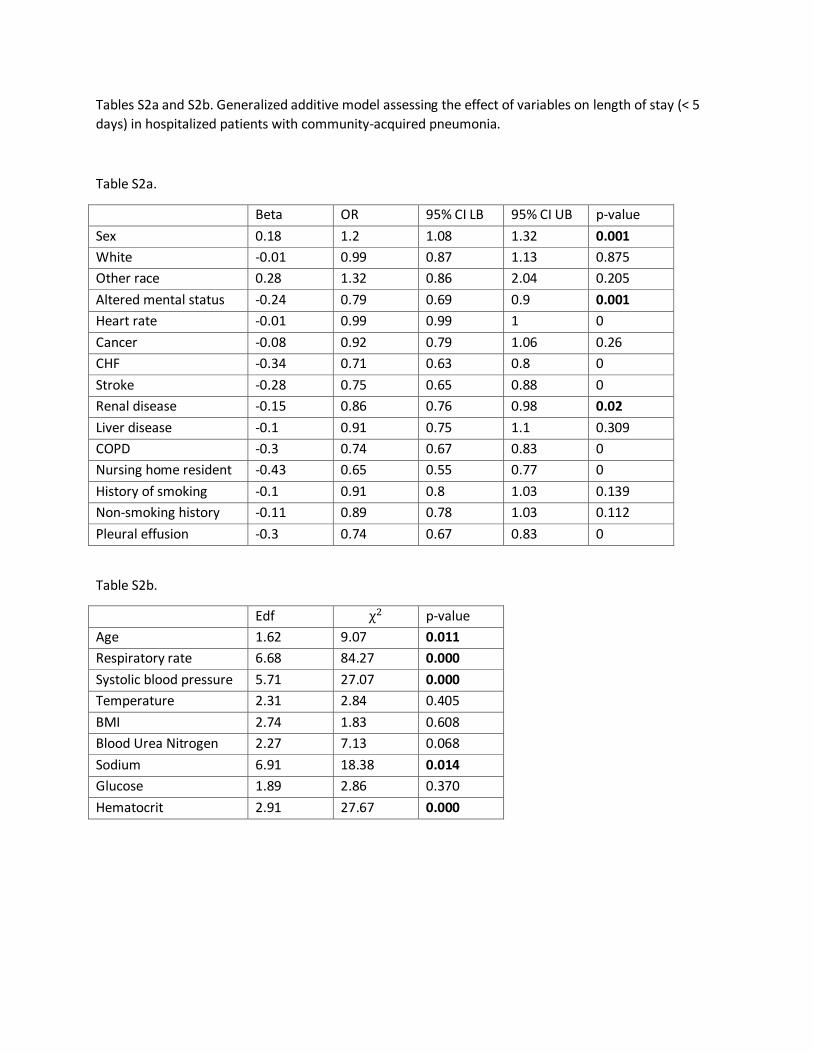
Tables S2a and S2b. Generalized additive model assessing the effect of variables on length of stay (< 5
days) in hospitalized patients with community-acquired pneumonia.
Table S2a.
Beta OR 95% CI LB 95% CI UB p-value
Sex 0.18 1.2 1.08 1.32 0.001
White -0.01 0.99 0.87 1.13 0.875
Other race 0.28 1.32 0.86 2.04 0.205
Altered mental status -0.24 0.79 0.69 0.9 0.001
Heart rate -0.01 0.99 0.99 1 0
Cancer -0.08 0.92 0.79 1.06 0.26
CHF -0.34 0.71 0.63 0.8 0
Stroke -0.28 0.75 0.65 0.88 0
Renal disease -0.15 0.86 0.76 0.98 0.02
Liver disease -0.1 0.91 0.75 1.1 0.309
COPD -0.3 0.74 0.67 0.83 0
Nursing home resident -0.43 0.65 0.55 0.77 0
History of smoking -0.1 0.91 0.8 1.03 0.139
Non-smoking history -0.11 0.89 0.78 1.03 0.112
Pleural effusion -0.3 0.74 0.67 0.83 0
Table S2b.
Edf p-value
Age 1.62 9.07 0.011
Respiratory rate 6.68 84.27 0.000
Systolic blood pressure 5.71 27.07 0.000
Temperature 2.31 2.84 0.405
BMI 2.74 1.83 0.608
Blood Urea Nitrogen 2.27 7.13 0.068
Sodium 6.91 18.38 0.014
Glucose 1.89 2.86 0.370
Hematocrit 2.91 27.67 0.000

Tables S3a and S3b. Generalized additive model assessing the effect of variables on clinical failure in
hospitalized patients with community-acquired pneumonia.
Table S3a.
Beta OR 95% CI LB 95% CI UB p-value
Age -0.01 0.99 0.99 1.00 0.046
Sex 0.00 1.00 0.88 1.15 0.976
White 0.19 1.21 1.02 1.44 0.030
Other race 0.05 1.05 0.59 1.89 0.865
Altered mental status 1.10 2.99 2.55 3.50 <0.001
Cancer 0.14 1.15 0.95 1.39 0.153
CHF 0.43 1.53 1.33 1.77 <0.001
Stroke -0.14 0.87 0.72 1.06 0.167
Renal disease -0.07 0.93 0.79 1.10 0.394
Liver disease -0.03 0.97 0.76 1.25 0.833
COPD 0.33 1.39 1.20 1.60 <0.001
Nursing home resident 0.26 1.30 1.07 1.57 0.007
Smoking history -0.13 0.88 0.74 1.04 0.135
Non-smoking history -0.18 0.84 0.69 1.01 0.064
Pleural effusion 0.29 1.34 1.17 1.54 <0.001
Table S3b.
Edf p-value
Heart rate 1.88 30.94 <0.001
Respiratory rate 7.50 387.74 <0.001
Systolic blood pressure 6.23 182.61 <0.001
Temperature 8.34 35.95 <0.001
BMI 1.00 28.08 <0.001
Blood urea nitrogen 4.42 60.38 <0.001
Sodium 3.84 21.59 0.001
Glucose 3.99 33.60 <0.001
Hematocrit 2.15 3.06 0.315

Tables S4a and S4b. Generalized additive model assessing the effect of variables on in-hospital mortality
in hospitalized patients with community-acquired pneumonia.
Table S4a.
Beta OR 95% CI LB 95% CI UB p-value
Age 0.02 1.02 1.01 1.03 <0.001
Sex 0.14 1.14 0.92 1.43 0.236
White 0.53 1.71 1.23 2.37 0.002
Other race -0.57 0.56 0.13 2.45 0.444
Altered mental status 0.53 1.70 1.34 2.17 <0.001
Temperature -0.09 0.91 0.86 0.96 <0.001
Cancer 0.90 2.45 1.89 3.18 <0.001
CHF 0.16 1.17 0.92 1.49 0.191
Stroke -0.05 0.95 0.71 1.29 0.752
Renal disease 0.23 1.26 0.98 1.61 0.074
Liver disease 0.67 1.95 1.32 2.89 0.001
COPD -0.14 0.87 0.69 1.09 0.225
Nursing home resident 0.68 1.97 1.51 2.56 <0.001
Smoking history 0.34 1.41 1.03 1.93 0.031
Non-smoking history 0.29 1.33 0.94 1.88 0.104
Sodium -0.01 0.99 0.97 1.01 0.228
Glucose 0.00 1.00 1.00 1.00 0.432
Pleural effusion 0.39 1.47 1.18 1.84 0.001
Table S4b.
Edf p-value
Heart rate 1.01 12.14 0.001
Respiratory rate 8.62 98.39 <0.001
Systolic blood pressure 2.39 32.65 <0.001
BMI 1.99 6.14 0.088
Blood urea nitrogren 3.01 46.66 <0.001
Hematocrit 1.78 1.87 0.463

Tables S5a and S5b. Generalized additive model assessing the effect of variables on 30-day mortality in
hospitalized patients with community-acquired pneumonia.
Table S5a.
Beta OR 95% CI LB 95% CI UB p-value
Age 0.03 1.03 1.02 1.04 <0.001
Sex 0.19 1.21 1.02 1.43 0.026
White 0.43 1.54 1.21 1.96 0.001
Other race -0.03 0.97 0.42 2.24 0.947
Altered mental status 0.69 2.00 1.66 2.41 <0.001
Systolic blood pressure -0.01 0.99 0.99 1.00 <0.001
Cancer 1.20 3.33 2.74 4.04 <0.001
CHF 0.13 1.14 0.96 1.37 0.144
Stroke 0.05 1.05 0.84 1.31 0.685
Renal disease 0.14 1.15 0.95 1.40 0.140
Liver disease 0.41 1.51 1.10 2.05 0.010
COPD -0.19 0.83 0.69 0.99 0.033
Nursing home resident 0.70 2.01 1.64 2.46 <0.001
Smoking history 0.18 1.20 0.96 1.51 0.115
Non-smoking history 0.19 1.21 0.94 1.55 0.142
Pleural effusion 0.46 1.58 1.34 1.86 <0.001
Table S5b.
Edf p-value
Heart rate 3.70 22.11 <0.001
Respiratory rate 8.31 81.70 <0.001
Temperature 1.58 28.51 <0.001
BMI 3.07 39.97 <0.001
Blood urea nitrogen 2.53 53.72 <0.001
Sodium 6.22 24.95 0.001
Glucose 6.60 9.56 0.237
Hematocrit 3.73 17.48 0.003

Tables S6a and S6b. Generalized additive model assessing the effect of variables on 6-month mortality in
hospitalized patients with community-acquired pneumonia.
Table S6a.
Beta OR 95% CI LB 95% CI UB p-value
Age 0.03 1.03 1.02 1.03 <0.001
Sex 0.25 1.28 1.12 1.46 <0.001
White 0.21 1.23 1.03 1.47 0.025
Other race -0.42 0.66 0.34 1.29 0.223
Altered mental status 0.54 1.71 1.46 2.00 <0.001
Cancer 1.35 3.87 3.28 4.56 <0.001
CHF 0.31 1.36 1.18 1.57 <0.001
Stroke -0.02 0.98 0.82 1.18 0.849
Renal disease 0.16 1.17 1.00 1.36 0.049
Liver disease 0.35 1.42 1.11 1.82 0.006
COPD 0.05 1.05 0.91 1.21 0.489
Nursing home resident 0.89 2.43 2.04 2.89 <0.001
Smoking history 0.14 1.15 0.97 1.36 0.119
Non-smoking history 0.16 1.18 0.97 1.43 0.098
Glucose 0.00 1.00 1.00 1.00 0.907
Pleural effusion 0.49 1.63 1.43 1.86 <0.001
Table S6b.
Edf p-value
Heart rate 4.03 24.74 <0.001
Respiratory rate 6.02 62.90 <0.001
Systolic blood pressure 3.85 17.33 0.003
Temperature 3.70 68.14 <0.001
BMI 3.44 89.42 <0.001
Blood urea nitrogen 2.48 27.37 <0.001
Sodium 4.26 19.27 0.002
Hematocrit 3.88 39.70 <0.001
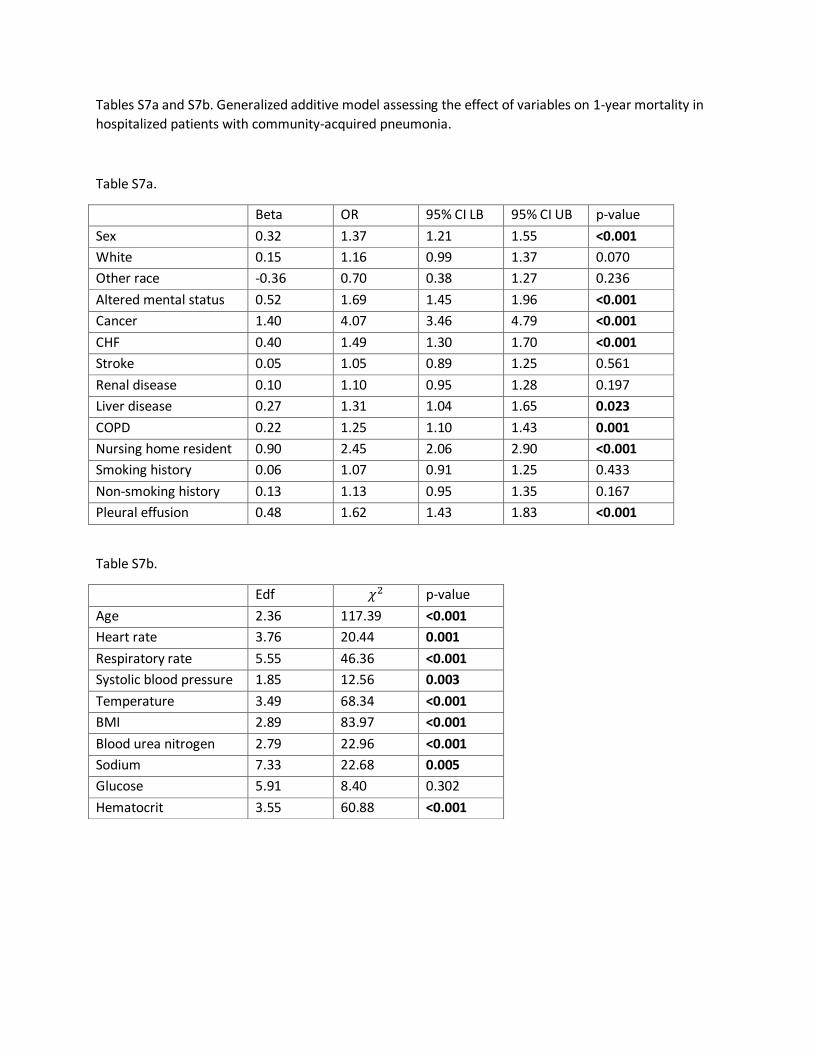
Tables S7a and S7b. Generalized additive model assessing the effect of variables on 1-year mortality in
hospitalized patients with community-acquired pneumonia.
Table S7a.
Beta OR 95% CI LB 95% CI UB p-value
Sex 0.32 1.37 1.21 1.55 <0.001
White 0.15 1.16 0.99 1.37 0.070
Other race -0.36 0.70 0.38 1.27 0.236
Altered mental status 0.52 1.69 1.45 1.96 <0.001
Cancer 1.40 4.07 3.46 4.79 <0.001
CHF 0.40 1.49 1.30 1.70 <0.001
Stroke 0.05 1.05 0.89 1.25 0.561
Renal disease 0.10 1.10 0.95 1.28 0.197
Liver disease 0.27 1.31 1.04 1.65 0.023
COPD 0.22 1.25 1.10 1.43 0.001
Nursing home resident 0.90 2.45 2.06 2.90 <0.001
Smoking history 0.06 1.07 0.91 1.25 0.433
Non-smoking history 0.13 1.13 0.95 1.35 0.167
Pleural effusion 0.48 1.62 1.43 1.83 <0.001
Table S7b.
Edf p-value
Age 2.36 117.39 <0.001
Heart rate 3.76 20.44 0.001
Respiratory rate 5.55 46.36 <0.001
Systolic blood pressure 1.85 12.56 0.003
Temperature 3.49 68.34 <0.001
BMI 2.89 83.97 <0.001
Blood urea nitrogen 2.79 22.96 <0.001
Sodium 7.33 22.68 0.005
Glucose 5.91 8.40 0.302
Hematocrit 3.55 60.88 <0.001