Embed Size (px)
Citation preview

"AGGREGATE DIFFUSION FORECASTING MODELSIN MARKETING: A CRITICAL REVIEW"
b'
P. PARKER*
93/92/TM/MKT
* Associate Professor at INSEAD, Boulevard de Constance, Fontainebleau 77305 Cedex,France.
A working paper in the INSEAD Working Paper Series is intended as a means whereby afaculty researcher's thoughts and findings may be communicated to interested readers. Thepaper should be considered preliminary in nature and may require revision.
Printed at INSEAD, Fontainebleau, France

Aggregate Diffusion Forecasting Models in Marketing:A Critical Review
December 1993
Philip M. ParkerAssociate ProfessorINSEAD77305 Fontainebleau France(tel. 33-1-60-72-4000)
The author would like to thank Marcel Corsjtens, Vijay Mahajan, TheodoreModis and Hermann Simon for their directive comments on earlier versions ofthis paper.

Aggregate Diffusion Forecasting Models in Marketing: A Critical Review
Abstract
Since the 1960s, a number of new product diffusion models have been developed and appliedin marketing. This paper reviews the theoretical origins, specifications, data requirements,estimation procedures, and pre-launch calibration possibilities for these aggregate models.Following a critical review of both the problems and the potential benefits of these models,a number of suggestions are made with respect to future academic and applied researchinvolving new product diffusion forecasting.

3
Aggregate Diffusion Forecasting Models in Marketing: A Critical Review
1. Introduction
One of the most important goals of firms is to successfully launch and market new products.
Prior to launch or during die introductory months or years, market demand forecasts are
critical to production, distribution, marketing and general planning efforts for these products.
Since the 1960s, a number of new product forecasting models have been developed and
documented in die academic marketing literature which are specifically designed to forecast
new product acceptance over time. This paper reviews aggregate marketing models which
fend their theoretical roots in the literature on the diffusion of innovations (Rogers 1983).
Diffusion processes characterize the acceptance or penetration of a new idea, behavior or
physical innovation over lime by a given social system. Based on hundreds of studies in
various disciplines (sociology, education, marketing, economics), Rogers (1983) proposes that
diffusion rates are affected by die type of innovation, its perceived attributes, the influence
of communication channels, the nature of die social system and its population, die marketing
activities of firms (change agents), consumer adoption processes, and the characteristics of
individuals within die social system (personality, demographics, communication behavior).
Robertson (1967), among others, extended die diffusion literature to marketing by suggesting
that new product innovations undergo diffusion processes. Despite the number of factors that
might affect new product acceptance, there has been a proliferation of parsimonious
mathematical models over die last three decades which have been designed to characterize
certain regularities in aggregate diffusion patterns, product life cycle curves, or new product
penetration curves starting with the bell-shaped adoption curve, or the s-shaped penetration
curve, as shown in Exhibit 1 for twelve consumer durable products.'
The data shown are first purchases only (total sales,less repeat and multiple purchases); source: various issues ofMerchandising, Merchandising Weekly, Electronics Weekly,Dealerscope, Dealership Merchandising, Appliance and theElectronics Industry Association and A.C. Nielsen (see Parker1992 and 1993a for details).

4
This review evaluates the use of these models as applied tools to forecast new product
diffusion. Despite a number of documented industrial applications (see, for example, Bass
1986), a number of authors have raised concems over the use of these models for forecasting
purposes (Bernhardt and MacKensie 1972; Heeler and Hustad 1980). Mahajan, Muller and
Bass (1990, p. 9) note that "by the time sufficient observations have developed for reliable
estimation, it is too Tate to use the estimates for forecasting purposes." Simon (1992, p. 13)
recently concludes that "as forecasting tools" diffusion models "are risky and potentially
misleading." These concems are generated, in part, by a fundamental lack of common
knowledge conceming these models. Given the sheer number and variety of specifications,
both applied and academic researchers seeking to use these models in a forecasting exercise
are faced with the following questions:
- which model among the varions alternatives should be used? For which types of products
and marketing processes are the models correctly specified?
- lacking sufficient historical data, how can the models be used to predict future diffusion
pattems?
- given some historical data, which estimation procedure is appropriate?
how much does forecasting accuracy, or parameter stability improve as more observations
become available? How many degrees of freedom are typically required before' these
models become useful (i.e. better than alternative methods)?
While a number of authors have suggested varions answers to these questions, general and
systematic approaches to using new product diffusion models have yet to be proposed in the
literature. This review will attempt to clarify many of these issues and, where a general
understanding is lacking, suggest future research directions. Our discussion is limited,
however, to forecasting models and issues alone, given the richness of this area.
A number of previous literature reviews consider in greater detail the descriptive, theoretical

5
and normative use of diffusion models in marketing. Mahajan, Muller and Bass (1990),
Bridges, Coughlan and Kalish (1991), and Lilien, Kotler and Moorthy (1992) provide
excellent reviews of the entire modelling area. These supersede earlier reviews by Mahajan
and Muller (1979), Meade (1984) and Mahajan and Wind (1986). Jeuland (1981) traces
parsimonious diffusion models to their origins in a historical review of diffusion models
across disciplines. The use of diffusion models in normative studies, in addition to the above,
is reviewed in Hanssens, Parsons, and Schultz (1992, Chapter 8), and Simon (1989, Chapter
6). Since this review will focus on aggregate adoption (first purchase) models, we will not
consider a number of new product forecasting procedures designed for frequently purchased
products for which the trial process is not typically modelled as a diffusion process or where
repeat purchase sales are emphasized; the reader is referred to the comprehensive reviews
provided in Lilien, Kotler and Moorthy (1992, pp. 480-500) and Mahajan and Wind (1988).
Finally, this review is limited to considering alternatives proposed within this particular
literature stream; the relative merits of other approaches over diffusion models are only
discussed if such comparisons are previously reported in the literature.
2. The Basic Theory
Unlike alternative forecasting methods, diffusion models have a common foundation in the
diffusion of innovations literature. Rogers (1983, p.10) concisely defines diffusion "as the
process by which an innovation is communicated through certain channels over time among
members of the social system." Rogers identifies the four main elements of diffusion as the
innovation, communication channels, time, and the social system. Innovations are typically
accepted within a given social system by being adopted over time by various user segments:
"innovators" (the first 2.5% to adopt), then the early adopters, the early majority, the late
majority, and the laggards (the last 16% to adopt). Adoption levels are initially low by
innovators and early adopters who act as opinion leaders, increase to a peak based on social
learning, word-of-mouth and other forms of interpersonal influence, and then decline as the
social system saturates; penetration levels follow the familiar s-shape pattern reflecting
cumulative adoptions over time, and the bell-shaped diffusion curve for new adoptions
(Exhibits 1 and 2 respectively). Forecasters are critically interested in having an accurate

6
picture of these two curves prior to, or in the early years following product introduction.
Extending diffusion research to consumer behavior, Robertson (1969, 1971) proposes that new
products follow similar diffusion patterns. Robertson defines three types of innovations which
undergo diffusion processes: continuons, dynamically continuons, and discontinuons
innovations. In theory, there is a negative relationship between the continuity of an
innovation and the level of social learning or interpersonal influence (including opinion
leadership) among adopters; there is a negative relationship between social learning and
diffusion speed (Gatignon and Robertson 1985). For a given market potential (target
customer group), a continuons innovation will not disrupt established behavioral patterns after
it is introduced (e.g., "new improved" dishwasher detergent), and is most likely to have an
exponential penetration curve (Gatignon and Robertson 1985). A dynamically continuons
innovation will cause some changes in behavior but not a significant amount within the
market potential targeted (e.g., cordless telephones). Discontinuons innovations cause
significant changes in consumer behavior and requise substantial learning prior to adoption
for members of the target market (e.g., the first television sets). Robertson suggests that
dynamically continuons or discontinuons product innovations are likely to have bell-shaped
diffusion patterns or s-shaped penetration curves similar to those found by Rogers. It is from
this basis that new product diffusion models find their theoretical justification in marketing.
In general, aggregate diffusion models have two basic components (1) a target market
potential, or number of ultimate adopters, and (2) a growth rate component which can
characterize interpersonal influence among members of the target market. Models lacking
these components include naïve extrapolation and varions time-dependent growth models. We
begin our review by highlighting varions model specifications which, by capturing these
components, have proven useful to forecast the size of an innovation's market potential, and
its speed of adoption.

3. Choosing Among the Proposed Models
Despite the concerns raised in the introduction, successful applications of diffusion models
as applied forecasting tools have been documented (sec, for example, Mahajan, Muller and
Bass 1990). The key to their successful use depends, in part, on the researcher correctly
matching the model to the adoption process under study. To guide this choice, we will
briefly describe three types of aggregate diffusion models: (1) first purchase models which
stem from or are generalized by the model proposed by Bass (1969), (2) non-Bass first
purchase models, and (3) repeat purchase models. First purchase models generally multiply
a hazard rate in each time period against an aggregate market potential. The hazard approach
is the general framework for most diffusion models in marketing. We will also briefly review
recent efforts which relax certain assumptions common in these aggregate diffusion models,
namely that the probabilities of adoption are homogeneous across individuals (see, for
example, Chatterjee and Eliashberg 1990). Micro-level diffusion models consider individual-
level adoption processes and have been found superior to certain aggregate hazard-based
models in forecasting new product adoption (see, for example, Lattin and Roberts 1989, and
Sinha and Chandrashekaran 1992). Finally, repeat purchase models capture additional
purchases (adoptions) after first purchases. In this section we primarily focus on reviewing
the functional forms of these models, leaving data requirements, estimation, and forecasting
issues to later sections.
3.1 First Purchase Diffusion Models
Fourt and Woodlock (1960) proposed one of the earliest new product growth models in
marketing which has seen wide industrial application. If f(t) is the density function of a
consumer to adopt a product in time t and F(t) is its associated cumulative distribution
function, Fourt and Woodlock assume that the conditional probability of adopting, given that
one has not yet adopted, is constant over time:
7
f(t)/(1-F(t)) = a (1)

8
Or,
f(t) = a (1 - F(t)) (2)
where a is a positive hazard rate. To forecast trials (first adoption/purchases), one can define
M as die market potential, or the total number of ultimate adopters (assuming this is static),
n(t) as the number of adopters in time t, and N(t) as the total number of cumulative adopters
up to, but not including t.2 Since f(t) = n(t)/M, and F(t) = N(t)/M, then,
n(t) = a (M - N(t))
(3)
growth saturationeffects effects
Typical of aggregate diffusion models in marketing, this model exhibits growth effects (the
hazard rate) which regulate die speed and shape of the diffusion process, and saturation
effects which constrain die process to a fixed level M. Consistent with Gatignon and
Robertson (1985), the Fourt and Woodlock model has typically been applied to the trials or
first purchases of inexpensive packaged products, continuons innovations which have
exponential trial curves or products having low word-of-mouth effects (e.g., the PROMPT
system, developed by Information Resources Inc., applies the model to scanner data to
generate trial forecasts).
Not ail products experience exponential penetration rates beginnnig at launch. The model
proposed by Bass (1969) generates s-shaped penetration curves while explicitly considering
the diffusion literature. Departing from Rogers, Bass defines two categories of adopters who
interact with each other in a contagion process: innovators and imitators. The Bass model
postulates that the hazard rate in time t is a linear function which increases with the
cumulative distribution function (a + b F(t)), resulting in the following aggregate diffusion
model:
2 Fourt and Woodlock note that M can represent some percentof a given social system; for example, M might represent 40percent of a target market.
9
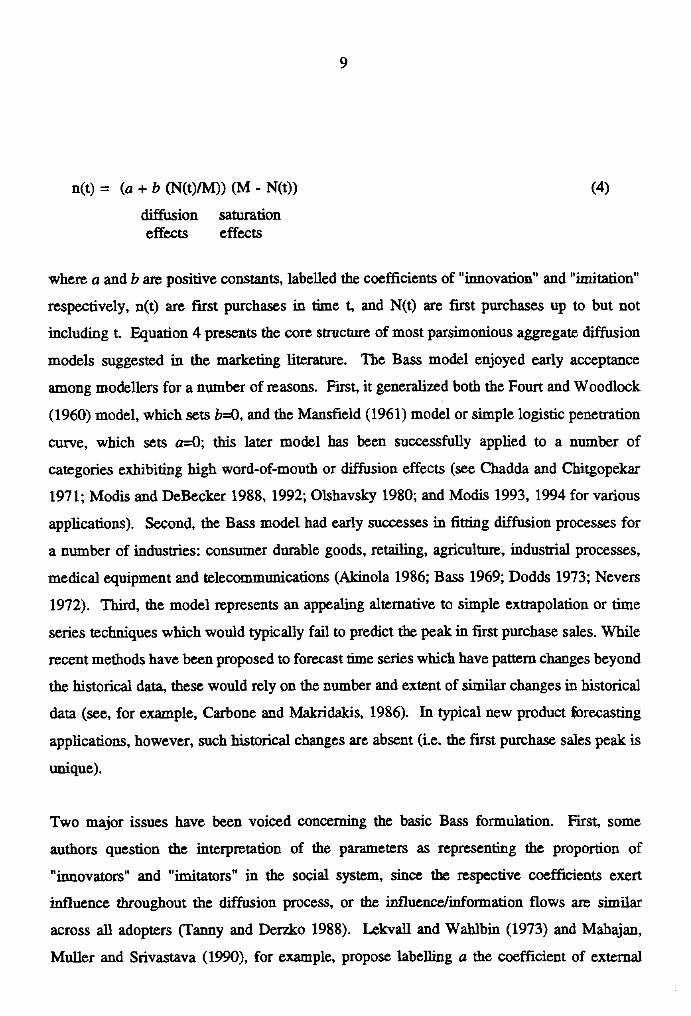
n(t) = (a + b (N(t)/M)) (M - N(t)) (4)
diffusion saturationeffects effects
where a and b are positive constants, labelled the coefficients of "innovation" and "imitation"
respectively, n(t) are first purchases in time t, and N(t) are first purchases up to but not
including t. Equation 4 presents the core structure of most parsimonious aggregate diffusion
models suggested in the marketing literature. The Bass model enjoyed early acceptance
among modellers for a number of reasons. First, it generalized both the Fourt and Woodlock
(1960) model, which sets 17.4, and the Mansfield (1961) model or simple logistic penetration
cuve, which sets a=0; this later model lias been successfully applied to a number of
categories exhibiting high word-of-mouth or diffusion effects (see Chadda and Chitgopekar
1971; Modis and DeBecker 1988, 1992; Olshavsky 1980; and Modis 1993, 1994 for various
applications). Second, the Bass model had early successes in fitting diffusion processes for
a number of industries: consumer durable goods, retailing, agriculture, industrial processes,
medical equipment and telecommunications (Akinola 1986; Bass 1969; Dodds 1973; Nevers
1972). Third, the model represents an appealing alternative to simple extrapolation or time
series techniques which would typically fail to predict the peak in first purchase sales. While
recent methods have been proposed to forecast time series which have pattern changes beyond
the historical data, these would rely on the number and extent of similar changes in historical
data (see, for example, Carbone and Makridakis, 1986). In typical new product forecasting
applications, however, such historical changes are absent (i.e. the first purchase sales peak is
unique).
Two major issues have been voiced concerning the basic Bass formulation. First, some
authors question the interpretation of the parameters as representing the proportion of
"innovators" and "imitators" in the social system, since the respective coefficients exert
influence throughout the diffusion process, or the influence/information flows are similar
across ail adopters (Tanny and Derzko 1988). Lekvall and Wahlbin (1973) and Mahajan,
Muller and Srivastava (1990), for example, propose labelling a the coefficient of external

10
influence (capturing information external to cumulative social experience) and b the
coefficient of internai influence. To date, few studies have explicitly tested whether, for
example, products having larger diffusion parameters values actually exhibited more word-of-
mouth influence (or other), versus products with small values. Since diffusion parameters
reflect the net effect of numerous phenomena, it is not clear that they can be generally
labelled as reflecting certain influences, especially in a general sense across ail categories.
Second, and despite the apparent advantages over alternatives, a number of authors note that
the model fails to consistently predict either the peak in new product sales or the penetration
ceiling for a broad ranges of categories (Bernhardt and MacKensie 1972; Heeler and Hustad
1980; and Tigert and Farivar 1981), and that direct parameter estimates are often implausible
or provide nonsensical projections. This problem is especially critical when external
judgements are not imposed on certain model parameters (e.g. the market potential, M).
Exhibit 2, for example, depicts the first purchase diffusion curves, or adoption life cycles for
varions consumer durable products. Unlike the theoretical adoption pattern proposed by
Rogers, and characterized by the Bass model, some categories are skewed left, skewed right,
or have multiple peaks. Lacking external constraints, the Bass model will inadvertently
interpret early variations in adoption (e.g. due to seasonality, business cycles, data reporting
errors, etc.) as inflection points, or peaks, which can lead to unreasonable parameter estimates
and long-run forecasts. During the late 1970s and 1980s a variety of extensions to the
original Bass model were proposed to overcome some of these shortcomings, including the
addition of varions marketing mix elements, and an extensive study of parameter estimation
procedures.
Modelling extensions have incorporated dyrirnic market potentials (Mahajan and Peterson
1978, Mahajan, Peterson, Jain and Malhotra 1979), non-uniform interpersonal influences
(Easingwood, Mahajan and Muller 1983), and heterogeneous adopter populations (Jeuland
1981). The following 5-parameter diffusion model, interpreted below, simultaneously
represents these modifications to the Bass model:

11
n(t) = (a + b (N(t)/cM(t)r")) (cM(t) - N(t))(i+e) (5)
diffusion saturationeffects effects
where a, b, c, d and e are estimated constants, and M(t) is the market potential (social system)
which varies over time. Equation 5 belongs to a class of flexible diffusion models which
allows for non-symmetric patterns (see Mahajan, Muller and Bass 1990). The imitation (or
internai influence) coefficient, b, is the baseline level of interpersonal influences (or contagion
effects). The parameter c measures the long-run penetration ceiling and accounts for the non-
adoption by some percentage of the market potential M(t). M(t) is set exogenously (say, the
number of households wired with electricity when studying consumer electronics); see, for
example, Schmittlein and Mahajan (1982) , and Kamakura and Balasubramanian (1988).
Values of c are positively related, therefore, to the number of segments that ultimately adopt
the product within a social system or target market. Low empirical estimates of c indicate
that the long-run diffusion process is limited to a small proportion of households perhaps
one or two segments. A value of .99 for c indicates that a product is adopted by virtually all
members in a given social system (e.g. as was the case for black-and-white television in the
United States). Since influences may intensify, or diminish as the category matures,
Easingwood, Mahajan and Muller (1981, 1983) control for nonuniform interpersonal influence
(NUI) by incorporating the constant d (-1<d). Holding b constant, lower values of d result
in faster penetration take-off periods (interpersonal influences increase), while larger values
of d reflect increased resistance. The NUI parameter is analogous, therefore, to changes in
consumers' immunity to social influence or contagion effects. The NUI parameter allows the
adoption curve to be skewed left, or right, in a non-symmetric pattern. Finally, Jeuland
(1981) controls for heterogeneous adopter populations via the parameter e (0<e). Since not
all members of die social system are identical in their income, tastes, ages, etc., Jeuland
suggests that e controls for differences across consumers in their propensities to adopt.
Within equation 5 there are some 20-nested models which have all seen some empirical
application in the marketing (see, for example, Easingwood et al. 1981, 1983; Kamakura and
Balasubramanian 1988; Parker 1992, 1993a; and Schmittlein and Mahajan 1982).

12
A number of additional studies have modified the Bass model to consider more complex
marketing issues including supply restrictions (Dain, Mahajan and Muller 1991), distribution
and geographic diffusion (Mahajan and Peterson 1979; Jones and Ritz 1991), substitutes,
complements and successive product generations (Peterson and Mahajan 1978; Norton and
Bass 1987), brand-level diffusion (Parker and Gatignon 1994), cross cultural effects (Gatignon
et al. 1990, Takada and Jain 1991), software piracy (Givon et al. 1993), sampling (Jain,
Mahajan and Muller 1991), advertising (Horsky 1983, Simon and Sebastian 1987), pricing and
income effects (Robinson and Lakhani 1975; Bass 1980; Rao and Bass 1985; Kamakura and
Balasubramanian 1988; Horsky 1990; Jain and Rao 1990; and Parker 1992), price
expectations (Narasimhan 1989), and other marketing decision variables (e.g. Bass and
Krishnan 1992, Jain 1992, Kalish and Sen 1986). These studies generally are descriptive or
use diffusion models to test research hypotheses (see also Mahajan, Muller and Bass 1990).
While they provide valuable information on diffusion processes, many do not illustrate
forecasting applications as the additional variables considered may proue difficult to forecast
(prices, advertising, competitive actions, etc.). Parallel to these empirical descriptive studies
are normative studies which derive optimal marketing mix strategies (see Mahajan, Muller
and Bass 1990; Hanssens, Parsons, and Schultz 1992, Chapter 8; and Simon 1989, Chapter
6 for comprehensive reviews of dais literature). These studies typically use general
formulations to describe the diffusion process and do not, therefore, consider forecasting
issues. Finally, some authors have proposed models which relax the deterministic nature of
the parameters in aggregate diffusion models. Noting the poor fit of the original Bass model
to certain categories, some authors have suggested that the parameters reflect stochastic
processes (see for example, Lilien, Rao and Kalish 1981; and Eliashberg, Tapiero and Wind
1987). These approaches typically require a larger number of parameters without specifically
modelling the factors which generate the uncertainty observed. Noting the limited use of such
procedures in the literature, Bridges, Coughlan and Kalish (1991, p.265) conclude that "little
incremental analytical insight is currently available due to taking a stochastic approach to
modelling diffusion."
In addition to Bass-type diffusion models, any number of growth models can be used to
characterize cumulative distribution functions, and, therefore, s-shaped penetration curves; see

13
for example, Narayanan (1992) who uses the Burr distribution to characterize diffusion
processes, Sharif and Islam (1980) who use the Weibull distribution, Stapleton (1976) who
proposes the normal distribution, or Trajtenberg and Yitzhaki (1989) who suggests a Gini's
expected mean difference approach. Models, which have both diffusion and saturation ternis
analogous to Bass-type models are summarized below (for additional models see the reviews
in Mahajan, Muller and Bass 1990, Young 1993, and Young and Ord 1990):
n(t) = (b (N(t)/M(t)) (1n1g/N(t)) (6)
n(t) = (b (N(t)/M(t)) (M - N(t))2 (7)
n(t) = (b (N(t)/M(t)) (M(t) - N(t)h) (8)
n(t) = (b/t)(N(t)/M(t)) (M(t) - N(t)) (9)
Equation 6 is the Gompertz curve (see Hendry 1972, Dixon 1980, Young and Ord 1985) and
bas been applied to consumer durables and agricultural innovations; equation 7 is the Floyd
(1962) model and has been applied to industrial innovations; equation 8 is proposed by Nelder
(1962) and has been applied to agrictiltural innovations (h is constant; see also McGowan
1986, Von Bertalanffy 1957, and Richards 1959 for similar formulations); equation 9 is
proposed by the Stanford Research Institute (SRI; Teotia and Raju 1986) and has been applied
to innovations in the energy sector. A variety of other growth models have also been
proposed; see, for example, Bewley and Fiebig (1988), Blackman (1971), Bodger and Tay
(1987), Brockhoff (1967), Fisher and Pry (1971), Gore and Lavaraj (1987), Harvey (1984),
Kumar and Kumar (1992a, 1992b), Lancaster and Wright (1983), Lee and Ln! (1987),
Levenbach and Reuter (1976), Meade 1989, Pozanski (1983), Sharif and Kabir (1976), Sharif
and Ramanatha (1981), Skiadas (1986), Steyer (1993), Tingyan (1990). In contrast to Bass-
type models, these alternatives have seen little direct application in marketing and have not
undergone modifications and extensions to the saine extent as the original Bass model.
Furthermore, in many cases these models do not directly relate to diffusion theory and have
parameter values which do not Tend themselves to extemal interpretation (other than a market
saturation term, if this is given).
As the number of new models proposed has generally outpaced forecasting applications, there

14
has been mimerons calls for systematic comparisons among the available models (Mahajan,
Muller and Bass 1990, p. 21; Lilien, Kotler and Moorthy 1992, p. 480). A number of reasons
justify such comparisons. First, since many diffusion models have been developed for
normative and descriptive purposes, forecasting issues simply go unaddressed. Second,
studies will often examine one particular issue in isolation, without necessarily considering
or incorporating the incremental improvements identified or made in previous studies. The
resulting "parallel processing" in the literature has lead to proposed models being compared
to the original Bass (1969) model without direct comparison to flexible forms developed
since, especially models which allow for skewed diffusion patterns (e.g., the non-uniform
influence, NUI, parameter, d), or an underlying social system growth rate. Furthermore,
proposed models often use the original Bass model as a point of departure, leading to the
exclusion of parameters or phenomenon found generally relevant in characterizing diffusion
processes. More importantly, many diffusion models have not been illustrated by or for
practising econometricians or forecasters, leading to a less than ideal statistical treatment in
most studies:
- studies are descriptive and typically illustrate "fit"; improvements in forecasts over
alternative methods (which are not examined or identified) are unknown;
basic fit and diagnostic statistics are frequently unreported, especially indicating
collinearity and serial correlation; basic forecasting measures based on hold-out samples
are often omitted (mean absolute deviations, mean absolute percentage errors, root mean
square errors, Theil's, 1966, U statistic, etc.);
certain statistics are incorrectly reported; for example, typical nonlinear diffusion models
do not include a linear intercept terni which prevents the traditional use of the classic R-
squared statistics, yet these are reported as indications of fit;
fit statistics are often not comparable across studies; for the same category one can
calibrate the models against the penetration curve (N(t)) which is smoothed and will likely
improve fit, versus the adoption curve (n(t)) which typically has greater variation and
15
lower fit statistics;
models are typically not compared using rigorous statistical tests (e.g. likelihood ratio
tests, or non-nested nonlinear model tests); exceptions using diffusion data include
Balasubramanian and Jain (1993), Parker (1992, 1993a) and Parker and Gatignon (1994).
Despite these shortcomings, some progress has been made to assist researchers in selecting
from among the various models. In a meta-analytic and econometric study of long-run
diffusion patterns from a sample of both highly successful and relatively unsuccessful
durables product categories, Parker (1993a) reports that aggregate diffusion models essentially
require no more than four parameters to adequately characterize ("fit") long-nm diffusion
patterns observed in practice. While considering models with various levels of
parameterization (from one parameter to five parameters) using nested and non-nested
likelihood ratio tests, the study fends the following model to be statistically superior among
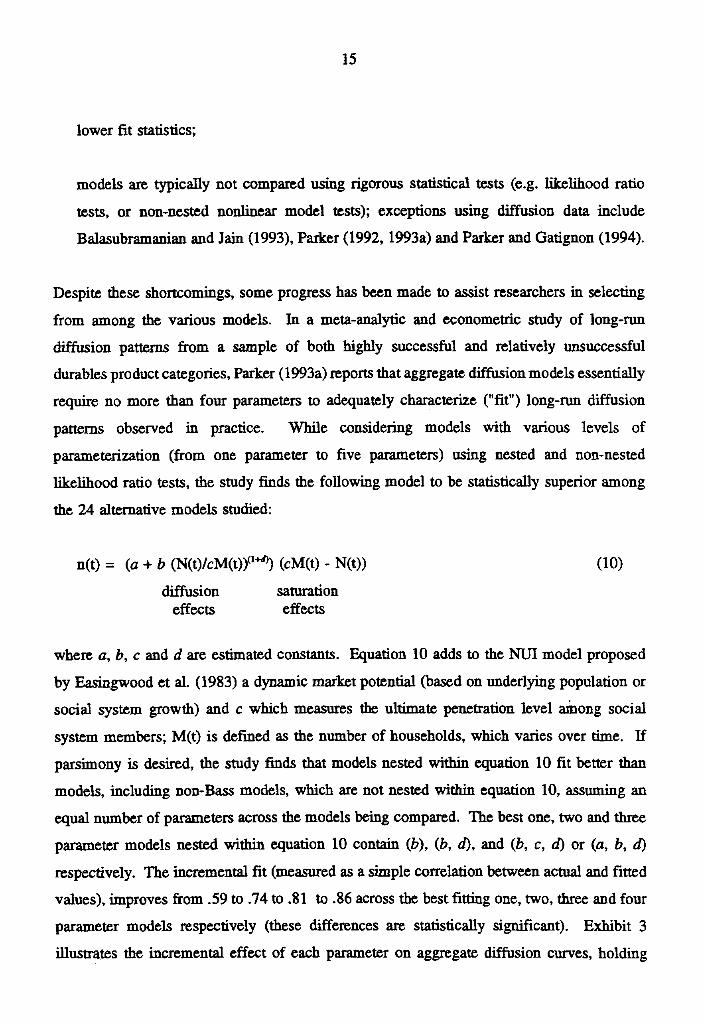
the 24 alternative models studied:
n(t) = (a + b (N(t)/cM(t)r")) (cM(t) - N(t)) (10)
diffusion saturation
effects effects
where a, b, c and d are estimated constants. Equation 10 adds to the NUI model proposed
by Easingwood et al. (1983) a dynamic market potential (based on underlying population or
social system growth) and c which measures the ultimate penetration level among social
system members; M(t) is defmed as the number of households, which varies over lime. If
parsimony is desired, the study finds that models nested within equation 10 fit better than
models, including non-Bass models, which are not nested within equation 10, assuming an
equal number of parameters across the models being compared. The best one, two and three
parameter models nested within equation 10 contain (b), (b, d), and (b, c, d) or (a, b, d)
respectively. The incremental fit (measured as a simple correlation between actual and fitted
values), improves from .59 to .74 to .81 to .86 across the best fitting one, two, three and four
parameter models respectively (these differences are statistically significant). Exhibit 3
Muscates the incremental effect of each parameter on aggregate diffusion curves, holding

16
others in the model constant As described earlier, the external influence coefficient, a, does
not effect the overail shape of the adoption curve, but does affect the intercept, and, therefore,
die years needed to reach the peak. The market potential parameter, c, does not affect the
years to peak, but die absolute magnitude of adoptions in any given year. The diffusion
parameter b affects both the timing and amplitude of the peak, and the NUI parameter reflects
the skew of the adoption curve, and, therefore, die peak's timing. The 19 product categories
shown in Exhibit 2 illustrate the model's ability to characterize a variety of diffusion patterns.
It is interesting to note that in none of the 19 cases was the original Bass model the best
fitting model, though, on average, it was equivalent to the best alternative three parameter
model. Since equation 10 is the integration of several incremental improvements to the
original Bass model and has only recently been empirically evaluated, there is no report of
its use in normative studies, though models nested within equation 11 have been considered
in descriptive studies of pricing and the diffusion process (Kamakura and Balasubramanian
1988; Parker 1992; Balasubramanian and Jain 1993).
Since the conclusion that equation 10 is statistically superior to alternatives is based on fit
statistics, it is not clear that it will provide adequate forecasts. Research conducted by Rao
(1985) evaluates die forecasting accuracy of six diffusion models and five naïve trend
extrapolation models using data from four consumer durables categories. Rao finds that
diffusion models generally outperform naïve models, and that among diffusion models, die
following model, which represents the Bass model adjusted for nonuniform interpersonal
influence (Easingwood et al., 1983), provides superior forecasts:
n(t) = (a + b (N(t)/M(t)r ) (M(t) - N(t)) (11)
diffusion saturationeffects effects
where a, b and d are estimated constants. In a second study comparing three diffusion
models on six categories, Lavaraj and Gore (1990) find that there is no best long-rai
forecasting model. The study was apparently conducted without consideration of the findings
of Rao (1985) and did not consider die model in equation 11. Lavaraj and Gore nevertheless
find that the best forecasting model is typically the model which best fits the data.

17
Finally, Young (1993) compares the forecasting accuracy of nine growth models, including
the original Bass (1969) model and a simplified model with non-uniform interpersonal
influence proposed in Easingwood et al. (1981). Applying the models to a variety of data sets
with varying lengths, Young (1993, p. 385) fends that the Bass model outperforms or equals
non-Bass growth models, especially when diffusion is under the 50% takeover point. The
simplified NUI model (excluding a and c) was found less accurate when few observations are
available for calibration, but was found best when the saturation level was externally imposed
(known) and data sets contained more than 15 observations. Both the Bass and NUI models
were found best in forecasting when the sertes had not reached 50 percent takeover level.
The frequency with which the Bass and NUI models, combined, were deemed best was
rivalled only by the logistic model proposed by Harvey (1984), which incorporates a time-
dependent component in the diffusion process. While this comparison is encouraging, it is
limited to short forecast horizons (1 year and 3 years), and internally estimated market
potentials which are assumed to remained fixed over the estimation and forecast periods
(often spanning multiple decades).
Combined, the existing comparative studies tend to indicate that the four-parameter
formulation in equation 10, a modified NUI model, best fits long-mn diffusion data. The
model requires that the target market be externally identified and be allowed to vary over time
(M(t)). One parameter reflects the initial penetration level (a), another die ultimate
penetration ceiling (c), and the two remaining are required to characterize the shape or speed
of the diffusion process (b and d). If parsimony is desired, the next best three parameter
model eliminates the NUI parameter (d = 0) or the original Bass model externat influence
coefficient (a = 1); see Parker (1993a). Models nested within equation 10, including the
original Bass model and the NUI model proposed by Easingwood et al. 1983), generally
provides superior (or equally good) forecasts compared to naïve or alternative diffusion model
approaches. This conclusion, however, is limited to too few studies to be categorical. A
more broad evaluation of the models proposed, using a far larger number of products in
multiple categories and countries, is clearly needed to improve our general understanding.

18
3.2 Micro-level Diffusion Models
The models reviewed above treat a category at the aggregate level. In many marketing
applications, especially for industrial markets, it is important to anticipate adoption timing at
the individual level. Alternative approaches have been recently proposed which disaggregate
the diffusion process to individual members of the social system (for more thorough reviews,
see Mahajan, Muller and Bass 1990, and Sinha and Chandrashekaran 1992). While an
aggregate diffusion model can forecast die aggregate number of first purchases in a given year
(or lime period), micro-level models can potentially forecast die adoption timing of each
individual member of the social system, provided that sufficient data are available at that
level. The aggregation of individual level adoption processes generates an aggregate diffusion
curve. Since the unit of analysis is at the individual-level, varions causal factors can be
assumed to affect individual adoption timing. Factors previously considered include the
distribution of knowledge, uncertainty, risk aversion, price/performance trade-offs, and
consumer perceptions of product performance (Hiebert 1974; Stoneman 1981; Reinganum
1981; 1983; Feder and O'Mara 1982; Jensen 1982; McCardle 1985; Oren and Schwartz 1988;
Lattin and Roberts 1989; Schmidt and Witte 1989; Chatterjee and Eliashberg 1990; Sinha and
Chandrashekaran 1992). While pre-launch survey approaches have been suggested to estimate
individual adoption which can be extrapolated to the aggregate level (Chatterjee and
Eliashberg 1990), extensive empirical applications of these approaches have yet to be reported
in die literature. This may result from die requirement to collect relevant data on consumer
heterogeneity and individual-level adoption. Sinha and Chandrashekaran (1992) report thb
successful application of a split-hazArd function approach to banks adopting automatic teller
machines; a variety of variables are used to capture adopter heterogeneity: size, location,
ownership by a holding company, local wage rates, and bank income. Future work in this
area promises to be extremely useful in describing adoption processes and testing a variety
of hypotheses concerning individual, or segment behavior (Weerahandi and Dalal 1992). In
particular, the application of such approaches to international diffusion processes where the
units of observation are countries would be a useful extension of this literature (i.e. at what
moment will a particular country adopt a new technology or standard?). For now, insufficient
experience is available to make generalizations on die usefulness of these approaches.

19
3.3 Repeat Purchase Extensions
Diffusion theory suggests that consumers undergo various stages when accepting and adopting
an innovation. Rogers (1983, p. 164) suggests five separate stages: knowledge, persuasion,
decision, implementation and confirmation. For die most part, diffusion models have typically
characterized the first four stages, with implementation representing first purchases. A
number of studies have considered the fifth stage which captures multiple purchases of the
innovation after the initial adoption. In many cases the success of an innovation is net based
on the initial adoption (or trial) level, but on the repeat purchases that follow. The models
presented above are purely adoption (first purchase) oriented. Repeat purchase diffusion
models generally have the following form:
s(t) = n(t) + r(t) (12)
where s(t) are total sales, n(t) are first purchases, and r(t) and repeat purchases in time period
t. Most models of repeat-purchase diffusion processes disaggregate the adopter population
into distinct sub-segments, or transition states. Transition equations model the flow between
states along a structured hierarchy (e.g., non-awareness, awareness, trial, repeat, re-repeat,
etc.). Each state undergoes some form of diffusion, the speed of which may be affected by
marketing mix variables (see, for example, Lilien, Rao and Kalish 1981; Mahajan, Wind and
Sharma 1983; and Rao and Yamada 1988). Typically these models are created for a
particular product category (pharmaceuticals and consumer durables), given that hierarchies
and data availability vary from one category to another. In the case of consumer durable
products, r(t) is often specified as being a function of product breakdown, scrapping rates
generated by a probability distribution, replacement cycles, or multiple unit ownership of the
innovation studied (see, for example, Lawrence and Lawton 1981; Olson and Choi 1985;
Kamakura and Balasubramanian 1987; Norton and Bass 1987; Bayus 1987; Bayus 1988;
Bayus, Hong and Labe 1989; Parker 1991). As these models all depend on the initial
adoption process, the issues of forecasting directly depend on the ability of the first purchase
model to forecast adoption penetration. Repeat sales forecasts are generated based on early
repeat sales estimates. For the remainder of this review, we will focus our attention,

20
therefore, on the applied use of the aggregate first purchase models reviewed above.
4. Estimating Diffusion Models
Beyond model selection, estimating modes prior to, or during the early years following a
product' s launch becomes important. The methods proposed largely depend on the data
available and the formulation hypothesized. In the following section we will discuss, in
chronological order, the racks facing forecasters: pre-launch, then post-launch estimation.
4.1 Pre-Launch Forecasting
Since major investments and marketing devisions are typically made during the earliest phases
of product launch, the value of forecasts may decline as the number of observations become
available . One might argue that this problem will likely increase in the future as product life
cycles become shorter, though recent evidence indicates that such is not the case (Bayus
1992). In any event, it is clear that for diffusion models to have wide applicability and use,
pre-launch parameter estimation methods must be explored. For this reason a number of
authors have considered estimation procedures that can be used in the absence of data. One
of the first questions a researcher must ask, however, is whether diffusion models are
applicable to the category in question. Given their theoretical origins, one can strongly argue
that the models presented can apply to ail products (consumer durables, high technologies,
or consumer packaged goods) provided that the object of die forecast is limited to the
adoption or trial process of sales (otherwise, repeat purchase extensions, reviewed above are
necessary).
Once a model (e.g. equation 10) is selected, a number of methodologies have been suggested
w obtain pre-launch estimates of diffusion model parameters. Broadly summarized, many
authors suggest using historical analogies and managerial judgements to calibrate model
parameters (Geurts and Reinmuth 1980; Lawrence and Geurts 1984; Lawrence 1980). If
enough analogies are available, one can obtain estimates of parameters for the analogies and
regress these estimates against varions factors likely to affect the diffusion process. Product

21
forecasts are generated by characterizing new innovations for each of the factors identified
(see for example, Srivastava et al. 1985; Gatignon et al., 1989; and Montgomery and
Srinivasan 1989). In the absence of multiple analogies, one might simply use parameter
estimates from a similar product as priors (Lilien, Rao and Kalish 1981). Again, if the goal
of the forecast is the long-run adoption cycle, three aspects must be considered: the market
potential and the long run penetration ceiling (asymptote) of the penetration curve, represented
by coefficient c in equation 10; (2) the initial or first year penetration level which acts as the
intercept of the penetration curve, represented by the coefficient of innovation or external
influence, a; and (3) the speed of adoption between these two levels, represented by the
coefficients b and d in equation 10.
Pre-launch estimates of the penetration ceiling, c, first requires a careful defmition of die
target market and a forecast of how this target will evolve over lime. For many categories
this care be a trivial exercise (e.g. for electronic consumer durables M(t) can be households
wired with electricity which has a stable growth pattern). For others, such as cellular
telephones, this becomes complicated as the market to be forecasted spans multiple markets,
or segments. In such cases, either data need to be forecasted (and ultimately collected) by
market or segment, or these need to be aggregated in a judicious manner. Once the target
market is defined, and forecasted, we must then estimate the long run percent that will
eventually adopt, c (multiplied against M(t)). Most authors suggest estimating the long run
market potential based on expert judgement which can involve managers "questimating" the
percent share a product will have vis-a-vis existing alternatives (e.g. using decision calculus
or delphi approaches). These judgements can be coupled with industry surveys incorporating
varions economic factors, extensive analyses of long run competitive substitutes, or a
combination of methods (see, for example, Tigert and Farivar 1981; Clarke and Soutar 1982;
Twiss 1984; Hauser and Urban 1986; Teotia and Raju 1986; and Thomas 1987). Otherwise,
if products are successive generations to earlier innovations, or are contingent to existing
innovations, market potentiels can be estimated from these existing products (see Bayus 1987;
Norton and Bass 1987). Rogers (1983) suggests that the long-run acceptante of an innovation
should be linked to the product's perceived attributes: relative advantage, perceived risk,
observability, trialability, complexity, and communicability. Given the large number of

22
factors which would tend to affect these perceptions and, therefore, the long run penetration
level of most products, Horsky (1990) notes that the market potential "varies considerably
across product categories and generalizations about its overall value are unlikely." A lack of
such a general understanding has led most authors to suggest informed judgement of
managers coupled with available industry data or information on the long run diffusion
patterns for similar products to estimate the market potential. Again, for some categories, this
may be a trivial exercise (e.g. it would be safe to assume that less than 50 percent of adults
will adopt products which are gender specific, or that attachments will be limited to the long-
mn penetration of the existing innovation). For others, this estimate can become pure
speculation (e.g. long run cellular telephone penetration). Clearly, there is a strong need for
researchers to rigorously explore why some products seem to reach high long-mn (e.g. 30-
year) penetration levels (e.g. above 90 percent), versus moderate or very low levels (below
5 percent). Such investigation is best performed on large data sets covering multiple
categories and multiple countries to insure that generalizations are not context specific.
To estimate Me initial penetration level, similar procedures to the ones suggested for the long-
mn market potential are typically recommended: industry studies/surveys or informed
managerial judgement based on initial penetration levels of similar products. Using the
discrete formulation of the Bass model, the coefficient of external influence, a, is equal to the
first year penetration levels (n(1) = aM, or n(1)/M = a, for N(1)). Purchase intention
questionnaires have been found effective in estimating pre-launch penetration levels for the
first year of introduction (see Juster 1966; Morrison 1979; Thomas 1985b; Infosino 186;
and Morwitz and Schmittlein 1992). Alternative methods include relying on test markets
which are extrapolated to the population, or first-year penetration levels in foreign markets
where the innovation has already undergone the initial diffusion process (Gatignon, et al.
1989; Sultan, Farley and Lehmann 1990) Finally, lacking other information, one can simply
extrapolate from previous diffusion studies. In a meta-analysis of 15 diffusion studies, or 161
applications of die Bass model, Sultan, Farley and Lehmann (1990) report an average value
of .03 for the coefficient of innovation, a; Parker (1993a) finds, in an econometric study of
19 consumer electronics categories, that a averages .01; in no case was a estimated to be
greater than 10 Caution should be used in relying on these estimates since they typically

23
do not control for the bias introduced by the significant lag in the reporting of penetration
data after the products have been launched; the actual first year penetration levels are likely
to be lower than those indicated in previously published empirical studies (Parker 1992,
1993a).
Assuming an initial estimate of the first year and long mn penetration levels, die speed of die
diffusion process between these two levels and hence die timing of the adoption curve peak
must be estimated. Based on die original Bass formulation (e.g. excluding die NUI
parameter), a number of estimation procedures have been proposed. Lawrence and Lawton
(1981) first suggested that managers make informed guesses of the sum of internai and
external influence coefficients (e.g., a + b, in equation 4). While it is not clear that managers
(or even academics) can make reasonable guesses, the authors find that this value typically
varies between .3 and .7 and suggest that managers rely on estimates from similar products.
They recommend, for example, .66 for industrial innovations and .5 for consumer products.
Based on dis sum, they show how die aggregate diffusion curve can be estimated
algebraically given external estimates of die penetration ceiling and Me first year penetration
level. A similar algebraic approach is suggested by Mahajan and Sharma (1986) who derive
the diffusion curve based on informed guesses or delphi estimates of die penetration ceiling,
die timing of the adoption curve peak, and die amplitude of that peak. A more structured
approach is proposed by Thomas (1985a) based on Me systematic comparison of similar
products to the innovation being forecasted. Thomas suggests estimating die Bass model
parameters using a weighted average of parameters from similar products with diffusion
history. Weights reflect die similarity of the new product to analogical products based on 25
criteria across 6 issue areas: including environmental situation, market structure, buyer
behavior, marketing strategy,_ and characteristics of die innovation. Yamada and Leung
(1992), using multidimensional scaling of consumer perceptions, weight products based on
die reciprocals of die interpoint distances between die innovation and historical products; see
also Rao and Yamada 1988. While such approaches have been documented to be used in
practice (Mahajan, Muller and Bass 1990), a number of reservations have been raised. First,
die algebraic approaches are tantamount to asking managers to simply draw the diffusion
curve since managers are asked to guess die key outputs that die models are designed to

24
forecast, especially the first purchase peak (Bass 1986). Since delphi or similar techniques
can extract managerial guesses for various points along the diffusion curve, it is not clear how
much die diffusion models themselves add value to the forecasting process. At a minimum,
however, diffusion models have the advantage over naïve alternatives in structuring the
problem in a systematic manner. The second concem is that defining "analogical products"
may prove difficult or arbitrary, especially for discontinuous innovations. For example,
Thomas fends only 3 comparable products for the innovation forecasted as an illustration. The
low number of comparable products makes determining the statistical significance of causal
assumptions difficult (e.g. determining if certain criteria have resulted in variations in
coefficient values). The third major concern is that the models estimated using these
procedures have focused on the original Bass specification, proposed in 1969, which has since
been shown to not be the best model in characterizing diffusion processes, especially those
with asymmetric diffusion patterns, or including the NUI parameter (Easingwood, et al 1983,
Rao 1985, and Parker 1993a).
To overcome this last limitation, Easingwood (1987, 1989) proposes an alternative
methodology which incorporates the non-uniform influence parameter, d. The procedure
involves estimating the two contagion parameters, b and d, and clustering curves into classes
based on the resulting diffusion curve shapes. In an illustration of the technique, Easingwood
and Lunn (1992) derive seven classes of adoption curves, such as rapid take-off and
saturation, called "rapid penetration", versus very slow take-off with a high spiked peak,
called "late rush". Various criteria, including the launch environment, the target market,
company barriers, the innovations' characteristics, and perceived risk are then used to
understand the factors influencing why products have particular patterns, and, therefore, values
of b and d. Based on observed patterns, the new innovation is forecasted based on its
characteristics, the market environment, and other relevant criteria. The authors argue that
tbis approach has advantages over the previous approaches since combinations of b and d
provide an infinite number of diffusion patterns which are observed in reality. Recently,
Balasubramanian and Ghosh (1992) have questioned the reliability of this approach as
misclassification (or multiple classification) is likely due to the sensitivity of parameter
estimates of b and d to the numbers of observations used from the historical sertes. They
25
suggest relying on a joint confidence region for b and d, rather than point estimates, to
classify products. Jones (1992) notes that the procedure is also weakened by the variations
in estimates of b and d, given minor changes in the number of observations used, and,
consequently, the inability to correctly/reliably classify products. Jones (1992, p. 353, p. 354)
fends that die "parameter estimates are so clouded with variation that Easingwood's
classification scheme is rendered inapplicable", and that die "successful implementation of
Easingwood's scheme will have to await a better method for estimating parameters of the
NUI model."
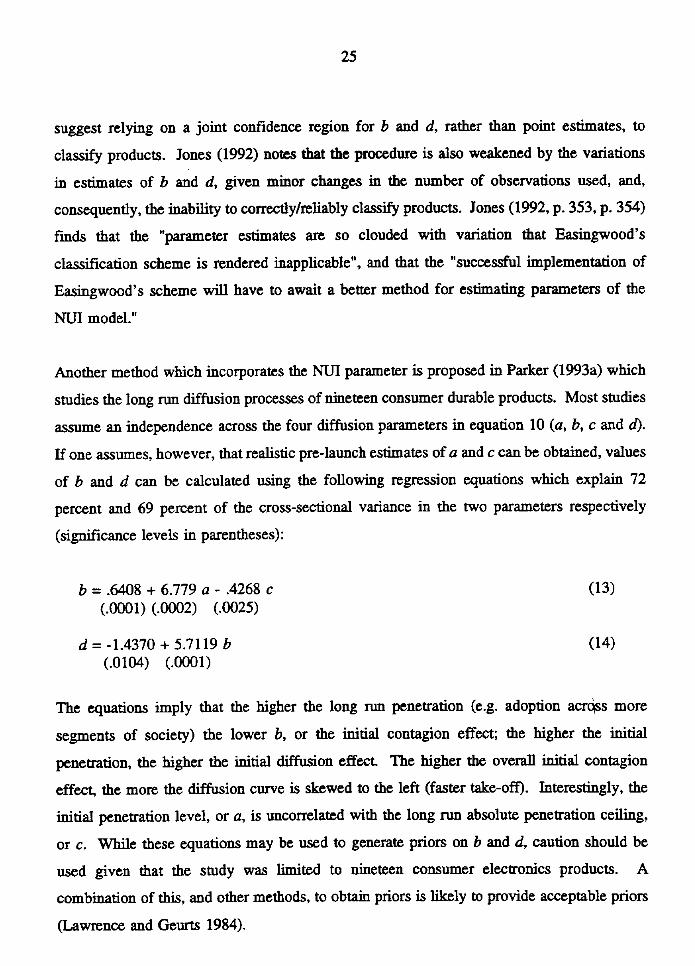
Another method which incorporates the NUI parameter is proposed in Parker (1993a) which
studies the long run diffusion processes of nineteen consumer durable products. Most studies
assume an independence across the four diffusion parameters in equation 10 (a, b, c and d).
If one assumes, however, that realistic pre-launch estimates of a and c can be obtained, values
of b and d can be calculated using the following regression equations which explain 72
percent and 69 percent of the cross-sectional variance in the two parameters respectively
(significance levels in parentheses):
b = .6408 + 6.779 a - .4268 c (13)(.0001) (.0002) (.0025)
d = -1.4370 + 5.7119 b (14)(.0104) (.0001)
The equations imply that the higher die long mn penetration (e.g. adoption acrées more
segments of society) the lower b, or the initial contagion effect; the higher the initial
penetration, the higher the initial diffusion effect. The higher the overall initial contagion
effect, the more the diffusion curve is skewed to the left (faster take-off). Interestingly, the
initial penetration level, or a, is uncorrelated with the long mn absolute penetration ceiling,
or c. While these equations may be used to generate priors on b and d, caution should be
used given that the study was limited to nineteen consumer electronics products. A
combination of this, and other methods, to obtain priors is likely to provide acceptable priors
(Lawrence and Geurts 1984).

26
In conclusion, pre-launch estimates of two of the basic diffusion model parameters appear
plausible due to their direct interpretability: the initial penetration level, a, and the ultimate
adoption ceiling, c. Pre-launch estimates of the remaining parameters (b and d) which
regulate diffusion speed are less evident given our lack of basic understanding of what die
parameters directly reflect. With our current understanding, it is very difficult to explain or
attribute the difference between an estimate of b=.25 versus b=.35 in a general sense, even
though these two estimates generate radically different diffusion patterns. No study has
shown, for example, that categories with high levels of b also historically exhibited high
levels of certain types of "word-of-mouth" or other interpersonal communications activities
suggested in theory. Even if such relationships were established, it is nevertheless difficult
to forecast the likely level of such communication for a new product prior to launch.
Promising research avenues will likely involve extensive empirical analyses which
systematically determine causal factors (covariates) which can be easily or objectively
forecasted prior to launch, and which are reasonable predictors of die relevant diffusion
parameters. Such approaches have been used to facilitate diffusion forecasting in a decision
support system (called PENETRATOR) which first asks managers to review a number of
historical diffusion patterns and answer numerous questions concerning the product concept
(Parker 1993b). Based on cross-sectional econometric models applied to over a hundred
categories, managers are then provided estimates of long rua price and ultimate penetration
levels. Based on these, or managerially motivated estimates, and certain assumptions on
product breakdown and replacement, diffusion forecasts are generated. Lacking this or similar
procedures, highly customized product/industry specific pre-launch modelling approaches rnay
be required. These would rely on extensive industry survey data and managerial judgements;
see, for example, Urban, Hauser and Roberts (1990) who describe such a procedure that
provides pre-launch forecasts of new automobile sales.
4.2 Post-Launch Forecasting when Few Data are Available
In their review, Mahajan, Muller and Bass (1990) find that "parameter estimation for diffusion
models is primarily of historical interest; by die time sufficient observations have been
developed for tenable estimation, it is too lace to use die estimates for forecasting purposes."

27
Waiting for enough observations to fit the correct model may render the forecasting exercise
a moot issue. This conclusion may be too harsh a generality given that many categories
historically have reached their first purchase adoption peaks several decades after product
launch due to population growth and slow penetration rates: 20 years for blenders, 22 years
for cloches dryers, 23 years for dishwashers, 25 years for disposers, 26 years for freezers, and
20 years for ironers, for example, as shown in Exhibit 2. The total sales peak often occurs,
if ever, decades after die first purchase peak due to population growth, and replacement sales.
Furthermore, many industry forecasters have demonstrated the importance of post-launch or
mature-market diffusion forecasts as market growth uncertainty may remain high even after
several post-launch years (see, for example, de long, 1980). On the other hand, for many
categories the first purchase peak is skewed far to the left (e.g. calculators, black and white
television). Heeler and Hustad (1980) and Srinivasan and Mason (1986) suggest that the
Bass model is best estimated with a minimum of 10 years' input data for forecasting and
market potential estimation. This conclusion should be qualified since (1) these studies were
not performed on die more flexible diffusion models (e.g. equation 10), (2) the market
potential penetration ceilings were not extemally estimated, and (3) parameters were not
constrained to plausible ranges (e.g. the first year penetration level equalling the coefficient
of extemal influence). While such constraints may allow for improved estimates with fewer
observations, the literature provides insufficient evidence on this subject.
The managerial task during the early years (or months) after launch is to derive as much
information from the historical data as possible to update pre-launch parameter estimates.
Irrespective of die method used to obtain pre-launch estimates of the diffusion parameters,
these priors should be systematically updated as data become available. This is especially
critical given that die various diffusion models proposed generate very different forecasts
based on relatively minor changes in the parameters estimates; such is die case for most
differential equations exhibiting chaotic behavior (see Exhibit 3 and Modis and Debecker
1992). Once data become available (e.g. die first year penetration level), pre-launch estimates
of diffusion parameters can be updated using a number of adoptive Bayesian, feedback filter,
or parameter updating procedures (see, for example, Bretschneider and Bozeman 1986;

28
Bretschneider and Mahajan 1980; Lenk and Rao 1989; Sultan, Farley and Lehmann 1990;
Vanhonacker 1990; Vanhonacker, Lehmann and Sultan 1990; Vanhonacker and Price 1992;
and Wiorkowski 1988). As more observations are used, estimates quickly converge, despite
the priors being relatively inaccurate (Lenk and Rao, 1989, pp. 50-51). The following steps
illustrates such approaches: (1) obtain "best guess" pre-launch parameter estimates as
described above, (2) when the first year penetration level become known, substitute this for
a, the coefficient of extemal influence; based on this new a, update b and d using equation
13, or similar relationships based on analogies; keep the long-run penetration ceiling, c, fixed,
(3) when the second, third and future year penetration levels become known, fix a and c to
previous levels (or update c if new information on product usage becomes available) and
update b and d using the adaptive Bayesian and feedback procedures discussed above. The
ceiling parameter, c, should never be estimated using die early penetration data unless these
strongly reveal (with extemal information) fundamentally different market structures.
Likewise, once die first year penetration level is known, a should be fixed to this level in all
subsequent models as this is die most efficient (accurate) use of this information across all
of die parameters. In practice, when a is freely estimated on categories with many decades
of data it is often statistically insignificant or has a negative sign (further indicating that the
parameter be externally constrained to realistic values; e.g. the first year penetration level).
This is especially important since the early years of product diffusion often exhibit chaotic
patterns (Modis and Debecker 1992). The usefulness of these earliest data points is very
questionable, therefore, to estimate parameters which are responsible for long-run trends.
As more data become available attention should turn to die type of data collected and applied
in die updating process. Some confusion over data requirements may be generated by the
titles of many studies positioning diffusion models as being simultaneously designed for both
"long-run" forecasting (as opposed to time sertes approaches), and new product "sales"
forecasting. For example, the Bass model was proposed as a long-run sales forecasting tool
applicable to consumer durable products, as households are likely to adopt only one unit each
(adoption data equal sales data). As illustrated for color television by Bayus, Hong and Labe
(1989), "sales" can be a far thing from "adoptions". Institutional sales, replacement sales, and
multiple unit adoptions by each household can make a substantial difference in sales for many

29
categories, including consumer durables. This distinction is especially important in the "long
run"; for minor innovations or durable products with short life cycles, forecasting need not
consider long-run diffusion dynamics. If one is willing to make the assumption that in early
years sales equals first adoptions, and forecast the sales peak using an adoption model, the
first peak predicted may be one of several to occur in the series, or be dramatically different
from the actual sales peak. In a study of repeat purchases of consumer durables, for example,
Parker (1991) fends that the Bass formulation unadjusted for replacement sales can be
misspecified to track sales for as few as 10 observations, and is dramatically misspecified at
15 observations for most categories. Furthermore, the timing of the "adoption" peak can be
many years, even decades, from the actual "sales" peak (Parker 1992). The risk forecasters
nin in using these models to predict die sales peak may be generated by the mismatch of the
model to die sales process.
4.2 Estimation Procedures When Many Data are Available
Provided that die correct model is specified and adequate data are available, a variety of
estimation procedures have been proposed in die marketing literature to improve Me fit and
forecasting ability of die various aggregate diffusion models (Mahajan, Mason, and Srinivasan
1986). These methodologies include ordinary least squares, maximum likelihood estimation,
nonlinear least squares, stochastic estimation, Bayesian estimation and other adaptive/feedback
estimation procedures? The choice of estimation procedure will largely be driven by the
number of observations available, and the functional forms assumed. We briefly Mview these
options by first considering die original Bass (1969) model in equation 4 with a linear error
term (e,- N(0,&)). When first proposed, Bass (1969) noted that equation 3 can be expanded
to make first adoptions a quadratic function of cumulative previous adoptions:
n(t) = aM + (b-a)N(t) - (b/M)N(t)2 (15)
3 Any number of estimation procedures can be considered,including computer intensive techniques (see, for example, Youngand Ord 1985 who consider discounted least squares). Only thoseexplicitly evaluated on diffusion models in the marketingliterature are reported.
30
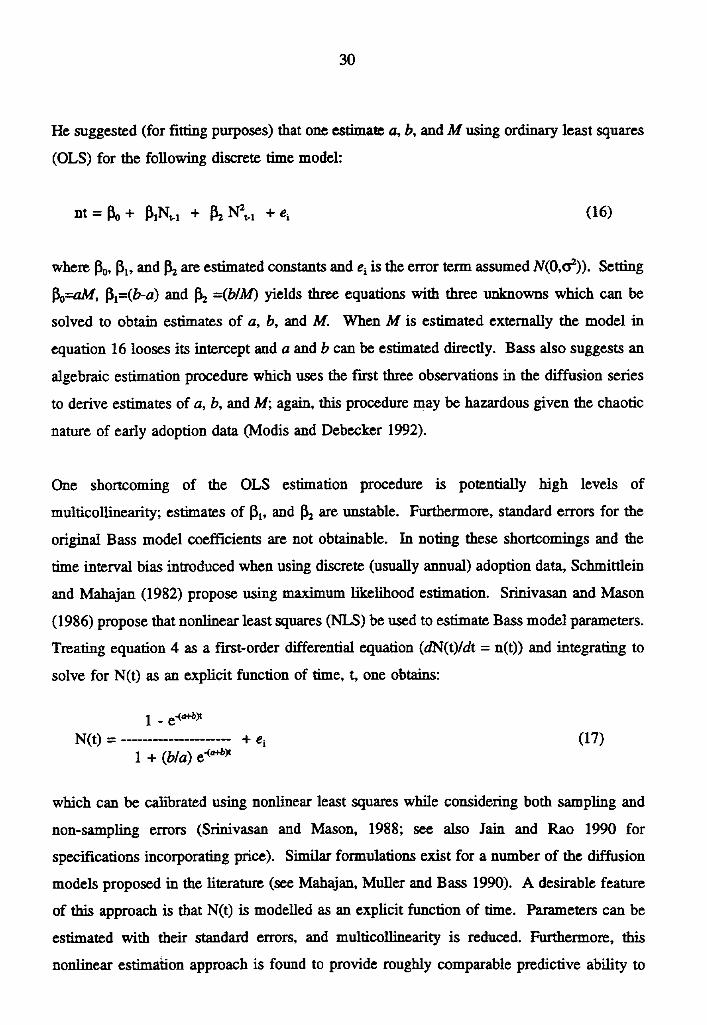
lie suggested (for fitting purposes) that one estimate a, b, and M using ordinary least squares
(OLS) for the following discrete time model:
nt = go + + 132 N2,, (16)
where 110, (31 , and 132 are estimated constants and ei is the error terni assumed N(0,02)). Setting
130=aM, f3,=(b-a) and (12 =(b/M) yields three equations with three unknowns which can be
solved to obtain estimates of a, b, and M. When M is estimated externally the model in
equation 16 looses its intercept and a and b can be estimated directly. Bass also suggests an
algebraic estimation procedure which uses the first three observations in the diffusion sertes
to derive estimates of a, b, and M; again, this procedure may be hazardous given the chaotic
nature of early adoption data (Modis and Debecker 1992).
One shortcoming of the OLS estimation procedure is potentially high levels of
multicollinearity; estimates of P I, and 132 are unstable. Furthermore, standard errors for the
original Bass model coefficients are not obtainable. In noting these shortcomings and the
tune interval bias introduced when using discrete (usually annual) adoption data, Schmittlein
and Mahajan (1982) propose using maximum likelihood estimation. Srinivasan and Mason
(1986) propose that nonlinear least squares (NLS) be used to estimate Bass model parameters.
Treating equation 4 as a first-order differential equation (dN(t)/dt = n(t)) and integrating to
solve for N(t) as an explicit function of tune, t, one oboins.
1 -N(t) =
+ ei (17)1 + (bla) e4°'4`
which can be calibrated using nonlinear least squares while considering both sampling and
non-sampling errors (Srinivasan and Mason, 1988; see also Jain and Rao 1990 for
specifications incorporating price). Similar formulations exist for a number of the diffusion
models proposed in the literature (see Mahajan, Muller and Bass 1990). A desirable feature
of this approach is that N(t) is modelled as an explicit function of time. Parameters can be
estimated with their standard errors, and multicollinearity is reduced. Furthermore, this
nonlinear estimation approach is found to provide roughly comparable predictive ability to

31
maximum likelihood estimation. NLS approaches should be applied, therefore, on closed
form solutions of aggregate models expressing N(t) as an explicit function of time, if such
forms exist, when launch time can be adequately estimated from historical records. In the
absence of closed form solutions, NLS can be directly applied to diffusion models. There are,
however, two practical limitations to this technique. First, for models which do not have
closed form solutions to dN(t)/dt, parameter estimates are not obtainable. This limitation
exists for all models including the non-uniform influence (NUI) parameter (d); a parameter
which appears important in characterizing long-run diffusion processes. In such cases,
nonlinear least squares can be directly applied to the aggregate diffusion model which is not
formulated explicitly as a function of time (e.g. equation 10); parameter standard errors are
obtainable in such cases, but N(t) is not modelled as an explicit function of time. The second
limitation of using the closed form solution to N(t) is that the origin for time, t, may not be
apparent for the innovation studied. In theory, t should begin when the product is "launched".
In many cases, this may be an arbitrary date, and will necessarily affect forecasts of the peak
timing. For example, color televisions were first sold in the United States in 1955, yet most
diffusion modellers consider 1960, 1961, or 1962 as being the launch year (e.g. after
standardization existed). Typically diffusion modellers choose the launch date as equalling
die year of data availability. This approach can systematically overstate die launch date by
several years, or even decades (Parker 1992, p. 361), as trade associations or the trade press
which report diffusion data do so only after a product category is perceived to be long-lasting.
Additional limitations of the NLS procedure include non-converging estimates, and local
minima; these can typically be handled using wide area initialization of parameters. In their
review, Mahajan, Muller and Bass (1990, p.9) conclude that various estimation methods
"often yield estimates that do not differ greatly" especially when a large number of historical
data are available. While nonlinear least squares appears to offer die best general approach
to aggregate diffusion model estimation, Dalal and Weerahandi (1993) propose a maximum
likelihood estimation procedure with beta binomial approximation and find their approach
superior to NLS and weighted NLS, especially in terms of forecasting the long-run market
potential. Their study is limited, however, to a single category, which is applied to die
original Bass formulation.

32
More important than the estimation procedure used are the constraints one places on the
parameter values based on extemal theoretical considerations. Even when a large number of
observations are available, researchers should not hesitate imposing constraints on parameters
as strong theories generate substantial, though non-statistical, degrees of freedom. In
particular, the modeller may fmd it useful to impose the first year penetration level, if this
is available, as an estimate of die extemal influence coefficient, a; the penetration ceiling, c,
should also be constrained to extemal estimates or at a minimum be bounded to be no greater
than I 0. There are clear advantages in estimating c as a parameter (as opposed to estimating
a fixed M, the market potential in absolute units). First, c has more direct interpretation as
a unit of measure (a percentage) and is bounded to a known range. When M is estimated
internally and directly, as in equations 4 or 15, it can typically indicate large absolute
numbers (e.g. in units reaching the thousands or millions) which are difficult to verify based
on managerial perception; a percent of a target market (or share gained from existing
substitutes) can be more easily gauged for face validity (e.g. percentages greater than 1 0
indicate specification, data collection, or market definition errors, whereas a large estimate
of M may not signal these problems). Second, since forecasts are long-run in nature, M must
be dynamic (or allowed to be so), so externally measuring M(t) as a variable is required.
Using M(t) as a variable forces the modeller to understand and objectively identify the market
(social system) within which the innovation is undergoing a diffusion process, and adapt data
collection and modelling procedures accordingly. In this sense, modellers who do not impose
such constraints and allow the model to "do all of the taiking", may not have thought enough
about how the diffusion process and the model should be matched. Finally, the NUI
parameter, d, can be constrained to be greater than -1.0, while the coefficient of internai
influence, b, can be constrained to be positive (if the NUI parameter d is excluded, then b
should vary between 0 and 1.0; if NUI is included, b can actually take on values greater than
1.0 since it acts as a multiplicative intercept to a term which is less than one, b(N(t)/M(t)i)).
While the usual statistical caveats apply when using constrained estimation, without such
constraints, diffusion models frequently generate implausible estimates, poor long-run
forecasts, or incorrectly indicate premature market saturation due to short terni business cycle
effects, among others. Since estimates mostly reported in die literature are unconstrained,
further empirical, work on the effects or potential benefits of such constraints is warranted.

33
5. Future Research Directions
Simon's (1992) conclusion that diffusion models are risky and misleading as forecasting tools
illustrates the current state of affairs for many new product modellers. This review has
illustrated that the use of these models as a generic tool may be asking too much. Like many
management science techniques, diffusion forecasting requires a thorough understanding of
both the diffusion process and the market situation before model specification and estimation
is undertaken. In their general review, Mahajan, Muller and Bass (1990, p. 21) Gall for
greater empirical work to help "identify conditions under which diffusion models work or do
not work" in forecasting situations. Despite the managerial relevance and substantial
academic interest in this area over the past 30 years, die proliferation of models and
methodologies leaves forecasters with few "rules-of-thumb" or empirical generalizations to
work with, which may lead to frustration in applying these models in practice. While there
has recently been responses to this Gall in terms of understanding appropriate parsimonious
specifications (Rao 1985, Parker 1993a), we are only beginning to understand how these
models should be optimally implemented, especially prior to product launch. To conclude
this paper, three future research directions are elaborated upon that should provide more basic
or risk-reducing insight on these models: (1) more rigorous and systematic evaluations of
diffusion models as applied forecasting tools, (2) research on die basic validity of the
diffusion parameters themselves and studies on the factors determining their levels, and (3)
extensions of this research to the study of forecasting international or geographic diffusion
processes.
With respect to die first research area, diffusion studies in marketing typically de-emphasize
forecasting issues; most diffusion studies fail to systematically compare proposed diffusion
models to reasonable or more simplistic alternatives. Mahajan, Sharma and Bettis (1988), for
example, have found that alternative time-series approaches can also generate s-shaped curves
and may be more applicable than diffusion models. The exclusion of non-diffusion
approaches in empirical diffusion studies opens a number of important applied and academic
research issues:

34
- other than the issue of forecasting the first purchase peak, there is a general lack of
knowledge on the comparative advantage of diffusion models over time series approaches,
and whether a combination of approaches is desirable; a general analysis evaluating the
impact of data availability, the forecast horizon, and the number of parameters included
in diffusion models is warranted;
- with the exception of the original Bass (1969) model, there is no general understanding
of the number of data required to obtain stable parameter estimates, especially for the NUI
parameter, and whether this number typically occurs prior to of alter the peak in adoption
(or sales, in the casse of repeat purchase models); recursive coefficient estimation
procedures should prove useful in this regard;
- it is generally accepted that diffusion parameters show non-stationarities as more
observations are used in estimation. Little is generalizable concerning the extent of this
phenomenon, and whether there are systematic patterns of instability (e.g. as revealed in
recursive regression) which can be accounted for when forecasts are developed using few
historical data; time varying parameter approaches have been suggested to capture such
changes when sufficient data are available (Mahajan, Bretschneider and Bradford 1980).
Furthermore, most diffusion modellers de-emphasize difficulties in adequately measuring the
impact of various foreseen events on the diffusion process. These might include the lifting
of supply restrictions (Simon and Sebastian 1987, or Jain, Mahajan and Muller 1991), or
competitive entry (Parker and Gatignon 1992, 1994). Such studies will assist managers in
distinguishing between an early dip in first purchases due to a business cycle, versus market
saturation. As the number of forces are potentially infinite, decision calculus, or delhi
procedures appear to be the best alternatives available, especially in pre-launch forecasting.
The literature tends to suggest that a four parameter model (or thre-e if parsimony is desired)
can guarantee an adequate fit/forecast to diffusion data in practice (as is the case for widely
accepted s-shaped sales response models used in marketing decision calculus applications; see
CALLPLAN, Lodish 1971). While the 4-parameter diffusion model in equation 10 provides a
relier intuitive and rigorous framework within which forecasters can structure the new

35
product forecasting problem, future researchers should invest greater efforts in generalizing
knowledge on the forecasting behavior of these models and in evaluating conditions under
which these models (under varions estimation scenarios) will typically outperform naïve
alternatives likely to be used in their place (Kolb and Steckler 1993). This knowledge can
then be the basis upon which managers can develop reasonable forecasts and explore die
sensitivities of underlying assumptions being made. Most diffusion studies fall short of
providing such insights, and this is often the result of basic data handling problems:
- despite a wealth of data and the context-free environnent for which these models have been
developed, proposed models generally are presented with a limited number of products (from
3 to 6) representing a convenience sample within a single industry; die basis upon which
categories are selected is generally not stated (other than citing previous use in the literature);
despite the existence of adoption, first purchase, or trial data, proposed models often use early
sales data without controlling for repeat purchases; likewise, the use of production data, which
do not control for exports, may lead to poor fits of die Bass model (Heeler and Hustad 1980);
-without recognition/acknowledgement, times sertes appear to be truncated on an ad hoc basis;
the left hand tail is truncated, sometimes due to data unavailability, which ma sks die actual
launch date, die years to Me adoption or sales peak and die skew of the adoption curve; the
right hand tail (pre-and post peak) is often truncated which can modify the perceived or
predicted/fit first peak which is often not the unique or highest sales peak, producing
exaggerated fit statistics; this "right-hand" truncation may not be wise from a managerial point
of view in that first purchases can represent from 20 to over 40 percent of sales even several
decades after launch for many consumer durables (Parker 1992);
-given the dependence of diffusion processes on extemal variables (marketing mix,
competitive dynamics), studies fail to report Me forecasting issues (and the possible
compounding of errors) associated with including these independent variables.
On this last point, Bass and Krishnan (1992), in noting that parsimonious aggregate models
fit diffusion data well, demonstrate that die exclusion of varions market mix and exogenous

36
factors in aggregate diffusion models may not be a serious problem when these factors do not
affect the long-mn penetration ceiling and enter the equation in a general multiplicative
manner.
Returning to Rogers (1983), marketing diffusion models have concentrated on two of the four
basic elements of diffusion processes: communication channels (interpersonal influences) and
time. It is clear that diffusion modelling has significantly progressed in this area and that less
attention should be placed on developing more complex functional forms which capture the
basic s-shape function. The two remaining elements, however, have been under-researched:
the innovation and the social system. An important avenue for future research will be the
search for empirical generalizations across products and , social systems which can guide
forecasters in using diffusion models at the earliest phases of product planning (Bass 1993).
These studies encompass the two remaining areas of proposed research. With respect to the
innovations, Roberston (1969, 1971) and Gatignon and Robertson (1985) have suggested that
post-launch diffusion patterns are in part driven by the types of products, and tlaeir perceived
attributes. Cross-sectional studies should be made to further understand parameter variations
across products. These would answer basic questions, for a given industry: (1) what features
or benefits of a product typically generate certain diffusion patterns?; (2) if products have
already reached a certain level of acceptance, what will be their likely acceptance in the
future?; and (3) are parameters reflecting the diffusion process interdependent? This research
should cross-sectionally incorporate physical, perceptual and social dimensions of products.
The field of diffusion modelling will be further served by the publication of more widespread
empirical studies across a much broader class of products purchased in a variety of marketing
contexts. Armed with more general knowledge, pre-launch forecasts can be justified based
on tested theories of diffusion theory (Gatignon and Robertson 1985), as opposed to ad hoc
manipulations of data from existing categories. Work in this area has been hampered by the
Jack of large or standardized data sets which can be competitively analyzed by various
authors, as is the tradition in other forecasting arenas. The advent of optical scanner data may
prove useful in this regard. Even though they have been traditionally applied to consumer
durables, there is absolutely no reason to avoid using diffusion models to analyze die trial and
repeat purchase processes of consumer packaged goods, as many studies have documented

37
the importance of interpersonal influence for such categories (see the review in Dawar, Parker
and Price 1993). Since managers are equally interested in their individual brands' diffusion
rates, analyses of brand-level scanner data should be encourage d, especially if these can be
used on a mass scale in order to generate basic understanding.
Finally, with respect to social systems, in their recent review of the international marketing
literature, Douglas and Craig (1992) found limited international diffusion research. As it
stands, diffusion parameters generally lack external validity in ternis of us understanding what
these actually measure (e.g. actual word-of-mouth communications, versus supply constraints;
Simon and Sebastian 1987). White some research has recently occurred in this area (e.g.
Bundgaard-Nielsen 1975; Gatignon et al. 1989; Helsen et al. 1993; Takada and Jain 1991),
we are at the earliest stages of general understanding. For example, we may observe that the
Japanese have different diffusion parameters than other social systems, yet we are not sure
whether this is due to different perceptions of products, different uses of products, different
supply constraints, or different aversions to risk. Since most products are not launched
simultaneously in multiple countries (or geographic regions), large-scale international studies
using data from multiple categories should allow forecasters to anticipate the diffusion pattern
of a product globally, or by country individually, given a historic pattern in the home market.
Gatignon et al., 1989, for example, discuss how estimates of diffusion parameters obtained
on one country can be used to estimate adoption rates in countries which have no historical
data. The lessons learned from these and future studies will greatly improve die usefulness
in reducing die potential risks in using diffusion models as applied forecasting tools.

REFERENCES
Akinola, A.A. (1986), "An Application of the Bass Model in the Analysis of Diffusion ofCocoa-Spraying Chemicals Among Nigerian Cocoa Farmers," Journal of AgriculturalEconomics, 37 (3), 395-404.
Balasubramanian, S.K. and A.K. Ghosh, (1922a), "Reliability Criteria Bolster ProductClassification Decisions: A reply to Jones," International Journal of Research inMarketing, 9 (1992), 355-357.
Balasubramanian, S.K. and A.K. Ghosh, (1922b), "Classifying early product life cycle formsvia a diffusion model: Problems and Prospects," International Journal of Research inMarketing, 9 (1992), 345-352.
Balasubramanian, S.K. and D.C. Jain (1993), "Simple Approaches to Evaluate CompetingNon-Nested Models in Marketing," forthcoming, International Journal of Research inMarketing.
Bass, F.M. (1969), "A New Product Growth Model for Consumer Durables," ManagementScience, 15 (January), 215-27.
Bass, F.M. (1980), "The Relationship Between Diffusion Rates, Experience Curves, andDemand Elasticities for Consumer Durable Technological Innovations," Journal ofBusiness, 53 (July, part 2), 51-67.
Bass, F.M. (1986), "The Adoption of a Marketing Model: Comments and Observations" inInnovation Diffusion of New Product Acceptance, by Vijay Mahajan and Yoram Wind, eds.Cambridge, MA: Ballinger Publishing Company.
Bass, F.M. (1993), "The Future of Research in Marketing: Marketing Science," Journal ofMarketing Research, Vol. XXX (February), 1-6.
Bass, F.M. and T.V. Krishman (1992), "A Generalization of the Bass Model: DecisionVariable Considerations" Working Paper Series, University of Texas at Dallas, 14 50-6-92.
Bayus, B.L. (1987), "Forecasting Sales of New Contingent Products: An Application to theCompact Disc Market," Journal of Product Innovation Management, 4 (December), 243-55.
Bayus, B.L. (1988), "Accelerating the Durable Replacement Cycle With Marketing MixVariables," Journal of Product Innovation Management, 5 (September), 216-26.
Bayus, B.L. (1992), "Have Diffusion Rates Been Accelerating Over Time?", MarketingLetters, 3:3, 215-226.
Bayus, B.L., S. Hong, and R.P. Labe, Jr. (1989), "Developing and Using Forecasting Modelsfor Consumer Durables," Journal of Product Innovation Management, 6 (March), 5-19.

Bernhardt, I. and K.M. MacKenzie (1972), "Some Problems in Using Diffusion Models forNew Products," Management Science, 19 (October), 187-200.
Bewley, R. and D.G. Fiebig (1988), "A Flexible Logistic Growth Model with Application inTelecommunications," Technological Forecasting and Social Change, 4, 177-192.
Blackman, A.W. (1972), "A Mathematical Model for Trend Forecasts," TechnologicalForecasting and Social Change, 441-452.
Bodger, P.S. and H.S. Tay (1987), "Logistic and Energy Substitution Models for ElectricityForecasting: A Comparison using New Zealand Consumption Data," TechnologicalForecasting and Social Change, 31, 27-48.
Bretschneider, S. and B. Bozeman (1986), "Adaptive Diffusion Models for the Growth ofRobotics in New York State Industry," Technological Forecasting and Social Change, 30,111-121.
Bretschneider, S.I. and V. Mahajan (1980), "Adaptive Technological Substitutions Models,"Technological Forecasting and Social Change, 18 (October), 129-39.
Bridges, E., A.T. Coughlan, and S. Kalish (1991), "New Technology Adoption in anInnovative Marketplace: Micro- and Macro-level Decision Making Models," InternationalJournal of Forecasting, 7, 257-270.
Brockhoff, K. (1967), "A Test for the Product Life Cycle," Econometrica, 35 (July-October),472-484.
Bundgaard-Nielsen, M. (1975), "The International Diffusion of New Technology,"Technological Forecasting and Social Change, 8, 365-372.
Carbone, R. and S. Makridakis (1986), "Forecasting when pattern changes occur beyond thehistorical data," Management Science, Vol. 32:3, 257-271.
Chadda, R.L. and S.S. Chitgopekar (1971), "A Generalization of the Logistic Curves andLong-Range Forecasts (1966-1991) of Residence Telephones," The Bell Journal ofEconomics and Management Science, 2, 542-560.
Chatterjee, R. and J. Eliashberg (1990), "The Innovation Diffusion Process in aHeterogeneous Population: A Micromodeling Approach," Management Science, Vol. 36,9, September, 1057-1079.
Clarke, Y. and G.N. Soutar (1982), "Consumer Acquisition Patterns for Durable Goods:Australian Evidence," Journal of Consumer Research, 8 (March), 456-49.
Dalal, S.R. and S. Weerahandi (1993), "Estimation of Innovation Diffusion Models withApplication to a Consumer Durable," Working Paper, Bellcore
Dawar, N., P.M. Parker and L. Price (1993), "A Cross-Cultural Study of InterpersonalInformation Seeking and Giving Behavior", Working Paper, INSEAD, Marketing Dept.

de Jong, P.L.F. (1980), "A Practical Methodology for Estimating the Market Volume forConsumer Durables," European Research, Jan. 1980, 8-18.
Dixon, R. (1980), "Hybrid Corn Revisited," Econometrica, 48 (September), 1451-1461.
Dodds, W. (1973), "An Application of the Bass Model in Long-Term New ProductForecasting," Journal of Marketing Research, 10 (August), 308-11.
Douglas, S.P. and C.S. Craig (1992), " Advances in International Marketing," InternationalJournal of Research in Marketing, 9 (December), 291-318.
Easingwood, C.J. and S.O. Lunn (1992), ."Diffusion Paths in a High-Tech Environment:Clusters and Commonalities," Rd-1) Management, Vol. 22, N° 1 January 1992, 69-80.
Easingwood, C.J., V. Mahajan, and E. Muller (1981), "A Nonsymmetric Responding LogisticModel for Technological Substitution," Technological Forecasting and Social Change, 20(October), 199-213.
Easingwood, C.J., V. Mahajan, and E. Muller (1983), A Nonuniform Influence InnovationDiffusion Model of New Product Acceptance," Marketing Science, 2 (Summer), 273-296.
Easingwood, C.J. (1987), "Early Product Life Cycle Forms for Infrequently Purchased MajorProducts," International Journal of Research in Marketing, 4, 1, 3-9.
Easingwood, C.J. (1989), "An Analogical Approach to Long Term Forecasting of ConsumerDurable Sales," International Journal of Forecasting, Vol. 5, No. 1, 69-82.
Eliashberg, J. and R. Chatterjee (1986), "Stochastic Issues in Innovation Diffusion Models", inInnovation Diffusion Models of New Product Acceptance, Vijay Mahajan and YoramWind, eds. Cambridge, MA: Ballinger Publishing Company.
Eliashberg, J and A.P. Jeuland (1986), "The Impact of Competitive Entry in a DevelopingMarket upon Dynamic Pricing Strategies," Marketing Science, 5 (Winter), 20-36.
Eliashberg, J., C.S. Tapiero and Y. Wind (1987), "Innovation Diffusion Models withStochastic Parameters: Forecasting and Planning Implications," Working Paper No. 87-003, Wharton School, University of Pennsylvania.
Feder, G. and G.T. O'Mara (1982), "On Information and Innovation Diffusion: A BayesianApproach," American Journal of Agricuhural Economics, 64, 145-147.
Fisher, J.C. and R.H. Pry (1971), "A Simple Substitution Model of Technological Change,Technological Forecasting and Social Change, 3, 5-88.
Floyd, A. (1962), "Trend Forecasting: A Methodology for Figure of Merit," in TechnologicalForecasting for Industry and Government: Methods and Applications, J. Bright, ed.Englewood Cliffs, NJ: Prentice-Hall, Inc., 95-105.

Fourt, L. A. and J. W. Woodlock (1960), "Early Prediction of Market Success for GroceryProducts," Journal of Marketing, 25 (October), 31-8.
Gatignon, H., J. Eliashberg, and T.S. Robertson (1989), "Modeling Multinational DiffusionPatterns: An Efficient Methodology," Marketing Science, Vol. 8, 3 (Summer), 231-247.
Gatignon, H. and T.S. Robertson (1985), "A Propositional Inventory for New DiffusionResearch," Journal of Consumer Research, 11 (March), 849-67.
Geurts, M. and J.E. Reinmuth (1980), "New Product Sales Forecasting without Past SalesData," European Journal of Operations Research, 4, 84-90.
Givon, M., V. Mahajan and E. Muller (1993), "Software Piracy: Estimation of Lost Sales andthe Impact of Software Diffusion," Working Paper, Recanati Graduate School of BusinessAdministdration, Tel Aviv University, Israel.
Gore, A.P. and U. A. Lavaraj (1987), "Innovation Diffusion in a Heterogeneous Population,"Technological Forecasting and Social Change, 32, 163-168.
Hanssens, D.M., L.J. Parsons, and R.L. Schultz (1992), Market Response Models:Econometric and Tinte Series Analysis, Kluwer Academic Publishers.
Harvey, A.C. (1984), "Time Series Forecasting Based on the Logistic Curve," Journal of theOperational Research Society, 35, 641-646.
Hauser, J.R. and G.L. Urban (1986), "The Value Priority Hypotheses for Consumer BudgetPlans," Journal of Consumer Research, 12 (March), 446-462.
Heeler, R.M. and T.P. Hustad (1980), "Problems in Predicting New Product Growth forConsumer Durables," Management Science, 26 (October), 1007-20.
Helsen, K., K. Jedidi and W.S. DeSarbo (1993), "A New Approach to Country SegmentationUtilizing Multinational Diffusion Patterns," Journal of Marketing, Vol. 57 (October), 60-71.
Hendry, I. (1972), "The Three Parameter Approach to Long Range Forecasting," Long RangePlanning, 51 (March), 40-5.
Hiebert, L.D. (1974), "Risk, Learning and Adoption of Fertilizer Responsive Seed Varieties,"American Journal of Agricultural Economics, 56 (November), 764-8.
Horsky, D. (1990), "A Diffusion Model Incorporating Product Benefits, Price, Income andInformation," Marketing Science, Vol. 9, N° 4, Fall.
Horsky, D. and L.S. Simon (1983), "Advertising and the Diffusion of New Products",Management Science, 2, 1-17.

Hyman, M.R. (1988), "TheTimeliness Problem in the Application of Bass-Type New ProductGrowth Models to Durable Sales Forecasting," Journal of Business Research, 16 (1), 31-47.
Infosino, W.J. (1986), "Forecasting New Product Sales from Likelihood of Purchase Ratings,"Marketing Science, Vol. 5, N° 4 (Fall), 372-390.
Jain, D. (1992), "Marketing Mix Effects on the Diffusion of Innovations," Working Paper,Northwestern University, Kellogg Graduate School of Management.
Jain, D., V. Mahajan and E. Muller (1991), "Assessment of the Impact of Product Samplingon the Diffusion of a New Product," Working Paper, August 1991.
Jain, D. and R.C. Rao (1990), "Effect of Price on the Demand for Durables: Modeling,Estimation, and Findings," Journal of Business and Econornic Statistics, (April) Vol. 8, N°2, 163-170.
Jain, D. V. Mahajan, and E. Muller (1991), "Innovation Diffusion in the Presence of SupplyRestrictions," Marketing Science, Vol. 10, N° 1 (Winter).
Jensen, R. (1982), "Adoption and Diffusion of an Innovation of Uncertain Profitability,"Journal of EC0170771iC Theory, 27, 182-193.
Jeuland, A.P. (1981), "Parsimonious Models of Diffusion of Innovation: Part A, Derivationsand Comparisons," Working Paper, Graduate School of Business, University of Chicago.
Jones, J.M. (1992), "A comment on 'Classifying early product life cycle forms via a diffusionModel: problems and prospects' by Balasuha, Manian and Ghosh," International Journalof Research in Marketing, 9, 353-354.
Jones, J.M. and C.J. Ritz (1991), Incorporating distribution into new product diffusionmodels," International Journal of Research in Marketing, 8, No 2 (June), 91-112.
Juster, F.T. (1966), "Consumer Buying Intentions and Purchasing Probability: An Experimentin Survey Design," Journal of the American Statistical Association (September).
Kalish, S. and S. Sen (1986), "Diffusion Models and the Marketing Mix for Single Products,"in Innovation Diffusion Models, Vijay Mahajan and Yoram Wind, eds., Cambridge:Ballinger Publishing Company.
Kamakura, W.A. and S.K. Balasubramanian (1987), "Long-Term Forecasting with InnovationDiffusion Models: The Impact of Replacement Purchase," Journal of Forecasting, 6 (1),1-19.
Kamakura, W.A. and S.K. Balasubramanian (1988), "Long-Term View of the Diffusion ofDurables," International Journal of Research in Marketing, 5, 1-13.

Kolb, R.A. and H.O. Stekler (1993), "Are Economic Forecasts Significantly Better ThanNaive Predictions? An Appropriate Test," International Journal of Forecasting, 9, (1)(April), 117-120.
Kumar, U. and V. Kumar (1992a), "Technological Innovation Diffusion: The Proliferation ofSubstitution Models and Easing the User's Dilemma," IEEE Transactions on EngineeringManagement, 39 (May), 158-168.
Kumar, U. and V. Kumar (1992b), "Innovation Diffusion: Some New TechnologicalSubstitution Models," Journal of Mathematical Sociology, 17, (2-3), 174-194.
Lancaster, G. A. and G. Wright (1983), "Forecasting the Future of Video Using a DiffusionModel," European Journal of Marketing, 17 (2), 70-79.
Lattin, J.M. and J.H. Roberts (1989), "Modeling the Role of Risk-Adjusted Utility in theDiffusion of Innovations," Working Paper 1019, Graduate School of Business, StanfordUniversity.
Lavaraj, U.A. and A.P. Gore (1990), "On Interpreting Probability Distributions Fitted toTimes of First Adoption," Technological Forecasting and Social Change, Vol. 37, N° 4(July), 355-370.
Lawrence, K.D. (1980), "New Product Forecasting, Diffusion Modeling with ScenarioSensitivity Analysis" in Marketing Measurement, TIMS (North-Holland, New York).
Lawrence, K.D. and M. Geurts (1984), "Converging Conflicting Forecasting Parameters inForecasting Durable New Product Sales," European Journal of Operational Research, 16,42-47.
Lawrence, K.D. and W.H. Lawton (1981), "Applications of Diffusion Models: SomeEmpirical Results," in New Product Forecasting by Y. Wind; V. Mahajan, and R.C.Cardozo, eds. Lexington, MA: Lexington Books, 529-41.
Lee, J.C. and K.W. Lu (1987), "On a Family of Data-Based Transformation Models Useful inForecasting Technological Substitution," Technological Forecasting and Social Change„31, 61-78.
Lekvall, P. and C. Wahlbin (1973), "A Study of Some Assumptions Underlying InnovationDiffusion Functions," Swedish Journal of Economics, 75, 362-77.
Lenk, P.J. and A.G. Rao (1989), "New Models from Old: Forecasting Product Adoption byHierarchical Bayes Procedures," Marketing Science, Vol. 9, 1 (Winter), 42-53.
Levenbach, H. and B.E. Reuter (1976), "Forecasting Trending Time Series with RelativeGrowth Rate Models," Technometrics, 18, 261-272.
Lilien, G.L., P. Kotler, and K.S. Moorthy (1992), Marketing Models, Englewood Cliffs, NJ:Prentice Hall.

Lilien, G.L., A.G. Rao, and S. Kalish (1981), "Bayesian Estimation and Control of DetailingEffort in Repeat Purchase Diffusion Environment," Management Science, 27 (May), 493-506.
Lodish, L.M. (1971), "CALLPLAN, An Interactive Salesman's Call Planning System,"Management Science, Part II, Vol. 18, N° 4.
McCardle, K.F. (1985), "Information Acquisition and the Adoption of New Technology,"Management Science, 31 (11), 1372-1389.
McGowan, I. (1986), "The Use of Growth Curves in Forecasting Market Development,"Journal of Forecasting, 5 (1), 69-71.
Mahajan, V., S.I. Bretschneider and J.W. Bradford (1980), "Feedback Approaches toModeling Structural Shifts in Market Response," Journal of Marketing, 44 (Winter), 71-80.
Mahajan, V., C.H. Mason, and V. Srinivasan (1986), "An Evaluation of EstimationProcedures for New Product Diffusion Models," in Innovation Diffusion Models of NewProduct Acceptance, Vijay Mahajan and Yoram Wind, eds. Cambridge, MA: BallingerPublishing Company.
Mahajan, V. and E.Muller (1979), "Innovation Diffusion and New Product Growth Models inMarketing," Journal of Marketing, 43 (Fall), 55-68.
Mahajan, V., E. Muller and F.M. Bass (1990), "New Product Diffusion Models in Marketing:A Review and Directions for Future Research," Journal of Marketing, 54 (1), 1-26.
Mahajan, V., E. Muller, and R.K. Srivastava (1990), "Determination of Adopter Categories byUsing Innovation Diffusion Models," Journal of Marketing Research, XXVII (February)37-50.
Mahajan, V. and R.A. Peterson (1978), "Innovation Diffusion in a Dynamic Potential AdopterPopulation," Management Science, 24 (November), 1589-97.
Mahajan, V. and R.A. Peterson (1979), "Integrating Time and Space in TechnologicalSubstitution Models," Technological Forecasting and Social Change, 14 (August), 231-41.
Mahajan, V. and R.A. Peterson, A.K. Jain and N. Malhotra (1979), "A New Product GrowthModel with Dynamic Market Potential," Long Range Planning, 62-9.
Mahajan, V. and S. Sen (1986), "Diffusion Models and the Marketing Mix for SingleProducts," in Innovation Diffusion Models of New Product Acceptance, Vijay Mahajan andYoram Wind , eds., Cambridge, MA: Ballinger Publishing Company.
Mahajan, V. and S. Sharma (1986), "A Simple Algebraic Estimation Procedure for InnovationDiffusion Models of New Product Acceptance," Technological Forecasting and SocialChange, 30 (December), 331-345.

Mahajan, V. and S. Sharma and R.A. Bettis (1988), "The Adoption of the M-FormOrganizational Structures: A Test of Imitation Hypothesis," Management Science, 34(October), 1188-1201.
Mahajan, V. and Y. Wind (1986a), Innovation Diffusion Models of New Product Acceptante.Cambridge, MA: Ballinger Publishing Company.
Mahajan, V. and Y. Wind (1986b), "Applications of Innovation Diffusion Models inMarketing," in Innovation Diffusion Models of New Product Acceptante. Cambridge, MA:Ballinger Publishing Company.
Mahajan, V. and Y. Wind (1988), "New Product Forecasting Models: Directions forResearch and Implementation," International Journal of Forecasting, 4 (3), 341-358.
Mahajan, V., Y. Wind, and S. Sharma (1983), "An Approach to Repeat Purchase DiffusionModels," AMA Proceedings, Series 49, Patrick E. Murphy et al., eds. Chicago: AmericanMarketing Association, 442-6.
Mansfield, Edwin (1961), "Technical Change and the Rate of Imitation," Econometrica, 29(October), 741-66.
Meade, N. (1984), "The Use of Growth Curves in Forecasting Market Development: AReview and Appraisal," Journal of Forecasting, 3 (4), 429-51.
Meade, N. (1989), "Technological Substitution: A Framework of Stochastic Models,"Technological Forecasting and Social Change, 36, 389-400.
Modis, T. (1993), "Technological Substitutions in the Computer Industry," TechnologicalForecasting and Social Change, 43, 157-167.
Modis, T. (1994), "Fractal Aspects of Natural Growth," Technological Forecasting andSocial Change, forthcoming.
Modis, T. and A. Debecker (1988), "Innovation in the Computer Industry," TechnologicalForecasting and Social Change, 33 (May), 267-78.
Modis, T. and A. Debecker (1992), "Chaoslike States Can Be Expected Before and AfterLogistic Growth," Technological Forecasting and Social Change, 41, 111-120.
Montgomery, D.B. and V. Srinivasan (1989), "An Improved Method for Meta Analysis: WithApplication to New Product Diffusion Models," Working Paper, Graduate School ofBusiness, Stanford University, Stanford, CA.
Morrison, D.G. (1979), "Purchase Intentions and Purchase Behavior," Journal of Marketing,42 (Spring), 65-74.

Morwitz, V.G., and D.C. Schmittlein (1992), "Using Segmentation to Improve SalesForecasts Based on Purchase Intent: Which 'Intenders' Actually Buy?" Journal ofMarketing Research, Vol. XXIX (November) 391-405.
Narasimhan, C. (1989), "Incorporating consumer Price Expectations in Diffusion Models,"Marketing Science, Vol. 8, 4 (Fall), 343-357.
Narayanan, S. (1992), "Incorporating Heterogeneous Adoption Rates in New ProductDiffusion: A Model and Empirical Investigations," Marketing Letters, 3:4, 395-406.
Nelder, J. A. (1962), "An Alternative Form of a Generalized Logistic Equation," Biometrics,18 (December), 614-16.
Nevers, J. V. (1972), "Extensions of a New Product Growth Model," Sloan ManagementReview, 13 (Winter), 78-9.
Norton, J.A. and F.M. Bass (1987), "A Diffusion Theory Model of Adoption and Substitutionfor Successive Generations of High Technology Products," Management Science, 33(September), 1069-86.
Olshavsky, R.W. (1980), "Time and Rate of Adoption of Innovations," Journal of ConsumerResearch, 6 (March), 425-8.
Oison, J.A. and S. Choi (1985), "A Product Diffusion Model Incorporating RepeatPurchases," Technological Forecasting and Social Change, 27, 385-97.
Oren, S.S. and R.G. Schwartz (1988), "Diffusion of New Products in Risk-SensitiveMarkets," Journal of Forecasting, 7 (October-December), 273-87.
Parker, P.M. (1991), "A Study of Price Elasticity Dynamics Using Parsimonious ReplacementMultiple Purchase Diffusion Models," Working Paper, INSEAD, 91/47/Marketing.
Parker, P.M. (1992), "Price Elasticity Dynamics Over the Adoption and Life Cycle," Journalof Marketing Research, Vol. XXIX (August), 358-67.
Parker, P.M., (1993), "Choosing Among Diffusion Models: Some Empirical Evidence,"Marketing Letters, 4: I .
Parker, P.M. (1993b), "PENETRATOR: Decision Support for Pre-Launch DiffusionForecasting," A Decision Support System, INSEAD, Marketing Dept.
Parker, P.M. and H. Gatignon (1992), "Order-of-Entry and the Diffusion of Trials forFrequently Purchased Brands in a New Category," Working Paper, INSEAD, MarketingDept.
Parker, P.M. and H. Gatignon (1993), "Competitive Effects in Diffusion Models: AnEmpirical Analysis," forthcoming, International Journal of Research in Marketing.

Peterson, R.A. and V. Mahajan (1978), "Multi-Product Growth Models," in Research inMarketing, J. Sheth, ed. Greenwich, CT: JAI Press, Inc., 201-31.
Poznanski, K. (1983), "International Diffusion of Steel Technologies, Time-Lag and the Speedof Diffusion," Technological Forecasting and Social Change, 23, 305-323.
Rao, A.G. and M. Yamada (1988), "Forecasting With a Repeat Purchase Diffusion Model,"Management Science, 34 (June), 734-52.
Rao, S.K. (1985), "An Empirical Comparison of Sales Forecasting Models," Journal ofProduct Innovation Management, 2 (December), 232-42.
Reinganum, J.F. (1981), "On the Diffusion of New Technology: A Game-TheoreticApproach," Review of Economic Studies, 48, 385-405.
Reinganum, J.F. (1983), "Technology Adoption Under Imperfect Information," Bell Journalof Economics, 14, 57-69.
Richards, F.J. (1959), "A Flexible Growth Function for Empirical Use," Journal ofExperimental Botany, 10, 290-300.
Robertson, T.S. (1967), "Determinants of Innovative Behavior," in Proceedings of theAmerican Marketing Association, R. Moyer, ed. Chicago: American MarketingAssociation, 328-32.
Robertson, T.S. (1971), Innovative Behavior and Communication. New York: Holt, Rinehartand Winston.
Robinson, B. and C. Lakhani (1975), "Dynamic Price Models for New Product Planning,"Management Science, 10 (June), 1113-22.
Rogers, E.M. (1983), Diffusion of Innovations, 3rd ed. New York: the Free Press.
Schmidt, P., and A.D. Witte (1989); "Predicting Criminel Recidivism Using 'Split Population'Survival Time Models," Journal of Econometrics, 40, 141-159.
Schmittlein, D.C. and V. Mahajan (1982), "Maximum Likelihood Estimation for an InnovationDiffusion Model of New Product Acceptance," Marketing Science, 1 (Winter), 57-78.
Sharif, M.N. and M.N. Islam (1980), "The Weibull Distribution as a General Model forForecasting Technological Change, Technological Forecasting and Social Change, 18,247-256.
Sharif, M.N. and K. Ramanatha (1981), "Binomial Innovation Diffusion Models with DynamicPotential Adapter Population," Technological Forecasting and Social Change, 20, 63-87.
Simon, H. (1989), Price Management. North Holland, Elsevier Science Publishers:Amsterdam.

Simon, H. (1992), "Marketing Science's Pilgrimage to the Ivory Tower," Working Paper,Johannes Gutenberg Universitat, Mainz.
Simon, H. and K-H. Sebastian (1987), "Diffusion and Advertising: The German TelephoneCompany," Management Science, 33 (April), 451-66.
Sinha, R.K. and M. Chandrashekaran (1992), "A Split Hazard Model for Analyzing theDiffusion of Innovations," Journal of Marketing Research, XXIX (February), 116-127.
Skiadas, C.H. (1986), "Innovation Diffusion Models Expressing Asymmetry and/or Positivelyor Negatively Influence Forces, Technological Forecasting and Social Change, 39, 313-
330.
Srinivasan, V. and C.H. Mason (1986), "Nonlinear Least Squares Estimation of New ProductDiffusion Models," Marketing Science, 5 (Spring), 169-78.
Srivastava, R.K., V. Mahajan, S.N. Ramaswami, and J. Cherian (1985), "A Multi-AttributeDiffusion Model for Forecasting the Adoption of Investment Alternatives for Consumers",Technological Forecasting and Social Change, 28 (December), 325-33.
Stapleton, E. (1976), "The Normal Distribution as a Model of Technological Substitution,Technological Forecasting and Social Change, 8, 325-334.
Steyer, A. (1993), "La Théorie des Avalanches: Physique Sociale des Phénomènes dePropagation," Doctoral Thesis, L'Ecole des Hautes Etudes Commerciales, Jouy-en-Josas,France.
Stoneman, P. (1981), "Intra-Firm Diffusion, Bayesian Learning and Profitability," EconomicJournal, 91 (June), 375-388.
Sultan, F., J.U. Farley, and D.R. Lehmann (1990), "A Meta-Analysis of Diffusion Models,"Journal of Marketing Research, Vol. XXVII (February), 70-77.
Takada, H. and D. Jain (1991), "Cross-National Analysis of Diffusion of Consumer DurableGoods in Pacific Rim Countries," Journal of Marketing, 55 (April), 48-54.
Tanny, S. M. and N. A. Derzko (1988), "Innovators and Imitators in Innovation DiffusionModeling," Journal of Forecasting, 7 (4), 225-34.
Teotia, A.P.S., and P.S. Raji (1986), "Forecasting the Market Penetration of NewTechnologies Using a Combination of Economic Cost and Diffusion Models," Journal ofProduct Innovation Management, 3 (December), 225-237.
Theil, H. (1966), Applied Economic Forecasting, Amsterdam: North Holland Publishing
Company.
Thomas, R.J. (1985a), "Estimating Market Growth for New Products: An AnalogicalDiffusion Model Approach," Journal of Product Innovation Management, 2 (March), 45-
55.

Thomas, R.J. (1985b), "Problems in Demand Estimation for a New Technology," Journal ofProduct Innovation Management, 3, 145-157.
Thomas, R.J. (1987), "Forecasting New Product Market Potential: Combining MultipleMethods," Journal of Product Innovation Management, 4:109-119.
Tigert, D. and B. Farivar (1981), "The Bass New Product Growth Model: A SensitivityAnalysis for a High Technology Product," Journal of Marketing, 45 (Fall), 81-90.
Tingyan, X. (1990), "A Combined Growth Model for Trend Forecasts," TechnologicalForecasting and Social Change, 38, 175-186.
Trajtenberg, M. and S. Yitzhaki (1989), "The Diffusion of Innovations: A MethodologicalReappraisal," Journal of Business and Economic Statistics, Vol. 7, N° 1.
Twiss, B.C. (1984), "Forecasting Market Size and Market Growth Rates for New Products,"Journal of Product Innovation Management, 1: 19-29.
Urban, G.L., J.R. Hauser and J.H. Roberts (1990), "Prelaunch Forecasting of NewAutomobiles," Management Science, Vol. 36, N° 4, 401-421.
Vanhonacker, W. (1990), "On Bayesian Estimation of Model Parameters," Marketing Science,9-1 (Winter), 54-57.
Vanhonacker, W., D. Lehmann, and F. Sultan (1990), "Combining Related and Sparse Data inLinear Regression Models," Journal of Business and Economic Statistics, 8-3 (July), 327-336.
Vanhonacker, W., and L. Price (1992), "Using Meta-Analysis Results in Bayesian Updating:The Empty Cell Problem," Journal of Business and Economic Statistics, 10, October, 427-435.
Von Bertalanffy, L. (1957), "Quantitative Laws in Metabolism and Growth," OuarterlyReview of Biology, 32 (September), 217-231.
Weerahandi, S. and S.R. Dalal (1992), "A Choice Model Approach to the Diffusion of qService: Forecasting Fax Penetration by Segment," Marketing Science, Vol. 11, N° 1, 39-53.
Wiorkowski, J.J. (1988), "Fitting of Growth Curves Over Time When the Data Are Obtainedfrom a Single Realization," Journal of Forecasting, 7259-272.
Yamada, M. and Y-L.E. Leung (1992), "Forecasting with a revealed similarity map," WorkingPaper N° IS92-0S, Nagoya University.
Young, P. (1993), "Technological Growth Curves: A Competition of Forecasting Models,"Technological Forecasting and Social Change, Vol. 44, N° 4 (December), 375-390.

Young, P. and J.K. Ord (1985), "The Use of Discounted Least Squares TechnologicalForecasting," Technological Forecasting and Social Change, 28, 263-274.
Young, P. and J.K. Ord (1990), "Model Selection and Estimation for Technological GrowthCurves," International Journal of Forecasting, 5, 501-514.
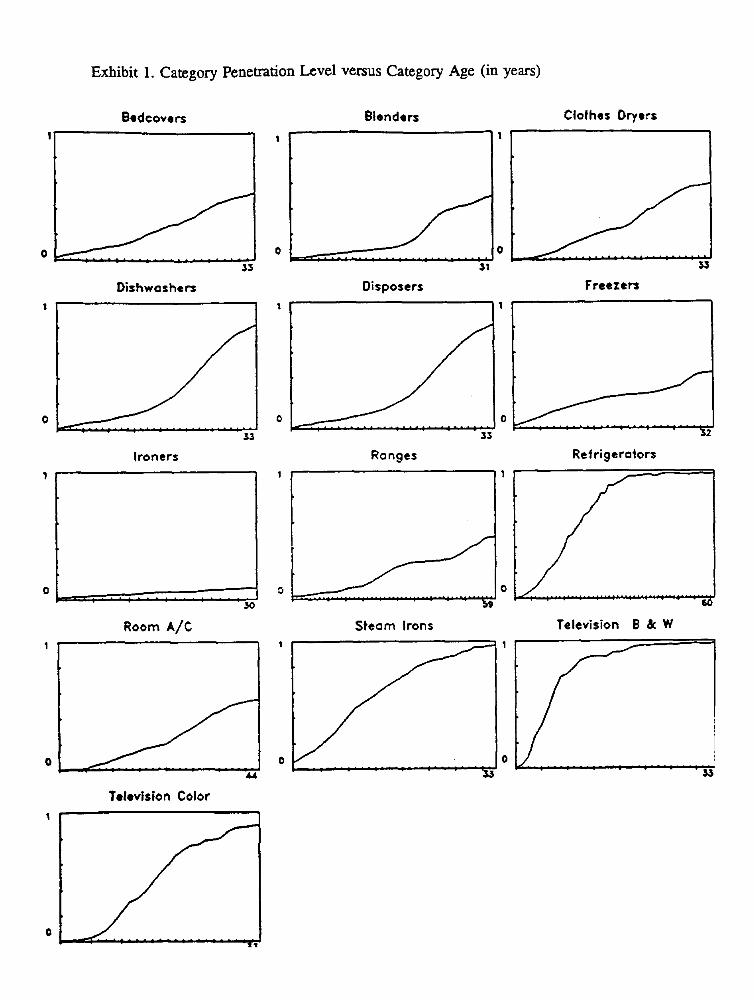
31 33
FreezersDisposers
I
oo33
Dishwoshers
Television Color
o o33
Exhibit 1. Category Penetration Level versus Category Age (in years)
Bedcovers Blenders Clothes Dryers
I I
o o 33
Ironers Ronges Refrigerotors I
o1•-•""'"
30
Room A/C Steom Irons Television B de W

Televieion:S&W 1S
o
Alicrouoves
Raines
Retriorotoes
Room Aic
Voeuum Cleoners
Woshers (electric)
Wolf, PulsoIors
o
........
I 0
o
illenclers u
...... .o
.r,""elI ii
Calcutotors
Freszero
I one.
o
o
e
o
..........
o
Steom Irons
Exhibit 2Annual First Purchase Patterns Over Time for Consumer Durable Goods
(solid Unes are actual observations; dashed Unes are fitted using Equation le)
Ronges:Oen in Television:eolot
Bodmer@ Disposers
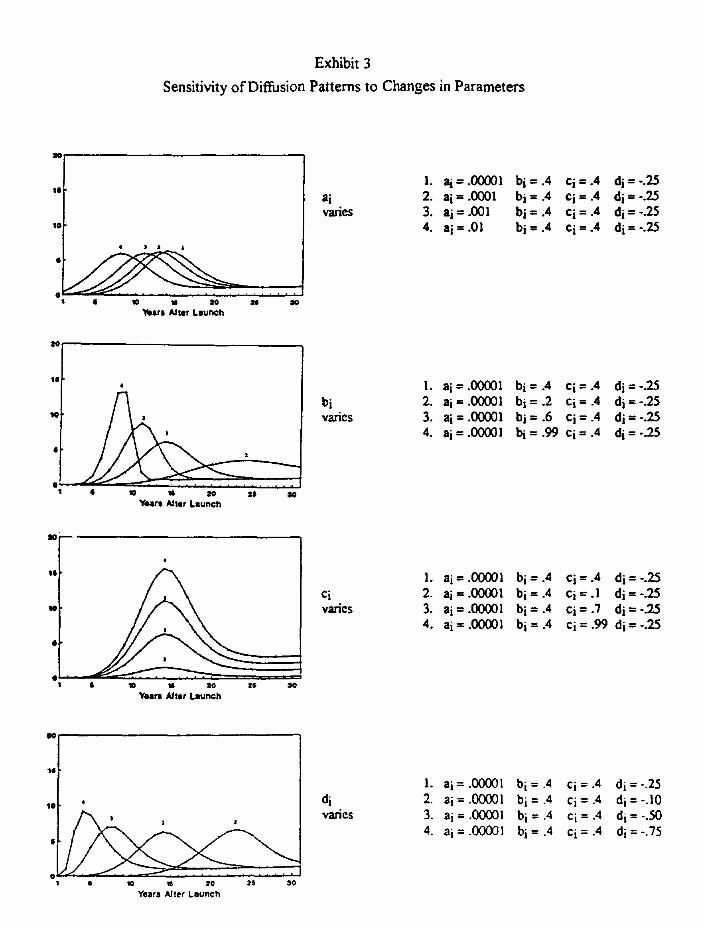
10 ta te 26 10
Yeats Alter Launch
16
$ te 26Wats Mur Launch
10 20 26 30
Ware Alter Launch
10 r6 20
25
30
Yeats Alter Launch
Exhibit 3
Sensitivity of Diffusion Patterns to Changes in Parameters
1. ai = .00001 = .4 ci = .4 di = -.25ai 2. ai = .0001 bi .4 ci = .4 di = -.25varies 3. ai= .001 bi = .4 ci= .4 di= -.25
4. ai = .01 bi = .4 ci = .4 di = -.25
1. ai = .00001 toi = .4 ci = .4 di = -.25bi 2. ai .00001 bi = .2 ci = .4 di = -.25varies 3. ai = .00001 bi = .6 ci = .4 di = -.25
4. ai = .00031 = .99 ci = .4 di = -.25
1. ai = .00001 = .4 ci = .4 = -.25ci 2. a;=.00001 bi = .4 ci = .1 di = -.25varies 3. ai = .00001 bi = .4 ci = .7 di = -.25
4. ai = .00001 bi = .4 ci = .99 di = -.25
te
16
10
1. ai = .00031 b i = .4 ci = .4 di = -.25di 2. ai = .00001 bi = .4 ci = .4 di = -.10varies 3. ai := .00031 b1=.4 c i = .4 di = -.50
4. ai = .00001 = .4 c i = .4 di = -.75