Embed Size (px)
Citation preview
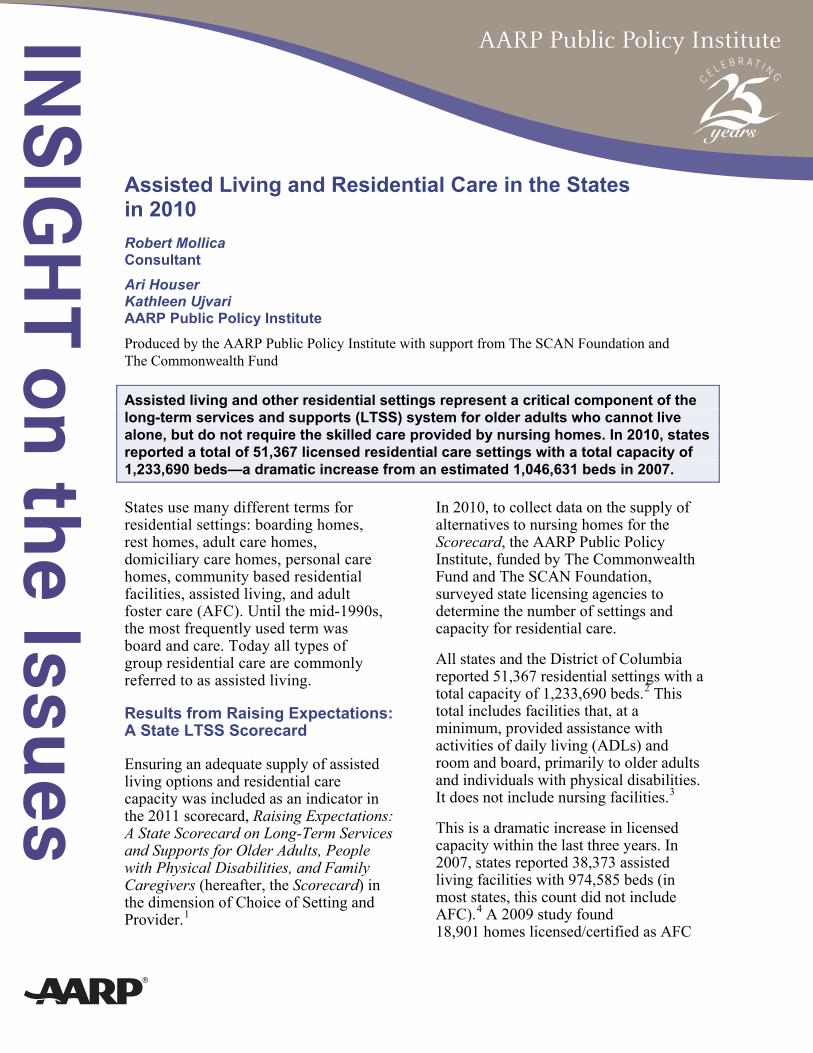
Assisted Living and Residential Care in the States in 2010
AARP Public Policy InstituteINSIG
HT on the Issues
Robert Mollica Consultant Ari Houser Kathleen Ujvari AARP Public Policy Institute Produced by the AARP Public Policy Institute with support from The SCAN Foundation and The Commonwealth Fund
Assisted living and other residential settings represent a critical component of the long-term services and supports (LTSS) system for older adults who cannot live alone, but do not require the skilled care provided by nursing homes. In 2010, states reported a total of 51,367 licensed residential care settings with a total capacity of 1,233,690 beds—a dramatic increase from an estimated 1,046,631 beds in 2007.
States use many different terms for residential settings: boarding homes, rest homes, adult care homes, domiciliary care homes, personal care homes, community based residential facilities, assisted living, and adult foster care (AFC). Until the mid-1990s, the most frequently used term was board and care. Today all types of group residential care are commonly referred to as assisted living.
Results from Raising Expectations: A State LTSS Scorecard
Ensuring an adequate supply of assisted living options and residential care capacity was included as an indicator in the 2011 scorecard, Raising Expectations: A State Scorecard on Long-Term Services and Supports for Older Adults, People with Physical Disabilities, and Family Caregivers (hereafter, the Scorecard) in the dimension of Choice of Setting and Provider.1
In 2010, to collect data on the supply of alternatives to nursing homes for the Scorecard, the AARP Public Policy Institute, funded by The Commonwealth Fund and The SCAN Foundation, surveyed state licensing agencies to determine the number of settings and capacity for residential care.
All states and the District of Columbia reported 51,367 residential settings with a total capacity of 1,233,690 beds.2 This total includes facilities that, at a minimum, provided assistance with activities of daily living (ADLs) and room and board, primarily to older adults and individuals with physical disabilities. It does not include nursing facilities.3
This is a dramatic increase in licensed capacity within the last three years. In 2007, states reported 38,373 assisted living facilities with 974,585 beds (in most states, this count did not include AFC).4 A 2009 study found 18,901 homes licensed/certified as AFC
Assisted Living and Residential Care in the States in 2010
2
with a capacity to serve 64,189 people.5 A composite of these results provides an approximate baseline of 53,774 facilities and 1,046,631 beds in 200.6
There is an approximately sixfold difference in capacity between the highest and lowest states (see Table 1 for capacity for all states). The average capacity in the five highest-performing states was 62 units per 1,000 people age 65 or older in the state, compared with just 11 units per 1,000 people age 65 or older in the bottom five states.7 The national average is 31 per 1,000. Redfoot and Houser (2010) considered the expansion of residential settings as one factor in the declining use of nursing homes.8
Three of the top five states in capacity—Minnesota, Oregon, and Washington—ranked in the top five states for the percentage of Medicaid LTSS spending going to home and community-based services (HCBS), and also ranked as the top three states in overall LTSS performance.
Assisted Living and Residential Care Definitions
There is no standard definition of assisted living. States licensing assisted living and other residential care options do not use the same definitions and standards, and even within states and licensure category, the characteristics of facilities vary greatly (see Table 2 for supply by state and licensure category).
Assisted living is generally defined as offering or providing assistance with ADLs and instrumental activities of daily living such as meals, and assistance with medications and related services in a residential setting to residents who are not related to the owner of the facility. Associations that represent providers have similar definitions of assisted living. The
Assisted Living Federation of America defines assisted living as a long-term care option that combines housing, support services, and health care, as needed. Assisted living is designed for individuals who require assistance with everyday activities such as meals, medication management or assistance, bathing, dressing, and transportation.
The National Center for Assisted Living (NCAL), which also represents providers, describes assisted living as residences that offer a multifaceted residential setting that provides personal care services, 24-hour supervision and assistance, activities, and health-related services designed to minimize the need to relocate; accommodate individual residents’ changing needs and preferences; maximize residents’ dignity, autonomy, privacy, independence, choice, and safety; and encourage family and community involvement.
The physical structure of older residential care facilities may be institutional, sometimes with two or more residents sharing a bedroom, and as many as eight to ten residents sharing a bathroom. Market forces and preferences for private apartment-style units have affected the supply over time. Only about 3 percent of units were occupied by two unrelated individuals in 2009.9 State policy has also changed. In the late 1980s, policymakers in Oregon—and later in other states—developed a separate licensing category called assisted living. Assisted living embraced a philosophy of care that emphasized privacy and greater control over daily activities such as sleeping, eating, and bathing. Today, nearly all states use the term “assisted living” to license residential facilities. However, most states that use the term do not require apartment-style units.
Many states license smaller facilities as adult foster care. In general, AFC
Assisted Living and Residential Care in the States in 2010
3
typically serves five or fewer residents in a provider’s home, although several states use a lower threshold. A 2009 report by the AARP Public Policy Institute found that 29 states have regulations to license or certify AFC, 6 states have regulations or standards for AFC to participate in Medicaid, and 17 states cover AFC through assisted living regulations.10
Many AFC providers are registered nurses, licensed practical nurses, or certified nursing assistants. Some providers cared for a spouse or relative and decided to use these skills to earn a living by caring for others in their own home.
Recent Changes in State and Federal Assisted Living Policy
On April 15, 2011, the Centers for Medicare and Medicaid Services (CMS) issued proposed regulations that would define “community settings” where Medicaid beneficiaries could receive services that are covered by §1915 (c) HCBS waiver programs. The current waiver guidelines describe assisted living services as follows: “Personal care and supportive services (homemaker, chore, attendant services, meal preparation) that are furnished to waiver participants who reside in a homelike, non-institutional setting that includes 24-hour on-site response capability to meet scheduled or unpredictable resident needs and to provide supervision, safety and security. Services also include social and recreational programming, and medication assistance ….”
States have the flexibility to propose other definitions. The proposed regulation would require that waiver services be provided only in “settings that are home and community-based, integrated in the community, provide meaningful access to the community and community activities, and choice about
providers, individuals with whom to interact, and daily life activities.”
“A setting is not integrated in the community if it is located in a building that is also a publicly or privately operated facility that provides inpatient institutional treatment or custodial care; in a building on the grounds of, or immediately adjacent to, a public institution; or a housing complex designed expressly around an individual’s diagnosis or disability, as determined by the Secretary; or has qualities of an institutional setting, as determined by the Secretary.”11
The proposed regulations described the conditions for assisted living that must be met for serving older adults in community settings:
■ Individual has a lease (resident agreements or contracts may be permitted);
■ Setting is an apartment with individual living, sleeping, bathing, and cooking areas and individuals can choose whether or not to share a living arrangement and with whom;
■ Individuals have lockable access to and egress from their own apartments;
■ Individuals are free to receive visitors and leave the setting at times and for durations of their own choosing;
■ Aging in place must be a common practice;
■ Leases may not reserve the right to assign and change apartment assignments;
■ Access to the greater community is easily facilitated based on the individual’s needs and preferences; and
■ Individuals’ compliance with their person-centered care plan is not in and of itself a condition of the lease.12
Assisted Living and Residential Care in the States in 2010
4
CMS continues to review more than 1,200 comments on this and other provisions of the proposed regulation, and changes are anticipated. Defining assisted living for purposes of Medicaid coverage could have a significant impact on the beneficiaries who reside in these settings. However, state agencies will continue to establish their own definitions for licensing purposes.
A 2011 NCAL report on state assisted living licensing activity found that at least 18 states made statutory, regulatory, or policy changes in 2010 or January 2011, and 6 states—Idaho, Kentucky, Oregon, Pennsylvania, South Carolina, and Texas—made major changes.13 The report noted that Pennsylvania implemented new assisted living regulations and Oregon developed new rules for the endorsement of memory care communities.
Characteristics of Facilities and Residents—The National Survey of Residential Care Facilities
The National Survey of Residential Care Facilities (NSRCF), fielded for the first time in 2010, estimated a total of 31,100 facilities and 971,900 beds nationwide. There were an estimated 733,400 residents, or about 75 percent of capacity. The true vacancy rate (no one living in the unit) is only about 12 percent in 2011,14 as many providers license a unit as double occupancy even if there is only one person in the unit.
The definition of residential care facilities used in the NSRCF was somewhat more restrictive than the definition used for the Scorecard. In particular, only facilities with four or more beds were included.15 This definition was used in developing the sampling frame of 39,635 facilities representing a total of 1,073,043 beds. Furthermore, during the survey process, approximately 18 percent of sampled
facilities were excluded because they did not meet the inclusion criteria, most often because they exclusively served a different population, such as adults with intellectual disabilities.16
Facility Characteristics Large facilities (26 or more beds) made up 35 percent of all facilities but represented 81 percent of the residents. Small and medium-sized facilities (4 to 25 beds) greatly outnumbered large facilities but accounted for only 19 percent of residents.17
About 82 percent of facilities were privately owned for profit. The remaining 18 percent (about one in six) were nonprofit or owned by state, city, or local government. About 38 percent of facilities were chain-affiliated.18
Resident Characteristics Assisted living and residential care residents are overwhelmingly female (70 percent). More than half (54 percent) are age 85 or older, and just 10 percent are younger than 65. Approximately one-third of residents (33 percent) have been living in the facility for less than a year; 36 percent for one to three years, and 31 percent for more than three years.19
About 74 percent of residents receive assistance with ADLs.20 Thirty-seven percent have three or more ADL limitations, and 42 percent have Alzheimer’s or other dementia.21 Approximately one in five residents (19 percent) receive Medicaid assistance, and 43 percent of facilities have at least one resident who receives Medicaid.22
Medicaid recipients were more likely to be younger than other residents: 31 percent were younger than 65, compared with just 10 percent of all residents. More than half (56 percent) of
Assisted Living and Residential Care in the States in 2010
5
residents under 65 were Medicaid beneficiaries, compared with 39 percent of those age 65 to 74, 16 percent of those age 75 to 84, and 10 percent of those 85 or older.23
Other Surveys A smaller industry survey and report, the 2009 Overview of Assisted Living,
presents data for responding facilities and their residents.24 In addition to measuring many resident and facility characteristics that are also measured in the NSRCF, this report presents data on a few topics not covered in the NSRCF, among them income of residents and information about discharges.
Endnotes
1 Susan C. Reinhard, Enid Kassner, Ari Houser, and Robert Mollica. Raising Expectations: A State Scorecard on Long-Term Services and Supports for Older Adults, People with Physical Disabilities, and Family Caregivers. Washington, DC: AARP Public Policy Institute, The Commonwealth Fund, The SCAN Foundation, 2011. Available at http://www.longtermscorecard.org. 2 Actual totals are even higher, as some states reported only facility count or only bed count for certain licensure categories. In particular, California did not report facility counts in the 2010 survey. The count of 51,367 is therefore low, as it does not include facilities in California (in 2007, the state had more than 7,000 facilities). It is likely that there were closer to 60,000 facilities in 2010. 3 Because we did not survey individual facilities, individual facilities that serve primarily mentally retarded/developmentally disabled or other populations, within a licensure category that primarily serves older people and adults with physical disabilities, may be included in the totals. 4 Robert Mollica, Kristin Sims-Kasterlein, and Janet O’Keeffe. Residential Care and Assisted Living Compendium: 2007. Washington, DC: Office of the Assistant Secretary for Planning and Evaluation, U.S. Department of Health and Human Services, November 2007. 5 Robert Mollica, Kristin Sims-Kastelein, Michael Cheek, Candace Baldwin, Jennifer Farnham, Susan Reinhard, and Jean Accius. Building Adult Foster Care: What States Can Do. Washington, DC: AARP Public Policy Institute, September 2009. 6 The definition of residential care in the 2010 Scorecard survey is similar to that used in Mollica et al. (2007); the licensure categories identified in the earlier report served as a baseline for the 2010 survey. States were able to identify additional categories in the 2010 survey, and were explicitly asked to include adult foster care and adult family care. 7 These numbers differ slightly from those reported in the Scorecard. The main difference is that 2010 state population estimates were not available at the time the Scorecard was produced, so 2009 population estimates were used instead. 8 Donald L. Redfoot and Ari Houser. More Older People with Disabilities Living in the Community: Trends from the National Long-Term Care Survey, 1984–2004. Washington, DC: AARP Public Policy Institute, September 2010. 9 American Association of Homes and Services for the Aging, American Seniors Housing Association, Assisted Living Foundation of America, National Center for Assisted Living, National Investment Center for the Seniors Housing & Care Industry. 2009 Overview of Assisted Living. 2009. 10 Mollica et al. 2009. 11 Federal Register. April 15, 2011, 21312–17. 12 Ibid. 13 Karl Polzer. Assisted Living State Regulatory Review 2011. Washington, DC: National Center for Assisted Living, 2011. 14 National Investment Center for the Seniors Housing & Care Industry. http://www.nicmap.org/Products/KeyMetrics.aspx. Accessed February 2012.
Assisted Living and Residential Care in the States in 2010
6
15 See Eunice Park-Lee, Christine Caffrey, Manisha Sengupta, Abigail J. Moss, Emily Rosenoff, and Lauren D. Harris-Kojetin. Residential Care Facilities: A Key Sector in the Spectrum of Long-term Care Providers in the United States. NCHS Data Brief No. 78. Washington, DC: National Center for Health Statistics (NCHS), Centers for Disease Control and Prevention, U.S. Department of Health and Human Services, December 2011. 16 Personal communication with NCHS staff. January 2012. 17 Park-Lee et al. 2011. 18 Ibid. 19 National Center for Health Statistics. 2010 National Survey of Residential Care Facilities Data Dictionary, Resident Public-Use File. Washington, DC: National Center for Health Statistics, Centers for Disease Control and Prevention, U.S. Department of Health and Human Services, 2011. 20 Personal communication with NCHS staff. February 2012. 21 Lauren D. Harris-Kojetin, Manisha Sengupta, Eunice Park-Lee, Christine Caffrey, Abigail Moss, and Emily Rosenoff. National Survey of Residential Care Facilities. “A Resource for Policymakers.” Presentation to the Senate Special Committee on Aging. December 15, 2011. 22 Ibid. 23 Personal communication with NCHS staff. December 2011. 24 American Association of Homes and Services for the Aging et al. 2009. The Overview of Assisted Living is not a representative sample (for example, smaller facilities are underrepresented: facilities with fewer than 25 beds comprise only 7 percent of total capacity, compared with 19 percent for the NSRCF, even though the latter explicitly excludes some small facilities).
Insight on the Issues 58, April, 2012 AARP Public Policy Institute 601 E Street, NW, Washington, DC 20049 www.aarp.org/ppi 202-434-3890, [email protected] © 2012, AARP. Reprinting with permission only.
Assisted Living and Residential Care in the States in 2010
7
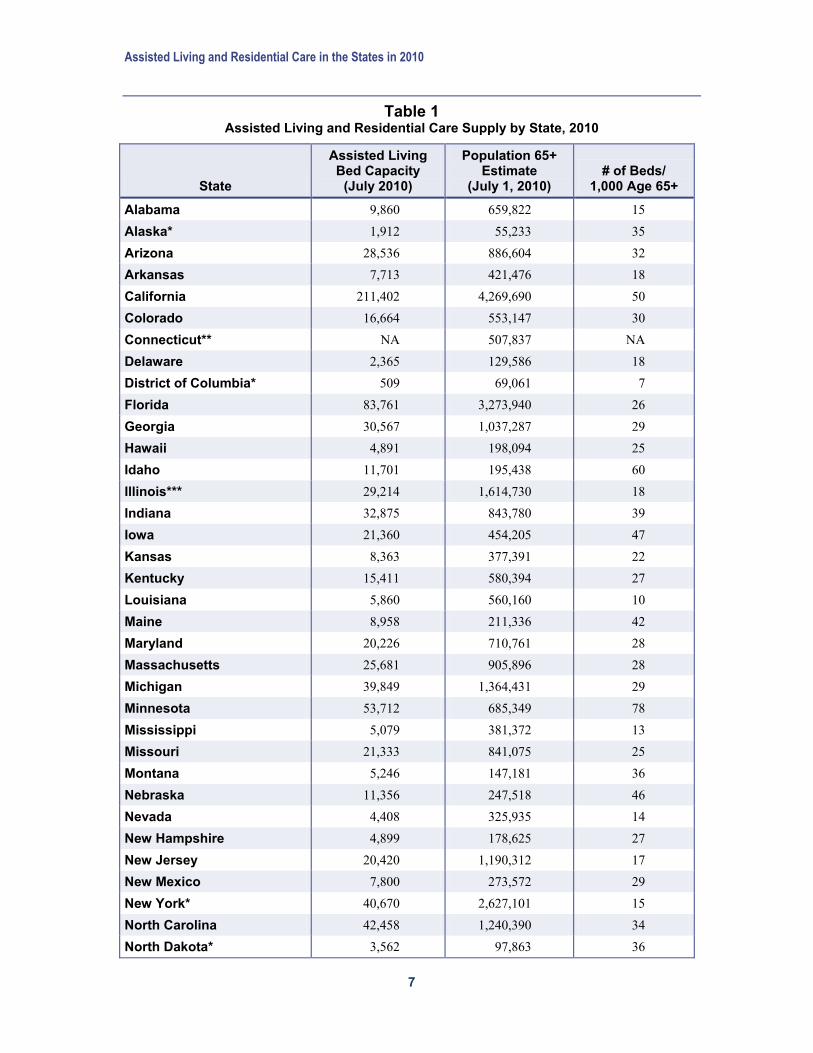
Table 1 Assisted Living and Residential Care Supply by State, 2010
State
Assisted Living Bed Capacity
(July 2010)
Population 65+ Estimate
(July 1, 2010) # of Beds/
1,000 Age 65+
Alabama 9,860 659,822 15 Alaska* 1,912 55,233 35 Arizona 28,536 886,604 32 Arkansas 7,713 421,476 18 California 211,402 4,269,690 50 Colorado 16,664 553,147 30 Connecticut** NA 507,837 NA Delaware 2,365 129,586 18 District of Columbia* 509 69,061 7 Florida 83,761 3,273,940 26 Georgia 30,567 1,037,287 29 Hawaii 4,891 198,094 25 Idaho 11,701 195,438 60 Illinois*** 29,214 1,614,730 18 Indiana 32,875 843,780 39 Iowa 21,360 454,205 47 Kansas 8,363 377,391 22 Kentucky 15,411 580,394 27 Louisiana 5,860 560,160 10 Maine 8,958 211,336 42 Maryland 20,226 710,761 28 Massachusetts 25,681 905,896 28 Michigan 39,849 1,364,431 29 Minnesota 53,712 685,349 78 Mississippi 5,079 381,372 13 Missouri 21,333 841,075 25 Montana 5,246 147,181 36 Nebraska 11,356 247,518 46 Nevada 4,408 325,935 14 New Hampshire 4,899 178,625 27 New Jersey 20,420 1,190,312 17 New Mexico 7,800 273,572 29 New York* 40,670 2,627,101 15 North Carolina 42,458 1,240,390 34 North Dakota* 3,562 97,863 36
Assisted Living and Residential Care in the States in 2010
8
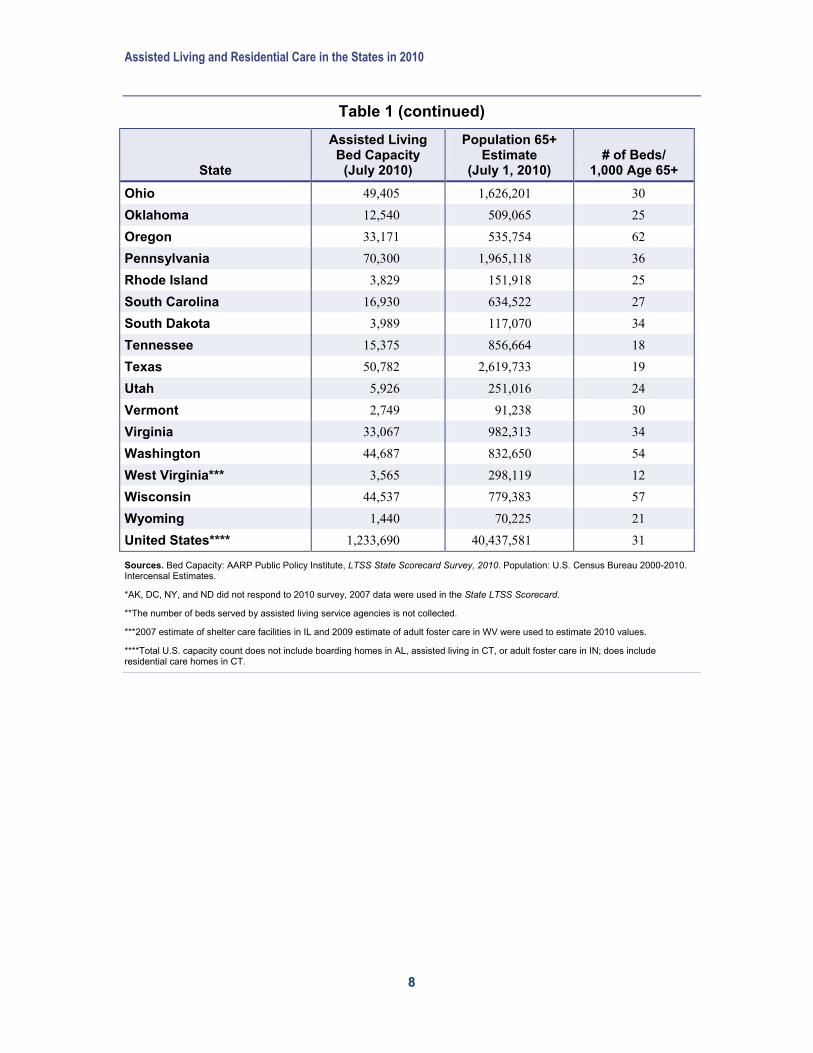
Table 1 (continued)
State
Assisted Living Bed Capacity
(July 2010)
Population 65+ Estimate
(July 1, 2010) # of Beds/
1,000 Age 65+ Ohio 49,405 1,626,201 30 Oklahoma 12,540 509,065 25 Oregon 33,171 535,754 62 Pennsylvania 70,300 1,965,118 36 Rhode Island 3,829 151,918 25 South Carolina 16,930 634,522 27 South Dakota 3,989 117,070 34 Tennessee 15,375 856,664 18 Texas 50,782 2,619,733 19 Utah 5,926 251,016 24 Vermont 2,749 91,238 30 Virginia 33,067 982,313 34 Washington 44,687 832,650 54 West Virginia*** 3,565 298,119 12 Wisconsin 44,537 779,383 57 Wyoming 1,440 70,225 21 United States**** 1,233,690 40,437,581 31
Sources. Bed Capacity: AARP Public Policy Institute, LTSS State Scorecard Survey, 2010. Population: U.S. Census Bureau 2000-2010. Intercensal Estimates.
*AK, DC, NY, and ND did not respond to 2010 survey, 2007 data were used in the State LTSS Scorecard.
**The number of beds served by assisted living service agencies is not collected.
***2007 estimate of shelter care facilities in IL and 2009 estimate of adult foster care in WV were used to estimate 2010 values.
****Total U.S. capacity count does not include boarding homes in AL, assisted living in CT, or adult foster care in IN; does include residential care homes in CT.
Assisted Living and Residential Care in the States in 2010
9
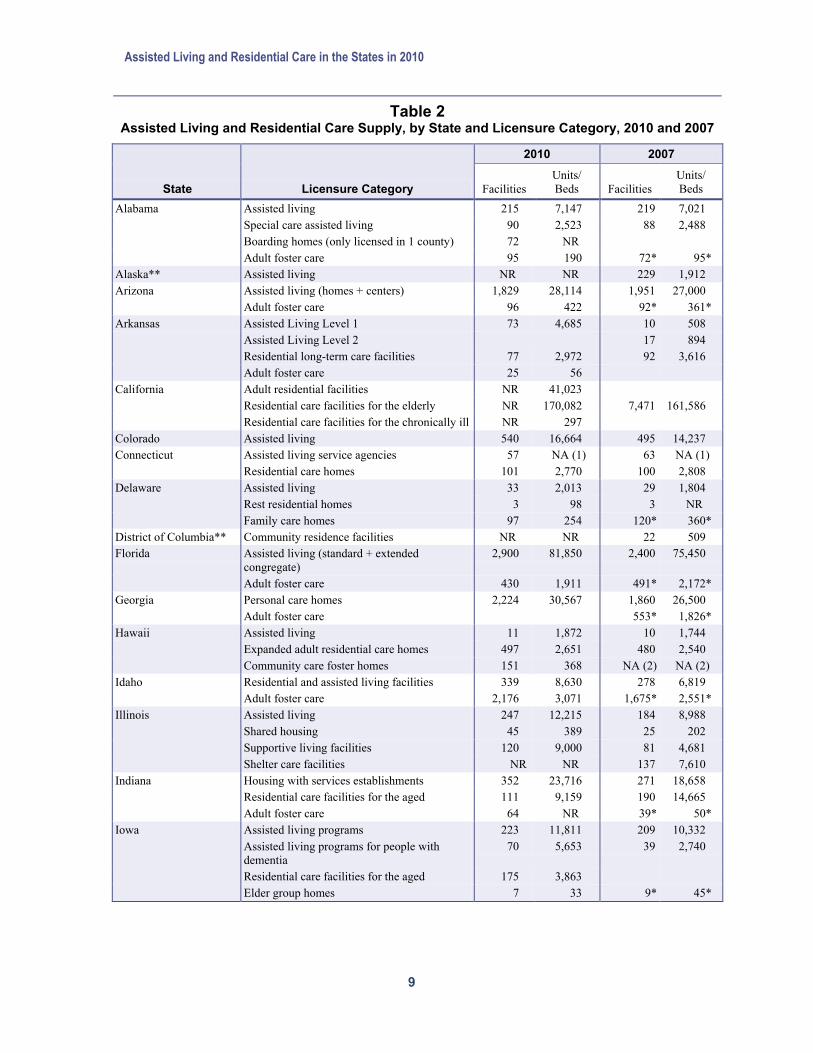
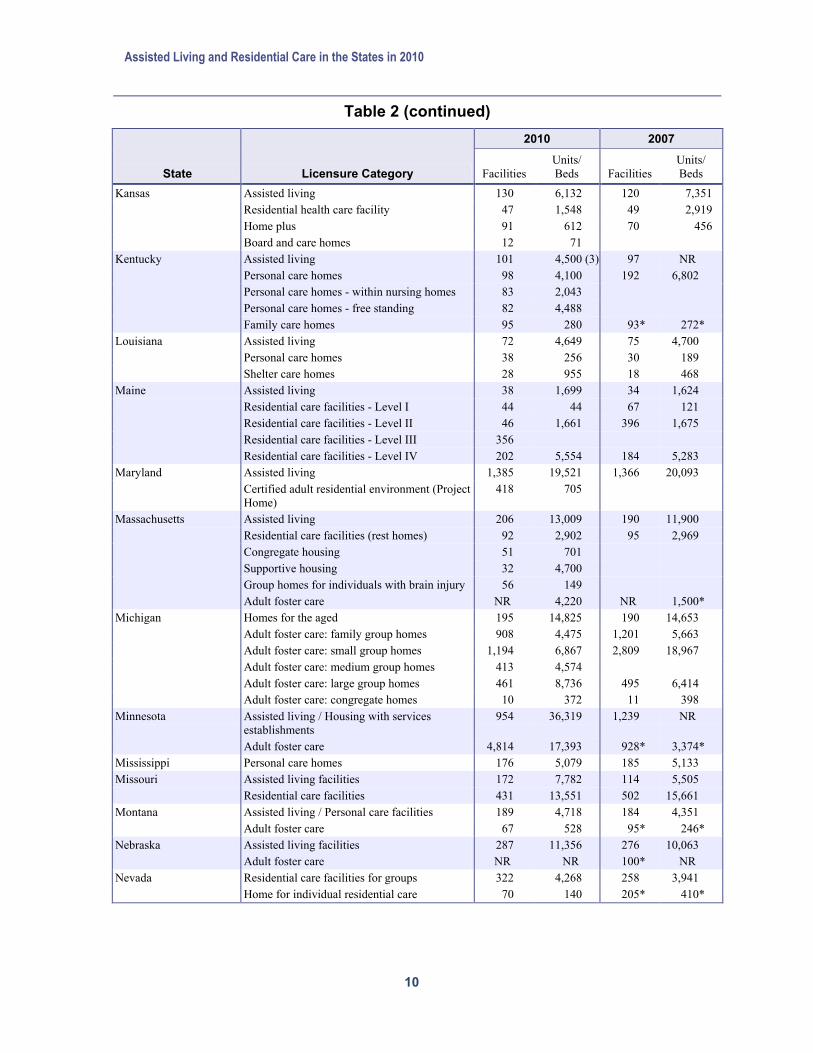
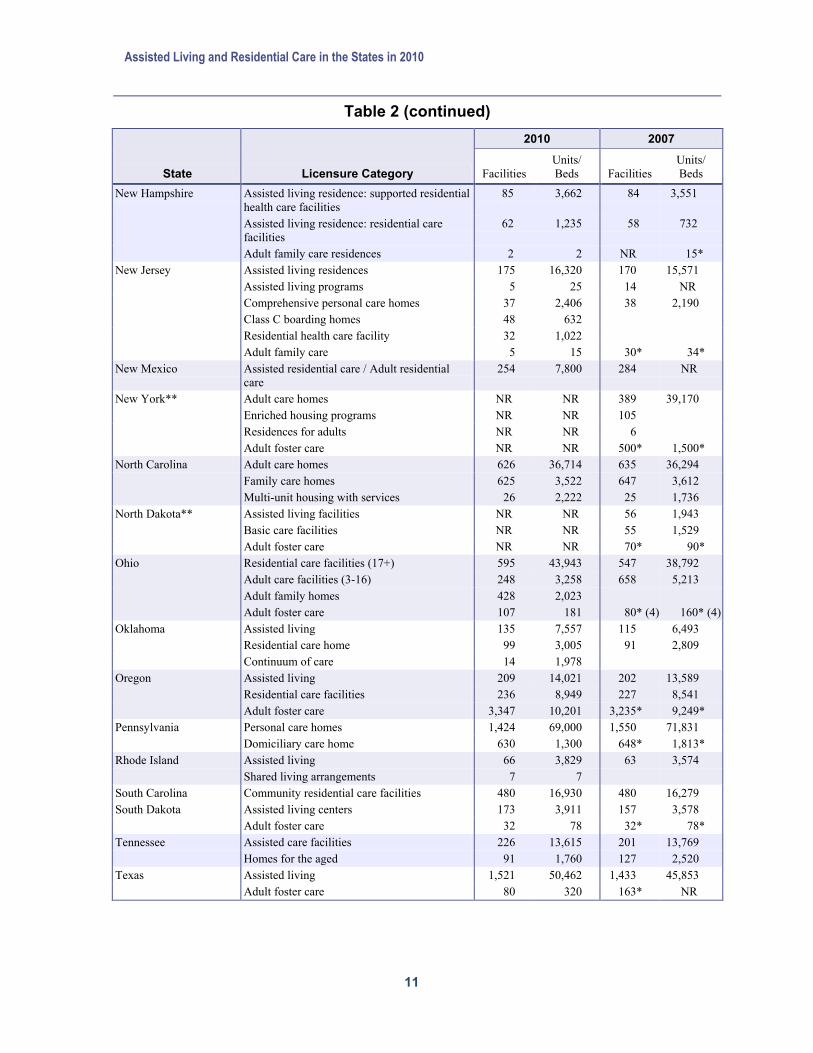
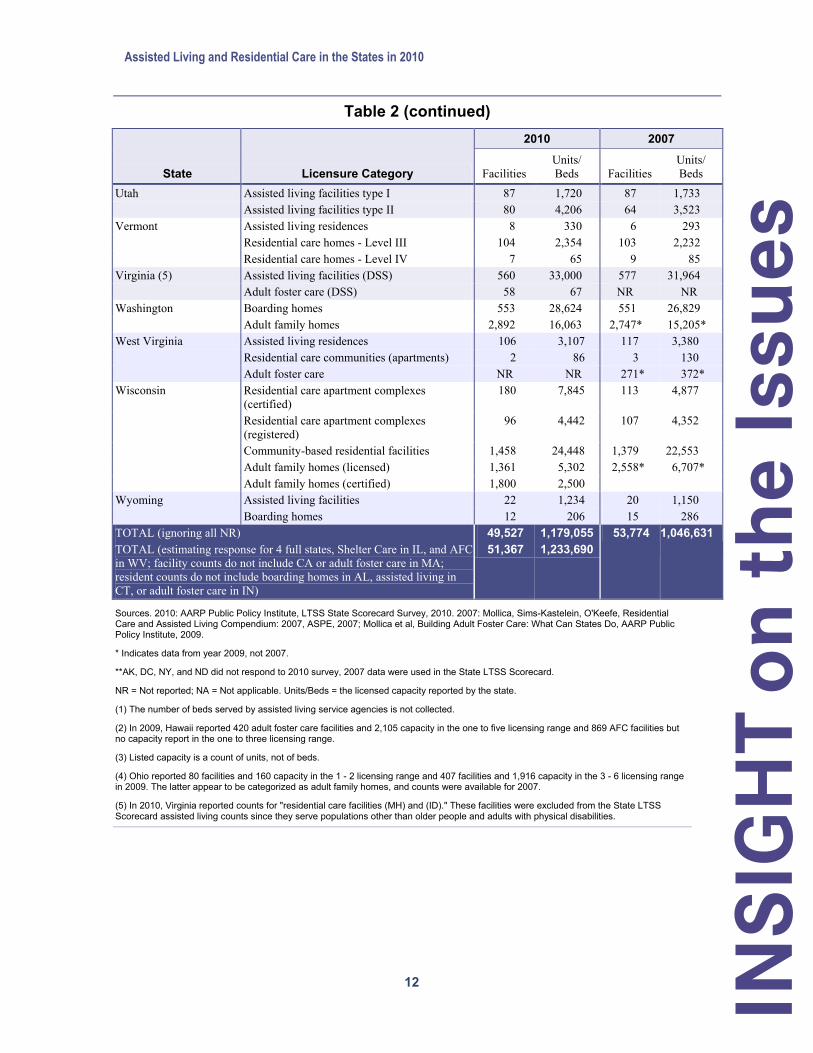
Table 2 Assisted Living and Residential Care Supply, by State and Licensure Category, 2010 and 2007
2010 2007
Facilities Units/ Beds Facilities
Units/ Beds
1
)
NR
State Licensure Category Alabama Assisted living 215 7,147 219 7,021
Special care assisted living 90 2,523 88 2,488 Boarding homes (only licensed in 1 county) 72 NR Adult foster care 95 190 72* 95*
Alaska** Assisted living NR NR 229 1,912 Arizona Assisted living (homes + centers) 1,829 28,114 1,951 27,000
Adult foster care 96 422 92* 361*Arkansas Assisted Living Level 1 73 4,685 10 508
Assisted Living Level 2 17 894 Residential long-term care facilities 77 2,972 92 3,616 Adult foster care 25 56
California Adult residential facilities NR 41,023 Residential care facilities for the elderly NR 70,082 7,471 161,586 Residential care facilities for the chronically ill NR 297
Colorado Assisted living 540 16,664 495 14,237 Connecticut Assisted living service agencies 57 NA (1 63 NA (1)
Residential care homes 101 2,770 100 2,808 Delaware Assisted living 33 2,013 29 1,804
Rest residential homes 3 98 3 NR Family care homes 97 254 120* 360*
District of Columbia** Community residence facilities NR 22 509 Florida
Georgia
Hawaii
Idaho
Illinois
Indiana
Iowa
Assisted living (standard + extended congregate)
2,900 81,850 2,400 75,450
Adult foster care 430 1,911 491* 2,172*Personal care homes 2,224 30,567 1,860 26,500 Adult foster care 553* 1,826*Assisted living 11 1,872 10 1,744 Expanded adult residential care homes 497 2,651 480 2,540 Community care foster homes 151 368 NA (2) NA (2) Residential and assisted living facilities 339 8,630 278 6,819 Adult foster care 2,176 3,071 1,675* 2,551*Assisted living 247 12,215 184 8,988 Shared housing 45 389 25 202 Supportive living facilities 120 9,000 81 4,681 Shelter care facilities NR NR 137 7,610 Housing with services establishments 352 23,716 271 18,658 Residential care facilities for the aged 111 9,159 190 14,665 Adult foster care 64 NR 39* 50*Assisted living programs 223 11,811 209 10,332 Assisted living programs for people with dementia
70 5,653 39 2,740
Residential care facilities for the aged 175 3,863 Elder group homes 7 33 9* 45*
Assisted Living and Residential Care in the States in 2010
10
Table 2 (continued)
State Licensure Category
2010 2007
Facilities Units/ Beds Facilities
Units/ Beds
Kansas Assisted living 130 6,132 120 7,351 Residential health care facility 47 1,548 49 2,919 Home plus 91 612 70 456 Board and care homes 12 71
Kentucky Assisted living 101 4,500 (3) 97 NR Personal care homes 98 4,100 192 6,802 Personal care homes - within nursing homes 83 2,043 Personal care homes - free standing 82 4,488 Family care homes 95 280 93* 272*
Louisiana Assisted living 72 4,649 75 4,700 Personal care homes 38 256 30 189 Shelter care homes 28 955 18 468
Maine Assisted living 38 1,699 34 1,624 Residential care facilities - Level I 44 44 67 121 Residential care facilities - Level II 46 1,661 396 1,675 Residential care facilities - Level III 356 Residential care facilities - Level IV 202 5,554 184 5,283
Maryland Assisted living 1,385 19,521 1,366 20,093 Certified adult residential environment (Project Home)
418 705
Massachusetts Assisted living 206 13,009 190 11,900 Residential care facilities (rest homes) 92 2,902 95 2,969 Congregate housing 51 701 Supportive housing 32 4,700 Group homes for individuals with brain injury 56 149 Adult foster care NR 4,220 NR 1,500*
Michigan Homes for the aged 195 14,825 190 14,653 Adult foster care: family group homes 908 4,475 1,201 5,663 Adult foster care: small group homes 1,194 6,867 2,809 18,967 Adult foster care: medium group homes 413 4,574 Adult foster care: large group homes 461 8,736 495 6,414 Adult foster care: congregate homes 10 372 11 398
Minnesota Assisted living / Housing with services establishments
954 36,319 1,239 NR
Adult foster care 4,814 17,393 928* 3,374* Mississippi Personal care homes 176 5,079 185 5,133 Missouri Assisted living facilities 172 7,782 114 5,505
Residential care facilities 431 13,551 502 15,661 Montana Assisted living / Personal care facilities 189 4,718 184 4,351
Adult foster care 67 528 95* 246* Nebraska Assisted living facilities 287 11,356 276 10,063
Adult foster care NR NR 100* NR Nevada Residential care facilities for groups 322 4,268 258 3,941
Home for individual residential care 70 140 205* 410*
Assisted Living and Residential Care in the States in 2010
11
Table 2 (continued)
State Licensure Category
2010 2007
Facilities Units/ Beds Facilities
Units/ Beds
New Hampshire Assisted living residence: supported residential health care facilities
85 3,662 84 3,551
Assisted living residence: residential care facilities
62 1,235 58 732
Adult family care residences 2 2 NR 15* New Jersey Assisted living residences 175 16,320 170 15,571
Assisted living programs 5 25 14 NR Comprehensive personal care homes 37 2,406 38 2,190 Class C boarding homes 48 632 Residential health care facility 32 1,022 Adult family care 5 15 30* 34*
New Mexico Assisted residential care / Adult residential care
254 7,800 284 NR
New York** Adult care homes NR NR 389 39,170 Enriched housing programs NR NR 105 Residences for adults NR NR 6 Adult foster care NR NR 500* 1,500*
North Carolina Adult care homes 626 36,714 635 36,294 Family care homes 625 3,522 647 3,612 Multi-unit housing with services 26 2,222 25 1,736
North Dakota** Assisted living facilities NR NR 56 1,943 Basic care facilities NR NR 55 1,529 Adult foster care NR NR 70* 90*
Ohio Residential care facilities (17+) 595 43,943 547 38,792 Adult care facilities (3-16) 248 3,258 658 5,213 Adult family homes 428 2,023 Adult foster care 107 181 80* (4) 160* (4)
Oklahoma Assisted living 135 7,557 115 6,493 Residential care home 99 3,005 91 2,809 Continuum of care 14 1,978
Oregon Assisted living 209 14,021 202 13,589 Residential care facilities 236 8,949 227 8,541 Adult foster care 3,347 10,201 3,235* 9,249*
Pennsylvania Personal care homes 1,424 69,000 1,550 71,831 Domiciliary care home 630 1,300 648* 1,813*
Rhode Island Assisted living 66 3,829 63 3,574 Shared living arrangements 7 7
South Carolina Community residential care facilities 480 16,930 480 16,279 South Dakota Assisted living centers 173 3,911 157 3,578
Adult foster care 32 78 32* 78* Tennessee Assisted care facilities 226 13,615 201 13,769
Homes for the aged 91 1,760 127 2,520 Texas Assisted living 1,521 50,462 1,433 45,853
Adult foster care 80 320 163* NR
Assisted Living and Residential Care in the States in 2010
12
Table 2 (continued)
State Licensure Category
2010 2007
Facilities Units/ Beds Facilities
Units/ Beds
Utah Assisted living facilities type I 87 1,720 87 1,733 Assisted living facilities type II 80 4,206 64 3,523
Vermont Assisted living residences 8 330 6 293 Residential care homes - Level III 104 2,354 103 2,232 Residential care homes - Level IV 7 65 9 85
Virginia (5) Assisted living facilities (DSS) 560 33,000 577 31,964 Adult foster care (DSS) 58 67 NR NR
Washington Boarding homes 553 28,624 551 26,829 Adult family homes 2,892 16,063 2,747* 15,205*
West Virginia Assisted living residences 106 3,107 117 3,380 Residential care communities (apartments) 2 86 3 130 Adult foster care NR NR 271* 372*
Wisconsin Residential care apartment complexes (certified)
180 7,845 113 4,877
Residential care apartment complexes (registered)
96 4,442 107 4,352
Community-based residential facilities 1,458 24,448 1,379 22,553 Adult family homes (licensed) 1,361 5,302 2,558* 6,707* Adult family homes (certified) 1,800 2,500
Wyoming Assisted living facilities 22 1,234 20 1,150 Boarding homes 12 206 15 286
TOTAL (ignoring all NR) 49,527 1,179,055 53,774 1,046,631 TOTAL (estimating response for 4 full states, Shelter Care in IL, and AFC in WV; facility counts do not include CA or adult foster care in MA; resident counts do not include boarding homes in AL, assisted living in CT, or adult foster care in IN)
51,367 1,233,690
Sources. 2010: AARP Public Policy Institute, LTSS State Scorecard Survey, 2010. 2007: Mollica, Sims-Kastelein, O'Keefe, Residential Care and Assisted Living Compendium: 2007, ASPE, 2007; Mollica et al, Building Adult Foster Care: What Can States Do, AARP Public Policy Institute, 2009.
* Indicates data from year 2009, not 2007.
**AK, DC, NY, and ND did not respond to 2010 survey, 2007 data were used in the State LTSS Scorecard.
NR = Not reported; NA = Not applicable. Units/Beds = the licensed capacity reported by the state.
(1) The number of beds served by assisted living service agencies is not collected.
(2) In 2009, Hawaii reported 420 adult foster care facilities and 2,105 capacity in the one to five licensing range and 869 AFC facilities but no capacity report in the one to three licensing range.
(3) Listed capacity is a count of units, not of beds.
(4) Ohio reported 80 facilities and 160 capacity in the 1 - 2 licensing range and 407 facilities and 1,916 capacity in the 3 - 6 licensing range in 2009. The latter appear to be categorized as adult family homes, and counts were available for 2007.
(5) In 2010, Virginia reported counts for "residential care facilities (MH) and (ID)." These facilities were excluded from the State LTSS Scorecard assisted living counts since they serve populations other than older people and adults with physical disabilities.
INSI
GH
T on
the
Issu
es