Embed Size (px)
Citation preview


Table of Contents
© 2012 National Research Corporation
INTRODUCTION
• PopulationProjectionHighlights
OVERVIEWANDDATABASE
• Overview
• Database
• Characteristics
i. Customers
ii. Employees
CUSTOMERSATISFACTION
• Overview
• AreasofGreatestandLeastSatisfaction
WORKFORCESATISFACTION
• Overview
• AreasofGreatestandLeastSatisfaction
DEEPERANALYSIS
• Overview
• PerformanceRelationships
• UnderstandingtheFeedback
• IdentifyingDriversofRecommendationScores
• RangeofPerformance
CONCLUSION

© 2012 National Research Corporation
INTRODUCTION
• Introduction
• PopulationProjectionHighlights
© 2012 National Research Corporation
2
Introduction
INTRODUCTION
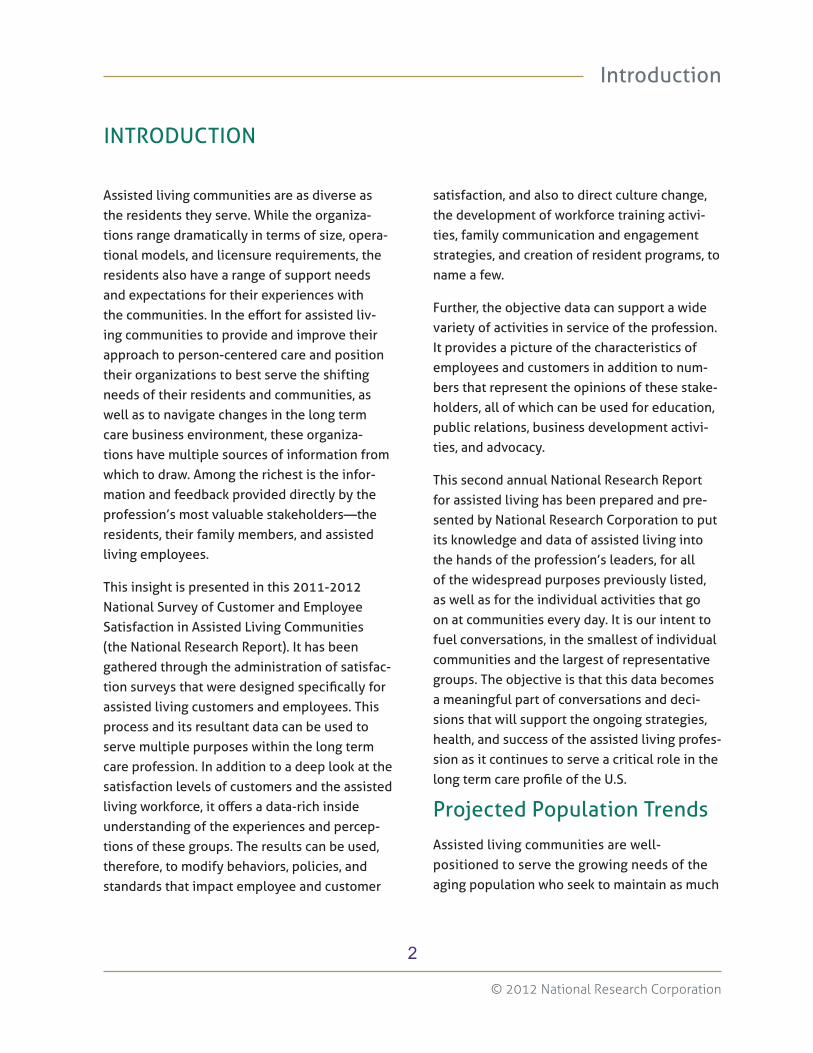
Assistedlivingcommunitiesareasdiverseastheresidentstheyserve.Whiletheorganiza-tionsrangedramaticallyintermsofsize,opera-tionalmodels,andlicensurerequirements,theresidentsalsohavearangeofsupportneedsandexpectationsfortheirexperienceswiththecommunities.Intheeffortforassistedliv-ingcommunitiestoprovideandimprovetheirapproachtoperson-centeredcareandpositiontheirorganizationstobestservetheshiftingneedsoftheirresidentsandcommunities,aswellastonavigatechangesinthelongtermcarebusinessenvironment,theseorganiza-tionshavemultiplesourcesofinformationfromwhichtodraw.Amongtherichestistheinfor-mationandfeedbackprovideddirectlybytheprofession’smostvaluablestakeholders—theresidents,theirfamilymembers,andassistedlivingemployees.
Thisinsightispresentedinthis2011-2012NationalSurveyofCustomerandEmployeeSatisfactioninAssistedLivingCommunities(theNationalResearchReport).Ithasbeengatheredthroughtheadministrationofsatisfac-tionsurveysthatweredesignedspecificallyforassistedlivingcustomersandemployees.Thisprocessanditsresultantdatacanbeusedtoservemultiplepurposeswithinthelongtermcareprofession.Inadditiontoadeeplookatthesatisfactionlevelsofcustomersandtheassistedlivingworkforce,itoffersadata-richinsideunderstandingoftheexperiencesandpercep-tionsofthesegroups.Theresultscanbeused,therefore,tomodifybehaviors,policies,andstandardsthatimpactemployeeandcustomer
satisfaction,andalsotodirectculturechange,thedevelopmentofworkforcetrainingactivi-ties,familycommunicationandengagementstrategies,andcreationofresidentprograms,tonameafew.
Further,theobjectivedatacansupportawidevarietyofactivitiesinserviceoftheprofession.Itprovidesapictureofthecharacteristicsofemployeesandcustomersinadditiontonum-bersthatrepresenttheopinionsofthesestake-holders,allofwhichcanbeusedforeducation,publicrelations,businessdevelopmentactivi-ties,andadvocacy.
ThissecondannualNationalResearchReportforassistedlivinghasbeenpreparedandpre-sentedbyNationalResearchCorporationtoputitsknowledgeanddataofassistedlivingintothehandsoftheprofession’sleaders,forallofthewidespreadpurposespreviouslylisted,aswellasfortheindividualactivitiesthatgoonatcommunitieseveryday.Itisourintenttofuelconversations,inthesmallestofindividualcommunitiesandthelargestofrepresentativegroups.Theobjectiveisthatthisdatabecomesameaningfulpartofconversationsanddeci-sionsthatwillsupporttheongoingstrategies,health,andsuccessoftheassistedlivingprofes-sionasitcontinuestoserveacriticalroleinthelongtermcareprofileoftheU.S.
ProjectedPopulationTrends
Assistedlivingcommunitiesarewell-positionedtoservethegrowingneedsoftheagingpopulationwhoseektomaintainasmuch
© 2012 National Research Corporation
3
Introduction
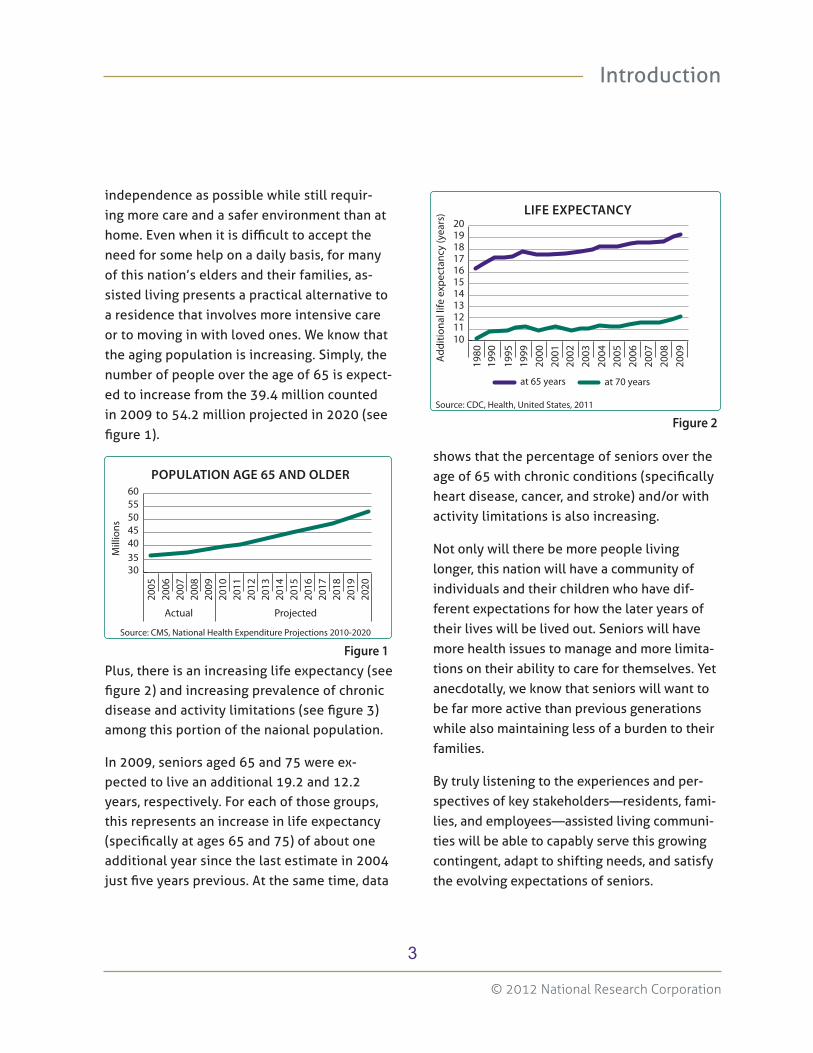
showsthatthepercentageofseniorsovertheageof65withchronicconditions(specificallyheartdisease,cancer,andstroke)and/orwithactivitylimitationsisalsoincreasing.
Notonlywilltherebemorepeoplelivinglonger,thisnationwillhaveacommunityofindividualsandtheirchildrenwhohavedif-ferentexpectationsforhowthelateryearsoftheirliveswillbelivedout.Seniorswillhavemorehealthissuestomanageandmorelimita-tionsontheirabilitytocareforthemselves.Yetanecdotally,weknowthatseniorswillwanttobefarmoreactivethanpreviousgenerationswhilealsomaintaininglessofaburdentotheirfamilies.
Bytrulylisteningtotheexperiencesandper-spectivesofkeystakeholders—residents,fami-lies,andemployees—assistedlivingcommuni-tieswillbeabletocapablyservethisgrowingcontingent,adapttoshiftingneeds,andsatisfytheevolvingexpectationsofseniors.
independenceaspossiblewhilestillrequir-ingmorecareandasaferenvironmentthanathome.Evenwhenitisdifficulttoaccepttheneedforsomehelponadailybasis,formanyofthisnation’seldersandtheirfamilies,as-sistedlivingpresentsapracticalalternativetoaresidencethatinvolvesmoreintensivecareortomovinginwithlovedones.Weknowthattheagingpopulationisincreasing.Simply,thenumberofpeopleovertheageof65isexpect-edtoincreasefromthe39.4millioncountedin2009to54.2millionprojectedin2020(seefigure1).
Plus,thereisanincreasinglifeexpectancy(seefigure2)andincreasingprevalenceofchronicdiseaseandactivitylimitations(seefigure3)amongthisportionofthenaionalpopulation.
In2009,seniorsaged65and75wereex-pectedtoliveanadditional19.2and12.2years,respectively.Foreachofthosegroups,thisrepresentsanincreaseinlifeexpectancy(specificallyatages65and75)ofaboutoneadditionalyearsincethelastestimatein2004justfiveyearsprevious.Atthesametime,data
Figure 1
POPULATION AGE 65 AND OLDER
30354045505560
2005
2006
2007
2008
2009
2010
2011
2012
2013
2014
2015
2016
2017
2018
2019
2020
Actual
Mill
ions
Projected
Source: CMS, National Health Expenditure Projections 2010-2020
Figure 2
LIFE EXPECTANCY
1011121314151617181920
1980
1990
1995
1999
2000
2001
2002
2003
2004
2005
2006
2007
2008
2009
at 65 years at 70 years
Add
ition
al li
fe e
xpec
tanc
y (y
ears
)
Source: CDC, Health, United States, 2011

© 2012 National Research Corporation
4
Introduction
1997-1998(1997*)
1999-2000(2000*)
2007-2008(2009*)
2009-2010(2010*)
SELF-REPORTED CHRONIC CONDITIONS AND ACTIVITY LIMITATIONS
Figure 3
0% 10% 20% 30% 40%
At least one complexactivity limitation*
At least one basicaction di�cult*
75+ years
65-74 years
75+ years
65-74 years
75+ years
65-74 years
Adu
lts
65
and
olde
rSt
roke
Canc
erH
eart
D
isea
se
Source: CDC, Health, United States, 2011
*Thedatesforthechronicconditionreportingaretherangesshown,thedatesassociatedwiththeactivitylimitationsarethesingleyearsshowninparentheses.

© 2012 National Research Corporation
OVERVIEWANDDATABASE
• Overview
• Database
• Characteristics
i. Customers
ii.Employees

© 2012 National Research Corporation
6
The2011-2012NationalSurveyofCustomerandEmployeeSatisfactioninAssistedLiv-ingCommunities(NationalResearchReport)presentsfeedbackandinsightsgatheredfromresidents,families,andemployeesofassistedlivingcommunitiesthroughsurveysadminis-teredbyNationalResearchCorporationthroughitsMyInnerViewproductline.
Thesesurveyscollectinformationtosupportassistedlivingorganizationsintheeverydayworktouseanevidence-basedunderstandingtoimprovetheirabilitiestoofferasafe,person-centeredenvironmentforresidents.Theseareoftenreferredtoas“satisfactionsurveys”butincludeafarmorediverseassessmentoftheresident,family,andemployeeexperienceofanassistedlivingcommunitythanbasicsatis-factionmeasurement.Thecustomersurveys,administeredtoresidentsandfamilymembers,include34questionsonavarietyoftypesofinteractionswiththeorganization,frombillingaccuracytocareandconcernofthestaff.Theemployeesurveysinclude21questionsrangingfromcomparisonofpaytoqualityofteamwork.
Overview and Database
OVERVIEWANDDATABASE
Bothsetsofdatacanbeusedbythelongtermcareorganizationstoobjectivelycollectandunderstandtheperspectivesoftheseindividu-als,evaluatetheeffectivenessofstandardsandprogramsinplace,andmeasuretheimpactofchangeswithintheorganization.Communitiesfurtherusetheseinsightstodirectfutureef-fortsaroundperformanceimprovement,em-ployeeengagement,customercommunication,publicoutreach,andmanyothergoals.
NationalResearchCorporationhoststhelargestcollectionofdatareflectiveoftheviewsandopinionsofresidents,families,andemployeesacrossthelongtermcarespectrum,includingskillednursinghomes,assistedandindepen-dentlivingcommunities,adultdayfacilities,homehealthagencies,andcontinuingcareretirementcommunities(CCRCs).Thisreportincludesobservationslimitedtoassistedlivingcommunities,drawingondatafromthe2011MyInnerViewcustomer(residentandfamily)experienceandemployeeengagementproductdatabaseaswellasfrompubliclyavailabledatareleasedfromtheCentersforMedicareand
0 5,,000 10,000 15,000 20,000 25,000
Personal Care
Nurse
Other
Family
Resident43,723Customer Responses
19,581Employee Responses
Figure 4
SURVEY PARTICIPANTS
22,349
21,374
10,329
4,114
5,138

© 2012 National Research Corporation
7
CharacteristicsofCustomers
DataonthedemographiccharacteristicsofthecustomersprovidescontextwithwhichtoframeinterpretationoftheresultsoftheNationalRe-searchReportanalysis.Theresidentageandthelengthofresidenceinformourunderstandingoftheindividualslivingintheassistedlivingcom-munitiesandthetenureoftheirrelationshipswiththeorganizations.Theoverviewofthetypeofrelationshipthefamilymembershareswiththeresidentandthefrequencyoftheirvisitstellsmoreabouttheperspectivesofthoserespondingtothesurvey.Thesedemographicsarealmostidenticaltothosereleasedinlastyear’sreport,withjusta1%residentshiftfromthe“under60”agegrouptothe“90orolder”agegroup,andasimilar1%familyshiftfromsiblingtospouserelationships.
• Morethan4outofevery5residents(82%)are80yearsofageorolder(seefigure6).
• Residentsaregroupedrelativelyevenlyintothreecategoriesbasedonhowlongtheyhavelivedinthecommunity—31%
Overview and Database
MedicaidServices(CMS)andtheCentersforDiseaseControl(CDC).
Database
InoursecondyearofreleasingthisNationalResearchReportforassistedliving,thevolumeofcommunities,customers,andemployeesrep-resentedcontinuestogrow.Thisyear’sreportincludes1,513assistedlivingcommunities,a12%increasefromthe2010-2011report.Thisalsoincludesresultsfromnearly20,000em-ployees(50%morethaninthepreviousyear)andalmost44,000customers,whichisa23%increase(seefigure4).Residentsmakeupjustoverhalfofthecustomerdatabase,whilenurs-ingandpersonalcarestaffcomprisejustunderhalfoftheworkforcefeedback.
Nearlytwicethenumberofindividualsreceivedsurveysandhadtheopportunitytohavetheirvoicesheard.Theresponserateforthefamilysurveyswas44%,whiletheresponseratesforresidentsandemployeeswereidenticalat58%(seefigure5).
Figure 5
RESPONSE RATES
0
10%
20%
30%
40%
50%
60%
Employee
Resident
Family
44%
58% 58%
Figure 6
RESIDENT AGES
90 or older
80-89
70-79
60-69
less than 6049%
33%
12%
4%2%
© 2012 National Research Corporation
8
CharacteristicsofEmployees
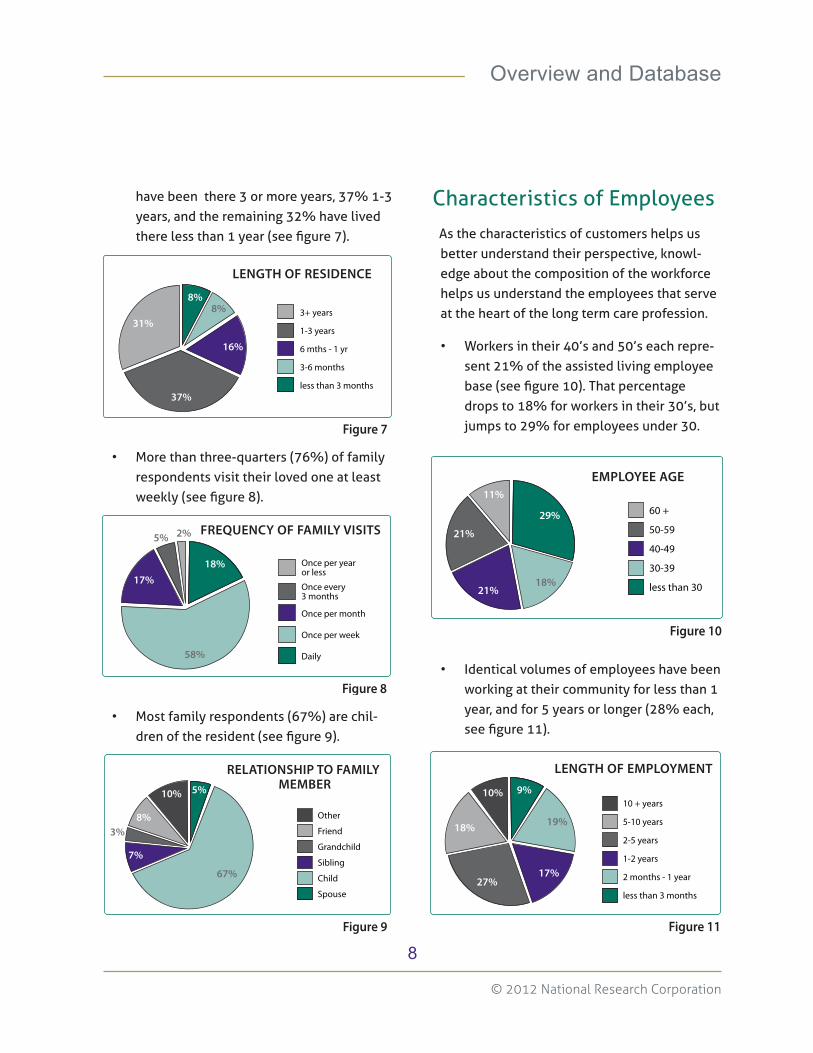
Asthecharacteristicsofcustomershelpsusbetterunderstandtheirperspective,knowl-edgeaboutthecompositionoftheworkforcehelpsusunderstandtheemployeesthatserveattheheartofthelongtermcareprofession.
• Workersintheir40’sand50’seachrepre-sent21%oftheassistedlivingemployeebase(seefigure10).Thatpercentagedropsto18%forworkersintheir30’s,butjumpsto29%foremployeesunder30.
• Identicalvolumesofemployeeshavebeenworkingattheircommunityforlessthan1year,andfor5yearsorlonger(28%each,seefigure11).
havebeenthere3ormoreyears,37%1-3years,andtheremaining32%havelivedtherelessthan1year(seefigure7).
• Morethanthree-quarters(76%)offamilyrespondentsvisittheirlovedoneatleastweekly(seefigure8).
• Mostfamilyrespondents(67%)arechil-drenoftheresident(seefigure9).
Overview and Database
Figure 7
LENGTH OF RESIDENCE
3+ years
1-3 years
6 mths - 1 yr
3-6 months
less than 3 months
8%8%
16%
37%
31%
Figure 8
FREQUENCY OF FAMILY VISITS
Once per year or less
Once every 3 months
Once per month
Once per week
Daily58%
17%18%
5% 2%
Figure 9
RELATIONSHIP TO FAMILY MEMBER
Other
Friend
Grandchild
Sibling
Child
Spouse
67%
7%
8%
10% 5%
3%
Figure 10
EMPLOYEE AGE
60 +
50-59
40-49
30-39
less than 3018%
29%
11%
21%
21%
Figure 11
LENGTH OF EMPLOYMENT
10 + years
5-10 years
2-5 years
1-2 years
2 months - 1 year
less than 3 months
18%
27%17%
19%
9%10%

© 2012 National Research Corporation
9
Thisdemonstratesthatwhileagoodportionoftheassistedlivingworkforceexperiencesturnover,anequalportionhasconsiderabletenureandexperience.
• Oftherespondentswhoprovidedtheirjobcategory,personalcareemployeesarethemostrepresentedasasingleworkgroupinthissurvey(30%),andnursesthesecondmost(24%,seefigure12).
Overview and Database
Figure 12
JOB CATEGORY
Other
Activities
Administration
Housekeeping/maintenanceFood
Personal Care
Nurse
24%
17% 30%
9%
10%
4% 6%
Figure 13
HOURS WORKED PER WEEK
Fewer than 10
10-20
20-30
30-40
40 or more57%
14%
10% 15%
4%
• Justoveroneinfouremployees(28%)workfewerthan30hoursperweek(seefigure13).
© 2012 National Research Corporation
CUSTOMERSATISFACTION
• Overview
• AreasofGreatestandLeastSatisfaction

© 2012 National Research Corporation
12
CustomerSatisfaction
CUSTOMERSATISFACTION
lowestin2007.Duetothedramaticincreaseinparticipationinstandardizedsatisfactionsurveyingamongassistedlivingcommunitiesinthelasttwoyears,itisplausibletopresentthehistoricalinformationforaframeofreference,butNationalResearchcautionsagainstusingittodrawjudgmentsaboutchangesinresidentandfamilyexperiencesandperceptions.
AreasofGreatestandLeastSatisfaction
Bothresidentsandfamilymembersgaveassist-edlivingcommunitiesanoverallpositiveratingmorethan90%ofthetime.Whenlookingatresidentandfamilyexperiencesandsatisfac-tionwithindividualaspectsoftheircommuni-ties,however,thatratingfluctuates.Atthehighend,96%offamiliesprovidepositivefeedbackabouttherespectfulnessofstaff,butonly72%ofresidents,onthelowend,providepositivefeedbackabouttheappealoffood(28%ofthetimesayingthatitisonlyfairorpoor).
Asawhole,customers(bothresidentsandfami-lies)providehighmarkstotheirassistedlivingcommunitiesinoverallsatisfaction.Morethan90%ofeachgroupsaidoverallsatisfactionis“good”or“excellent”andthattheywouldrecommendtheircommunitiesasa“good”or“excellent”placetolive(seefigure14).Feed-backisslightlymorepositivefromfamilymem-bers,especiallywhenlookingatthe“excellent”rating.
Feedbackfromresidentsandfamilymembershasbeenconsistentlyhighduringthe6yearsthatNationalResearchCorporationhascollect-edinformationfromthiscontingent(seefigure15).Thecumulativepositiveratingof91%fromresidentsisslightlyupfromlastyear’sreport,whilethefamilyrating(92%)isalittledown.Whenreviewingscoresfromeachoftheprevi-ousyears,satisfactionpeakedin2009withnumbersthatarejustslightlyhigherthanwhatwasmeasuredin2011.Satisfactionscoreswere
0%
20%
40%
60%
80%
100%
FamilyResidentFamilyResident
Overall Satisfaction Recommendationto others
Figure 14
OVERALL CUSTOMER SATISFACTIONSCORES
Good Excellent
46%
45%
44%
48%
42%
49%
41%
51%
Figure 15
CUSTOMER SATISFACTION TRENDS
84%86%88%90%92%94%96%98%
100%
*Fewer than 30,000 customers represented2006* 2007* 2008* 2009* 2010 2011
ResidentFamily

© 2012 National Research Corporation
13
“Excellent”ratingshelptounderstandwherecommunitiestrulyexcelintheeyesofcustom-ers,whohaveagreatlevelofagreementontheseopinions.Familiesandresidentsalikecited“respectfulnessofstaff,”“safetyoffacil-ity,”and“courteousnessofdiningstaff”asthethreeareaswhereassistedlivingcommunitiesaremostsuccessful(seefigure16).“Excellent”scoresrangedbetween55%and65%forthesethreeitems.
Ontheotherhand,thereisaslightdisagree-mentaboutwherecommunitiesareleastsuc-cessful.Residentsandfamilieswereleastim-pressedwith“comparisonofcharges”(28%and27%,respectively).Residentsprovidedfeedbackthat“adequacyofstoragespace”wastheareasecondtothebottomintermsofexcellenceat28%.Familiesweremoderatelylesstroubledbythisissue,placingitfourth
CustomerSatisfaction
fromthebottomofthelistat34%.“Growasapersonopportunities”wasthesecondleastsuccessfulareaofoperationsfromtheper-spectiveoffamilies(30%excellent)andthirdleastforresidents(alsoat28%).
Thescoresfortheseareasofsatisfactionhavenotchangeddramaticallysincetheresearchconductedforlastyear’sreport.Theresidents’ratingsintopperformingareaswereoneortwopointshigherthisyearthanlast;thefami-lies’ratingswereevenfor“respectfulnessofstaff,”downby1%for“safetyoffacility,”andup1%for“courteousnessofdiningstaff.”Thelowerperformingareashadmoreconsistentimprovement–allofthe“excellent”scoreswereupforbothresidentsandfamiliesby1%or2%,exceptfor“comparisonofcharges,”whereresidents’satisfactionincreasedfrom25%to28%.
Figure 16
AREAS OF HIGHEST AND LOWEST CUSTOMER SATISFACTION
0% 10% 20% 30% 40% 50% 60%
Comparison of charges
Adequacy of storage space
Courteousness of dining sta�
“Grow as a person” opportunities
Respectfulness of sta�
Safety of facilityHighestSatisfaction
LowestSatisfaction
% “Excellent” ScoresResident Family

© 2012 National Research Corporation
WORKFORCESATISFACTION
• Overview
• AreasofGreatestandLeastSatisfaction

© 2012 National Research Corporation
16
AreasofGreatestandLeastSatisfaction
Employeerecommendationsofassistedlivingcommunitiesasaplacetoreceivecareappearsinthe“excellent”and“good”categoriesatahigherlevel.Morethan40%ofallthreegroupswouldrecommendtheircommunitiesasan“excellent”placetoreceivecareandmorethan80%offerapositiverecommendation.
Thedifferentcategoriesofemployeesmaynotsharetheexactsamescores,butthefeedbackisconsistent(seefigure18).Whenlookingattheareasofperformancewhereemployeeshadgiventheircommunitiesthehighestandlowest“excellent”scores,thelistsareidentical.Allthreelistsinclude“senseofaccomplishment,”
WorkforceSatisfaction
WORKFORCESATISFACTION
Feedbackfromemployeesislessglowingthanthatprovidedbycustomers,yetpositiveinmanyareas.Regardlessofthebusiness,itiscommonforemployeesatisfactiontobelowerthancustomersatisfaction.Itcanbeeasytolookpastthechallengingresponsesthatareof-feredandtodismissthemforonereasonortheother.Theopinionsvoicedthroughthisprocess,however,provideusefulandclearinformationaboutwhatorganizationsandleaderscandotoimprovetheworkingenvironmentandtherelationshipswiththepeoplewhoholdsomuchresponsibilityforthesuccessfuloperationofassistedlivingcommunities.Employeesarenotonlygettingthingsdoneeveryday,theyarecreatingexperiencesforresidentsandfamiliesandtherebyidentifyingtheassistedlivingcom-munityinthemind’seyeforthoseindividuals.
Forthesakeofthisanalysis,employeeshavebeendividedbroadlyintothreegroups:nurses,personalcare,andthefullworkforce.Eachgrouptellsapartofthestorythatcanbecombinedtoinformemployeeengagementandprogramefforts.Feedbackisoftensimilar,butsometimesdifferent.
Nurses,personalcareemployees,andthewhole
workforcehavesimilarlevelsofpositivefeedback(combined“good”and“excellent”responses)foroverallsatisfactionandrecom-mendationofthecommunityasaplacetowork.
Scoresrangefrom66%foroverallsatisfactionofpersonalcareemployees(slightlyhigherat67%forpersonalcareemployees’recom-mendation)to72%fortheentireworkforce’sresponsetobothquestions(seefigure17).
Entir
e w
orkf
orce
Pers
onal
car
e
Nur
ses
Entir
e w
orkf
orce
Pers
onal
car
e
Nur
ses
Entir
e w
orkf
orce
Pers
onal
car
e
Nur
ses
Figure 17
OVERALL EMPLOYEE SATISFACTION SCORES
Overall Satisfaction
Recommendationfor job
Recommendationfor care
Good Excellent
0%
20%
40%
60%
80%
100%
47%
23%
43%
23%
46%
26%
43%
28%
40%
27%
42%
30%
42%
41%
40%
40%
40%
42%
Nursesfellbetweenthetwosetsofscores,of-feringa70%positiveoverallsatisfactionscoreand71%positiverecommendationforthejob.

© 2012 National Research Corporation
17
“respectfulnessofstaff,”and“care(concern)ofsupervisor”withthehighest“excellent”scores,rangingfrom35%(“care(concern)ofsupervi-sor”forpersonalcare)to51%(thefullwork-force’s“senseofaccomplishment”).
Thethreegroupsofemployeesarealsochal-lengedbythesamethreeareas:“comparisonofpay,”“assistancewithjobstress,”and“compari-sonofbenefits.”Therangeof“excellent”scores
WorkforceSatisfaction
0% 10% 20% 30% 40% 50% 60%
Comparison of pay
Assistance with job stress
Care (concern) of supervisor
Sense of Accomplishment
Figure 18
AREAS OF HIGHEST AND LOWEST EMPLOYEE SATISFACTION
HighestSatisfaction
LowestSatisfaction
% “Excellent” ScoresNurses Personal Care Entire Workforce
forthesethreeitemsspansfrom9%(“compar-isonofpay”forpersonalcare)to16%(“com-parisonofbenefits”fortheentireworkforce).Despitetheverylowscoresineachoftheseareas,asdiscussedinthenextsection,noneareamongthosemosttightlytiedtotheglobalsat-isfaction“recommendationasaplacetowork,”whichmayprovideinsightintotherelativeimportanceoftheseareastoemployees.

© 2012 National Research Corporation
DEEPERANALYSIS
• Overview
• PerformanceRelationships
• UnderstandingtheFeedback
• IdentifyingDriversofRecommendationScores
• RangeofPerformance

© 2012 National Research Corporation
20
DeeperAnalysis
DEEPERANALYSIS
Thiswasevaluatedthisbygroupingassistedlivingcommunitiesintofourquartilesbasedoneitheremployeeorfamilyscoresandthencalculatingtheaveragefamilyorresident
satisfactionscoreforeachgroup.Thisanaly-sisprovidestwoaffirmations.First,organiza-tionsthattendtoexcelinoneareaalsotendtoexcelintheother.Second,thereisevidencetoemphasizetheimportanceoffocusingonemployeesatisfactionandengagement,evenifanorganization’spriorityisresidentandfamilysatisfaction.
UnderstandingtheFeedbackofSpecificGroupsofIndividuals
Anotherwaytodigintothedataistoevaluatetrendsinsatisfactionbysubsetsofthecus-tomeroremployeepopulation.Forexample,satisfactiontendstopeakwhentheresident
Asweseektobetterunderstandresident,fam-ily,andemployeeexperienceswithassistedlivingcommunities,thereareseveralwaystodelveintothedatatofurtherexploretherelationshipsandthestorieshiddeninsidethenumbers.
PerformanceRelationships
Thefirstthingaboutsatisfactionscores,ingeneral,isthattheytendtomovetogetherandtheytendtomovewithotherqualityindicators.Wehaveseenthisphenomenoninmultipleset-tingsofhealthcare.
Intheassistedlivingprofessionspecifically,thesametrendsexist.Communitieswithhigheraverageemployeesatisfactionscorestendtohavehigheraveragefamilysatisfactionscores,andcommunitieswithhigherfamilysatisfactionscorestendtohavehighercustomersatisfac-tionscores(seefigures19and20).
COMMUNITIES WITH HIGHER EMPLOYEE SATISFACTION HAVE HIGHER
FAMILY SATISFACTION
Communities Grouped By AverageEmployee Satisfaction
Aver
age
Fam
ily S
atis
fact
ion
68
72
76
80
4th Quartile
3rd Quartile
2nd Quartile
1st Quarti
le
77
8183
73
70
74
78
8284
Figure 19
COMMUNITIES WITH HIGHER FAMILYSATISFACTION HAVE HIGHER
RESIDENT SATISFACTION
Communities Grouped By AverageFamily Satisfaction
Aver
age
Resi
dent
Sat
isfa
ctio
n68
72
76
80
4th Quartile
3rd Quartile
2nd Quartile
1st Quarti
le
7981
84
75
70
74
78
8284
Figure 20

© 2012 National Research Corporation
21
IdentifyingDriversofRecommendationScores
Perhapsthemostmeaningfulwaytotrulyun-derstandexperienceandsatisfactiondata,andtohoneinonareasofinteractionandsupportthataremostmeaningfultokeystakeholders,istocorrelateanalysisthatidentifiesthedriversofoverallsatisfaction.Thatis,findthespecificareasofmeasurementthattrendmostcon-sistentlywithglobalmeasuresofsatisfaction.Thiscanrevealwheretofocusperformanceimprovementeffortsonareasthatwillhavethegreatestimpact.
ToconductthisanalysisfortheNationalReseachReport,individualquestionsinthesur-veyswerecorrelatedwithtwoglobalmeasures:recommendationasaplacetoreceivecareforcustomers(residentsandfamilies),andrecom-mendationasaplacetoworkforemployees.
DeeperAnalysis
hasbeeninthecommunitybetween1and3months(seefigures21and22),whichappliestoeitherresidentorfamilysatisfaction.Bothgroupsprovidethehighestpercentof“excel-lent”overallsatisfactionratingsatthattime(55%forresidentsand58%forfamilies).Wheretheresidentpositivesatisfactionscorealsopeaksduringthatwindow(at96%,drop-pingdownto92%formostotherlengthsofstay),thesamedropisnotseeninfamilyscores(thoseareandremainat93%,untilthepeak94%scoreat1-3years,andaslightdropto92%inthe3ormoreyearsgroup).
Thissortofsubsetanalysisshowssimilarlylimitedvariationinscoreswhenevaluatedatthenationallevel.Whenreviewedatthecom-munitylevel,however,itmayhighlightstrongorweakareasofperformancewithcertainpor-tionsofthecustomeroremployeepopulation,whichmayleadtoidentificationofrootcausesofdisappointmentsinsatisfactionscores.
0%
20%
40%
60%
80%
100%
3 or more years
1-3 years
6 mth
s - 1 year
3-6 month
s
1-3 month
s
less th
an 1 mth
Figure 21
RESIDENT SATISFACTION BY LENGTHOF RESIDENCE
Good Excellent
45%
44%
41%
55%
44%
48%
46%
44%
46%
46%
46%
46%
0%
20%
40%
60%
80%
100%
3 or more years
1-3 years
6 mth
s - 1 year
3-6 month
s
1-3 month
s
less th
an 1 mth
Figure 22
FAMILY SATISFACTION BY LENGTHOF RESIDENCE
Good Excellent
45%
43%
35%
58%
42%
51%
41%
51%
45%
49%
45%
47%

© 2012 National Research Corporation
22
Interestingly,neitherthehighestcorrelateditemsnorthelowestcorrelateditemsarerepetitiveoftheareasthatreceivethehighestandlowest“excellent”scoresonthesatisfac-tionsurvey.Itmaynotbeeasy,butthereisalmostcertainlyopportunitytofocusonthetopdriversofsatisfaction,improveinthoseareas,andindoingsoimprovecustomerrecommen-dationscores.
Thesameactivitywasappliedtounderstandwhatreallydrivesemployeesatisfactionwithassistedlivingcommunitiesasemployers,andleadsstafftobemorelikelytorecommendtheircommunitiesasaplacetowork.Again,therewasconsiderableconsistencyamongthedifferentgroupsofemployeesandallthreeidentifiedthesametopfourdriversofoverallsatisfaction:“care(concern)ofmanagement,”“attentivenessofmanagement,”“assistancewithjobstress,”and“clearexpectationsofmanagement”(seefigure24).Thesamethreeitemsarealsoseenasthoseleastcorrelatedwithoverallsatisfaction:“senseofaccomplish-ment,”“qualityofteamwork,”and“respectful-nessofstaff.”
Whilelookingatresidentsandfamilymembersseparately,itwasfoundthatthetopdriversofoverallsatisfactionwerealmostidentical.Thetopthreelistsforbothincluded“competencyofstaff,”“responsivenessofmanagement,”and“choices/preferences”(seefigure23).“Care(concern)ofstaff”wasfourthforresidentsandfifthforfamilies.Theitemsthatroundouteachlistofthetopfivediffer:“home-likeatmosphere”wasfifthforresidents(seventhforfamilies)and“responsivenessofstaff”wasfourthforfamilies(seventhforresidents).
Theitemsthatwereleastassociatedwithrec-ommendationwerethesameforbothgroups(althoughinslightlydifferentorders)andalsoprovidefurtherinsightintotheaspectsoftherelationshipsbetweenassistedlivingcommuni-tiesandtheircustomers(residentsandfami-lies)thatarelessmeaningfultothecustomersthemselves.Thisdoesn’tmakethemunimport-ant,justlesslikelytoinfluencehowacustomerthinksaboutanassistedlivingcommunityinaglobalway.Thethreeitemswiththelowestcorrelationscoreswere:“religious/spiritualop-portunities,”“adequacyofstoragespace,”and“controlofroomtemperature.”
DeeperAnalysis
Figure 24
TOP DRIVERS OF EMPLOYEE RECOMMENDATION
- Care (concern) of management
- Attentiveness of management
- Assistance with job stress
- Clear expectations by management
TOP DRIVERS OF CUSTOMER RECOMMENDATION
Figure 23
- Competency of staff
- Responsiveness of management
- Choices/preferences
- Care (concern) of staff
- Home-like atmosphere (5th for residents, 7th for families)
- Responsiveness of staff (4th for families, 7th for residents)

© 2012 National Research Corporation
23
DeeperAnalysis
Oneofthemostusefulthingsaboutunder-standingthebiggestdriversofsatisfactionisusingthoseareasasprioritiesforperformanceimprovementefforts.Especiallyforanorgani-zationoraleaderthatisunsurewheretostart,evaluatingperformanceinthesefourmeasuresandidentifyingwhichofferthemostopportu-nityforimprovement(eitherduetolowrelativescoreswithintheorganizationorlowscorescomparedagainstabenchmark)canhelpfocuseffortsnotonlyonmeasuresthatcouldbenefitfromimprovement,butthosethatwillalsohavethegreatestimpactonanindividual’soverallsatisfactionwiththecommunity.
RangeofPerformance
Onefrequentquestionandsubjectofconversa-tionwhenitcomestoperformanceimprove-mentactivitiesisaroundthepossiblescoresorlevelsofimprovementsthatorganizationscanreasonablyexpecttoachieve.Inthisyear’sNationalResearchReportforassistedliving,weprovidepartialanswerstothosequestionsintheformofdataaroundthe“topquartile”levelofperformanceamongindividualcommunitiesincludedinthesurveydatabase.Thatistosay,wehaveidentifiedthescoresthatatleastoneoutofeveryfourcommunitieshaveachievedorexceeded(seefigures25and26).Whenitcomestoemployeesatisfaction,25%ofcom-munitiesearnedatleasta35%“excellent”scoreandan86%“excellent”or“good”scoretotheoverallsatisfactionquestion.Theposi-tivebenchmarkisidenticalforthe“recommen-dationforjob”question,butthe“excellent”benchmarkis42%.
Unlikewiththecustomers,thereisconsiderableoverlapbetweenthetopandbottomdriversofsatisfactionandtheitemswiththehighestandlowestpercentof“excellent”scores.Infact,oneofthetopdriversofsatisfactionisoneareainwhichemployeesaremostsatisfied—“care(concern)ofmanagement”—andoneofthetopdriversofsatisfactionisoneoftheareasinwhichemployeesareleastsatisfied–“as-sistancewithjobstress.”Alsoworthnoting,twooftheitemsthatreceivethehighestpercent“excellent”scoresfromcustomersareactuallyamongthoseleastassociatedwithrecommen-dationscores—“senseofaccomplishment”and“respectfulnessofstaff.”
Again,justbecauseitemsarelesscorrelatedwithrecommendationresultsdoesn’tmeanthattheyareunimportant.Butitishelpfultoun-derstandthatsomeoftheareaswhereassistedlivingcommunitiesexcelasemployersarenotthesamefunctionsthataremostlikelytoresultinanemployeerecommendingtheorganizationasaplacetowork.
Theconsistentthemeinthetopdriversofem-ployeerecommendationistheroleofmanage-ment—concern,attentiveness,clearexpecta-tions,andsupportorassistancewithjobstressallspeaktotherelationshipthatemployeesfeeltheyhavewithmanagers.Itemphasizestheopportunitythatimprovedmanagementskills,activities,andbehaviorhavetoimpacttheworkenvironmentforemployees,therebyimprovingsatisfactionandcommitmenttotheorganiza-tion,andinturnhavingapositiveeffectonresidentexperienceswiththecommunity.

© 2012 National Research Corporation
24
Forcustomersatisfaction,atleastoneoutofeveryfourassistedlivingcommunitiesearneda100%positiveresponsefrombothresidentsandfamilymemberstoboththeoverallsatis-factionandtherecommendationmeasures.Forthehigher-levelscoreof“excellent”alone,thebenchmarksforthetopquartileperformersare57%fromresidentsforoverallsatisfactionand63%forrecommendationforcare,and63%fromfamiliesforoverallsatisfactionand67%forrecommendationforcare.
Thesescoresarenotseenasexclusivetoanelitefeworganizations—theyareveryreason-ablegoalsforcommunitiesthatalreadyexceedthenationalaveragebutdon’tmeettheselev-
elsofperformance.Itisalsoreasonableandadmirableforleaderstostriveforanevenmoreelitestandard.The90thpercentilesofperfor-mance—thelevelthatonly10%ofallassistedlivingcompaniesachieveorexceed—raisethebarto50%forexcellentand95%forpositiveoverallsatisfactionscoresfromemployees,andto54%excellentand96%positiverecom-mendationscoresfromemployees.The90thpercentilesofperformanceforcustomersatis-factionare75%excellentoverallsatisfactionfrombothresidentsandfamilies,and78%and79%excellentrecommendationscoresfromresidentsandfamilies,respectively,forrecom-mendationforcarescores.
Figures 25, 26
TOP QUARTILE EMPLOYEE SATISFACTION SCORES
0% 20% 40% 60% 80% 90%
Recommendationfor job
Overall Satisfaction
86%
42%
86%
35%
Excellent & Good
Excellent
TOP QUARTILE CUSTOMER SATISFACTION SCORES
Excellent & Good
Excellent
Overall Satisfaction
Recommendationfor care
Resident Family 20% 40% 60% 80% 100%
100%100%
100%100%
67%63%
63%57%
0%
Excellent & Good
Excellent
Excellent & Good
Excellent

© 2012 National Research Corporation
CONCLUSION

© 2012 National Research Corporation
26
Conclusion
Assistedlivingorganizationsplayauniqueandvitalroleinthelongtermcarecontinuum.Providingahome,services,andacommunitytoapproximately1millionpeople,givingthemaplacetomaintaintheirindependencealongwiththesupporttodoso,thesecommunitiesareoftenanoptimaloptionforseniorsandtheirfamilies.
Feedbackfromresidents,families,andem-ployeesprovidesleadersandadvocatesoftheassistedlivingprofessionunparalleledinsightintothevalueoftheirservices,plusopportu-nitiestocontinuetoimprovethoseservices,increasevalue,andboostconsumerperceptionsgoingforward.Thedevelopmentofanationaldatabaseofstandardizedsurveyresponsesforassistedlivingcommunitiesoffersasourceofknowledgeforcomparingtheresultsofindi-vidualorganizationsagainstpeers,offeringdata-richinsightsintothissegmentoflongtermcare,anddeeperlevelsofresearchintotheexpectationsandvaluesofassistedlivingcustomersandemployees.
Theentiretyofthisreportcreatestheopportu-nitytofuelimprovement.Individualcommuni-
CONCLUSION
tiescandiscoverwhatispossible,inadditiontowhattheyshouldbestrivingforincomparisontotheperformanceoftheirpeers.Managerscanidentifyhowimportanttheirroleandrelation-shipswithcustomersandemployeesareinthebiggerpicture,astimeandagainweseethatthewaymanagersandleadersinteractandre-spondtobothcustomersandemployeesdrivesoverallsatisfactionwithcommunities.Thoselookingoutforandleadingthedirectionoftheprofessionasawholegainmoredata,aclearerpictureofthepeopleaffectedbyassistedliving,andusethisinformationtoreinforceorganiza-tionaldecisionsandconversations.
Withamorecompleteunderstandingoftheexperiencesandperceptionsofemployeesandcustomers,assistedlivingproviderswillbebet-terpreparedbothtomaximizeeffortsaroundcreatingculturesofperson-centeredcareandadaptingtoshiftsinthehealthcarelandscapeduetoavarietyoffactorsthatimpacttheprofession.Inaddition,thisinformationcanbeusedtofurtherthecausesoftheassistedlivingprofession,fromstaffandcustomerengagementtopublicrelationsandadvocacy.

© 2012 National Research Corporation. All rights reserved. My InnerView is a product of National Research Corporation. My InnerView, the My InnerView logo, and the National Research Corporation logo are trademarks of National Research Corporation. All other trademarks mentioned herein are the property of their respective holders. All original data, analy-ses, and intellectual property presented herein cannot be duplicated or claimed as source material by parties other than National Research Corporation.
www.nationalresearch.com | [email protected] | 800.388.4264