Embed Size (px)
Citation preview
CEE 321: Formal Models For Design
John HaymakerAssistant ProfessorConstruction Eng. & MgmtCivil and Env. Eng.Stanford University
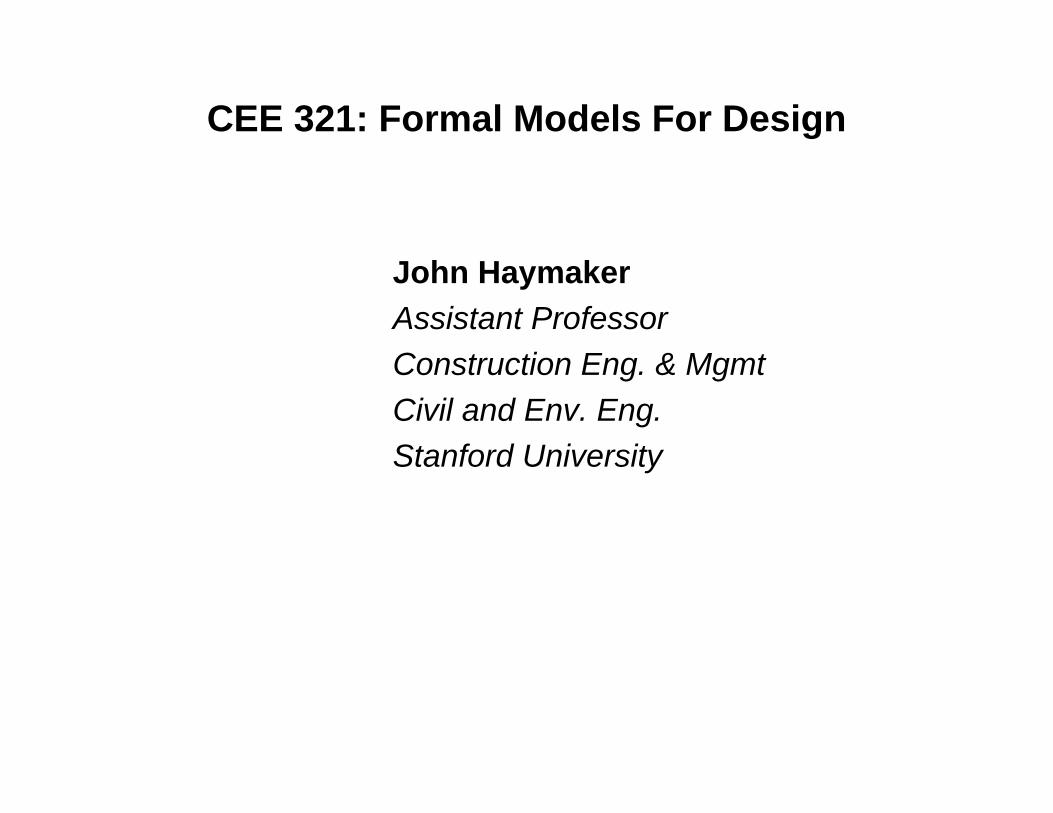
2 Problem: Informal Process
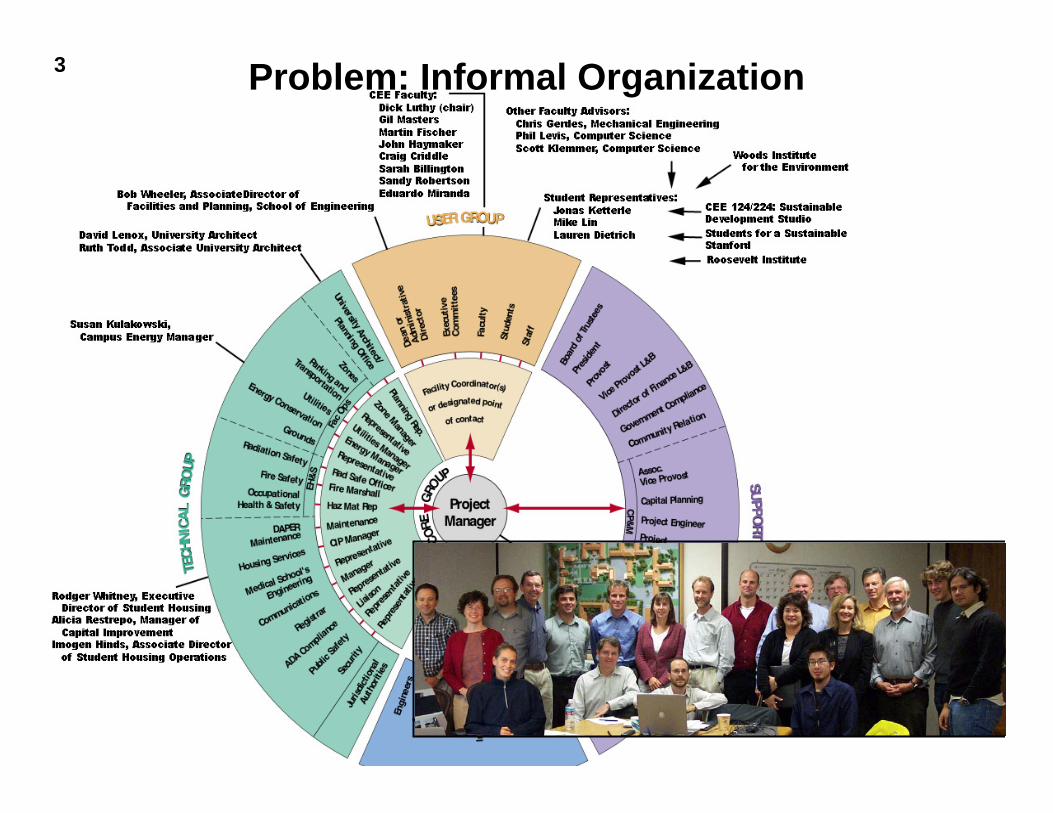
3 Problem: Informal Organization
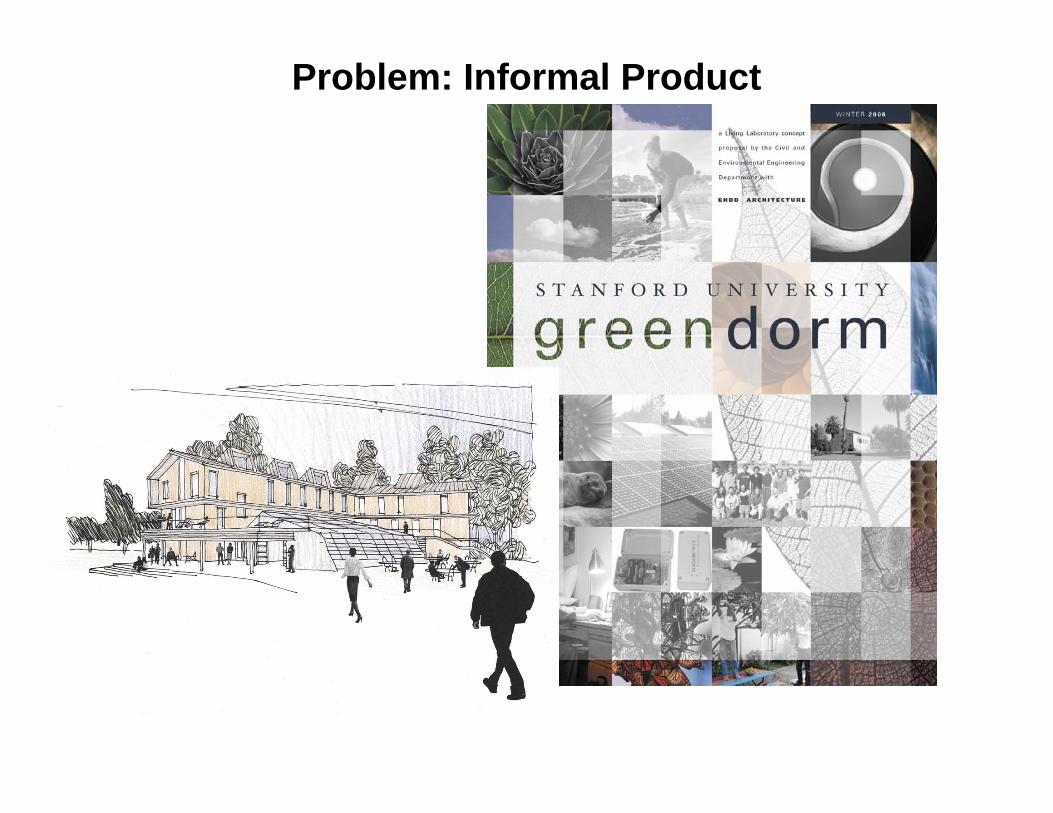
Problem: Informal Product

Problem: Informal Functions
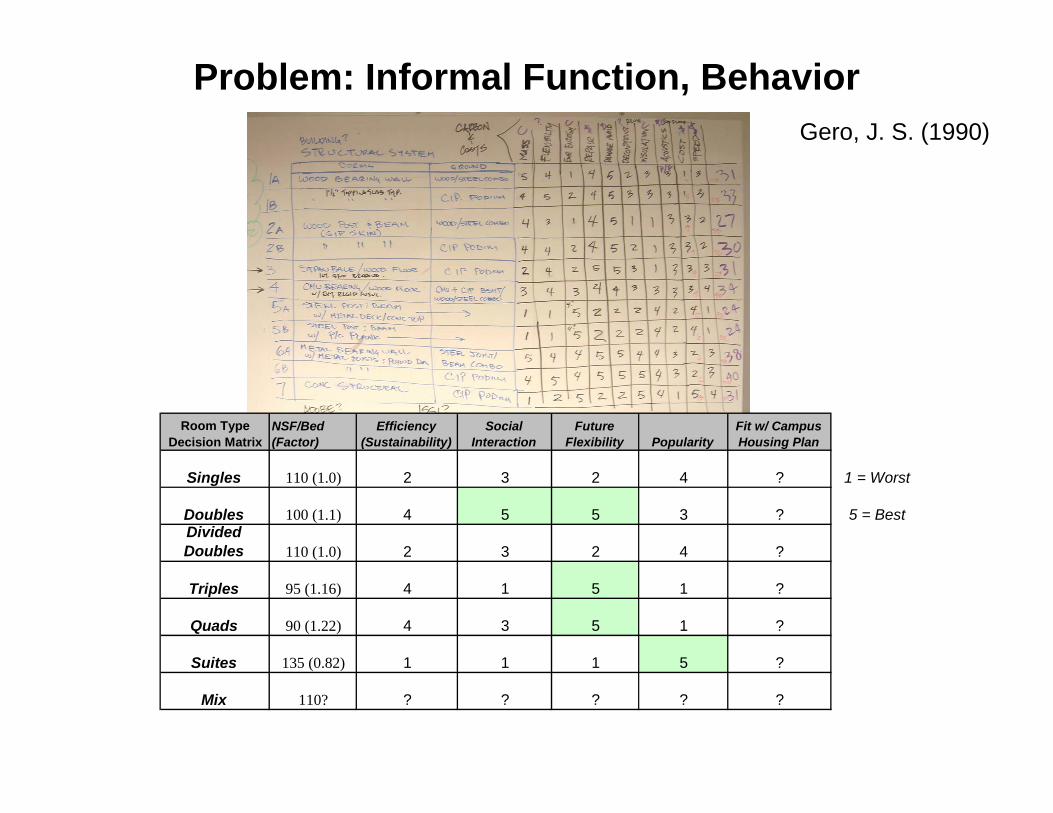
Room Type Decision Matrix
NSF/Bed (Factor)
Efficiency (Sustainability)
Social Interaction
Future Flexibility Popularity
Fit w/ Campus Housing Plan
Singles 110 (1.0) 2 3 2 4 ? 1 = Worst
Doubles 100 (1.1) 4 5 5 3 ? 5 = BestDivided Doubles 110 (1.0) 2 3 2 4 ?
Triples 95 (1.16) 4 1 5 1 ?
Quads 90 (1.22) 4 3 5 1 ?
Suites 135 (0.82) 1 1 1 5 ?
Mix 110? ? ? ? ? ?
Problem: Informal Function, Behavior Gero, J. S. (1990)

Impact of Lack of Formalization
• Communication– Speed and accuracy
• Integration– Speed and accuracy
• Performance– Single and multi-disciplinary
Drawings
Written Reports
Verbal Accounts
Presentations
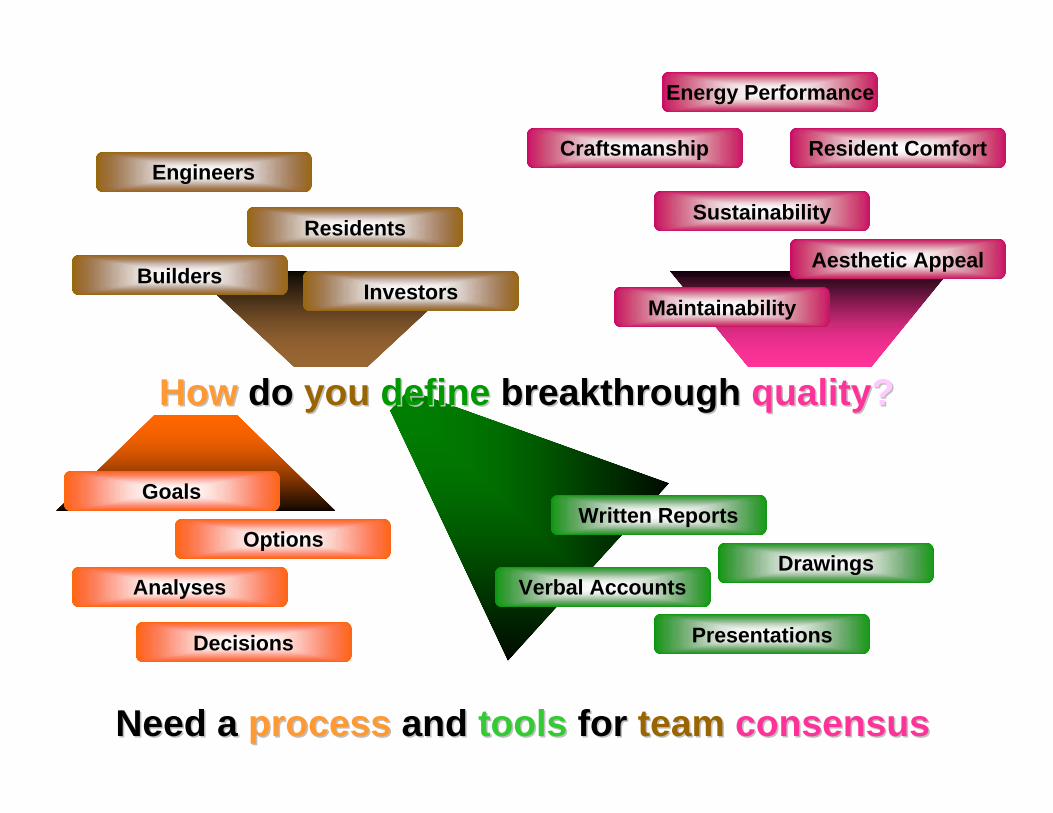
HowHow do do youyou definedefine breakthrough breakthrough qualityquality??
Residents
InvestorsBuilders
Engineers
Sustainability
Resident Comfort
Maintainability
Aesthetic Appeal
Energy Performance
Craftsmanship
Need a Need a processprocess and and toolstools for for teamteam consensusconsensus
Decisions
Analyses
Options
Goals

The Big Idea: MACDADIThe Big Idea: MACDADI
Decision Maker Decision MakerStakeholders
Engineers
Decision Maker Decision Maker
Stakeholders
Engineers
MACDADI
Typical Process
Proposed Process
MACDADI,Multi-Attribute Collective Decision Analysis* of Design Initiatives,adapts Management Science tools for the AEC Industry tohelp teams collaboratively choose the best building configurations.
* Keeney R., and Raiffa, H., (1976). “Decisions with Multiple Objectives: Preferences and Value Tradeoffs,” John Wiley and Sons, Inc.
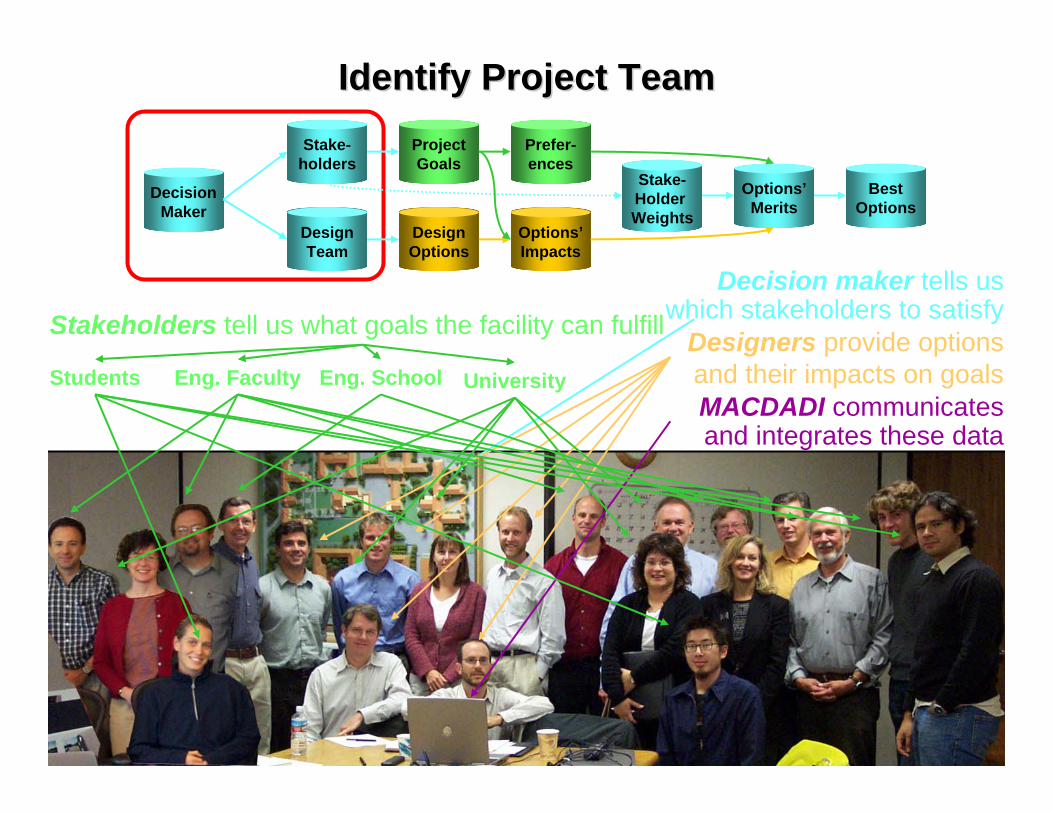
Identify Project TeamIdentify Project Team
Decision maker tells us which stakeholders to satisfy
Designers provide options and their impacts on goalsMACDADI communicates and integrates these data
Stakeholders tell us what goals the facility can fulfill
Students Eng. Faculty Eng. School University
DesignOptions
Stake-holders
Options’Impacts
Prefer-ences
BestOptions
Stake-Holder Weights
DecisionMaker
DesignTeam
Options’Merits
ProjectGoals
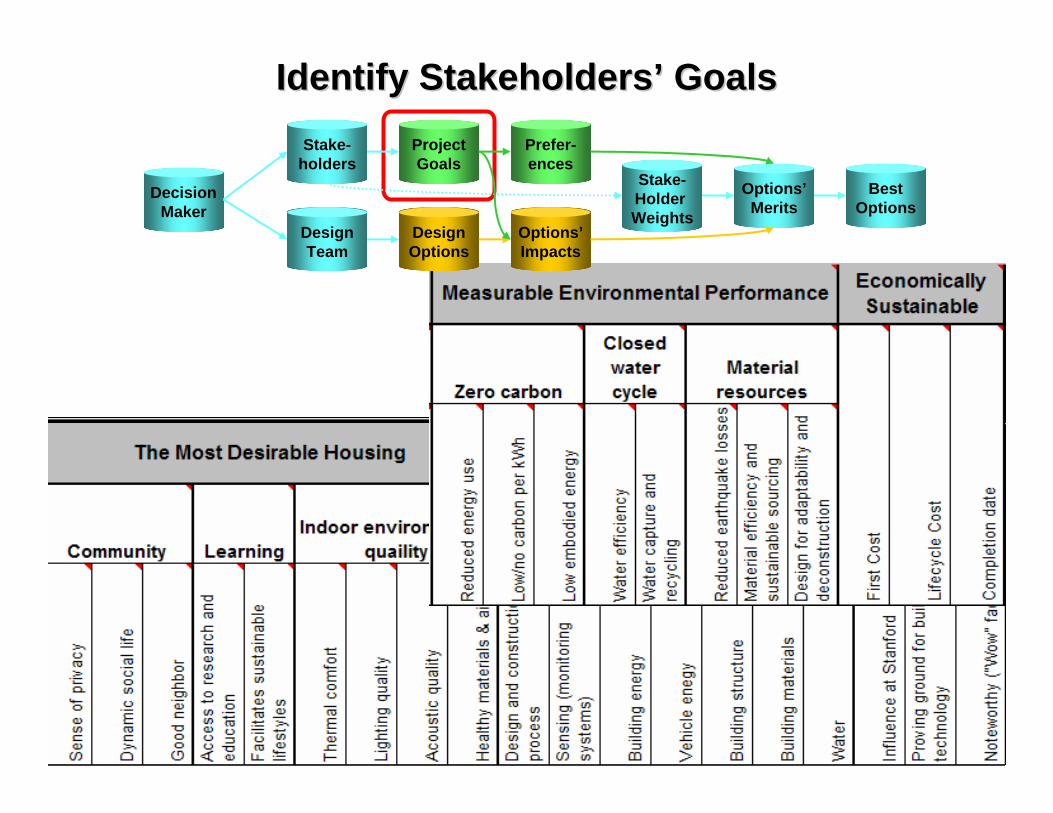
Identify StakeholdersIdentify Stakeholders’’ GoalsGoals
DesignOptions
Stake-holders
Options’Impacts
Prefer-ences
BestOptions
Stake-Holder Weights
DecisionMaker
DesignTeam
Options’Merits
ProjectGoals

StakeholdersStakeholders’’ PreferencesPreferences
Living
Laboratory : 33%
Environmental Performance : 30%
Economy: 9%
Desirable Housing: 28%
Community7%
H20Cycle7%
Material Use9%
Economy9% R: Materials
3%
Indoor Environment
13%
Demonstration13%
R: Process2%
R: Water4%
R: Sensing3%
Learning8%
Zero Carbon14%
R: Structure2%
R: Energy5%
R: Vehicle1%
DesignOptions
Stake-holders
Options’Impacts
Prefer-ences
BestOptions
Stake-Holder Weights
DecisionMaker
DesignTeam
Options’Merits
ProjectGoals
… it will be beneficial
… thank you for the good design of the survey.
Jonas, Stanford Undergraduate Student

Identify Design OptionsIdentify Design Options
This is great!!! Truly integrative design!!!
Ken Kortkamp PE, LEED APSherwood Design Engineers
DesignOptions
Stake-holders
Options’Impacts
Prefer-ences
BestOptions
Stake-Holder Weights
DecisionMaker
DesignTeam
Options’Merits
ProjectGoals

Evaluate OptionsEvaluate Options’’ ImpactsImpacts
DesignOptions
Stake-holders
Options’Impacts
Prefer-ences
BestOptions
Stake-Holder Weights
DecisionMaker
DesignTeam
Options’Merits
ProjectGoals

Calculate OptionsCalculate Options’’ Value for StakeholdersValue for Stakeholders
0.0
50.0
100.0
150.0
100%
Day
lit
Stee
l
Cerif
ied
Woo
d
Fuel
Cel
l
Sola
r H2O
Gre
yH2O
Hea
t
PV A
rray
Dim
mer
s
Even
ing
Dim
Fixt
ure
Opt
imiz
e
Mon
itors
Rai
nwat
er
Gre
y/Bl
ack
H2O
Gre
en F
inis
h
Gre
en R
oof
Trip
le P
anes
Cler
esto
ry
Atriu
m
Students Faculty Department University Developers
DesignOptions
Stake-holders
Options’Impacts
Prefer-ences
BestOptions
Stake-Holder Weights
DecisionMaker
DesignTeam
Options’Merits
ProjectGoals
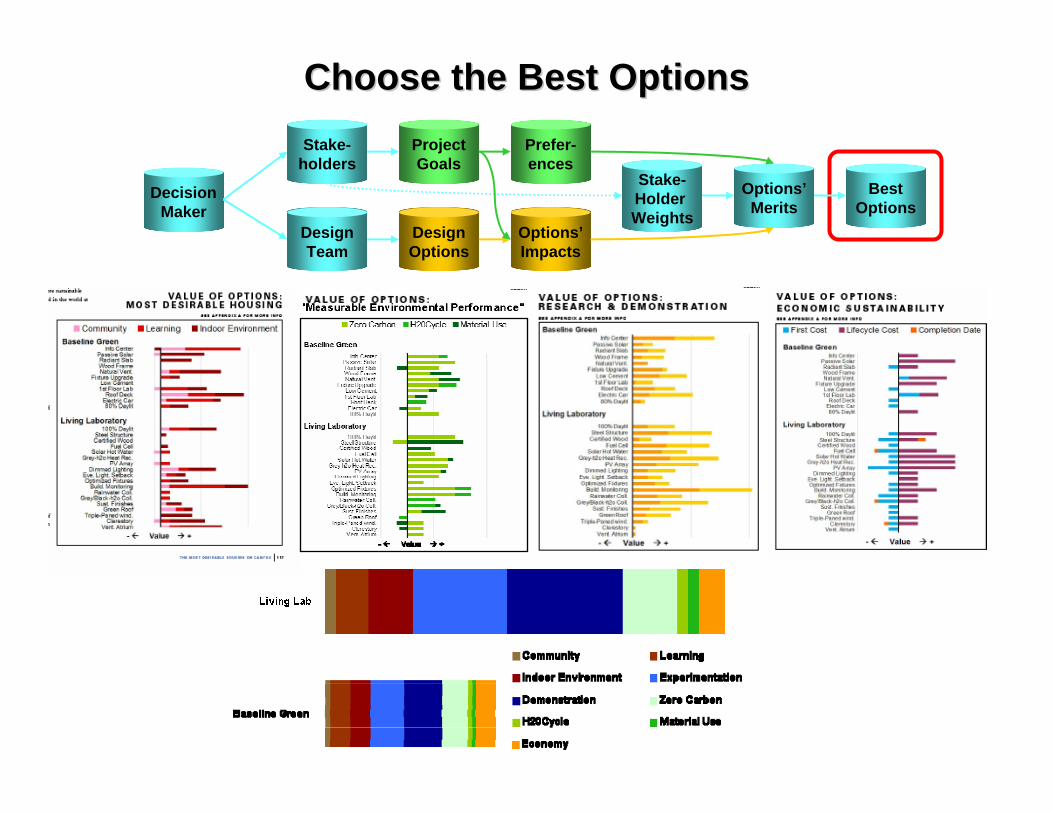
Choose the Best OptionsChoose the Best Options
DesignOptions
Stake-holders
Options’Impacts
Prefer-ences
BestOptions
Stake-Holder Weights
DecisionMaker
DesignTeam
Options’Merits
ProjectGoals

0.0
500.0
1000.0
1500.0
2000.0
Students Faculty Department University Developers
Desirable Housing Living Lab
Environ. Performance Economy
17 MACDADI: A Methodology for Systematically and MACDADI: A Methodology for Systematically and Transparently Achieving Breakthrough QualityTransparently Achieving Breakthrough Quality
“Wow, this is really great. I
think this really might make the
difference in helping us
decide the final scope, which in my experience
here, is the hardest part of
any project....
Thanks so much for taking this
on- I really hope it can be a model for
making these kinds of
decisions on all jobs.”
Laura GoldsteinProject Manager
Stanford University
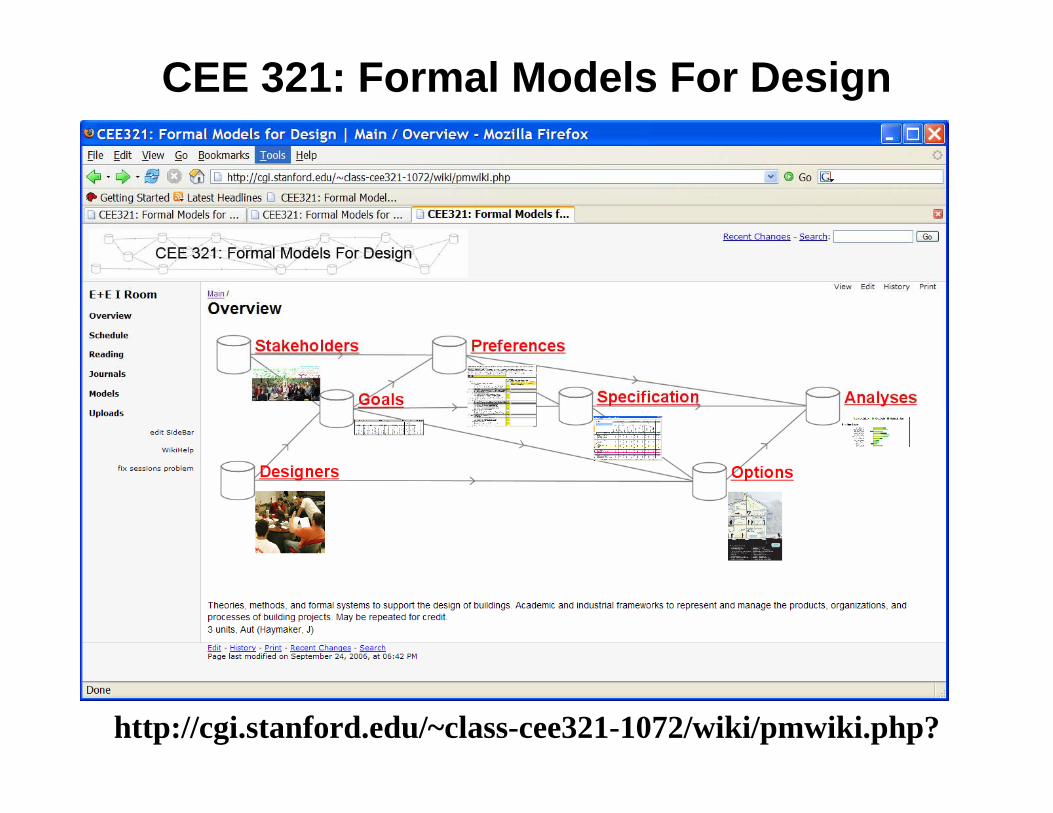
CEE 321: Formal Models For Design
http://cgi.stanford.edu/~class-cee321-1072/wiki/pmwiki.php?

The Opportunity
The site of the new E+E building is on axis to the existing quad, in the North West Corner of the SEQ-2. The iRoom will be on the second floor of the E+E building. The space is approximately 70 feet long x 33 feet deep, or 2300 square feet in area.
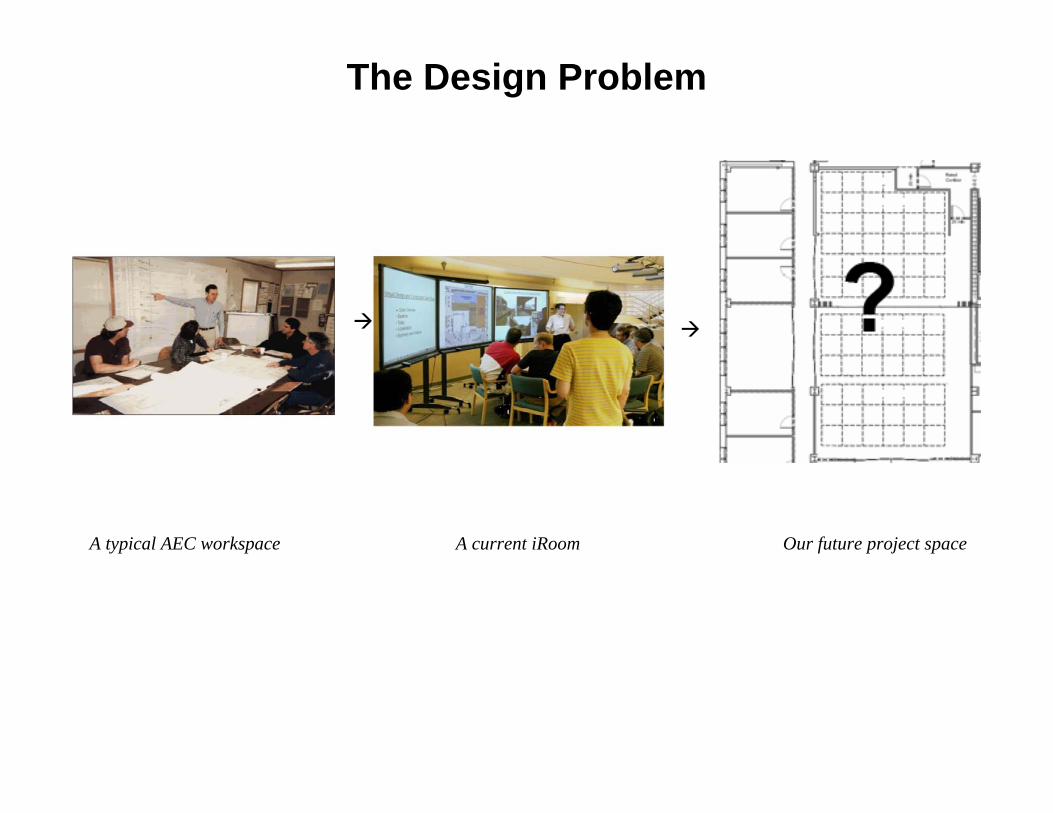
The Design Problem
A typical AEC workspace A current iRoom Our future project space

Some Possibilities…
Four of many potential configurations for the E&E iRoom space, which could be dynamically reconfigurable.
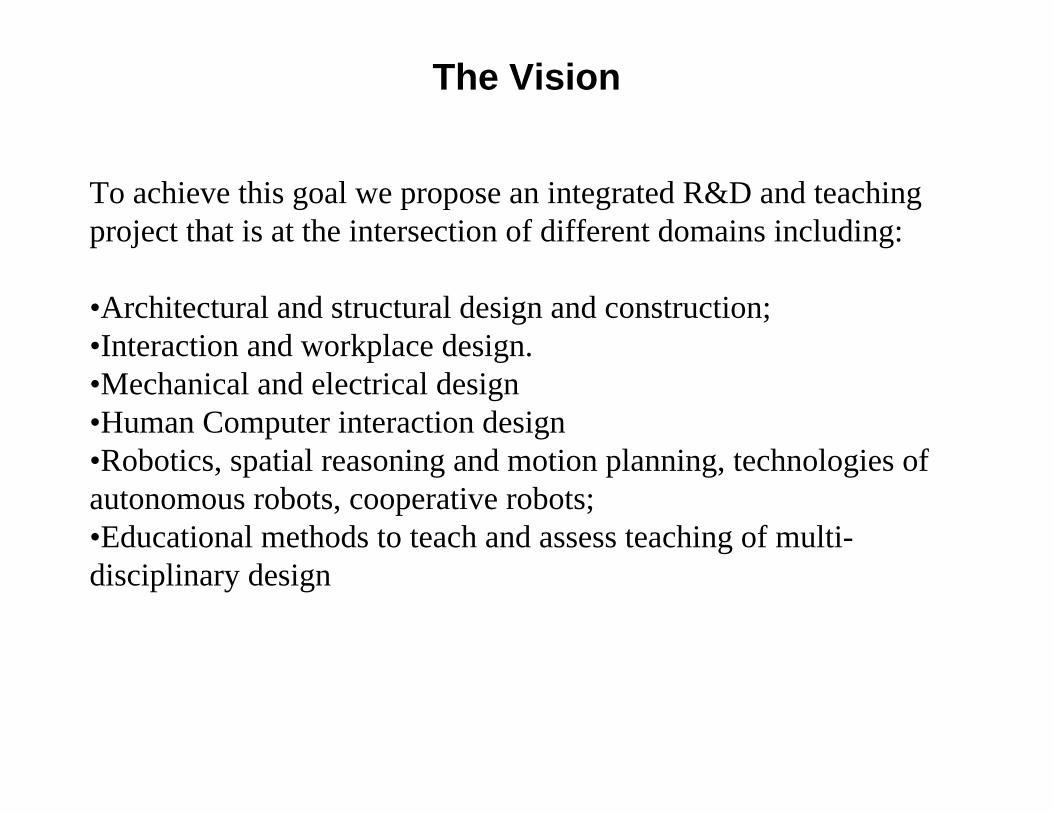
The Vision
To achieve this goal we propose an integrated R&D and teaching project that is at the intersection of different domains including:
•Architectural and structural design and construction; •Interaction and workplace design.•Mechanical and electrical design•Human Computer interaction design•Robotics, spatial reasoning and motion planning, technologies ofautonomous robots, cooperative robots;•Educational methods to teach and assess teaching of multi-disciplinary design

Project Schedule
CEE 321
Define Goals Design & Analyze Document & Negotiate Fabricate Install
ME 310
Design Team
Contractor
1/07 6/07
12/069/06
6/07 9/07
9/07 12/07
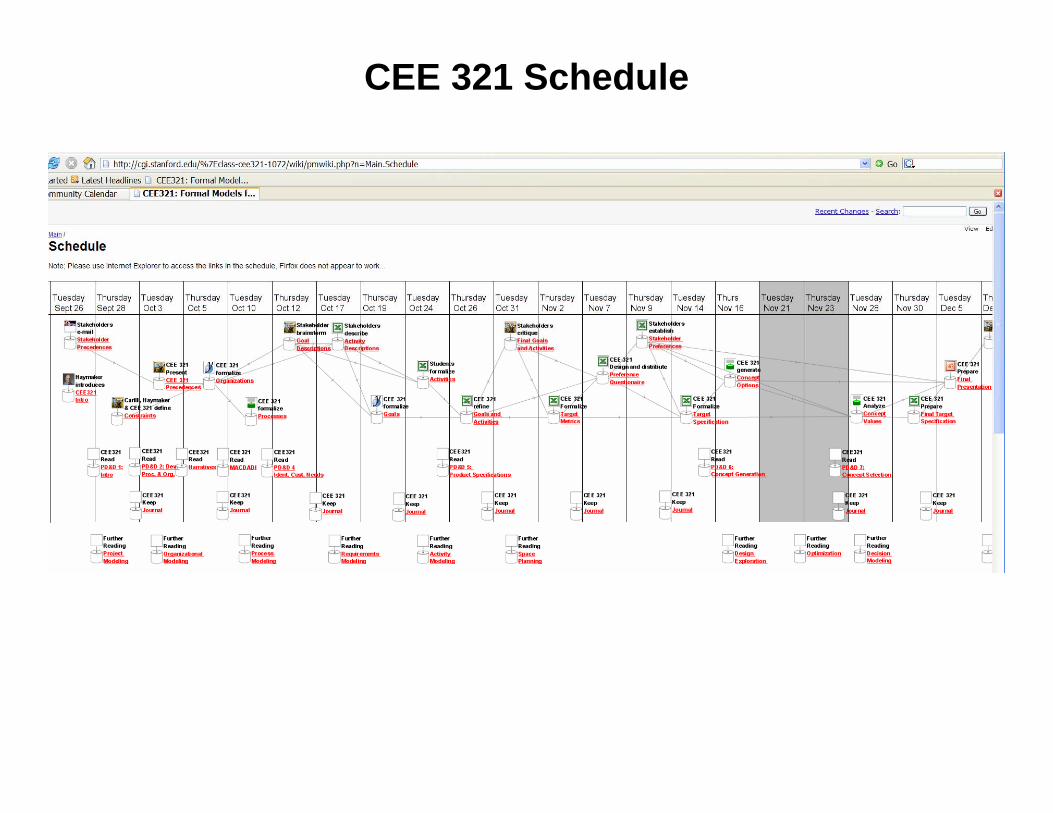
CEE 321 Schedule
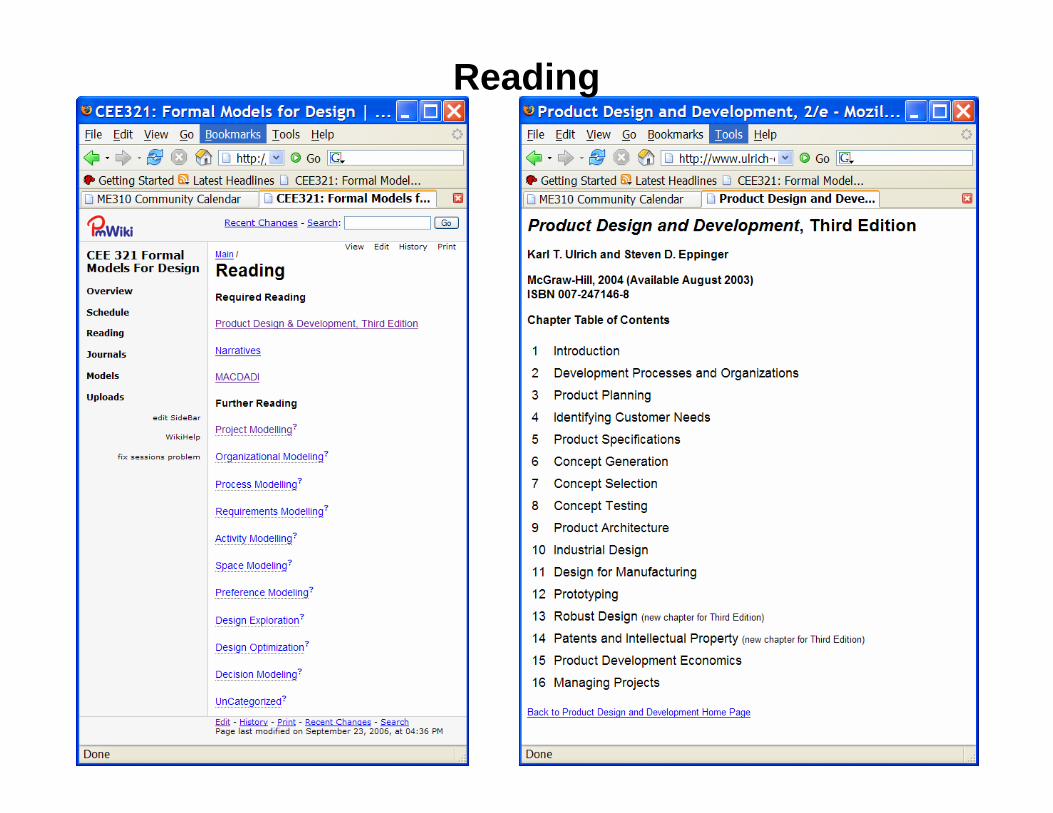
Reading
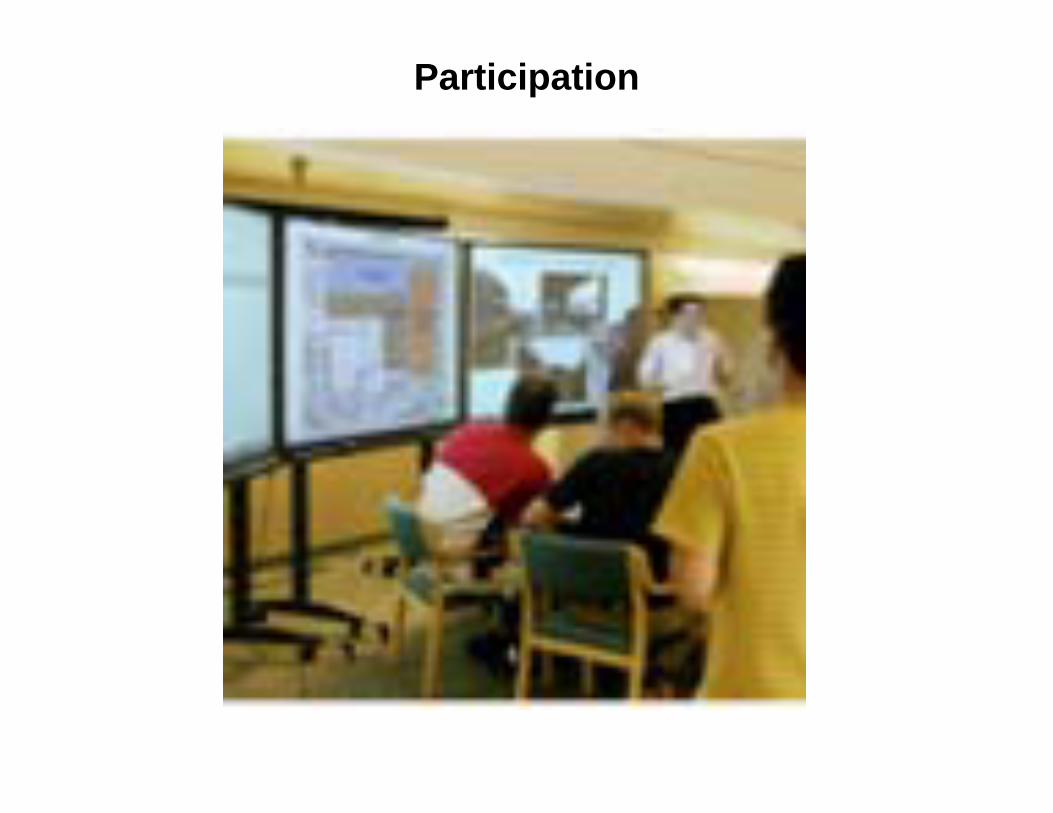
Participation
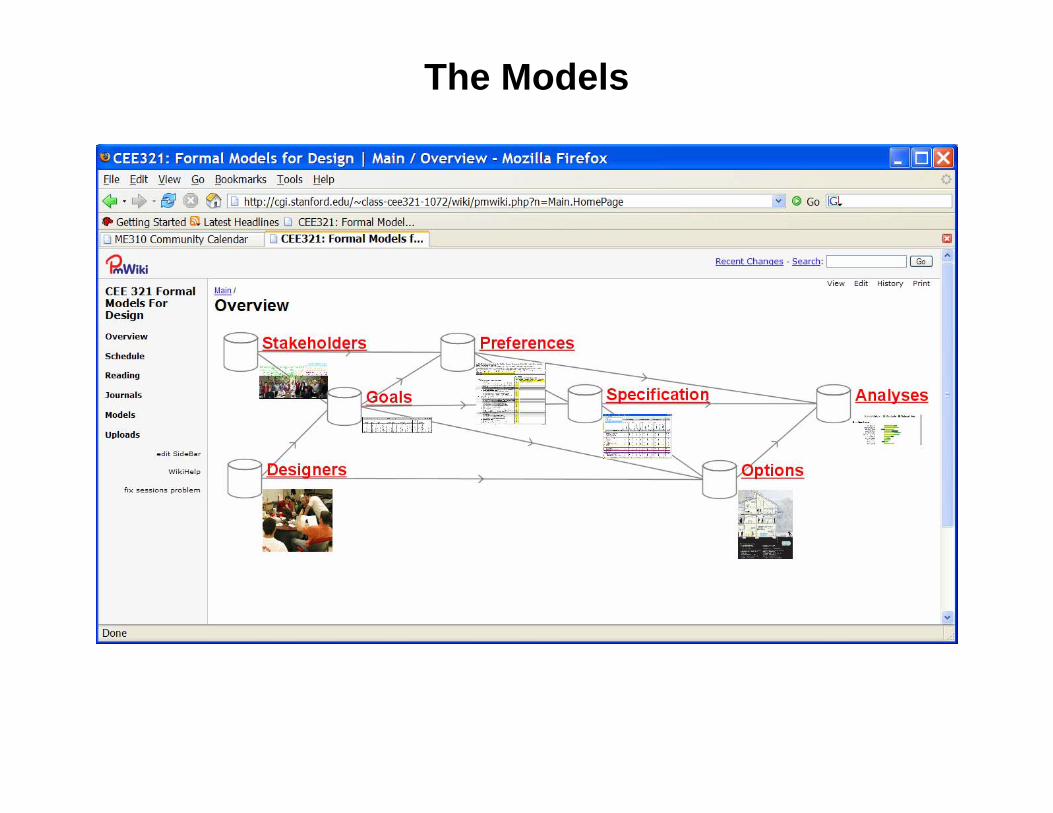
The Models

Journals
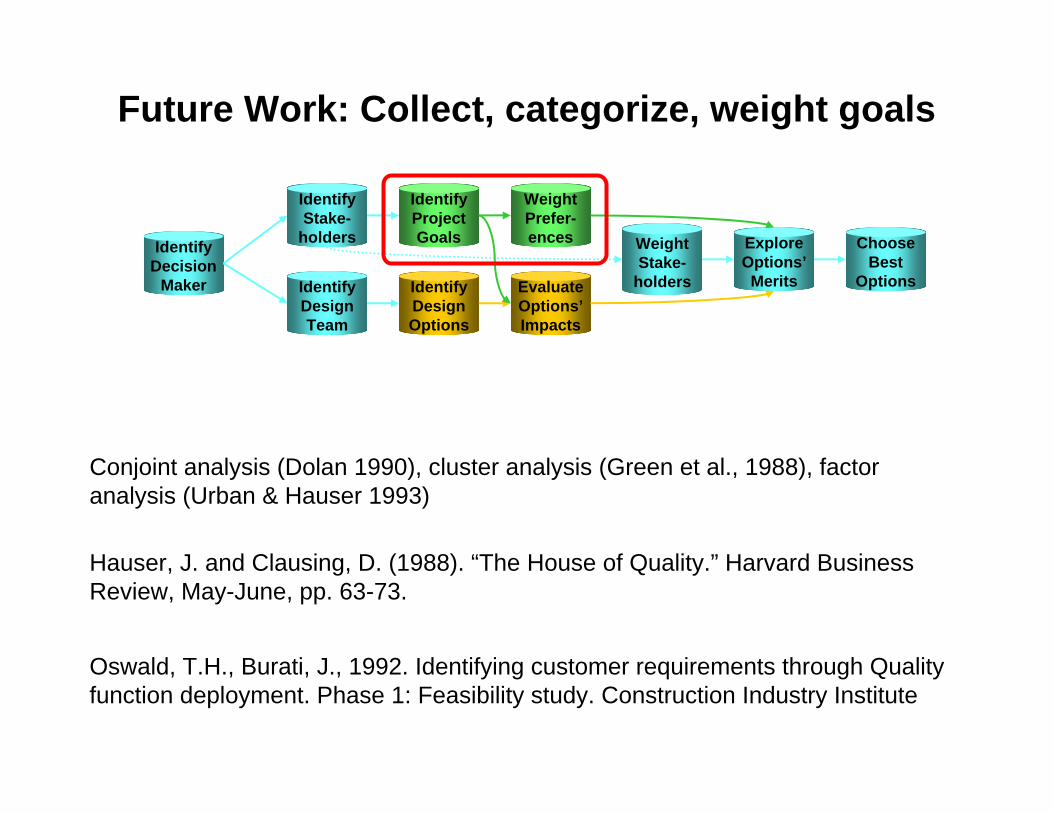
Future Work: Collect, categorize, weight goals
IdentifyDesignOptions
IdentifyStake-
holders
EvaluateOptions’Impacts
WeightPrefer-ences Choose
BestOptions
WeightStake-
holders
IdentifyDecision
Maker IdentifyDesignTeam
ExploreOptions’
Merits
IdentifyProjectGoals
Oswald, T.H., Burati, J., 1992. Identifying customer requirements through Quality function deployment. Phase 1: Feasibility study. Construction Industry Institute
Conjoint analysis (Dolan 1990), cluster analysis (Green et al., 1988), factor analysis (Urban & Hauser 1993)
Hauser, J. and Clausing, D. (1988). “The House of Quality.” Harvard Business Review, May-June, pp. 63-73.

Future Work: Evaluate Options’ Impacts
Stanford Green Dorm
MACDADI Matrix
Sens
e of
priv
acy
Dyn
amic
soc
ial l
ife
Goo
d ne
ighb
or
Acce
ss to
rese
arch
and
ed
ucat
ion
Faci
litat
es s
usta
inab
le
lifes
tyle
Ther
mal
com
fort
Ligh
ting
qual
ity
Acou
stic
qua
lity
Hea
lthy
mat
eria
ls &
air
Preferences 1 2 1 2 5 4 3 1 1
Baseline GreenShared "Information Center"(foyer) and entry -1 2 2 3 3 0 0 -1 0Solar orientation for passive solar design 0 0 -1 0 0 2 3 0 0Radiant slab heating 0 0 0 0 0 3 0 1 0Optimized. 24" O.C. wood framing 0 0 0 0 0 0 0 0 0Natural ventilation for passive cooling 0 1 0 0 1 3 0 -1 3High-performance light and water fixtures 0 0 0 0 1 0 1 0 0Fly ash or slag, low-cement concrete 0 0 0 0 0 0 0 0 0First floor location for building systems lab -1 0 0 2 1 3 0 -1 0Large roof deck at second level -1 3 1 2 1 2 2 -1 0Electric car garage 0 0 1 2 3 0 0 0 180% daylit interior 0 0 0 0 1 0 2 0 0
Living Laboratory100% daylit interior 0 1 0 0 2 0 3 0 0
Steel structure w/concrete-filled metal deck 0 0 0 0 0 0 0 1 0 FSC-certified wood 0 0 0 0 0 0 0 0 0
5 kw fuel cell 0 0 0 0 0 0 0 0 1Solar hot water system 0 0 -1 0 1 0 0 0 0Greywater heat recovery 0 0 0 0 0 0 0 0 060 Kw Photovoltaic array 0 0 -1 0 1 0 0 0 0Dimmed lighting in dorm rooms 0 2 0 0 1 0 3 0 0Evening lighting setback 0 0 1 0 1 0 1 0 0Highest-performance lighting and water fixtures 0 0 0 0 1 0 2 0 0
Building systems monitors 0 1 0 3 3 1 0 0 2Rainwater collection 0 0 0 0 1 0 0 0 0Greywater and blackwater collection 0 0 0 0 1 0 0 0 0Stormwater Features and Native Landscaping 0 0 2 1 2 0 0 0 0Sustainable finish materials (interior and exterior) 0 0 1 0 0 0 0 0 2Extensive green roof, 2 to 4 inches of soil. 1400 sf 0 1 1 1 0 1 0 0 0Triple-paned, double low-e windows 0 0 0 0 0 2 1 1 0Three foot clerestory pop-up at upper, north-facing rooms 0 0 -1 0 1 2 2 0 0Ventilation atrium on first floor 0 1 0 0 1 2 2 0 1
The Most Desirable Housing
Community LearningIndoor environmental
quaility
Des
ign
and
cons
truct
ion
proc
ess
Sen
sing
(mon
itorin
g sy
stem
s)
Bui
ldin
g en
ergy
Veh
icle
ene
gy
Bui
ldin
g st
ruct
ure
Bui
ldin
g m
ater
ials
Wat
er
Influ
ence
at S
tanf
ord
Pro
ving
gro
und
for
build
ing
tech
nolo
gy
Not
ewor
thy
("W
ow" f
acto
r)
Red
uced
ene
rgy
use
Low
/no
carb
on p
er k
Wh
Low
em
bodi
ed e
nerg
y
Wat
er e
ffici
ency
Wat
er c
aptu
re a
nd
recy
clin
g
Red
uced
ear
thqu
ake
loss
es
Mat
eria
l effi
cien
cy a
nd
sust
aina
ble
sour
cing
Des
ign
for a
dapt
abilit
y an
d de
cons
truct
ion
2 5 5 1 4 2 5 5 5 3 5 5 3 3 4 1 2 2 16 5 1
2 3 2 1 0 0 1 3 2 2 2 0 0 1 0 0 0 0 0 1 01 0 1 0 0 0 0 1 1 0 3 0 0 0 0 0 0 0 0 3 01 1 1 0 0 0 0 1 1 1 2 0 0 0 0 0 0 -2 -1 1 02 0 0 0 1 0 0 2 1 1 1 0 1 0 0 0 2 1 0 0 01 1 1 0 0 0 0 0 0 0 2 0 0 0 0 0 2 1 1 2 01 1 1 0 0 1 2 1 0 0 2 0 0 1 1 0 0 0 0 2 02 0 1 0 2 2 0 2 2 1 0 0 3 0 0 0 1 0 -1 0 00 0 0 2 0 0 0 2 0 1 0 0 1 0 0 -1 * 3 2 1 00 2 1 0 0 0 1 1 0 2 0 0 0 0 2 0 0 0 -1 0 01 2 0 3 0 0 0 2 2 3 0 1 0 0 0 0 -1 0 -1 0 01 1 0 0 0 0 0 1 0 0 2 0 0 0 0 0 0 0 0 1 0
01 1 1 0 0 0 0 3 1 1 3 0 0 0 0 0 0 0 -1 2 02 2 0 0 3 3 0 1 3 3 0 0 -2 0 0 3 1 3 -2 1 21 0 0 0 0 1 0 1 0 1 0 0 0 0 0 0 3 0 -1 0 02 1 3 1 0 0 0 1 3 3 0 2 0 0 0 0 0 0 -2 2 -11 1 3 0 0 0 0 1 1 2 0 3 0 0 0 0 0 1 -1 3 02 1 3 0 0 0 1 2 3 3 0 3 0 0 0 0 0 0 -1 3 01 1 2 1 0 0 0 3 1 3 0 3 -1 0 0 0 0 1 -3 3 01 1 1 0 0 0 0 2 2 1 2 0 0 0 0 0 0 0 -1 1 01 1 1 0 0 0 0 2 1 0 1 0 0 0 0 0 0 0 0 1 01 1 2 0 0 0 0 2 1 0 3 0 0 2 0 0 0 0 -1 1 01 3 3 1 2 1 3 3 3 3 3 0 0 2 0 0 0 0 -1 2 01 1 0 0 0 0 3 1 1 2 0 0 0 0 3 0 0 0 -2 1 02 1 0 0 0 0 3 2 3 3 0 0 0 0 3 0 0 1 -2 1 -11 1 0 0 0 0 2 1 0 1 0 0 0 0 2 0 0 0 0 1 01 0 0 0 1 3 0 1 2 2 0 0 2 0 0 0 3 0 -1 0 01 1 0 0 0 0 1 1 1 2 0 0 0 -1 0 0 0 0 -1 0 01 0 1 0 0 0 0 0 1 0 1 0 0 0 0 -1 0 0 -1 1 01 0 0 0 0 0 0 0 0 0 1 0 0 0 0 0 -1 0 -1 1 -11 0 0 0 0 0 0 0 0 0 1 0 0 0 0 0 0 0 -1 0 0
Measurable Environmental PerformanceA Living Laboratory for Research
Com
plet
ion
date
Firs
t Cos
t
Economically Sustainable
Life
cycl
e C
ost
Zero carbonDemonstration Closed
water cycleMaterial
resourcesExperimentation
IdentifyDesignOptions
IdentifyStake-
holders
EvaluateOptions’Impacts
WeightPrefer-ences Choose
BestOptions
WeightStake-
holders
IdentifyDecision
Maker IdentifyDesignTeam
ExploreOptions’
Merits
IdentifyProjectGoals
3000 ft2
PV sizeand type
3000 ft2
PV sizeand type
John Scofield paperon monitoring a solar academic building
John Scofield paperon monitoring a solar academic building
Energy Supply and Demand Narrative
John Scofield paperon performance forJasper Ridge
John Scofield paperon performance forJasper Ridge
Heat Recovery From Gray Water Narrative
Monthly Water FlowMonthly Heat Flow
Water flow Diagram(p1)
Water tank Capacity(p84)
Shower DrainTemperature
Daily water Volume per tank(p54)
Well capacity
Seasonal ground water temperature
Capacityfactor
Fuel Cell Narrative
Energy from fuel cell (p20)
Fuel cell size
Solar Hot Water NarrativeArea of solar water Array(p68)
EfficiencyInsolation
Photovoltaic Array Narrative
64,431 kWh/yr
Jasper RidgePV PerformanceSince 10/2002
Elect: 404 MMBtuHeat: 296 MMBtu
NatGas: -389 MMBtu
Energy from Solar Hot Water(p68)
Number of tanks = 1Size = 2,000 gal
NEED gal/min
35 MMBtu/yr
Pump 1: NEED °FPump 2 NEED °F
NEED gal/min
680 gal/day
Cf = 90%
5KW CHP
Energy Balance(p67-68)
0 = Supply – Deman[BTU/yr]92 MMBtu/yr
5kWh/m2d40%
475 ft2
Building Geometry
Energy Supply Narrative
80-90ºF
(1000 ft2)
Back of EnvelopeArray Size
Energy from Photovoltaic Array
~1.4 [m3/day]
Bioreactor
SiteSite
Building layoutBuilding layout
Equest energy analysis
Building geometry
Equest simulationassumptions
Comparison for consistency
Back of theenvelope energyconsumption
Back of theenvelope energyconsumption
Energy Demand Narrative
Total: 54,423 kWh/yr199 MMBtu/yr
Building Energy Demand(p60)
Heat Pump
Energy Conversion(p66)
Energy from building graywater(p66)
ElectricitySupply(p67)
54,423 kWh/yr
ElectricitySupply(p67)
54,423 kWh/yr
HeatSupply(p67) 120 MMBtu/yr
(85+35)
HeatSupply(p67) 120 MMBtu/yr
(85+35)
Natural GasFrom Utility(p67)
79 MMBtu/yr(80.1 MMBtu) source
Natural GasFrom Utility(p67)
79 MMBtu/yr(80.1 MMBtu) source
35 MMBtu/yr- 2,188 kWh/yr
HeatNot used(p67)
7 MMBtu/yr
HeatNot used(p67)
7 MMBtu/yr
BioGas production
ExcessElectricityback to grid(p67) 7820 kWh/yr
(80.1 MMBtu)source
ExcessElectricityback to grid(p67) 7820 kWh/yr
(80.1 MMBtu)source
eQuestNatural GasDemand
79 MMBtu/yr
eQuestNatural GasDemand
79 MMBtu/yr
eQuestElectricityDemand
54,423 kWh/yr
eQuestElectricityDemand
54,423 kWh/yreQuestHeatDemand
120 MMBtu/yr
eQuestHeatDemand
120 MMBtu/yr
Utility Balance
Haymaker et al (2004).

Bas
elin
e G
reen
Livi
ng L
abor
ator
yFuture Work: Calculation & Visualization
IdentifyDesignOptions
IdentifyStake-
holders
EvaluateOptions’Impacts
WeightPrefer-ences Choose
BestOptions
WeightStake-
holders
IdentifyDecision
Maker IdentifyDesignTeam
ExploreOptions’
Merits
IdentifyProjectGoals
Tufte, E. R. (1997).

Conclusions
AEC projects lack formal design and analysis processes
Simple, well-designed and implemented methods can helpcommunicate goals, options, analyses, decisions
Can they improve quality ?
More research required on how to:-design and communicate these methods-optimize the design using these methods-educate and transform organizations to adopt them
IdentifyDesignOptions
IdentifyStake-
holders
EvaluateOptions’Impacts
WeightPrefer-ences Choose
BestOptions
WeightStake-
holders
IdentifyDecision
Maker IdentifyDesignTeam
ExploreOptions’
Merits
IdentifyProjectGoals
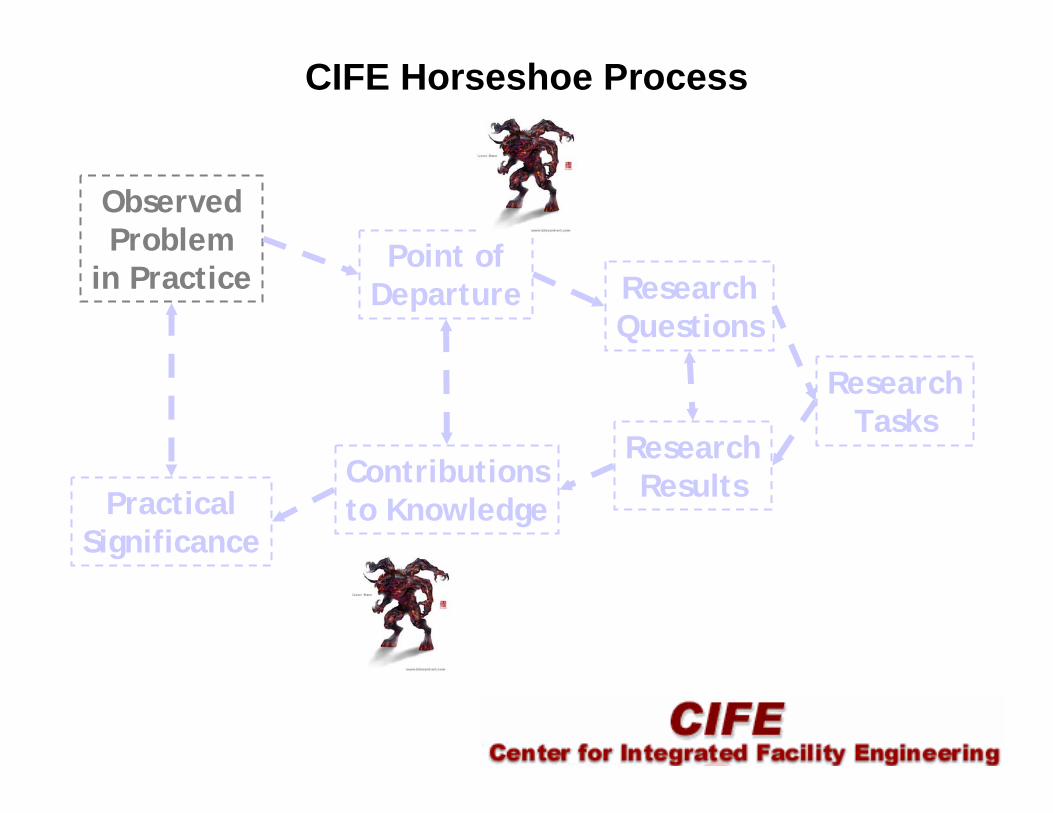
ObservedProblem
in PracticePoint of
Departure ResearchQuestions
ResearchTasks
ResearchResultsContributions
to KnowledgePracticalSignificance
CIFE Horseshoe Process