Embed Size (px)
Citation preview

ASSIGNMENT 2 – Analogue Tape Simulation in MATLAB
Digital Audio Systems, DESC9115, 2020 Master of Architectural Science (Audio and Acoustics)
Sydney School of Architecture, Design and Planning, The University of Sydney
ABSTRACT
Analogue tape recording is known for its warmth, low end punch and smooth saturation (Robjohns, 2010). This project aims to simulate some of the characteristics of analogue tape recording using digital signal processing in MATLAB. Three characteristics were chosen that are idiosyncratic to the sound of analogue tape recording – tape saturation, low end head bumps and the pitch modulation effects wow and flutter. An analysis of how these occur in an actual analogue tape machine was conducted. This analysis was used in the selection, application and modification of existing digital signal processes to achieve an authentic sounding simulation. 1. INTRODUCTION
The sound of ‘analogue warmth’ inherent in tape recording is revered in the audio world and the analogue vs digital debate has waged on since the introduction of digital audio and its eventual dominance as the preferred recording medium (Robjohns, 2010). Ironically much of the literature about magnetic tape recording is aimed at reducing noise, distortion and other artefacts through appropriate set up and handling of tape machines. For example, Eargle (2003) discusses setting up bias in such a way as to create minimum 3rd harmonic distortion. So, while technicians and engineers of the day were attempting to reduce these artefacts to make a perfectly clean recording, it is these very artefacts and idiosyncrasies that give tape its mythical status and what plugin companies seek to emulate. Through an analysis of how a tape machine system functions and how its sonic characteristics are imparted onto an input signal, the sound of tape recording can be emulated using a Digital Audio System. 1.1 The Analogue Tape Machine
A tape machine converts electrical audio signals into magnetic energy, which imprints a record of the signal onto a moving tape covered in magnetic particles. The tape passes over a series of magnetic heads. Firstly, the tape passes over the erase head which scrambles anything stored on the track. Next tape passes the record head, a stack of magnets each wound with a coil of wire. There is one magnet per track. Between the positive and negative poles of the magnets is a tiny gap called the head gap. Inside the head gap exists a magnetic field which fluctuates in response to the changing electrical signal. ‘As the tape passes by, these pulses align the tiny magnetic particles into patterns, leaving a record of the sound. The third head is the playback head, which “reads” the magnetic information stored on the tape and converts it back into electrical signals that are sent to the machine’s outputs’ (Fumo,

2018). Figures 1, 2 show the basic components of a tape recorder and Figure 3 shows the typical composition of magnetic tape.
Figure 1. The basic elements of a tape recorder (Eargle, 2003)
Figure 2. The typical components of a tape recorder transport (Eargle, 2003)
Figure 3. Typical magnetic tape composition. A plastic film is coated with needle shaped magnetic iron oxide particles. (Eargle, 2003)

1.2 Selected characteristics of analogue tape recording
1.2.1 Low-end Head Bump
‘Head bumps’ are a phenomenon that occurs in analogue tape recording where low frequency undulations cause varying levels of constructive and destructive interference in the low end. They occur when at low frequencies, the ‘wavelength of the recorded signal becomes as long as the magnetic core of the playback head ‘(Ballou, p.946 1987). These long wavelengths leak into the core via the head gap and from the rear and sides. Therefore, the magnetic flux in the core consists of the desired magnetic flux plus the additions and/or subtractions from the flux that has leaked in. Two well-defined head bumps are usually evident. ‘The exact shape of the head bumps is determined by the size and shape of the reproduce core, surrounding shielding material, and angle of wrap of the tape’ (Ballou, p. 946, 1987). While the last generations of mastering tape recorders had reduced the magnitude of the bumps to less than 1db peak-to-peak at 15in/s, ‘the total error can easily reach 5dB as tape is rerecorded during mixdown, protection copying and mastering’ (Ballou, p. 946, 1987). While these head bumps are technically a flaw, the increase in bottom end is the reason some engineers prefer recording to analogue tape as this bump can add a ‘punchy’ sound to the kick drum and bass. Renowned engineer Jack Endino who has worked with bands such as Nirvana and Soundgarden, performed some experiments on various tape machines using test tones to calibrate the machines (Endino, 2013). The frequency response curves in Figure 5 includes curves from various well-known tape machines from commercial studios. While the response of all machines are quite different, what is common to all these curves is a bump in the low frequency region. I used the Waves Q-Clone plugin to analyze the frequency response of the Waves J37 plugin in ProTools. The Q-Clone sends a spectral sweep to obtain the frequency response of a system. Figure 6 shows the frequency response of the J37. The largest head bump is evident at approximately 45Hz.
Figure 4. Head bumps in a typical mastering recorder (Courtesy of Sony Corporation of America in Ballou, 1987)

Figure 5a. Frequency Response - Studer A820 (Endino, 2013)
Figure 5b. Frequency Response - MCI 2-inch 24 track (30ips) (Endino, 2013)
Figure 5c. Frequency Response - Studer A80 Mk II (Endino, 2013)
Figure 5d. Frequency Response - Sony APR-5000 (Endino, 2013)
Figure 6. Frequency Response of Waves J37 plugin

1.2.2 Tape Saturation A tape machine’s maximum input level is the level at which all magnetic tape particles become magnetized (Ballou, 1987). Any part of the signal exceeding this point will be compressed and as such the machine’s response becomes non-linear as there are no more available magnetic particles to magnetize and match the input level. This compression occurs smoothly. The results are a rounding off of transient peaks and the introduction of third order and other odd harmonics. Eargle (1976) explains why this type of saturation is favored amongst engineers: ‘One reason for their preference for analogue recording is the fact that magnetic tape goes into distortion gradually and produces those kinds of harmonics which help special sound effects on drums, guitars and vocals’ (as cited in Zölzer, 2011, p. 132). Figure 7 shows the input and corresponding output amplitudes following tape compression. Figure 8 shows the pattern of odd harmonics produced in tape saturation for a 1kHz sinusoidal wave. Level and decay time decrease proportionally for each consecutive order of harmonic. The graph shows that the harmonics are odd rather than even, with the strongest being the third harmonic followed by the 5th, 7th, 9th and so on. So, frequencies of harmonics for a 1kHz sine wave produced would be as per Table 1. While I did not have access to an analogue tape recorder, I have conducted some measurements of the Waves Abbey Road J37 plugin (Figure 9) in ProTools using a spectral analyser. This plugin is an emulation of the original J37 plugin used at London’s Abbey Road Studios to record some of the most well-known music of the 20th century including The Beatles’ ‘Sgt. Pepper’s Lonely Hearts Club Band’. (Waves, 2020) I used a signal generator to generate a 1kHz sine tone. Figure 10a Shows the spectral analysis of the J37 plugin bypassed. Figure 10b shows the spectral analysis of the J37 plugin engaged. Figure 10c shows spectral analysis of plugin with the Saturation setting on half. Figure 10d shows the analysis of the saturation setting on full. These analyses show that even with the plugin engaged, odd harmonics are produced which increase as the saturation amount increases.
Figure 7. Clean input vs saturated tape output signals (Zölzer, 2011)

Figure 8. Waterfall representation of short-time FFTs showing harmonics and their decay times due to tape saturation (Zölzer, 2011)
Fundamental 1kHz
3rd harmonic 3kHz
5th harmonic 5kHz 7th harmonic 7hKz
8th harmonic 9kHz 11th harmonic 11kHz
13th harmonic 13kHz
15th harmonic 15kHz 17th harmonic 17kHz
19th harmonic 19kHz
Table 1. Odd harmonics produced by tape saturation for a 1kHz sine wave
Figure 9. GUI of Waves J37 plugin
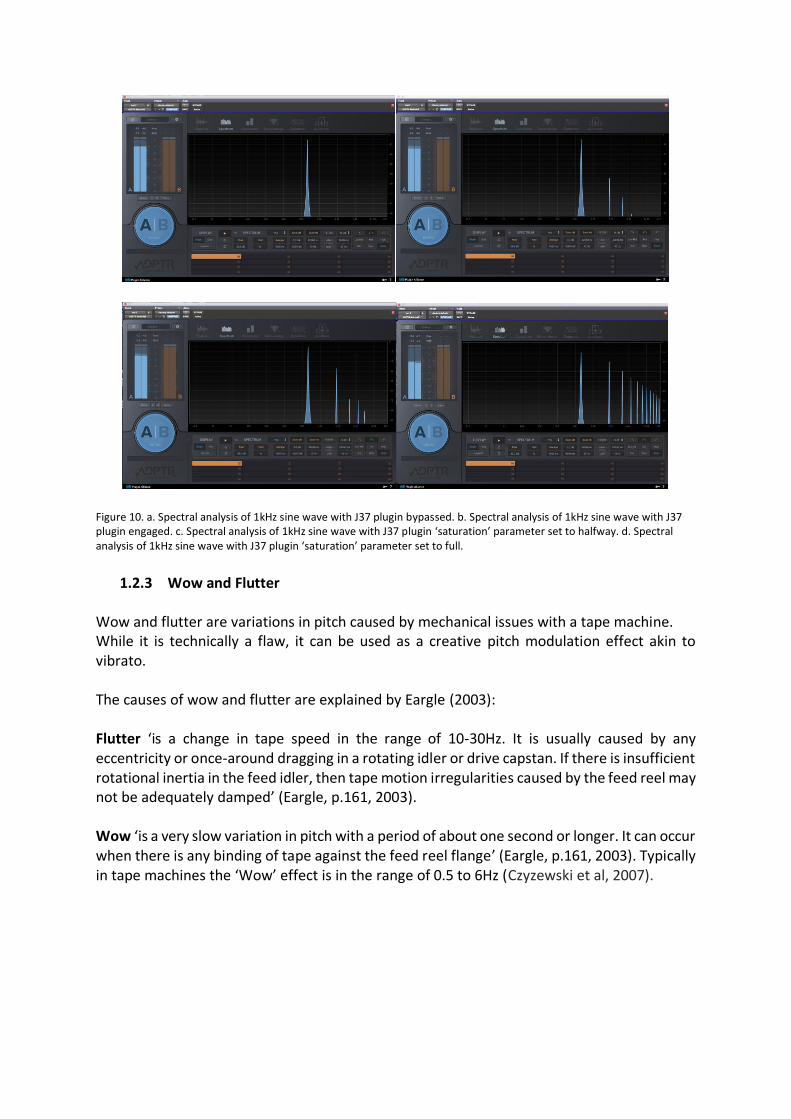
Figure 10. a. Spectral analysis of 1kHz sine wave with J37 plugin bypassed. b. Spectral analysis of 1kHz sine wave with J37 plugin engaged. c. Spectral analysis of 1kHz sine wave with J37 plugin ‘saturation’ parameter set to halfway. d. Spectral analysis of 1kHz sine wave with J37 plugin ‘saturation’ parameter set to full.
1.2.3 Wow and Flutter
Wow and flutter are variations in pitch caused by mechanical issues with a tape machine. While it is technically a flaw, it can be used as a creative pitch modulation effect akin to vibrato. The causes of wow and flutter are explained by Eargle (2003): Flutter ‘is a change in tape speed in the range of 10-30Hz. It is usually caused by any eccentricity or once-around dragging in a rotating idler or drive capstan. If there is insufficient rotational inertia in the feed idler, then tape motion irregularities caused by the feed reel may not be adequately damped’ (Eargle, p.161, 2003). Wow ‘is a very slow variation in pitch with a period of about one second or longer. It can occur when there is any binding of tape against the feed reel flange’ (Eargle, p.161, 2003). Typically in tape machines the ‘Wow’ effect is in the range of 0.5 to 6Hz (Czyzewski et al, 2007).

2. LAB WORK
2.1 Signal Flow
The following diagram describes the system’s signal flow:
2.2 Head Bump Simulation using peak filter
The low-end head bump described in section 1 can be approximated using a peak filter. Peak filters ‘boost or cut mid-frequency bands with parameters centre frequency fc, bandwidth fb and gain G’ (Zölzer, p. 61, 2011). In order to implement a peak filter to simulate a head bump, the centre frequency of the filter can be adjusted to match the centre frequency of the head bump any tape machine desired. The final script will include instructions to select input parameters which will be displayed in the command window. Zölzer (p.64, 2011) gives the transfer function for a second-order peak filter:
𝐻(𝑧) = 1 +𝐻0
2[1 − 𝐴2(𝑧)],
Where
𝐴2(𝑧) =−
𝑐𝐵
𝐶+ 𝑑 (1 −
𝑐𝐵
𝐶) 𝑧−1 + 𝑧−2
1 + 𝑑 (1 −𝑐𝐵
𝐶) 𝑧−1 −
𝑐𝐵
𝐶𝑧−2
The block diagram for a peak filter is shown in Figure 11.
Figure 11. Block Diagram for a second-order peak filter (Zölzer, p. 65, 2011)
The head bumps of actual tape machines analyzed in Section 1.2.1 are used to design recommendations for center frequency and bandwidth values and included in the script. These values are suggested in the command window. Recommended values for center frequency (Wb) are 45-100Hz. Recommended values for bandwidth (Wb) are 50-200Hz.
INPUT
SIGNAL HEAD BUMP
FILTER
TAPE
SATURATION WOW OR FLUTTER
PITCH MODULATION OUTPUT

2.2.1. Function for Matlab implementation: %%%%% LOW END HEAD BUMP FUNCTION %%%%%%%% % Originally called 'Peak Filter' - peakfilt.m % % THIS FUNCTION WAS SOURCED FROM: % % Book on DAFX - Digital Audio Effects % % Edited by Udo Zolzer % ISBN: 0-471-49078-4 % John Wiley & Sons, 2011 % Author: M. Holters % % y = peakfilt (x, Wc, Wb, G) % Applies a peak filter to the input signal x. % Wc is the normalized center frequency 0<Wc<1, i.e. 2*fc/fS. % Wb is the normalized bandwidth 0<Wb<1, i.e. 2*fb/fS. % G is the gain in dB. function y = Low_End_Head_Bump_Function(x, Wc, Wb, G) V0 = 10^(G/20); H0 = V0 - 1; if G >= 0 c = (tan(pi*Wb/2)-1) / (tan(pi*Wb/2)+1); % boost else c = (tan(pi*Wb/2)-V0) / (tan(pi*Wb/2)+V0); % cut end; d = -cos(pi*Wc); xh = [0, 0]; for n = 1:length(x) xh_new = x(n) - d*(1-c)*xh(1) + c*xh(2); ap_y = -c * xh_new + d*(1-c)*xh(1) + xh(2); xh = [xh_new, xh(1)]; y(n) = 0.5 * H0 * (x(n) - ap_y) + x(n);
end; (Zölzer, 2011)
2.3 Tape Saturation Using Arctangent Function
Arctangent distortion will be used to simulate tape saturation. Figure 12 shows the waveform and characteristic curve created by Arctangent distortion. This is very similar to the curve shown for tape saturation shown in Figure 7. It creates a form soft clipping. Soft clipping is a ‘type of distortion effect where the amplitude of a signal is saturated along a smooth curve rather than the abrupt shape of hard clipping’ (Tarr, 2018). It creates ‘odd harmonics with decreasing amplitude as frequency increases’ (Tarr, 2018). These harmonics are shown in Figure 13a, demonstrating that arctangent distortion creates are very similar harmonic pattern to that of tape saturation shown in Figure 8. The arctangent function is as follows:
𝑦[𝑛] = 2𝜋. arctan(𝛼. 𝑥[𝑛]) (Tarr, 2018)

Figure 12. Waveform and characteristic curve of arctangent distortion (Tarr, 2018)
Figure 13. a. Harmonics created through arctangent distortion (Tarr, 2018). b. characteristic curve for arctangent distortion with different saturation (alpha) amounts (Tarr, 2018).
2.3.1. Function for Matlab implementation: %%%%% TAPE SATURATION FUNCTION %%%%%%% % Originally called 'Arctan Distortion' - arctanDistortion.m % % THIS FUNCTION WAS SOURCED FROM: % % HACK AUDIO: An Introduction to Computer Programming & Digital Signal % Processing in MATLAB % % ISBN-10: 113849755X % Audio Engineering Society Presents, 2018 % Author: E. Tarr % 'This function implements arctangent soft-clipping distortion. An input % parameter 'alpha' is used to control the amount of distortion applied to % the input signal
% % Input Variables % in: input signal % alpha: drive amount (1-10) function [out] = Tape_Saturation_Function(in,alpha); N = length (in); out = zeros(N,1); for n = 1:N out(n,1) = (2/pi)*atan(in(n,1)*alpha);
end; (Tarr, 2018)

2.4 Wow & Flutter To implement the pitch variation caused by fluctuations in tape speed described as ‘wow’ and ‘flutter’ a vibrato function is used. Vibrato is a periodic fluctuation in pitch (Manor, 2020). It’s parameters are depth ie. the extent of the fluctuation, and the fluctuation rate. Zölzer (2011) explains that if we create a time delay of a signal that keeps varying periodically a pitch variation is produced. ‘For that purpose we need a delay line and a low-frequency oscillator to drive the delay time parameter.’ The amount of delay in milliseconds corresponds to the depth and the Frequency of the low-frequency oscillator corresponds to the rate (width). In order to use vibrato to simulate ‘wow’ and ‘flutter’ the typical modulation rate of these effects must be examined and fluctuation rate parameters designed accordingly. Typically in tape machines the ‘Wow’ effect is in the range of 0.5 to 6Hz (Czyzewski et al, 2007), while the ‘Flutter’ effect is in the range of 10-30Hz (Eargle, 2003). These ranges will be recommended to the user via instructions in the script. After some trial and error, suggested range for width input is 0 to 5ms.
Figure 14. Signal flow for the vibrato effect (Manor, 2020).
2.4.1. Function for Matlab implementation: %%%%% WOW & FLUTTER FUNCTION %%%%%%% % Originally called 'Vibrato' - vibrato.m % % THIS FUNCTION WAS SOURCED FROM: % % Book on DAFX - Digital Audio Effects % % Edited by Udo Zolzer % ISBN: 0-471-49078-4 % John Wiley & Sons, 2011 % Author: S. Disch % Edited for DESC9115: Ella Manor 2017 function y=WOW_and_FLUTTER_Function(x,SAMPLERATE,Modfreq,Width) WIDTH=round(Width*SAMPLERATE); % modulation width in # samples MODFREQ=Modfreq/SAMPLERATE; % modulation frequency in # samples LEN=length(x); % # of samples in WAV-file L=2+WIDTH+WIDTH*2; % length of the entire delay Delayline=zeros(L,1); % memory allocation for delay y=zeros(size(x)); % memory allocation for output vector for n=1:(LEN-1) MOD=sin(MODFREQ*2*pi*n); TAP=1+WIDTH+WIDTH*MOD; i=floor(TAP); frac=TAP-i; Delayline=[x(n);Delayline(1:L-1)]; %---Linear Interpolation----------------------------- y(n,1)=Delayline(i+1)*frac+Delayline(i)*(1-frac);
end; (Zölzer, 2011)

2.5 Putting it all together – The Tape Simulation Script
The following sections are included in the script:
1. LOAD AUDIO EXAMPLES – Commands to clear workspace and load audio file examples.
2. LOW END HEAD BUMP - The user is prompted to specify input variables for the head bump filter. Suggested values for input parameters displayed in the command window. Once values are selected, the ‘Low_End_Head_Bump’ Function is called. The result is normalised and saved as an audio file.
3. TAPE SATURATION - The new audio file with the previous Head Bump processing is loaded. In the command window, the user is prompted to specify an input value for saturation amount within a recommended range. Once this is selected, the ‘Tape_Saturation’ Function is called. The result is normalised and saved as an audio file.
4. WOW & FLUTTER - The new audio file with the previous Head Bump and Tape saturation processing is loaded. User is prompted to select width and depth of pitch modulation with suggested values displayed in command window. Once values are selected, the ‘WOW_and_FLUTTER’ Function is called. The result is normalised and saved as an audio file.
5. PLAYBACK - Commands included to load and playback final file plus other newly created files for comparison.
2.6 Implementation
Three audio examples are used to test the functions and experiment with function parameters. Note the audio examples and processing are all in mono. 1. ROCK WITH YOU ISOLATED DRUMS.WAV; 2. ROCK WITH YOU FULL BAND INTRO.WAV; 3. ROCK WITH YOU ISOLATED VOCALS.WAV. The examples are excerpts from ‘Rock With You’ performed by Michael Jackson (Temperton, 1979). The following example parameters were selected and resulting files were output and included in practical deliverables:
1. ROCK WITH YOU ISOLATED DRUMS TAPE SIM with the following parameter settings: Low end head bump – Centre Frequency: 60Hz Bandwidth: 60Hz Gain: 8 Tape Saturation – Saturation: 5 Wow & Flutter - Width: 5 Depth: 0.5

2. ROCK WITH YOU FULL BAND INTRO TAPE SIM with the following parameter settings:
Low end head bump – Centre Frequency: 100Hz Bandwidth: 80Hz Gain: 5 Tape Saturation – Saturation: 8 Wow & Flutter – Width: 2 Depth: 2
3. ROCK WITH YOU ISOLATED VOCALS TAPE SIM with the following parameter settings: Low end head bump – Centre Frequency: 200Hz Bandwidth: 100Hz Gain: 4 Tape Saturation – Saturation: 3 Wow & Flutter – Width: 0.3 Depth: 12
1. DISCUSSION & CONCLUSION
The digital simulations of analogue tape effects outlined in this project provide a somewhat accurate approximation of the colour and character of vintage tape recording. In addition, they allow the user the flexibility to change parameters to taste. This is an advantage over actual analogue tape recording where parameters are not always controllable particularly when they are due to imperfections in machine components. However, it should be observed that the MATLAB functions implemented here lack the inherent randomness of recording to analogue tape. For example, wow and flutter in actuality would have more random asymmetrical fluctuations than the steady modulation created by the low frequency oscillator used for the wow and flutter function in this project. This is an area where design could be improved. With regards to frequency response, actual measured transfer functions from tape machines could be implemented to achieve more authentic results - the head bump function implemented in this project is overly simplistic. For further improvement on the saturation effect, impulse responses from various tape machines may be measured and incorporated into a saturation function that more accurately approximates actual behaviour. Nonetheless, the included audio examples demonstrate that the functions outlined in this report create a sonically pleasing result and a convincing simulation of the effects of analogue tape recording, capable of imparting warmth to a signal as well as some interesting pitch modulation effects.

2. REFERENCES
• Ballou, Glen M., and Wolfgang Ahnert. (1987). Handbook for Sound Engineers. 5th ed. New York, New York: Focal Press.
• Czyzewski et al. (2007). DSP Techniques for Determining “Wow” Distortion. Journal of the Audio Engineering Society, 55(4), Retrieved from http://citeseerx.ist.psu.edu/viewdoc/download?doi=10.1.1.330.9264&rep=rep1&type=pdf
• Eargle, J. (2003). Analog Magnetic Recording and Time Code. In Handbook of Recording Engineering. Boston, MA: Springer.
• Endino, J. (2013). The Unpredictable Joys of Analog Recording. Retrieved from http://www.endino.com/graphs/index.html
• Fumo, D. (2018). How Does Magnetic Tape Work? The Basics. Retrieved from https://reverb.com/au/news/how-does-magnetic-tape-work-the-basics?locale=en-AU
• Manor, E. (2020). DESC 9115 Digital Audio Systems, Lecture 10, week 10: Time Variant Systems (Delay Modulation Effects) [Lecture Powerpoint Slides]. Retrieved from https://canvas.sydney.edu.au/courses/21570
• Robjohns, H. (2010). Analogue Warmth. In Sound on Sound. Retrieved from https://www.soundonsound.com/techniques/analogue-warmth
• Tarr, E (2018). Hack Audio: An Introduction to Computer Programming and Digital Signal Processing in Matlab (Audio Engineering Society Presents), Abingdon, UK: Routledge.
• Temperton, R. (1979). Rock With You [Recorded by Michael Jackson]. On Off The Wall. [CD]. Los Angeles CA: Epic Records.
• Waves. (2020), J37 Tape. Retrieved from https://www.waves.com/plugins/j37-tape?gclid=EAIaIQobChMIh97TtsXl6QIVwTUrCh0AowbzEAAYASAAEgI_ifD_BwE#butch-vig-billy-bush-j37
• Zölzer, U. (Ed). (2011). DAFX: digital audio effects. Hoboken, NJ: John Wiley & Sons.