Embed Size (px)
Citation preview

1
Assignment 1 Note: Part I of the assignment is to be submitted through Blackboard (See instructions on
Blackboard). Parts II, III and IV are to be submitted as a hard copy during your lab
session.
Part I
Dilutions and Concentrations
When doing your calculations, do not round off your intermediate numbers. Only round off the
final answer. Your answers must be submitted to two significant figures after the decimal. For
example 2.00, 0.020, or 0.0020. It is strongly recommended that you submit your answers using
the web browser Firefox. You will be allowed two submissions!
Use the following information to answer questions 1-6
You prepare a solution by adding the following ingredients in the order indicated: 600 mL H2O,
125 mL 1.6 M LiCl, 50 mL 20 % (m/v) MgCl2, and 25 mL 10g/L NaCl. The properties of each
ingredient are as follows:
LiCl: MW 200g/mole, density 1.2g/mL, density of 1.6 M soln. 1.05g/mL
MgCl2: MW 150g/mole, density 1.3g/mL, density of 20% soln. 1.1g/mL
NaCl: MW 35g/mole, density 1.15g/mL, density of 10g/L soln. 1.03g/mL
Final solution: density: 1.25g/mL
1. What is the final molarity of MgCl2 in the solution? (0.083M)
2. What is the volume in milliliters of one part? (25 mL)
3. What is the percentage (m/m) of NaCl in the final solution? (0.025%)
4. What is the percentage (m/v) of LiCl in the final solution? (5%)
5. What is the number of parts of solvent in the final solution? (24 parts)
6. What is the percent of total solute (m/v) in the final solution? (6.28%)
7. You start with 2.5L of a KNO3 stock solution and wish to prepare 10.0 L of 1.5 M KNO3.
What percentage (m/v) would the potassium nitrate stock solution need to be if you were to
use it all? (MW of KNO3: 101g/mole) (60.6%)
8. You have a 5.0 M copper sulfate stock solution and a 2 M NaCl stock solution. You wish to
prepare a solution with a final concentration of 0.25 M copper sulfate and 0.25 M NaCl
containing 330 mL of water as a solvent. How many milliliters of the NaCl stock solution
would the solution contain? (50 mL)
9. 40.0 mL of 2.0 M Fe(NO3)3 is mixed with 2 mL of 5 M Fe(NO3)3 and 48 mL of water. What
is the final molar concentration of NO3- ions? (3M)
10. You add 3.5 L of an HCl solution of unknown concentration to 2.0 L of 0.5 M HCl and 4.5 L
of water. The final concentration of HCl was 1.5 M. What was the unknown concentration of
the initial HCl solution? (4M)
11. You prepare 100 mL of a 20% NaCl (m/v) solution. (Denisty of NaCl: 2.16 g/mL). How
many milliliters of water are in this solution? (90.74mL)
2
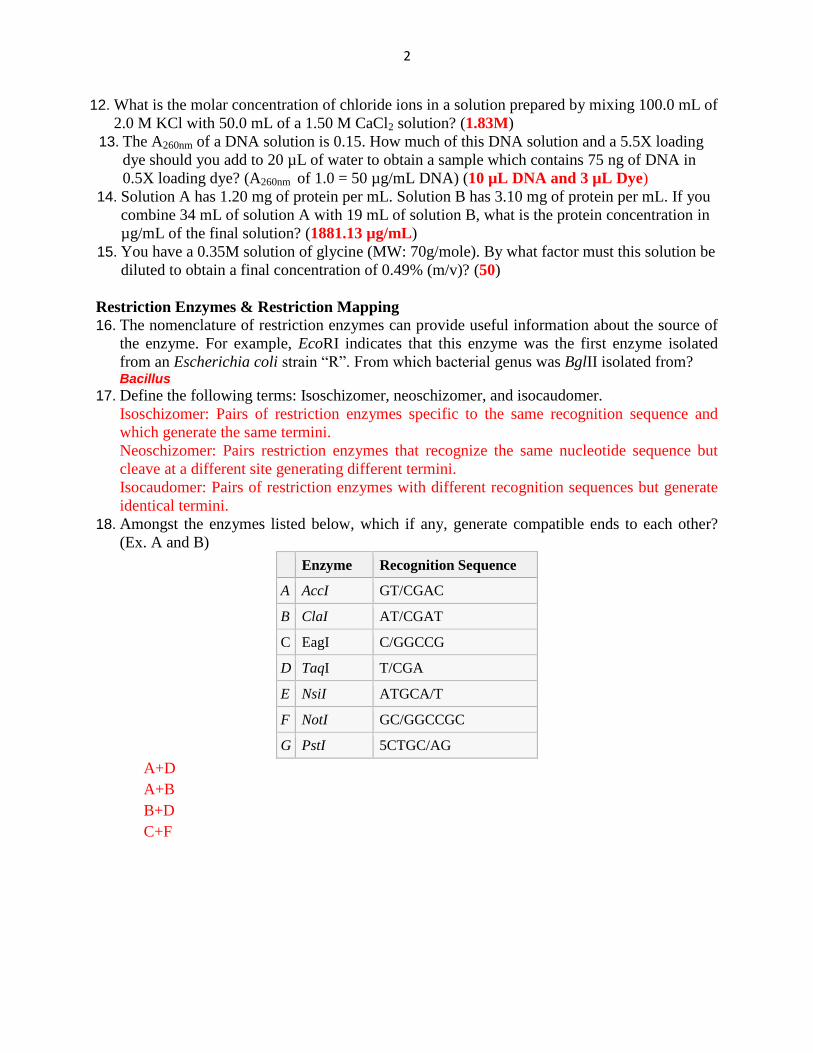
12. What is the molar concentration of chloride ions in a solution prepared by mixing 100.0 mL of
2.0 M KCl with 50.0 mL of a 1.50 M CaCl2 solution? (1.83M)
13. The A260nm of a DNA solution is 0.15. How much of this DNA solution and a 5.5X loading
dye should you add to 20 µL of water to obtain a sample which contains 75 ng of DNA in
0.5X loading dye? (A260nm of 1.0 = 50 µg/mL DNA) (10 µL DNA and 3 µL Dye)
14. Solution A has 1.20 mg of protein per mL. Solution B has 3.10 mg of protein per mL. If you
combine 34 mL of solution A with 19 mL of solution B, what is the protein concentration in
µg/mL of the final solution? (1881.13 µg/mL)
15. You have a 0.35M solution of glycine (MW: 70g/mole). By what factor must this solution be
diluted to obtain a final concentration of 0.49% (m/v)? (50)
Restriction Enzymes & Restriction Mapping
16. The nomenclature of restriction enzymes can provide useful information about the source of
the enzyme. For example, EcoRI indicates that this enzyme was the first enzyme isolated
from an Escherichia coli strain “R”. From which bacterial genus was BglII isolated from? Bacillus
17. Define the following terms: Isoschizomer, neoschizomer, and isocaudomer.
Isoschizomer: Pairs of restriction enzymes specific to the same recognition sequence and
which generate the same termini.
Neoschizomer: Pairs restriction enzymes that recognize the same nucleotide sequence but
cleave at a different site generating different termini.
Isocaudomer: Pairs of restriction enzymes with different recognition sequences but generate
identical termini.
18. Amongst the enzymes listed below, which if any, generate compatible ends to each other?
(Ex. A and B)
Enzyme Recognition Sequence
A AccI GT/CGAC
B ClaI AT/CGAT
C EagI C/GGCCG
D TaqI T/CGA
E NsiI ATGCA/T
F NotI GC/GGCCGC
G PstI 5CTGC/AG
A+D
A+B
B+D
C+F

3
19. The partial sequences recognized by two restriction enzymes “A” and “B” are indicated
below. Complete the sequences such that palindromes are generated for each of the sites. On
your palindromes indicate which phosphodiester linkage would have to be cleaved such that
protruding ends of enzyme “A” are compatible with protruding ends of enzyme “B”. Ex.
CT/GCAG
Enzyme “A”: 5’CTAATTAG 3’
Enzyme “B”: 5’AAA TTT 3’
20. Consider your answer to the previous question. A DNA fragment generated with enzyme
“A” was ligated to a DNA fragment generated with enzyme “B” as illustrated below. Which
enzymes, A, B, A & B, or neither A or B would cut the ligated DNA?
CT/AATTAG A/AATTT
CTA/ATTAG AA/ATTT
CTAATT/AG AAATT/T
CTAAT/TAG AAAT/TT
21. This picture represents an agarose gel electrophoresis of various restriction digests of the
plasmid pBR322. (This file can be obtained from this course’s web site under the heading
“Data>pBR322).
L: Molecular weight ladder U : Undigested pBR322 H : pBR322 digested with HincII P: pBR322 digested with PvuII H+P: pBR322 digested with HincII and PvuII
Answer the following questions based on the results obtained:
a. How many times did PvuII cut within the plasmid? 1
b. How many times did HincII cut within the plasmid? 2
c. How many times did HincII cut within the PvuII fragment? 2
d. How many different fragments of different sizes could be generated if the HincII +
PvuII digest was partial? 7
A/B
L U H P H+P
4
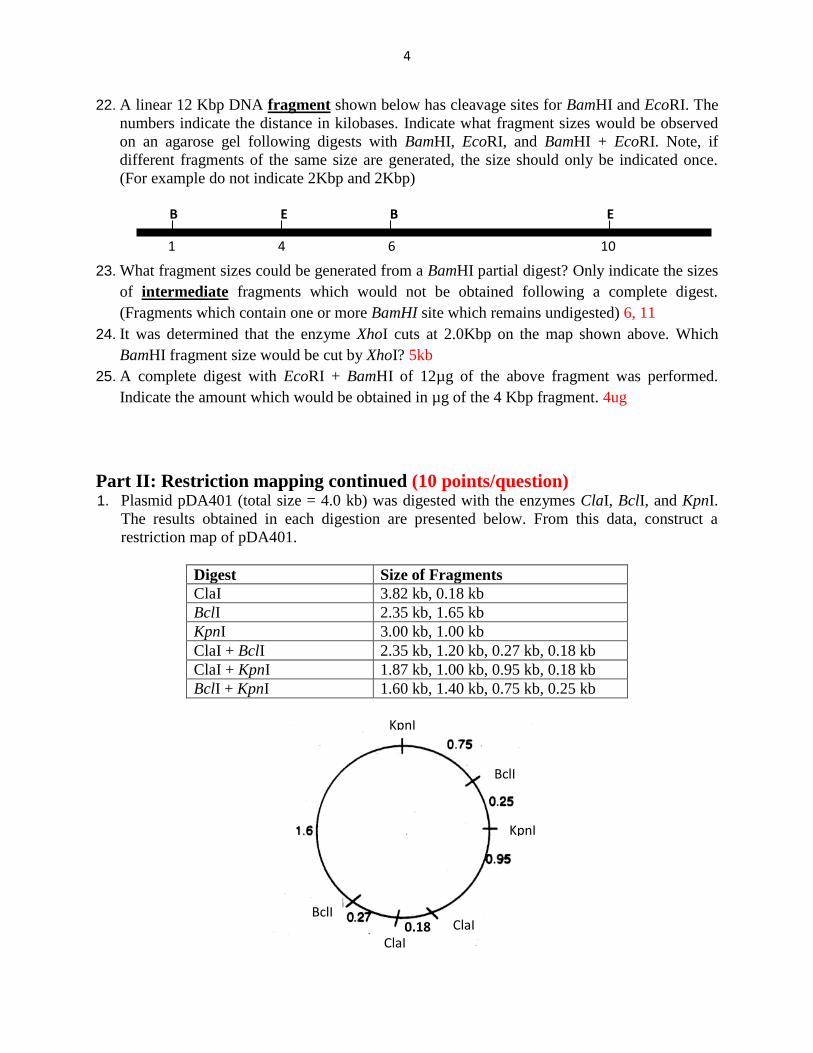
22. A linear 12 Kbp DNA fragment shown below has cleavage sites for BamHI and EcoRI. The
numbers indicate the distance in kilobases. Indicate what fragment sizes would be observed
on an agarose gel following digests with BamHI, EcoRI, and BamHI + EcoRI. Note, if
different fragments of the same size are generated, the size should only be indicated once.
(For example do not indicate 2Kbp and 2Kbp)
23. What fragment sizes could be generated from a BamHI partial digest? Only indicate the sizes
of intermediate fragments which would not be obtained following a complete digest. (Fragments which contain one or more BamHI site which remains undigested) 6, 11
24. It was determined that the enzyme XhoI cuts at 2.0Kbp on the map shown above. Which
BamHI fragment size would be cut by XhoI? 5kb
25. A complete digest with EcoRI + BamHI of 12µg of the above fragment was performed.
Indicate the amount which would be obtained in µg of the 4 Kbp fragment. 4ug
Part II: Restriction mapping continued (10 points/question) 1. Plasmid pDA401 (total size = 4.0 kb) was digested with the enzymes ClaI, BclI, and KpnI.
The results obtained in each digestion are presented below. From this data, construct a
restriction map of pDA401.
Digest Size of Fragments
ClaI 3.82 kb, 0.18 kb
BclI 2.35 kb, 1.65 kb
KpnI 3.00 kb, 1.00 kb
ClaI + BclI 2.35 kb, 1.20 kb, 0.27 kb, 0.18 kb
ClaI + KpnI 1.87 kb, 1.00 kb, 0.95 kb, 0.18 kb
BclI + KpnI 1.60 kb, 1.40 kb, 0.75 kb, 0.25 kb
1 4 6 10
B E B E
BclI
ClaI ClaI
BclI
BclI
KpnI
KpnI
0.18

5
Lab exercise: Restriction digests & agarose gel electrophoresis (Pg. 18-20)
Below is shown an agarose gel electrophoresis of the predigested DNA as you performed in the
lab. (This file can be obtained from the course’s web site under the heading Data>predigests)
2. Submit a standard curve of the molecular weight ladder (Migration distance Vs. Size in Kbp)
Grading: 2 points/criteria listed below
Graph was computer generated
Title provided
Appropriate axis labels with units is provided
Y axis is a logarithmic scale
Trend line provided (may be drawn by hand) which has a good linear range
3. Submit a table presenting the results of the restriction digests of the recombinant plasmid
which includes the following information: Enzyme used, Total number of cuts, Number of
cuts in the insert, Number of cuts in the vector, fragment sizes observed. Note sizes are
approximate.
Enzyme Total cuts Cuts in insert Cuts in vector Sizes in Kb
BamHI 2 0 1 4.5, 0.7
EcoRI 2 1 1 4.0, 1.2
HindIII 2 1 1 3.7, 1.8
PstI 1 1 1 5.3
EcoRI + HindIII 3 2 2 3.7, 1.0, 0.8
4. In a caption accompanying the table, indicate the total size of the plasmid, the size of the
vector, the size of the insert, and the restriction site (s) in which the insert was introduced in
the vector. Give points if the following information is provided:
Total size in the range of 5.2 Kb
Size of vector in the range of 3.7 Kb
Size of insert in the range of 1.8Kb
Insertion site: HindIII
L: 1Kbp molecular weight markers U: Undigested recombinant pUC9 plasmid DNA 1: Recombinant pUC9 plasmid cut with BamHI 2: Recombinant pUC9 plasmid cut with EcoRI 3: Recombinant pUC9 plasmid cut with HindIII 4: Recombinant pUC9 plasmid cut with EcoRI + HindIII 5: Recombinant pUC9 plasmid cut with PstI 6: pUC9 vector cut with BamHI
L U 1 2 3 4 5 6

6
5. Submit a figure which represents a possible restriction map of the insert within the multiple
cloning site of pUC9. Your map should be linear, to scale and only include the insert within
the multiple cloning site. (See directives on this course’s web site under the heading graphs
and figures)
Map can be computer drawn or hand drawn.
Should be to scale
Must include scale bar
Should indicate following regions: multiple cloning site and insert
Insertion site should be easily determined from figure
Part III: Bioinformatics 1 (10 points/question) 1. What is the protein accession number of the first record for actin, cytoplasmic 2 isoform 1
from the mouse (Mus musculus) obtained through a general search? NP_001300852.1
2. Does the record with the accession number NG_009024 correspond to a nucleotide or a
protein record? nucleotide
3. What was the source of the sequence corresponding to the record with the accession number
NG_009024; protein, mRNA, or genomic DNA? DNA
4. Submit a printout of a FASTA sequence of one of the unknown genes. Include the name of
the gene as a heading to the printout. Give points if provided with gene name.
5. Submit the following information with regards to each of the unknown genes from the first
bioinformatics exercise.
Accession number
Coverage
Ident.
E value
The definition
The organism from which this sequence was obtained
The gene name
The gene’s product name
The protein’s accession number Acc. Num. Cov. Ident. E value Definition Organism Product Pro. Acc.
NM_057444.3 100% 100% 0.0 Drosophila
melanogaster yellow
(y), mRNA
Drosophila
melanogaster
yellow NP_476792.
1
X91249.1 100% 100% 0.0 H.sapiens mRNA for
white gene protein
Homo sapiens white CAA62631.
1
NM_001110389.1 45% 91% 0.0 Danio rerio mitogen-
activated protein
kinase 8a (mapk8a),
mRNA.
Danio rerio mitogen-
activated
protein
kinase 8
NP_001103
859.1
Y00417.1 42% 100% 0.0 Wheat mitochondrial
COI gene for
cytochrome oxidase
subunit I
Triticum
aestivum
cytochrome
oxidase
subunit I
CAA68474.
1
XM_009805932.1 74% 90% 0.0 Nicotiana sylvestris
uncharacterized
LOC104249497
Nicotiana
sylvestris
(wood
tobacco)
LOC104249
497 isoform
X1
XP_009804
234.1

7
Part IV: Lab performance (10 points each)
Dilutions exercise with micropipettors (Pg. 13) 1. Indicate the absorbance readings obtained for each of the following solutions which you
prepared during lab exercise 1.
a. A 0.2mM solution of compound “A”.
b. A 0.036% (m/v) solution of compound “B”.
c. A 5% (v/v) solution of solution I.
d. A solution containing 0.1mg of compound “A” and 0.1% (v/v) of compound “B”.
e. A solution with the following ratio: solution I: solution II : water : 2 : 1 : 247
Grading: Within 20% of values provided: 100%
Between 21-50% of values provided: 50%
Greater than 50% difference: 0%
Determining the concentration of DNA: (Pg. 15)
2. Submit a graph representing the A260 readings Vs standard DNA concentrations. Include a
line of best fit, the R coefficient, and the formula of the line on the graph.
Includes required information
Axes are appropriately labeled
Title is included
R value is 0.9 or higher
3. According to your graph what was the DNA concentration of the undiluted unknown DNA
solution provided?
Within 20% full points
Between 21%-50% 50% of points
Deviation from expected value greater than 50% 0 points.
Restriction digests & agarose gel electrophoresis (Pg. 16-20)
4. Submit an appropriate figure of your gel electrophoresis including an accompanying legend.
(Follow the directives for figures and graphs available on this course’s web site)
(One point/criteria)
Figure provided with Accompanying legend
Plasmid isolation (lane 2) got something of acceptable yield
Figure title provided
Lanes are labelled and easy to understand
First lane is mw ladder
Second lane is undigested control
MW sizes of standard are indicated
Loading is consistent between lanes
Gel clearly shows bands and migration is satisfactory
Legend indicates parameters of migration: Voltage, agarose concentration, samples loaded

8
Assignment #2 Note: Part I of this assignment is to be submitted through Blackboard (See instructions on
Blackboard). Parts II, III and IV are to be submitted as a hard copy during your lab
session.
Part I: Restriction digests and mapping
The table below presents the results of different digests of a plasmid. All sizes are in base pairs.
BamHI 13199, 8572, 4627
KpnI 13199
NheI 13199
BamHI +KpnI 12126, 9645, 8572, 3554, 1073
BamHI + NheI 10701, 11070, 8572, 2498, 2129
NheI + KpnI 11774, 1425
1. One of the enzymes used only partially digested the DNA. Which enzyme is it? BamHI
2. Indicate the size in base pairs of one of the intermediate products which represents an
incompletely digested DNA fragment in the double digests. 12126, 9645, 10701
3. What is the total plasmid size in base pairs? 13199
4. What are the distances between the KpnI and NheI restriction sites? 1425 + 11774
5. What are the distances between the BamHI and NheI restriction sites? 2498 + 2129
6. What are the distances between the BamHI and KpnI restriction sites? 1073 + 3554
The table below presents the results of different complete digests of a linear DNA fragment. All
sizes are in base pairs.
NcoI 5023, 1295
NruI 4229, 2089
XbaI 3242, 2374, 702
NcoI + NruI 2934, 2089, 1295
NcoI + XbaI 3242, 1295, 1079, 702
NruI + XbaI 2374, 1855, 1387, 702
7. What is the total size of the undigested fragment? 6318
8. Among the fragments obtained with the XbaI digest, which one has XbaI overhangs on both
ends? Indicate the size of the fragment. 3242
9. Digestion of the fragment indicated in question 8 with NruI would generate fragments of
what sizes? 1855, 1387
10. Among the fragments generated in the NcoI + NruI digest, which one could be ligated and
cloned in a vector digested with NcoI + NruI? Indicate the size of the fragment. 2934
11. What is the distance between the NcoI and NruI restriction sites? 2934
12. What are the distances between the XbaI sites and the ends of the fragment? 2374 & 702

9
13. The restriction enzyme ApoI cleaves the sequence R/AATTY (R= A or G and Y = C or T).
How many different palindromes does ApoI recognize? 2
14. What would be the average fragment size which would be expected following the digestion
of genomic DNA with ApoI? Assume an equal distribution of A, G, C, and T. 2048
15. True or false; an overhang generated following the cleavage of a palindrome recognized by
ApoI would necessarily be compatible with any other palindrome cleaved by ApoI? true
16. The enzyme PspN4I cleaves the sequence GG/NNCC (N= any of the four bases). How many
times would you expect PspN4I to digest a 30 kb genome? Round off to the nearest whole
number.29
17. True or false, an overhang generated following the cleavage of a palindrome recognized by
PspN4I would necessarily be compatible with any other palindrome cleaved by PspN4I?
False
18. Sequence A, which contains two BstBI sites (TT/CGAA), was digested with BstBI. The
resulting fragment was then ligated into the unique TaqI restriction site (T/CGA) within
vector B.
Sequence A: CAG TT/CGAA TTC • • • • • • • • • • • • • • • • GGC TT/CGAA AAG
Vector B: TGG T/CGA CAC
Which enzyme (s) could be used to release the cloned DNA fragment from the recombinant
vector B? BstBI, TaqI , both, or neither. TaqI
PCR
Consider the following information to answer questions 19-24:
The partial sequence of a 1 kb region at the end of a linear single stranded 50 kb genome is
shown:
19. Indicate the sequence of a forward primer of ten bases that could be used in a PCR
amplification to amplify the 1 kb region. TACCTTGTAA
20. Indicate the sequence of a reverse primer of ten bases that could be used in a PCR
amplification to amplify the 1 kb region. GCAACGTGTA
21. What is the minimum number of cycles required to obtain a double stranded amplification
product which starts and ends with the primer sequences you’ve designed? 3
22. PCR amplification was performed with 10ng of the above described genome using the
primers you’ve designed. What mass of the double stranded PCR product (in µg) would you
have after 30 cycles? 53687ug
3’-CGTTGCACAT • • • • • • • • • • • • • • • • AATGTTCCAT• • • • • • • -5’
1 kb region
1 50 000
│ │
10
23. How many additional PCR cycles would be required to attain the same yield of product
which was obtained in the previous question if you had started with 1 ng of genomic DNA
instead? 3.3
24. Shown below, is the partial sequence of the region of the genome described previously:
Indicate the sequence of the first 20 bases of the PCR product which would be synthesized
using your forward primer.
TACCTTGTAATTTATAGGGC
GCAACGTGTAAATTCCGGTG
25. Your primers allowed you to amplify the 1 kb region of interest. You now wish to clone the
amplified product in a 2.5 kb vector. To do so, you digest the amplicon and 100ng of the
vector with the appropriate enzymes. How much of the digested amplicon (in ng) should be
added to the ligation mix in order to have an insert to vector ratio of 3:1? 120ng
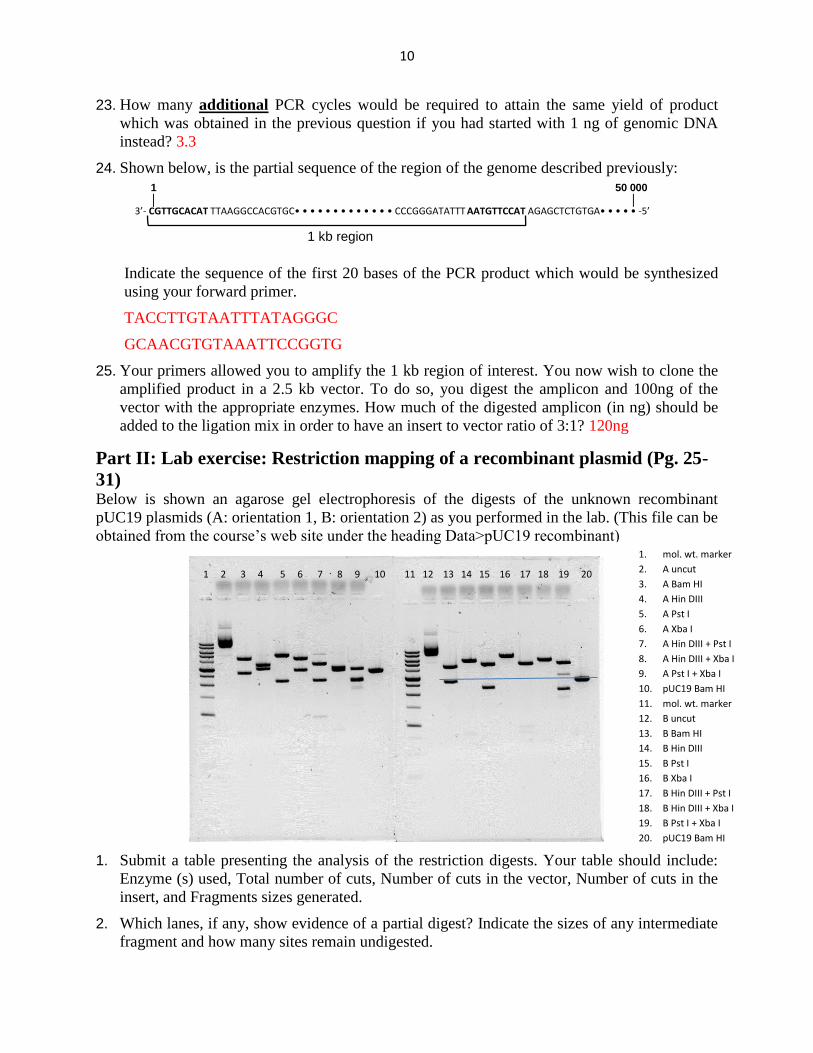
Part II: Lab exercise: Restriction mapping of a recombinant plasmid (Pg. 25-
31) Below is shown an agarose gel electrophoresis of the digests of the unknown recombinant
pUC19 plasmids (A: orientation 1, B: orientation 2) as you performed in the lab. (This file can be
obtained from the course’s web site under the heading Data>pUC19 recombinant)
1. Submit a table presenting the analysis of the restriction digests. Your table should include:
Enzyme (s) used, Total number of cuts, Number of cuts in the vector, Number of cuts in the
insert, and Fragments sizes generated.
2. Which lanes, if any, show evidence of a partial digest? Indicate the sizes of any intermediate
fragment and how many sites remain undigested.
3’- CGTTGCACAT TTAAGGCCACGTGC• • • • • • • • • • • • • CCCGGGATATTT AATGTTCCAT AGAGCTCTGTGA• • • • • -5’
1 kb region
1 50 000 │ │
1. mol. wt. marker
2. A uncut
3. A Bam HI
4. A Hin DIII
5. A Pst I
6. A Xba I
7. A Hin DIII + Pst I
8. A Hin DIII + Xba I
9. A Pst I + Xba I
10. pUC19 Bam HI
11. mol. wt. marker
12. B uncut
13. B Bam HI
14. B Hin DIII
15. B Pst I
16. B Xba I
17. B Hin DIII + Pst I
18. B Hin DIII + Xba I
19. B Pst I + Xba I
20. pUC19 Bam HI
1 2 3 4 5 6 7 8 9 10 11 12 13 14 15 16 17 18 19 20
11
3. In which restriction site of the multiple cloning site was the insert introduced?
4. What is the size of the insert?
5. Submit a figure of the restriction maps of the insert. Your maps must be linear, include the
multiple cloning site, the insertion site, the size of the insert, the positions in the multiple
cloning site or the insert of all the enzymes tested. Your figure must be to scale. Follow the
directives for generating such a figure under the heading Graphs/Figures on this course's web
site.
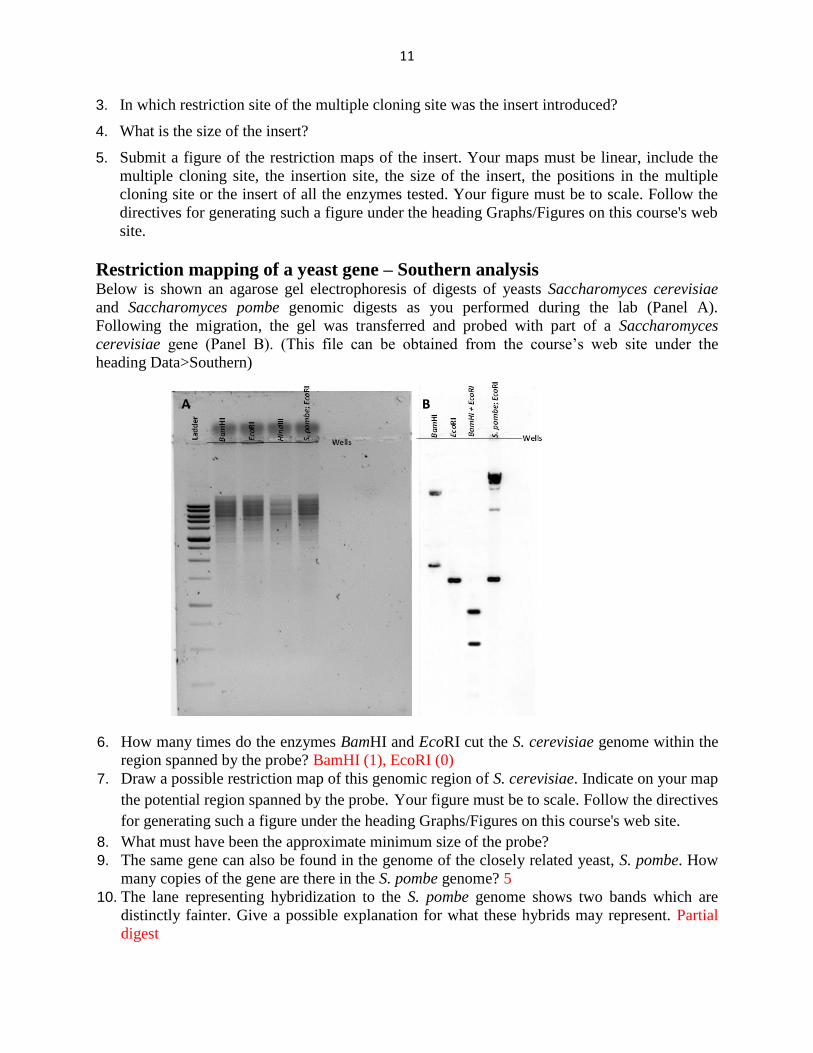
Restriction mapping of a yeast gene – Southern analysis Below is shown an agarose gel electrophoresis of digests of yeasts Saccharomyces cerevisiae
and Saccharomyces pombe genomic digests as you performed during the lab (Panel A).
Following the migration, the gel was transferred and probed with part of a Saccharomyces
cerevisiae gene (Panel B). (This file can be obtained from the course’s web site under the
heading Data>Southern)
6. How many times do the enzymes BamHI and EcoRI cut the S. cerevisiae genome within the
region spanned by the probe? BamHI (1), EcoRI (0)
7. Draw a possible restriction map of this genomic region of S. cerevisiae. Indicate on your map
the potential region spanned by the probe. Your figure must be to scale. Follow the directives
for generating such a figure under the heading Graphs/Figures on this course's web site.
8. What must have been the approximate minimum size of the probe?
9. The same gene can also be found in the genome of the closely related yeast, S. pombe. How
many copies of the gene are there in the S. pombe genome? 5
10. The lane representing hybridization to the S. pombe genome shows two bands which are
distinctly fainter. Give a possible explanation for what these hybrids may represent. Partial
digest
A B

12

13
Part III: Bioinformatics 2
1. Provide theoretical restriction maps of the 5 unknown genes available on this course’s Web
page. Indicate below each map the name of the gene and list the enzymes which do not cut.
Give points if done and includes required info.
2. Compare the theoretical maps generated in the previous question to the experimental map of
the unknown insert you analyzed in the lab (“Restriction mapping of a recombinant
plasmid (Pg. 25-31)”). The unknown insert corresponds most closely to which gene? Cox
3. Indicate how many times each of the following enzymes cut within the unknown insert
identified in question 2: AccI, BglII, MboI, NcoI, and NotI. (3, 0, 17, 2 and 0 respectively)
4. Amongst the enzymes indicated in the previous question, which one cuts the most often
within the DNA insert? Give a reason which would explain why this enzyme cuts more often
than the others. MboI, shorter recognition sequence therefore higher probability
5. Provide a restriction map showing the positions of the restriction sites PstI, ScaI, NcoI, and
XbaI within the region spanned by positions 2046-3948 of the sequence “Unknown
sequence” available on this course’s Web page. Indicate below the map the definition of the
gene and the enzymes which do not cut.
NcoI does not cut. Gene name: Human mRNA for LCA-homolog.
6. The genome from which the sequence described in the previous question was obtained was
digested with NcoI + ScaI and then migrated on an agarose gel. The gel was then transferred
and probed with a sequence spanning the region 1491 – 2491 of the unknown sequence. How
many bands and of what size would you expect on the Southern transfer? 2 bands: 645 +
1843bases.
Part IV: Lab performance 1. Submit a figure representing the agarose gel electrophoresis showing your plasmid isolation
and the digests of the unknown recombinant plasmid. Make sure to include an appropriate
legend. Follow the directives for figures on the Web page of this course and to include all the
required information in the legend for the understanding and interpretation of the figure.
(One point/criteria)
Figure provided with Accompanying legend
Figure title provided
Lanes are labelled and easy to understand
First lane is mw ladder
Second lane is undigested control
14
MW sizes of standard are indicated
Loading is consistent between lanes
Digests are complete for the most part
Gel clearly shows bands and migration is satisfactory
Legend indicates parameters of migration: Voltage, agarose concentration, samples loaded
2. Provide the following information for your yeast genomic DNA isolation: ABS260, ABS280,
Ratio ABS260/ ABS280, Concentration in µg/µL of undiluted preparation, Total yield in µg.