Embed Size (px)
Citation preview
IJRIM Volume 6, Issue 4 (April, 2016) (ISSN 2231-4334) International Journal of Research in IT & Management (IMPACT FACTOR – 5.96)
International Journal of Research in IT & Management
Email id: [email protected],http://www.euroasiapub.org
29
Assets Management Efficiency of Indian Textile companies - A Comparative Analysis
Dr. B. MADHUSUDHAN REDDY
Professor in Finance
Department of Management Studies,
Guru Nanak Institute of Technology, Hyderabad, India
ABSTRACT
The Textile Sector in India ranks next to Agriculture. Textile is one of India’s oldest industries and has a formidable presence in the national economy. The textile industry occupies a unique place in our country. One of the earliest to come into existence in India, it accounts for 14% of the total Industrial production, contributes to nearly 27% of the total exports and is the second largest employment generator after agriculture. Like other organizations, all textile companies keep various assets such as inventory, debtors, fixed assets, investments etc. to carry out the business operations effectively and efficiently. However, managing these assets effectively is a crucial thing. Asset Management Ratios attempt to measure the firm's success in managing its assets to generate sales. These ratios can provide insight into the success of the firm's credit policy and inventory management. These ratios are also known as Activity or Turnover Ratios. This paper represents an empirical study which examines the assets management in textile companies in India with a data of 5 years. For the purpose of the study secondary data is used. For the purpose of analysis ratios and arithmetic mean have been used and to test hypothesis, ANOVA test (F test) has been applied.
Key words: Assets management, Inventory turnover ratio, Debtors turnover ratio, Fixed assets turnover ratio, Total assets turnover ratio and ANOVA test.
Introduction
Textile industry plays a significant role in the economy. The Indian textile industry is one of the largest and most important sectors in the economy in terms of output, foreign exchange earnings and employment in India. India Textile Industry is one of the leading textile industries in the world. Though was predominantly unorganized industry even a few years back, but the scenario started changing after the economic liberalization of Indian economy in 1991. The opening up of economy gave the much-needed thrust to the Indian textile industry, which has now successfully become one of the largest in the world. India textile industry largely depends upon the textile manufacturing and export. It also plays a major role in the economy of the country. India earns about 27% of its total foreign exchange through textile exports. Further, the textile industry of India also contributes nearly 14% of the total industrial production of the country. It also contributes around 3% to the GDP of the country. India textile industry is also the largest in the country in terms of employment generation. It not only generates jobs in its own industry, but also opens up scopes for the other ancillary sectors. India textile industry currently generates employment to more than 35 million people. It is also estimated that, the industry will generate 12 million new jobs by the year 2010.

IJRIM Volume 6, Issue 4 (April, 2016) (ISSN 2231-4334) International Journal of Research in IT & Management (IMPACT FACTOR – 5.96)
International Journal of Research in IT & Management
Email id: [email protected],http://www.euroasiapub.org
30
India has several advantages in the textile sector, including abundant availability of raw material and labour. It is the second largest player in the world cotton trade. It has the largest cotton acreage, of about nine million hectares and is the third largest producer of cotton fibre in the world. It ranks fourth in terms of staple fibre production and fourth in polyester yarn production. The textile industry is also labour intensive, thus India has an advantage.
As the textile industry need huge fund allocation which makes necessary for the companies to manage all financial affairs in well structured and organized manner to activate the dormant financial allocations, financing the deficit or disposal of surplus. The major factors have been identified as reason for affecting financial performance of textile companies are heavy capital investment, high collection period, frequent policies from the side of the government which fails forecasting.
The efficient management of assets is very important for a business survival and thus a factor for overall boost in profitability. Efficient asset management involves excessive planning and controlling. There should be neither excessive investments or shortage of investments in assets. Due to excess investments in assets, the firm cannot get optimum returns from the assets and similarly shortage of investments results in poor profitability of the firm as it cannot grab the market opportunities as a result of shortage of funds. Asset management includes management of inventory, management of receivables, management of fixed assets and total assets etc.
Review Of Literature
A non-systematic literature review was undertaken to identify the asset management ratios included in articles in peer-reviewed journals, industry publications, and articles in magazines and newspaper. Articles published prior to 1995 were excluded from the searches in order to ensure that only the most recent studies were included. This exclusion was important because of the many changes in textile sector since 1991 and the likely lower relevance of articles prior to these changes.
P. Janki Ramadu & S.Durga Rao (2007) under their study – “Receivables Management of the Indian Commercial Vehicles Industry”, revealed that the industry had managed receivables efficiently whereas a few individual companies had far less satisfactory scores in this respect.
Ranchandran, A and Janakiraman, M, (2009), Analyzed the relationship between current assets efficiency and earnings before interest and tax of the paper Industry in Indian capital management. The study revealed that capnl conversion cycle and inventory days had negative correlative with earnings before interest and tax, while accounts payable days and accounts receivable days related positively with earnings before interest and tax.
Grzeg or2 m. m (2008) in his study a portfolio management approach in accounts receivable management, used portfolio management theory to determine the level of accounts receivable in a firm he paid out that there was an increase in level of accounts receivable in a firm increase both net working capital and cost of holding and managing account receivables.
Kesseven Padachi (2006) in his study used return on total assets as a measure of profitability and the relation between working capital management and corporate profitability, which is investigated for a sample of 58 small manufacturing firms, using panel data analysis for the period 1998 – 2003. The regression result of his study indicates that high investment in inventories and receivables is associated with lower profitability.
Jasmine Kaur (2010) did a study which is concerned with the problems that arise in attempting to manage the Current Assets, Current Liabilities and the interrelation that exists between them. This is a two-dimensional study which examined the policy and practices of cash management,
IJRIM Volume 6, Issue 4 (April, 2016) (ISSN 2231-4334) International Journal of Research in IT & Management (IMPACT FACTOR – 5.96)
International Journal of Research in IT & Management
Email id: [email protected],http://www.euroasiapub.org
31
evaluate techniques of Investment Management, Receivable and Payable Management. He revealed that there is a standoff between liquidity and profitability and the selected corporate has been achieving a trade off between risk and return. Efficient management of working Capital and its components have a direct effect on the profitability levels of tyre industry.
Jose at al. (2003) tested the corporate returns and cash conversion cycle of 2,718 firms for the period 1974-1993 by using multiple regression analysis. In their research, an aggressive liquidity management (lower CCC) is associated with higher profitability for several industries, including natural resources, manufacturing, service, Retail/wholesale, and professional services.
All the above studies showed that there is significant need to manage current assets as well as fixed assets effectively to enhance the performance of the textile industry.
Objectives Of The Study
1. To analyse the profile of Raymond Ltd., Arvind Ltd. and Bombay Dyeing companies. 2. To understand the concept of asset management. 3. To interpret the asset management efficiency of the select companies.
Research Methodology
Source of Data
The study is based on secondary data. The data pertaining to sample textile companies were collected from the annual reports of the respective companies, magazines and journals relating to finance have also been used as sources of data. The present study is descriptive and analytical in nature.
Statistical Tools
To compare the management efficiency of selected textile companies, the important statistical techniques such as asset management ratios, arithmetic mean and one – way analysis of variance (ANOVA) have been used for the study.
Period of Study
The study covers a period of five years from 2010-11 to 2014-2015.
Sampling
The sample for the present study consists of three major textile companies in India such as Raymond Ltd., Arvind Ltd. and Bombay Dyeing.
Key variables
The variable that have been adopted for the present study are Inventory Turnover Ratio, Debtors Turnover Ratio, Fixed Assets Ratio and Total Assets Ratio.
Hypotheses
H0 = There is no significant difference between the selected variables of the sample textile companies.
HA = There is significant difference between selected variables of the sample textile companies.
IJRIM Volume 6, Issue 4 (April, 2016) (ISSN 2231-4334) International Journal of Research in IT & Management (IMPACT FACTOR – 5.96)
International Journal of Research in IT & Management
Email id: [email protected],http://www.euroasiapub.org
32
Scope of the Study
The research study covers three important major textile companies; Raymond Ltd., Arvind Ltd. and Bombay Dyeing.
Limitations of the study
1. The present study is based on only secondary data. 2. Analysis is restricted to only textile sector. 3. Study is only confined to comparative analysis of asset management efficiency of three major
textile companies.
Raymond Ltd. Profile
Raymond Ltd., part of the Raymond Group, operates as a textile company in India. It was incorporated as the Raymond Woollen mill during the year 1925 near Thane Creek. The company has its registered office located in Maharashtra. Lala Kailashpat Singhania took over The Raymond Woollen Mill in the year 1944. In 1958, the first exclusive Raymond Retail showroom, King's Corner, was opened at Ballard Estate in Mumbai. In 1968, Raymond had set up a readymade garments plant at Thane. A new manufacturing facility was set up at Jalgaon(Maharashtra) during the year 1979 to meet the increasing demand for worsted woollen fabrics.
Raymond Ltd is largest the integrated manufacturer of worsted fabric in the world based in Mumbai, Maharashtra. It has over 60% market share in worsted suiting in India. It also the India’s biggest woollen fabrics maker. Textile division of the company has a distribution network of more than 4,000 multi-brand outlets and over 637 exclusive retail shops in the domestic market itself. Suitings are available in India in over 400 towns through 30,000 retailers and an exclusive chain is present in over 150 cities across India. Its products exports to over 55 countries including US, Canada, Europe, Japan and the Middle East. It has more than 20,000 design and colours of suiting fabric which makes it one of largest collection of designs and colours by single company. It was listed as India's most trusted apparel brand by The Brand Trust Report in 2015. In November 2015 Raymond announced that Sanjay Bahl would be taking over M Shivkumar as CFO.
Arvind Ltd. Profile
Arvind Limited (formerly Arvind Mills) is a textile manufacturer and the flagship company of the Arvind Group. Its headquarters is in Naroda, Ahmedabad, Gujarat, India. The Company manufactures cotton shirting, denim, knits and bottom weights (Khakis) fabrics, and jeans and shirts garments. It has also recently ventured into technical textiles when it started Advanced Materials Division in 2011. It is India's largest denim manufacturer apart from being world’s fourth-largest producer and exporter of denim.
Sanjaybhai Lalbhai is the Chairman & Managing Director of Arvind & Lalbhai Group. In the early 1980s, Sanjay Lalbhai led the 'Reno-vision' whereby the company brought denim into the domestic market, thus starting the jeans revolution in India. Today it retails its own brands like Flying Machine, Newport and Excalibur and licensed international brands like Arrow, Lee, Wrangler and Tommy Hilfiger, through its nationwide retail network. Arvind also runs a value retail chain, Mega-mart, which stocks company brands. It has Jointly ventured with PVH Corp for Calvin Klein Businesses in India and with OG Cop, Japan, for manufacturing and sale of non-woven fabrics, project being spearheaded by Dr. Kunal Shah in 2014.

IJRIM Volume 6, Issue 4 (April, 2016) (ISSN 2231-4334) International Journal of Research in IT & Management (IMPACT FACTOR – 5.96)
International Journal of Research in IT & Management
Email id: [email protected],http://www.euroasiapub.org
33
Bombay Dyeing Profile
Bombay Dyeing (full name: The Bombay Dyeing & Mfg. Co. Ltd., established 1879) is the flagship company of the Wadia Group, engaged mainly into the business of Textiles. In the late 19th century, Bombay was one of the major cotton ports of the world. Nowrosjee Wadia sensed an opportunity in India's mushrooming textile industry and on August 23, 1879, Bombay Dyeing was founded in a humble redbrick shed. Since then, Bombay Dyeing has grown into one of India's largest producer of textiles. Bombay Dyeing is one of India's largest producers of textiles. Its current chairman is Nusli Wadia. In March 2011, Jehangir 'Jeh' Wadia, the younger son of Nusli, has been named the managing director of Wadia Group's flagship, Bombay Dyeing & Manufacturing Company, while the elder son, Ness has resigned from the post of joint MD of the company. Ratan Tata, the ex-chairman of Tata group was on the board of directors till 2013. He resigned and Cyrus Mistry took over. The company was ranked 68 in the Business India Super 100 list in 1997 and was ranked 300 in the ET 500 list in 2010.The company sponsors many events, including Bombay Dyeing Gladrags Mrs. India contest. The daily production at Bombay Dyeing exceeds 300,000 meters of fabrics and it has a distribution chain consisting of 600 plus exclusive shops spread all over the country. Bombay Dyeing, exports to advanced countries such as USA, countries in European Union, Australia and New Zealand, and its sales turnover is more or less equally divided between National and International markets.
Assets Management
Every business needs investment to procure fixed assets, which remain in use for a longer period. Money invested in these assets is called ‘Long term Funds’ or ‘Fixed Capital’. Business also needs funds for short-term purposes to finance current operations. Investment in short term assets like cash, inventories, debtors etc., is called ‘Short-term Funds’ or ‘Working Capital’. The ‘Working Capital’ can be categorised, as funds needed for carrying out day-to-day operations of the business smoothly. The management of the working capital is equally important as the management of long-term financial investment. Even a business which is fully equipped with all types of fixed assets required is bound to collapse without (i) adequate supply of raw materials for processing; (ii) cash to pay for wages, power and other costs; (iii) creating a stock of finished goods to feed the market demand regularly; and, (iv) the ability to grant credit to its customers. All these require working capital. Working capital is thus like the lifeblood of a business. The business will not be able to carry on day-to-day activities without the availability of adequate working capital. So these current assets such as cash, inventory, debtors, investments and fixed assets have to be managed effectively and efficiently so that the firm will get good returns from those assets. A balance has to be struck between risk and return. Asset utilization measures allow investors to understand how well a company uses its assets in operations. Investors will typically track sales to fixed assets over time, looking for long term patterns in this metric. Companies with ratios that are higher than their industry average, or have ratios that increase over time, are desirable.
Data Analysis And Interpretation
Inventory Turnover Ratio (ITR): The inventory turnover formula measures the rate at which inventory is used over a measurement period. One can use the formula to see if a business has an excessive inventory investment in comparison to its sales level, which can indicate either unexpectedly low sales or poor inventory planning. When there is a low rate of inventory turnover, this implies that a business may have a flawed purchasing system that bought too many goods, or that stocks were increased in anticipation of sales that did not occur. When there is a high rate of inventory turnover, this implies that the purchasing function is tightly managed. However, it may mean that a business does not have the cash reserves to maintain normal inventory levels, and so is turning away prospective sales.

IJRIM Volume 6, Issue 4 (April, 2016) (ISSN 2231-4334) International Journal of Research in IT & Management (IMPACT FACTOR – 5.96)
International Journal of Research in IT & Management
Email id: [email protected],http://www.euroasiapub.org
34
Table 1: Inventory Turnover Ratio
Year Raymond
Ltd. Arvind Ltd.
Bombay Dyeing
2010-11 3.79 3.84 1.8
2011-12 4.42 4.8 1.44
2012-13 4.04 4.32 1.81
2013-14 3.96 5.07 3.7
2014-15 4.59 5.02 3.54
Mean 4.16 4.61 2.458
Grand Mean(X) = (4.16+4.61+2.458)/3 = 3.742667
Sum of variance between samples =
(Mean -Grand Mean)2 + (Mean - Grand Mean)2 + (Mean - Grand Mean)2x5
= (4.16 -3.74)2 + (4.61 - 3.74)2 + (2.458 - 3.74)2x5
= 9.15092
Table 2: Variance within samples
Year (Observation
- Mean)2
(Observation -
Mean)2
(Observation -
Mean)2
2010-11 0.1369 0.5929 0.432964
2011-12 0.0676 0.0361 1.036324
2012-13 0.0144 0.0841 0.419904
2013-14 0.04 0.2116 1.542564
2014-15 0.1849 0.1681 1.170724
Total 0.4438 1.0928 4.60248
Sum of variance within samples 6.13908
Table 3: Analysis of Variance
Source of
variance Sum of squares
Degrees of
freedom Mean square
Between
Samples 9.15092 2 4.57546
Within
Samples 6.13908 12 0.51159
F = Mean square between the samples
Mean square within the samples
F = 4.57546
0.51159 = 8.943607185
The following hypothesis has been used to compare and test the ITR of the textile companies.

IJRIM Volume 6, Issue 4 (April, 2016) (ISSN 2231-4334) International Journal of Research in IT & Management (IMPACT FACTOR – 5.96)
International Journal of Research in IT & Management
Email id: [email protected],http://www.euroasiapub.org
35
Null Hypothesis 1 (H01): There is no significant difference between ITR of all the three textile companies.
According to table 3, since the calculated value (8.9436) is higher than the tabulated value (3.8852) at 5% level of significance, the null hypothesis1 is rejected and therefore I conclude that there is a significance difference between ITR of Raymond Ltd., Arvind Ltd. And Bombay Dyeing.
Debtors Turnover Ratio (DTR) : Debtors Turnover Ratio indicates the number of times average debtors are turned over during a year. This ratio is also known as accounts receivable turnover ratio. Debtors Turnover Ratio indicates the speed at which the sundry debtors are converted in the form of cash. It indicates the number of times the debtors are turned over a year. It is the reliable measure of receivables from credit sales. The higher the value the more efficient is the management of debtors. Similarly, lower the ratio means inefficient management of debtors.
Table 4: Inventory Turnover Ratio
Year Raymond Ltd. Arvind Ltd. Bombay
Dyeing
2010-11 4.86 5.43 4.93
2011-12 5.28 7.21 17.33
2012-13 5.03 8.92 13.15
2013-14 4.87 9.93 12.88
2014-15 5.04 10.65 10.33
Mean 5.016 8.428 11.724
Grand Mean (X) = (5.016+8.428+11.724)/3 = 8.389333
Sum of variance between samples =
(Mean -Grand Mean)2 + (Mean - Grand Mean)2 + (Mean - Grand
Mean)2x5
=
(5.016 -8.389)2 + (8.428 - 8.389)2 + (11.724 - 8.389)2x5
= 66.989775
Table 5: Variance within samples
Year (Observation
- Mean)2
(Observation -
Mean)2
(Observation -
Mean)2
2010-11 0.024336 8.988004 46.158436
2011-12 0.069696 1.483524 31.427236
2012-13 0.000196 0.242064 2.033476
2013-14 0.021316 2.256004 1.336336
2014-15 0.000576 4.937284 1.943236
Total 0.11612 17.90688 82.89872
Sum of variance within samples 100.92172
IJRIM Volume 6, Issue 4 (April, 2016) (ISSN 2231-4334) International Journal of Research in IT & Management (IMPACT FACTOR – 5.96)
International Journal of Research in IT & Management
Email id: [email protected],http://www.euroasiapub.org
36
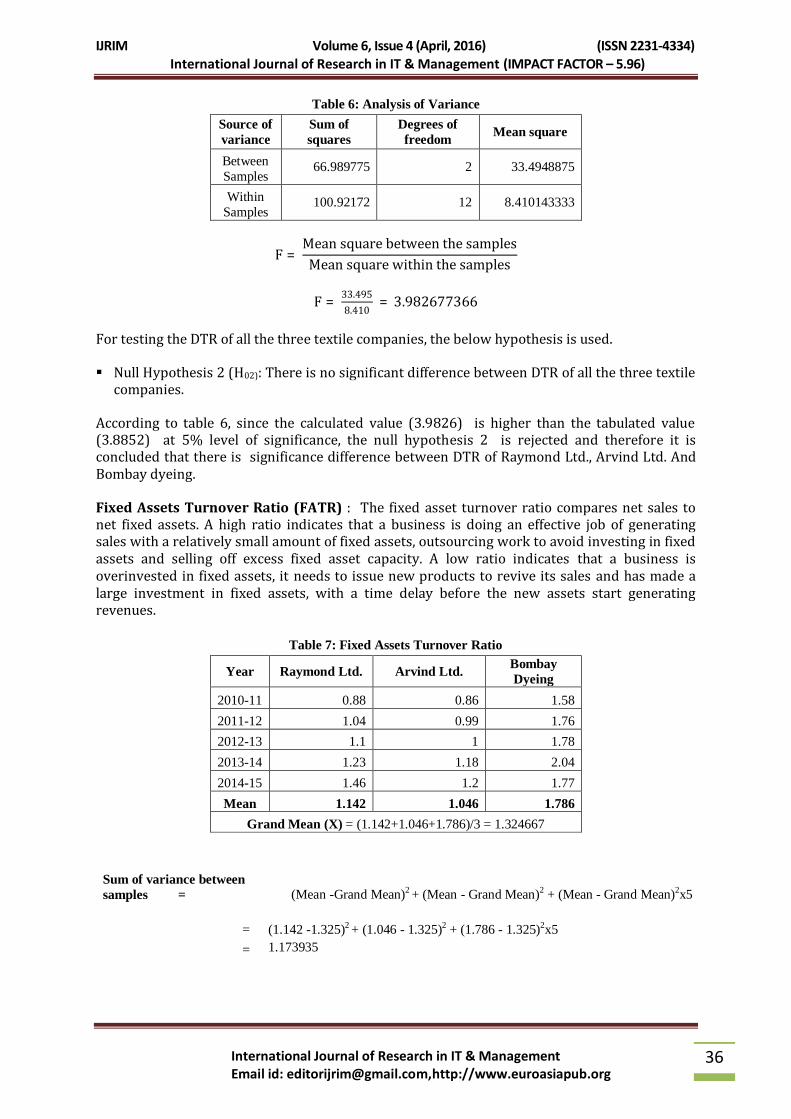
Table 6: Analysis of Variance
Source of
variance
Sum of
squares
Degrees of
freedom Mean square
Between
Samples 66.989775 2 33.4948875
Within
Samples 100.92172 12 8.410143333
F = Mean square between the samples
Mean square within the samples
F = 33.495
8.410 = 3.982677366
For testing the DTR of all the three textile companies, the below hypothesis is used.
Null Hypothesis 2 (H02): There is no significant difference between DTR of all the three textile companies.
According to table 6, since the calculated value (3.9826) is higher than the tabulated value (3.8852) at 5% level of significance, the null hypothesis 2 is rejected and therefore it is concluded that there is significance difference between DTR of Raymond Ltd., Arvind Ltd. And Bombay dyeing.
Fixed Assets Turnover Ratio (FATR) : The fixed asset turnover ratio compares net sales to net fixed assets. A high ratio indicates that a business is doing an effective job of generating sales with a relatively small amount of fixed assets, outsourcing work to avoid investing in fixed assets and selling off excess fixed asset capacity. A low ratio indicates that a business is overinvested in fixed assets, it needs to issue new products to revive its sales and has made a large investment in fixed assets, with a time delay before the new assets start generating revenues.
Table 7: Fixed Assets Turnover Ratio
Year Raymond Ltd. Arvind Ltd. Bombay
Dyeing
2010-11 0.88 0.86 1.58
2011-12 1.04 0.99 1.76
2012-13 1.1 1 1.78
2013-14 1.23 1.18 2.04
2014-15 1.46 1.2 1.77
Mean 1.142 1.046 1.786
Grand Mean (X) = (1.142+1.046+1.786)/3 = 1.324667
Sum of variance between
samples =
(Mean -Grand Mean)2 + (Mean - Grand Mean)2 + (Mean - Grand Mean)2x5
=
(1.142 -1.325)2 + (1.046 - 1.325)2 + (1.786 - 1.325)2x5
= 1.173935

IJRIM Volume 6, Issue 4 (April, 2016) (ISSN 2231-4334) International Journal of Research in IT & Management (IMPACT FACTOR – 5.96)
International Journal of Research in IT & Management
Email id: [email protected],http://www.euroasiapub.org
37
Table 8: Variance within samples
Year (Observation
- Mean)2
(Observation -
Mean)2
(Observation -
Mean)2
2010-11 0.068644 0.034596 0.042436
2011-12 0.010404 0.003136 0.000676
2012-13 0.001764 0.002116 3.6E-05
2013-14 0.007744 0.017956 0.064516
2014-15 0.101124 0.023716 0.000256
Total 0.18968 0.08152 0.10792
sum of variance within samples 0.37912
Table 9: Analysis of Variance
Source of
variance
Sum of
squares
Degrees of
freedom Mean square
Between
Samples 1.173935 2 0.5869675
Within
Samples 0.37912 12 0.031593333
F = Mean square between the samples
Mean square within the samples
F = 0.5869675
0.031593333 = 18.57884047
For testing the FATR of all the three textile companies, the below hypothesis is used.
Null Hypothesis 3 (H03): There is no significant difference between FATR of all the three textile companies.
According to table 9, since the calculated value (18.579) is higher than the tabulated value (3.8852) at 5% level of significance, the null hypothesis 3 is rejected and therefore it is concluded that there is significance difference between FATR of Raymond Ltd., Arvind Ltd. And Bombay dyeing.
Total Assets Turnover Ratio (TATR) : Total asset turnover is a financial ratio that measures the efficiency of a company's use of its assets in generating sales revenue or sales income to the company. This ratio considers all assets, current and fixed. Those assets include fixed assets, like plant and equipment, as well as inventory, accounts receivable, as well as any other current assets. The lower the total asset turnover ratio as compared to historical data for the firm and industry data, the more sluggish the firm's sales. This may indicate a problem with one or more of the asset categories composing total assets - inventory, receivables, or fixed assets. The small business owner should analyze the various asset classes to determine in which current or fixed asset the problem lies. The problem could be in more than one area of current or fixed assets.

IJRIM Volume 6, Issue 4 (April, 2016) (ISSN 2231-4334) International Journal of Research in IT & Management (IMPACT FACTOR – 5.96)
International Journal of Research in IT & Management
Email id: [email protected],http://www.euroasiapub.org
38
Table 10: Total Assets Turnover Ratio
Year Raymond Ltd. Arvind Ltd. Bombay Dyeing
2010-11 0.65 0.87 1.59
2011-12 0.9 1.05 1.83
2012-13 1 0.95 1.64
2013-14 0.93 1.04 1.73
2014-15 1.17 1.03 1.32
Mean 0.93 0.988 1.622
Grand Mean (X) = (0.93+0.988+1.622)/3 = 1.18
Sum of variance between samples =
(Mean -Grand Mean)2 + (Mean - Grand Mean)2 + (Mean - Grand
Mean)2x5
=
(0.93 -1.18)2 + (0.988 - 1.18)2 + (1.622 - 1.18)2x5
= 1.076184
Table 11: Variance within samples
Year (Observation
- Mean)2 (Observation -
Mean)2 (Observation -
Mean)2
2010-11 0.0784 0.013924 0.001024
2011-12 0.0009 0.003844 0.043264
2012-13 0.0049 0.001444 0.000324
2013-14 0 0.002704 0.011664
2014-15 0.0576 0.001764 0.091204
Total 0.1418 0.02368 0.14748
sum of variance within samples 0.31296
Table 12: Analysis of Variance
Source of
variance
Sum of squares
Degrees of freedom
Mean square
Between Samples
1.076184 2 0.538092
Within Samples
0.31296 12 0.02608

IJRIM Volume 6, Issue 4 (April, 2016) (ISSN 2231-4334) International Journal of Research in IT & Management (IMPACT FACTOR – 5.96)
International Journal of Research in IT & Management
Email id: [email protected],http://www.euroasiapub.org
39
F = Mean square between the samples
Mean square within the samples
F = 0.538092
0.02608 = 20.63236196
For testing the TATR of all the three textile companies, the below hypothesis is used.
Null Hypothesis 4 (H04): There is no significant difference between TATR of all the three textile companies.
According to table 12, since the calculated value (20.6324) is higher than the tabulated value (3.8852) at 5% level of significance, the null hypothesis 4 is rejected and therefore I concluded that there is significance difference between TATR of Raymond Ltd., Arvind Ltd. And Bombay dyeing.
Conclusion
Assets management is of crucial importance in management decision making. The optimal of financial soundness is could be achieved by company that manage the trade off between liquidity and solvency management. The purpose of this study is to investigate the effective management of assets to enhance sales revenue, to meet its short term and long term obligations where as analysis of solvency, fixed assets and ROI concentrates on long term performance. ANOVA test discloses relationship of financial variables between sample textile companies. It is overall found that there a significant difference between variables of three textile companies.
References
1. Grzegorz M,M (2008) A profitability management approach in Accounts Receivable management Journal of south East European Journal of Economics and Business, Vol. 3, No 2, PP. 89-96.
2. I. M. Pandey, “Financial management” 2002, Vikash Publishig House Pvt Limited New Delhi.
3. Jose, M., Lancester, C., Stevens, J., (1996). Corporate Returns and Cash Conversion Cycles. Journal of Economics and Finance, 20, 33-46.
4. Oruc Eda and Sen Mehmet, (2009), “Relationship between Efficiency level of Working Capital Management and Return on Total Assets in ISE” International Journal of Business and Management, Vol. 4, No. 10, October 2009.
5. Padachi Kesseven, “Trends in working capital management and its impact on firms‟ performance: An analysis of Mauritius small manufacturing firms.” International Review of business research papers. Vol. 2 No. 2 October 2006 pp 45-58.
6. Poule, Roy A “Practical financial statement analysis”, Tata McGraw Hill Publishing company Limited, New Delhi Edition 1972.
7. Prassana Chandra, “Financial management theory and practice”, Tata McGraw Hill Publishing company Limited, New Delhi 2002.
8. Ramachandran A, & Janakiraman, M(2009). The Relationship between working capital management efficiency and EBIT, managing global transitions, Vol. 7 (1) 61-74.

IJRIM Volume 6, Issue 4 (April, 2016) (ISSN 2231-4334) International Journal of Research in IT & Management (IMPACT FACTOR – 5.96)
International Journal of Research in IT & Management
Email id: [email protected],http://www.euroasiapub.org
40
9. www.moneycontrol.com
10. www.google.com
11. www.raymond.in
12. www.arvind.com
13. www.bombaydyeing.com