Embed Size (px)
Citation preview

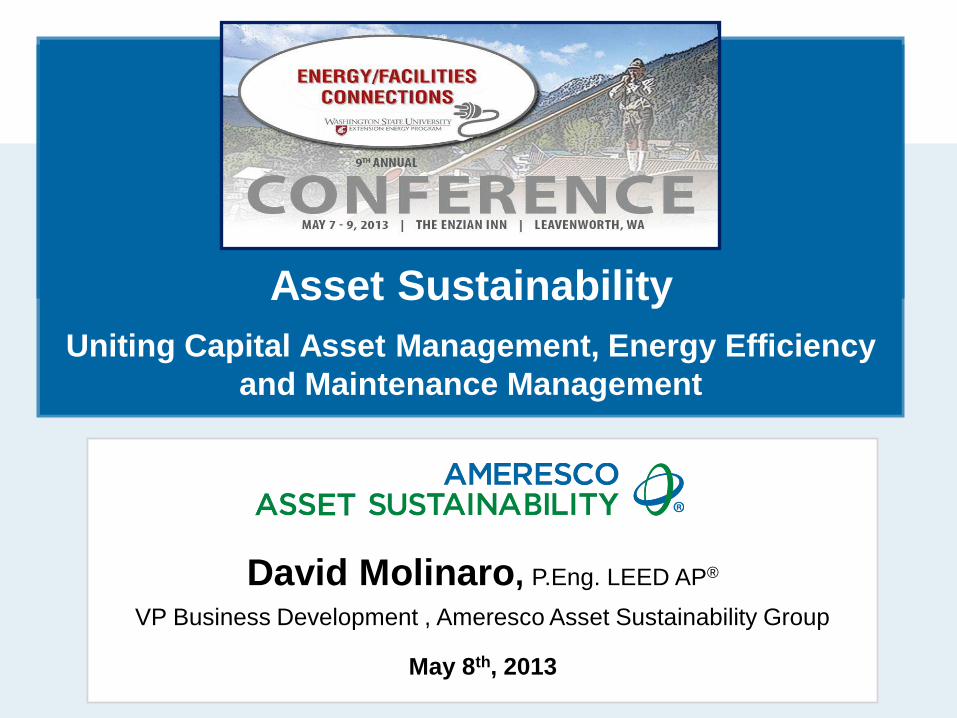
David Molinaro, P.Eng. LEED AP®
VP Business Development , Ameresco Asset Sustainability Group
May 8th, 2013
Asset Sustainability
Uniting Capital Asset Management, Energy Efficiency
and Maintenance Management
Asset Management Defined
“Structured approach to the current and long term
management of assets as tools for the effective
delivery of stakeholder benefits.”
Quality of Space
Environmental
Responsibility
GREEN
Asset
Sustainment
SUSTAINABILITY
Financial
Stewardship
VIABILITY
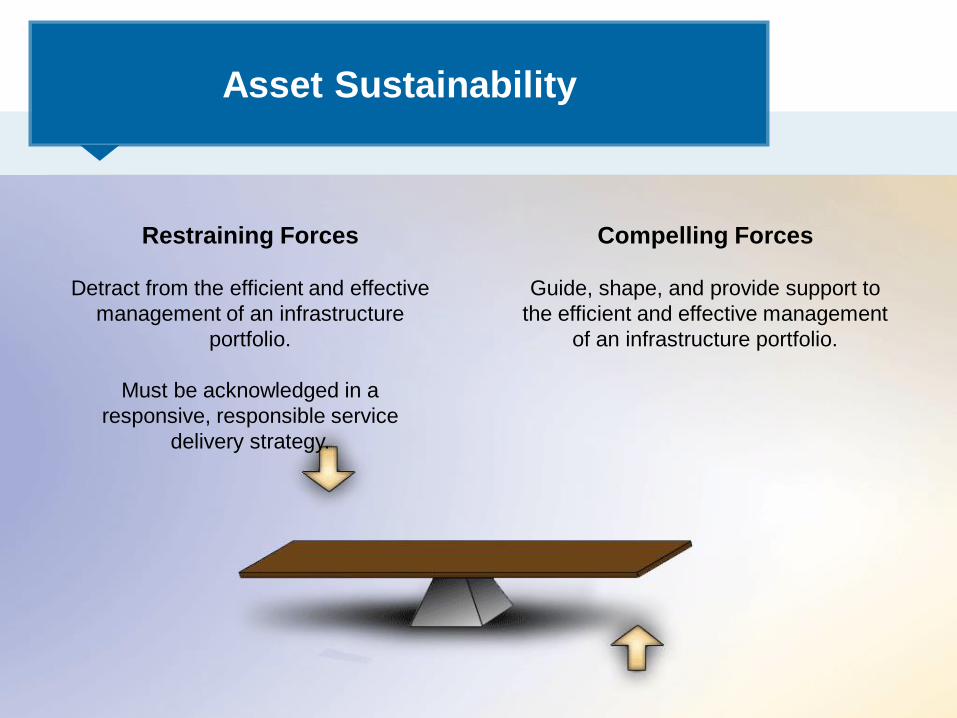
Asset Sustainability
Restraining Forces
Detract from the efficient and effective
management of an infrastructure
portfolio.
Must be acknowledged in a
responsive, responsible service
delivery strategy.
Compelling Forces
Guide, shape, and provide support to
the efficient and effective management
of an infrastructure portfolio.
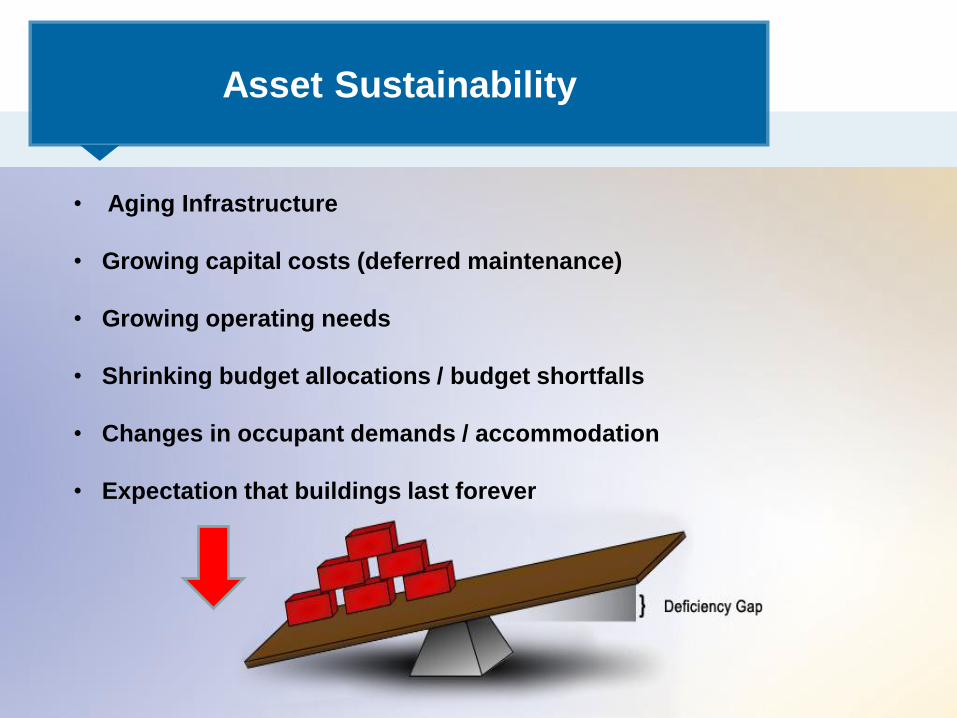
• Aging Infrastructure
• Growing capital costs (deferred maintenance)
• Growing operating needs
• Shrinking budget allocations / budget shortfalls
• Changes in occupant demands / accommodation
• Expectation that buildings last forever
Maintenance Management
Model Asset Sustainability
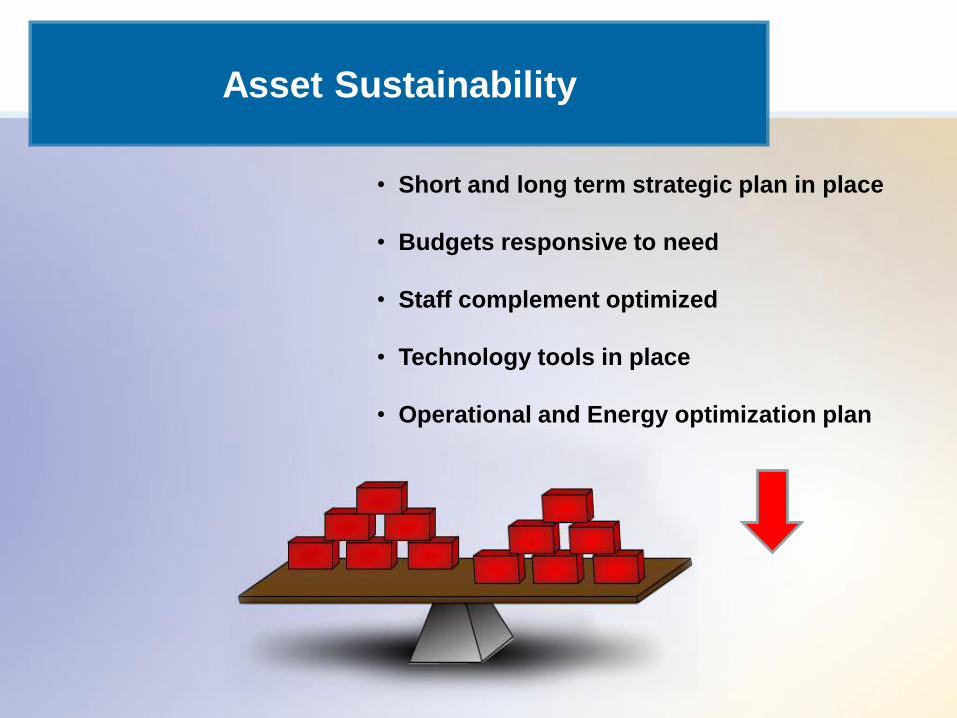
• Short and long term strategic plan in place
• Budgets responsive to need
• Staff complement optimized
• Technology tools in place
• Operational and Energy optimization plan
Asset Sustainability
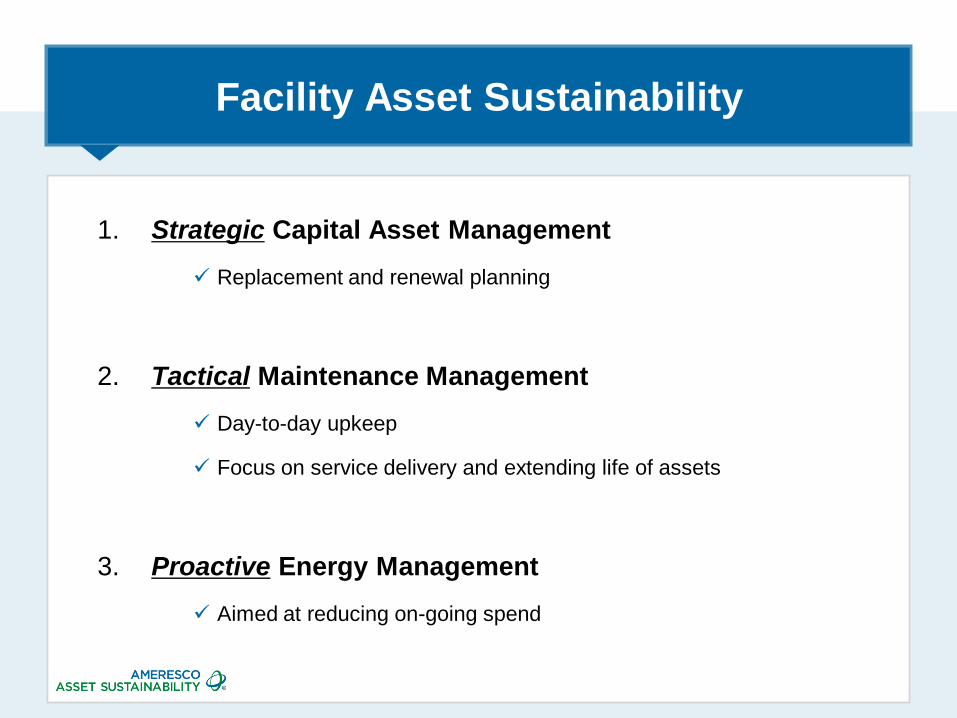
Facility Asset Sustainability
1. Strategic Capital Asset Management
Replacement and renewal planning
2. Tactical Maintenance Management
Day-to-day upkeep
Focus on service delivery and extending life of assets
3. Proactive Energy Management
Aimed at reducing on-going spend
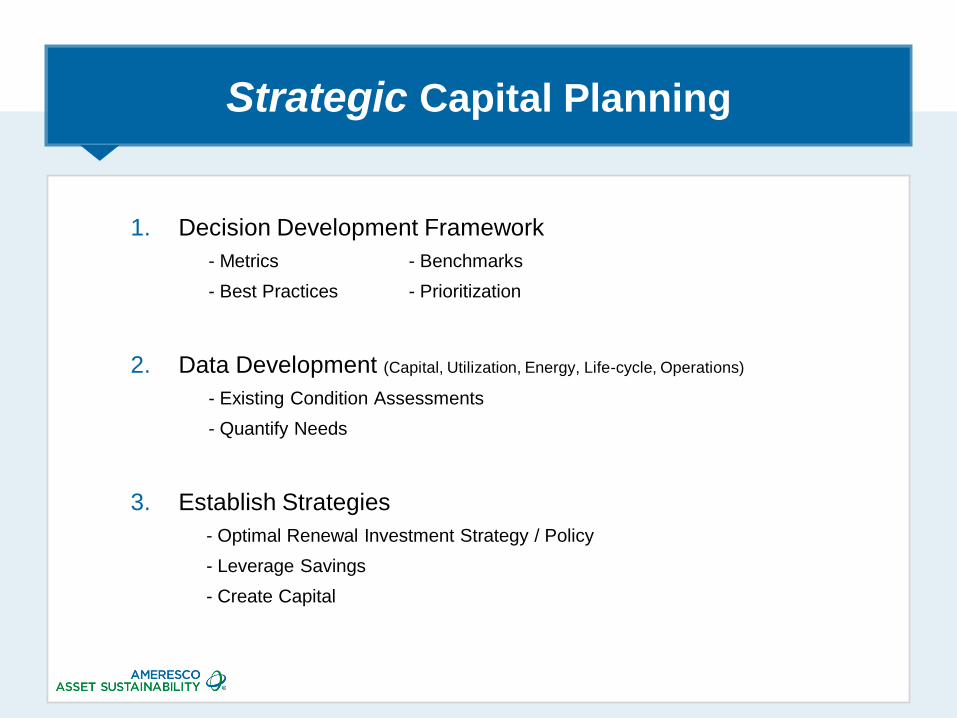
Strategic Capital Planning
1. Decision Development Framework
- Metrics - Benchmarks
- Best Practices - Prioritization
2. Data Development (Capital, Utilization, Energy, Life-cycle, Operations)
- Existing Condition Assessments
- Quantify Needs
3. Establish Strategies
- Optimal Renewal Investment Strategy / Policy
- Leverage Savings
- Create Capital
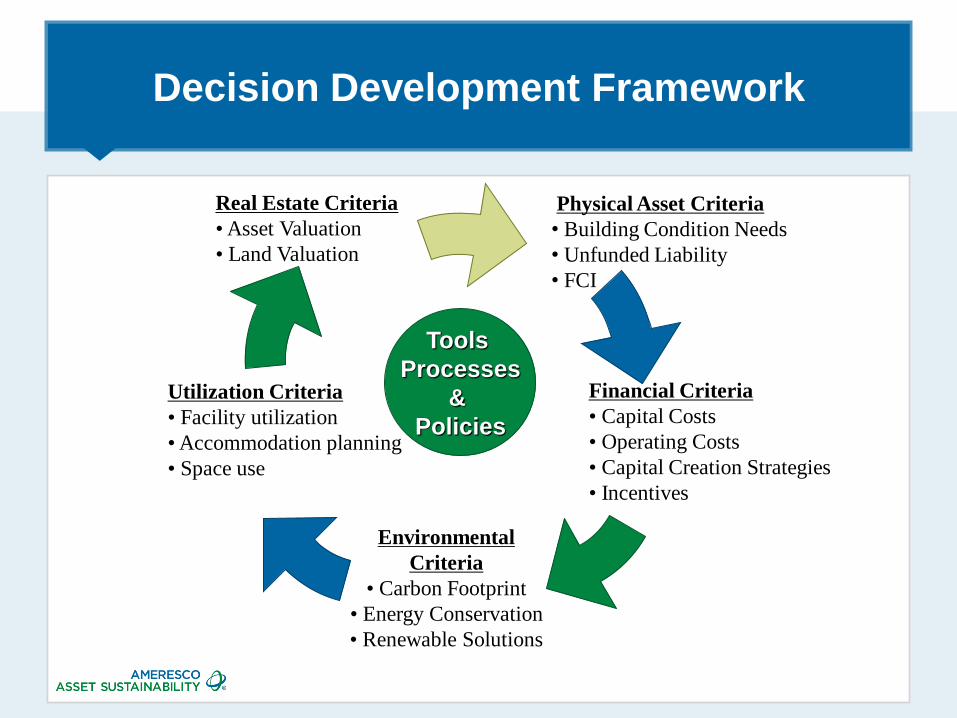
Decision Development Framework
Physical Asset Criteria
• Building Condition Needs
• Unfunded Liability
• FCI
Utilization Criteria
• Facility utilization
• Accommodation planning
• Space use
Real Estate Criteria
• Asset Valuation
• Land Valuation
Environmental
Criteria
• Carbon Footprint
• Energy Conservation
• Renewable Solutions
Financial Criteria
• Capital Costs
• Operating Costs
• Capital Creation Strategies
• Incentives
Tools
Processes
&
Policies
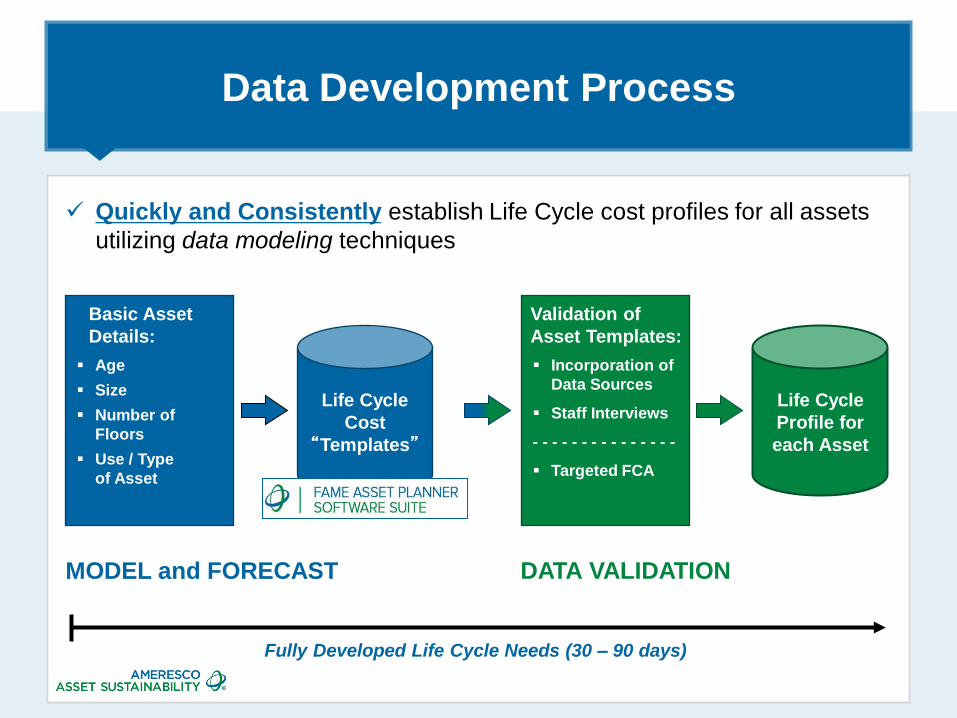
Data Development Process
Quickly and Consistently establish Life Cycle cost profiles for all assets
utilizing data modeling techniques
DATA VALIDATION
Incorporation of
Data Sources
Staff Interviews
- - - - - - - - - - - - - - -
Targeted FCA
Life Cycle
Profile for
each Asset
Validation of
Asset Templates:
MODEL and FORECAST
Life Cycle
Cost
“Templates”
Basic Asset
Details:
Age
Size
Number of
Floors
Use / Type
of Asset
Fully Developed Life Cycle Needs (30 – 90 days)
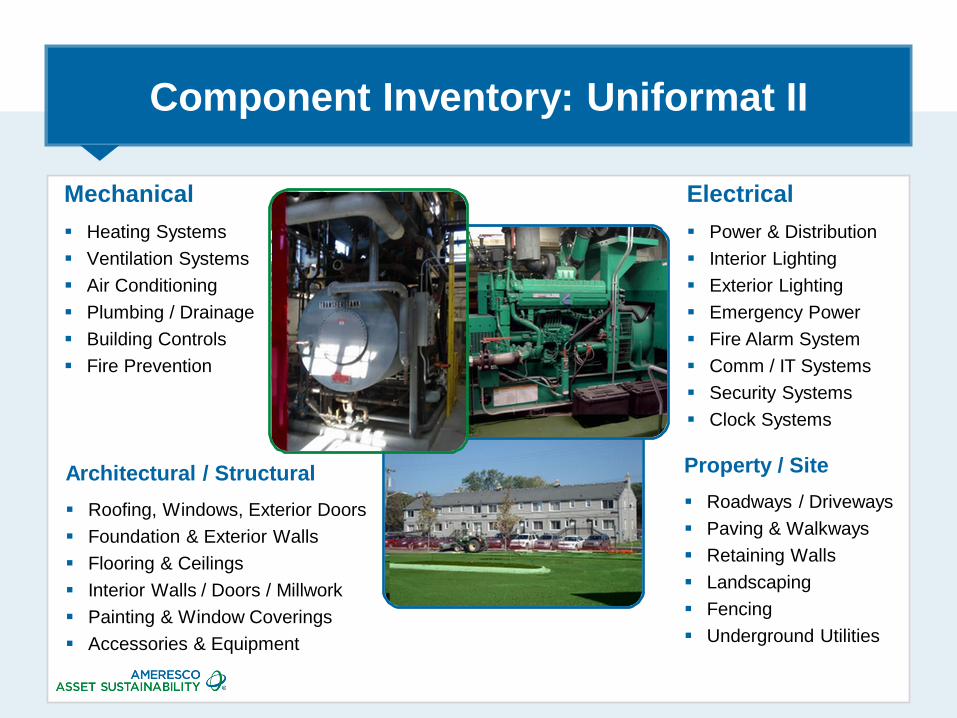
Component Inventory: Uniformat II
Mechanical
Heating Systems
Ventilation Systems
Air Conditioning
Plumbing / Drainage
Building Controls
Fire Prevention
Electrical
Power & Distribution
Interior Lighting
Exterior Lighting
Emergency Power
Fire Alarm System
Comm / IT Systems
Security Systems
Clock Systems
Property / Site
Roadways / Driveways
Paving & Walkways
Retaining Walls
Landscaping
Fencing
Underground Utilities
Architectural / Structural
Roofing, Windows, Exterior Doors
Foundation & Exterior Walls
Flooring & Ceilings
Interior Walls / Doors / Millwork
Painting & Window Coverings
Accessories & Equipment
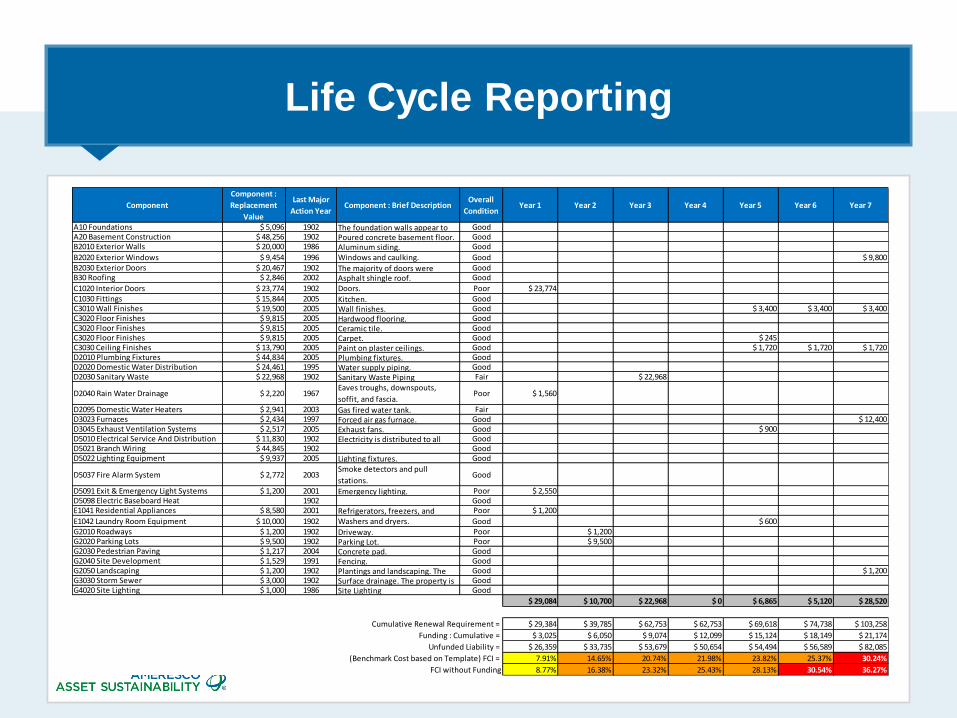
Life Cycle Reporting
Component
Component :
Replacement
Value
Last Major
Action YearComponent : Brief Description
Overall
ConditionYear 1 Year 2 Year 3 Year 4 Year 5 Year 6 Year 7
A10 Foundations $ 5,096 1902 The foundation walls appear to GoodA20 Basement Construction $ 48,256 1902 Poured concrete basement floor. GoodB2010 Exterior Walls $ 20,000 1986 Aluminum siding. Good
B2020 Exterior Windows $ 9,454 1996 Windows and caulking. Good $ 9,800B2030 Exterior Doors $ 20,467 1902 The majority of doors were GoodB30 Roofing $ 2,846 2002 Asphalt shingle roof. Good
C1020 Interior Doors $ 23,774 1902 Doors. Poor $ 23,774C1030 Fittings $ 15,844 2005 Kitchen. GoodC3010 Wall Finishes $ 19,500 2005 Wall finishes. Good $ 3,400 $ 3,400 $ 3,400C3020 Floor Finishes $ 9,815 2005 Hardwood flooring. GoodC3020 Floor Finishes $ 9,815 2005 Ceramic tile. GoodC3020 Floor Finishes $ 9,815 2005 Carpet. Good $ 245C3030 Ceiling Finishes $ 13,790 2005 Paint on plaster ceilings. Good $ 1,720 $ 1,720 $ 1,720D2010 Plumbing Fixtures $ 44,834 2005 Plumbing fixtures. GoodD2020 Domestic Water Distribution $ 24,461 1995 Water supply piping. GoodD2030 Sanitary Waste $ 22,968 1902 Sanitary Waste Piping Fair $ 22,968
D2040 Rain Water Drainage $ 2,220 1967Eaves troughs, downspouts,
soffit, and fascia.Poor $ 1,560
D2095 Domestic Water Heaters $ 2,941 2003 Gas fired water tank. FairD3023 Furnaces $ 2,434 1997 Forced air gas furnace. Good $ 12,400D3045 Exhaust Ventilation Systems $ 2,517 2005 Exhaust fans. Good $ 900D5010 Electrical Service And Distribution $ 11,830 1902 Electricity is distributed to all GoodD5021 Branch Wiring $ 44,845 1902 GoodD5022 Lighting Equipment $ 9,937 2005 Lighting fixtures. Good
D5037 Fire Alarm System $ 2,772 2003Smoke detectors and pull
stations.Good
D5091 Exit & Emergency Light Systems $ 1,200 2001 Emergency lighting. Poor $ 2,550D5098 Electric Baseboard Heat 1902 GoodE1041 Residential Appliances $ 8,580 2001 Refrigerators, freezers, and Poor $ 1,200
E1042 Laundry Room Equipment $ 10,000 1902 Washers and dryers. Good $ 600G2010 Roadways $ 1,200 1902 Driveway. Poor $ 1,200G2020 Parking Lots $ 9,500 1902 Parking Lot. Poor $ 9,500G2030 Pedestrian Paving $ 1,217 2004 Concrete pad. GoodG2040 Site Development $ 1,529 1991 Fencing. GoodG2050 Landscaping $ 1,200 1902 Plantings and landscaping. The Good $ 1,200G3030 Storm Sewer $ 3,000 1902 Surface drainage. The property is GoodG4020 Site Lighting $ 1,000 1986 Site Lighting Good
$ 29,084 $ 10,700 $ 22,968 $ 0 $ 6,865 $ 5,120 $ 28,520
Cumulative Renewal Requirement = $ 29,384 $ 39,785 $ 62,753 $ 62,753 $ 69,618 $ 74,738 $ 103,258
Funding : Cumulative = $ 3,025 $ 6,050 $ 9,074 $ 12,099 $ 15,124 $ 18,149 $ 21,174
Unfunded Liability = $ 26,359 $ 33,735 $ 53,679 $ 50,654 $ 54,494 $ 56,589 $ 82,085
(Benchmark Cost based on Template) FCI = 7.91% 14.65% 20.74% 21.98% 23.82% 25.37% 30.24%
FCI without Funding 8.77% 16.38% 23.32% 25.43% 28.13% 30.54% 36.27%
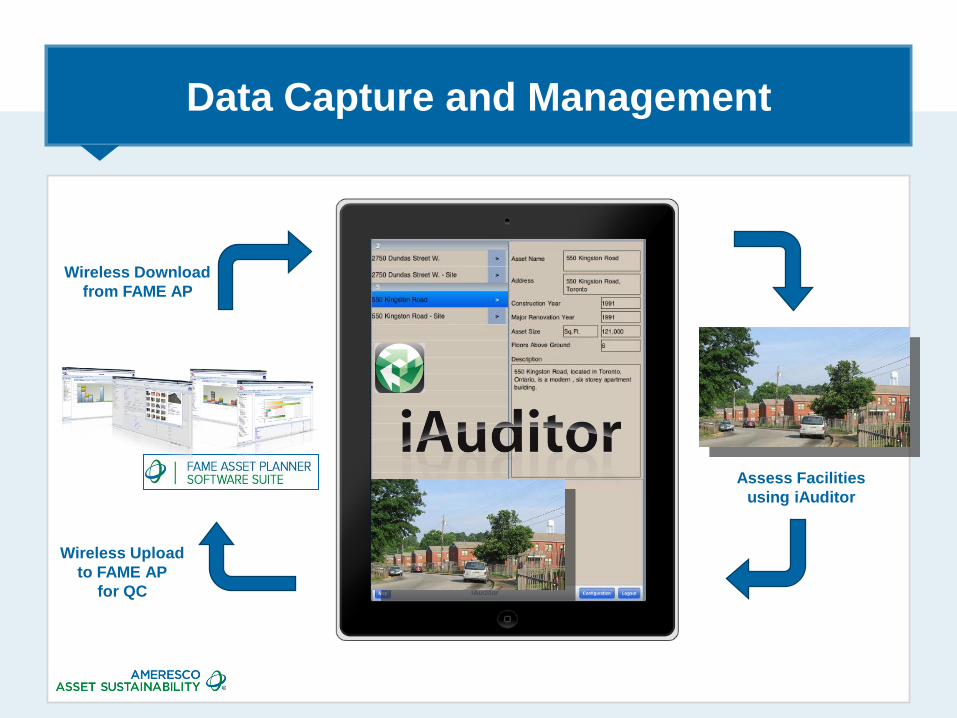
Data Capture and Management
Wireless Upload
to FAME AP
for QC
Wireless Download
from FAME AP
Assess Facilities
using iAuditor
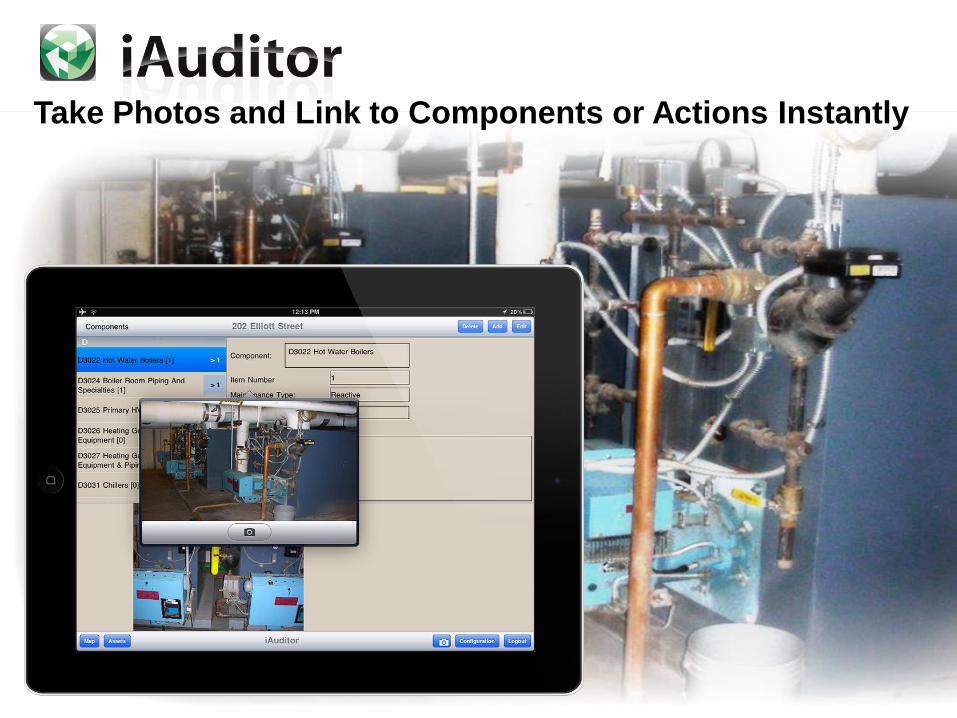
Take Photos and Link to Components or Actions Instantly
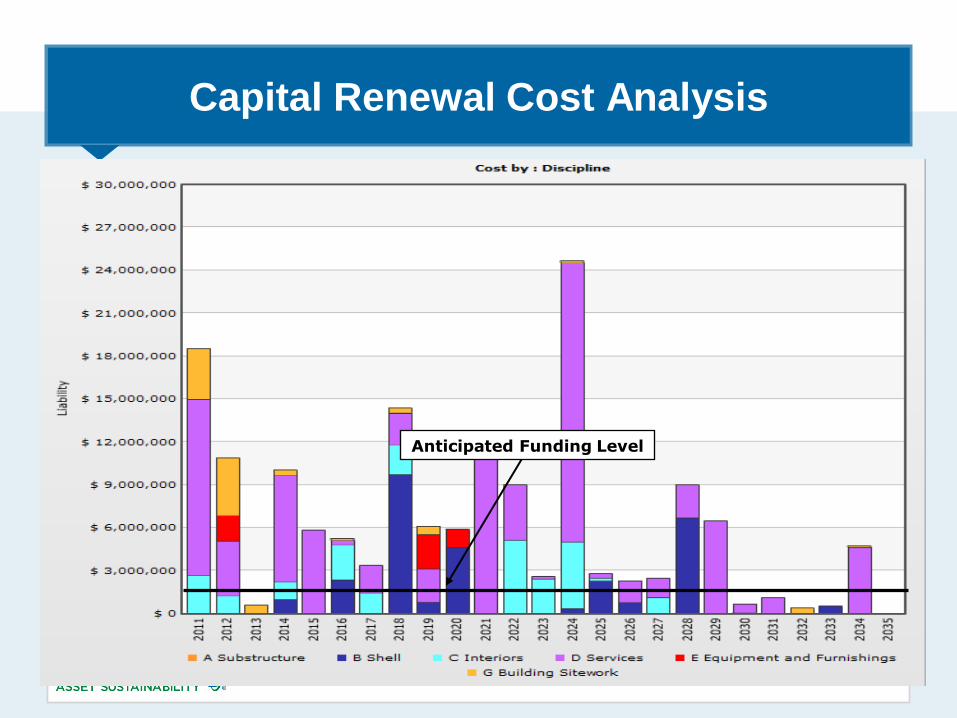
Capital Renewal Cost Analysis
Anticipated Funding Level
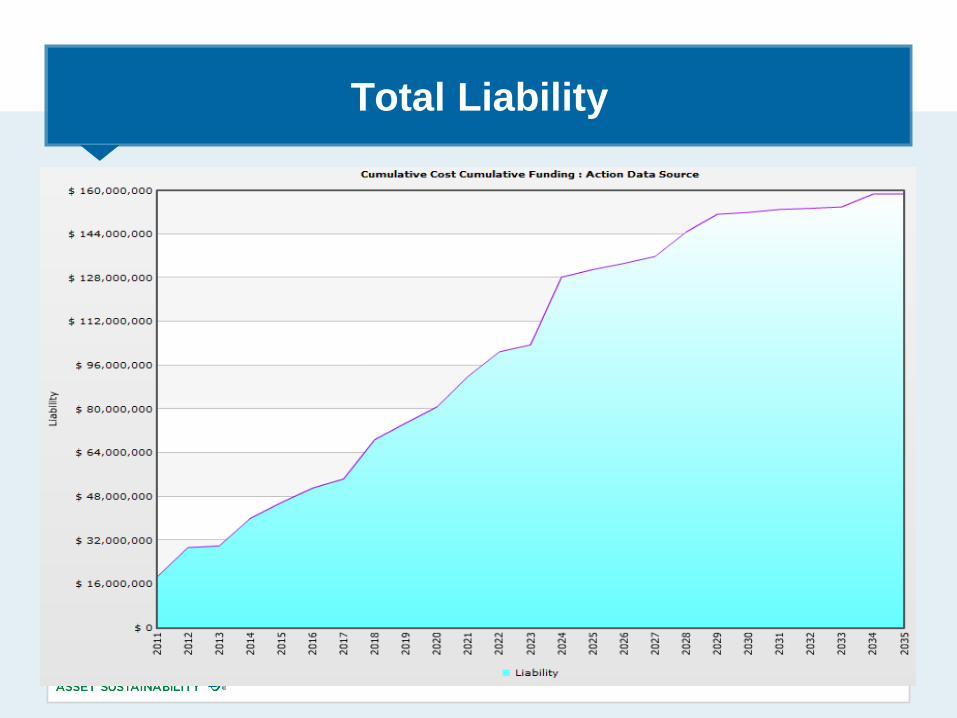
Total Liability
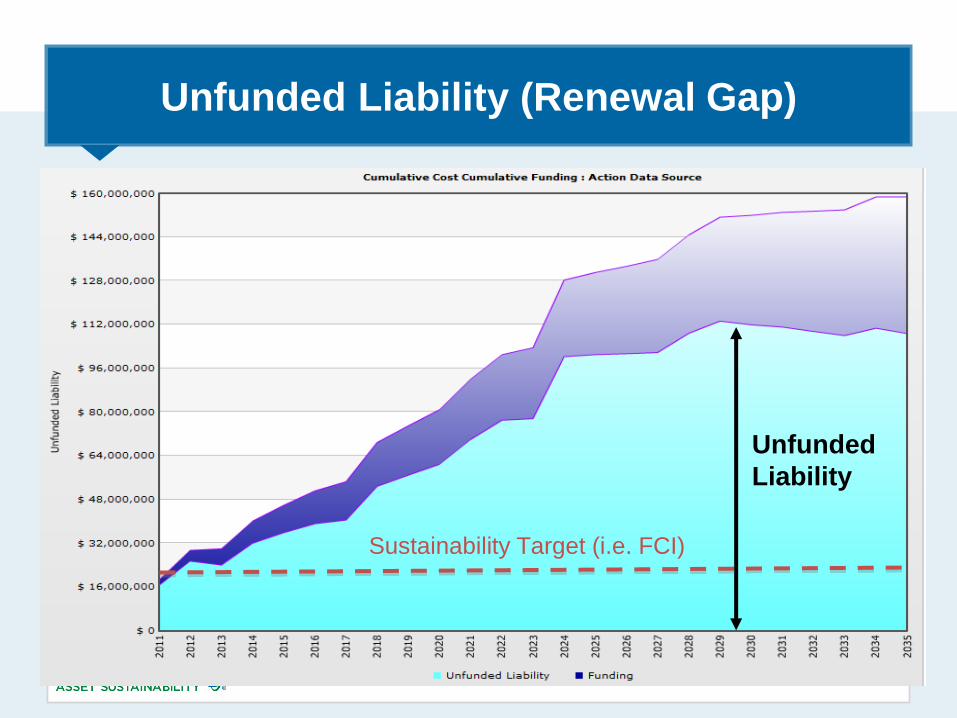
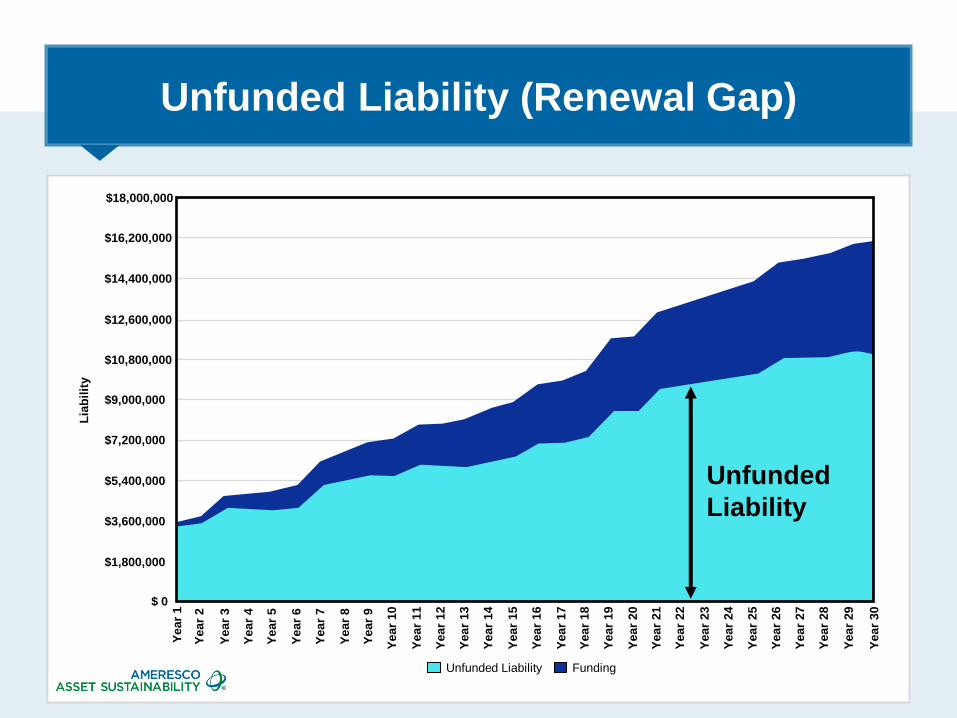
Unfunded Liability (Renewal Gap)
Unfunded Liability Funding
Unfunded
Liability
Sustainability Target (i.e. FCI)
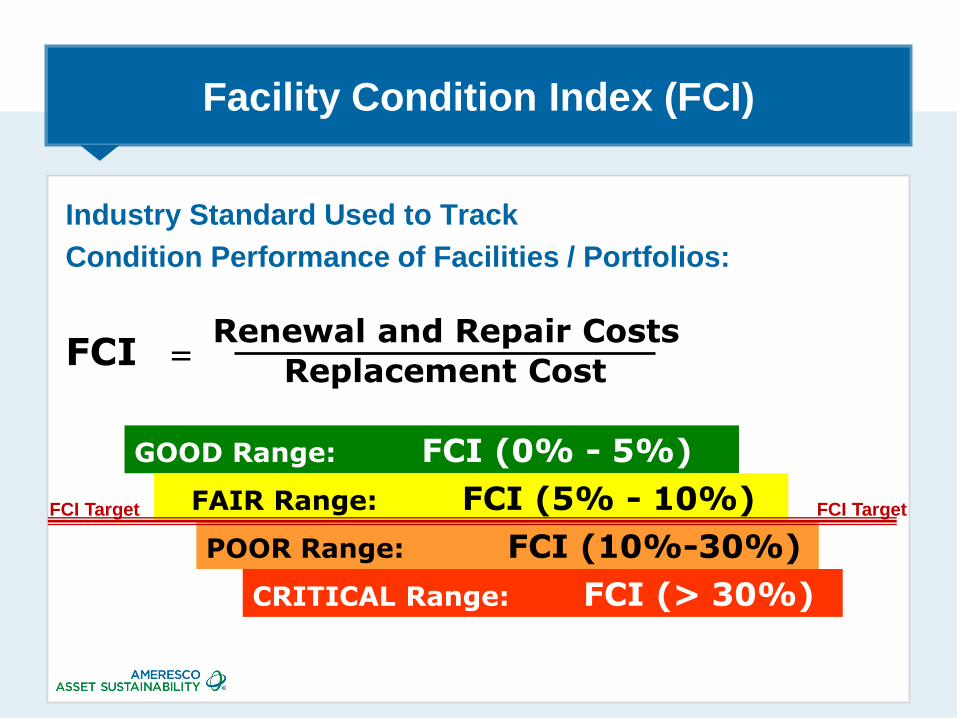
Facility Condition Index (FCI)
Industry Standard Used to Track
Condition Performance of Facilities / Portfolios:
GOOD Range: FCI (0% - 5%)
FAIR Range: FCI (5% - 10%)
POOR Range: FCI (10%-30%)
CRITICAL Range: FCI (> 30%)
FCI Target FCI Target
FCI = Renewal and Repair Costs
Replacement Cost
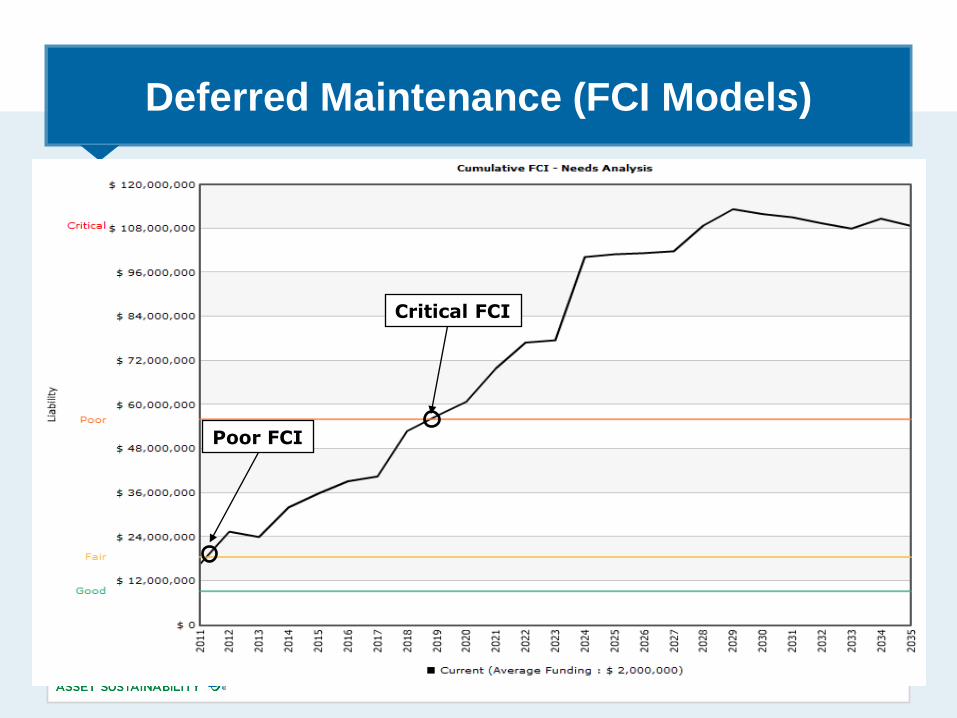
Deferred Maintenance (FCI Models)
Critical FCI
Poor FCI
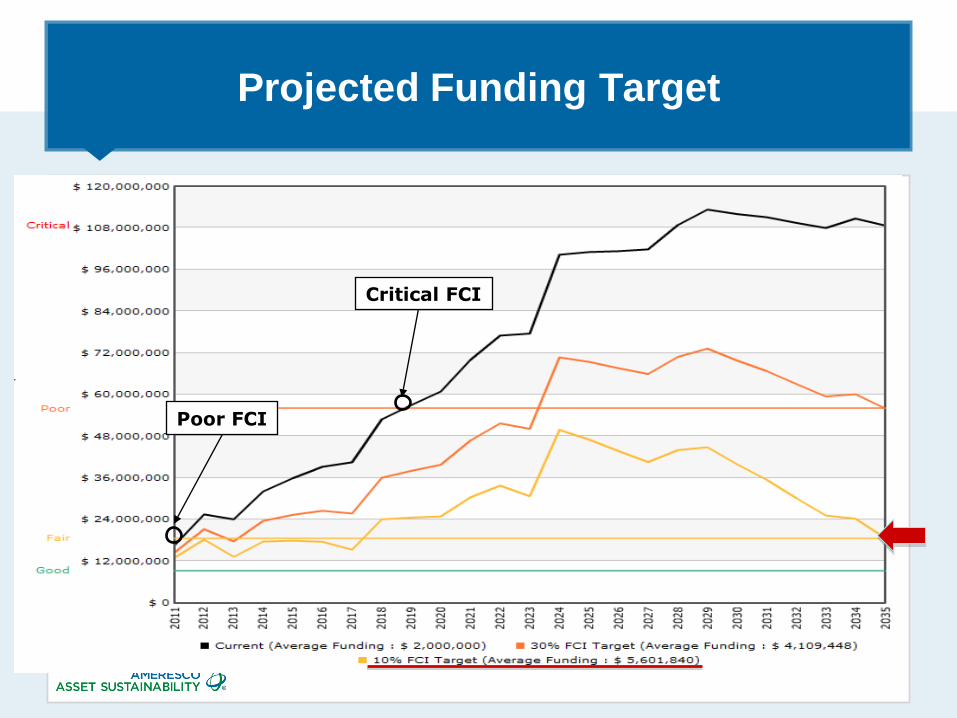
Critical FCI
Poor FCI
Projected Funding Target
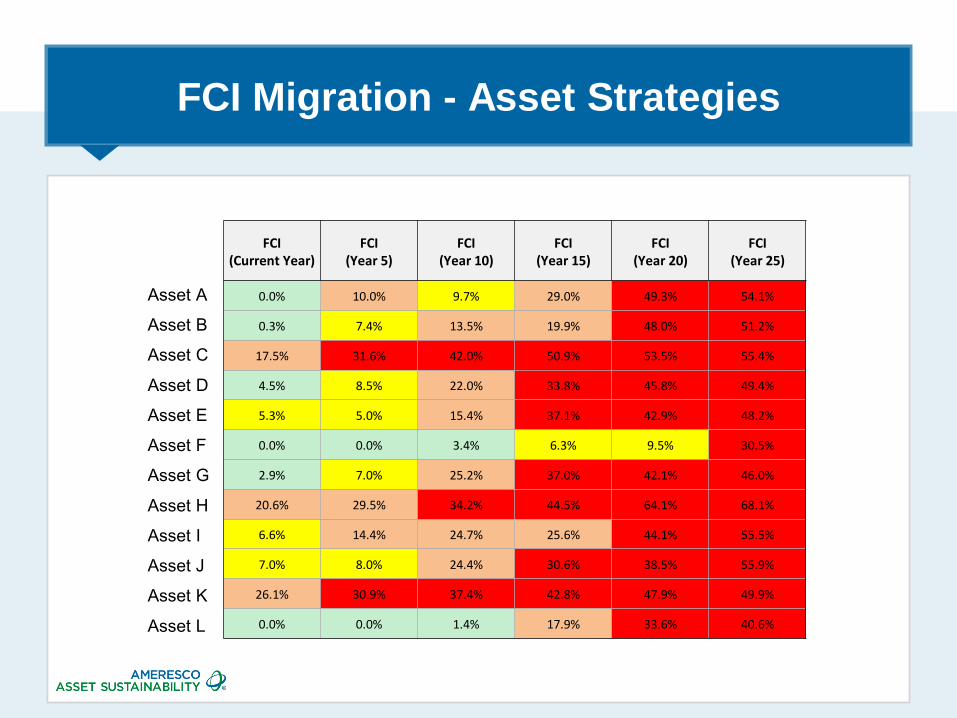
FCI Migration - Asset Strategies
FCI (Current Year)
FCI (Year 5)
FCI (Year 10)
FCI (Year 15)
FCI (Year 20)
FCI (Year 25)
0.0% 10.0% 9.7% 29.0% 49.3% 54.1%
0.3% 7.4% 13.5% 19.9% 48.0% 51.2%
17.5% 31.6% 42.0% 50.9% 53.5% 55.4%
4.5% 8.5% 22.0% 33.8% 45.8% 49.4%
5.3% 5.0% 15.4% 37.1% 42.9% 48.2%
0.0% 0.0% 3.4% 6.3% 9.5% 30.5%
2.9% 7.0% 25.2% 37.0% 42.1% 46.0%
20.6% 29.5% 34.2% 44.5% 64.1% 68.1%
6.6% 14.4% 24.7% 25.6% 44.1% 55.5%
7.0% 8.0% 24.4% 30.6% 38.5% 55.9%
26.1% 30.9% 37.4% 42.8% 47.9% 49.9%
0.0% 0.0% 1.4% 17.9% 33.6% 40.6%
Asset A
Asset B
Asset C
Asset D
Asset E
Asset F
Asset G
Asset H
Asset I
Asset J
Asset K
Asset L
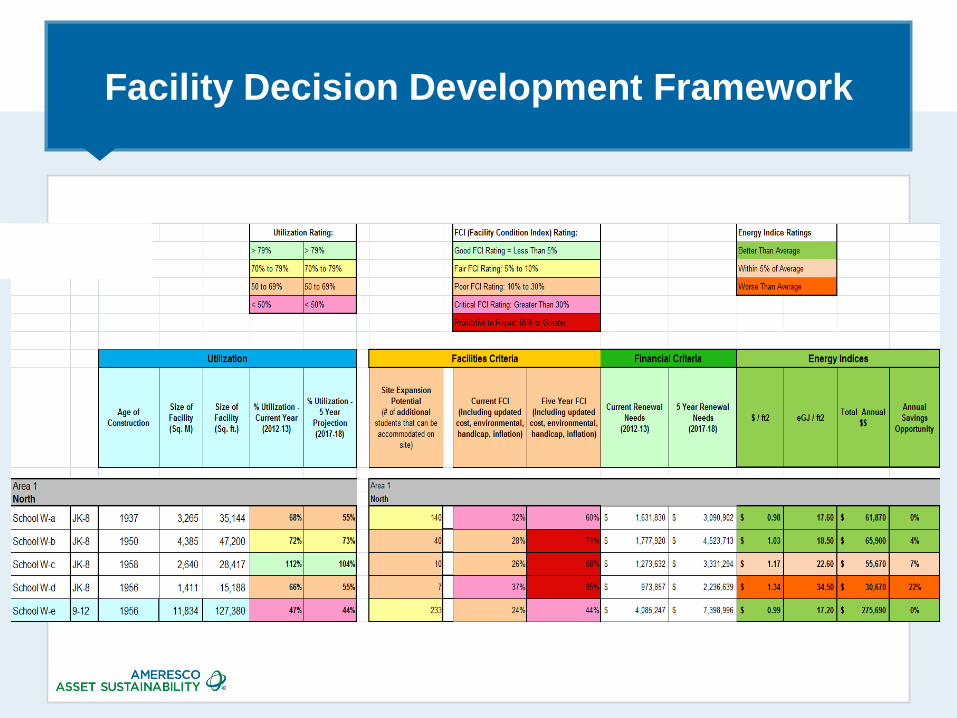
Facility Decision Development Framework
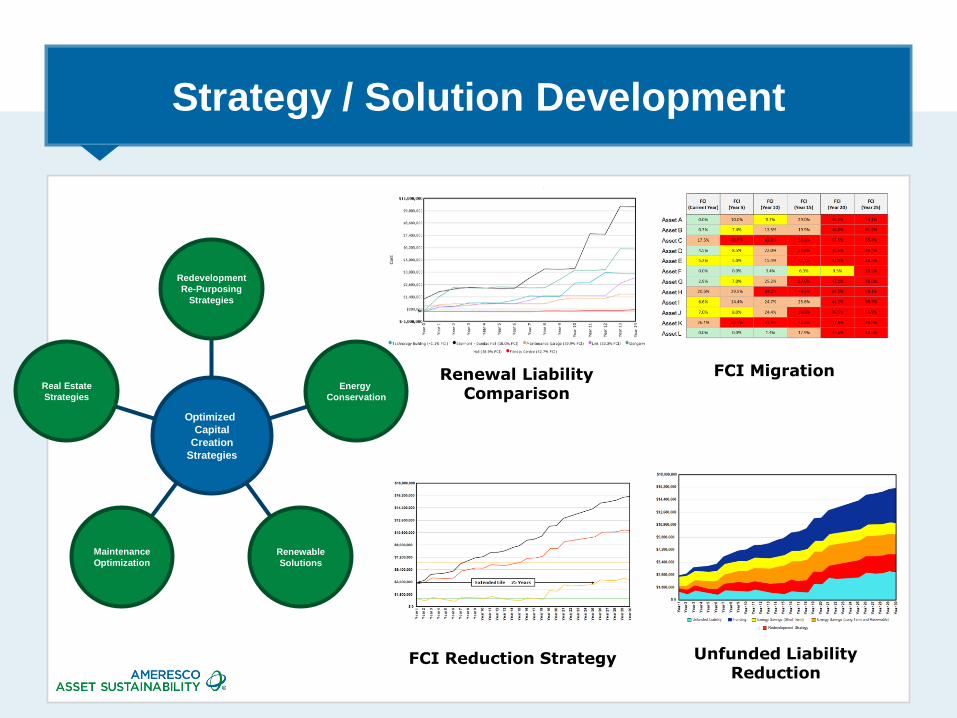
Strategy / Solution Development
FCI Migration
Unfunded Liability Reduction
Renewal Liability Comparison
FCI Reduction Strategy
Real Estate
Strategies
Maintenance
Optimization
Renewable
Solutions
Energy
Conservation
Redevelopment
Re-Purposing
Strategies
Optimized
Capital
Creation
Strategies
$18,000,000
$16,200,000
$14,400,000
$12,600,000
$10,800,000
$9,000,000
$7,200,000
$5,400,000
$3,600,000
$1,800,000
Lia
bil
ity
$ 0
Year
1
Year
2
Year
3
Year
4
Year
5
Year
6
Year
7
Year
8
Ye
ar
9
Year
10
Year
11
Year
12
Year
13
Year
14
Year
15
Year
16
Year
17
Year
18
Year
19
Year
20
Year
21
Year
22
Year
23
Year
24
Year
25
Year
26
Year
27
Year
28
Year
29
Year
30
Unfunded Liability (Renewal Gap)
Unfunded
Liability
Unfunded Liability Funding
Unfunded Liability (Renewal Gap)
$18,000,000
$16,200,000
$14,400,000
$12,600,000
$10,800,000
$9,000,000
$7,200,000
$5,400,000
$3,600,000
$1,800,000
Lia
bil
ity
$ 0
Year
1
Year
2
Year
3
Year
4
Year
5
Year
6
Year
7
Year
8
Ye
ar
9
Year
10
Year
11
Year
12
Year
13
Year
14
Year
15
Year
16
Year
17
Year
18
Year
19
Year
20
Year
21
Year
22
Year
23
Year
24
Year
25
Year
26
Year
27
Year
28
Year
29
Year
30
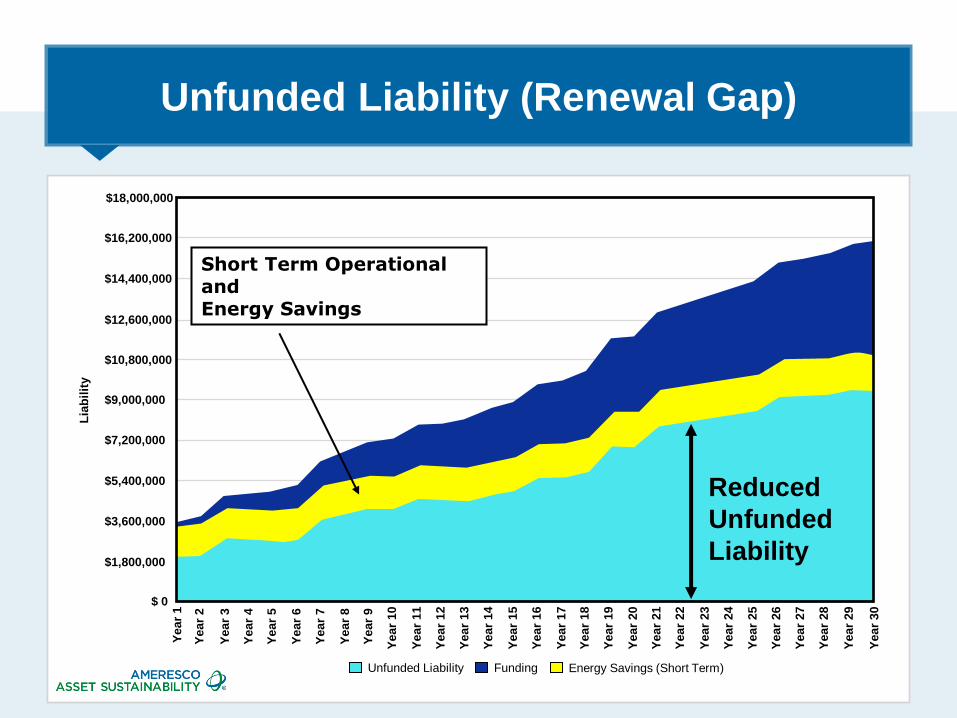
Reduced
Unfunded
Liability
Short Term Operational and Energy Savings
Unfunded Liability Funding Energy Savings (Short Term)
Unfunded Liability (Renewal Gap)
$18,000,000
$16,200,000
$14,400,000
$12,600,000
$10,800,000
$9,000,000
$7,200,000
$5,400,000
$3,600,000
$1,800,000
Lia
bil
ity
$ 0
Year
1
Year
2
Year
3
Year
4
Year
5
Year
6
Year
7
Year
8
Ye
ar
9
Year
10
Year
11
Year
12
Year
13
Year
14
Year
15
Year
16
Year
17
Year
18
Year
19
Year
20
Year
21
Year
22
Year
23
Year
24
Year
25
Year
26
Year
27
Year
28
Year
29
Year
30
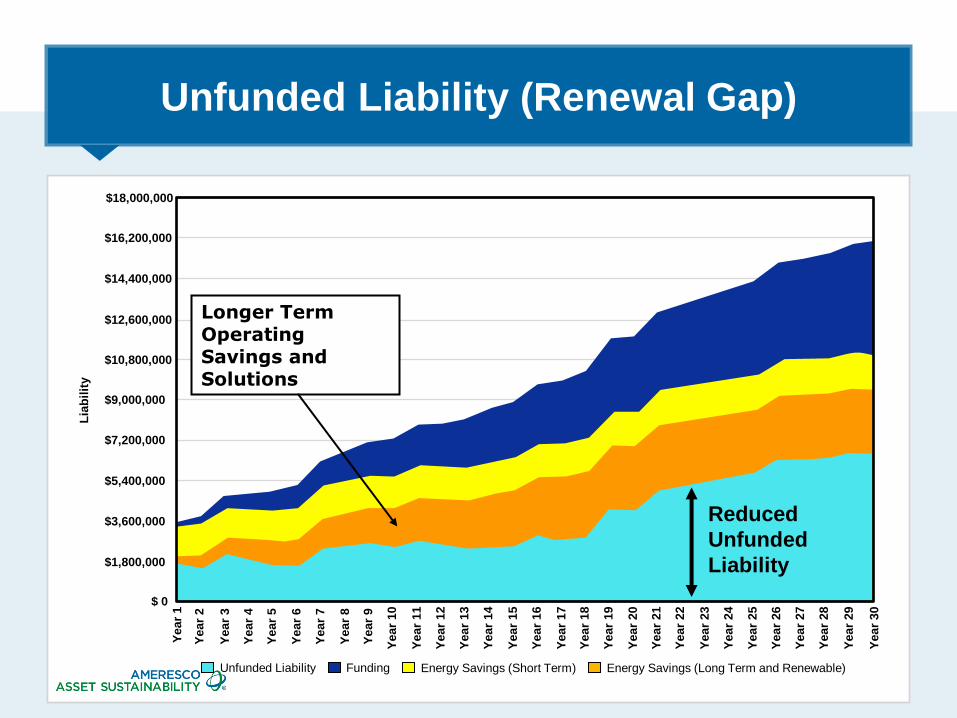
Reduced
Unfunded
Liability
Longer Term Operating Savings and Solutions
Unfunded Liability Funding Energy Savings (Short Term) Energy Savings (Long Term and Renewable)
Unfunded Liability (Renewal Gap)
$18,000,000
$16,200,000
$14,400,000
$12,600,000
$10,800,000
$9,000,000
$7,200,000
$5,400,000
$3,600,000
$1,800,000
Lia
bil
ity
$ 0
Year
1
Year
2
Year
3
Year
4
Year
5
Year
6
Year
7
Year
8
Ye
ar
9
Year
10
Year
11
Year
12
Year
13
Year
14
Year
15
Year
16
Year
17
Year
18
Year
19
Year
20
Year
21
Year
22
Year
23
Year
24
Year
25
Year
26
Year
27
Year
28
Year
29
Year
30
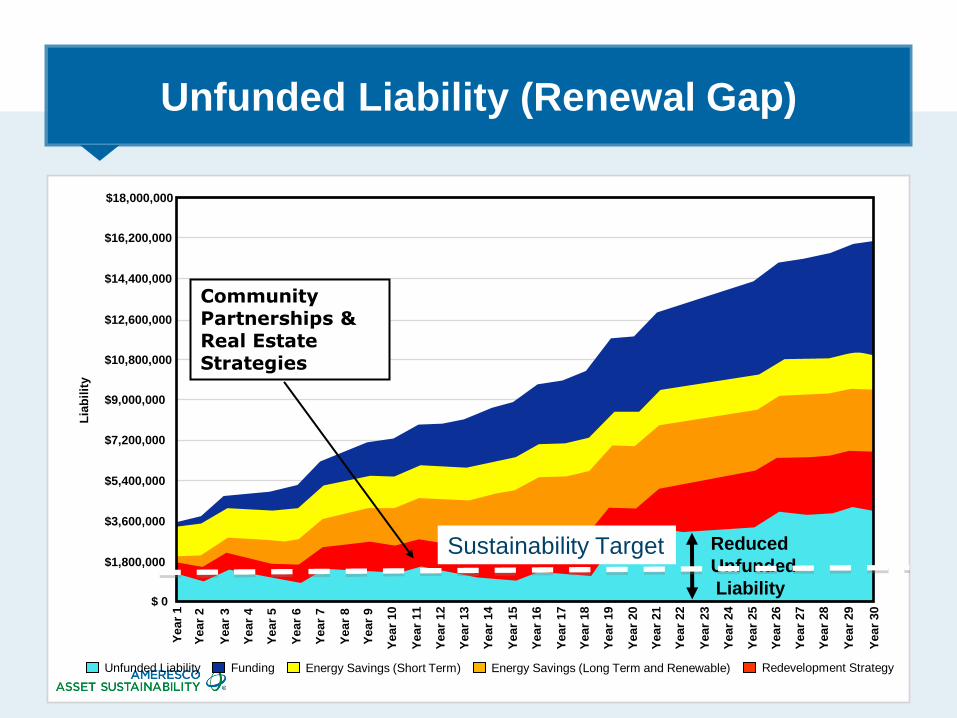
Reduced
Unfunded
Liability
Community Partnerships & Real Estate Strategies
Redevelopment Strategy Unfunded Liability Funding Energy Savings (Short Term) Energy Savings (Long Term and Renewable)
Sustainability Target
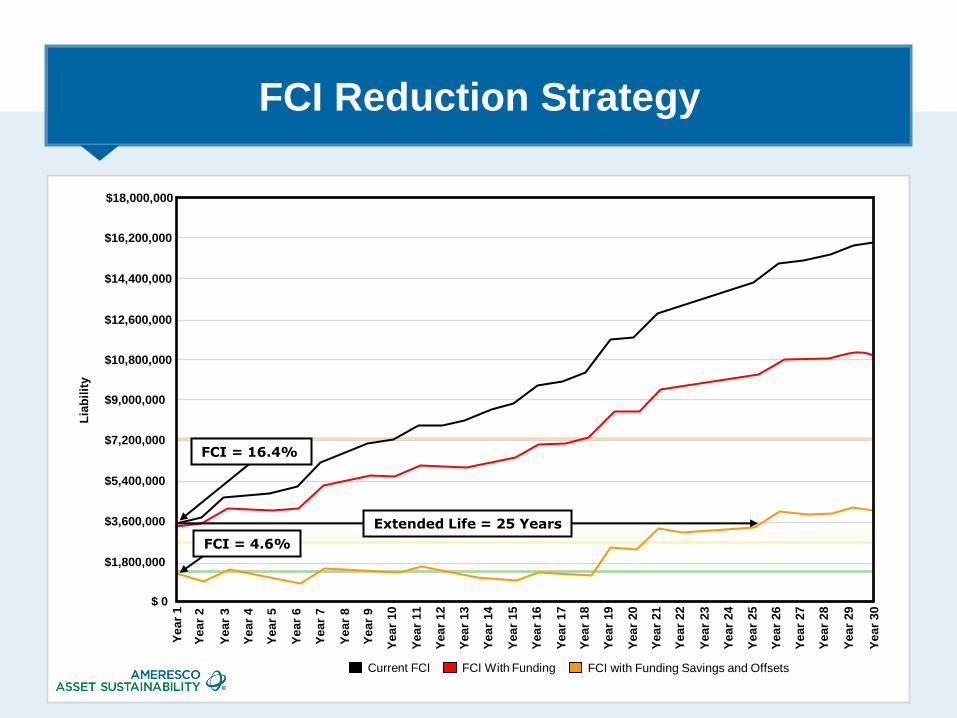
FCI Reduction Strategy
FCI with Funding Savings and Offsets
$18,000,000
$16,200,000
$14,400,000
$12,600,000
$10,800,000
$9,000,000
$7,200,000
$5,400,000
$3,600,000
$1,800,000
Lia
bil
ity
$ 0
Year
1
Year
2
Year
3
Year
4
Year
5
Year
6
Year
7
Year
8
Ye
ar
9
Year
10
Year
11
Year
12
Year
13
Year
14
Year
15
Year
16
Year
17
Year
18
Year
19
Year
20
Year
21
Year
22
Year
23
Year
24
Year
25
Year
26
Year
27
Year
28
Year
29
Year
30
FCI With Funding
FCI = 16.4%
FCI = 4.6%
Extended Life = 25 Years
Current FCI
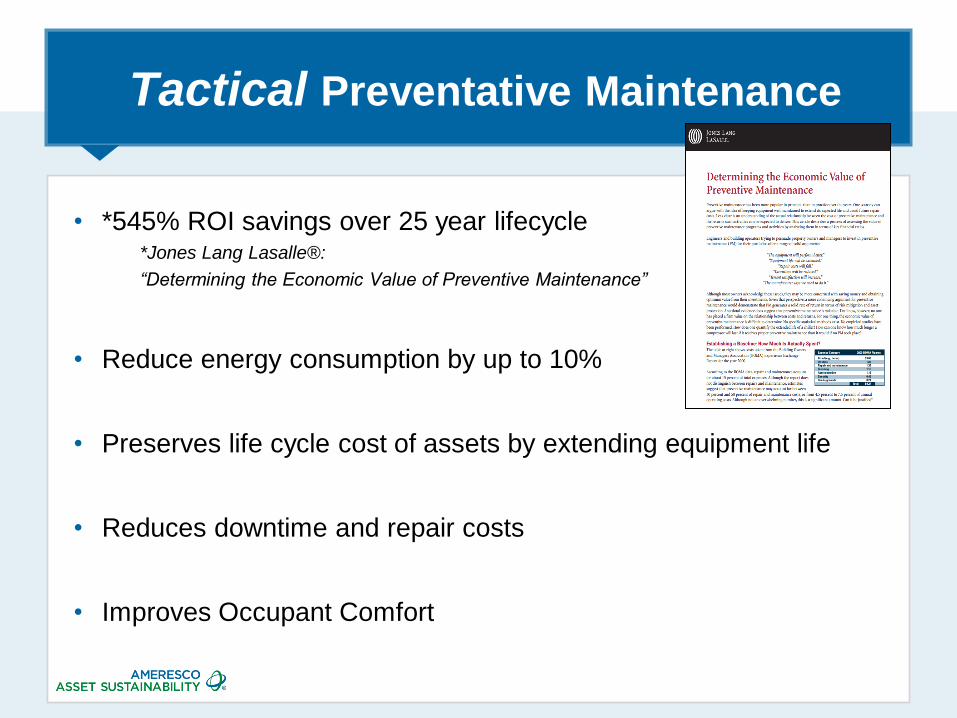
Tactical Preventative Maintenance
• *545% ROI savings over 25 year lifecycle *Jones Lang Lasalle®:
“Determining the Economic Value of Preventive Maintenance”
• Reduce energy consumption by up to 10%
• Preserves life cycle cost of assets by extending equipment life
• Reduces downtime and repair costs
• Improves Occupant Comfort
Best Practices – Maintenance Program
• Define Service Levels
• Standardize Delivery
• 80 / 20 Rule... walk before you run
• What gets measured...
• Process that is Achievable... Believable... Sustainable
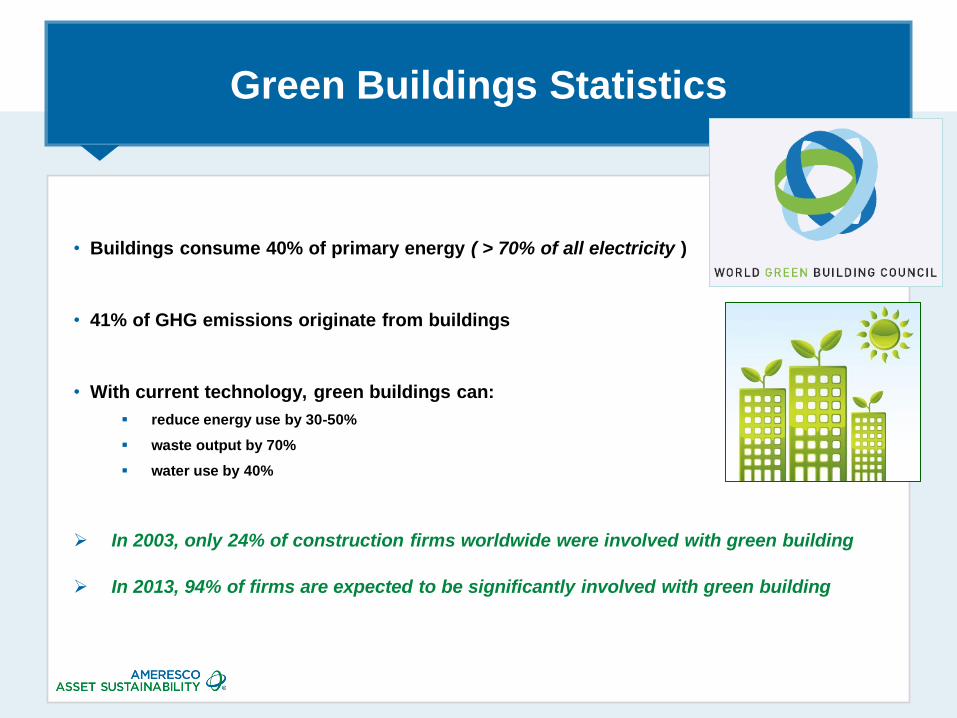
Green Buildings Statistics
• Buildings consume 40% of primary energy ( > 70% of all electricity )
• 41% of GHG emissions originate from buildings
• With current technology, green buildings can:
reduce energy use by 30-50%
waste output by 70%
water use by 40%
In 2003, only 24% of construction firms worldwide were involved with green building
In 2013, 94% of firms are expected to be significantly involved with green building
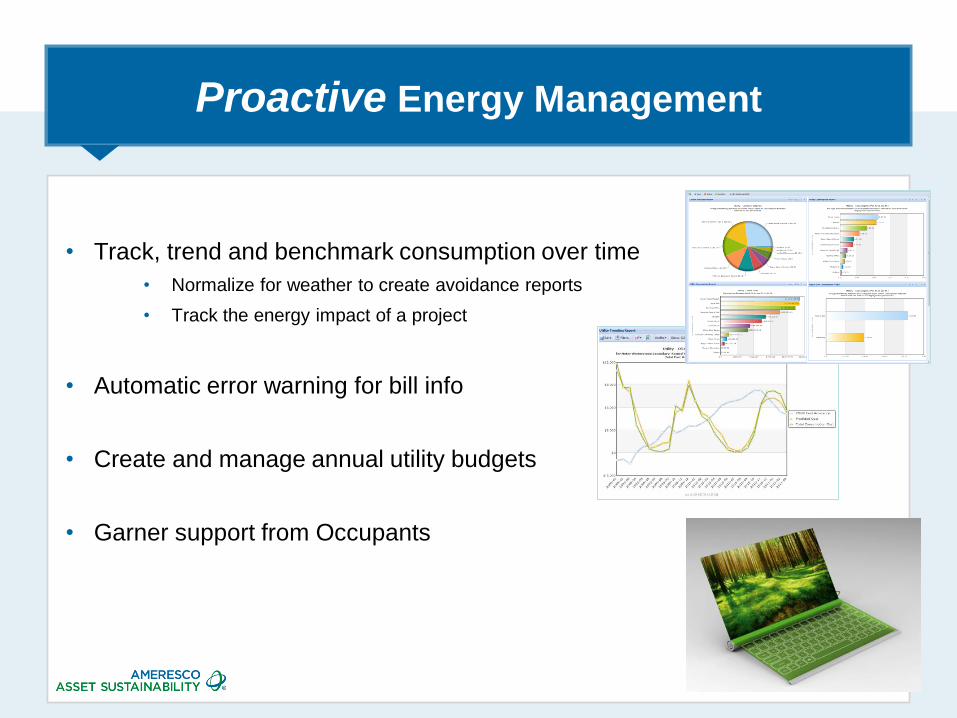
Proactive Energy Management
• Track, trend and benchmark consumption over time
• Normalize for weather to create avoidance reports
• Track the energy impact of a project
• Automatic error warning for bill info
• Create and manage annual utility budgets
• Garner support from Occupants
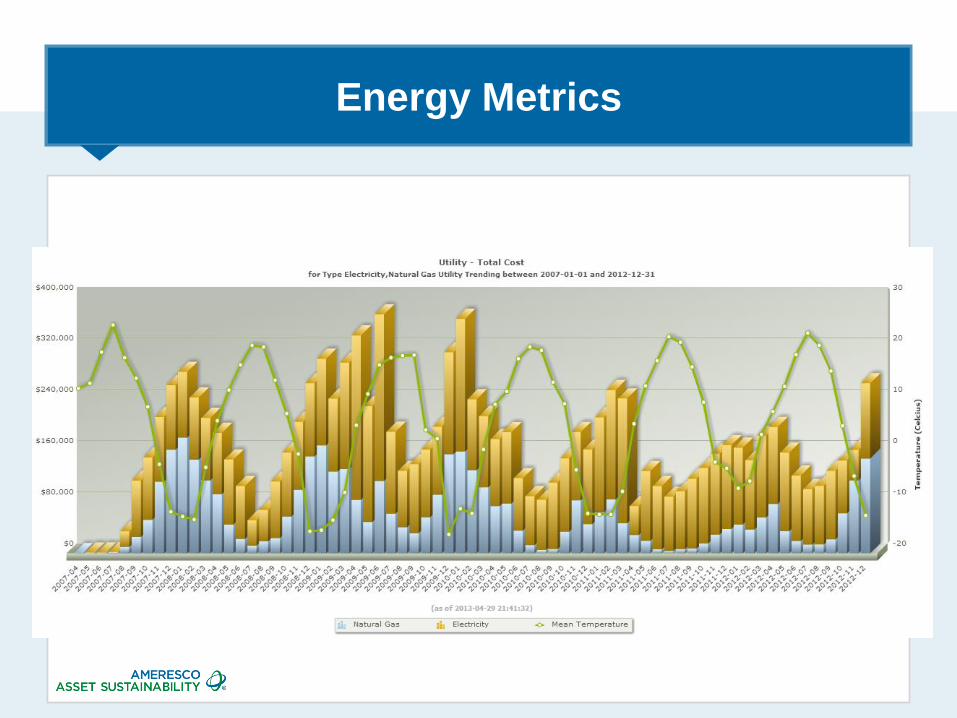
Energy Metrics
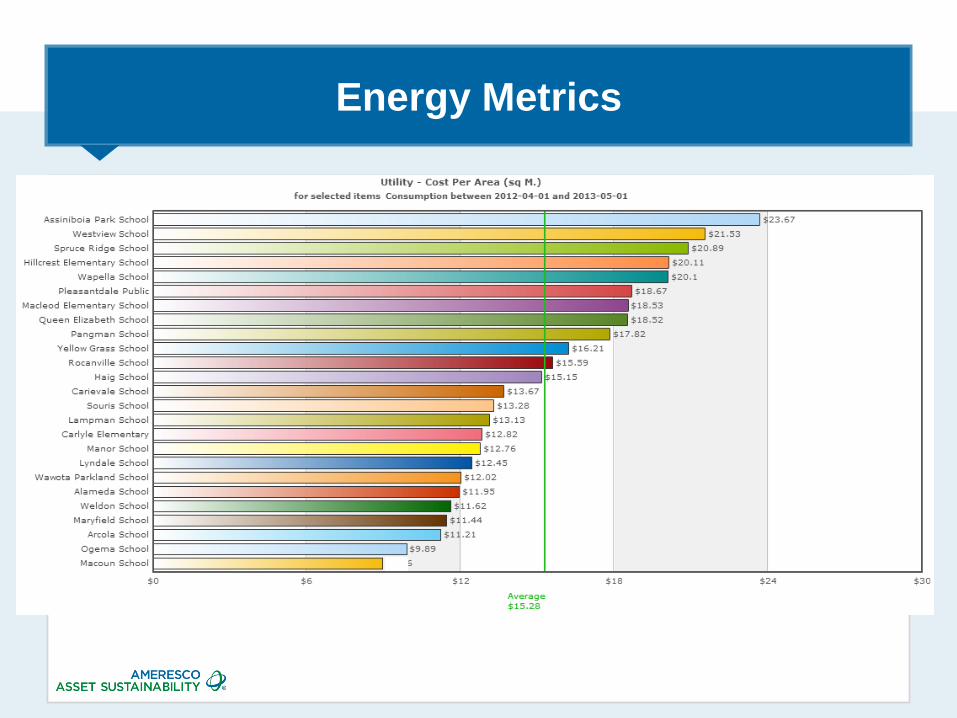
Energy Metrics
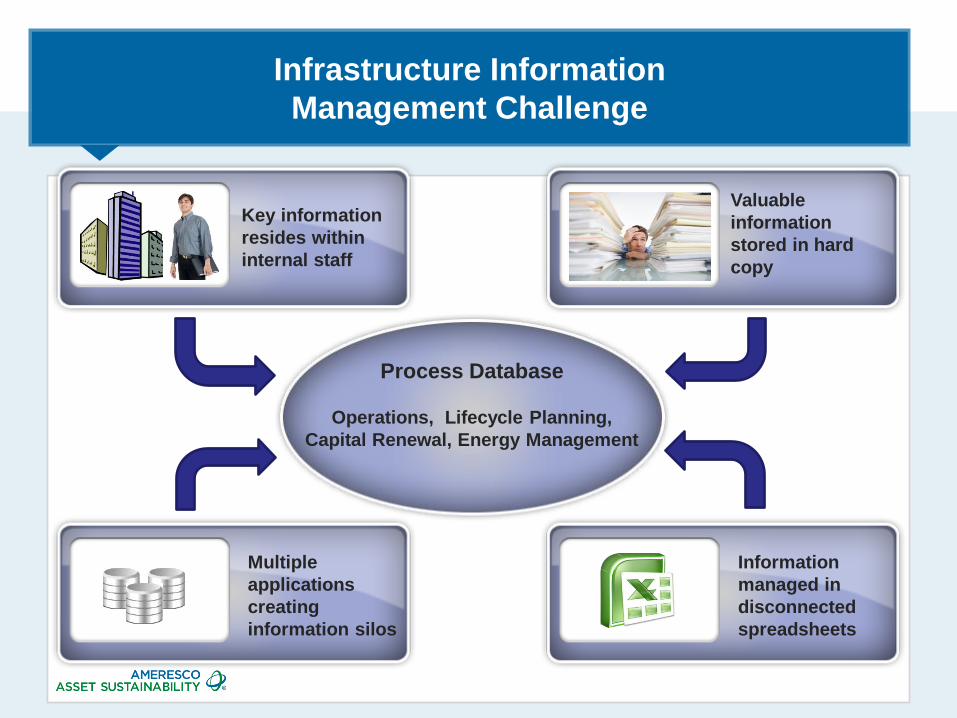
Key information
resides within
internal staff
Multiple
applications
creating
information silos
Information
managed in
disconnected
spreadsheets
Process Database
Operations, Lifecycle Planning,
Capital Renewal, Energy Management
Valuable
information
stored in hard
copy
Infrastructure Information
Management Challenge
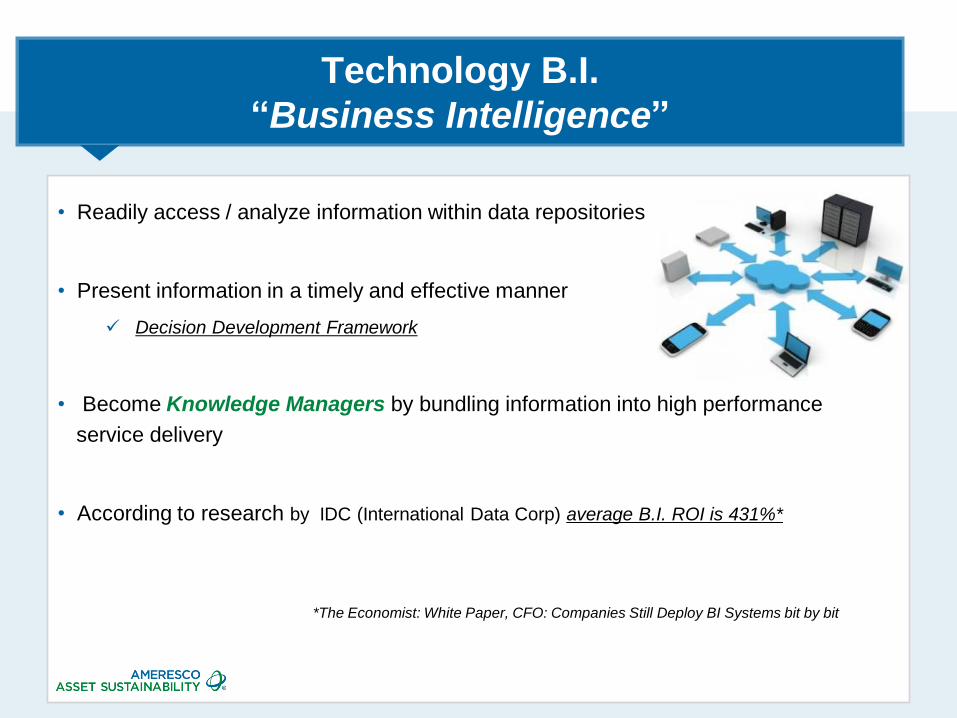
Technology B.I.
“Business Intelligence”
• Readily access / analyze information within data repositories
• Present information in a timely and effective manner
Decision Development Framework
• Become Knowledge Managers by bundling information into high performance
service delivery
• According to research by IDC (International Data Corp) average B.I. ROI is 431%*
*The Economist: White Paper, CFO: Companies Still Deploy BI Systems bit by bit
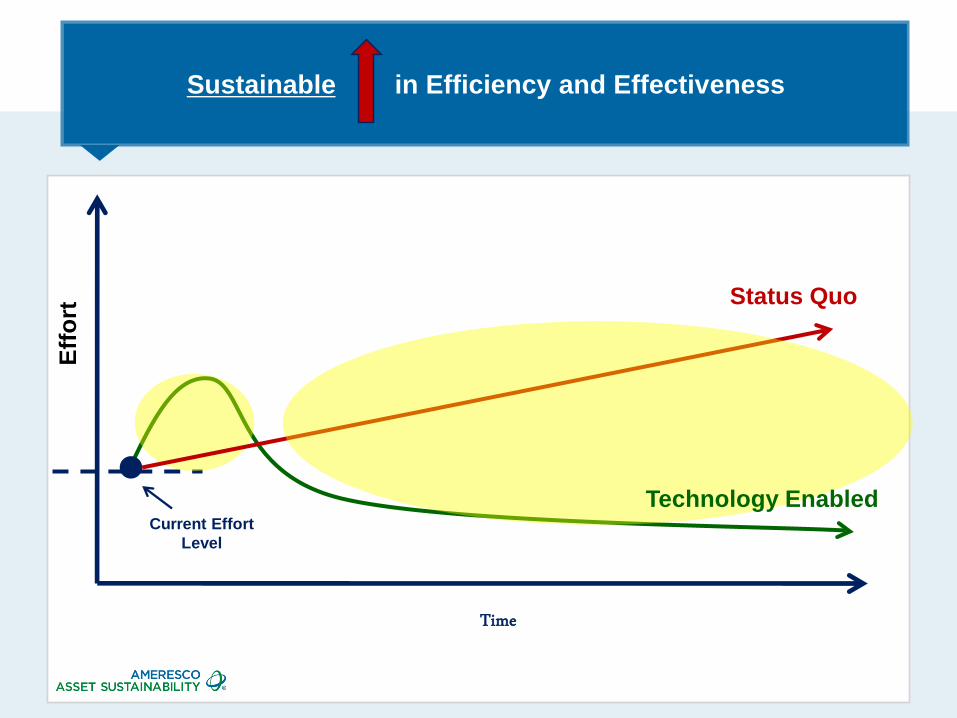
Sustainable in Efficiency and Effectiveness E
ffo
rt
Time
Status Quo
Current Effort
Level
Technology Enabled
David Molinaro, P.Eng. LEED AP®
VP Business Development , Ameresco Asset Sustainability Group
May 8th, 2013
Asset Sustainability
Uniting Capital Asset Management, Energy Efficiency
and Maintenance Management