Embed Size (px)
Citation preview
Asset Management
JULY 2013 WORKSHOPSDALE BARRIE - IRWABRENT BESTE - IRWA
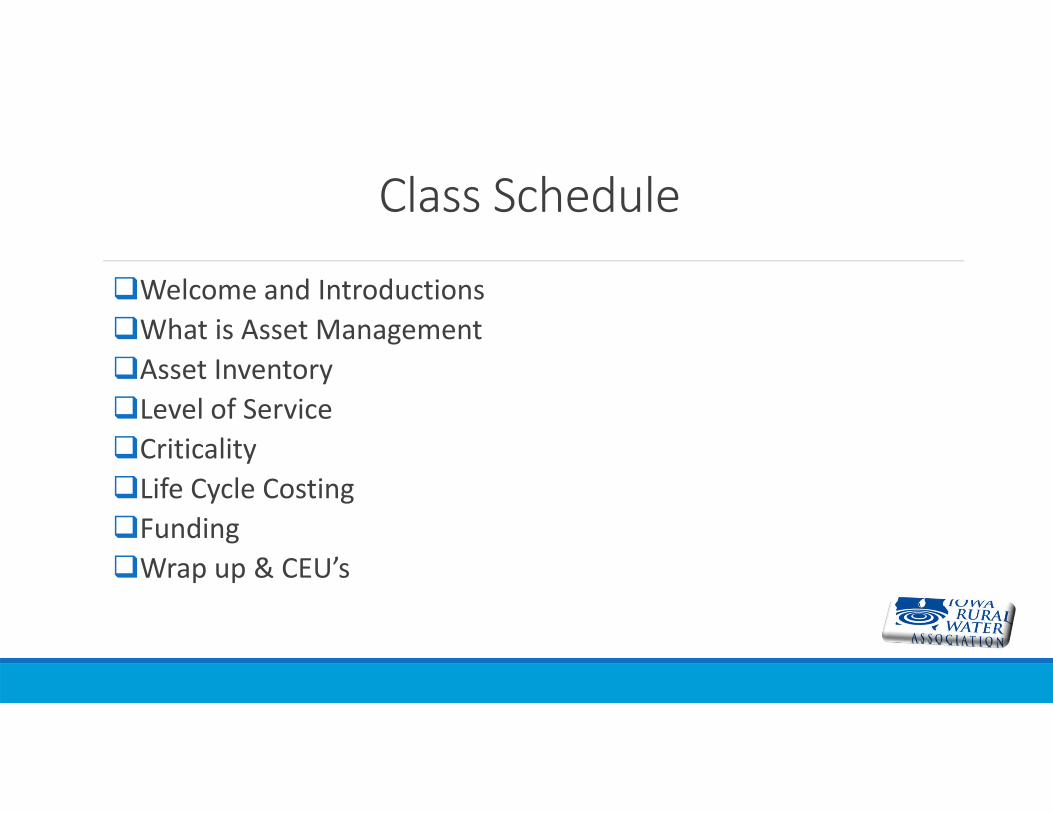
Class Schedule
Welcome and IntroductionsWhat is Asset ManagementAsset InventoryLevel of ServiceCriticalityLife Cycle CostingFundingWrap up & CEU’s
WELCOMESpeakers:Dale Barrie – Training & Technical Assistance [email protected] Beste – Source Water [email protected]
AcknowledgementsInformation presented today was originally based on the Asset Management approach of Australia and New Zealand.
A.M. Kan Work – Asset Management and Energy Efficiency Manual, developed for the Kansas Department of Health and Environment by the New Mexico Environmental Finance Center.
WHAT IS ASSET MANAGEMENT?
Asset – A useful or valuable thing, person or quality or property owned by a person or company, regarding as having value.Management ‐ The process of dealing with or controlling things or people or The responsibility for and control of a company or similar organization.
Asset Management therefore is…..
the management of physical assets (their selection, maintenance, inspection and renewal) and plays a key role in determining the operational performance of a utility
In the simplest terms, Asset Management can be thought of as applied common sense.
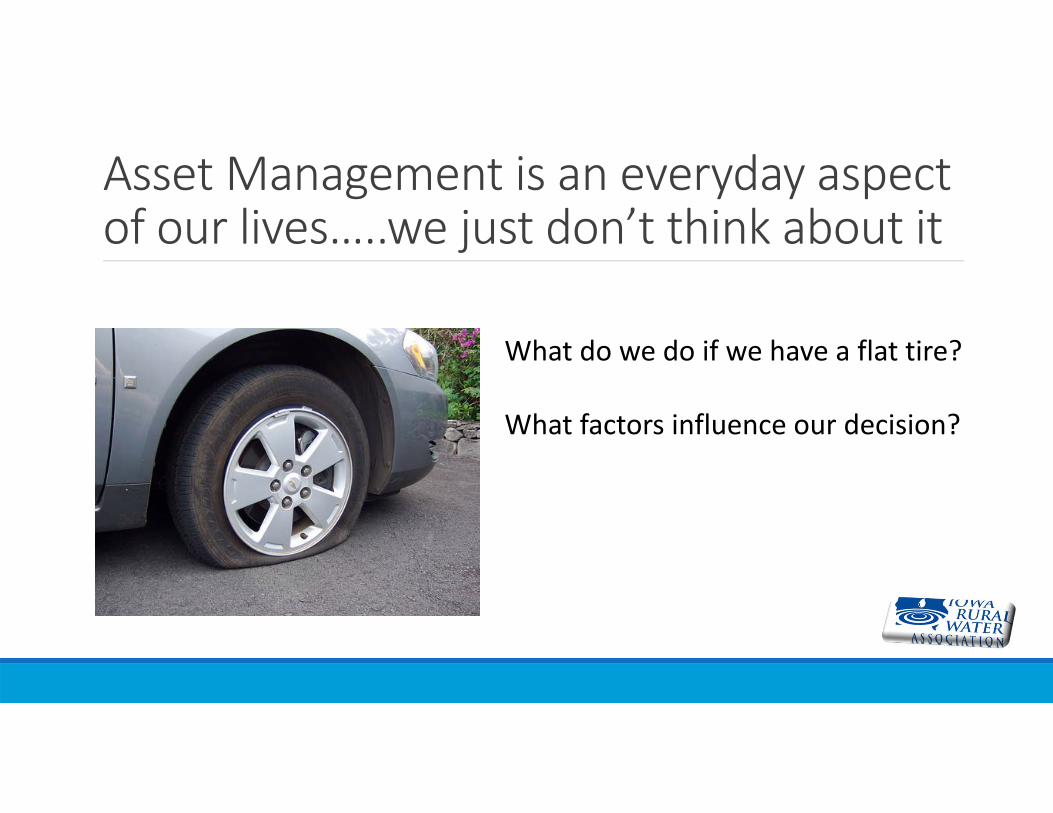
Asset Management is an everyday aspect of our lives…..we just don’t think about it
What do we do if we have a flat tire?
What factors influence our decision?
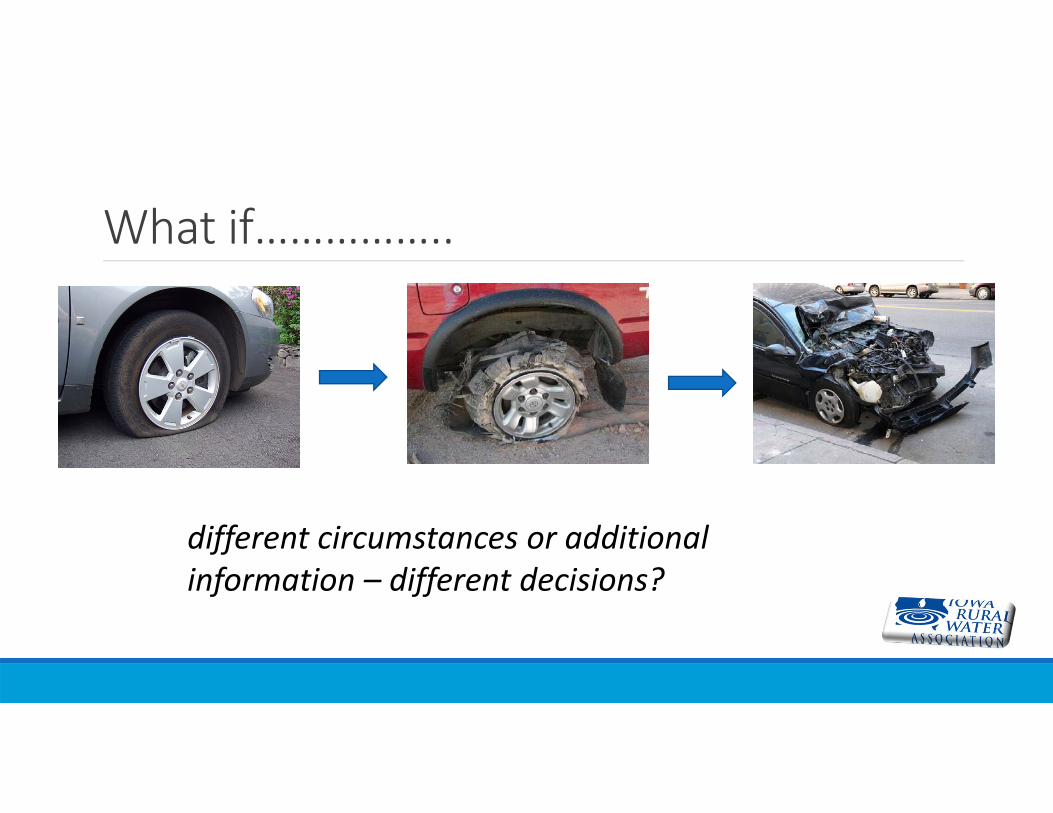
What if……………..
different circumstances or additional information – different decisions?
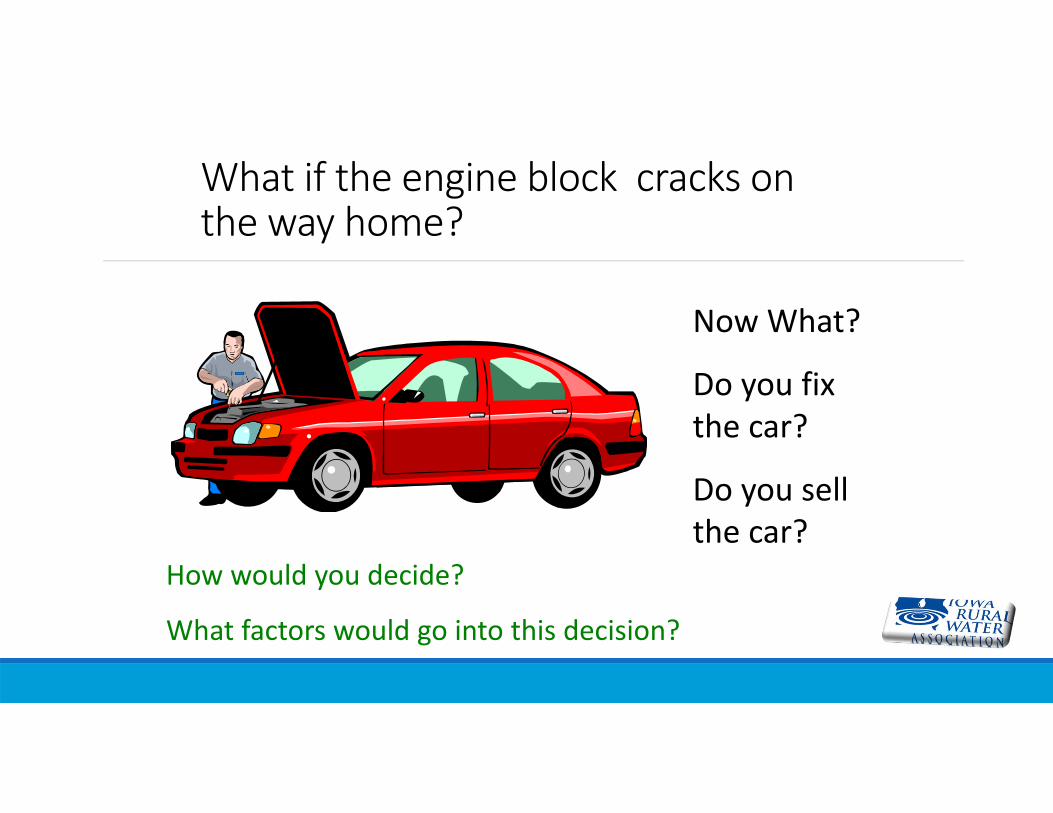
What if the engine block cracks on the way home?
Now What?
Do you fix the car?
Do you sell the car?
How would you decide?
What factors would go into this decision?
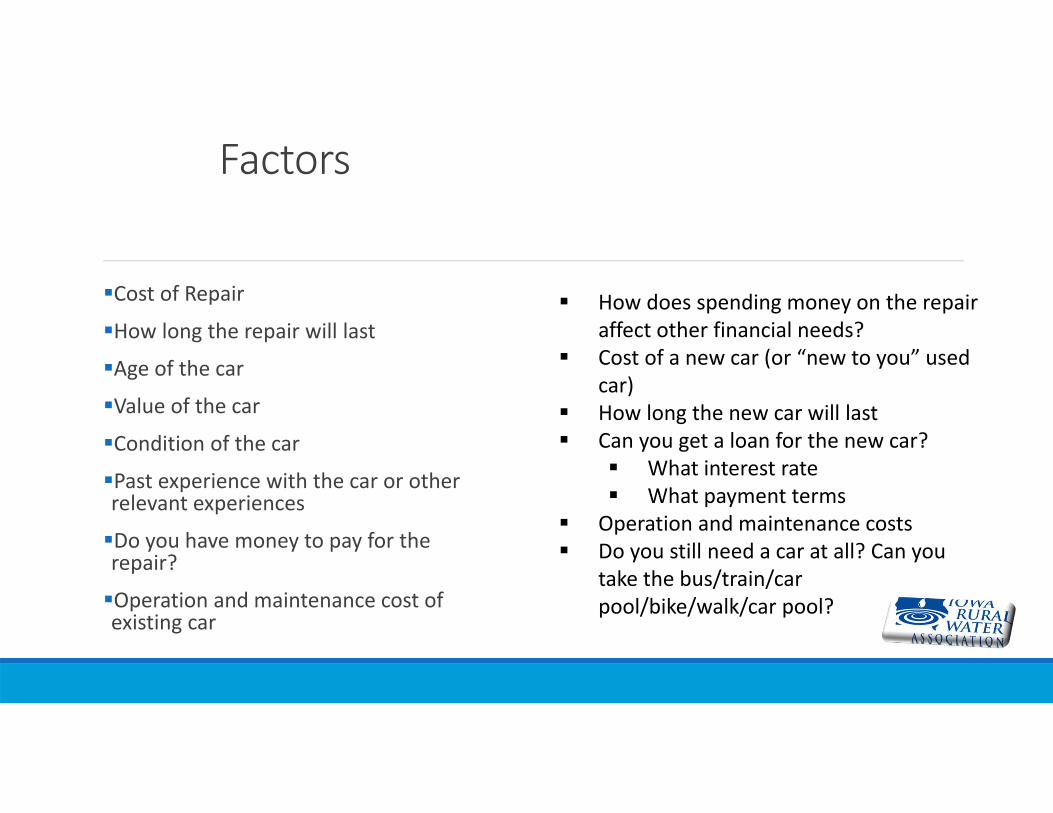
Factors
Cost of Repair
How long the repair will last
Age of the car
Value of the car
Condition of the car
Past experience with the car or other relevant experiences
Do you have money to pay for the repair?
Operation and maintenance cost of existing car
How does spending money on the repair affect other financial needs?
Cost of a new car (or “new to you” used car)
How long the new car will last Can you get a loan for the new car?
What interest rate What payment terms
Operation and maintenance costs Do you still need a car at all? Can you
take the bus/train/car pool/bike/walk/car pool?
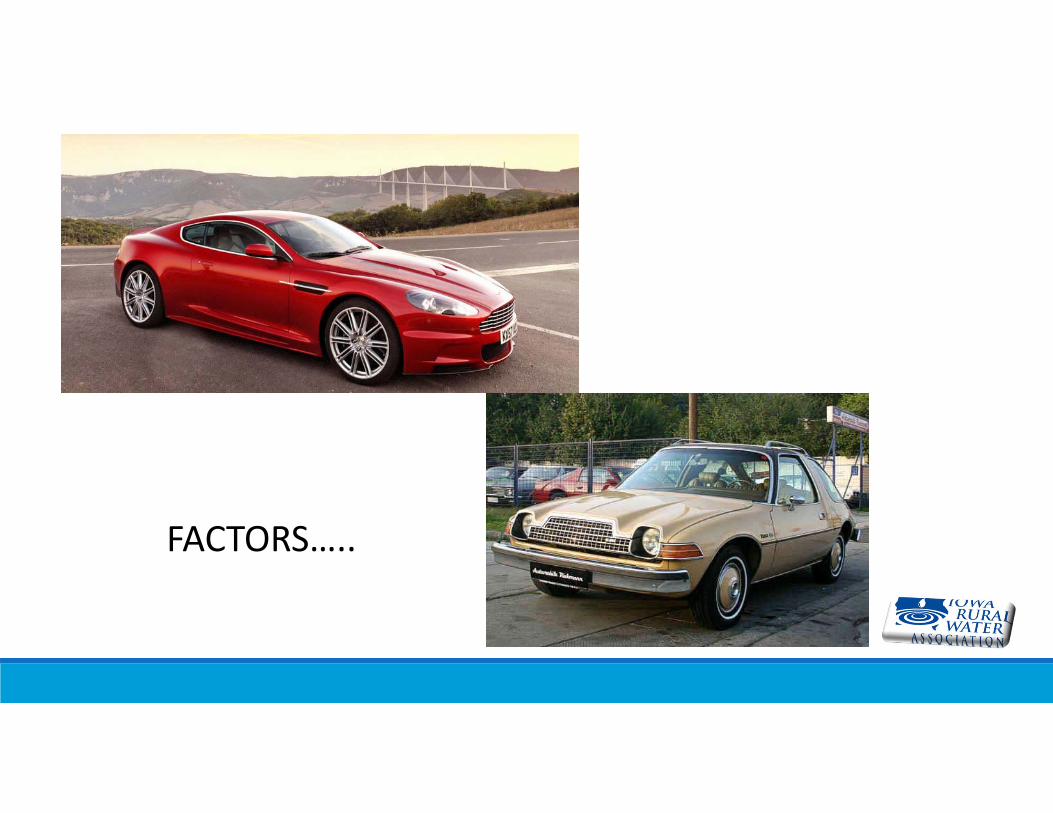
FACTORS…..
Decision Making Fuels Asset ManagementIf all your decisions were like the flat tire, a formal program to help you make them would not be needed……..
Unfortunately most of the decisions we make with our utilities are more complicated (like the engine block).
Limited funds and competing priorities, needs and availability complicate these decisions.
A program to help you collect the data and provide the framework for these decisions is beneficial.
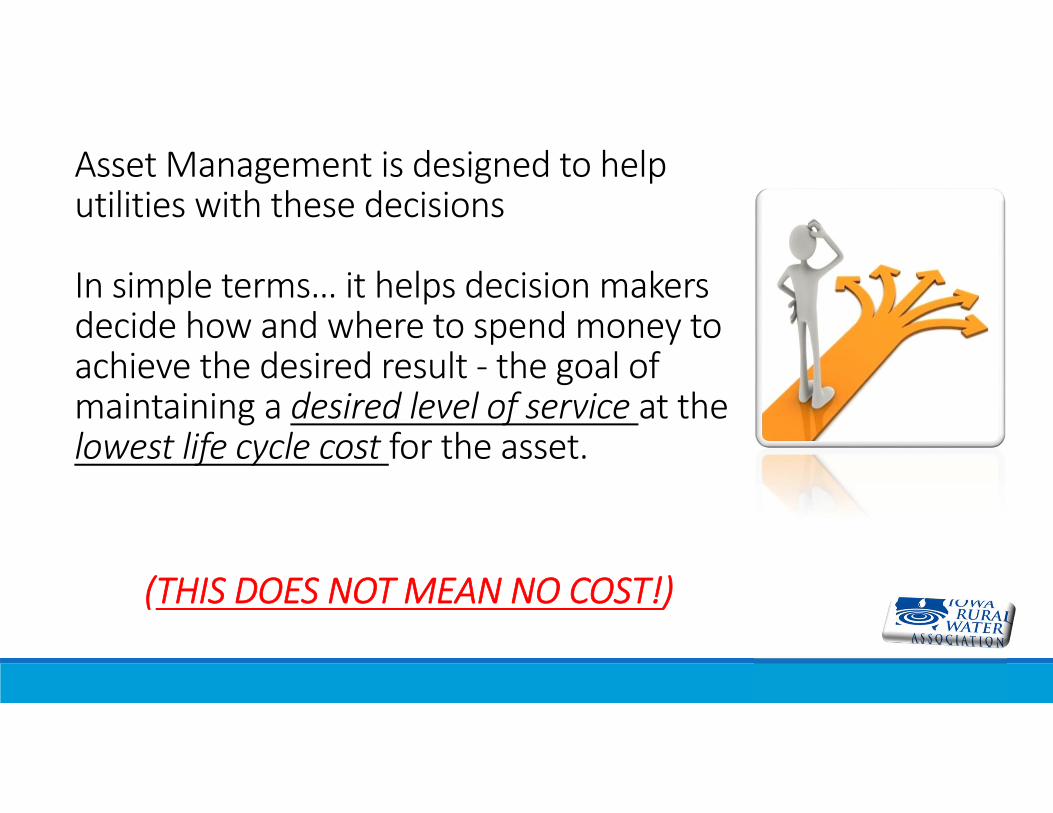
Asset Management is designed to help utilities with these decisions
In simple terms… it helps decision makers decide how and where to spend money to achieve the desired result ‐ the goal of maintaining a desired level of service at the lowest life cycle cost for the asset.
(THIS DOES NOT MEAN NO COST!)
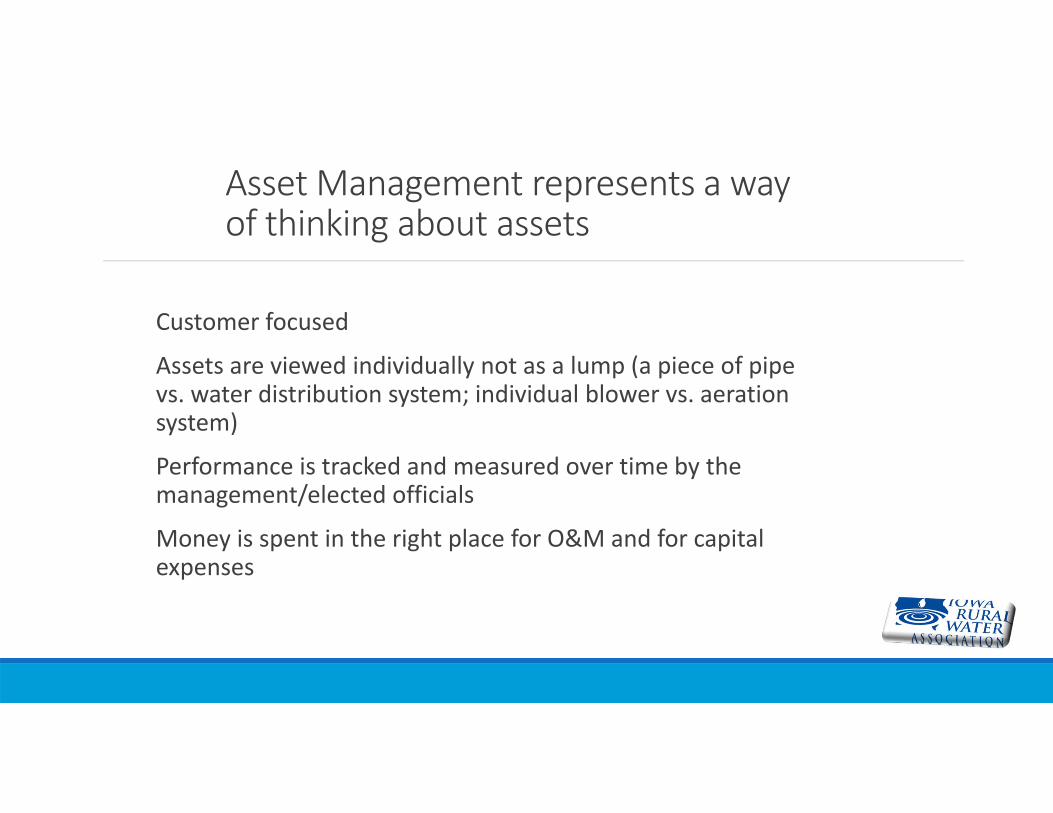
Asset Management represents a way of thinking about assets
Customer focused
Assets are viewed individually not as a lump (a piece of pipe vs. water distribution system; individual blower vs. aeration system)
Performance is tracked and measured over time by the management/elected officials
Money is spent in the right place for O&M and for capital expenses
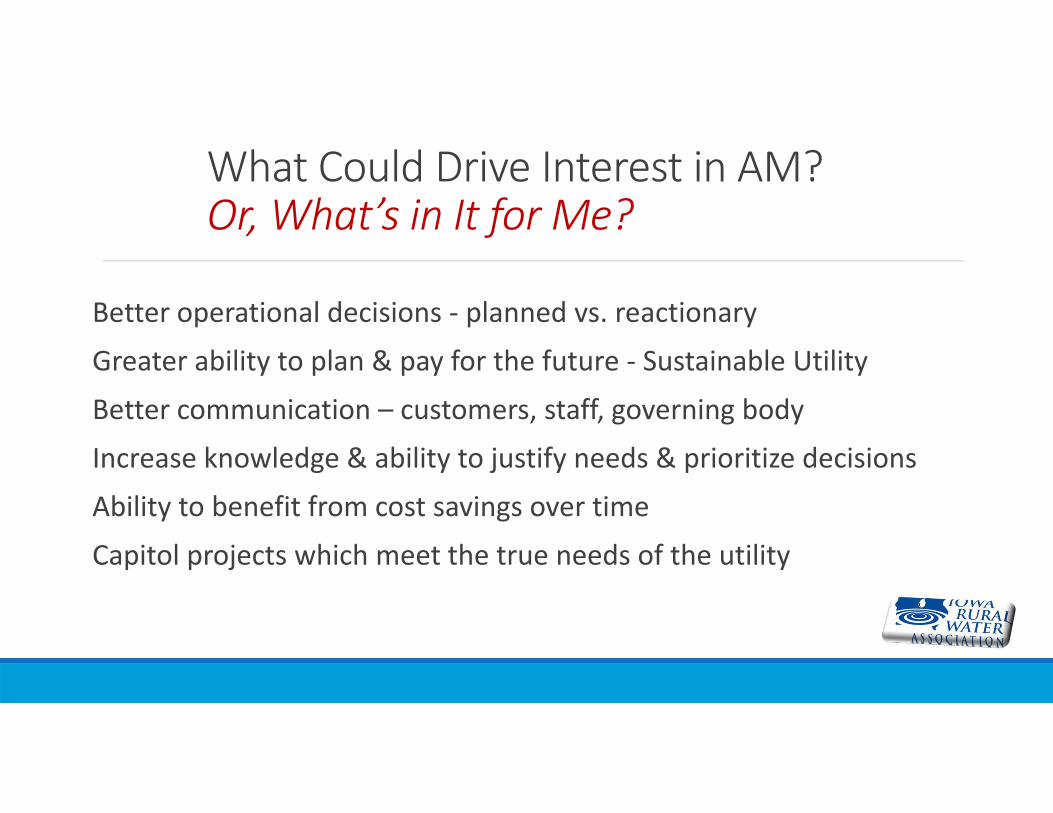
What Could Drive Interest in AM? Or, What’s in It for Me?
Better operational decisions ‐ planned vs. reactionary
Greater ability to plan & pay for the future ‐ Sustainable Utility
Better communication – customers, staff, governing body
Increase knowledge & ability to justify needs & prioritize decisions
Ability to benefit from cost savings over time
Capitol projects which meet the true needs of the utility
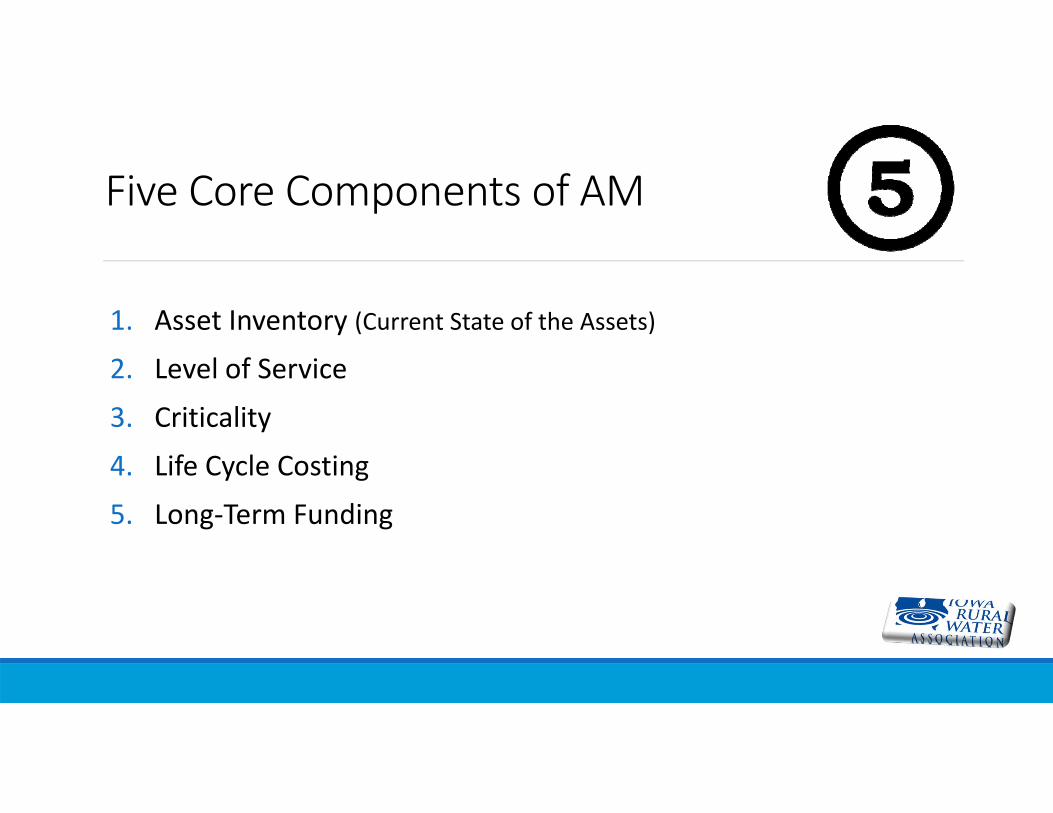
Five Core Components of AM
1. Asset Inventory (Current State of the Assets)
2. Level of Service
3. Criticality
4. Life Cycle Costing
5. Long‐Term Funding
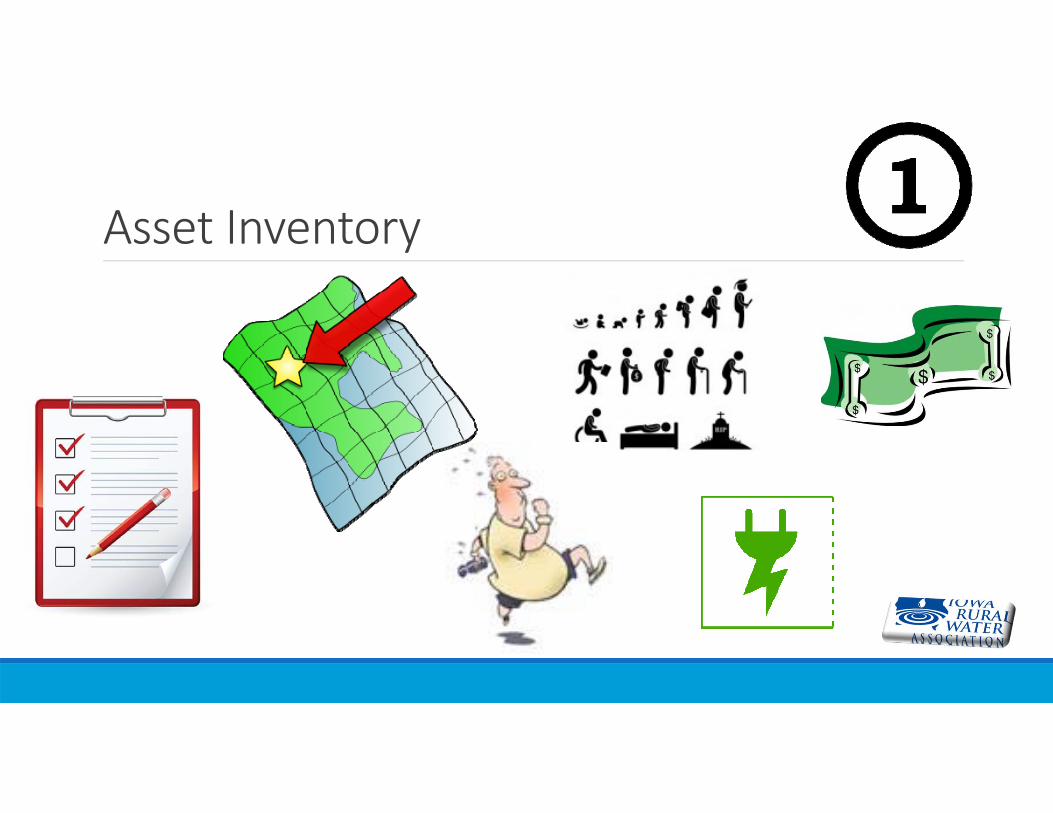
Asset Inventory
What are my assets?Critical to understand what the utility owns
Not always easy to answer
Out of sight – out of mind
Assets purchased/installed over a long period of time
Records are old, incomplete, inaccurate or missing
Changes in staffing limit historical knowledge
Defining an assetsAnything owned which has value?
Too broad to be workable?
By $$ value?
By ability to repair?
What are some examples of your assets?
Developing the initial inventoryHow much time is available
What are your resources
What initial information do you need/want
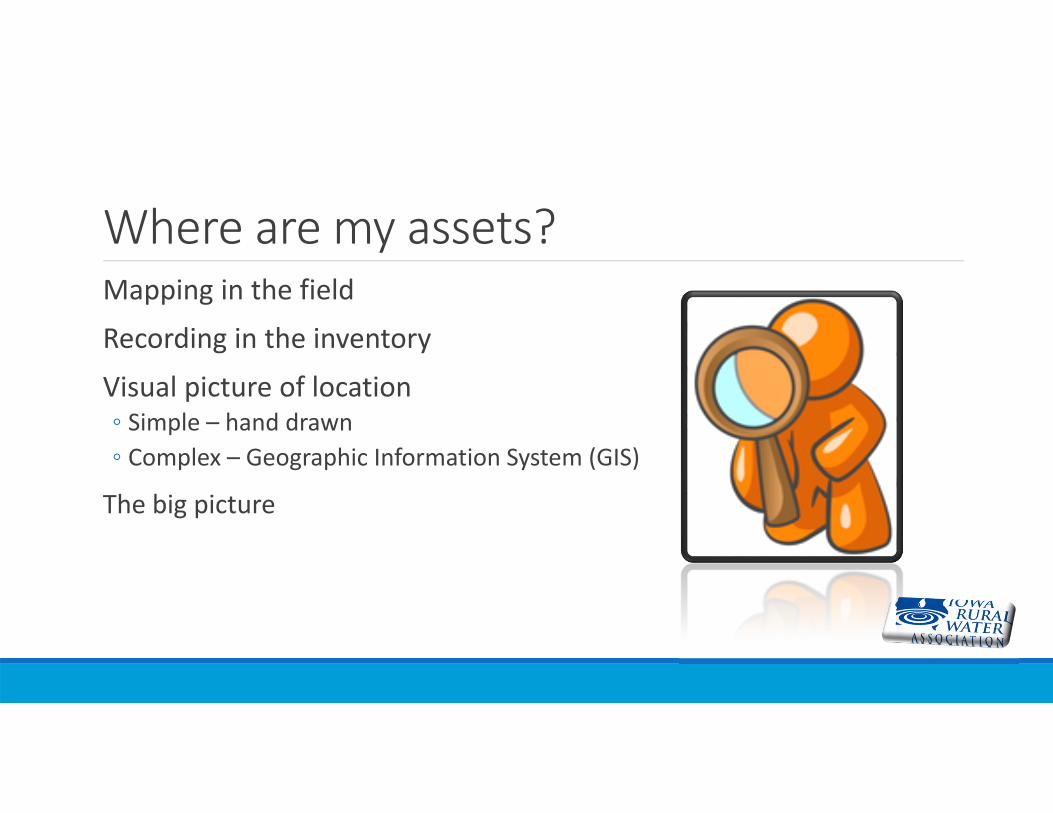
Where are my assets?Mapping in the field
Recording in the inventory
Visual picture of location◦ Simple – hand drawn◦ Complex – Geographic Information System (GIS)
The big picture
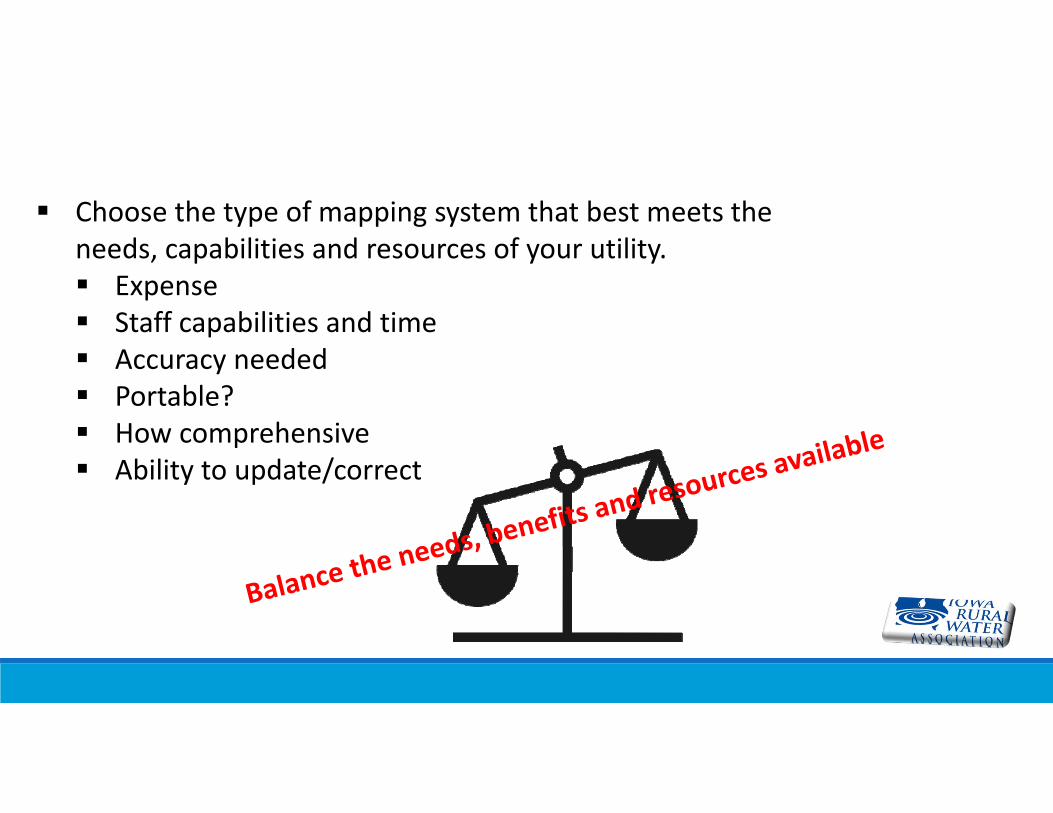
Choose the type of mapping system that best meets the needs, capabilities and resources of your utility. Expense Staff capabilities and time Accuracy needed Portable? How comprehensive Ability to update/correct
Brent Mapping Presentation
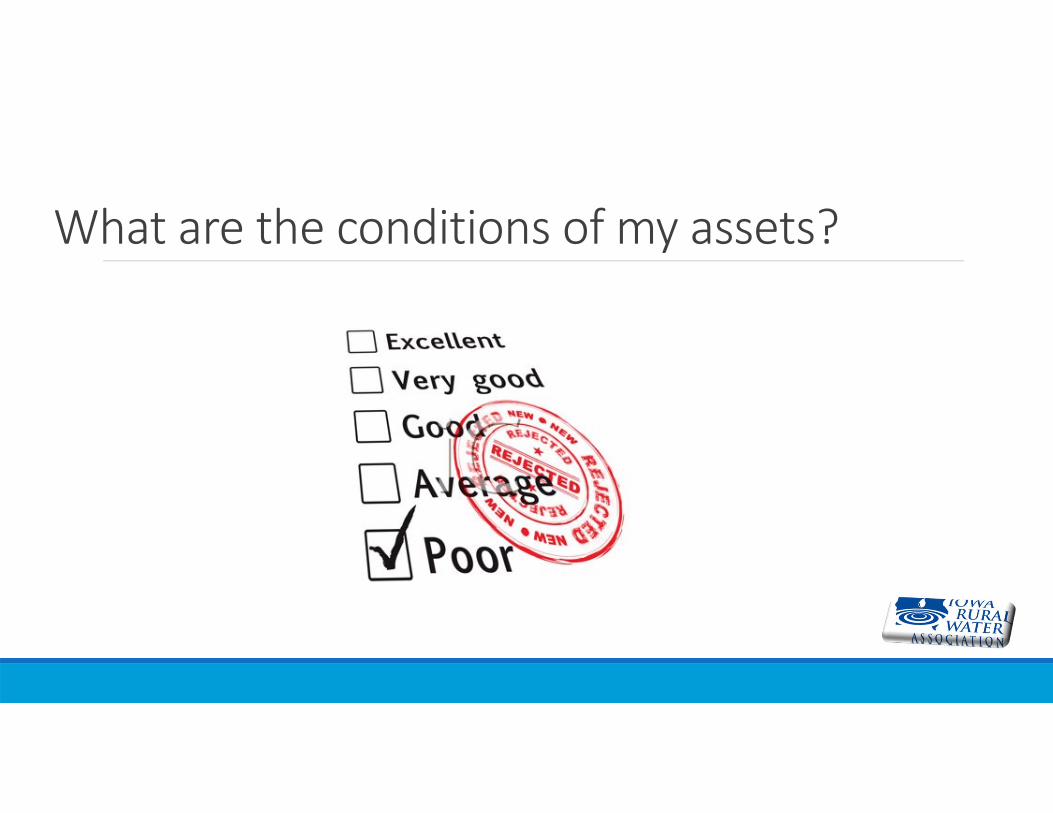
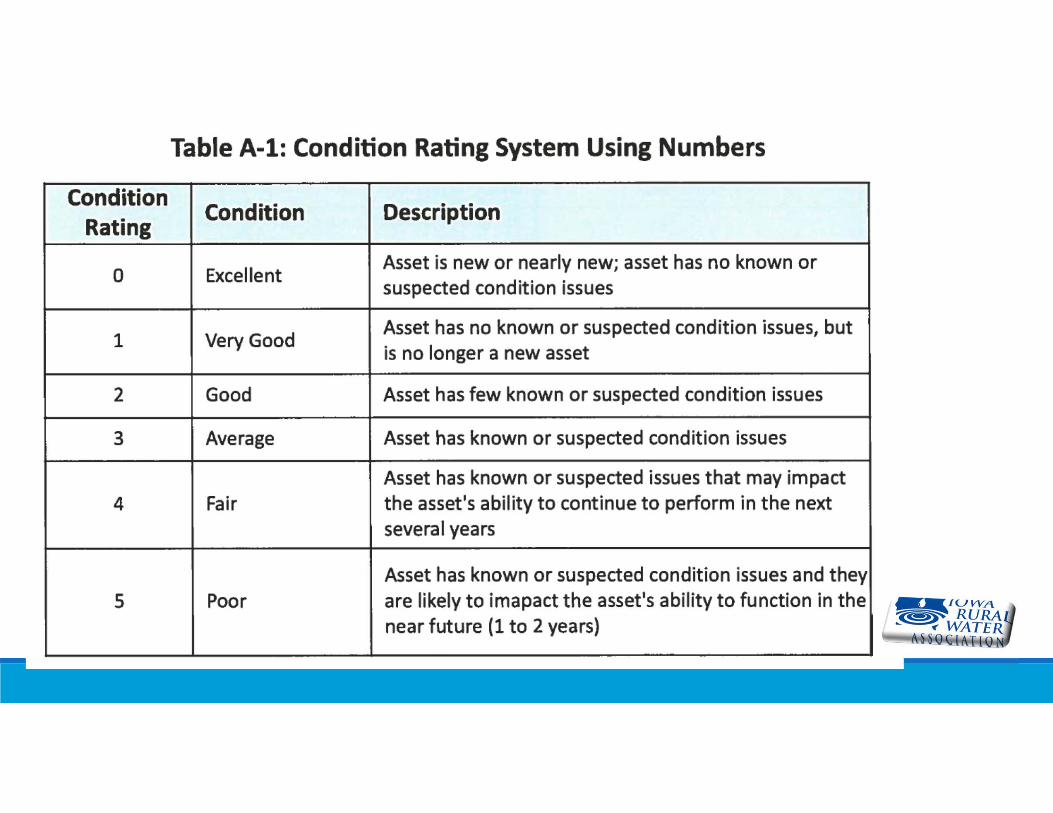
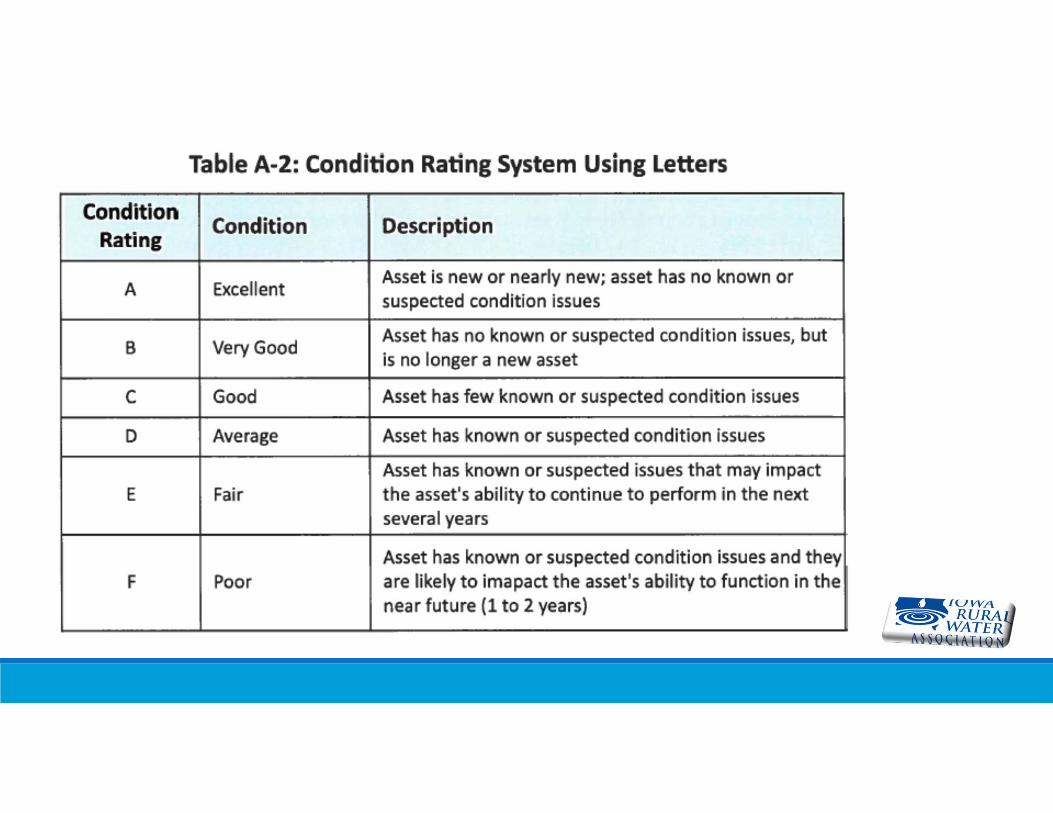
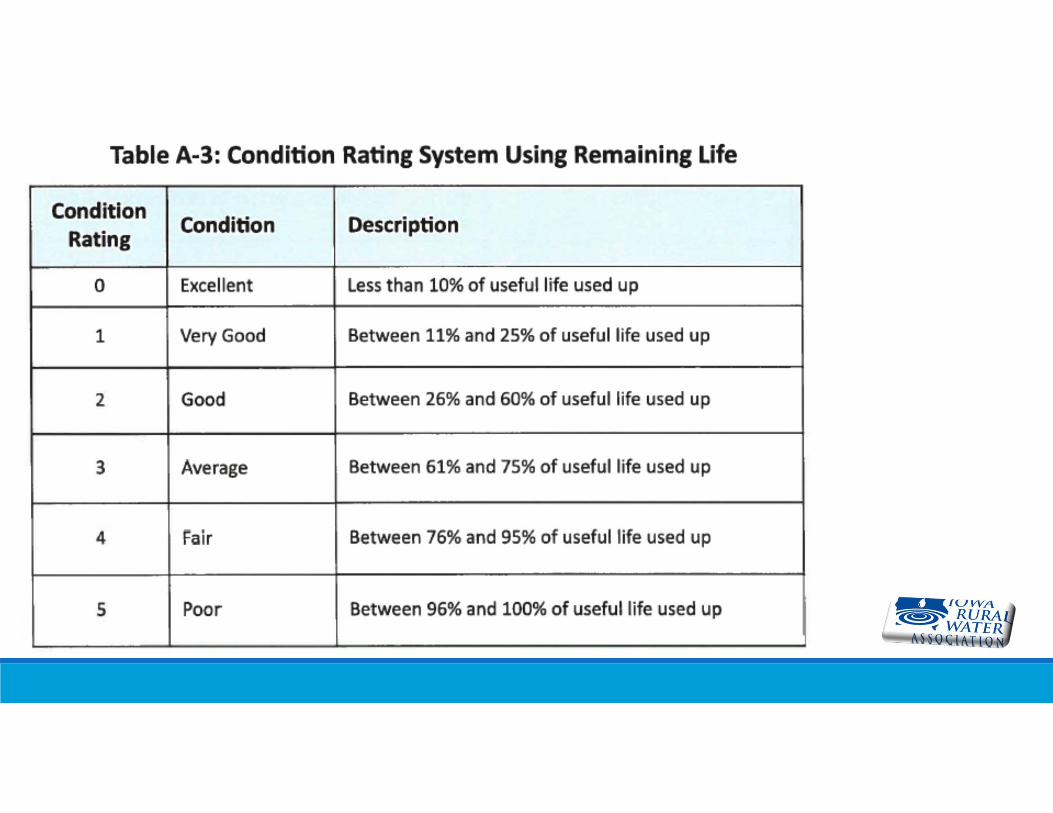
What are the conditions of my assets?
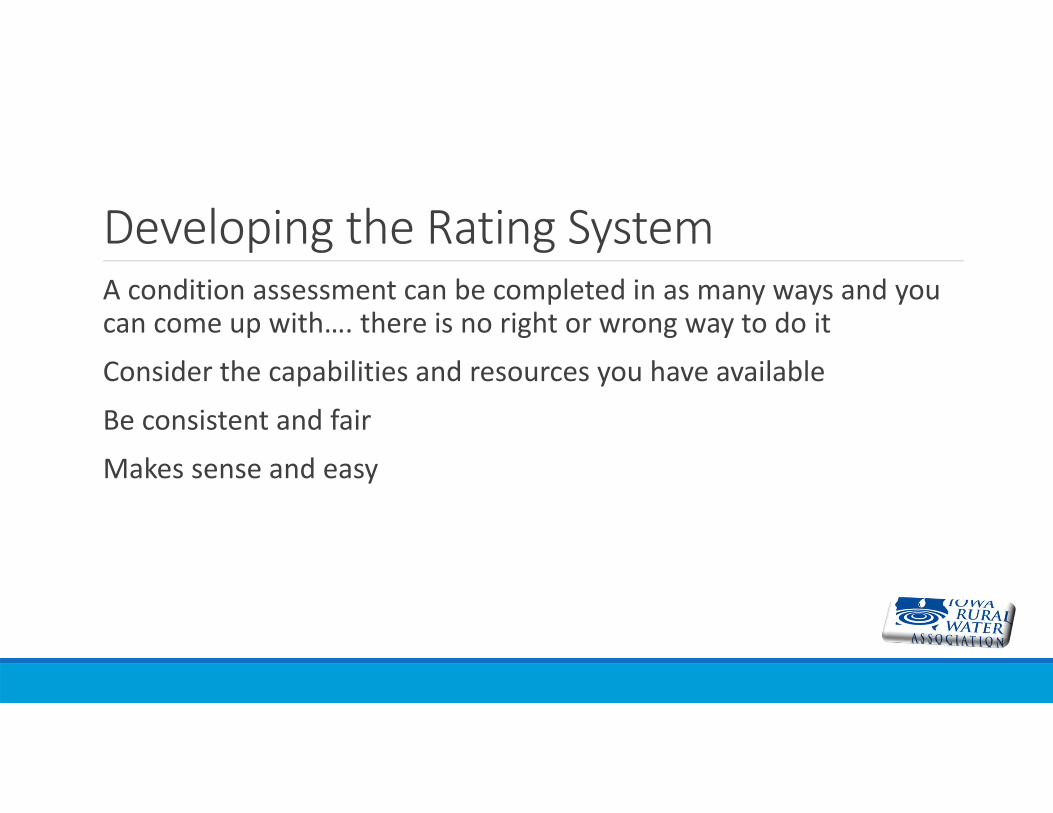
Developing the Rating SystemA condition assessment can be completed in as many ways and you can come up with…. there is no right or wrong way to do it
Consider the capabilities and resources you have available
Be consistent and fair
Makes sense and easy
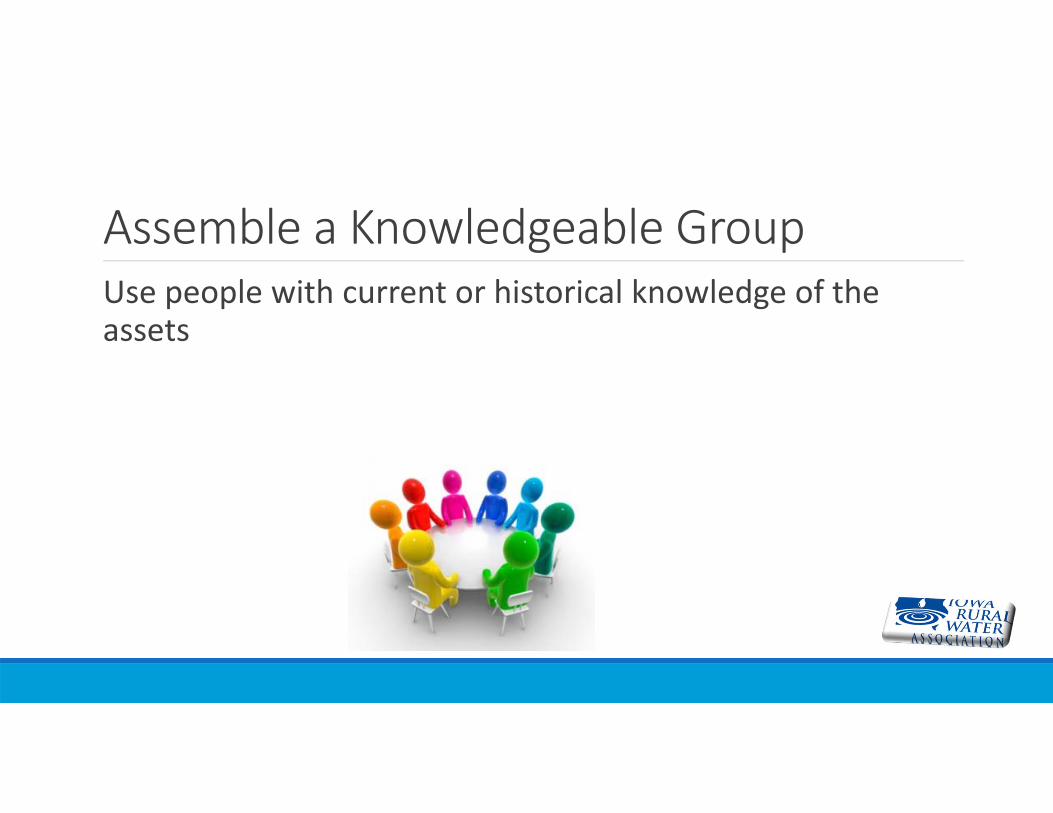
Assemble a Knowledgeable GroupUse people with current or historical knowledge of the assets
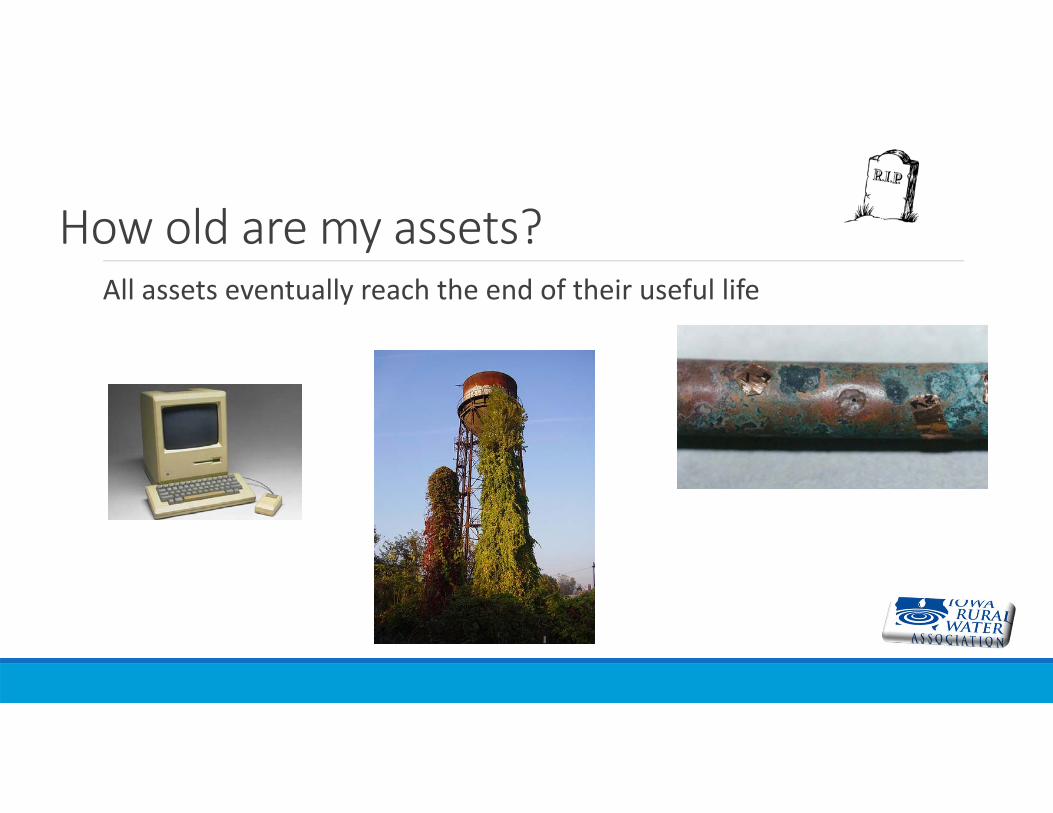
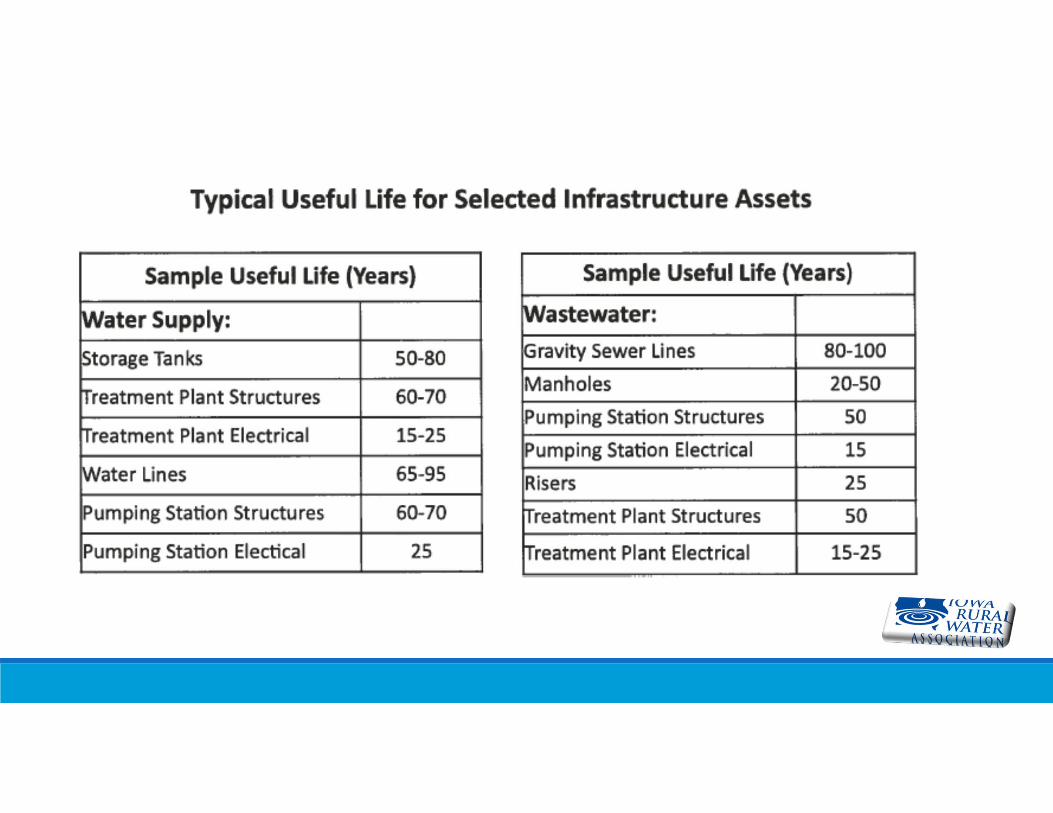
How old are my assets? All assets eventually reach the end of their useful life
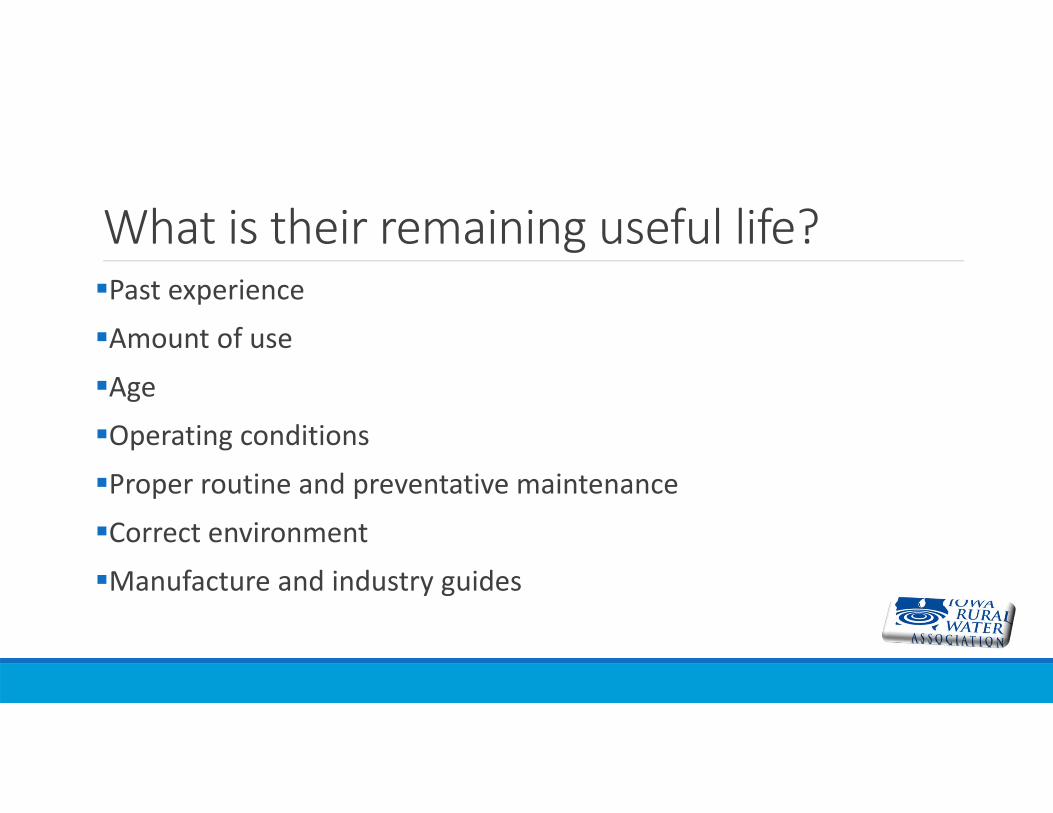
What is their remaining useful life?Past experience
Amount of use
Age
Operating conditions
Proper routine and preventative maintenance
Correct environment
Manufacture and industry guides
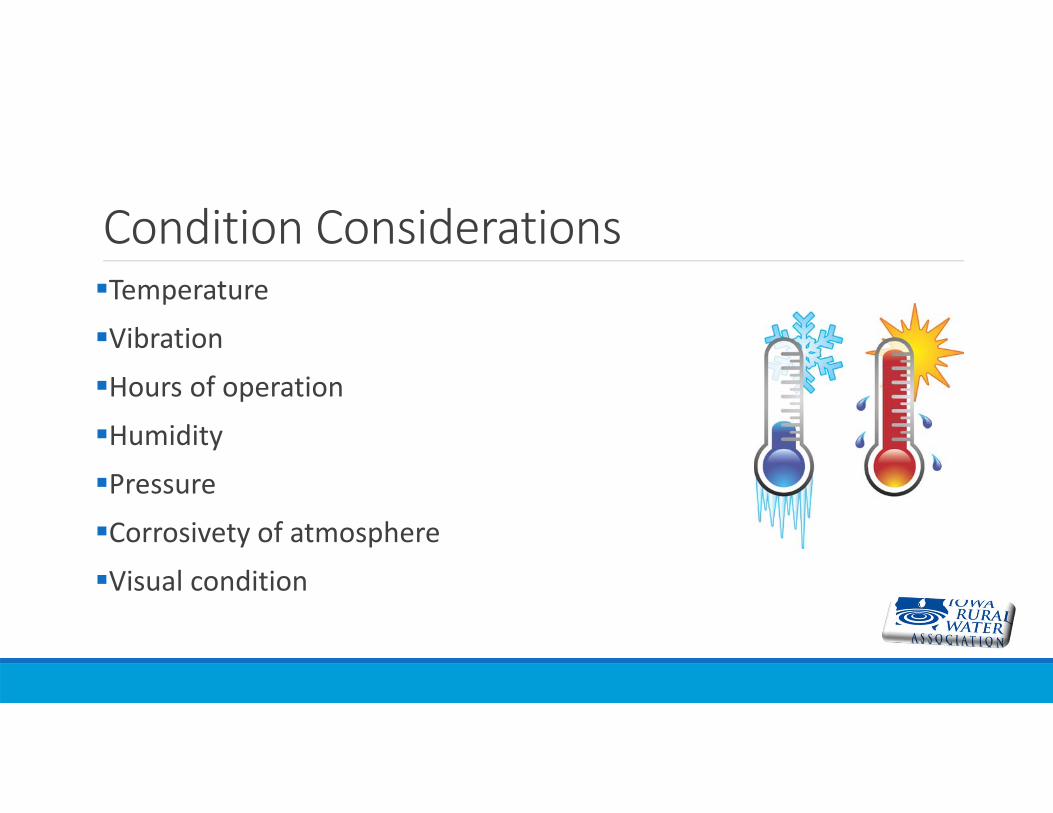
Condition ConsiderationsTemperature
Vibration
Hours of operation
Humidity
Pressure
Corrosivety of atmosphere
Visual condition
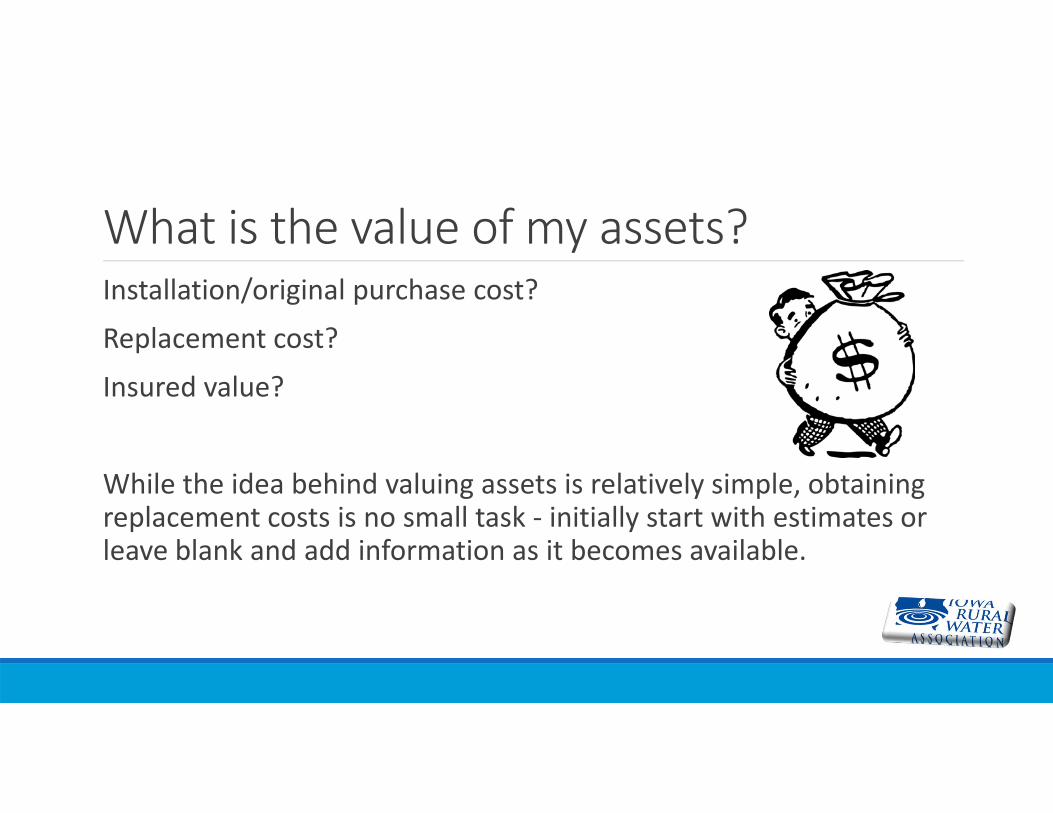
What is the value of my assets?Installation/original purchase cost?
Replacement cost?
Insured value?
While the idea behind valuing assets is relatively simple, obtaining replacement costs is no small task ‐ initially start with estimates or leave blank and add information as it becomes available.
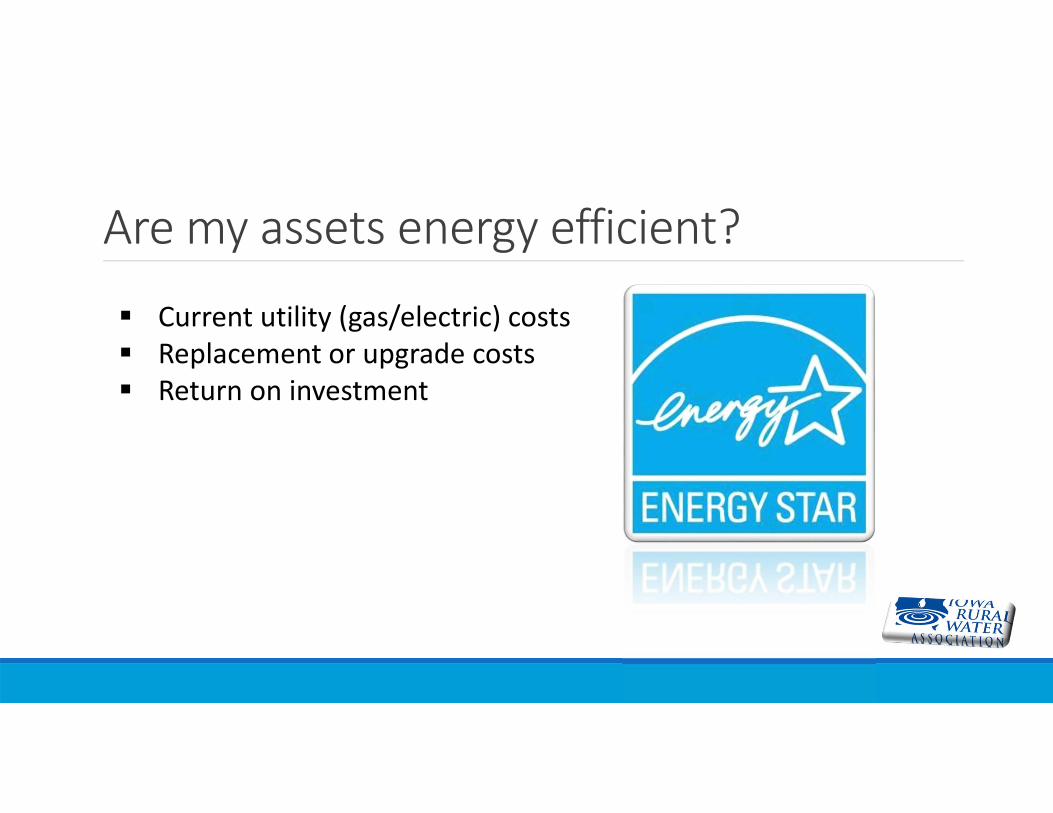
Are my assets energy efficient?
Current utility (gas/electric) costs Replacement or upgrade costs Return on investment
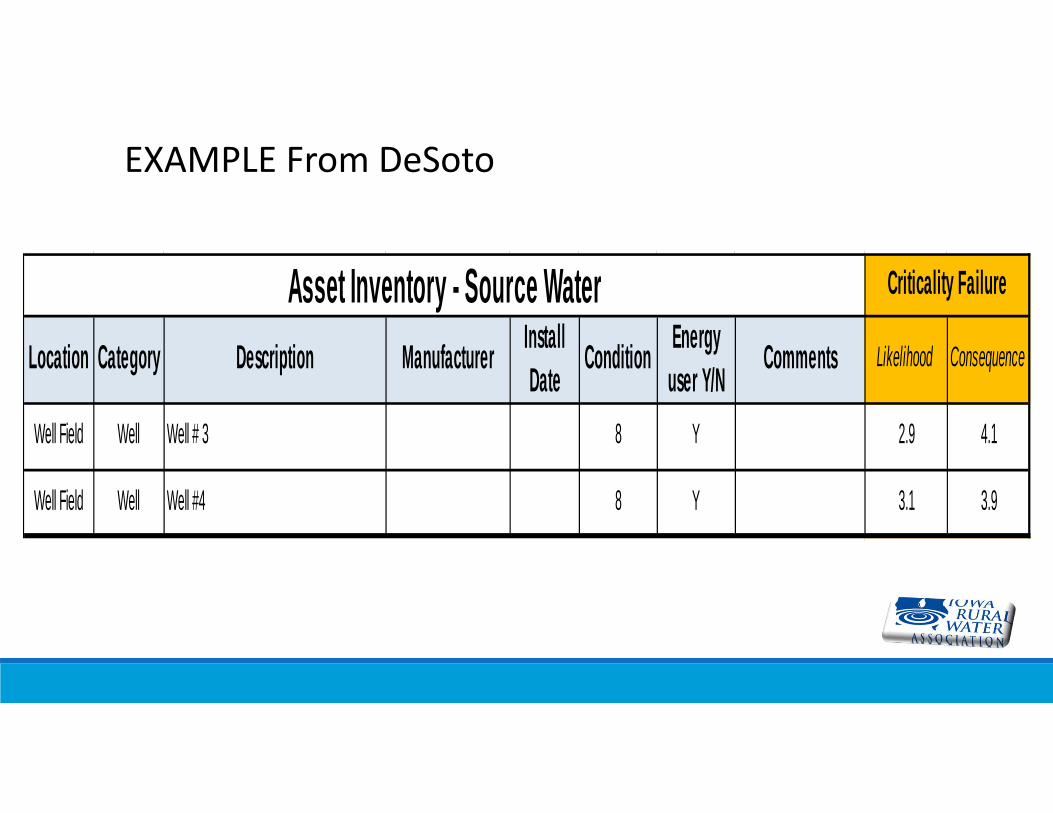
EXAMPLE From DeSoto
Location Category Description Manufacturer Install Date Condition Energy
user Y/N Comments Likelihood Consequence
Well Field Well Well # 3 8 Y 2.9 4.1
Well Field Well Well #4 8 Y 3.1 3.9
Asset Inventory - Source Water Criticality Failure
Level of Service (LOS)
Water utilities are in the business of providing safe, reliable drinking water at an acceptable pressure.
Wastewater utilities are in the business of treating and discharging wastewater in an environmentally sound manner.
Expressing how the utility will meet customer expectations is called the Level of Service (LOS)
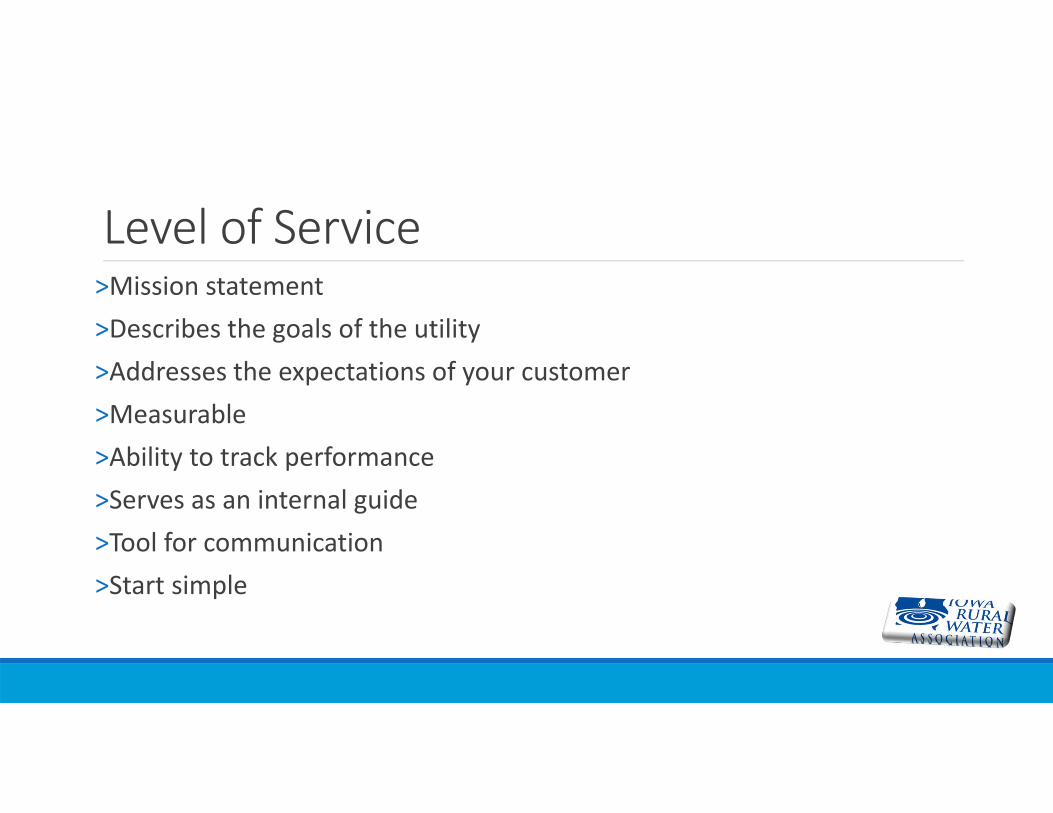
Level of Service˃Mission statement˃Describes the goals of the utility˃Addresses the expectations of your customer˃Measurable˃Ability to track performance˃Serves as an internal guide˃Tool for communication˃Start simple
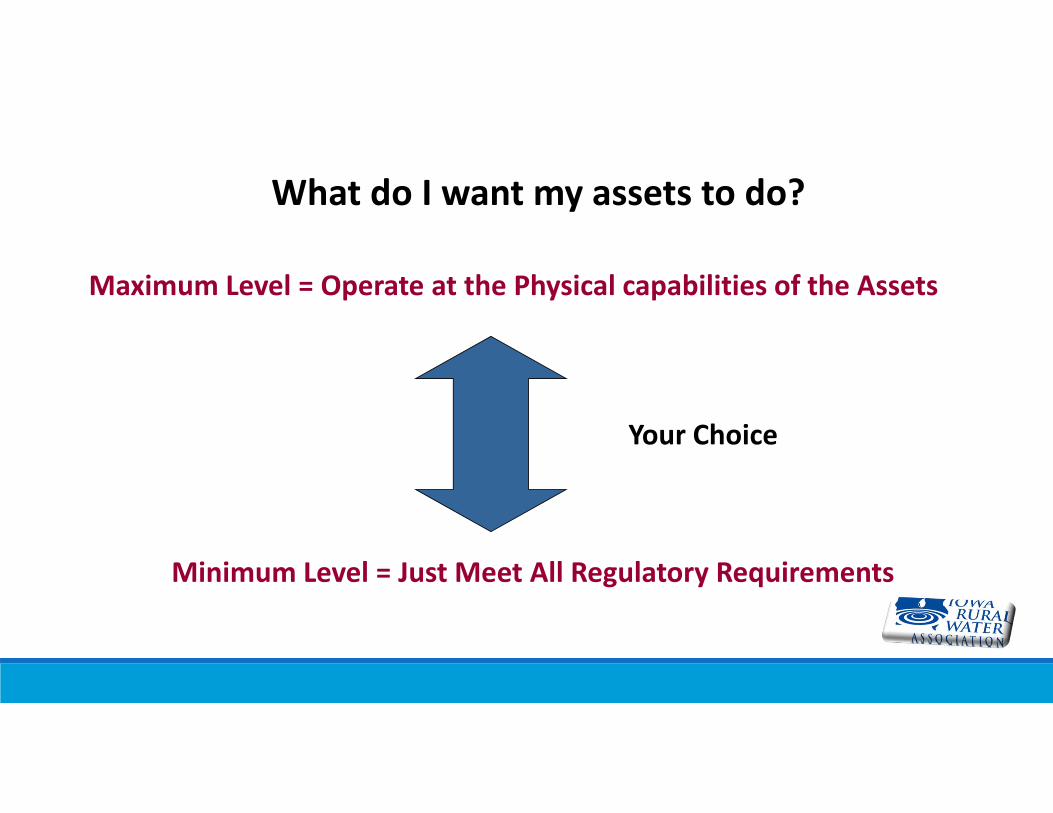
What do I want my assets to do?
Minimum Level = Just Meet All Regulatory Requirements
Maximum Level = Operate at the Physical capabilities of the Assets
Your Choice

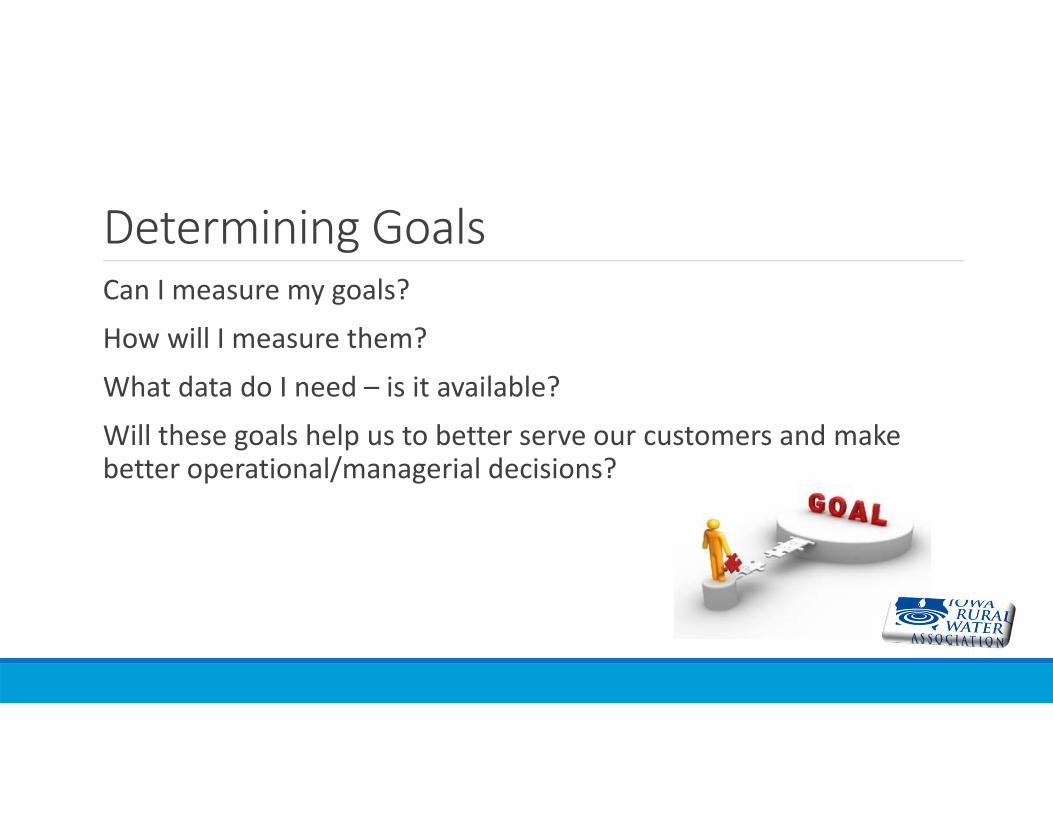
Determining GoalsCan I measure my goals?
How will I measure them?
What data do I need – is it available?
Will these goals help us to better serve our customers and make better operational/managerial decisions?
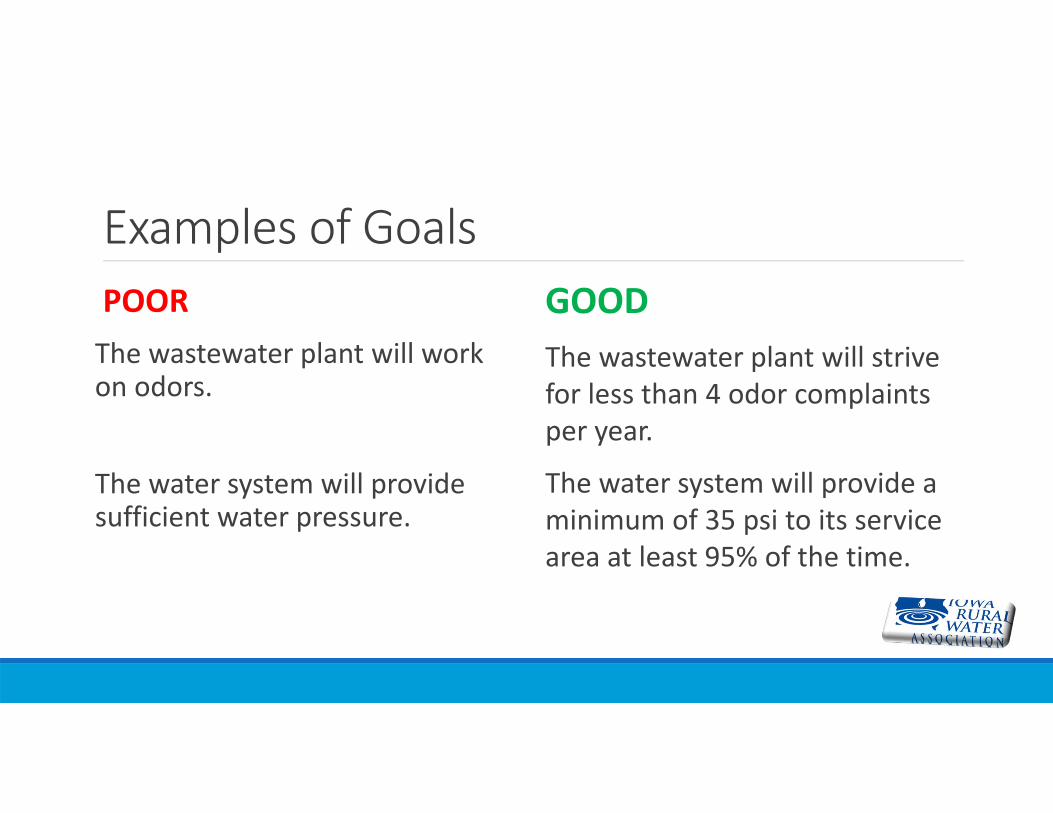
Examples of GoalsPOORThe wastewater plant will work on odors.
The water system will provide sufficient water pressure.
GOODThe wastewater plant will strive for less than 4 odor complaints per year.
The water system will provide a minimum of 35 psi to its service area at least 95% of the time.
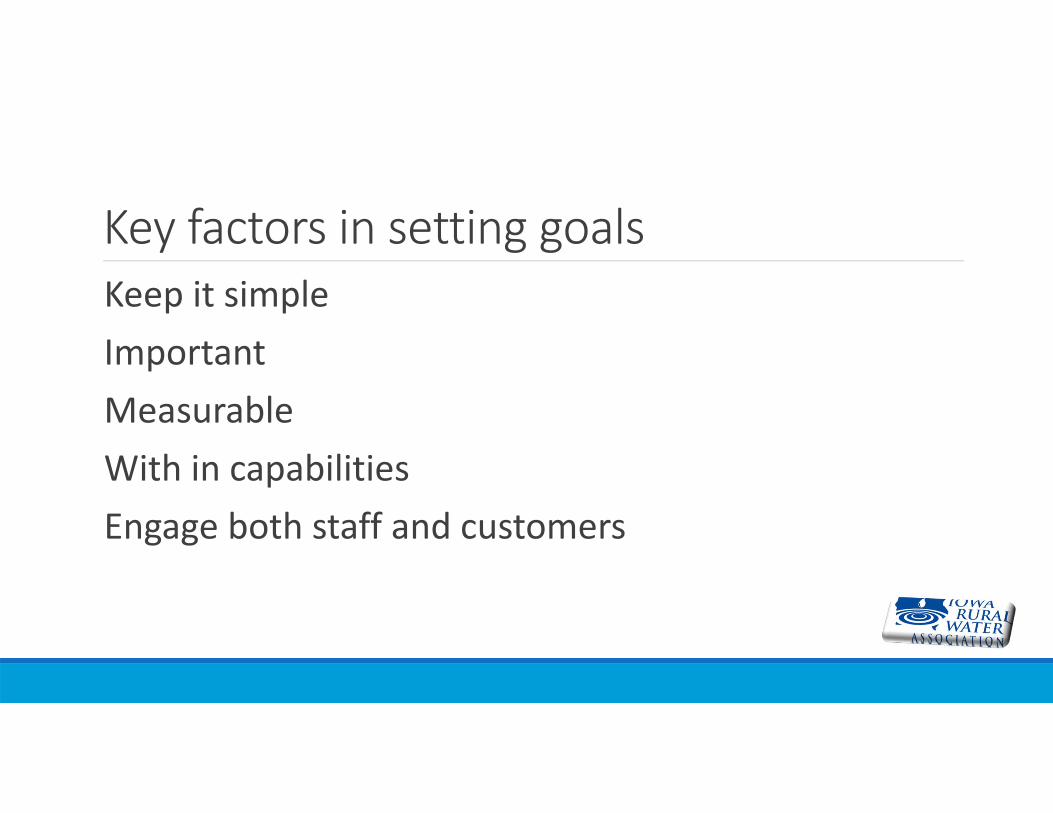
Key factors in setting goalsKeep it simpleImportantMeasurableWith in capabilitiesEngage both staff and customers
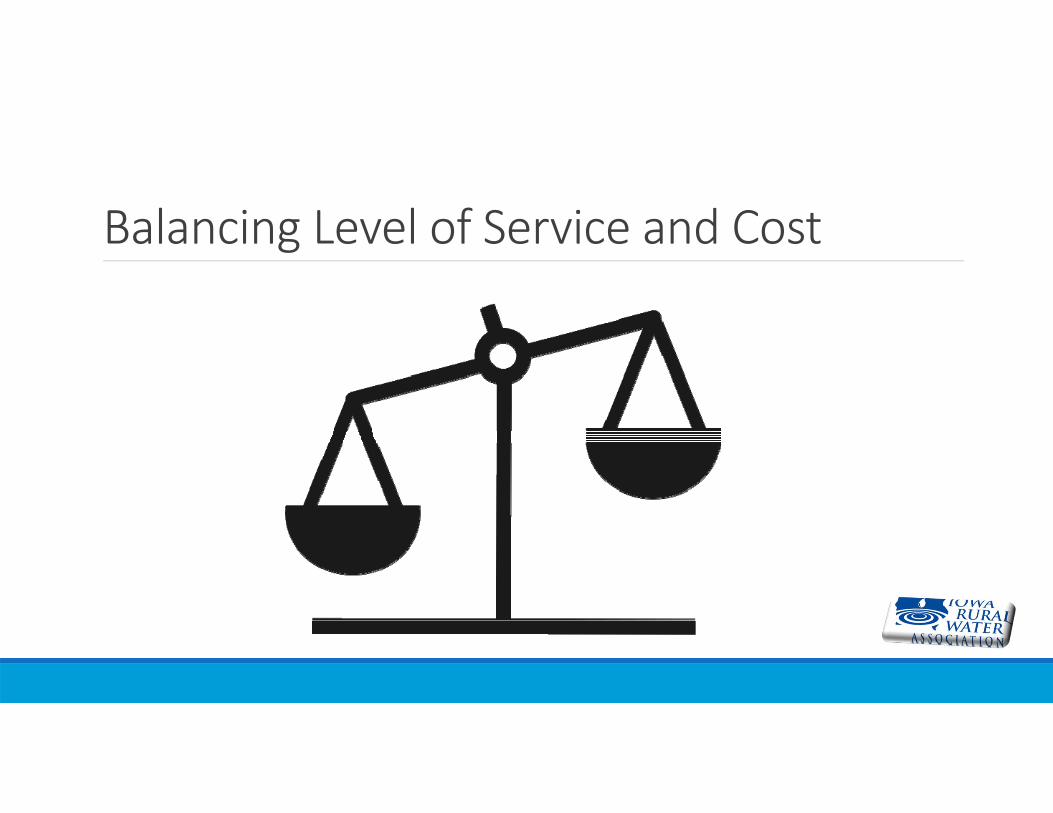
Balancing Level of Service and Cost

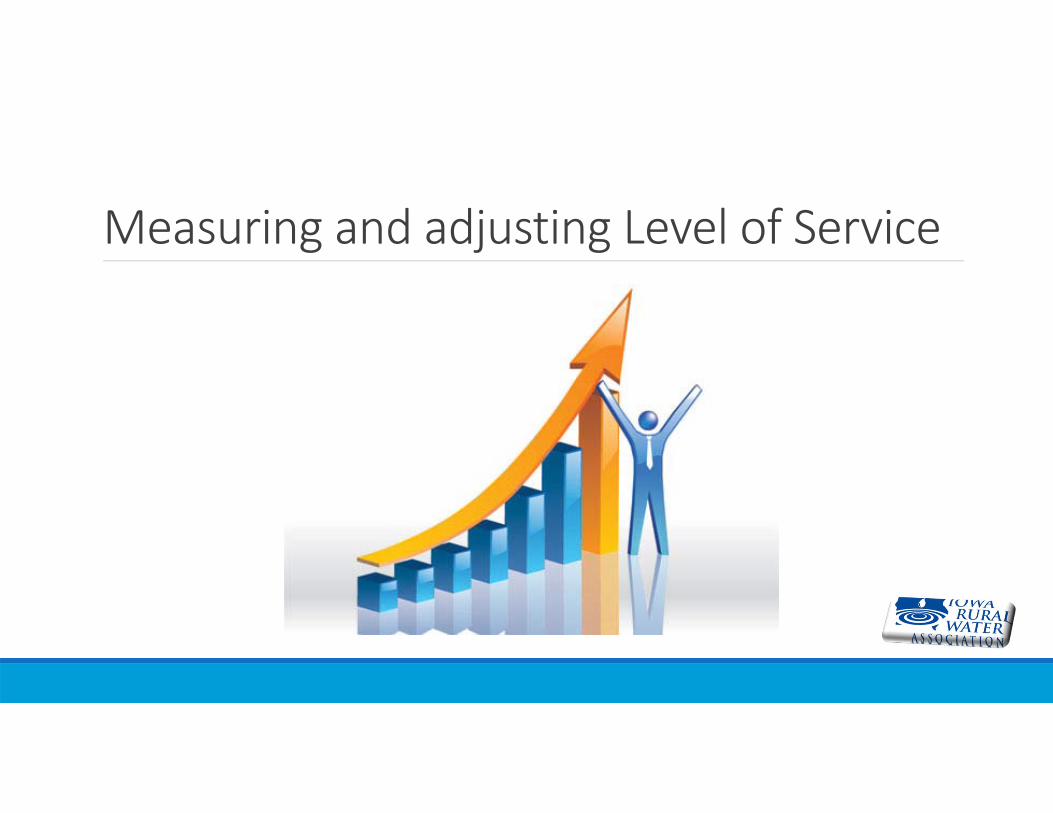
Measuring and adjusting Level of Service
Reviewing GoalsWas the goal met?Were the cost of meeting the goal within normal operation?Were the customers satisfied with the results?Was staff satisfied with the result (including time taken to determine result)?Were decision makers satisfied?
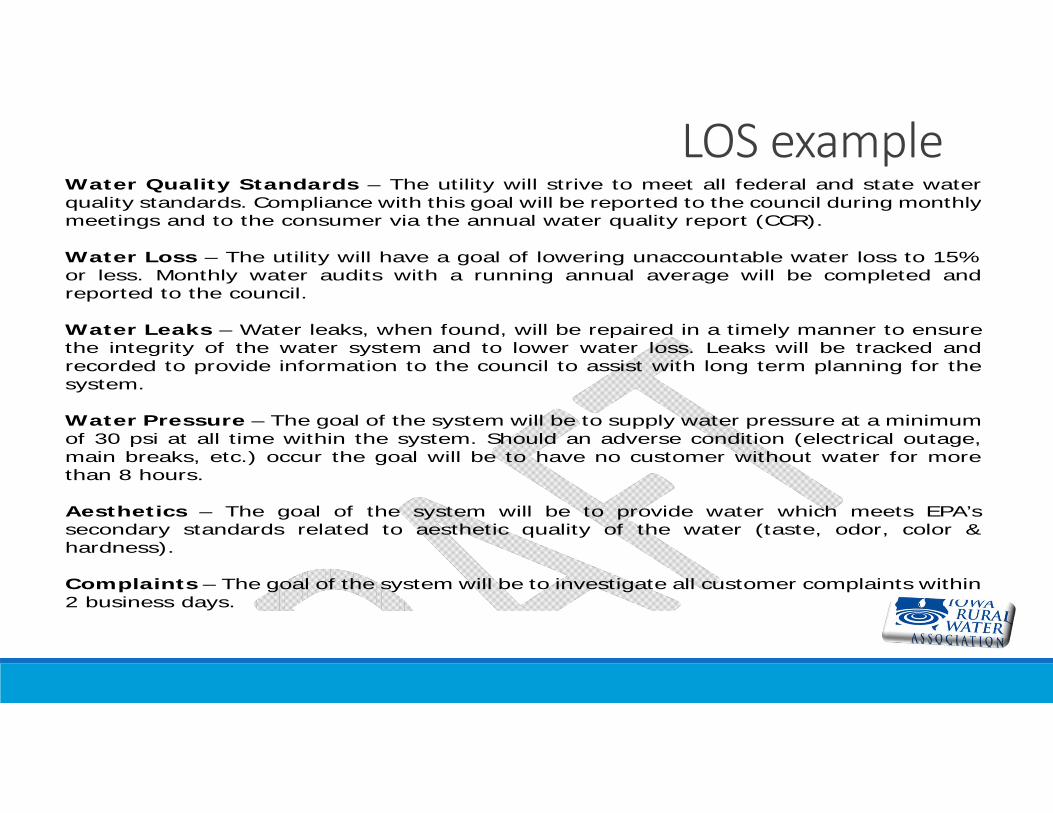
LOS exampleWater Quality Standards – The utility will strive to meet all federal and state waterquality standards. Compliance with this goal will be reported to the council during monthlymeetings and to the consumer via the annual water quality report (CCR). Water Loss – The utility will have a goal of lowering unaccountable water loss to 15% or less. Monthly water audits with a running annual average will be completed andreported to the council. Water Leaks – Water leaks, when found, will be repaired in a timely manner to ensure the integrity of the water system and to lower water loss. Leaks will be tracked andrecorded to provide information to the council to assist with long term planning for thesystem. Water Pressure – The goal of the system will be to supply water pressure at a minimum of 30 psi at all time within the system. Should an adverse condition (electrical outage,main breaks, etc.) occur the goal will be to have no customer without water for morethan 8 hours. Aesthetics – The goal of the system will be to provide water which meets EPA’ssecondary standards related to aesthetic quality of the water (taste, odor, color & hardness). Complaints – The goal of the system will be to investigate all customer complaints within2 business days.
Table Top ExerciseList of 10 (descriptions and pictures) – pick the 5 assets you wish to include
Develop a rating system & rate your assets
Estimate/determine age
Remaining useful life
Estimated value
Energy user (efficiency)
Spreadsheet Development
CriticalityNot all assets are equally important to a utility’s operation
Same asset not as critical to every utility
You must look at your own assets based on your utility
Two parts to criticality
How likely is the asset to fail?
What is the consequence if it does fail?
Probability (likelihood) of Failure
Four modes by which an asset may fail
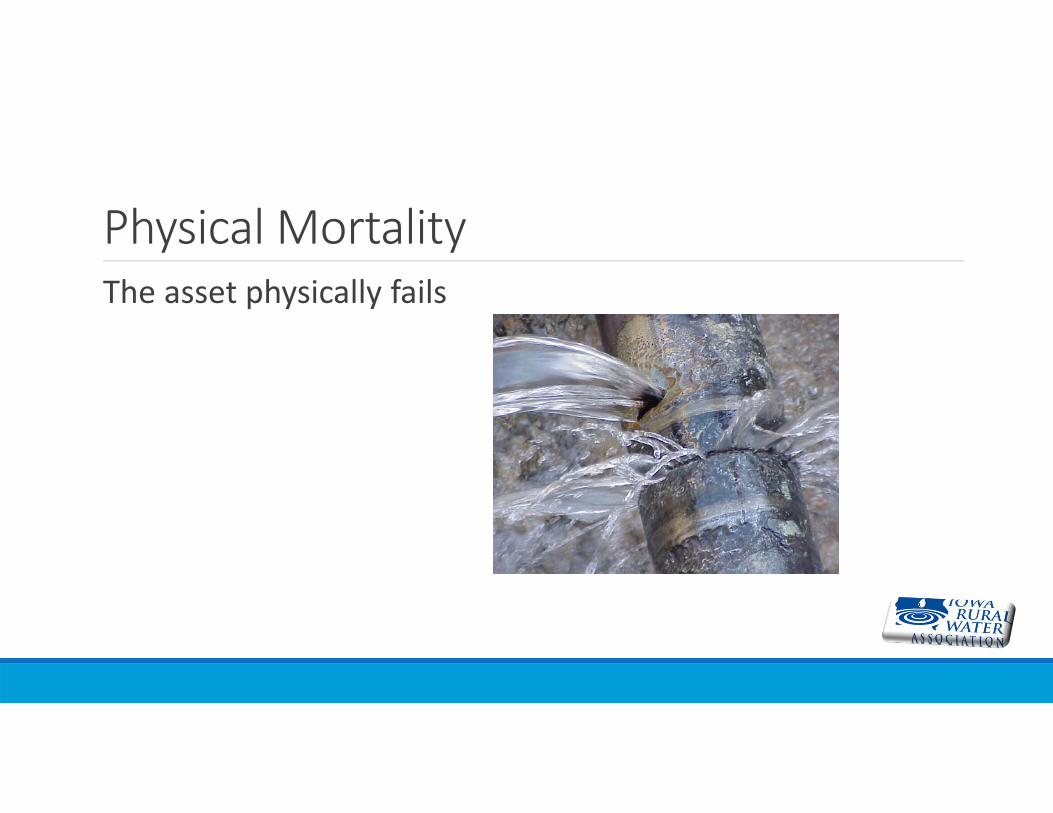
Physical MortalityThe asset physically fails
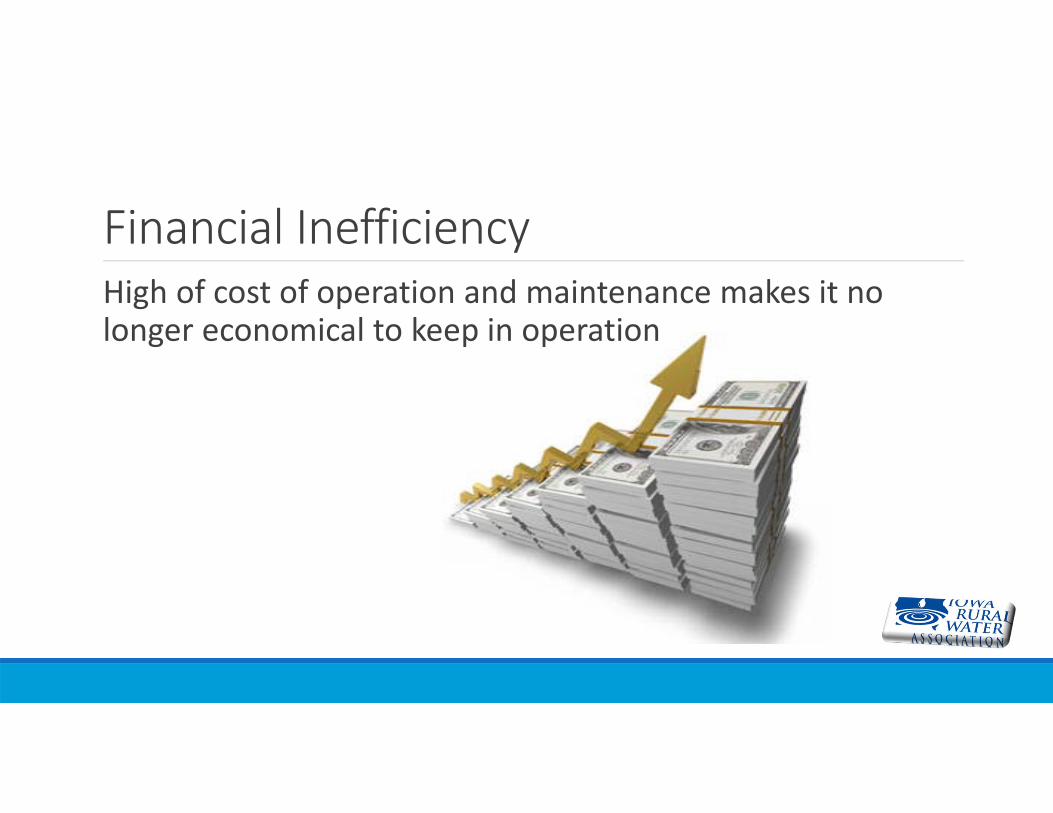
Financial InefficiencyHigh of cost of operation and maintenance makes it no longer economical to keep in operation
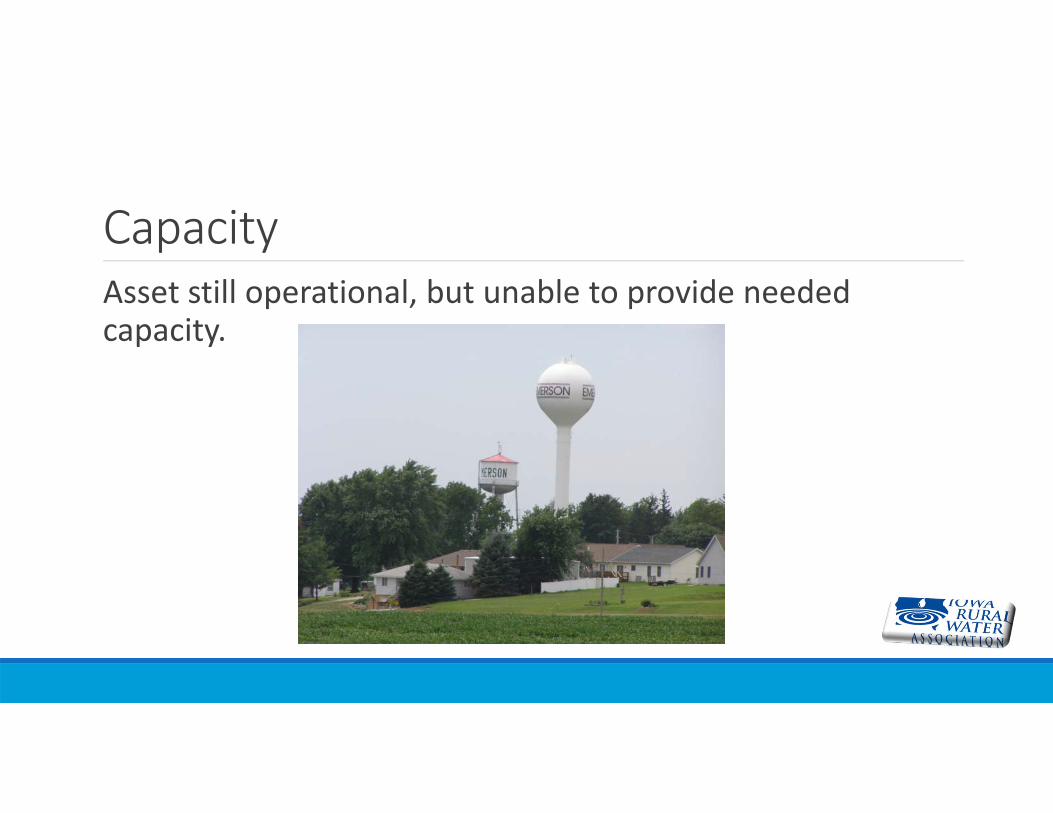
CapacityAsset still operational, but unable to provide needed capacity.
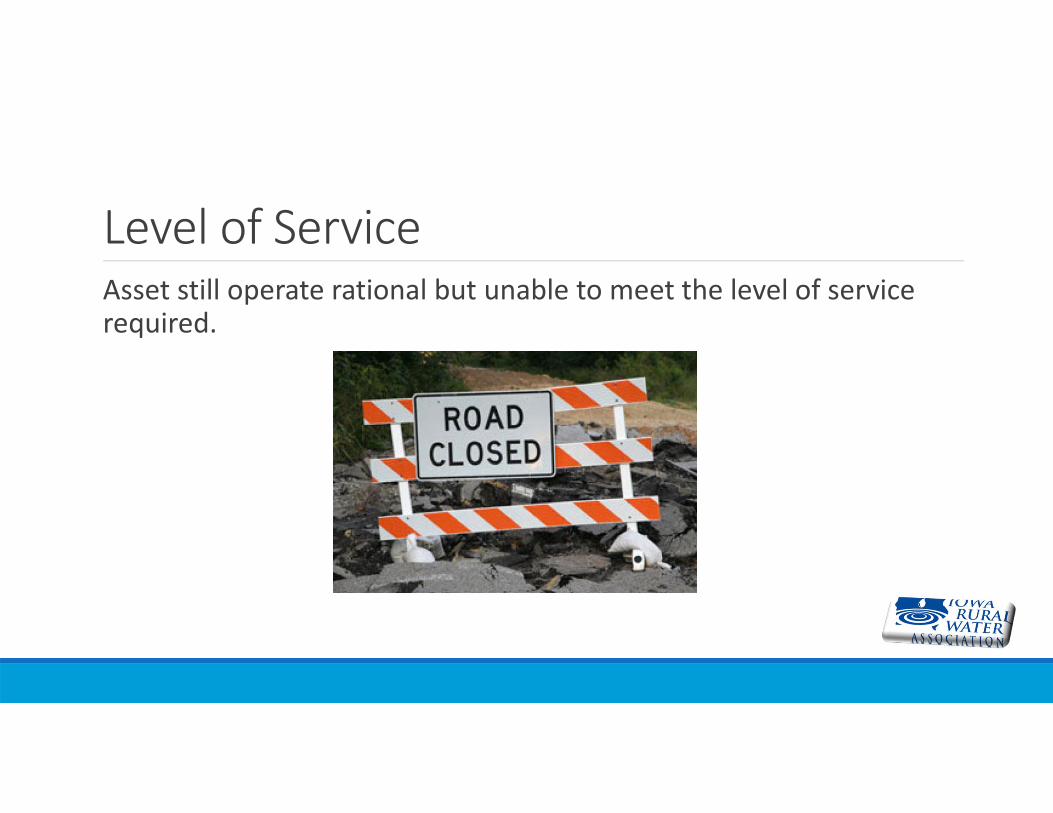
Level of ServiceAsset still operate rational but unable to meet the level of service required.
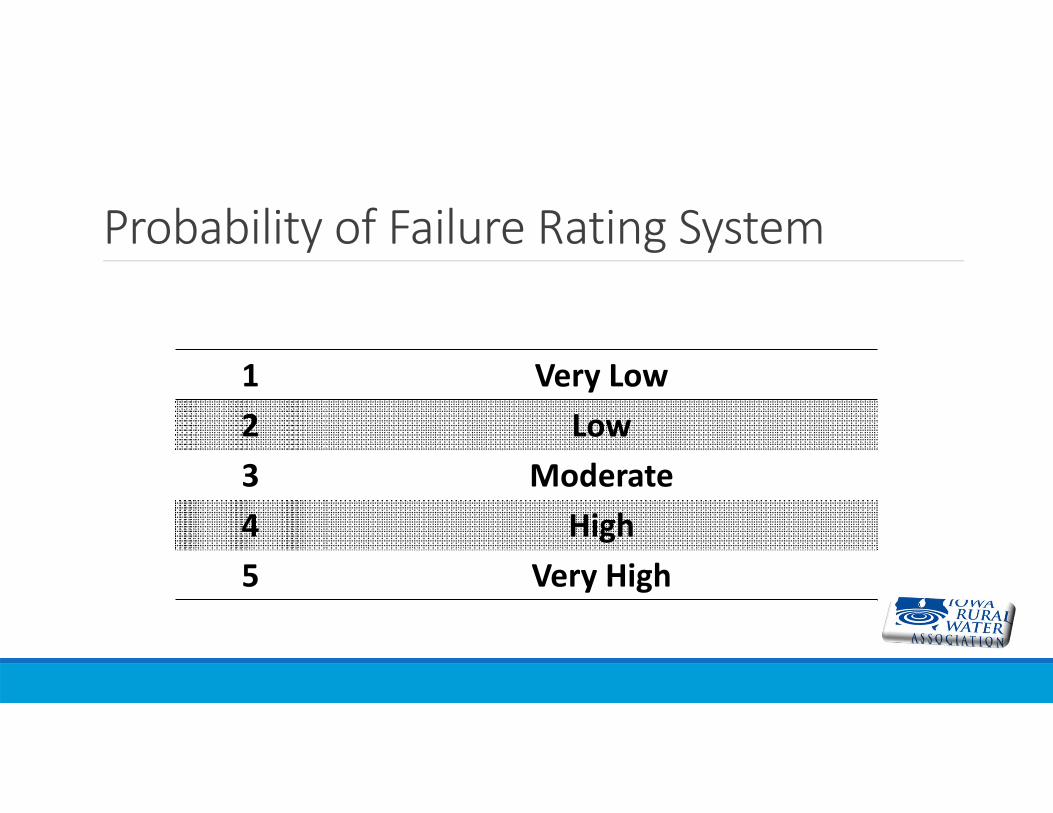
Probability of Failure Rating System
1 Very Low2 Low3 Moderate4 High5 Very High
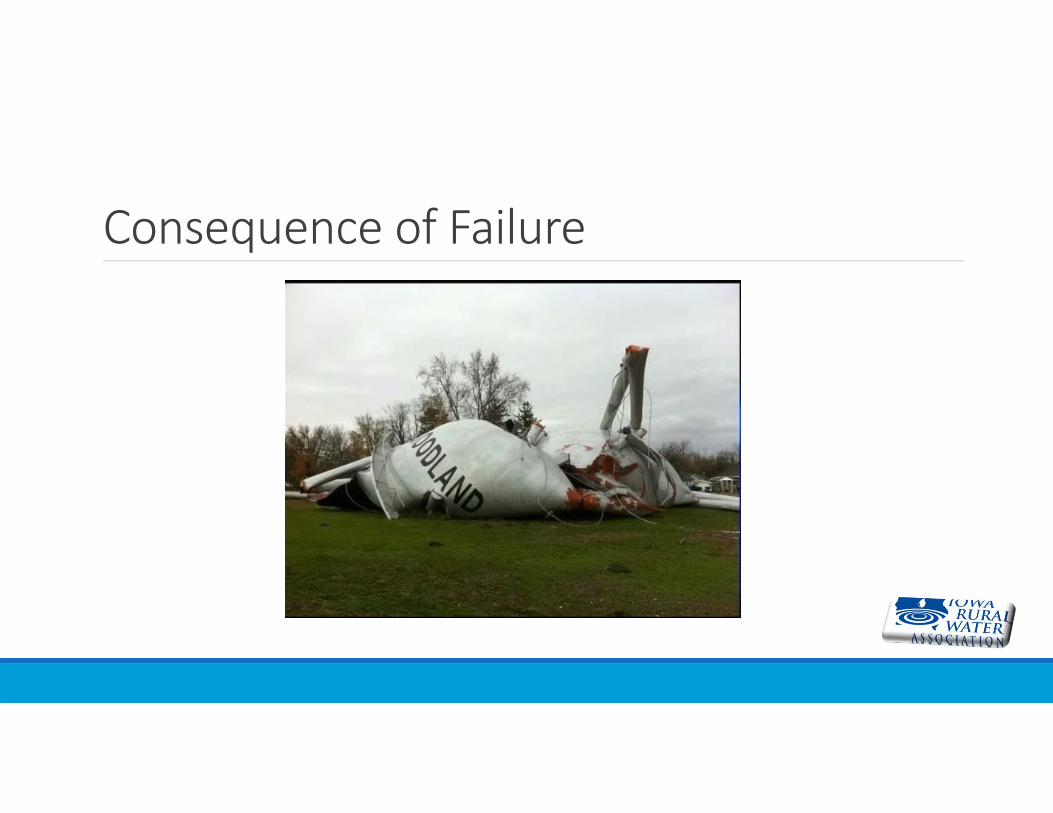
Consequence of Failure
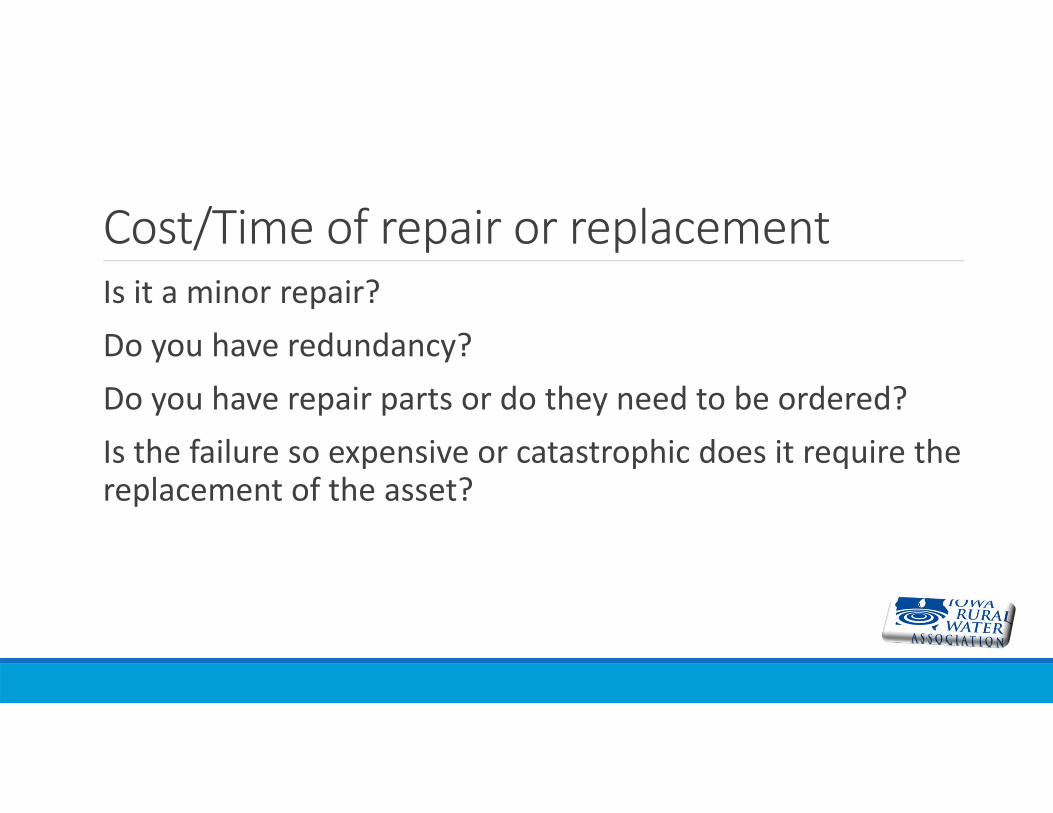
Cost/Time of repair or replacementIs it a minor repair?Do you have redundancy?Do you have repair parts or do they need to be ordered?Is the failure so expensive or catastrophic does it require the replacement of the asset?
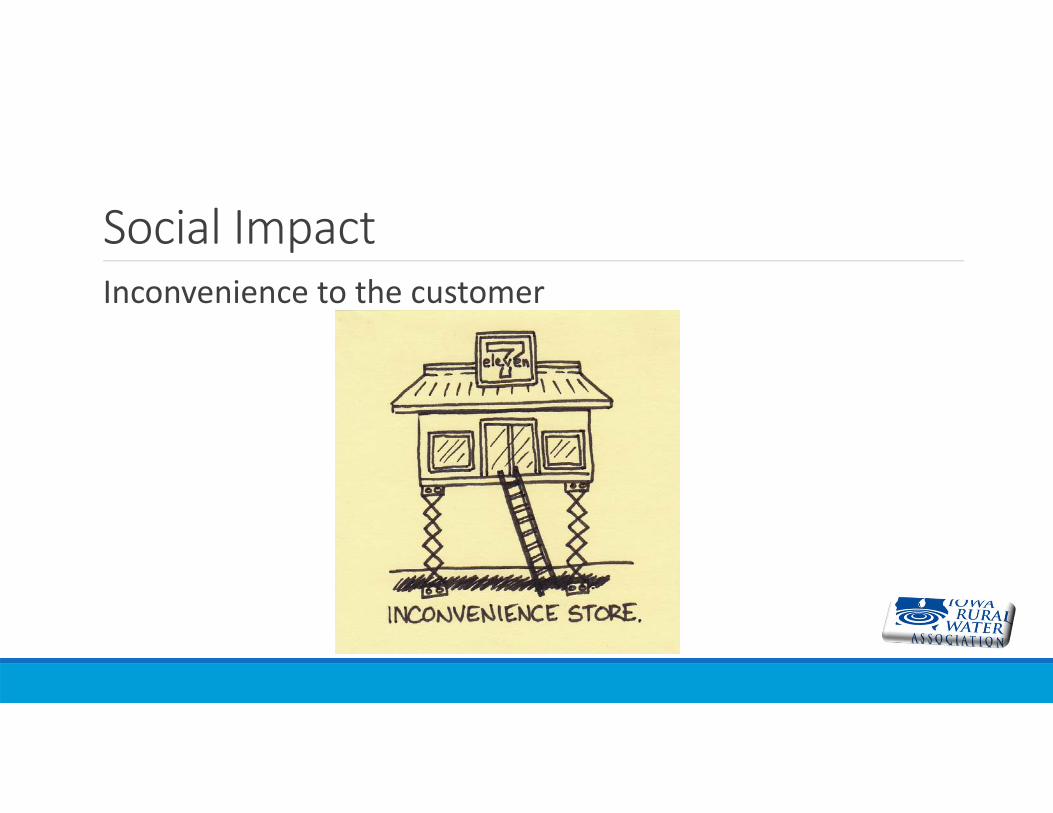
Social ImpactInconvenience to the customer
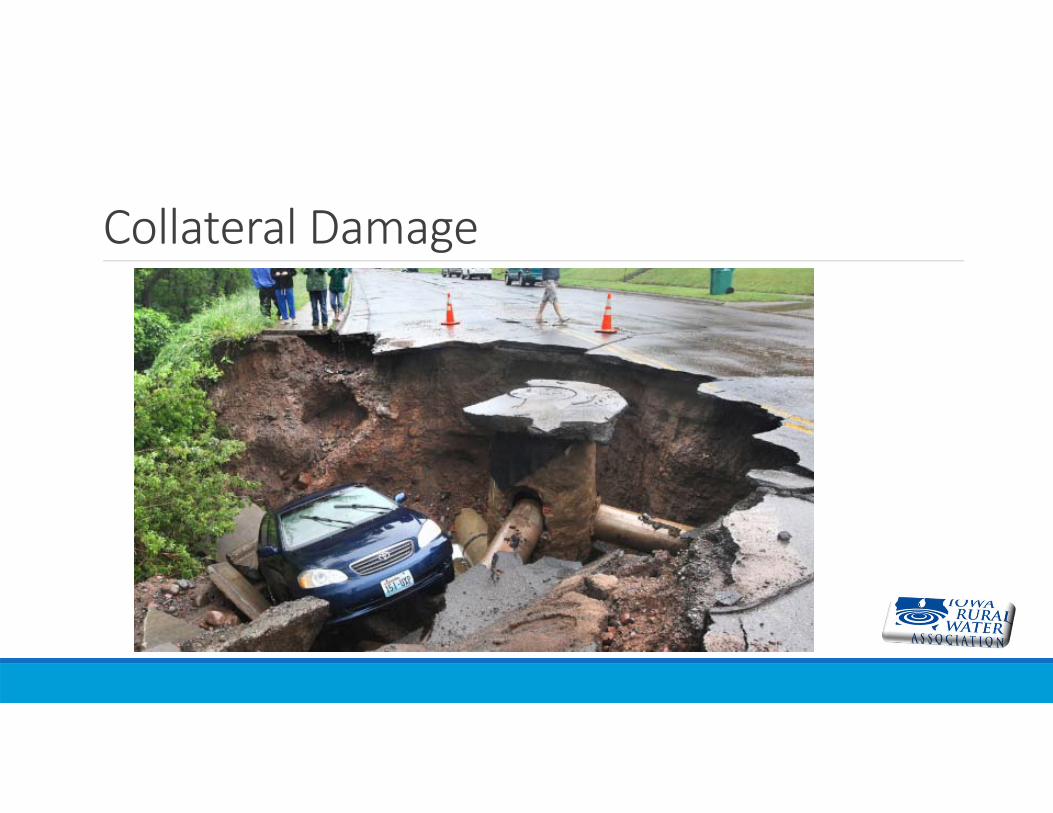
Collateral Damage
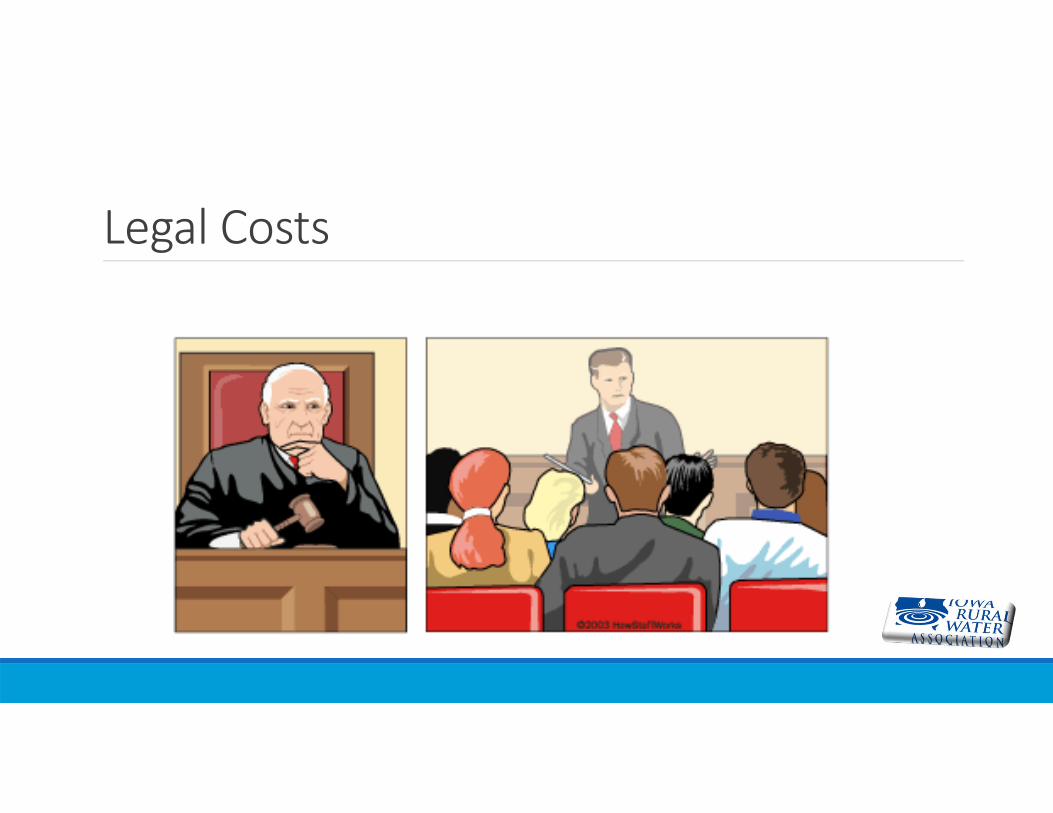
Legal Costs
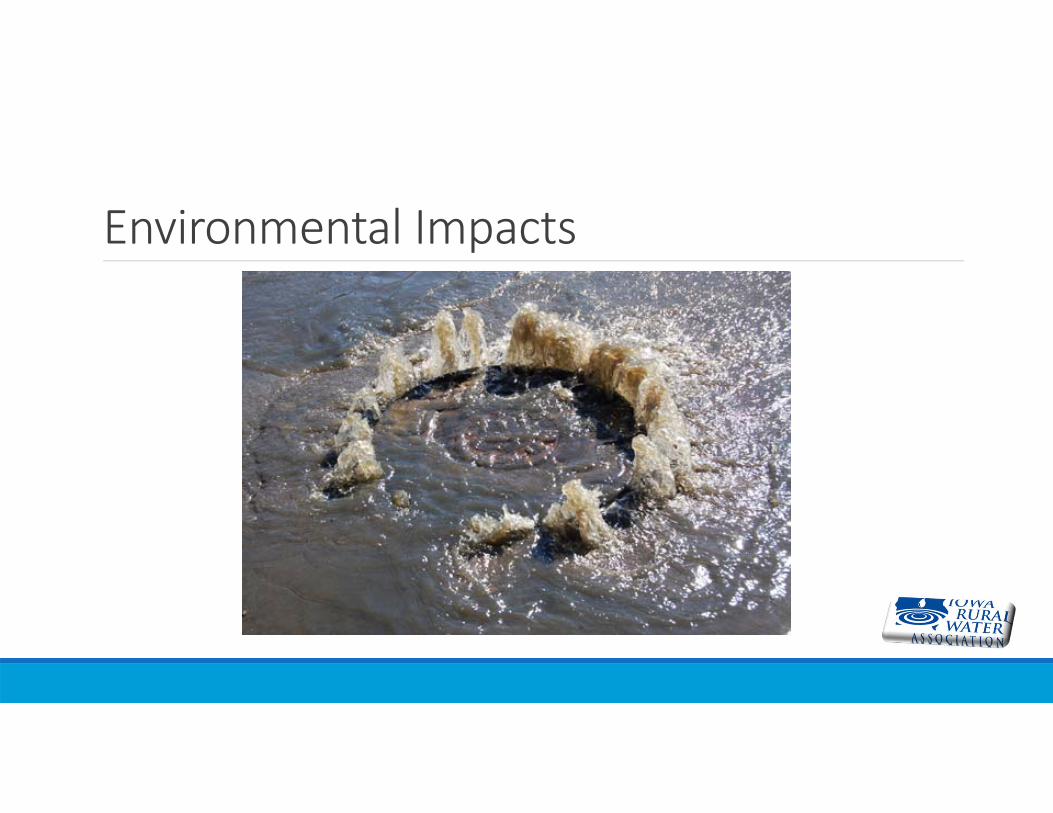
Environmental Impacts

Public Health Impacts
Reduction in Level of ServiceAssets must be in working order to deliver the desired level of service.Consider the level of impact the asset failure has on your level of service desired.
Redundancy
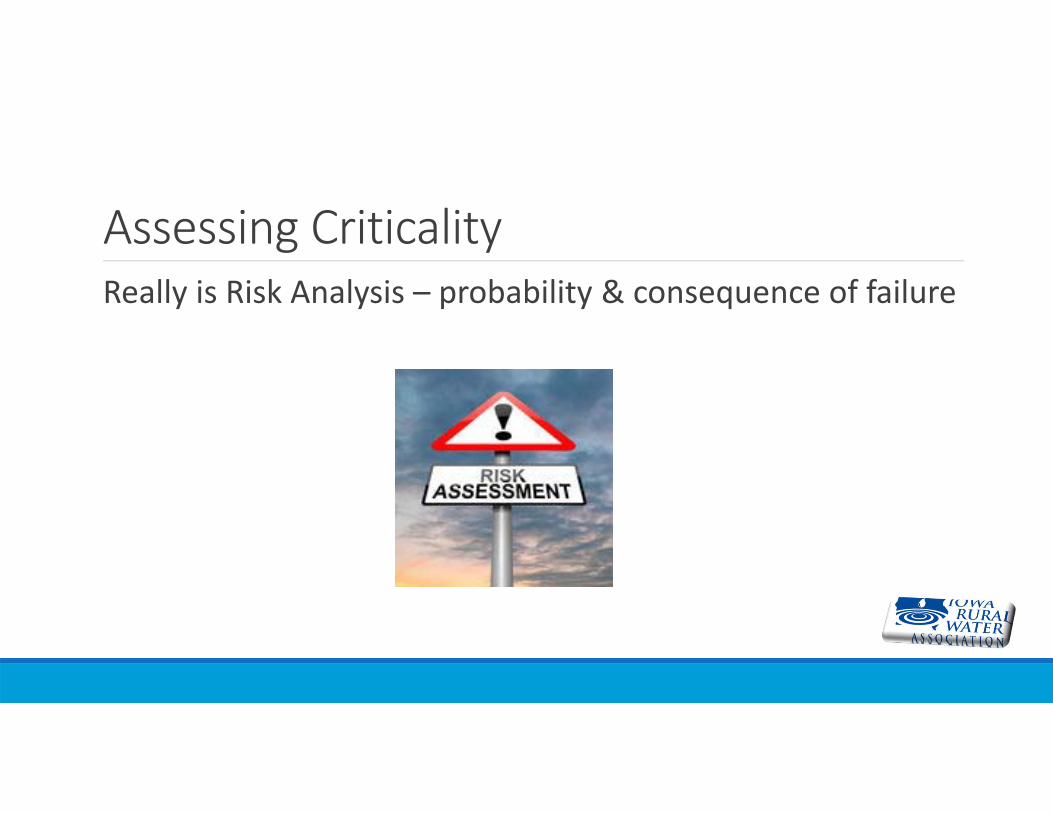
Assessing CriticalityReally is Risk Analysis – probability & consequence of failure
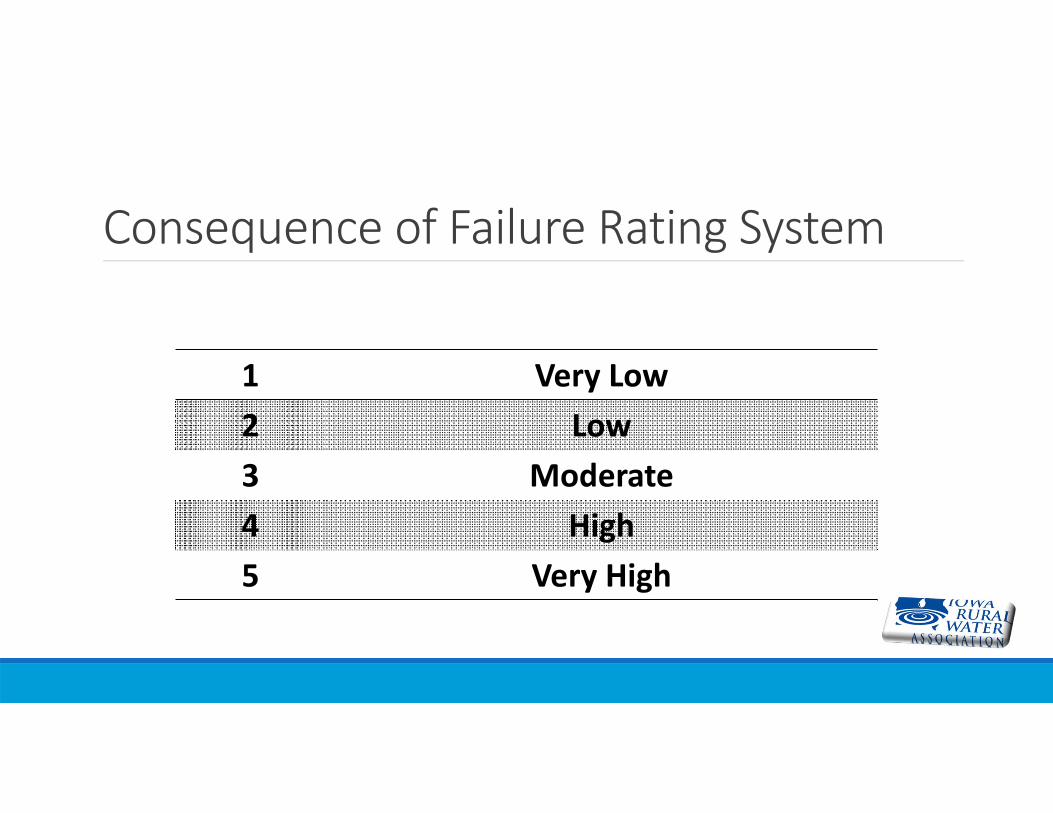
Consequence of Failure Rating System
1 Very Low2 Low3 Moderate4 High5 Very High
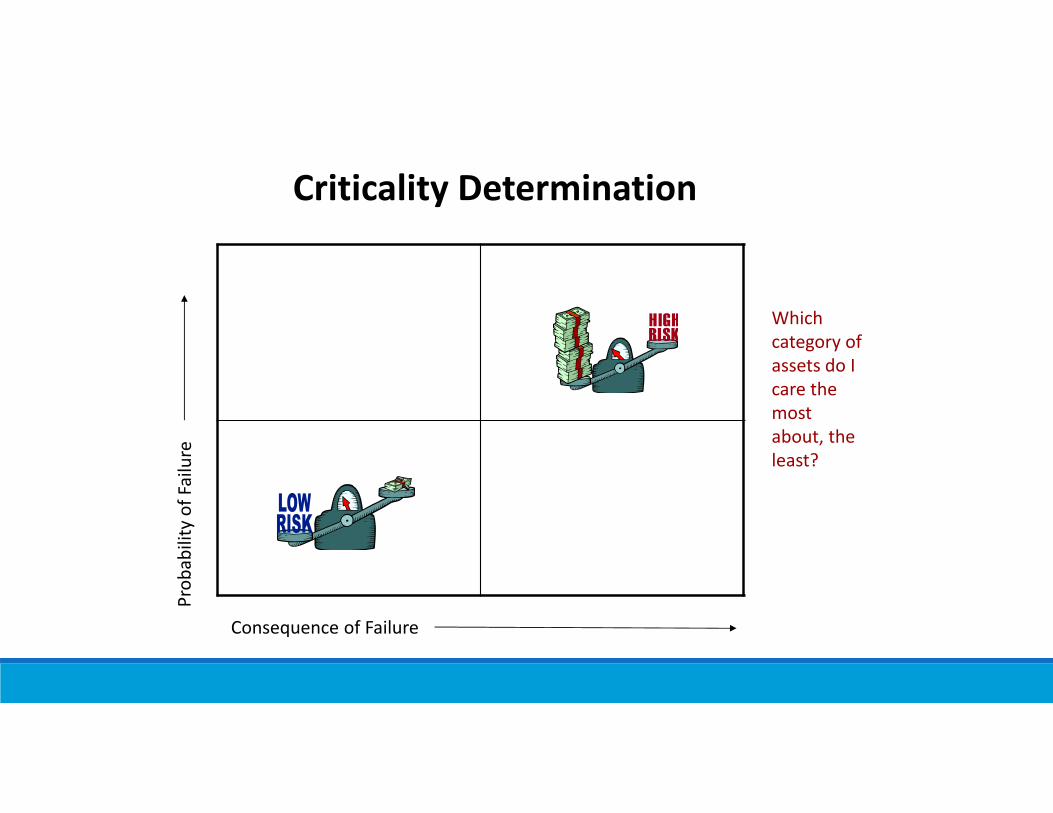
Criticality Determination
Consequence of Failure
Which category of assets do I care the most about, the least?
Criticality Calculations
Life Cycle CostingHeart of asset managementHow much/what type maintenanceWhen to replace
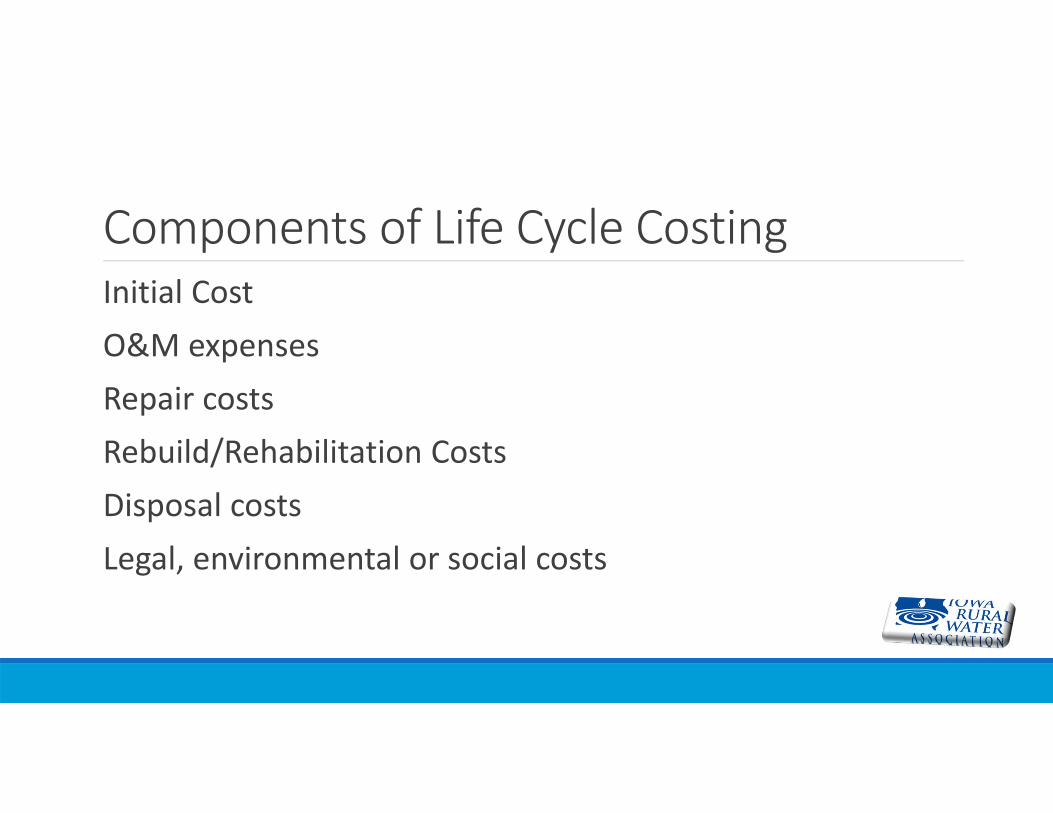
Components of Life Cycle CostingInitial CostO&M expensesRepair costsRebuild/Rehabilitation CostsDisposal costsLegal, environmental or social costs
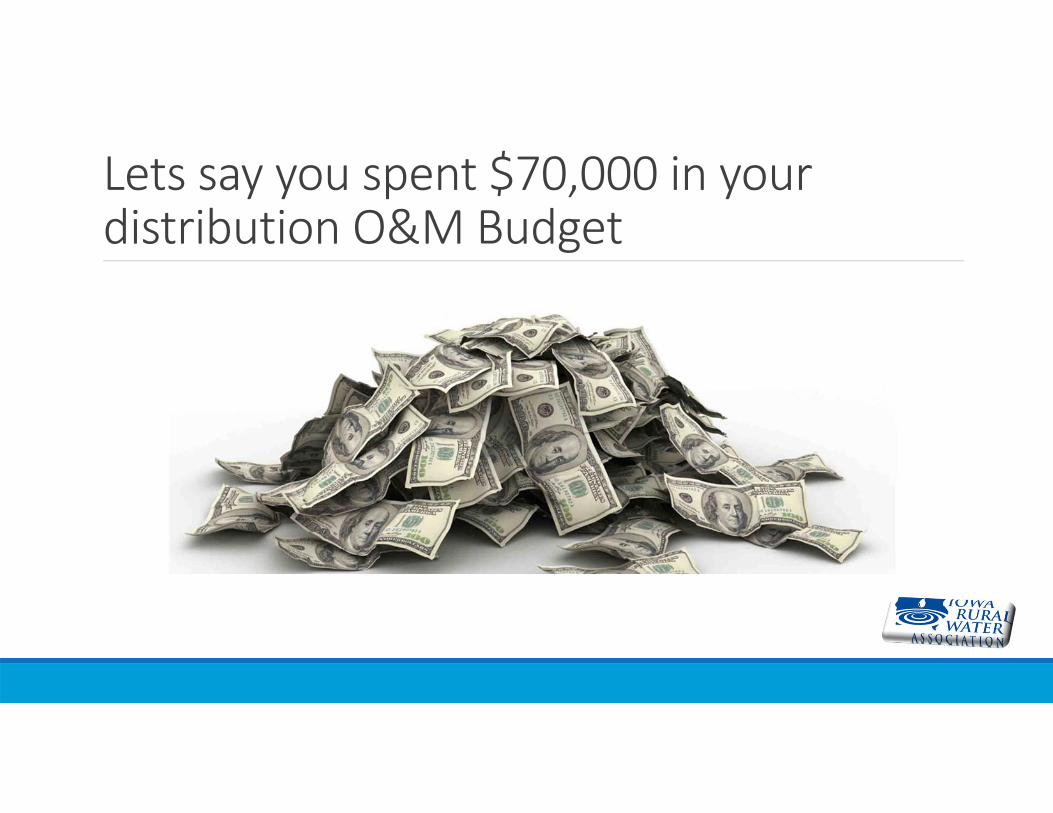
Lets say you spent $70,000 in your distribution O&M Budget
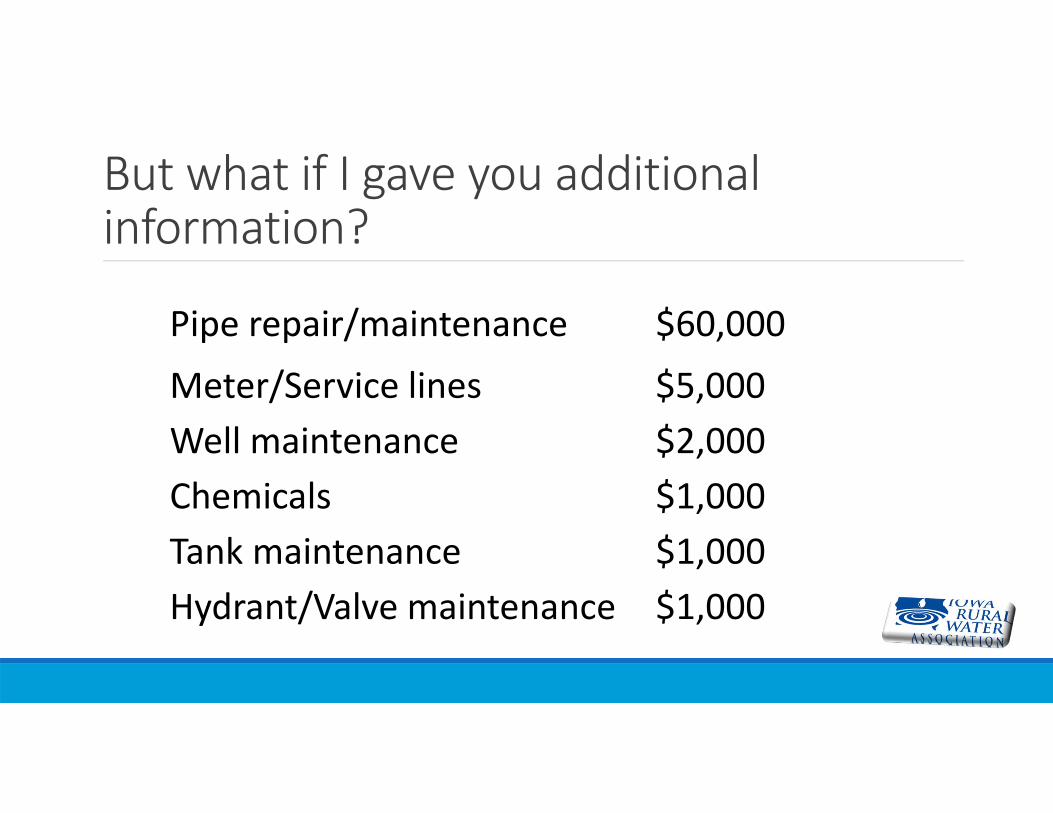
But what if I gave you additional information?
Pipe repair/maintenance $60,000
Meter/Service lines $5,000Well maintenance $2,000Chemicals $1,000Tank maintenance $1,000Hydrant/Valve maintenance $1,000
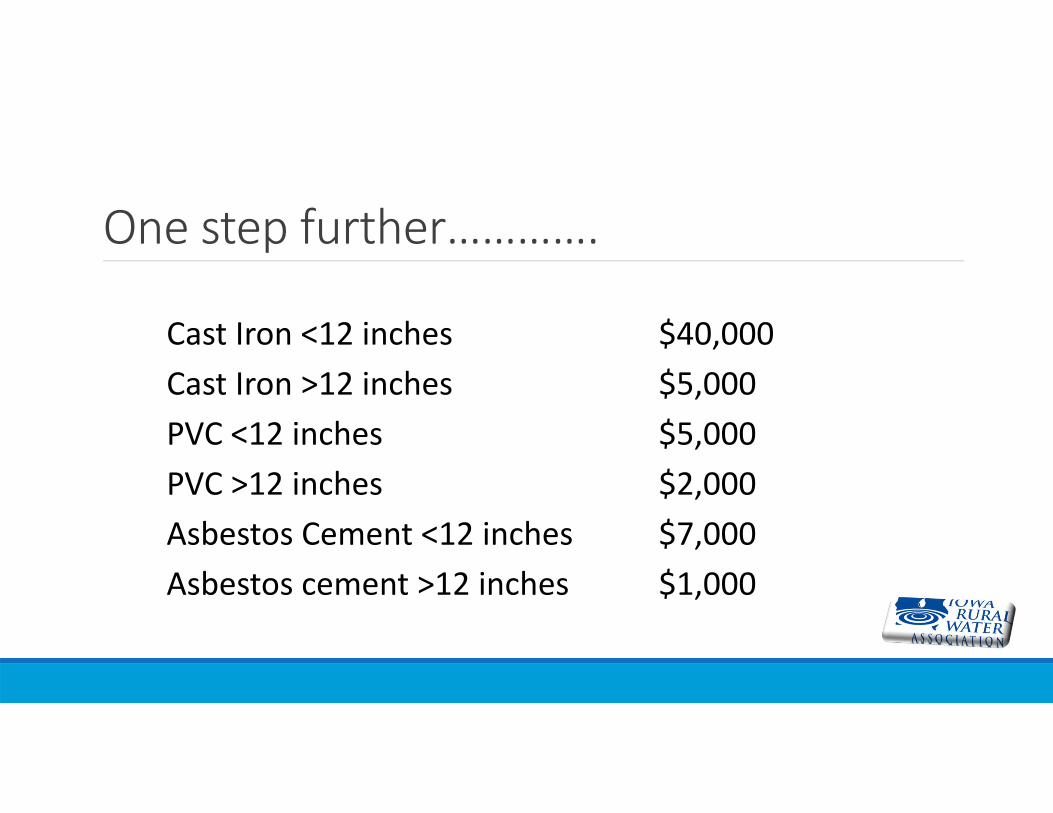
One step further………….
Cast Iron <12 inches $40,000Cast Iron >12 inches $5,000PVC <12 inches $5,000PVC >12 inches $2,000Asbestos Cement <12 inches $7,000Asbestos cement >12 inches $1,000
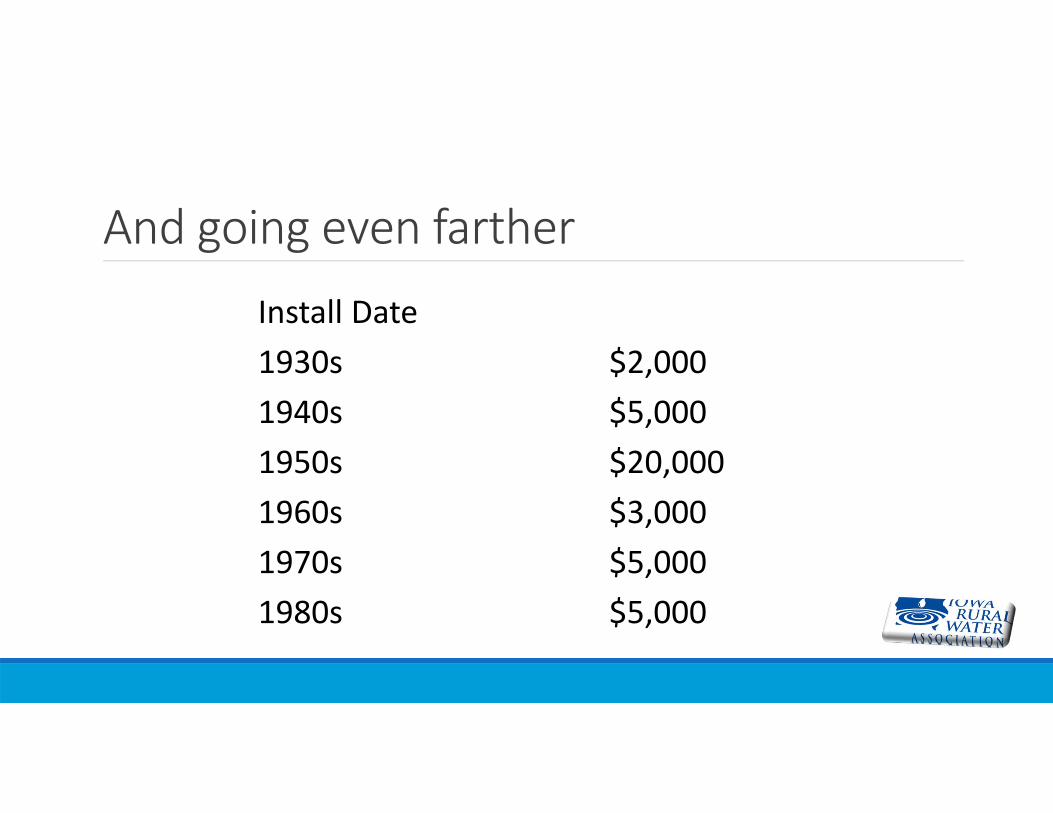
And going even fartherInstall Date1930s $2,0001940s $5,0001950s $20,0001960s $3,0001970s $5,0001980s $5,000
Operation and Maintenance costsRoutine MaintenancePlanned MaintenancePreventative MaintenanceCorrective Maintenance
Questions to askIs there maintenance I am doing that I should continue?Is there maintenance I am doing that I should discontinue?Is there maintenance I am not doing that I need to start?Is there maintenance I am not doing that should stay that way?
Run to FailureLow risk assetsLow costMay be most economical optionFull life span
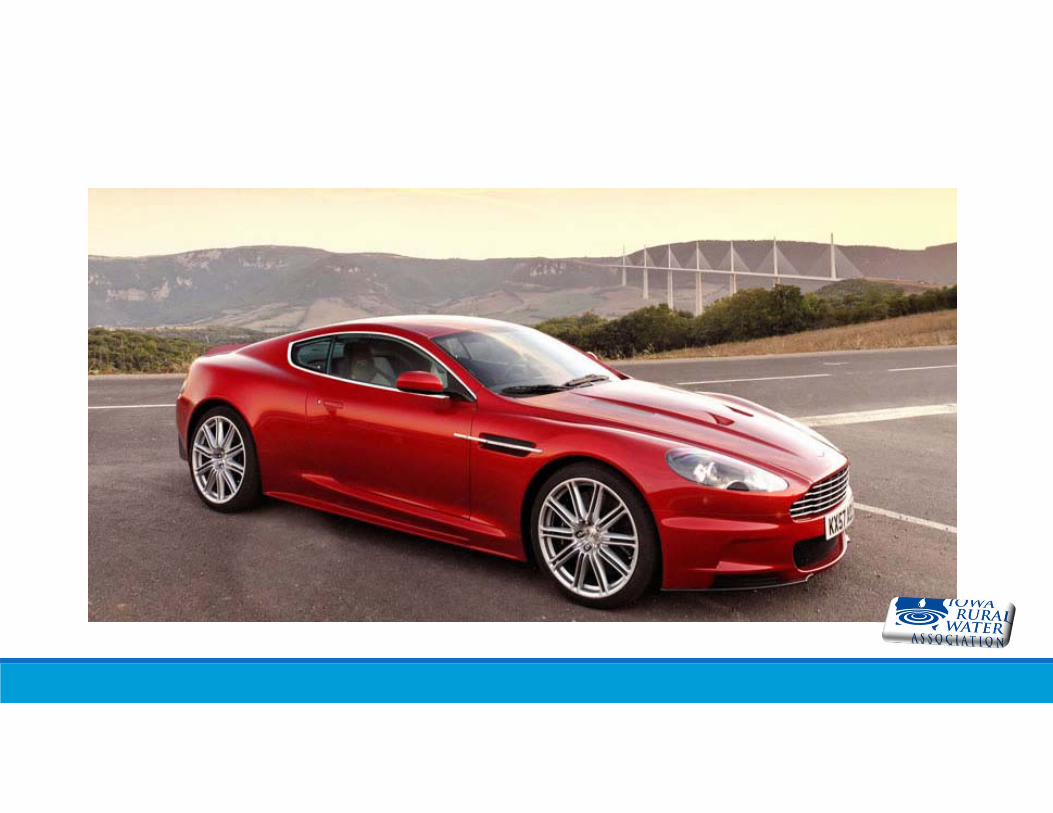
Repair – Rehabilitate ‐ ReplaceWhen asset fails how do you decide?
RepairWill the repair bring the asset back to near new condition?Will the repair keep the asset operational for an extended period of time?What condition is the asset in?
RehabilitateWill the rehabilitation bring the asset back to original installed condition?Is the rehab costs less than the replacement costs?Is the additional useful life worth the expense?
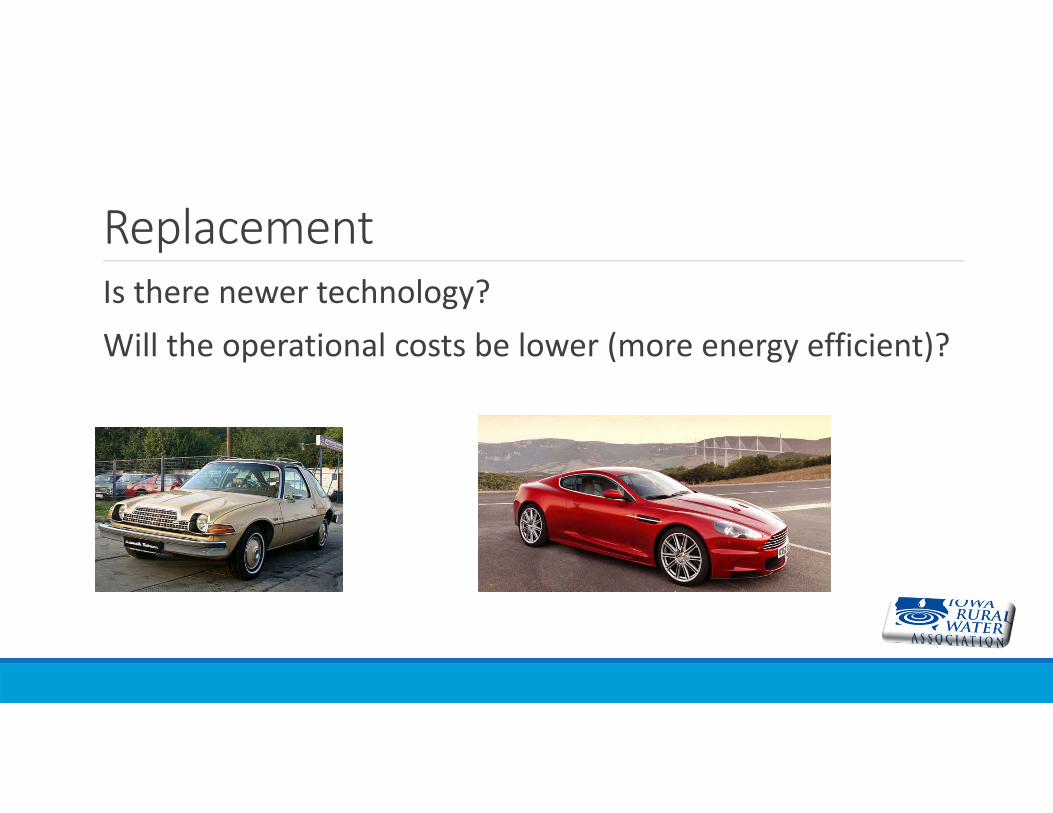
ReplacementIs there newer technology?Will the operational costs be lower (more energy efficient)?
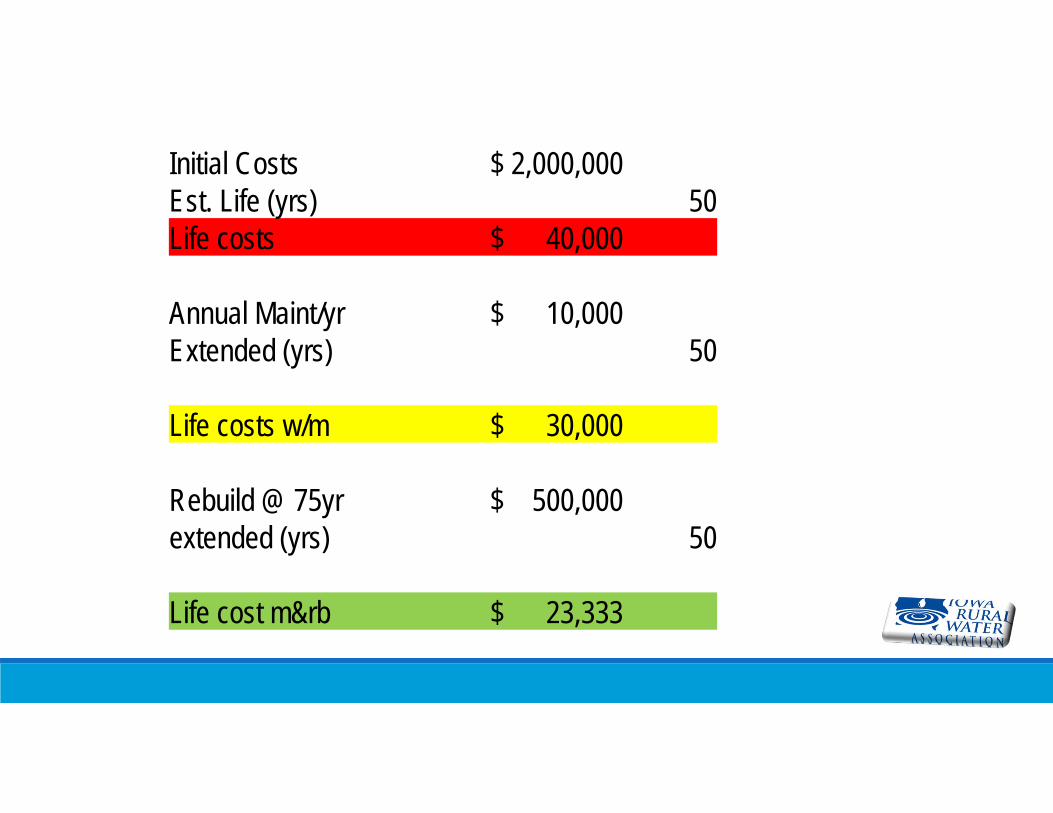
Initial Costs $ 2,000,000 Est. Life (yrs) 50Life costs $ 40,000
Annual Maint/yr $ 10,000 Extended (yrs) 50
Life costs w/m $ 30,000
Rebuild @ 75yr $ 500,000 extended (yrs) 50
Life cost m&rb $ 23,333
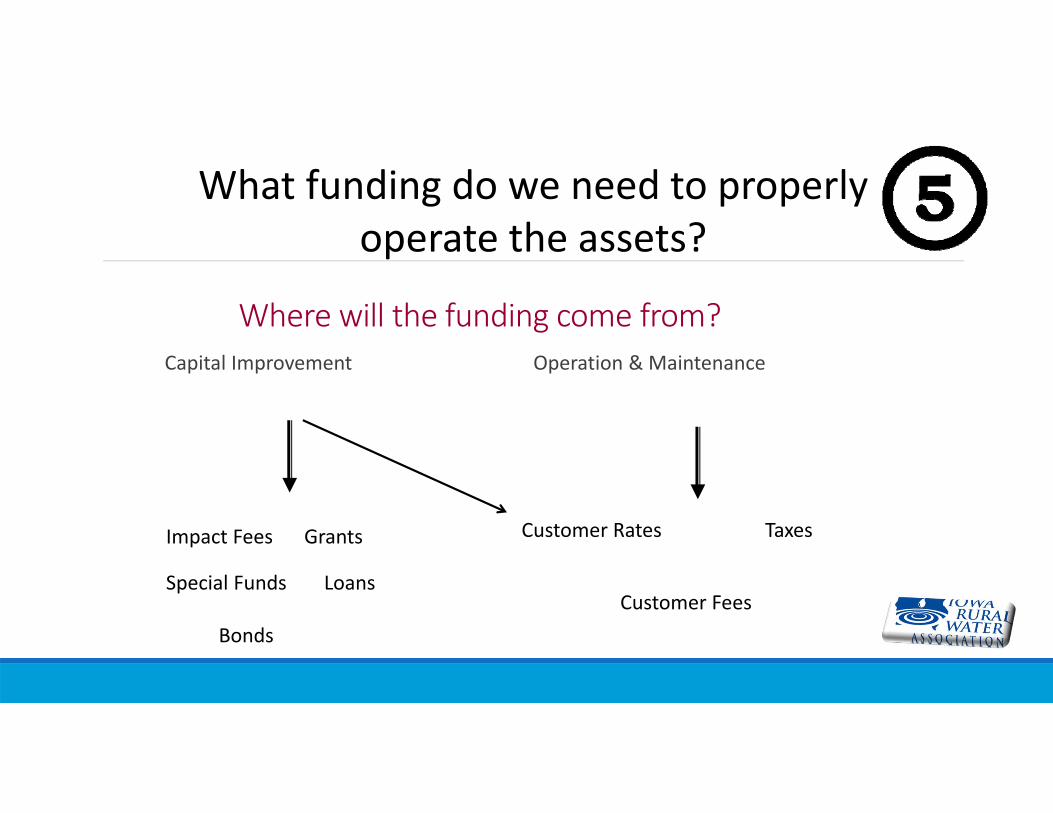
Where will the funding come from?Capital Improvement Operation & Maintenance
What funding do we need to properly operate the assets?
Customer Fees
Customer Rates
Bonds
Loans
Grants
Special Funds
Impact Fees Taxes
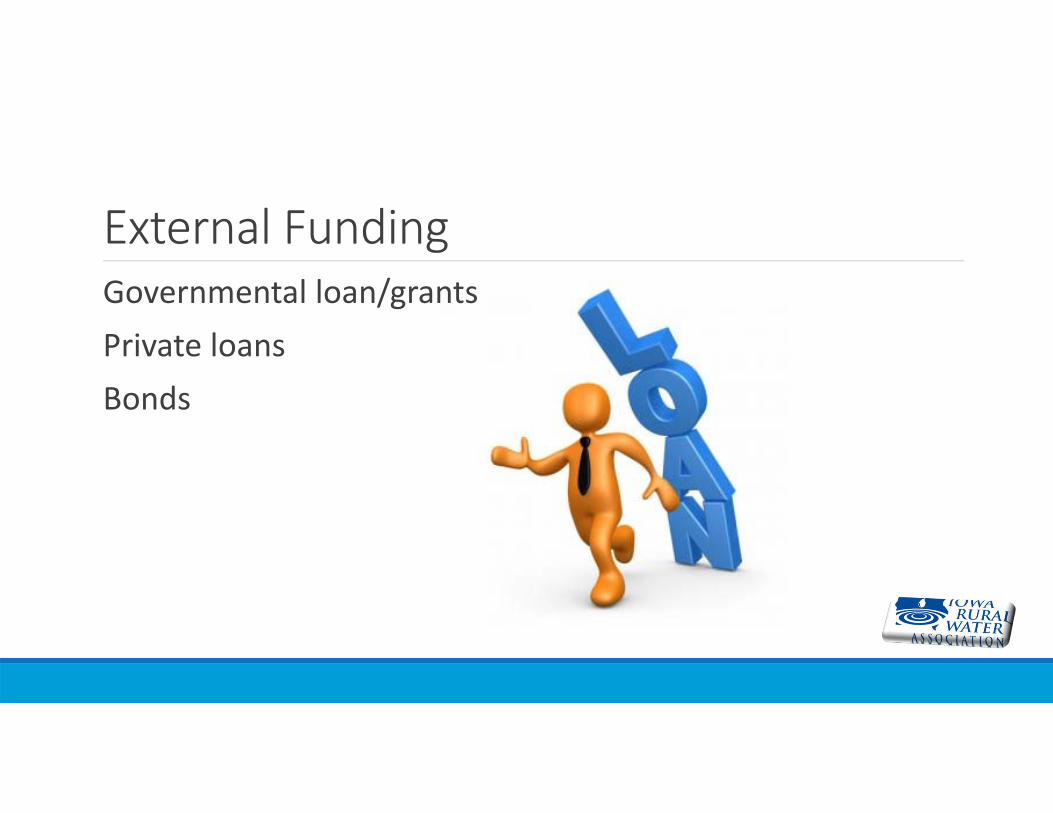
External FundingGovernmental loan/grantsPrivate loansBonds
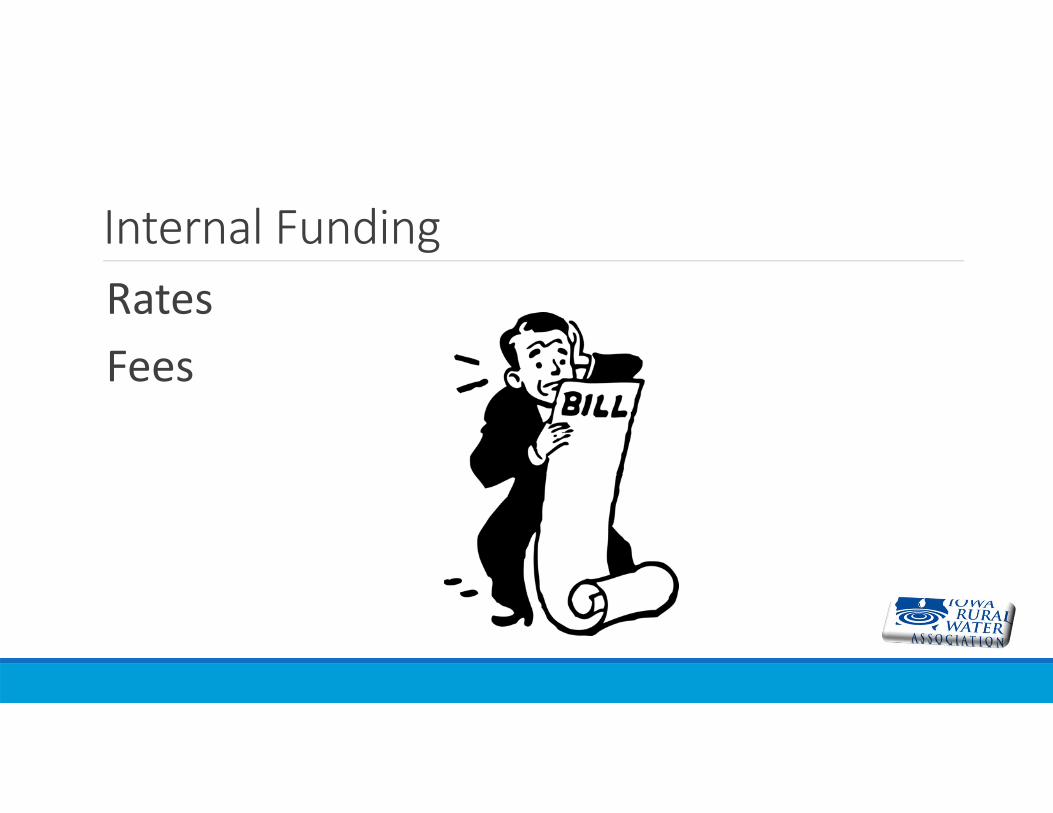
Internal FundingRatesFees
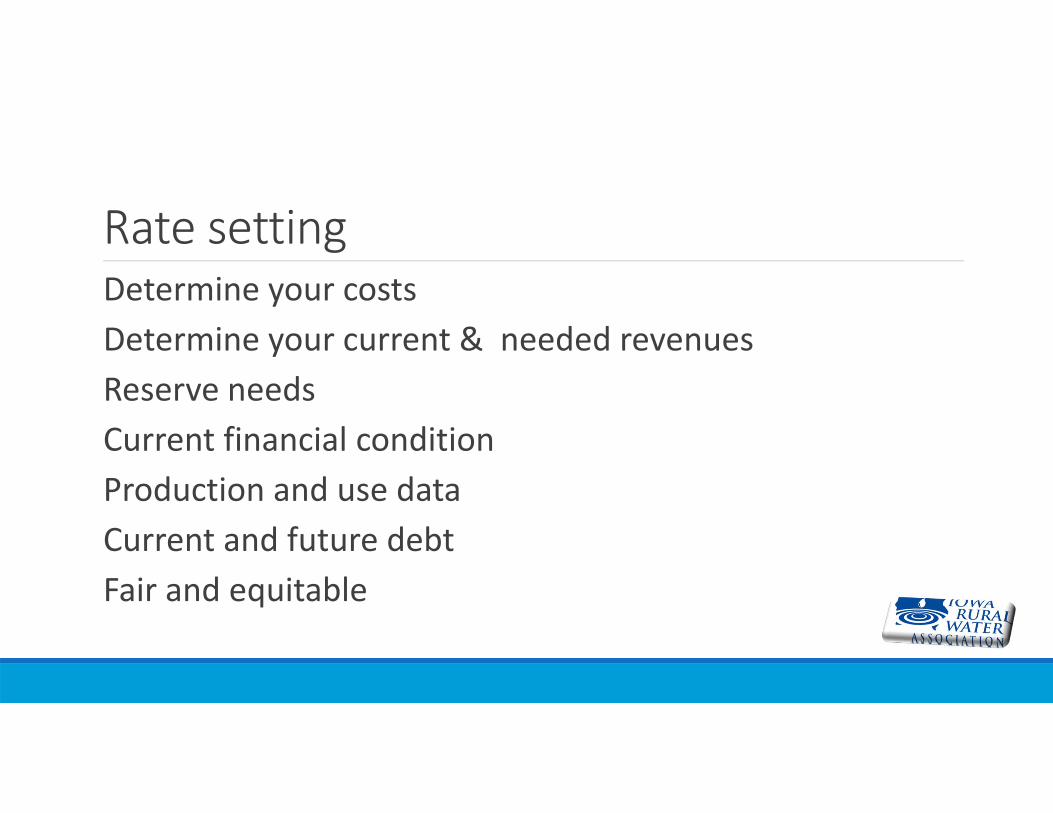
Rate settingDetermine your costsDetermine your current & needed revenuesReserve needsCurrent financial conditionProduction and use dataCurrent and future debtFair and equitable
Utilities need to develop a comprehensive funding strategy in order to remain sustainable into the
future and provide their customers with the level of service desired at the lowest
cost possible (not no cost).
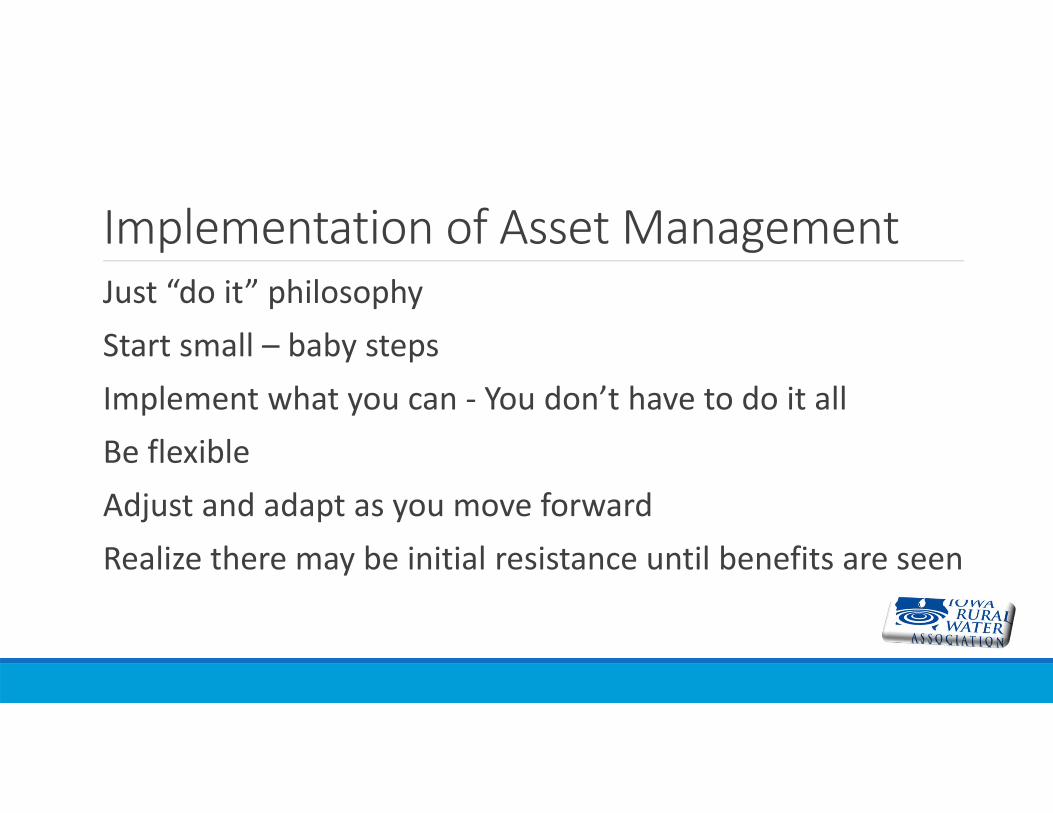
Implementation of Asset ManagementJust “do it” philosophyStart small – baby stepsImplement what you can ‐ You don’t have to do it allBe flexibleAdjust and adapt as you move forwardRealize there may be initial resistance until benefits are seen
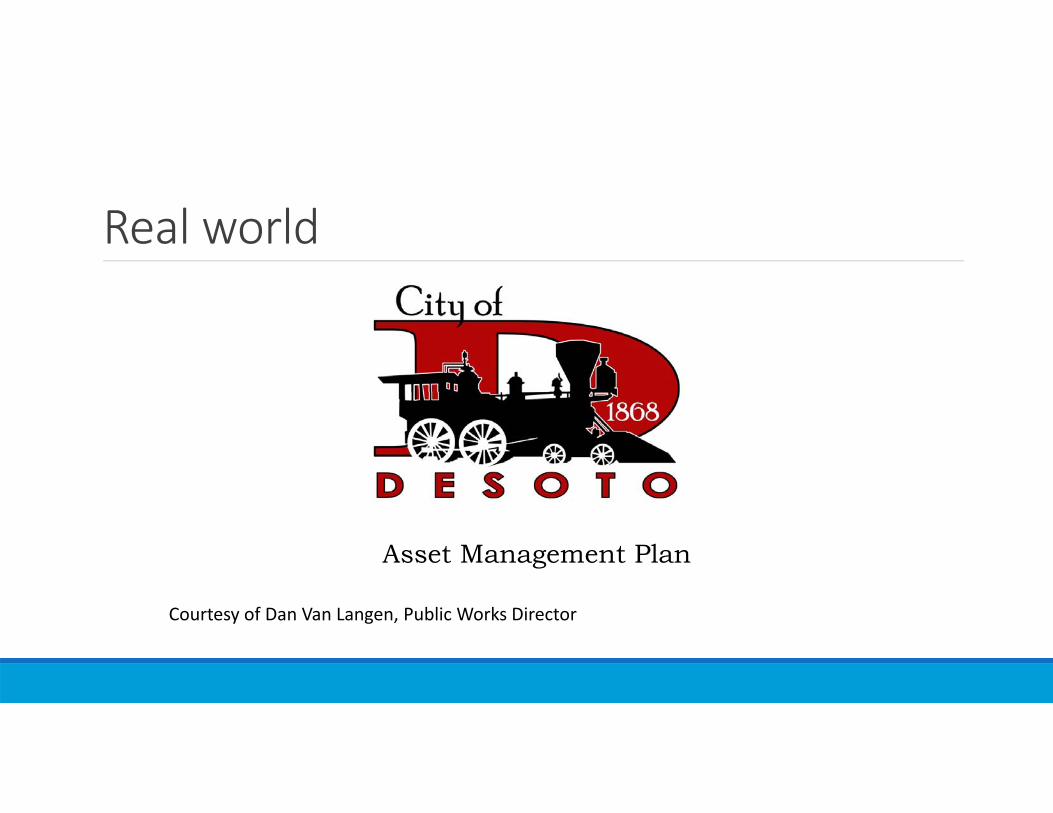
Real world
Asset Management Plan
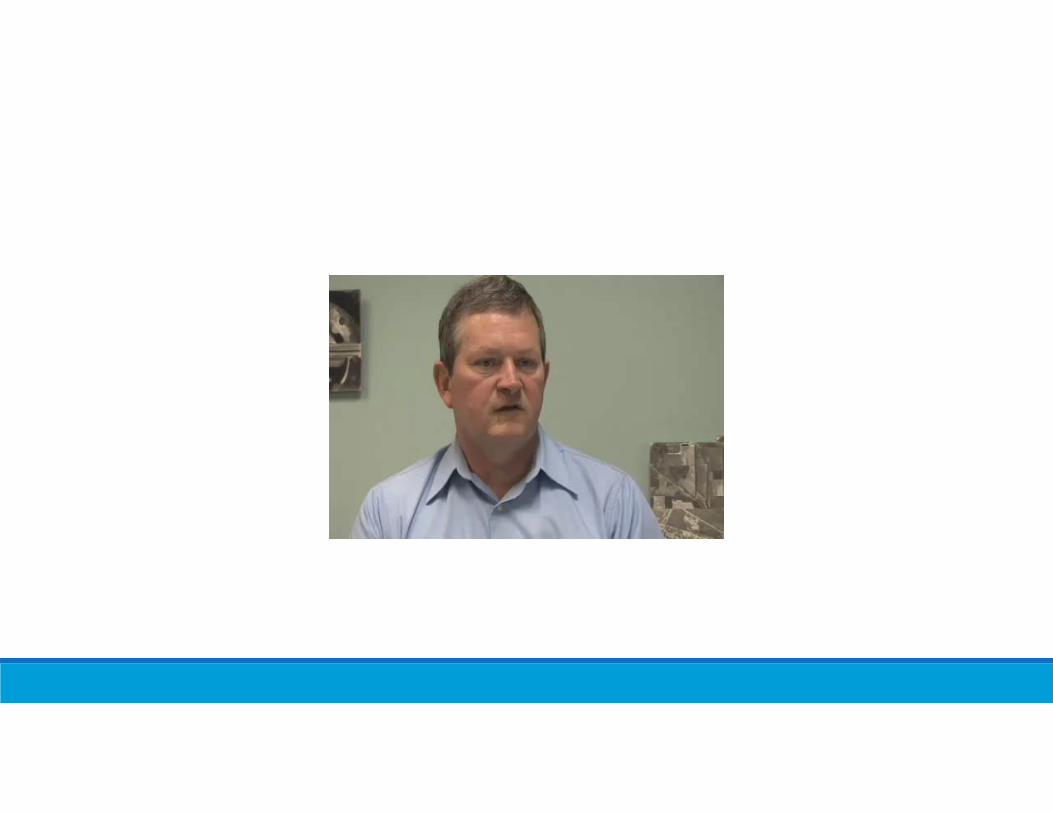
Courtesy of Dan Van Langen, Public Works Director
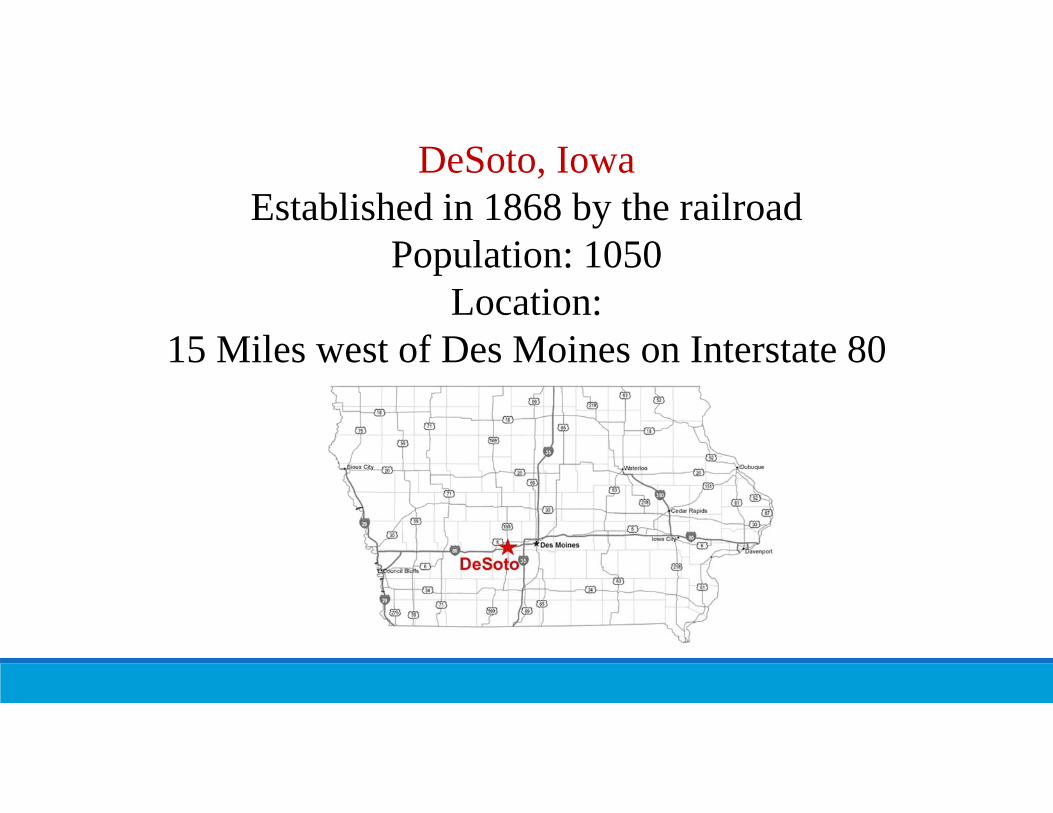
DeSoto, IowaEstablished in 1868 by the railroad
Population: 1050Location:
15 Miles west of Des Moines on Interstate 80
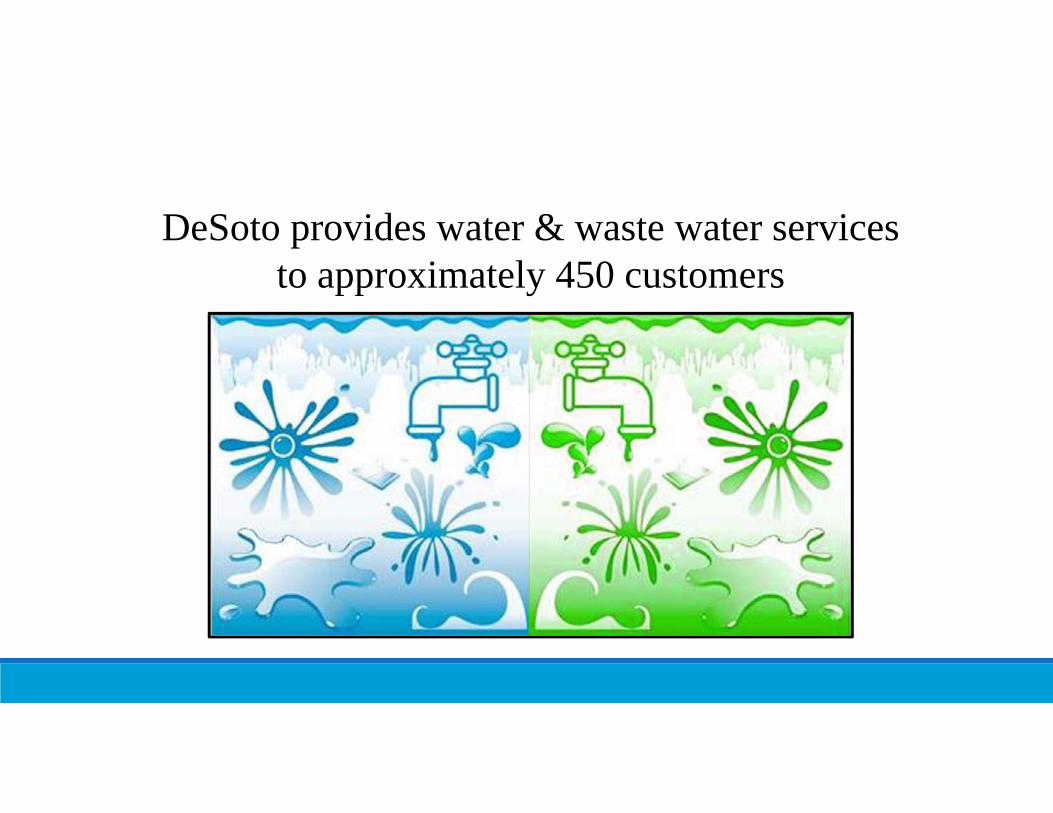
DeSoto provides water & waste water services to approximately 450 customers
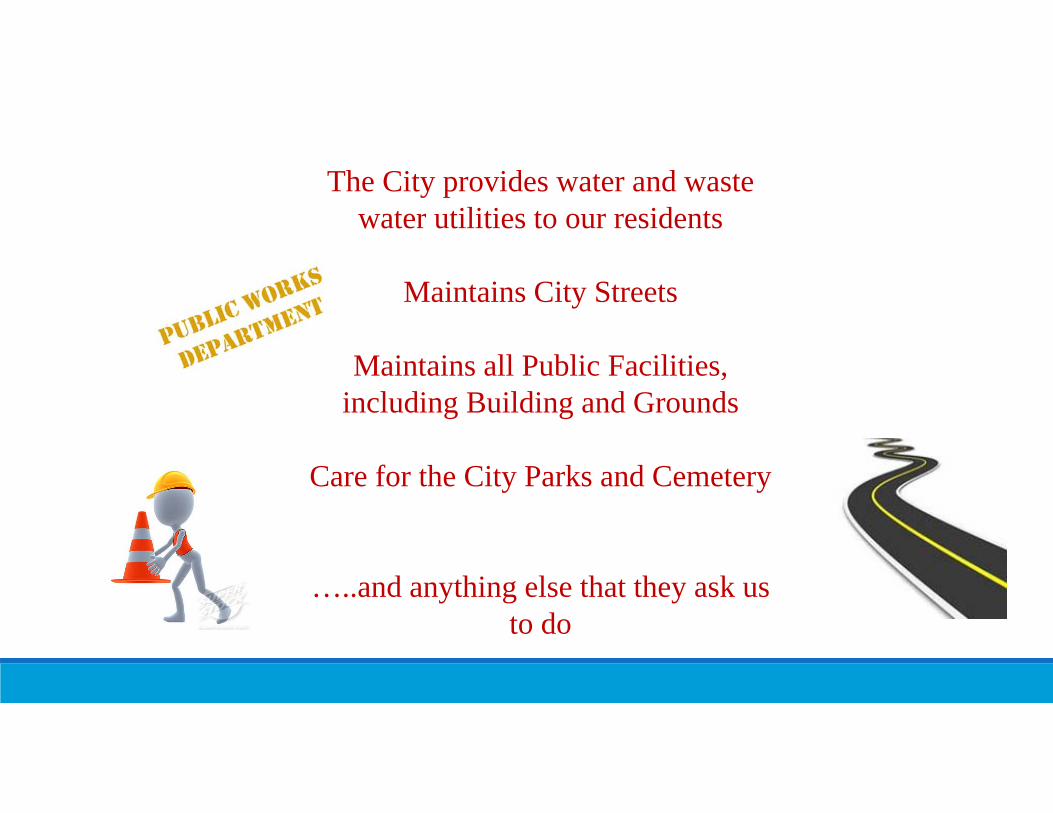
The City provides water and waste water utilities to our residents
Maintains City Streets
Maintains all Public Facilities, including Building and Grounds
Care for the City Parks and Cemetery
…..and anything else that they ask us to do
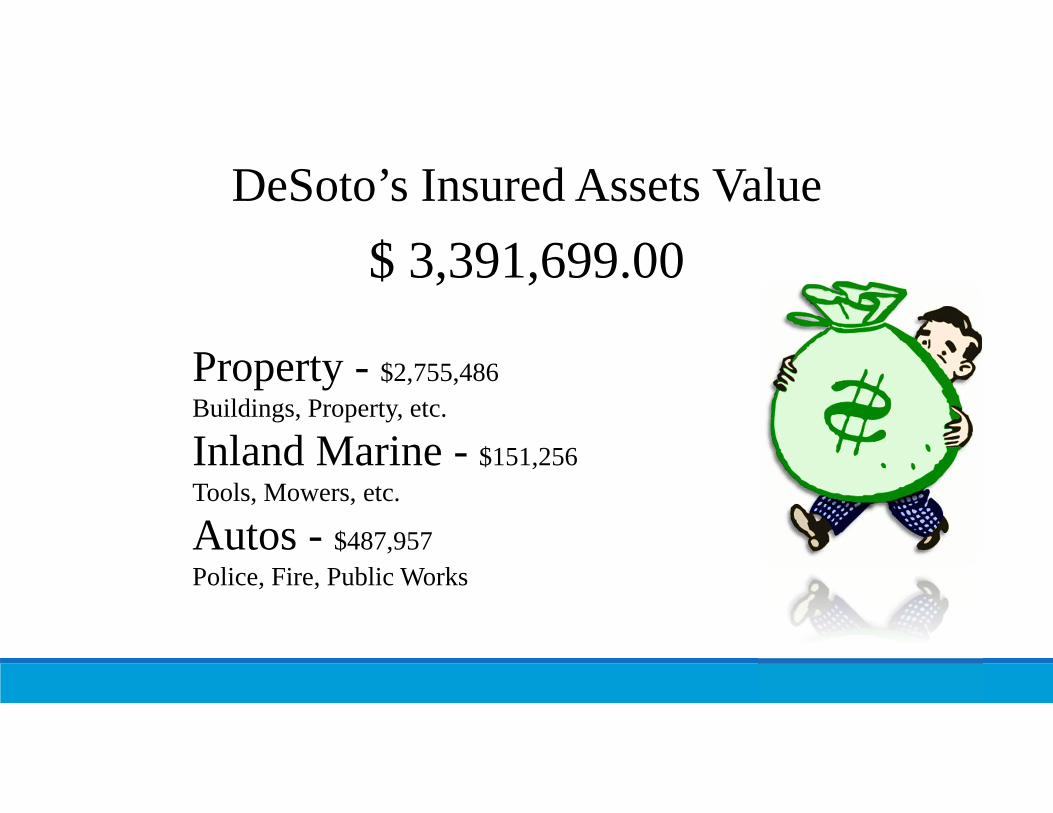
DeSoto’s Insured Assets Value$ 3,391,699.00
Property - $2,755,486 Buildings, Property, etc.
Inland Marine - $151,256Tools, Mowers, etc.
Autos - $487,957Police, Fire, Public Works
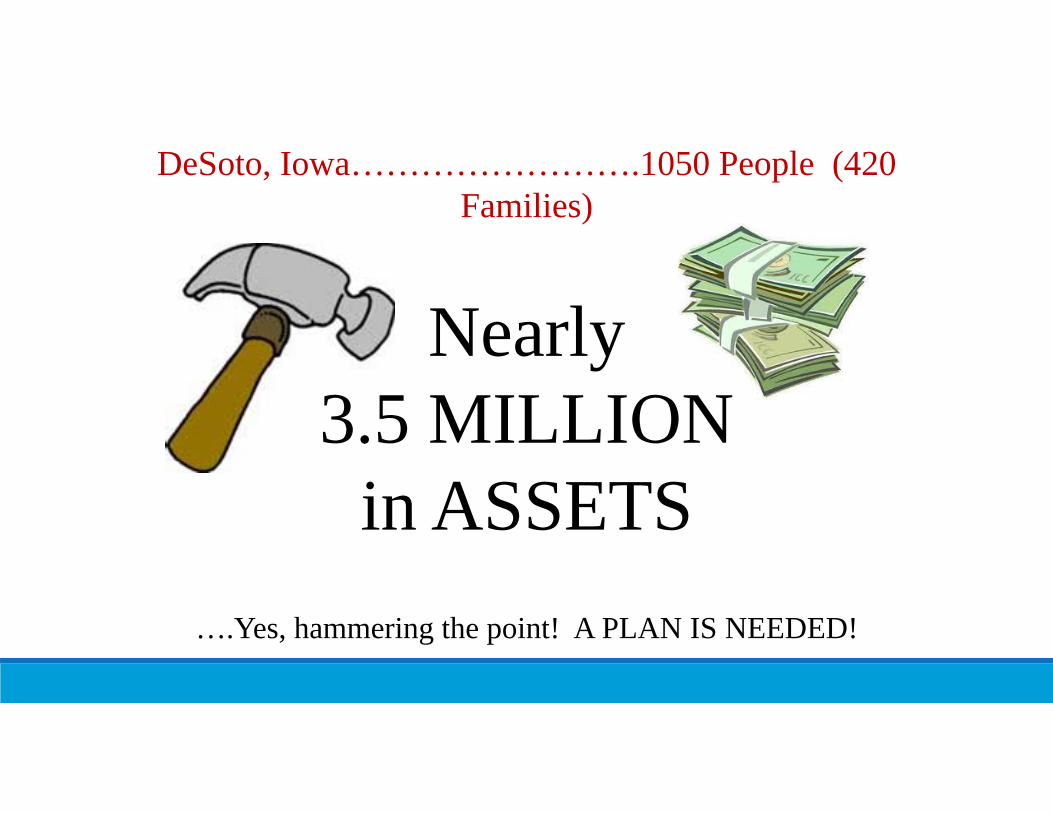
DeSoto, Iowa…………………….1050 People (420 Families)
Nearly 3.5 MILLION
in ASSETS….Yes, hammering the point! A PLAN IS NEEDED!

Some of the Problems?
Please!! NO
MOREPAPERWORK!
Got Time?
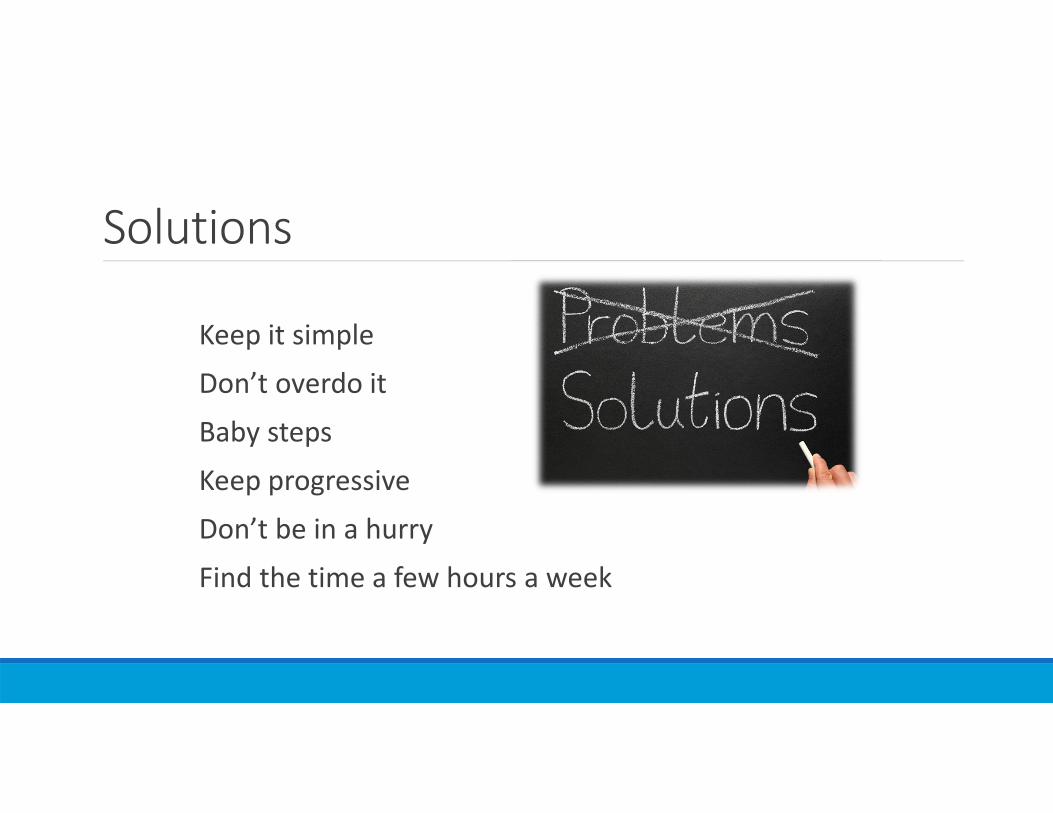
Solutions
Keep it simple
Don’t overdo it
Baby steps
Keep progressive
Don’t be in a hurry
Find the time a few hours a week
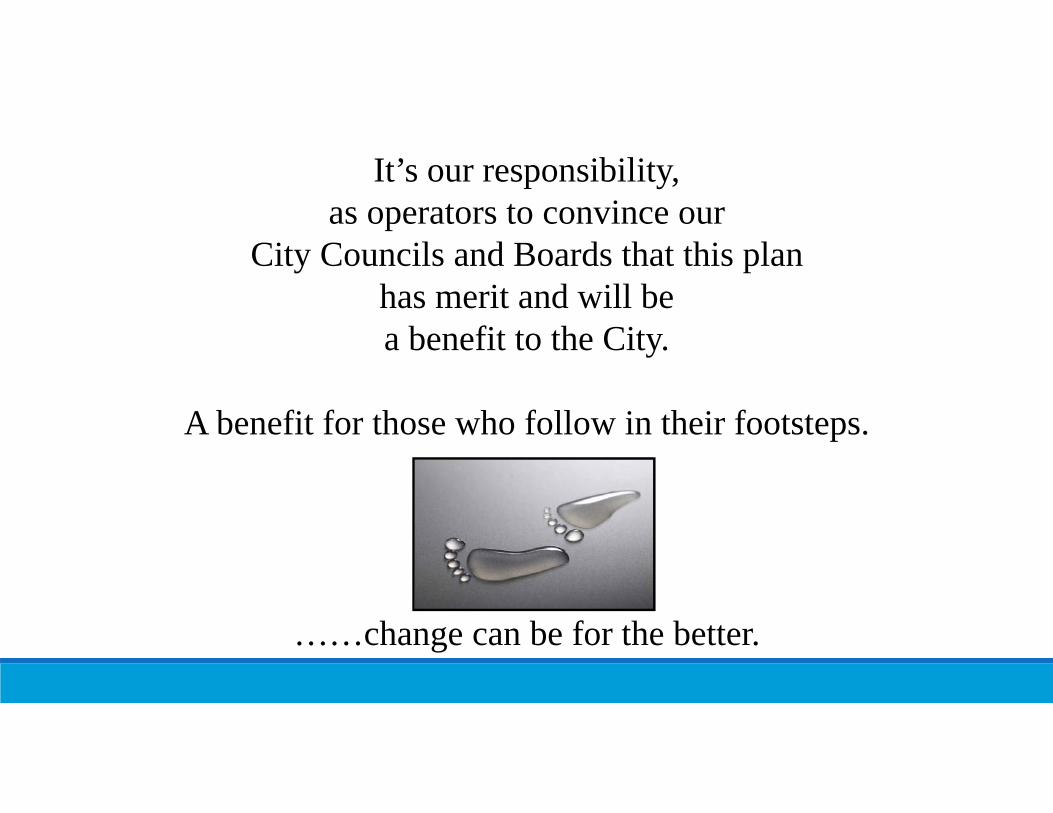
It’s our responsibility,as operators to convince our
City Councils and Boards that this planhas merit and will bea benefit to the City.
A benefit for those who follow in their footsteps.
……change can be for the better.
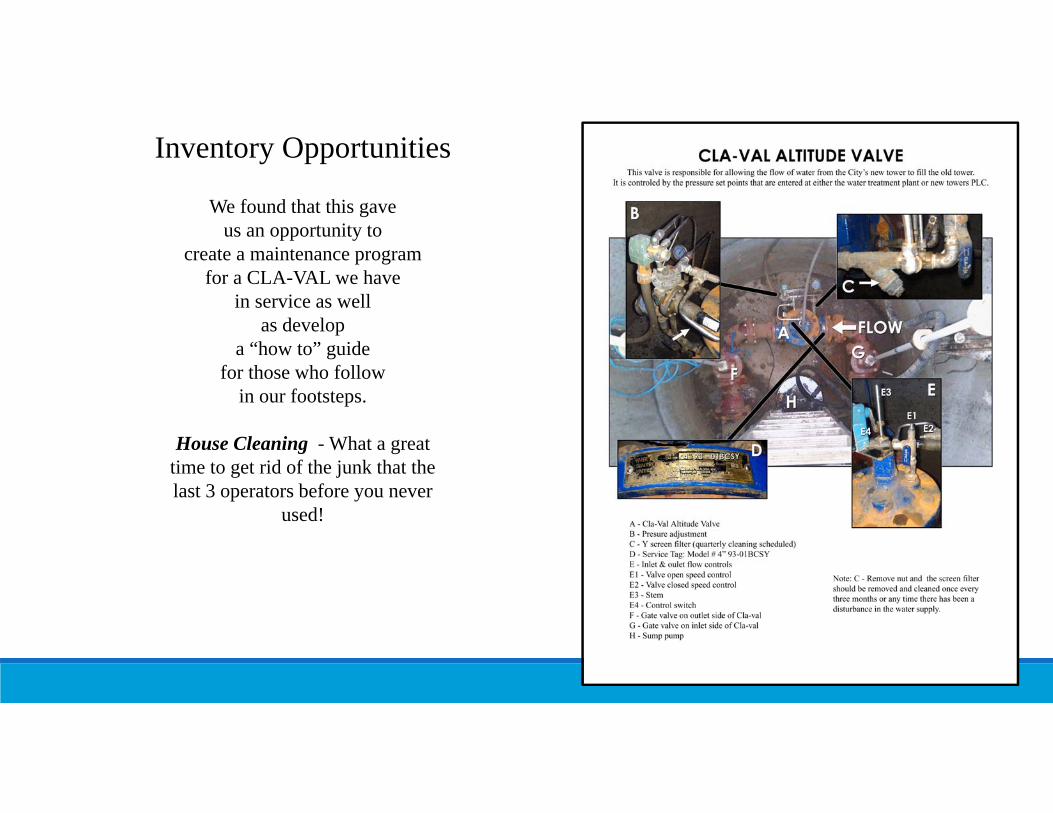
Inventory Opportunities
We found that this gave us an opportunity to
create a maintenance program for a CLA-VAL we have
in service as well as develop
a “how to” guide for those who follow
in our footsteps.
House Cleaning - What a great time to get rid of the junk that the last 3 operators before you never
used!
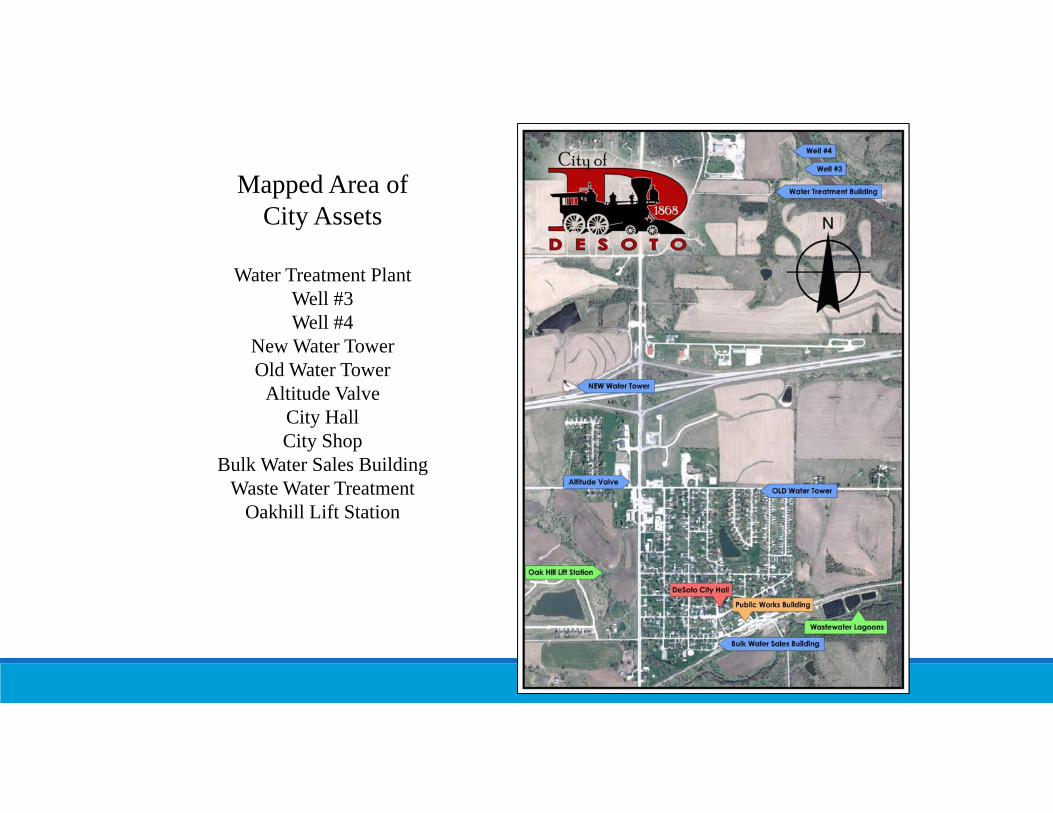
Mapped Area of City Assets
Water Treatment PlantWell #3Well #4
New Water Tower Old Water Tower
Altitude ValveCity HallCity Shop
Bulk Water Sales BuildingWaste Water Treatment
Oakhill Lift Station
LOS exampleWater Quality Standards – The utility will strive to meet all federal and state waterquality standards. Compliance with this goal will be reported to the council during monthlymeetings and to the consumer via the annual water quality report (CCR). Water Loss – The utility will have a goal of lowering unaccountable water loss to 15% or less. Monthly water audits with a running annual average will be completed andreported to the council. Water Leaks – Water leaks, when found, will be repaired in a timely manner to ensure the integrity of the water system and to lower water loss. Leaks will be tracked andrecorded to provide information to the council to assist with long term planning for thesystem. Water Pressure – The goal of the system will be to supply water pressure at a minimum of 30 psi at all time within the system. Should an adverse condition (electrical outage,main breaks, etc.) occur the goal will be to have no customer without water for morethan 8 hours. Aesthetics – The goal of the system will be to provide water which meets EPA’ssecondary standards related to aesthetic quality of the water (taste, odor, color & hardness). Complaints – The goal of the system will be to investigate all customer complaints within2 business days.
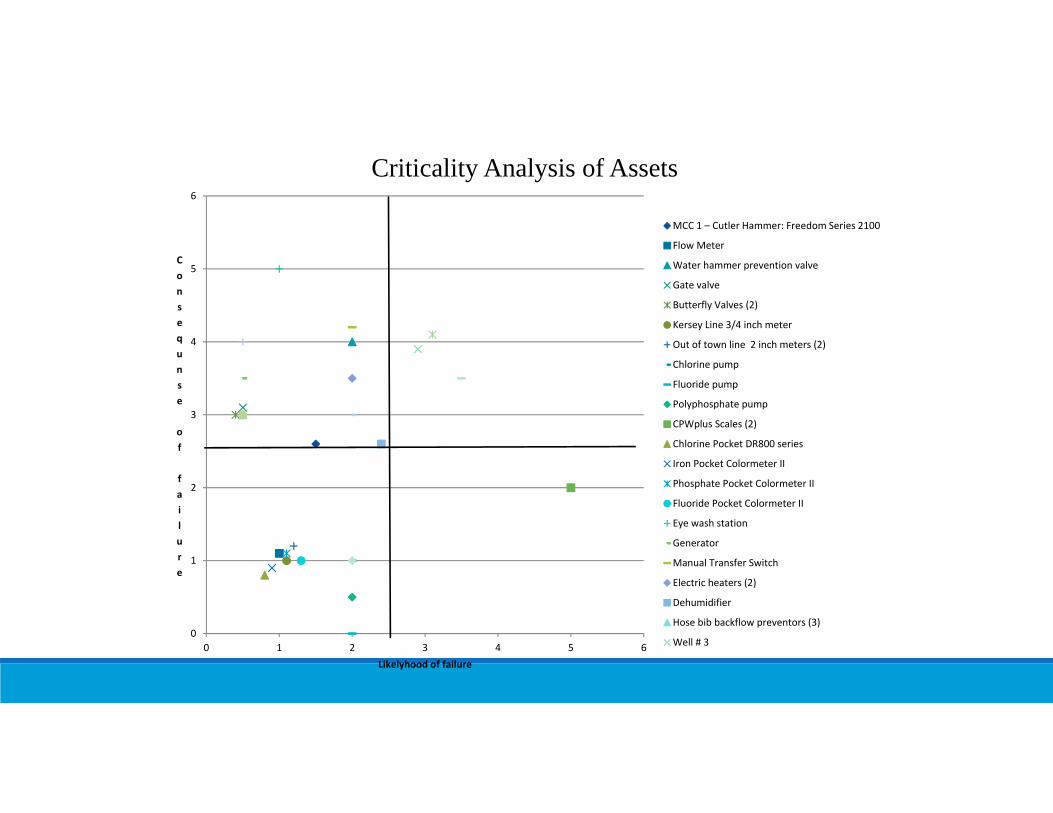
0
1
2
3
4
5
6
0 1 2 3 4 5 6
Consequnse
of
failure
Likelyhood of failure
Criticality Analysis of Assets
MCC 1 – Cutler Hammer: Freedom Series 2100
Flow Meter
Water hammer prevention valve
Gate valve
Butterfly Valves (2)
Kersey Line 3/4 inch meter
Out of town line 2 inch meters (2)
Chlorine pump
Fluoride pump
Polyphosphate pump
CPWplus Scales (2)
Chlorine Pocket DR800 series
Iron Pocket Colormeter II
Phosphate Pocket Colormeter II
Fluoride Pocket Colormeter II
Eye wash station
Generator
Manual Transfer Switch
Electric heaters (2)
Dehumidifier
Hose bib backflow preventors (3)
Well # 3
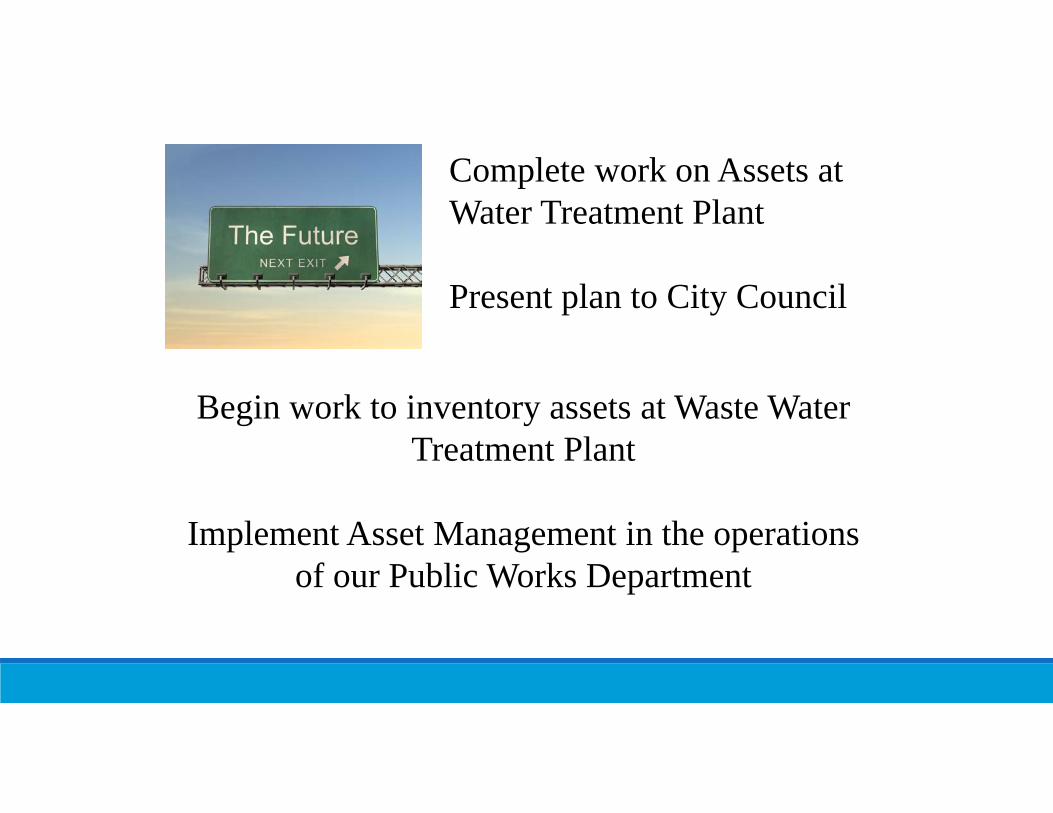
Complete work on Assets at Water Treatment Plant
Present plan to City Council
Begin work to inventory assets at Waste Water Treatment Plant
Implement Asset Management in the operations of our Public Works Department

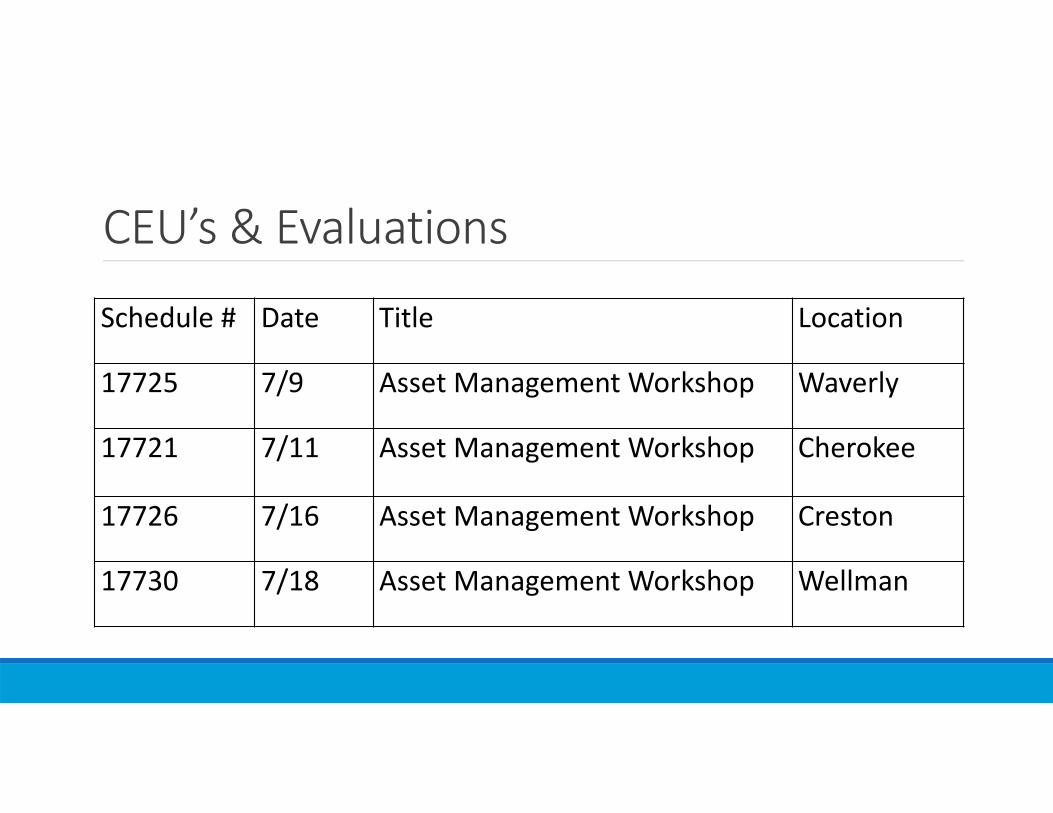
CEU’s & Evaluations
Schedule # Date Title Location
17725 7/9 Asset Management Workshop Waverly
17721 7/11 Asset Management Workshop Cherokee
17726 7/16 Asset Management Workshop Creston
17730 7/18 Asset Management Workshop Wellman


![[ON TIME-CRITICALITY] TIME-CRITICALITY … · ["ON TIME-CRITICALITY"] TIME-CRITICALITY Time-critical signal processing in humans and machines ... - ancient Greek prosody based on](https://img.pdfslide.us/doc/110x75/5b914fb509d3f215288b5a2b/on-time-criticality-time-criticality-on-time-criticality-time-criticality.jpg)