Embed Size (px)
Citation preview
See discussions, stats, and author profiles for this publication at: https://www.researchgate.net/publication/267613633
Asset Integrity Management of High Pressure Piping Systems Subject to Creep
Conference Paper in American Society of Mechanical Engineers, Pressure Vessels and Piping Division (Publication) PVP · July 2013
DOI: 10.1115/PVP2013-97524
CITATIONS
3
READS
86
1 author:
Some of the authors of this publication are also working on these related projects:
Ranking of Creep Damage in Main Steam Piping System Girth Welds Considering Multiaxial Stress Ranges View project
NDE for Detection of Flow Accelerated Corrosion View project
Marvin Cohn, P.E., P.Eng., FASME
Intertek
44 PUBLICATIONS 79 CITATIONS
SEE PROFILE
All content following this page was uploaded by Marvin Cohn, P.E., P.Eng., FASME on 21 October 2016.
The user has requested enhancement of the downloaded file.
Intertek AIM 601 W. California Avenue, Sunnyvale, CA 94086, 408.745.7000
16100 Cairnway Drive, Suite 310 , Houston, TX 77084, 832.593.0550 www.intertek.com/aim
Asset Integrity Management of High
Pressure Piping Systems Subject to Creep
By
Marvin J. Cohn, P.E.
Intertek AIM Sunnyvale, California, USA
Proceedings of PVP2013 2013 ASME Pressure Vessels and Piping Conference
July 14-18, 2013, Paris, France
TP204
1 Copyright © 2013 by ASME
Proceedings of PVP2013 2013 ASME Pressure Vessels and Piping Conference
July 14-18, 2013, Paris, France
PVP2013-97524
ASSET INTEGRITY MANAGEMENT OF HIGH PRESSURE PIPING SYSTEMS SUBJECT TO CREEP
Marvin J. Cohn, P.E.
Intertek AIM 601 W. California Ave.
Sunnyvale, CA 94086-4831 USA
ABSTRACT Safety and reliability are the preeminent concerns in
the design, operation, and maintenance of power piping. Recent additions to the ASME B31.1 Power Piping Code (Code) have addressed condition assessment of covered piping systems (CPS). Mandatory requirements for the condition assessment of CPS are discussed in Chapter VII of the Code, and nonmandatory guidelines are discussed in Appendix V of the Code. These documents discuss design, fabrication, construction, operation, and maintenance issues, and do not provide detailed guidance in the evaluation of high pressure piping systems subject to creep.
An asset integrity management (AIM) program should integrate and consider all attributes that influence the intended function of the original design. In addition to the evaluation of specified design, fabrication, construction, operation, and maintenance issues, an asset integrity management program should also consider and evaluate significant time-dependent anomalies, such as flexible operation modes, malfunctioning supports, and creep redistributed stresses. An AIM program includes the identification of governing drivers that accelerate piping system damage and then develops countermeasures to mitigate or reduce the driving mechanisms.
This paper discusses the large range of piping system stresses and the sensitivity of stress increase to 50% creep life reduction, indicating the need for a robust stress ranking methodology. The process results in an accurate selection of the most critical creep damage weldments for nondestructive examinations.
Keywords: high energy piping, asset integrity management, fitness-for-service, Grade 11, Grade 22, Grade 91 Disclaimer: The views expressed in this paper are strictly those of the author and do not necessarily reflect those of his affiliated corporation. INTRODUCTION
An asset integrity management (AIM) program should integrate and consider all attributes that influence the intended function of the original design [1]. Traditionally, maintenance and inspection departments have been responsible for mechanical integrity. Within the past decade, we have used industry programs (e.g., reliability centered maintenance, risk based inspection, and fitness-for-service), software tools, and advanced nondestructive examination techniques to monitor and confirm system integrity. The AIM program should also consider the long-term integrity of unconventional design configurations, such as dissimilar metal girth welds and welded lateral connections in high pressure piping subject to creep, which have resulted in early service life weldment cracks in Grade 91 material, discussed by Paterson, et al. [2].
In addition to the evaluation of specified design, fabrication, construction, operation, and maintenance issues, an AIM program should also consider and evaluate significant time-dependent anomalies such as flexible operation modes, malfunctioning supports, and creep redistributed stresses. An AIM program should include the identification of governing drivers that accelerate piping system damage and then develop countermeasures to mitigate or reduce the driving mechanisms. Due to renewable power cycling, original design baseloaded conventional plants and multiunit combined-cycle plants
2 Copyright © 2013 by ASME
This paper suggests that documentation and evaluation of piping system anomalies will provide significant improvements to the high pressure piping AIM program. Photographic documentation of hanger position indicators will improve the evaluation of piping displacements and stresses. Compared to the assumption of no piping system anomalies, evaluation of significant piping system field anomalies has resulted in more realistic stress results and a more accurate ranking of critical stresses. While the large scatter band in material creep rupture data is well recognized, the range of piping stresses among all girth welds and clock positions is much greater than the material creep rupture variability. This paper discusses several examples where off-design piping stress variations can result in premature creep rupture failure times and provides methodologies to reduce the range of stress value uncertainties. DOCUMENTATION OF PIPING SYSTEM ANOMALIES
Piping system hot and cold walkdowns are more than hanger walkdowns. In addition to assessing the conditions of spring hangers and supports, all piping deformation, piping interferences, and observed anomalies should be documented. It is also prudent to include the first few supports of drain lines, auxiliary steam lines, and extraction lines in the walkdowns.
Piping interferences should be noted and removed to allow the pipe to displace freely as expected in the original design. Unloaded rigid supports should be documented.
Snubbers should be carefully examined. For example, a broken snubber shaft is shown in Figure 1. DOCUMENTATION OF SPRING HANGER POSITION INDICATOR VALUES
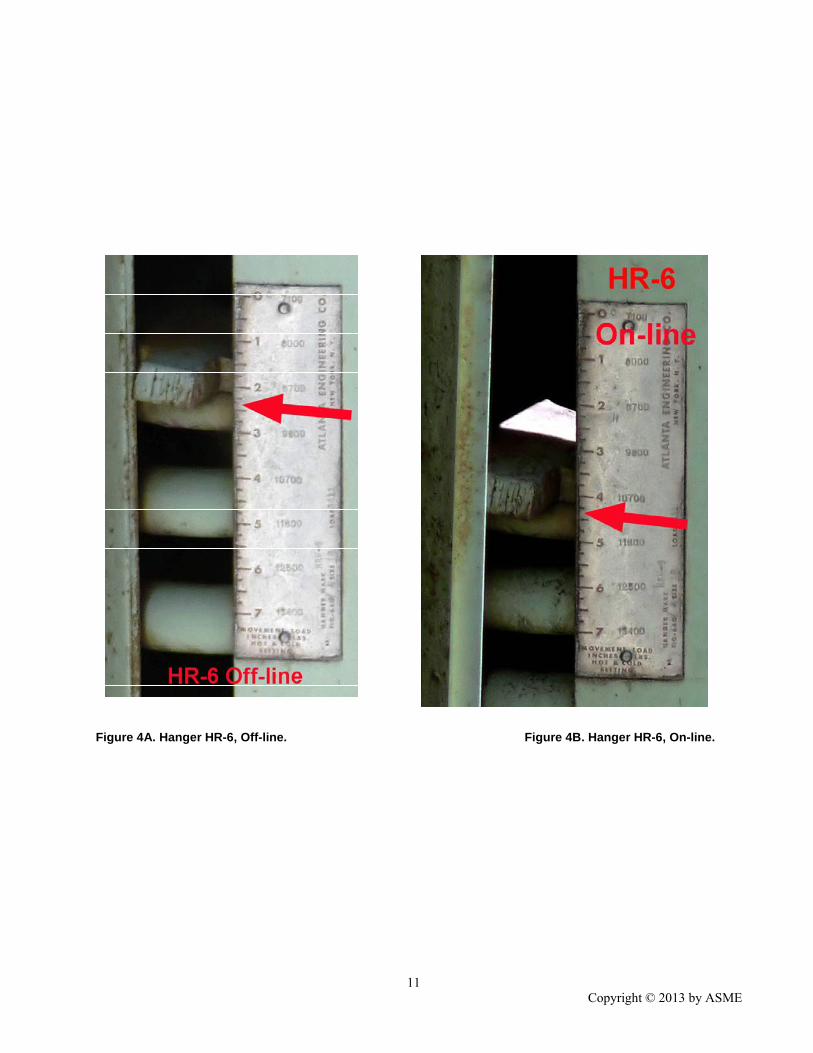
Without having to take climbing risks while wearing a safety harness and stretching lanyard, position indicator readings can be clearly documented by photographs. As an example, a normal view from a cat walk of Hangers MS-6 and HR-6 is provided in Figure 2. The detailed cold and hot walkdown photographs of Hanger MS-6 are shown in Figures 3A and 3B. It is clearly indicated that the pipe at the location of Hanger MS-6 drops about 25 mm (1.0 inch) from off-line to on-line. Similarly, the detailed cold and hot walkdown photographs of Hanger HR-6 are shown in Figures 4A and 4B. It is clearly indicated that the pipe at the location of Hanger HR-6 drops about 51 mm (2.0 inches) from off-line to on-line. UNCERTAINTY IN CREEP RUPTURE DATA
It is well recognized that there is a large scatter band in creep rupture data. One of the approaches to evaluate creep rupture data is with a parameterized “master curve.” The Larson-Miller parameter [3] was used by the author to evaluate the creep rupture data over a range of
temperatures and stresses. In this case, the following equation was used:
P = T (C + log t) (1)
where P is the Larson-Miller parameter (LMP), T is the applied temperature (Rankine), C is a constant with a value of 20, and t is the time to rupture (hours).
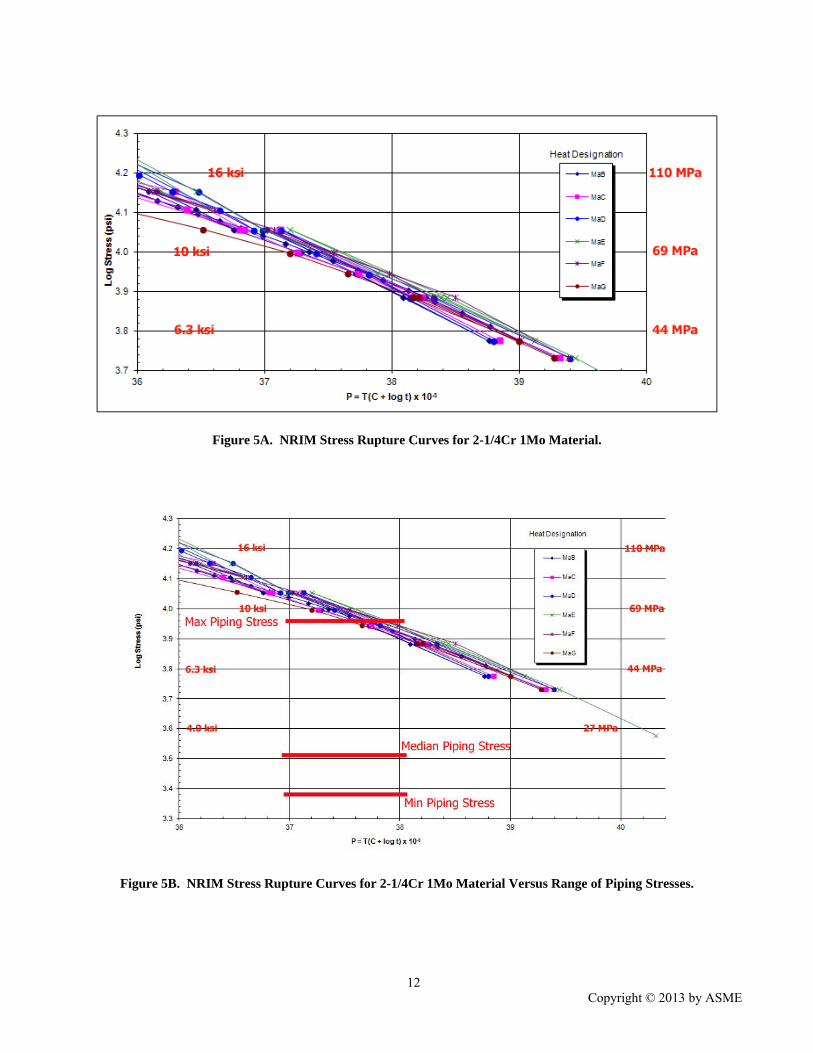
An evaluation of creep rupture data for 2-1/4Cr–1Mo (Grade P22) normalized and tempered plates was performed to consider creep rupture material property variations. The National Research Institute for Metals (NRIM – now the National Institute for Materials Science (NIST)) creep rupture database [4] was used for this evaluation, which included six heats of 2-1/4Cr–1Mo material tested in air at temperatures ranging from 500°C to 650°C (932°F to 1202°F). For main steam (MS) piping systems, the author considered applied stresses ranging from 26.3 MPa (3.8 ksi) to 82.7 MPa (12 ksi).
The creep rupture curves of log stress versus P are provided in Figure 5A. As an LMP reference, P = 36.5 for T = 1460° Rankine (538°C and 1000°F) and 100,000 hours. Each color coded curve represents a specific heat of material. It is important to note that throughout the full range of stress, the stronger heats remain above the weaker heats of materials (there is no substantial crossover throughout the range of stresses). Consequently, the ranking of creep damage does not change for the same heat of material with redistributing creep stresses because the material property curves do not significantly cross over each other.
Since all of the piping is operated for the same time and approximately the same temperature, the variation in creep damage at the selected weldments is primarily dependent upon the applied stress. Within the stress range of 26 MPa to 83 MPa, there is no more than 8% variation in the stress rupture scatter band for the same heat of material and no more than 14% variation in the stress rupture scatter band from the weakest to strongest heats of material. RANGE OF PIPING STRESSES
The author and his colleagues have performed evaluations on more than 300 MS piping systems (in conventional power plants) or high pressure piping systems (in combined-cycle plants). In these piping systems, we have typically found a significant range of stresses among the girth welds. As discussed below, an evaluation of Grades 11, 22, and 91 power piping stresses revealed that the range of pipe stresses among all girth welds is significantly greater than the material creep rupture variability for a given temperature and time-to-rupture.
As a simple comparison, the ranges of ASME B31.1 [5] piping stress analysis sustained load (SL) values were considered in this evaluation. As discussed later in this
3 Copyright © 2013 by ASME
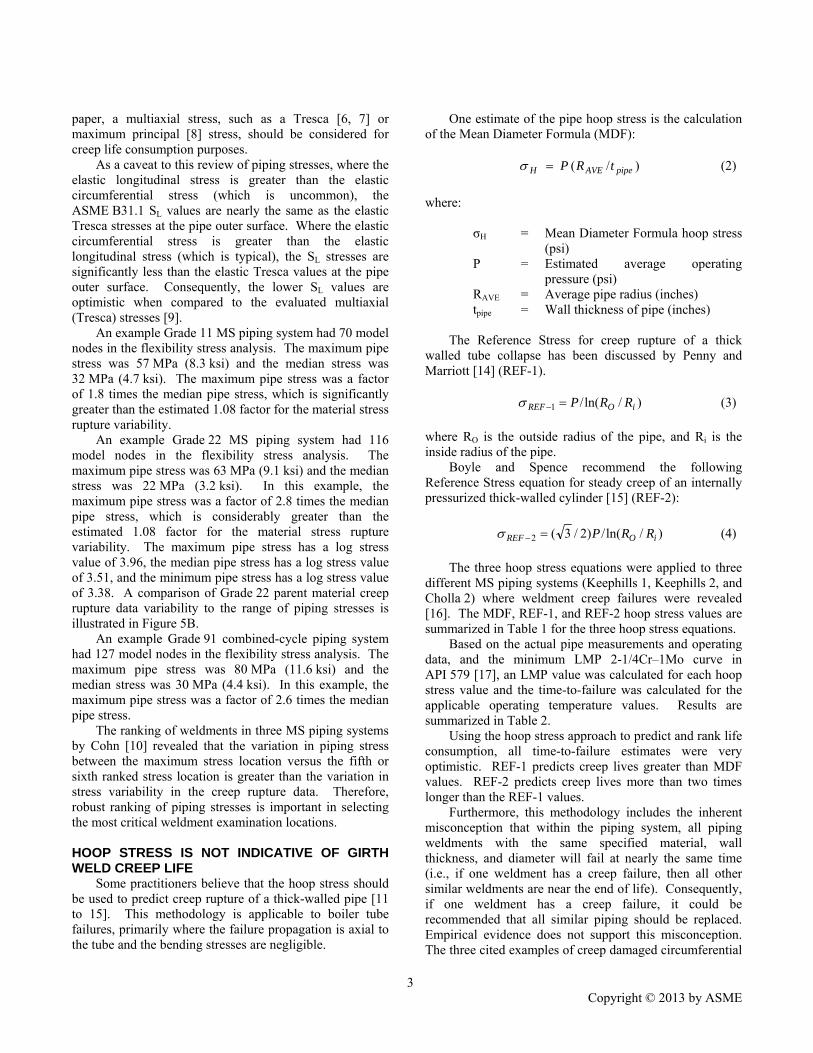
paper, a multiaxial stress, such as a Tresca [6, 7] or maximum principal [8] stress, should be considered for creep life consumption purposes.
As a caveat to this review of piping stresses, where the elastic longitudinal stress is greater than the elastic circumferential stress (which is uncommon), the ASME B31.1 SL values are nearly the same as the elastic Tresca stresses at the pipe outer surface. Where the elastic circumferential stress is greater than the elastic longitudinal stress (which is typical), the SL stresses are significantly less than the elastic Tresca values at the pipe outer surface. Consequently, the lower SL values are optimistic when compared to the evaluated multiaxial (Tresca) stresses [9].
An example Grade 11 MS piping system had 70 model nodes in the flexibility stress analysis. The maximum pipe stress was 57 MPa (8.3 ksi) and the median stress was 32 MPa (4.7 ksi). The maximum pipe stress was a factor of 1.8 times the median pipe stress, which is significantly greater than the estimated 1.08 factor for the material stress rupture variability.
An example Grade 22 MS piping system had 116 model nodes in the flexibility stress analysis. The maximum pipe stress was 63 MPa (9.1 ksi) and the median stress was 22 MPa (3.2 ksi). In this example, the maximum pipe stress was a factor of 2.8 times the median pipe stress, which is considerably greater than the estimated 1.08 factor for the material stress rupture variability. The maximum pipe stress has a log stress value of 3.96, the median pipe stress has a log stress value of 3.51, and the minimum pipe stress has a log stress value of 3.38. A comparison of Grade 22 parent material creep rupture data variability to the range of piping stresses is illustrated in Figure 5B.
An example Grade 91 combined-cycle piping system had 127 model nodes in the flexibility stress analysis. The maximum pipe stress was 80 MPa (11.6 ksi) and the median stress was 30 MPa (4.4 ksi). In this example, the maximum pipe stress was a factor of 2.6 times the median pipe stress.
The ranking of weldments in three MS piping systems by Cohn [10] revealed that the variation in piping stress between the maximum stress location versus the fifth or sixth ranked stress location is greater than the variation in stress variability in the creep rupture data. Therefore, robust ranking of piping stresses is important in selecting the most critical weldment examination locations. HOOP STRESS IS NOT INDICATIVE OF GIRTH WELD CREEP LIFE
Some practitioners believe that the hoop stress should be used to predict creep rupture of a thick-walled pipe [11 to 15]. This methodology is applicable to boiler tube failures, primarily where the failure propagation is axial to the tube and the bending stresses are negligible.
One estimate of the pipe hoop stress is the calculation of the Mean Diameter Formula (MDF): )/( pipeAVEH tRP (2)
where: σH = Mean Diameter Formula hoop stress
(psi) P = Estimated average operating
pressure (psi) RAVE = Average pipe radius (inches) tpipe = Wall thickness of pipe (inches)
The Reference Stress for creep rupture of a thick walled tube collapse has been discussed by Penny and Marriott [14] (REF-1). )/ln(/1 iOREF RRP (3)
where RO is the outside radius of the pipe, and Ri is the inside radius of the pipe.
Boyle and Spence recommend the following Reference Stress equation for steady creep of an internally pressurized thick-walled cylinder [15] (REF-2):
)/ln(/)2/3(2 iOREF RRP (4)
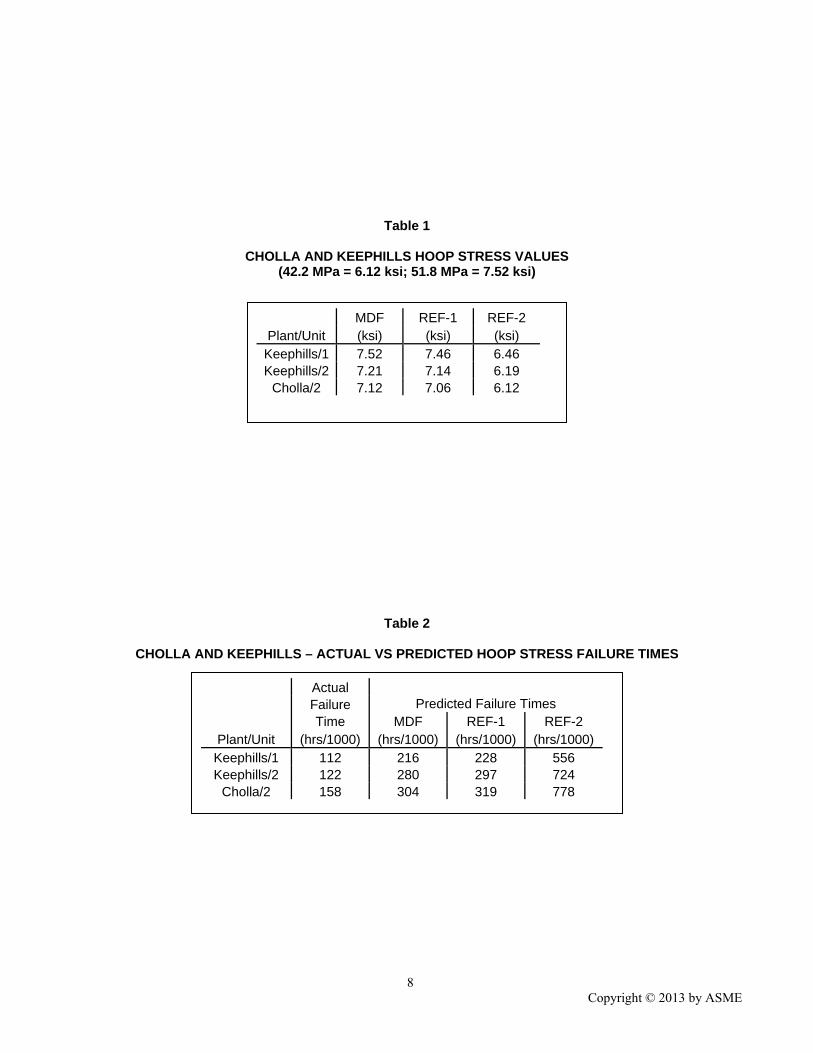
The three hoop stress equations were applied to three
different MS piping systems (Keephills 1, Keephills 2, and Cholla 2) where weldment creep failures were revealed [16]. The MDF, REF-1, and REF-2 hoop stress values are summarized in Table 1 for the three hoop stress equations.
Based on the actual pipe measurements and operating data, and the minimum LMP 2-1/4Cr–1Mo curve in API 579 [17], an LMP value was calculated for each hoop stress value and the time-to-failure was calculated for the applicable operating temperature values. Results are summarized in Table 2.
Using the hoop stress approach to predict and rank life consumption, all time-to-failure estimates were very optimistic. REF-1 predicts creep lives greater than MDF values. REF-2 predicts creep lives more than two times longer than the REF-1 values.
Furthermore, this methodology includes the inherent misconception that within the piping system, all piping weldments with the same specified material, wall thickness, and diameter will fail at nearly the same time (i.e., if one weldment has a creep failure, then all other similar weldments are near the end of life). Consequently, if one weldment has a creep failure, it could be recommended that all similar piping should be replaced. Empirical evidence does not support this misconception. The three cited examples of creep damaged circumferential
4 Copyright © 2013 by ASME
weldments occurred more than 13 years ago, and no other circumferential weldments in the three piping systems have had creep failures that were not predicted since those incidents. In one case, the downstream circumferential weldment (having slightly less bending stress) had a creep crack several years later. A major flaw in the hoop stress methodology applied to piping circumferential weldments is that the methodology does not consider the significant variation of bending stresses in piping systems, especially due to malfunctioning supports. A more realistic methodology to estimate pipe stresses and creep rupture lives is discussed at the end of this paper. STRESS INCREASE FOR 50% LIFE REDUCTION
The factors of stress increase to result in 50% life reduction in Grades 11, 22, and 91 materials were investigated. For this study, the API 579 average and minimum creep rupture curves based on API STD 530 data [17] were used in the evaluation.
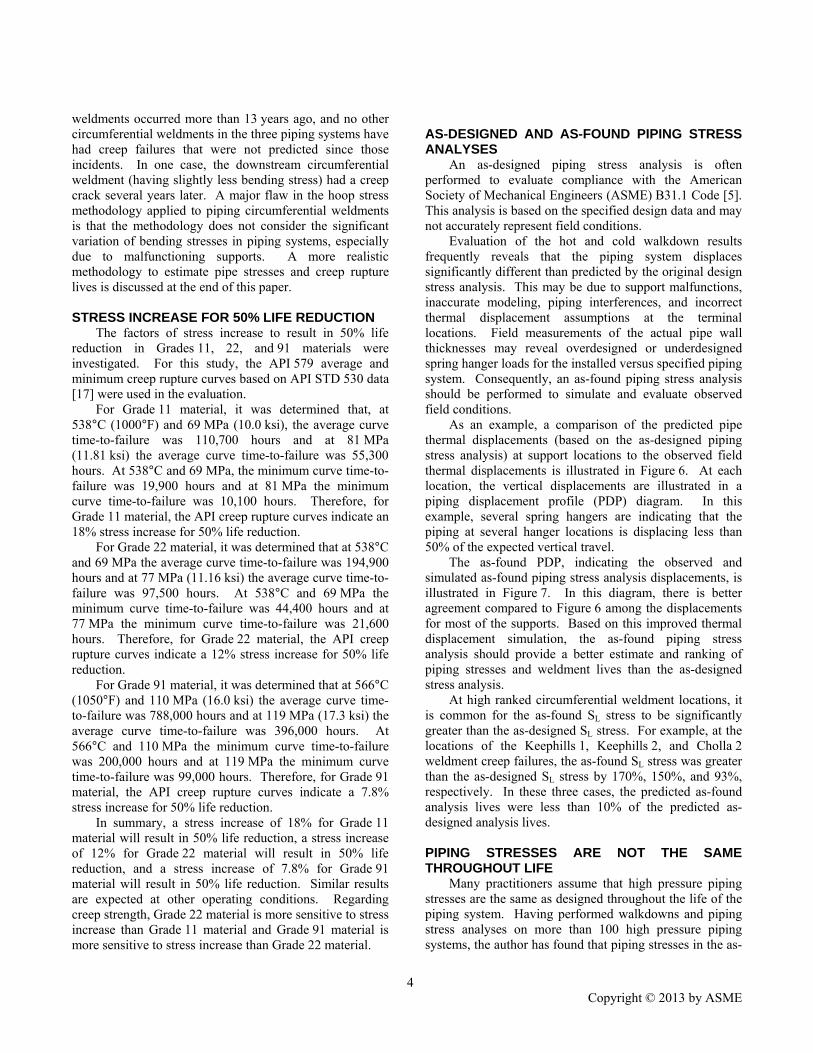
For Grade 11 material, it was determined that, at 538°C (1000°F) and 69 MPa (10.0 ksi), the average curve time-to-failure was 110,700 hours and at 81 MPa (11.81 ksi) the average curve time-to-failure was 55,300 hours. At 538°C and 69 MPa, the minimum curve time-to-failure was 19,900 hours and at 81 MPa the minimum curve time-to-failure was 10,100 hours. Therefore, for Grade 11 material, the API creep rupture curves indicate an 18% stress increase for 50% life reduction.
For Grade 22 material, it was determined that at 538°C and 69 MPa the average curve time-to-failure was 194,900 hours and at 77 MPa (11.16 ksi) the average curve time-to-failure was 97,500 hours. At 538°C and 69 MPa the minimum curve time-to-failure was 44,400 hours and at 77 MPa the minimum curve time-to-failure was 21,600 hours. Therefore, for Grade 22 material, the API creep rupture curves indicate a 12% stress increase for 50% life reduction.
For Grade 91 material, it was determined that at 566°C (1050°F) and 110 MPa (16.0 ksi) the average curve time-to-failure was 788,000 hours and at 119 MPa (17.3 ksi) the average curve time-to-failure was 396,000 hours. At 566°C and 110 MPa the minimum curve time-to-failure was 200,000 hours and at 119 MPa the minimum curve time-to-failure was 99,000 hours. Therefore, for Grade 91 material, the API creep rupture curves indicate a 7.8% stress increase for 50% life reduction.
In summary, a stress increase of 18% for Grade 11 material will result in 50% life reduction, a stress increase of 12% for Grade 22 material will result in 50% life reduction, and a stress increase of 7.8% for Grade 91 material will result in 50% life reduction. Similar results are expected at other operating conditions. Regarding creep strength, Grade 22 material is more sensitive to stress increase than Grade 11 material and Grade 91 material is more sensitive to stress increase than Grade 22 material.
AS-DESIGNED AND AS-FOUND PIPING STRESS ANALYSES
An as-designed piping stress analysis is often performed to evaluate compliance with the American Society of Mechanical Engineers (ASME) B31.1 Code [5]. This analysis is based on the specified design data and may not accurately represent field conditions.
Evaluation of the hot and cold walkdown results frequently reveals that the piping system displaces significantly different than predicted by the original design stress analysis. This may be due to support malfunctions, inaccurate modeling, piping interferences, and incorrect thermal displacement assumptions at the terminal locations. Field measurements of the actual pipe wall thicknesses may reveal overdesigned or underdesigned spring hanger loads for the installed versus specified piping system. Consequently, an as-found piping stress analysis should be performed to simulate and evaluate observed field conditions.
As an example, a comparison of the predicted pipe thermal displacements (based on the as-designed piping stress analysis) at support locations to the observed field thermal displacements is illustrated in Figure 6. At each location, the vertical displacements are illustrated in a piping displacement profile (PDP) diagram. In this example, several spring hangers are indicating that the piping at several hanger locations is displacing less than 50% of the expected vertical travel.
The as-found PDP, indicating the observed and simulated as-found piping stress analysis displacements, is illustrated in Figure 7. In this diagram, there is better agreement compared to Figure 6 among the displacements for most of the supports. Based on this improved thermal displacement simulation, the as-found piping stress analysis should provide a better estimate and ranking of piping stresses and weldment lives than the as-designed stress analysis.
At high ranked circumferential weldment locations, it is common for the as-found SL stress to be significantly greater than the as-designed SL stress. For example, at the locations of the Keephills 1, Keephills 2, and Cholla 2 weldment creep failures, the as-found SL stress was greater than the as-designed SL stress by 170%, 150%, and 93%, respectively. In these three cases, the predicted as-found analysis lives were less than 10% of the predicted as-designed analysis lives. PIPING STRESSES ARE NOT THE SAME THROUGHOUT LIFE
Many practitioners assume that high pressure piping stresses are the same as designed throughout the life of the piping system. Having performed walkdowns and piping stress analyses on more than 100 high pressure piping systems, the author has found that piping stresses in the as-

5 Copyright © 2013 by ASME
found condition can be significantly different than the as-designed stresses.
As an example, the author performed evaluations of 22 TransAlta Utilities piping systems between 1996 and 1999 [18]. These piping systems ranged from 66 MW to 400 MW. In 1999, the units ranged from 16 operating years through 42 operating years. As a preliminary phase of the program, hot walkdowns of the MS and hot reheat (HRH) piping systems were performed. The walkdowns revealed that there were many topped-out and bottomed-out hangers among the 22 piping systems. In this case study, piping systems had malfunctioning supports, ranging from 3% to 36% of the total number of supports per piping system.
In particular, it was found that the Keephills 1 MS piping system had 8% malfunctioning supports on-line and the Keephills 2 MS piping system had 11% malfunctioning supports on-line. The Keephills 1 and 2 units are sister units. At the same location in the Keephills 1 and Keephills 2 units, it was determined that the as-found SL stresses were significantly greater than the as-designed SL stress, by a factor of 2.7 and 2.5, respectively.
The MS and high pressure piping system materials are subject to creep during normal operation. It is well documented that the time-dependent creep phenomenon results in redistributed stresses and degraded material properties (e.g., ultimate tensile strength, yield strength, and creep rupture strength).
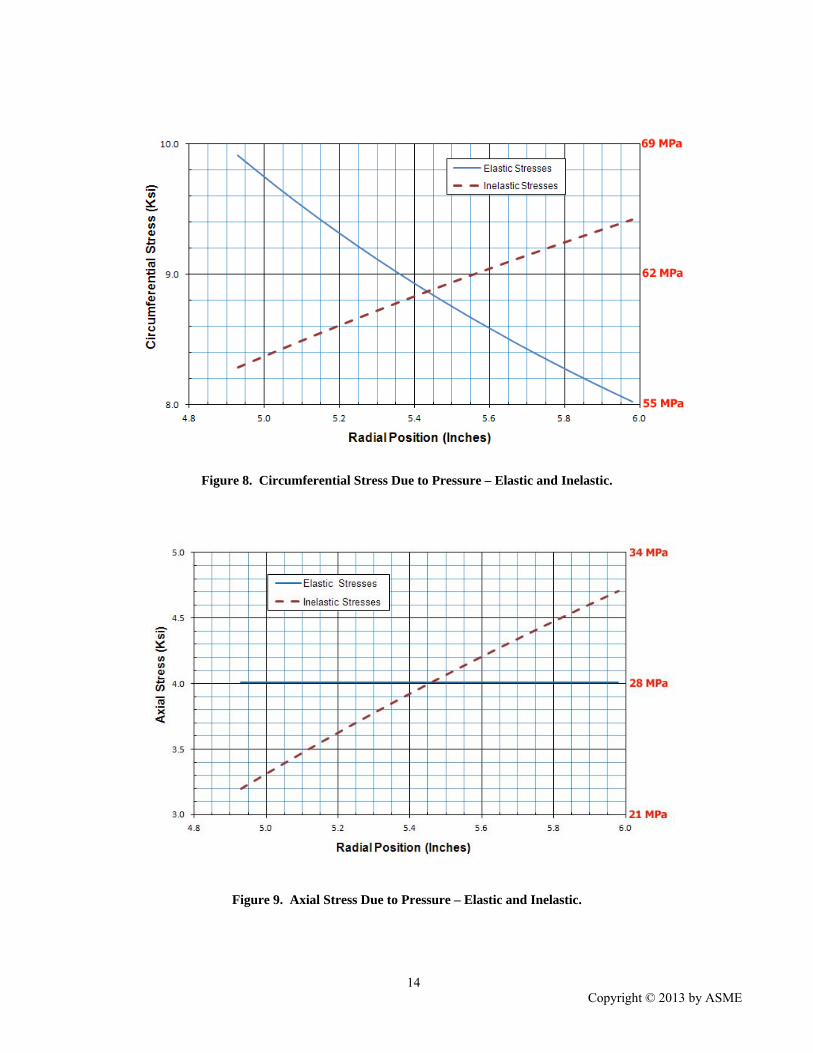
The elastic through-wall circumferential stresses due to pressure are based on the Lamé equations [19] and the inelastic through-wall stresses due to pressure are based on the Bailey equations [20]. As an example, the elastic and inelastic through-wall circumferential stresses due to pressure for a girth weld are illustrated in Figure 8 [21]. At the outside diameter (OD) surface, the inelastic circumferential stress is about 17.5% greater than the elastic circumferential stress and about 6.7% greater than the elastic midwall circumferential stress.
The elastic and inelastic through-wall axial stress due to pressure at girth welds is illustrated in Figure 9 [21]. At the OD surface, the inelastic axial stress due to pressure is 17.5% greater than the elastic axial stress and the elastic midwall stress.
General finite element stress analyses of high pressure piping systems subject to creep typically use shell elements. Since the shell elements do not account for radial redistribution of inelastic stresses due to pressure, the hoop and axial stresses due to pressure on the OD surface underestimate the fully redistributed stresses and the estimated multiaxial stresses would be optimistic (nonconservative). VARIATION OF PIPE WALL THICKNESSES
Most high pressure piping life consumption evaluations do not consider the actual (field) pipe wall
thickness at the circumferential location of highest multiaxial stress. Consequently, the analysts probably assume that actual pipe wall thickness variations do not significantly influence the life consumption estimates. However, the pipe manufacturing wall thickness tolerance could be about 12%.
A pipe wall thickness survey of several MS and HRH pipe spools was summarized by Cohn [16]. Four pipe wall thickness measurements were taken near each circumferential weldment (about 2 inches from the toe of the weld), 90 degrees apart. In some cases, the ratios of maximum to minimum wall thickness were small, less than 2%. In several other cases, the ratios of maximum to minimum wall thickness were in the range of 10% to 20%.
As previously discussed by the author [16, 22], pipe wall thickness variations of 10% to 20% have a significant influence on the predicted weldment life consumption. In the following example, two welds with different applied loads are considered. Both weldments are 2-1/4Cr–1Mo material, with a pipe diameter of 394 mm (15.51 inches) and a nominal wall thickness (NWT) of 58.7 mm (2.31 inches). As a baseline calculation, the weldment creep life was evaluated for the actual wall thickness equal to the NWT value.
For Weldment A with an applied stress of 82.7 MPa (12,000 psi), the baseline life for an NWT value of 2.31 inches is 190,000 operating hours. For Weldment B, with an applied stress of 86.2 MPa (12,500 psi), the baseline life for an NWT value of 2.31 inches is 155,000 operating hours.
In addition, predicted weldment life calculations were evaluated for hypothetical wall thicknesses at -10%, -5%, 5%, and 10% variations from the NWT values.
Using a Power Law equation, the predicted lives were correlated to the hypothetical pipe wall thickness variations: Life = A + B (thickness) C (5)
For Weld A, the curve fit of wall thickness vs. creep life is illustrated in Figure 10, where: A is -17.8 B is 4.81 C is 4.50
For Weld B, the curve fit of wall thickness vs. creep life is illustrated in Figure 11, where: A is -16.2 B is 4.41 C is 4.37
This study indicates that the field measured pipe wall thickness is a significant parameter for the estimation of
6 Copyright © 2013 by ASME
weldment life. The exponent on pipe wall thickness is in the range of 4.4 to 4.5. Therefore, pipe wall thicknesses should be measured at the most critical welds subject to creep and included as part of the asset integrity management program. For these two examples, a 10% wall thickness variation resulted in a 9% stress variation. A 20% wall thickness variation resulted in an 18% stress variation. GIRTH WELDMENTS AND BASE METAL DO NOT HAVE THE SAME MATERIAL PROPERTIES IN THE CREEP REGIME
Most piping life consumption practitioners use the same material stress rupture properties for base metal and circumferential weldments (including the heat affected zone) in the creep regime. The ASME B31.1-2012 Code [5] notes that the weld strength reduction factor (WSRF) (discussed in ASME B31.1 Table 102.4.7) applies to longitudinal seam welds or spiral welded pipe. Since 2010, the ASME B31.1 Code has a caveat that the designer is responsible to assess application of a WSRF for circumferential welds. Since the ASME B31.1 WSRF is not time-dependent, the author suspects that the ASME methodology may be reasonable for longitudinal seam welds with less than 100,000 operating hours, but may be optimistic beyond 100,000 operating hours.
Empirical creep-related failure data indicate that girth weldments have significantly lower stress rupture strength than base metal for the same applied temperatures, pressures, bending stresses, and operating hours. The power industry has found that the circumferential creep failures occur in the girth weldments, not in the base metal beyond the weldments. There are many instances where creep damaged weldments have been replaced and the remaining base metal has not had significant creep damage after many more years of service. For example, the base metal adjacent to the creep-damaged weldments in Cholla 2, Keephills 1, and Keephills 2 has been in service for more than 13 years after the weldment repairs, without indications of significant creep damage. EVALUATION OF TIME DEPENDENT MULTIAXIAL STRESSES
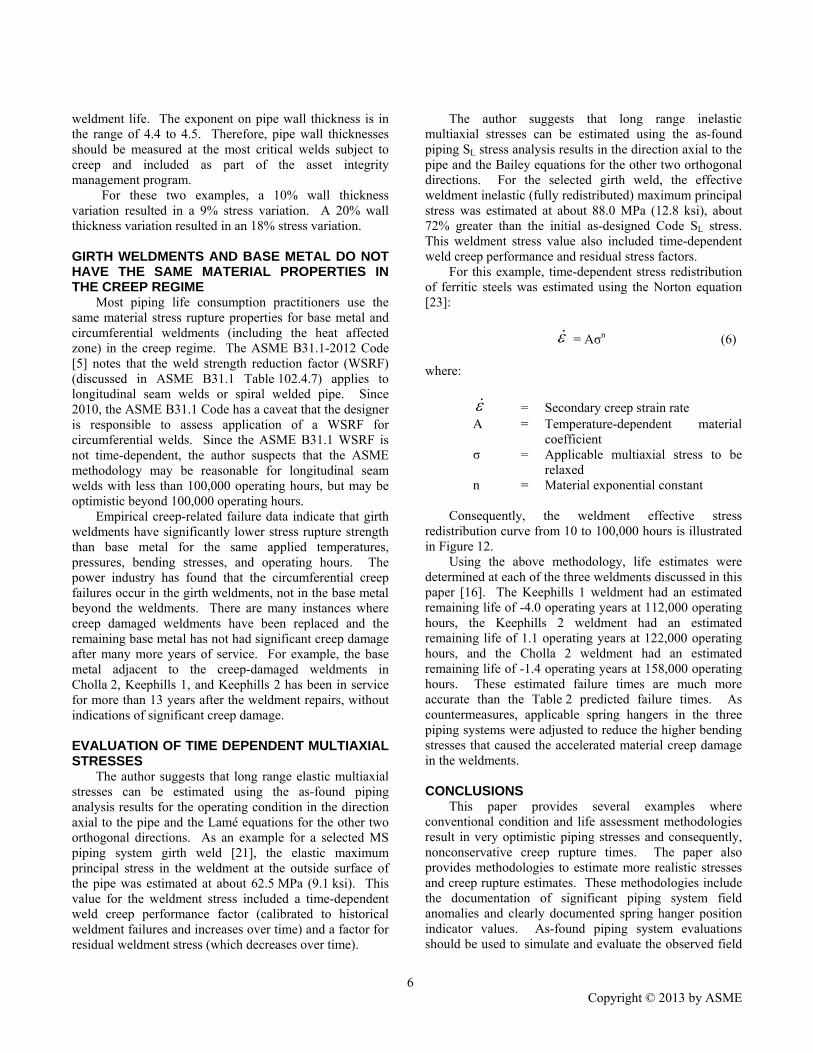
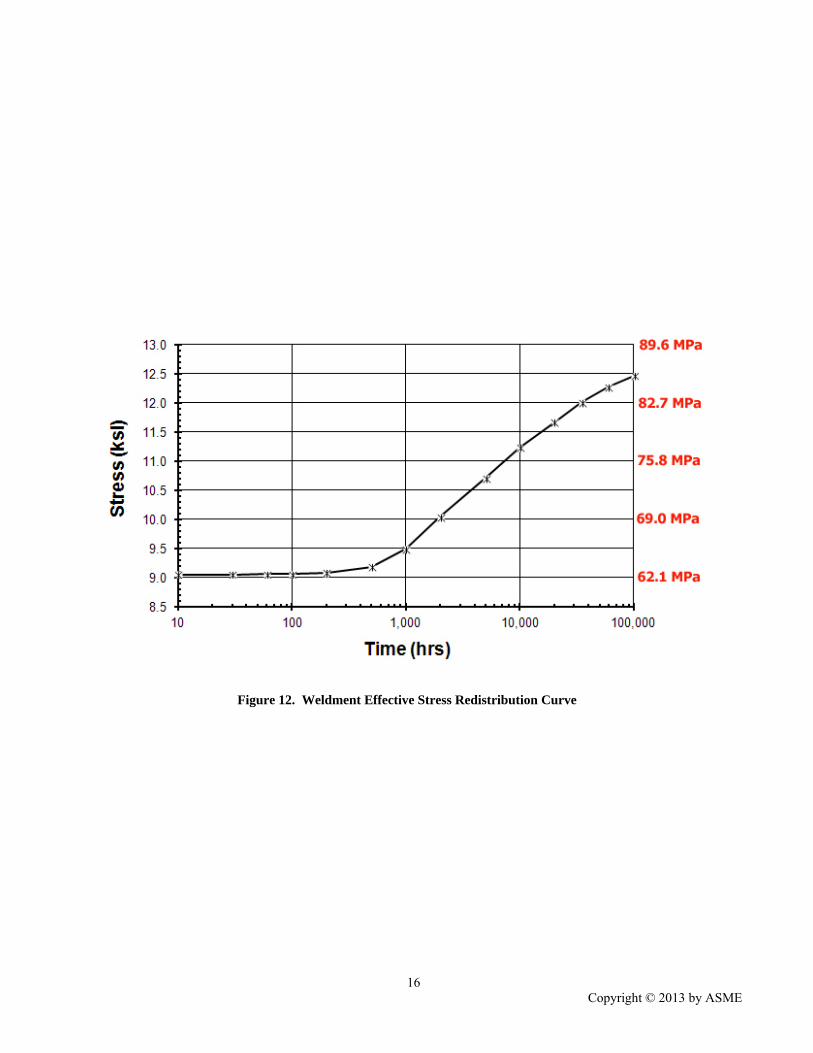
The author suggests that long range elastic multiaxial stresses can be estimated using the as-found piping analysis results for the operating condition in the direction axial to the pipe and the Lamé equations for the other two orthogonal directions. As an example for a selected MS piping system girth weld [21], the elastic maximum principal stress in the weldment at the outside surface of the pipe was estimated at about 62.5 MPa (9.1 ksi). This value for the weldment stress included a time-dependent weld creep performance factor (calibrated to historical weldment failures and increases over time) and a factor for residual weldment stress (which decreases over time).
The author suggests that long range inelastic multiaxial stresses can be estimated using the as-found piping SL stress analysis results in the direction axial to the pipe and the Bailey equations for the other two orthogonal directions. For the selected girth weld, the effective weldment inelastic (fully redistributed) maximum principal stress was estimated at about 88.0 MPa (12.8 ksi), about 72% greater than the initial as-designed Code SL stress. This weldment stress value also included time-dependent weld creep performance and residual stress factors.
For this example, time-dependent stress redistribution of ferritic steels was estimated using the Norton equation [23]:
= Aσn (6) where:
= Secondary creep strain rate A = Temperature-dependent material
coefficient σ = Applicable multiaxial stress to be
relaxed n = Material exponential constant
Consequently, the weldment effective stress redistribution curve from 10 to 100,000 hours is illustrated in Figure 12.
Using the above methodology, life estimates were determined at each of the three weldments discussed in this paper [16]. The Keephills 1 weldment had an estimated remaining life of -4.0 operating years at 112,000 operating hours, the Keephills 2 weldment had an estimated remaining life of 1.1 operating years at 122,000 operating hours, and the Cholla 2 weldment had an estimated remaining life of -1.4 operating years at 158,000 operating hours. These estimated failure times are much more accurate than the Table 2 predicted failure times. As countermeasures, applicable spring hangers in the three piping systems were adjusted to reduce the higher bending stresses that caused the accelerated material creep damage in the weldments. CONCLUSIONS
This paper provides several examples where conventional condition and life assessment methodologies result in very optimistic piping stresses and consequently, nonconservative creep rupture times. The paper also provides methodologies to estimate more realistic stresses and creep rupture estimates. These methodologies include the documentation of significant piping system field anomalies and clearly documented spring hanger position indicator values. As-found piping system evaluations should be used to simulate and evaluate the observed field
7 Copyright © 2013 by ASME
conditions. The evaluation of time-dependent multiaxial weldment stresses (including through-wall effects) is more accurate than conventional techniques in ranking creep rupture times and selecting critical girth weld examination locations.
Piping stresses should be estimated and ranked as accurately as possible to identify many critical examination locations, because the large variation of piping system stresses may dominate the steady state creep damage. An AIM methodology is recommended to maintain safe function of the piping system and reliable operation throughout the expected life with minimal inspection and maintenance costs. ACKNOWLEDGMENTS
The support of Intertek AIM is greatly appreciated and acknowledged. REFERENCES [1] Anderson, S. A., 2007, “A Question of Integrity,”
Hydrocarbon Engineering, May 2007. [2] Paterson, S. R., Cronin, M. T., and Gialdini, R. J.,
2012, “Early Service Life Cracking of Steam Piping Welds in Combined Cycle Power Plants,” International Conference on Advances in Condition and Remaining Life Assessment for Fossil Power Plants – Coal, Gas, and HRSG,” October 2012, Hilton Head, South Carolina, USA.
[3] Larson, F. R., and Miller, J., 1952, “A Time-Temperature Relationship for Rupture and Creep Stresses,” Transactions of the American Society of Mechanical Engineers, Vol. 74, pp. 756-775.
[4] NRIM, 1997, “Data Sheets on the Elevated Temperature Properties of Normalized and Tempered 2-1/4Cr-1Mo Steel Plates for Boilers and Pressure Vessels (SCMV 4 NT),” NRIM Data Sheet No. 11B, National Research Institute for Metals, Tokyo, Japan.
[5] ASME, 2012, “ASME B31.1-2012 Edition, Power Piping,” ASME Code for Pressure Piping, B31, An American National Standard, The American Society of Mechanical Engineers, New York., NY.
[6] Tresca, H. 1864, “Mémoire sur l’écoulement des corps solides soumis a de fortes pressions,” Comptes rendus de l’Academie des Sciences, Paris, 59 (1864), p. 754-758.
[7] Tresca, H. 1868, “Mémoire sur l’écoulement des corps solides,” Mémoires Par Divers Savants, 18 (1968), p. 733; 20 (1972), pp. 75-135.
[8] Rankine, W., 1857, “On the Stability of Loose Earth,” Philosophical Transactions of the Royal Society of London, Vol. 147.
[9] Cohn, M. J., 2012, “Comparison of ASME B31.1 Sustained Load Stresses to Corresponding Tresca Stresses,” Proceedings of PVP2012, 2012 ASME
Pressure Vessels and Piping Conference, July 2012, Toronto, Canada.
[10] Cohn, M. J., 2006, “Life Management Projects for Three Main Steam Piping Systems,” EPRI International Conference on Advances in Condition and Remaining Life Assessment for Fossil Power Plants, October 2006, Louisville, Kentucky.
[11] EPRI Product 1012201, June 2007, “Fossil Plant High Energy Piping Damage: Theory and Practice, Volume 1: Piping Fundamentals,” Electric Power Research Institute, p. 8-5.
[12] Antaki, G.., 2005, Fitness-for-Service and Integrity of Piping, Vessels, and Tanks, McGraw-Hill, p. 347.
[13] Payten, W. M., Snowden, K. U., and Bendeich, P., 2009, “The Use of a Simplified Analytical Expression for Metastable Thermal Stress Analysis and its Application to Creep-Fatigue Damage of a 2.25Cr 1Mo Thick Walled Component,” International Journal of Fatigue, 32 (2010) pp. 368-375.
[14] Penny, R. K., and Marriott, D. L., 1995, Design for Creep, Chapman and Hall, Second Edition, p. 118.
[15] Boyle, J. T., and Spence, J., 1983, Stress Analysis for Creep, Butterworths, p. 110.
[16] Cohn, M. J., 2011, “Main Steam Piping Creep Life Consumption in Circumferential Welds,” Proceedings of PVP2011, 2011 ASME Pressure Vessels and Piping Conference, July 2011, Baltimore, Maryland, USA.
[17] API 579-1/ASME FFS-1, 2007,Second Edition, June 2007, Table F.31.
[18] Cohn, M. J., 2001, “The TransAlta High-Energy Piping Program – a Five-Year History,” Journal of Pressure Vessel Technology, Vol. 123, pp. 65-69.
[19] Lamé 1852, “Lecons sur la théorie … de l’élasticité,” Gauthier-Villars, Paris.
[20] Bailey, R. W., 1956, “ Creep Relationships and Their Application to Pipes, Tubes, and Cylindrical Parts Under Internal Pressure,” Proceeding, Institute of the Mechanical Engineers, 164.
[21] Cohn, M. J., and Paterson, S.R., 2012, “Fitness for Service of Low Hardness Grade 91 Pipe,” European Technology Development, Cyclic Operation of Power Plants, November, 2012.
[22] Cohn, M. J., 2010, “Estimating Main Steam Circumferential Weldment Creep Life Consumption,” Materials at High Temperatures,” 27(3) pp. 227-231.
[23] Norton, F. H., 1929, Creep of Steel at High Temperatures, McGraw-Hill, New York, p.67.
8 Copyright © 2013 by ASME
Table 1
CHOLLA AND KEEPHILLS HOOP STRESS VALUES (42.2 MPa = 6.12 ksi; 51.8 MPa = 7.52 ksi)
Table 2
CHOLLA AND KEEPHILLS – ACTUAL VS PREDICTED HOOP STRESS FAILURE TIMES
MDF REF-1 REF-2 Plant/Unit (ksi) (ksi) (ksi) Keephills/1 7.52 7.46 6.46 Keephills/2 7.21 7.14 6.19
Cholla/2 7.12 7.06 6.12
Actual Failure Predicted Failure Times Time MDF REF-1 REF-2
Plant/Unit (hrs/1000) (hrs/1000) (hrs/1000) (hrs/1000) Keephills/1 112 216 228 556 Keephills/2 122 280 297 724
Cholla/2 158 304 319 778

9 Copyright © 2013 by ASME
Figure 1. Broken Snubber Shaft.
Figure 2. Variable Spring Hangers MS-6 and HR-6, Normal View.

10 Copyright © 2013 by ASME
Figure 3A. Hanger MS-6, Off-line. Figure 3B. Hanger MS-6, On-line.
11 Copyright © 2013 by ASME
Figure 4A. Hanger HR-6, Off-line. Figure 4B. Hanger HR-6, On-line.
12 Copyright © 2013 by ASME
Figure 5A. NRIM Stress Rupture Curves for 2-1/4Cr 1Mo Material.
Figure 5B. NRIM Stress Rupture Curves for 2-1/4Cr 1Mo Material Versus Range of Piping Stresses.

13 Copyright © 2013 by ASME
Figure 6. As-designed Piping Displacement Profile Diagram
Figure 7. As-found Piping Displacement Profile Diagram
14 Copyright © 2013 by ASME
Figure 8. Circumferential Stress Due to Pressure – Elastic and Inelastic.
Figure 9. Axial Stress Due to Pressure – Elastic and Inelastic.

15 Copyright © 2013 by ASME
Figure 10. Weld A - Wall Thickness versus Life.
Figure 11. Weld B - Wall Thickness versus Life.
16 Copyright © 2013 by ASME
Figure 12. Weldment Effective Stress Redistribution Curve

601 West California Avenue Sunnyvale, CA 94086 Phone: 408.745.7000
Fax 408.734.0445
16100 Cairnway Drive, Suite 310 Houston, TX 77084
Phone: 832.593.0550 Fax: 832.593.0551
Toll Free: 800.568.3201
Intertek AIM
139, 11215 Jasper Avenue Edmonton, AB T5K 0L5
Canada Phone: 780.669.2869
Fax: 780.669.2509
Offices
www.intertek.com/aim
View publication statsView publication stats