Embed Size (px)
Citation preview

Asset Class Opportunities
Q2 2015
Invesco’s quarterly Asset Class Opportunities flipbook provides financial advisors compelling insights and strategies that seek to capitalize on today’s market.
We provide:
Economic and market insights
Timely asset class opportunities
Value-added tools that take you beyond the data
Easy-to-understand charts and graphs
Portfolio construction strategies for your clients
Delivering what you need
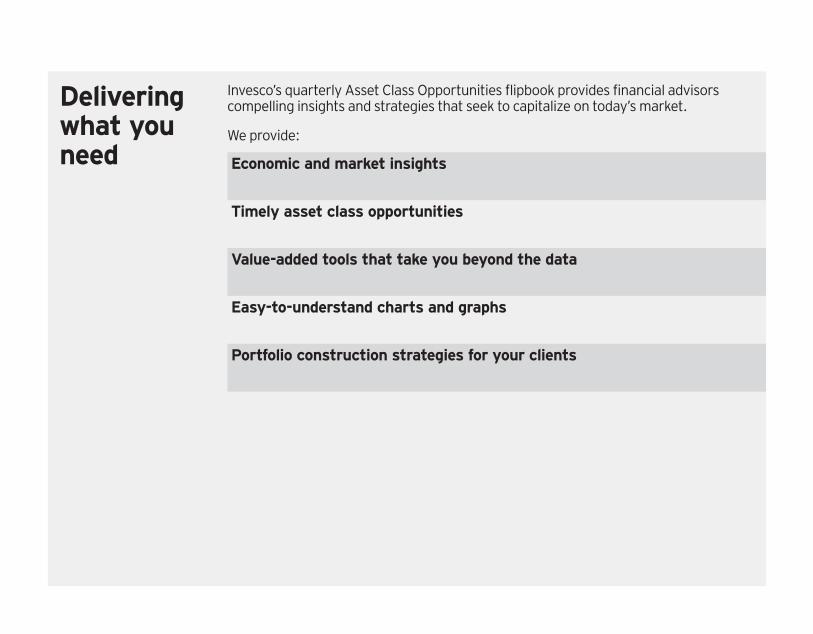
Contents Intentional Investing® with Invesco
Economic and Market Overview
Capital Growth Opportunity – Searching for value in energy
Income Opportunity – High-quality bonds may offer income and diversification potential
Alternatives Opportunity – Actively pursue investment goals with alternative opportunities
Portfolio Strategies – The compelling case for international equities
Invesco does not provide tax advice. Tax information contained herein is general in nature and is not meant to be and cannot be used by any taxpayer for the purpose of avoiding tax penalties that may be imposed on the taxpayer under US federal tax laws. Federal and state tax laws are complex and constantly changing. Investors should always consult their own legal or tax advisor for information concerning their individual situation.
Investors should consider their current and anticipated investment horizon and income tax bracket when making an investment decision.
Neither MSCI nor any other party involved in or related to compiling, computing or creating the MSCI data makes any express or implied warranties or representations with respect to such data (or the results to be obtained by the use thereof), and all such parties hereby expressly
disclaim all warranties of originality, accuracy, completeness, merchantability or fitness for a particular purpose with respect to any of such data. Without limiting any of the foregoing, in no event shall MSCI, any of its affiliates or any third party involved in or related to compiling, computing or creating the data have any liability for any direct, indirect, special, punitive, consequential or any other damages (including lost profits) even if notified of the possibility of such damages. No further distribution or dissemination of the MSCI data is permitted without MSCI’s express written consent.
Standard & Poor’s, S&P, S&P 500 and Dividend Aristocrats are registered trademarks of Standard & Poor’s Financial Services LLC (“S&P”), a wholly owned subsidiary of The McGraw-Hill Companies, Inc. Standard & Poor’s Investment Advisory Services LLC (“SPIAS”) is a registered investment advisor and a wholly owned subsidiary of The McGraw-Hill Companies, Inc. SPIAS reviews the Invesco Capital Markets, Inc.’s (formerly
Van Kampen Funds, Inc.) investment selections for the S&P Dividend Sustainability Portfolio. SPIAS does not provide advice to underlying clients of the firms to which it provides services. SPIAS does not act as a “fiduciary” or as an “investment manager”, as defined under ERISA, to any investor. SPIAS is not responsible for client suitability. Past performance is not a guarantee of future results.
SPIAS, S&P and their affiliates do not sponsor, endorse, sell, promote or manage any investment fund or other vehicle that is offered by third parties and that seeks to provide an investment return based on a SPIAS investment strategy or the constituents or the returns of any index. SPIAS, S&P and their affiliates make no representation regarding the advisability of investing in any such investment fund or other vehicle. With respect to recommendations made by SPIAS, investors should realize that such information is provided only as a general guideline. SPIAS does not take into account any
information about any investor or any investor’s assets when providing its services. There is no agreement or understanding whatsoever that SPIAS will provide individualized advice to any investor. SPIAS does not have any discretionary authority or control with respect to purchasing or selling securities or making other investments. Individual investors should ultimately rely on their own judgment and/or the judgment of a financial advisor in making their investment decisions. There is no assurance that future dividend payouts will equal or exceed past dividend payouts. Standard & Poor’s parent company, The McGraw-Hill Companies, Inc. may be one of the constituents of the S&P 500 Dividend Aristocrats Index and may be included in the portfolio based solely on quantitative measurements.
For additional disclaimers and disclosures for SPIAS, please see http://www.standardandpoors.com/regulatory-affairs/spias/en/us.
Important information
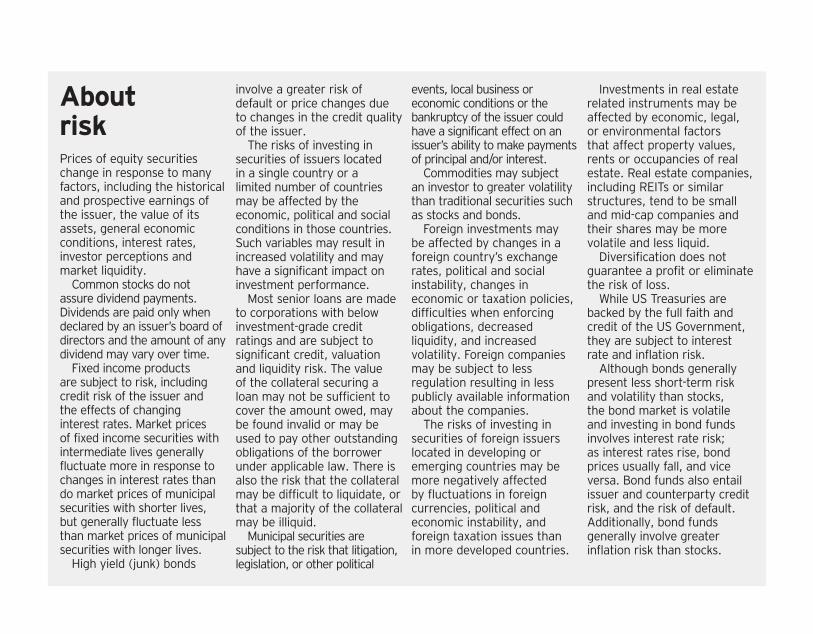
About risk Prices of equity securities change in response to many factors, including the historical and prospective earnings of the issuer, the value of its assets, general economic conditions, interest rates, investor perceptions and market liquidity.
Common stocks do not assure dividend payments. Dividends are paid only when declared by an issuer’s board of directors and the amount of any dividend may vary over time.
Fixed income products are subject to risk, including credit risk of the issuer and the effects of changing interest rates. Market prices of fixed income securities with intermediate lives generally fluctuate more in response to changes in interest rates than do market prices of municipal securities with shorter lives, but generally fluctuate less than market prices of municipal securities with longer lives.
High yield (junk) bonds
involve a greater risk of default or price changes due to changes in the credit quality of the issuer.
The risks of investing in securities of issuers located in a single country or a limited number of countries may be affected by the economic, political and social conditions in those countries. Such variables may result in increased volatility and may have a significant impact on investment performance.
Most senior loans are made to corporations with below investment-grade credit ratings and are subject to significant credit, valuation and liquidity risk. The value of the collateral securing a loan may not be sufficient to cover the amount owed, may be found invalid or may be used to pay other outstanding obligations of the borrower under applicable law. There is also the risk that the collateral may be difficult to liquidate, or that a majority of the collateral may be illiquid.
Municipal securities are subject to the risk that litigation, legislation, or other political
events, local business or economic conditions or the bankruptcy of the issuer could have a significant effect on an issuer’s ability to make payments of principal and/or interest.
Commodities may subject an investor to greater volatility than traditional securities such as stocks and bonds.
Foreign investments may be affected by changes in a foreign country’s exchange rates, political and social instability, changes in economic or taxation policies, difficulties when enforcing obligations, decreased liquidity, and increased volatility. Foreign companies may be subject to less regulation resulting in less publicly available information about the companies.
The risks of investing in securities of foreign issuers located in developing or emerging countries may be more negatively affected by fluctuations in foreign currencies, political and economic instability, and foreign taxation issues than in more developed countries.
Investments in real estate related instruments may be affected by economic, legal, or environmental factors that affect property values, rents or occupancies of real estate. Real estate companies, including REITs or similar structures, tend to be small and mid-cap companies and their shares may be more volatile and less liquid.
Diversification does not guarantee a profit or eliminate the risk of loss.
While US Treasuries are backed by the full faith and credit of the US Government, they are subject to interest rate and inflation risk.
Although bonds generally present less short-term risk and volatility than stocks, the bond market is volatile and investing in bond funds involves interest rate risk; as interest rates rise, bond prices usually fall, and vice versa. Bond funds also entail issuer and counterparty credit risk, and the risk of default. Additionally, bond funds generally involve greater inflation risk than stocks.

Energy stocks may be adversely affected by foreign, federal or state regulations governing energy production, distribution and sale as well as supply-and-demand for energy resources.
A value style of investing is subject to the risk that the valuations never improve or that the returns will trail other styles of investing or the overall stock markets.
Short sales may cause an investor to repurchase a security at a higher price, causing a loss. As there is no limit on how much the price of a security can increase, exposure to potential loss is limited.
The opinions expressed are those of the author, are based on current market conditions and are subject to change without notice. These opinions may differ from those of other Invesco investment professionals.
There is no guarantee any outlooks mentioned will come to pass. Past performance cannot guarantee comparable future results.
About risk
BarclayHedge Currency Traders Index is an equal weighted composite of managed programs that trade currency futures and/or cash forwards in the inter-bank market.
BarclayHedge Equity Market Neutral Index includes funds that attempt to exploit equity market inefficiencies and usually involves being simultaneously long and short matched equity portfolios of the same size within a country. Market neutral portfolios are designed to be either beta or currency neutral, or both. Well-designed portfolios typically control for industry, sector, market capitalization, and other exposures. Leverage is often applied to enhance returns. Only funds that provide net returns are included in the index calculation.
BarclayHedge Fixed Income Arbitrage Index includes funds that aim to profit from price anomalies
between related interest rate securities. Most managers trade globally with a goal of generating steady returns with low volatility. This category includes interest rate swap arbitrage, US and non-US government bond arbitrage and forward yield curve arbitrage. Only funds that provide net returns are included in the index calculation.
BarclayHedge Global Macro Index includes funds that carry long and short positions in any of the world’s major capital or derivative markets. These positions reflect their views on overall market direction as influenced by major economic trends and or events. The portfolios of these funds can include stocks, bonds, currencies, and commodities in the form of cash or derivatives instruments. Most funds invest globally in both developed and emerging markets. Only funds that provide net returns are included in the index calculation.
BarclayHedge Long/Short Index includes funds employ a directional strategy involving equity-oriented investing on
both the long and short sides of the market. The objective is not to be market neutral. Managers have the ability to shift from value to growth, from small to medium to large capitalization stocks, and from a net long position to a net short position. Managers may use futures and options to hedge. The focus may be regional or sector specific. Only funds that provide net returns are included in the index calculation.
BarclayHedge Multi Strategy Index includes funds that are characterized by their ability to dynamically allocate capital among strategies falling within several traditional hedge fund disciplines. The use of many strategies, and the ability to reallocate capital between them in response to market opportunities, means that such funds are not easily assigned to any traditional category. Only funds that provide net returns are included in the index calculation.
Barclays Corporate Bond Index is an unmanaged index considered representative of
publicly issued US corporate and specified foreign debentures and secured notes that meet the specified maturity, liquidity, and quality requirements. To qualify, bonds must be SEC-registered.
Barclays Global Aggregate Credit USD Hedged Index is an unmanaged portfolio of globally issued debt securities.
Barclays Global Aggregate ex-U.S. Index is an unmanaged index considered representative of bonds of foreign countries.
Barclays Global High Yield USD Hedged Index provides a broad-based measure of the global high-yield fixed income markets.
Barclays Municipal Bond Index is an unmanaged index considered representative of the tax-exempt bond market.
Barclays Municipal Bond High Yield Index is generally representative of bonds that are non-investment grade, unrated or rated below Ba1.
Barclays U.S. Aggregate Index is an unmanaged index considered representative of the US investment-grade, fixed-rate bond market.
Index definitions
Barclays U.S. Corporate High Yield Index is representative of the universe of fixed-rate, non-investment grade debt.
Barclays U.S. Corporate Investment Grade Index is an unmanaged index consisting of publicly issued U.S. Corporate and specified foreign debentures and secured notes that are rated investment grade (Baa3/BBB- or higher) by at least two ratings agencies, have at least one year to final maturity and have at least $250 million par amount outstanding.
Barclays U.S. Government Bond Index is a market value weighted index of US Government and government agency securities (other than mortgage securities) with maturities of one year or more.
Barclays U.S. High Yield 2% Issuer Cap Index is an unmanaged index that tracks the performance of U.S. non-investment grade bonds and limits each issuer to 2% of the index.
Barclays U.S. TIPS Index is an unmanaged index that measures the performance
of the US Treasury Inflation Protected Securities (“TIPS”) market.
Bloomberg Commodity Index is a broadly diversified index that allows investors to track commodity futures through a single, simple measure.
BofA Merrill Lynch All Convertibles All Qualities Index is a total return index composed of convertible securities that span all corporate sectors, have a par amount outstanding of $25 million or more, and a maturity of at least one year.
BofA Merrill Lynch Municipal 3–7 Years Index consists of bonds with an outstanding par greater than or equal to $25 million and a maturity range between three and seven years.
BofA Merrill Lynch Preferred Stock Fixed Rate Index tracks the performance of fixed rate US dollar denominated preferred securities issued in the US domestic market. Qualifying securities must have an investment grade rating and must have an investment grade rated country of risk.
Credit Suisse Leveraged Loan Index represents tradable, senior-secured, US-dollar-denominated, noninvestment-grade loans.
FTSE EPRA/NAREIT ex-U.S. Index is designed to track the performance of listed real estate companies and REITS.
FTSE EPRA/NAREIT Netherlands Index is an unmanaged index considered representative of Dutch real estate companies and REITs.
FTSE NAREIT All Equity REITs Index is an unmanaged index considered representative of US REITs.
HFN Fixed Income Arbitrage Index includes funds that attempt to exploit pricing inefficiencies between credit sensitive instruments which may include government or corporate debt, structured securities and their related derivatives.
JP Morgan GBI-Emerging Markets Diversified Index is a comprehensive global local emerging markets index, and consists of liquid, fixed-rate, domestic currency government bonds.
Morningstar Category: Intermediate-Term Bond focuses on corporate, government, foreign or other issues with an average duration of greater than or equal to 3.5 years but less than or equal to six years, or an average effective maturity of more than four years but less than 10 years.
Morningstar Category: Multi-Sector Bond funds that seek income by diversifying their assets among several fixed-income sectors, usually U.S. government obligations, foreign bonds, and high-yield domestic debt securities.
Morningstar Category: Non-Traditional Bond contains funds that pursue strategies divergent in one or more ways from conventional practice in the broader bond-fund universe. Many funds in this group describe themselves as “absolute return” portfolios, which seek to avoid losses and produce returns uncorrelated with the overall bond market; they employ a variety of methods to achieve those aims. Another large subset are self-described
“unconstrained” portfolios that have more flexibility to invest tactically across a wide swath of individual sectors, including high-yield and foreign debt, and typically with very large allocations. The category is also home to a subset of portfolios that attempt to minimize volatility by maintaining short or ultra-short duration portfolios, but explicitly court significant credit and foreign bond market risk in order to generate high returns. Funds within this category often will use credit default swaps and other fixed income derivatives to a significant level within their portfolios.
MSCI EAFE Index is an unmanaged index considered representative of stocks of Europe, Australasia and the Far East.
MSCI Emerging Markets Index is an unmanaged index considered representative of stocks of developing countries.
MSCI Europe Index is a free float-adjusted market capitalization weighted index that is designed to measure the equity market performance of the developed
markets in Europe.MSCI USA Index is a
free float adjusted market capitalization index that is designed to measure large and mid-cap US equity market performance.
MSCI World Index is an unmanaged index considered representative of stocks of developed countries.
Russell 1000 Index is an unmanaged index considered representative of large-cap stocks.
Russell 1000 Growth Index is an unmanaged index considered representative of large-cap growth stocks.
Russell 1000 Value Index is an unmanaged index considered representative of large-cap value stocks.
Russell 2000 Index is an unmanaged index considered representative of small-cap stocks.
Russell Midcap Index is an unmanaged index considered representative of mid-cap stocks.
S&P 500 Index is an unmanaged index considered representative of the US stock market.
S&P 500 Dividend Aristocrats Index measure the performance of S&P 500 companies that have increased dividends every year for the last 25 consecutive years.
S&P 500 Pure Value Index measures value in separate dimensions across six risk factors. Value factors include book value to price ratio, earnings to price ratio, and sales to price ratio. The Pure Style Index only includes those stocks from the parent index that exhibit strong Value Characteristics, and weights them by style score.
S&P/LSTA Leveraged Loan Index is a weekly total return index that tracks the current outstanding balance and spread over Libor for fully funded term loans.
The Russell Indices are trademarks/service marks of the Frank Russell Co. Russell® is a trademark of the Frank Russell Co.
Unmanaged index returns do not reflect fees, expenses, or sales charges. An investment cannot be made directly in an index.
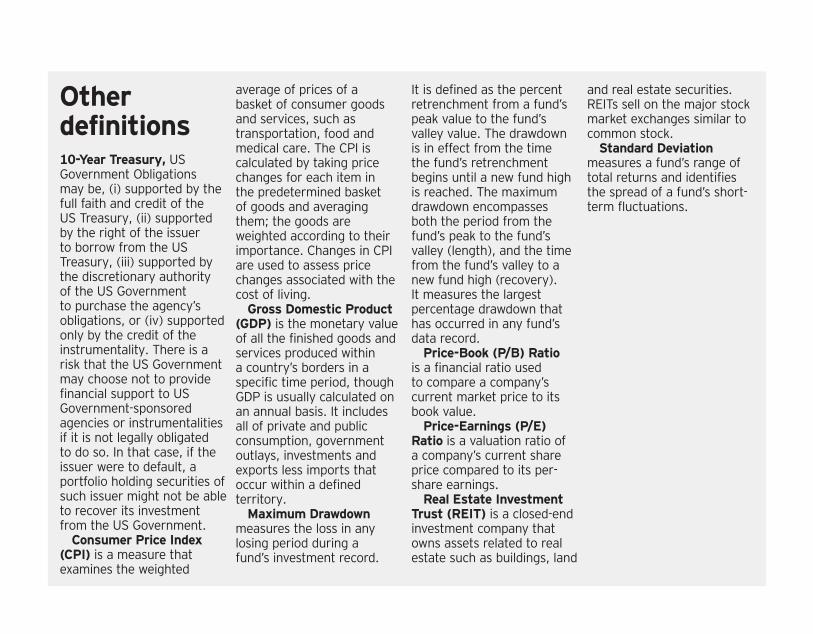
10-Year Treasury, US Government Obligations may be, (i) supported by the full faith and credit of the US Treasury, (ii) supported by the right of the issuer to borrow from the US Treasury, (iii) supported by the discretionary authority of the US Government to purchase the agency’s obligations, or (iv) supported only by the credit of the instrumentality. There is a risk that the US Government may choose not to provide financial support to US Government-sponsored agencies or instrumentalities if it is not legally obligated to do so. In that case, if the issuer were to default, a portfolio holding securities of such issuer might not be able to recover its investment from the US Government.
Consumer Price Index (CPI) is a measure that examines the weighted
average of prices of a basket of consumer goods and services, such as transportation, food and medical care. The CPI is calculated by taking price changes for each item in the predetermined basket of goods and averaging them; the goods are weighted according to their importance. Changes in CPI are used to assess price changes associated with the cost of living.
Gross Domestic Product (GDP) is the monetary value of all the finished goods and services produced within a country’s borders in a specific time period, though GDP is usually calculated on an annual basis. It includes all of private and public consumption, government outlays, investments and exports less imports that occur within a defined territory.
Maximum Drawdown measures the loss in any losing period during a fund’s investment record.
It is defined as the percent retrenchment from a fund’s peak value to the fund’s valley value. The drawdown is in effect from the time the fund’s retrenchment begins until a new fund high is reached. The maximum drawdown encompasses both the period from the fund’s peak to the fund’s valley (length), and the time from the fund’s valley to a new fund high (recovery). It measures the largest percentage drawdown that has occurred in any fund’s data record.
Price-Book (P/B) Ratio is a financial ratio used to compare a company’s current market price to its book value.
Price-Earnings (P/E) Ratio is a valuation ratio of a company’s current share price compared to its per-share earnings.
Real Estate Investment Trust (REIT) is a closed-end investment company that owns assets related to real estate such as buildings, land
and real estate securities. REITs sell on the major stock market exchanges similar to common stock.
Standard Deviation measures a fund’s range of total returns and identifies the spread of a fund’s short-term fluctuations.
Other definitions
Intentional Investing with Invesco
Intentional Investing with Invesco | Q2 2015 1invesco.com/flipbook
Source: Invesco as of Dec. 31, 2014. Please consult your Invesco representative for more information.
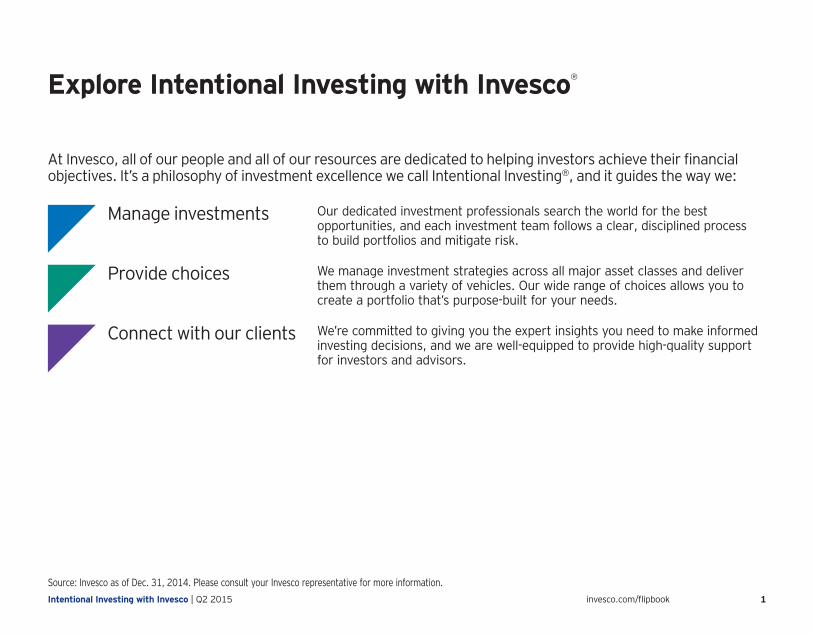
Explore Intentional Investing with Invesco®
At Invesco, all of our people and all of our resources are dedicated to helping investors achieve their financial objectives. It’s a philosophy of investment excellence we call Intentional Investing®, and it guides the way we:
Manage investments Our dedicated investment professionals search the world for the best opportunities, and each investment team follows a clear, disciplined process to build portfolios and mitigate risk.
Provide choices We manage investment strategies across all major asset classes and deliver them through a variety of vehicles. Our wide range of choices allows you to create a portfolio that’s purpose-built for your needs.
Connect with our clients We’re committed to giving you the expert insights you need to make informed investing decisions, and we are well-equipped to provide high-quality support for investors and advisors.
Intentional Investing with Invesco | Q2 2015 2invesco.com/flipbook
Source: Invesco as of March 31, 2015. Assets under management as of Dec. 31, 2014.
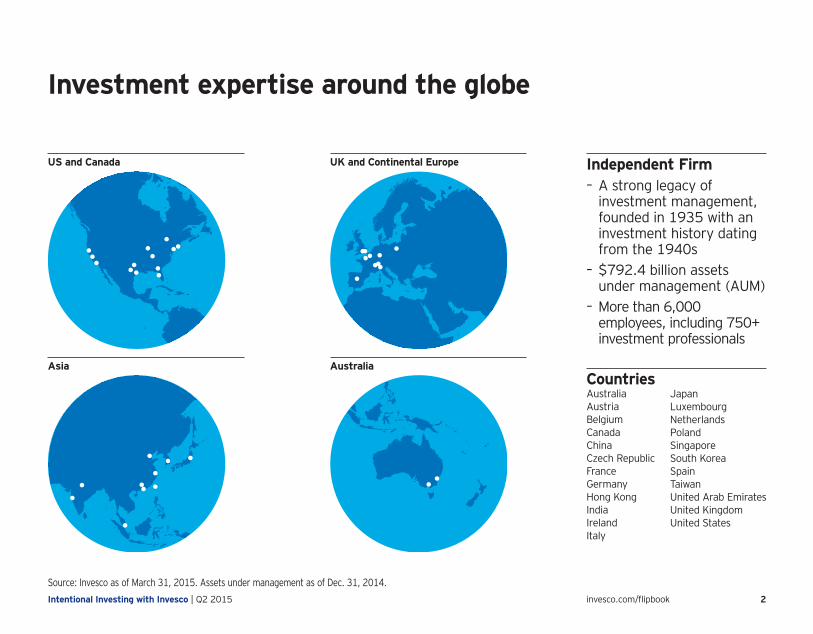
Independent Firm – A strong legacy of investment management, founded in 1935 with an investment history dating from the 1940s
– $792.4 billion assets under management (AUM)
– More than 6,000 employees, including 750+ investment professionals
Investment expertise around the globe
US and Canada
Asia
UK and Continental Europe
AustraliaCountriesAustraliaAustriaBelgiumCanadaChinaCzech RepublicFranceGermanyHong KongIndiaIrelandItaly
JapanLuxembourgNetherlandsPolandSingaporeSouth KoreaSpainTaiwanUnited Arab EmiratesUnited KingdomUnited States
Intentional Investing with Invesco | Q2 2015 3invesco.com/flipbook
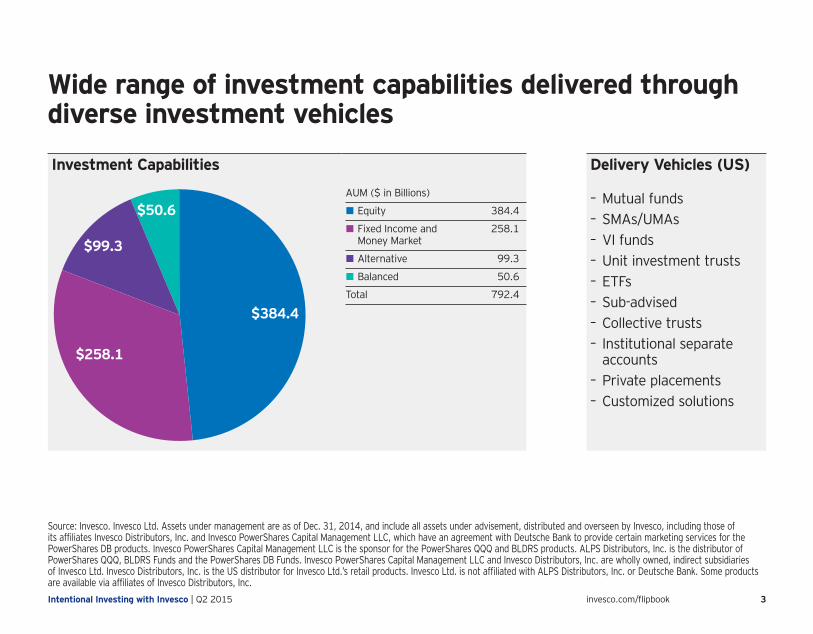
Wide range of investment capabilities delivered through diverse investment vehicles
Delivery Vehicles (US)
– Mutual funds – SMAs/UMAs – VI funds – Unit investment trusts – ETFs – Sub-advised – Collective trusts – Institutional separate accounts
– Private placements – Customized solutions
Source: Invesco. Invesco Ltd. Assets under management are as of Dec. 31, 2014, and include all assets under advisement, distributed and overseen by Invesco, including those of its affiliates Invesco Distributors, Inc. and Invesco PowerShares Capital Management LLC, which have an agreement with Deutsche Bank to provide certain marketing services for the PowerShares DB products. Invesco PowerShares Capital Management LLC is the sponsor for the PowerShares QQQ and BLDRS products. ALPS Distributors, Inc. is the distributor of PowerShares QQQ, BLDRS Funds and the PowerShares DB Funds. Invesco PowerShares Capital Management LLC and Invesco Distributors, Inc. are wholly owned, indirect subsidiaries of Invesco Ltd. Invesco Distributors, Inc. is the US distributor for Invesco Ltd.’s retail products. Invesco Ltd. is not affiliated with ALPS Distributors, Inc. or Deutsche Bank. Some products are available via affiliates of Invesco Distributors, Inc.
Investment Capabilities
$384.4
$258.1
$99.3
$50.6AUM ($ in Billions)
• Equity 384.4
• Fixed Income and 258.1 Money Market
• Alternative 99.3
• Balanced 50.6
Total 792.4
Economic and Market Overview
Asset Class Opportunities | Q2 2015 5
Economic and MarketOverview
Asset class returns
Industry fund flows
The relationship between GDP growth and equity returns
Economic and Market Overview | Q2 2015 6invesco.com/flipbook
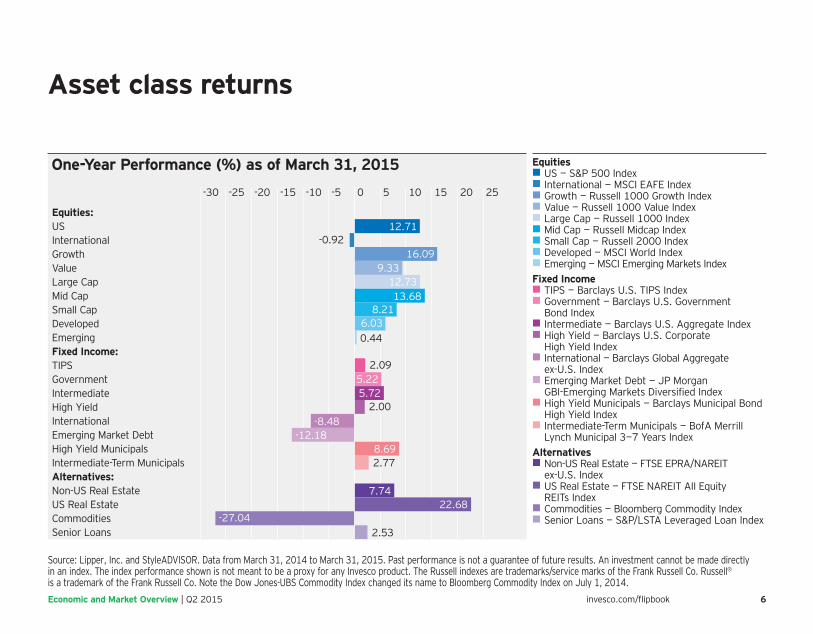
Source: Lipper, Inc. and StyleADVISOR. Data from March 31, 2014 to March 31, 2015. Past performance is not a guarantee of future results. An investment cannot be made directly in an index. The index performance shown is not meant to be a proxy for any Invesco product. The Russell indexes are trademarks/service marks of the Frank Russell Co. Russell® is a trademark of the Frank Russell Co. Note the Dow Jones-UBS Commodity Index changed its name to Bloomberg Commodity Index on July 1, 2014.
One-Year Performance (%) as of March 31, 2015
Senior LoansCommodities US Real Estate Non-US Real Estate Alternatives:Intermediate-Term MunicipalsHigh Yield MunicipalsEmerging Market DebtInternational High Yield Intermediate Government TIPS Fixed Income:Emerging Developed Small Cap Mid Cap Large Cap Value Growth International US Equities:
-30 -25 -20 -15 -10 -5 0 5 10 15 20 25
12.71
16.099.33
12.7313.68
8.216.03
5.225.72
-8.48-12.18
8.69
7.7422.68
-27.04
-0.92
0.44
2.09
2.00
2.77
2.53
Equities• US — S&P 500 Index• International — MSCI EAFE Index• Growth — Russell 1000 Growth Index• Value — Russell 1000 Value Index• Large Cap — Russell 1000 Index• Mid Cap — Russell Midcap Index• Small Cap — Russell 2000 Index• Developed — MSCI World Index• Emerging — MSCI Emerging Markets IndexFixed Income• TIPS — Barclays U.S. TIPS Index• Government — Barclays U.S. Government
Bond Index• Intermediate — Barclays U.S. Aggregate Index• High Yield — Barclays U.S. Corporate
High Yield Index• International — Barclays Global Aggregate
ex-U.S. Index• Emerging Market Debt — JP Morgan
GBI-Emerging Markets Diversified Index• High Yield Municipals — Barclays Municipal Bond
High Yield Index• Intermediate-Term Municipals — BofA Merrill
Lynch Municipal 3—7 Years IndexAlternatives• Non-US Real Estate — FTSE EPRA/NAREIT
ex-U.S. Index• US Real Estate — FTSE NAREIT AII Equity
REITs Index• Commodities — Bloomberg Commodity Index• Senior Loans — S&P/LSTA Leveraged Loan Index
Asset class returns
Economic and Market Overview | Q2 2015 7invesco.com/flipbook
Source: Strategic Insight as of March 31, 2015. Data grouped by Lipper classifications and organized into larger asset classes.
Industry fund flows
Net Flows ($ Billions) as of March 31, 2015
Q2 2014
Q3 2014
Q4 2014
Q1 2015
-60 0 20 40 60-20-40
10.94
-26.132.07
3.392.99
-2.19
4.34
9.88-22.89
9.794.73
-0.04-2.03
7.82-26.10
21.67
14.6415.61
-0.4024.15
27.06
-11.007.42
-1.2927.66
6.9239.48
9.20
• US Equity • Tax-Free Fixed Income • Taxable Fixed Income • Sector• International/Global Equity • Alternative • Allocation
Economic and Market Overview | Q2 2015 8invesco.com/flipbook
The relationship between GDP growth and equity returns
GDP consensus for 2015 is 2.9%, and growth at that level has generated positive returns 83% of the time.
Source: Bloomberg L.P. and Invesco for the period March 31, 1949 through Dec. 31, 2014.GDP consensus as of March 31, 2015Past performance is not a guarantee of future results. There is no guarantee these outlooks will come to pass.
When GDP Was %
Year-to-Year S&P 500 Index
Returns %
Range of Returns
%
Returns Positive
%
< 0 -2.21 -41/+38 54
0–2 2.26 -28/+47 46
2–3 10.69 -23/+45 83
3–4 13.89 -9/+53 83
>4 11.53 -17/+46 78

Capital Growth
Asset Class Opportunities | Q2 2015 10
Capital Growth Opportunities
Searching for value in energyValue investing may provide multiple paths to success
In a rising interest rate environment,value equities may provide various ways to outperform
Energy stocks are at their cheapest levels since 1928, on a relative basis
Capital Growth Opportunity | Q2 2015 11invesco.com/flipbook
Value investing may provide multiple paths to success
Source: Zephry and Bloomberg L.P. as of March 31, 2015. Deep Value represented by the S&P 500 Pure Value Index; Relative Value by the Russell 1000 Value Index; Dividend Value by the S&P Dividend Aristocrats Index; and Broad US Market by the S&P 500 Index. Past performance is not a guarantee of future results. An investment cannot be made directly in an index.
Value Sub-Asset Classes Historically Have Performed Well Versus the Broad MarketReturn %
2000 2001 2002 2003 2004 2005 2006 2007 2008 2009 2010 2011 2012 2013 2014
13.16 10.87 -9.87 41.71 26.13 13.43 22.25 5.49 -21.88 55.20 23.06 8.33 25.59 48.11 15.76
10.13 10.82 -15.52 30.03 16.49 7.05 20.04 -0.17 -36.85 26.56 19.35 2.11 17.51 32.53 13.69
7.02 -5.59 -17.74 28.68 15.46 4.91 17.30 -2.07 -37.00 26.46 15.51 0.39 16.94 32.39 13.45
-9.11 -11.88 -22.10 25.37 10.88 3.69 15.79 -3.69 -47.87 19.69 15.06 -0.81 16.00 32.27 12.69
• Deep Value • Dividend Value• Relative Value • Broad US Market
Deep Value Dividend Value Relative Value
Invest in companies at a significant discount to their underlying value before the market recognizes the opportunity.
Invest in undervalued, but financially sound companies that pay a consistent or growing dividend.
Invest in companies at a discount to their historical average price.
Capital Growth Opportunity | Q2 2015 12invesco.com/flipbook
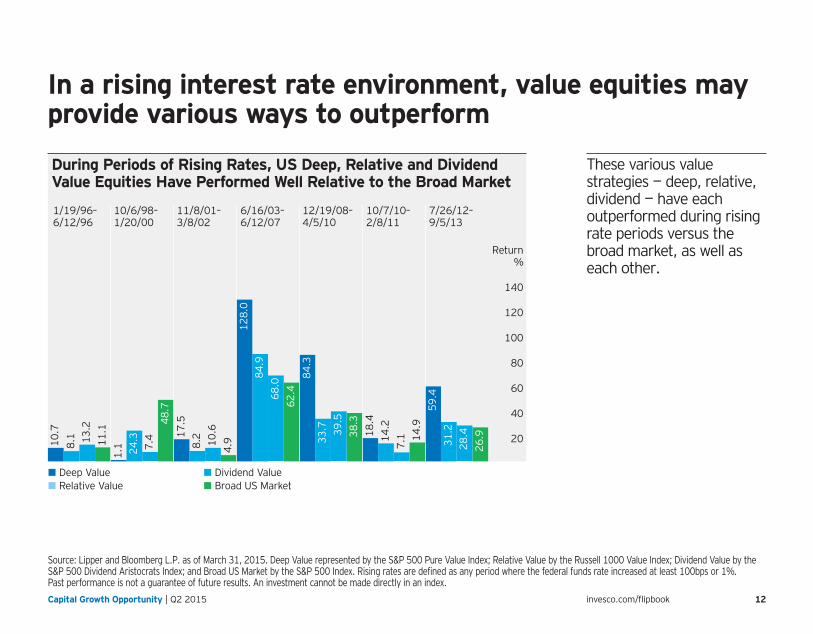
In a rising interest rate environment, value equities may provide various ways to outperform
These various value strategies — deep, relative, dividend — have each outperformed during rising rate periods versus the broad market, as well as each other.
During Periods of Rising Rates, US Deep, Relative and Dividend Value Equities Have Performed Well Relative to the Broad Market
20
40
140
120
100
80
60
10/6/98–1/20/00
11/8/01– 3/8/02
6/16/03–6/12/07
12/19/08–4/5/10
10/7/10–2/8/11
7/26/12–9/5/13
1/19/96–6/12/96
10.7
1.1
17.5
128.
0
84.3
18.4
59.4
8.1
8.2 33
.7
14.2
31.2
24.3
84.9
13.2
7.4 10
.6
68.0
39.5
7.1
28.4
11.1
4.9
62.4
38.3
14.9
26.9
48.7
Return%
• Deep Value • Dividend Value• Relative Value • Broad US Market
Source: Lipper and Bloomberg L.P. as of March 31, 2015. Deep Value represented by the S&P 500 Pure Value Index; Relative Value by the Russell 1000 Value Index; Dividend Value by the S&P 500 Dividend Aristocrats Index; and Broad US Market by the S&P 500 Index. Rising rates are defined as any period where the federal funds rate increased at least 100bps or 1%. Past performance is not a guarantee of future results. An investment cannot be made directly in an index.
Capital Growth Opportunity | Q2 2015 13invesco.com/flipbook
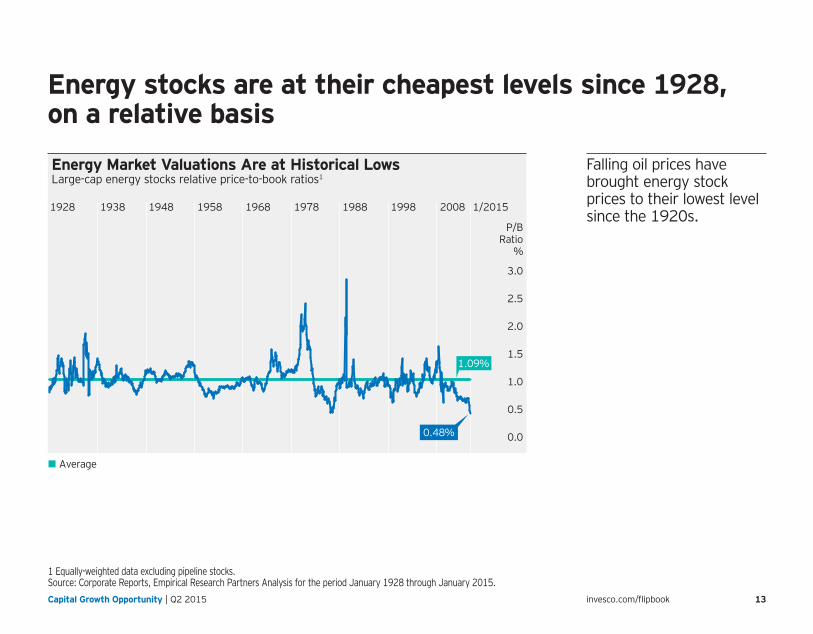
Energy stocks are at their cheapest levels since 1928, on a relative basis
1 Equally-weighted data excluding pipeline stocks.Source: Corporate Reports, Empirical Research Partners Analysis for the period January 1928 through January 2015.
Energy Market Valuations Are at Historical LowsLarge-cap energy stocks relative price-to-book ratios1
P/BRatio
%
0.48%
1.09%
1/20151928 1938 1948 1958 1968 1978 1988 1998 2008
0.0
3.0
0.5
1.0
1.5
2.0
2.5
• Average
Falling oil prices have brought energy stock prices to their lowest level since the 1920s.

Income
Asset Class Opportunities | Q2 2015 15
Diversification does not guarantee a profit or eliminate the risk of loss.
Income Opportunity High-quality bonds may offer income and diversification potentialVolatility of returns across fixed income may support maintaining a diversified allocation
Investors turning to non-traditional and multi-sector bond funds for income to combat potentially rising rates
High-quality, intermediate-term bonds may help balance risk while providing income and growth opportunities
Investors can potentially balance market volatility without sacrificing income using high-quality bonds
Income Opportunity | Q2 2015 16invesco.com/flipbook
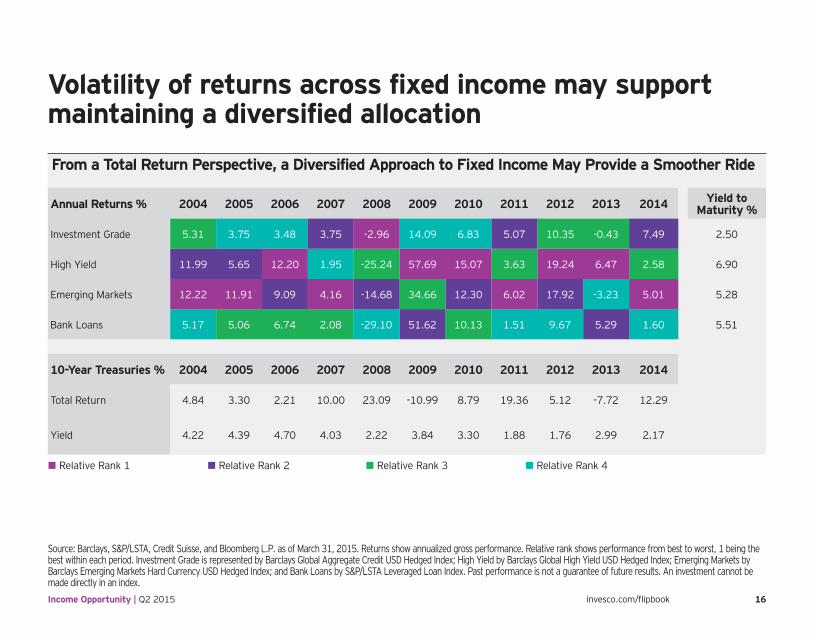
Volatility of returns across fixed income may supportmaintaining a diversified allocation
Source: Barclays, S&P/LSTA, Credit Suisse, and Bloomberg L.P. as of March 31, 2015. Returns show annualized gross performance. Relative rank shows performance from best to worst, 1 being the best within each period. Investment Grade is represented by Barclays Global Aggregate Credit USD Hedged Index; High Yield by Barclays Global High Yield USD Hedged Index; Emerging Markets by Barclays Emerging Markets Hard Currency USD Hedged Index; and Bank Loans by S&P/LSTA Leveraged Loan Index. Past performance is not a guarantee of future results. An investment cannot be made directly in an index.
From a Total Return Perspective, a Diversified Approach to Fixed Income May Provide a Smoother Ride
Annual Returns % 2004 2005 2006 2007 2008 2009 2010 2011 2012 2013 2014 Yield to Maturity %
Investment Grade 5.31 3.75 3.48 3.75 -2.96 14.09 6.83 5.07 10.35 -0.43 7.49 2.50
High Yield 11.99 5.65 12.20 1.95 -25.24 57.69 15.07 3.63 19.24 6.47 2.58 6.90
Emerging Markets 12.22 11.91 9.09 4.16 -14.68 34.66 12.30 6.02 17.92 -3.23 5.01 5.28
Bank Loans 5.17 5.06 6.74 2.08 -29.10 51.62 10.13 1.51 9.67 5.29 1.60 5.51
10-Year Treasuries % 2004 2005 2006 2007 2008 2009 2010 2011 2012 2013 2014
Total Return 4.84 3.30 2.21 10.00 23.09 -10.99 8.79 19.36 5.12 -7.72 12.29
Yield 4.22 4.39 4.70 4.03 2.22 3.84 3.30 1.88 1.76 2.99 2.17
• Relative Rank 1 • Relative Rank 2 • Relative Rank 3 • Relative Rank 4
Income Opportunity | Q2 2015 17invesco.com/flipbook
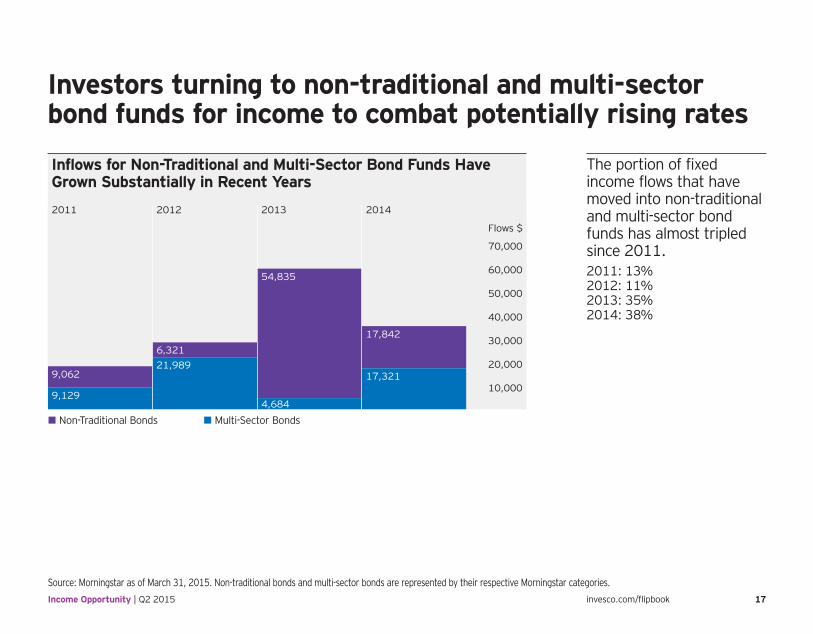
Investors turning to non-traditional and multi-sector bond funds for income to combat potentially rising rates
Source: Morningstar as of March 31, 2015. Non-traditional bonds and multi-sector bonds are represented by their respective Morningstar categories.
Inflows for Non-Traditional and Multi-Sector Bond Funds Have Grown Substantially in Recent Years
9,062
9,129
6,321
21,989
54,835
4,684
17,842
17,321
2011 2012 2013 2014
Flows $
10,000
20,000
30,000
40,000
50,000
60,000
70,000
• Non-Traditional Bonds • Multi-Sector Bonds
The portion of fixed income flows that have moved into non-traditional and multi-sector bond funds has almost tripled since 2011.2011: 13% 2012: 11% 2013: 35% 2014: 38%
Income Opportunity | Q2 2015 18invesco.com/flipbook
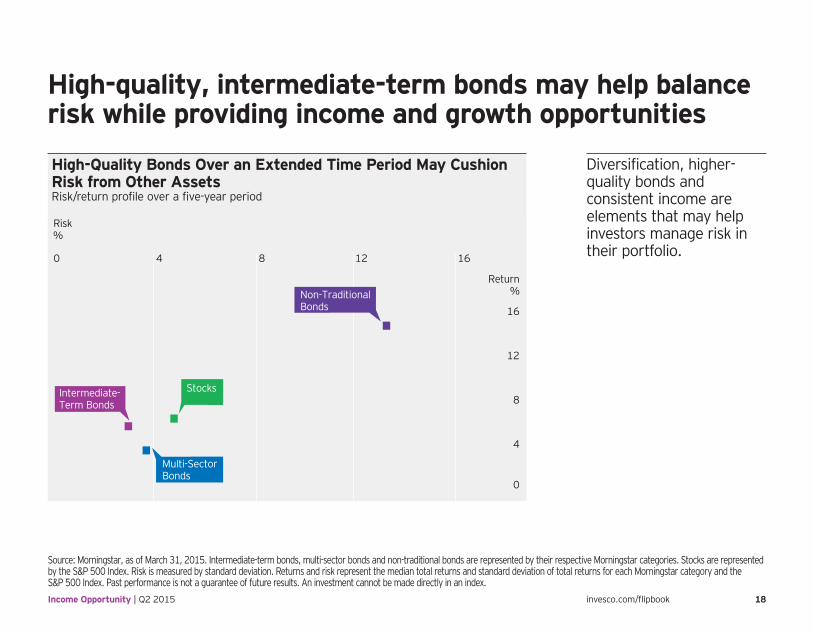
High-quality, intermediate-term bonds may help balance risk while providing income and growth opportunities
Source: Morningstar, as of March 31, 2015. Intermediate-term bonds, multi-sector bonds and non-traditional bonds are represented by their respective Morningstar categories. Stocks are represented by the S&P 500 Index. Risk is measured by standard deviation. Returns and risk represent the median total returns and standard deviation of total returns for each Morningstar category and the S&P 500 Index. Past performance is not a guarantee of future results. An investment cannot be made directly in an index.
High-Quality Bonds Over an Extended Time Period May Cushion Risk from Other AssetsRisk/return profile over a five-year period
Intermediate-Term Bonds
Multi-SectorBonds
Non-TraditionalBonds
Stocks
0 4 8 12 16
0
4
8
12
16
Return%
Risk%
Diversification, higher-quality bonds and consistent income are elements that may help investors manage risk in their portfolio.
Income Opportunity | Q2 2015 19invesco.com/flipbook
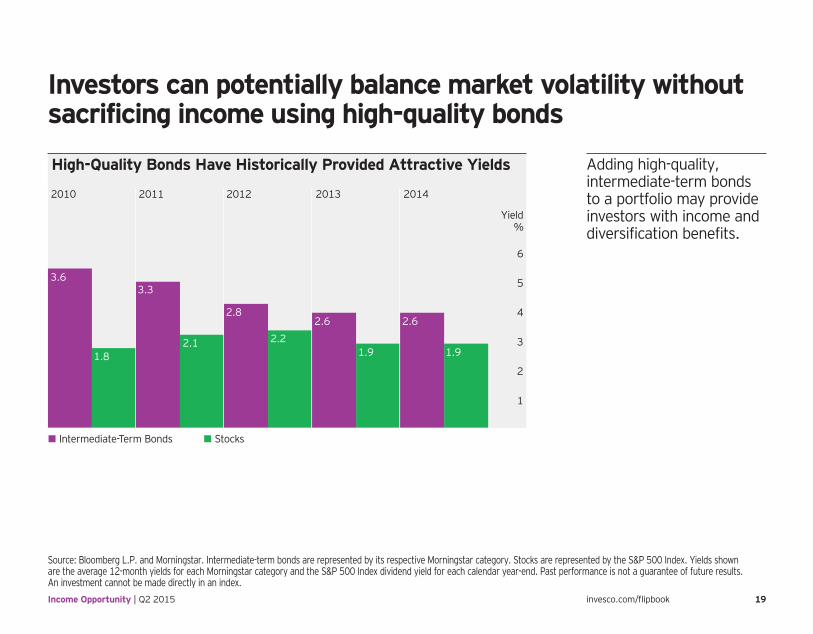
Investors can potentially balance market volatility without sacrificing income using high-quality bonds
Source: Bloomberg L.P. and Morningstar. Intermediate-term bonds are represented by its respective Morningstar category. Stocks are represented by the S&P 500 Index. Yields shown are the average 12-month yields for each Morningstar category and the S&P 500 Index dividend yield for each calendar year-end. Past performance is not a guarantee of future results. An investment cannot be made directly in an index.
Adding high-quality, intermediate-term bonds to a portfolio may provide investors with income and diversification benefits.
High-Quality Bonds Have Historically Provided Attractive Yields
1
2
6
5
4
3
2010 2011 2012 20142013
Yield%
3.6
2.82.6 2.6
3.3
1.82.1 2.2
1.9 1.9
• Intermediate-Term Bonds • Stocks

Alternatives
Asset Class Opportunities | Q2 2015 21
Alternatives Opportunity
Actively pursue investment goals with alternative opportunitiesKey investment objectives may be achieved by incorporating alternatives into a portfolio
Alternative investments have been a core part of institutional and high-net-worth portfolios
In recent market cycles, alternatives have helped investors generate return and manage volatility
Alternatives have performed well relative to other asset classes in different market cycles

Alternative products typically hold more non-traditional investments and employ more complex trading strategies, including hedging and leveraging through derivatives, short selling and opportunistic strategies that change with market conditions. Investors considering alternatives should be aware of their unique characteristics and additional risks from the strategies they use. Like all investments, performance will fluctuate. You can lose money.
Alternatives are investments that do not fall into the three classic assets types of stocks, bonds and cash. Alternatives fall into non-traditional asset types such as commodities, currencies, real estate and any securities that aren’t traded on the open market. Alternatives also include investments that incorporate
non-traditional features such as long/short investing.
The differences between retail investors and institutional investors dictate not only the size of the trades they make, but also the types of companies and financial instruments in which they invest their monies. “Retail investors” is synonymous with “individual investors” who buy and sell securities for their personal account(s) and not for another company or organization. Retail investors buy in much smaller quantities than larger institutional investors.” Institutional investors are large, sophisticated investors that buy and sell securities for their investment portfolios. In contrast to retail investors, institutional investors engage in large block trades. Institutional investors have numerous advantages including access to more securities and the ability to negotiate trading fees and the guarantee of best price and execution.
About risk
Alternatives Opportunity | Q2 2015 23invesco.com/flipbook
Source: Invesco as of March 31, 2015.
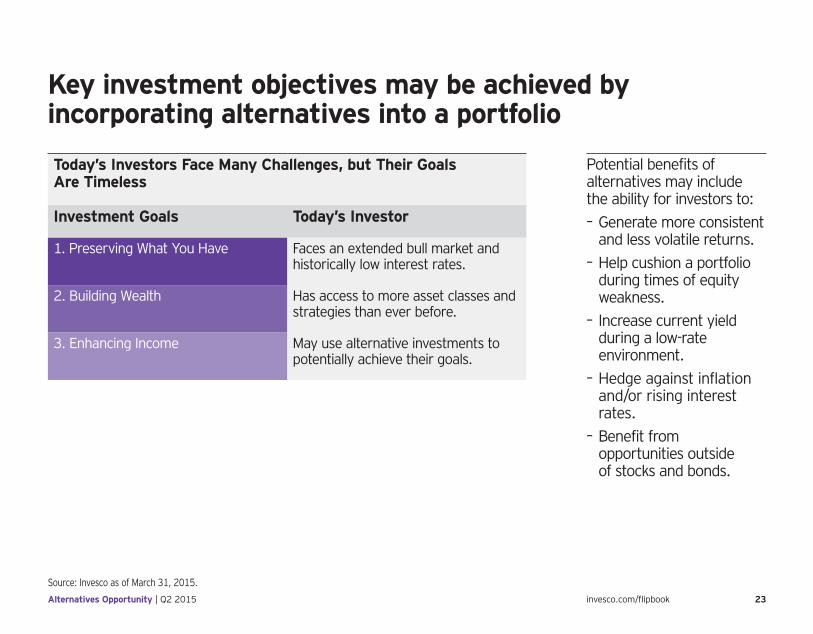
Key investment objectives may be achieved by incorporating alternatives into a portfolio
Potential benefits of alternatives may include the ability for investors to: – Generate more consistent and less volatile returns.
– Help cushion a portfolio during times of equity weakness.
– Increase current yield during a low-rate environment.
– Hedge against inflation and/or rising interest rates.
– Benefit from opportunities outside of stocks and bonds.
Today’s Investors Face Many Challenges, but Their Goals Are Timeless
Investment Goals Today’s Investor
1. Preserving What You Have Faces an extended bull market and historically low interest rates.
2. Building Wealth Has access to more asset classes and strategies than ever before.
3. Enhancing Income May use alternative investments to potentially achieve their goals.
Alternatives Opportunity | Q2 2015 24invesco.com/flipbook
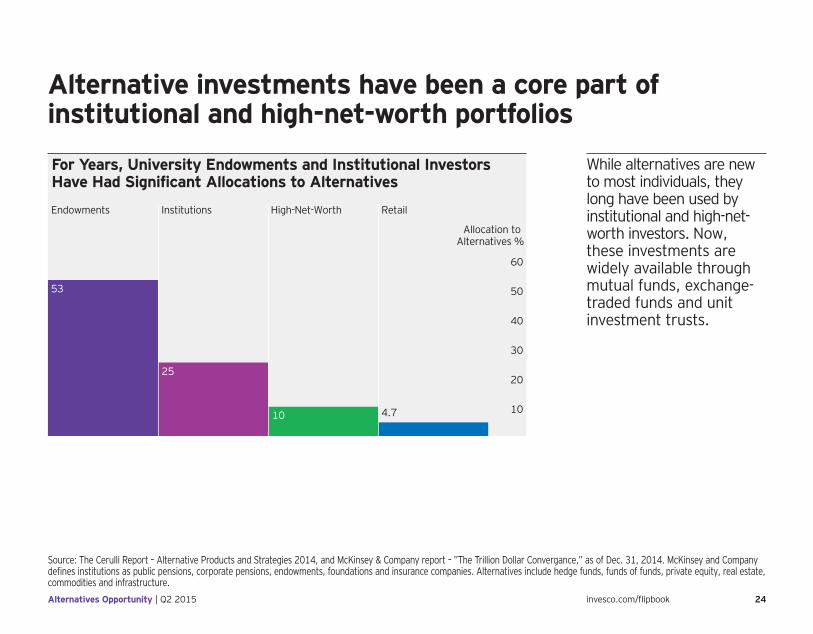
Alternative investments have been a core part of institutional and high-net-worth portfolios
While alternatives are new to most individuals, they long have been used by institutional and high-net-worth investors. Now, these investments are widely available through mutual funds, exchange-traded funds and unit investment trusts.
Source: The Cerulli Report – Alternative Products and Strategies 2014, and McKinsey & Company report – ”The Trillion Dollar Convergance,” as of Dec. 31, 2014. McKinsey and Company defines institutions as public pensions, corporate pensions, endowments, foundations and insurance companies. Alternatives include hedge funds, funds of funds, private equity, real estate, commodities and infrastructure.
For Years, University Endowments and Institutional Investors Have Had Significant Allocations to Alternatives
60
10
20
30
40
50
Allocation to Alternatives %
RetailHigh-Net-WorthInstitutionsEndowments
4.710
25
53
Alternatives Opportunity | Q2 2015 25invesco.com/flipbook
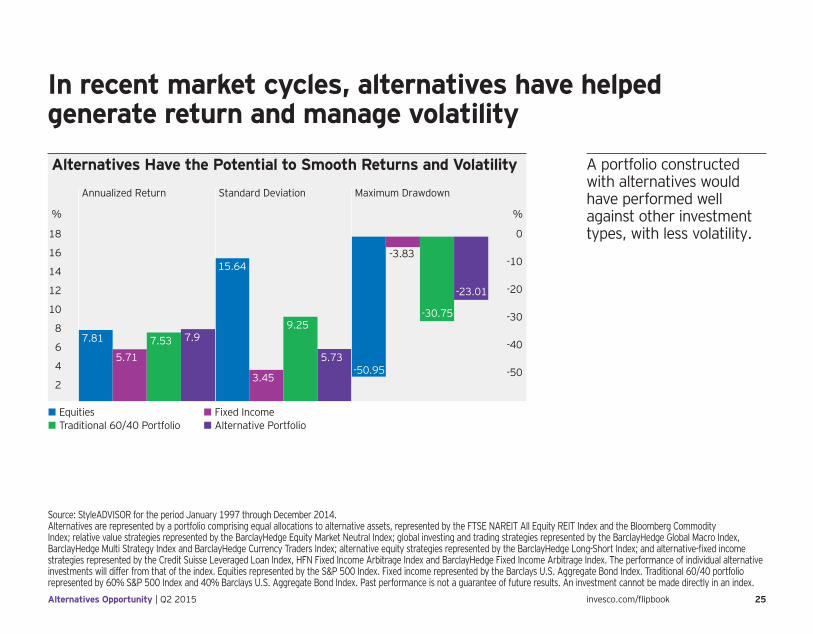
In recent market cycles, alternatives have helped generate return and manage volatility
Source: StyleADVISOR for the period January 1997 through December 2014.Alternatives are represented by a portfolio comprising equal allocations to alternative assets, represented by the FTSE NAREIT All Equity REIT Index and the Bloomberg Commodity Index; relative value strategies represented by the BarclayHedge Equity Market Neutral Index; global investing and trading strategies represented by the BarclayHedge Global Macro Index, BarclayHedge Multi Strategy Index and BarclayHedge Currency Traders Index; alternative equity strategies represented by the BarclayHedge Long-Short Index; and alternative-fixed income strategies represented by the Credit Suisse Leveraged Loan Index, HFN Fixed Income Arbitrage Index and BarclayHedge Fixed Income Arbitrage Index. The performance of individual alternative investments will differ from that of the index. Equities represented by the S&P 500 Index. Fixed income represented by the Barclays U.S. Aggregate Bond Index. Traditional 60/40 portfolio represented by 60% S&P 500 Index and 40% Barclays U.S. Aggregate Bond Index. Past performance is not a guarantee of future results. An investment cannot be made directly in an index.
Alternatives Have the Potential to Smooth Returns and Volatility
0
%
18
%
2
4
6
8
10
12
14
16
-50
-40
-30
-20
-10
Annualized Return Standard Deviation Maximum Drawdown
7.81
5.71
7.53 7.99.25
15.64
3.45
5.73-50.95
-3.83
-30.75
-23.01
• Equities • Fixed Income• Traditional 60/40 Portfolio • Alternative Portfolio
A portfolio constructed with alternatives would have performed well against other investment types, with less volatility.
Alternatives Opportunity | Q2 2015 26invesco.com/flipbook
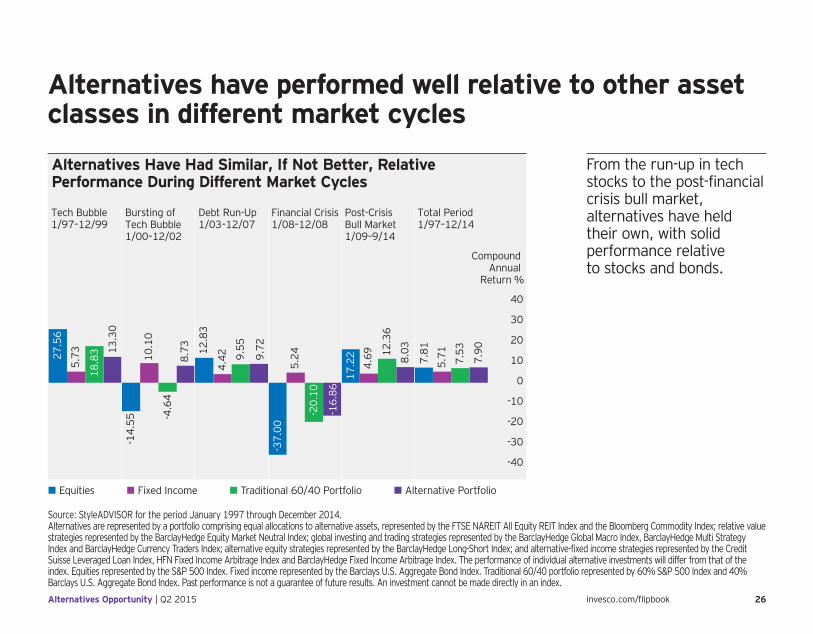
Alternatives have performed well relative to other asset classes in different market cycles
Source: StyleADVISOR for the period January 1997 through December 2014.Alternatives are represented by a portfolio comprising equal allocations to alternative assets, represented by the FTSE NAREIT All Equity REIT Index and the Bloomberg Commodity Index; relative value strategies represented by the BarclayHedge Equity Market Neutral Index; global investing and trading strategies represented by the BarclayHedge Global Macro Index, BarclayHedge Multi Strategy Index and BarclayHedge Currency Traders Index; alternative equity strategies represented by the BarclayHedge Long-Short Index; and alternative-fixed income strategies represented by the Credit Suisse Leveraged Loan Index, HFN Fixed Income Arbitrage Index and BarclayHedge Fixed Income Arbitrage Index. The performance of individual alternative investments will differ from that of the index. Equities represented by the S&P 500 Index. Fixed income represented by the Barclays U.S. Aggregate Bond Index. Traditional 60/40 portfolio represented by 60% S&P 500 Index and 40% Barclays U.S. Aggregate Bond Index. Past performance is not a guarantee of future results. An investment cannot be made directly in an index.
Alternatives Have Had Similar, If Not Better, Relative Performance During Different Market Cycles
40
Compound Annual
Return %
-40
-30
-20
-10
0
10
20
30
Tech Bubble1/97–12/99
Bursting of Tech Bubble1/00–12/02
Debt Run-Up1/03–12/07
Financial Crisis1/08–12/08
Post-Crisis Bull Market1/09–9/14
Total Period1/97–12/14
27.5
6
18.8
3
5.73
-14.
55
13.3
0
10.1
0
8.73
4.42 9.
55
9.72
5.24
4.69 8.0312
.36
7.81
7.53
7.90
5.71
-16.
86
12.8
3
-4.6
4
-20.
10
17.2
2
-37.
00
• Equities • Fixed Income • Traditional 60/40 Portfolio • Alternative Portfolio
From the run-up in tech stocks to the post-financial crisis bull market, alternatives have held their own, with solid performance relative to stocks and bonds.

Portfolio Strategies
Asset Class Opportunities | Q2 2015 28
Portfolio Strategies The compelling case for international equitiesThe time may be right to rebalance into developed (ex-US) markets
It also may be the right time to rebalance into emerging markets
Relative to the US, developed (ex-US) markets appear attractively valued
Emerging markets appear attractively valued relative to the US
A weaker euro, declining oil prices and quantitative easing have led to continued support for growth in Europe
Declining oil prices may boost growth in Asia (ex-Japan)
Portfolio Strategies | Q2 2015 29invesco.com/flipbook
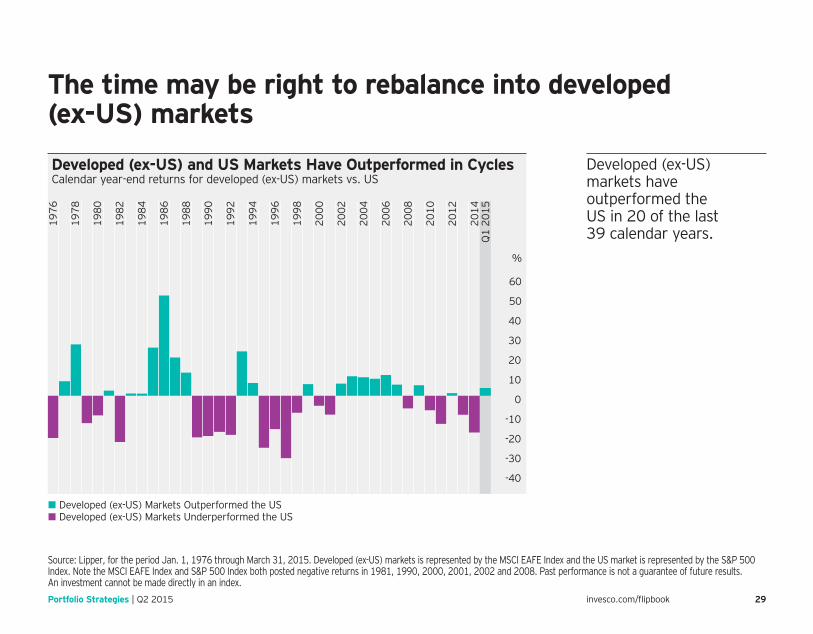
The time may be right to rebalance into developed (ex-US) markets
Source: Lipper, for the period Jan. 1, 1976 through March 31, 2015. Developed (ex-US) markets is represented by the MSCI EAFE Index and the US market is represented by the S&P 500 Index. Note the MSCI EAFE Index and S&P 500 Index both posted negative returns in 1981, 1990, 2000, 2001, 2002 and 2008. Past performance is not a guarantee of future results. An investment cannot be made directly in an index.
Developed (ex-US) and US Markets Have Outperformed in CyclesCalendar year-end returns for developed (ex-US) markets vs. US
Q1
2015
2014
2012
2010
2008
2006
2004
2002
2000
1998
1996
1994
1992
1990
1988
1986
1984
1982
1980
1978
1976
%
-40
-30
-20
-10
0
10
20
30
40
50
60
• Developed (ex-US) Markets Outperformed the US• Developed (ex-US) Markets Underperformed the US
Developed (ex-US) markets have outperformed the US in 20 of the last 39 calendar years.
Portfolio Strategies | Q2 2015 30invesco.com/flipbook
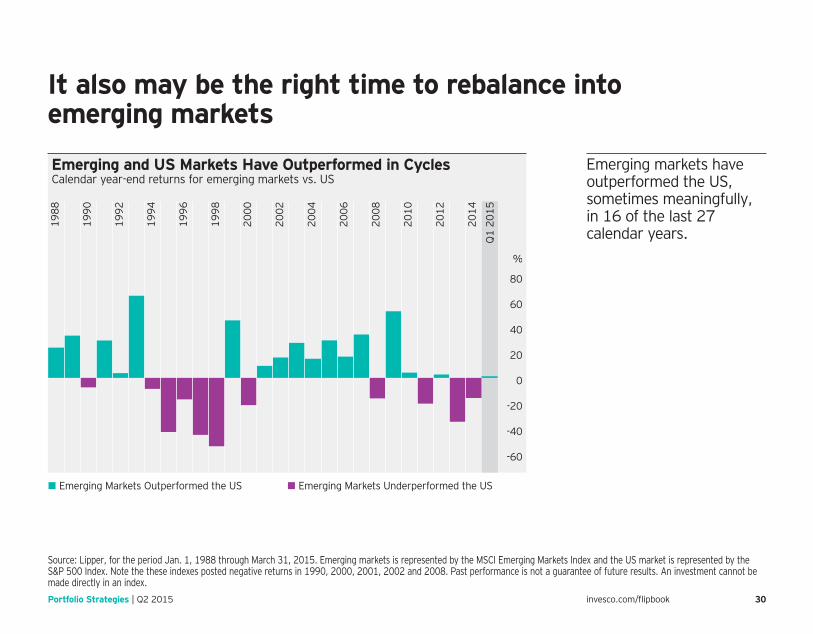
It also may be the right time to rebalance into emerging markets
Source: Lipper, for the period Jan. 1, 1988 through March 31, 2015. Emerging markets is represented by the MSCI Emerging Markets Index and the US market is represented by the S&P 500 Index. Note the these indexes posted negative returns in 1990, 2000, 2001, 2002 and 2008. Past performance is not a guarantee of future results. An investment cannot be made directly in an index.
Emerging and US Markets Have Outperformed in CyclesCalendar year-end returns for emerging markets vs. US
Q1
2015
2014
2012
2010
2008
2006
2004
2002
2000
1998
1996
1994
1992
1990
1988
%
-60
-40
-20
0
20
40
60
80
• Emerging Markets Outperformed the US • Emerging Markets Underperformed the US
Emerging markets have outperformed the US, sometimes meaningfully, in 16 of the last 27 calendar years.
Portfolio Strategies | Q2 2015 31invesco.com/flipbook
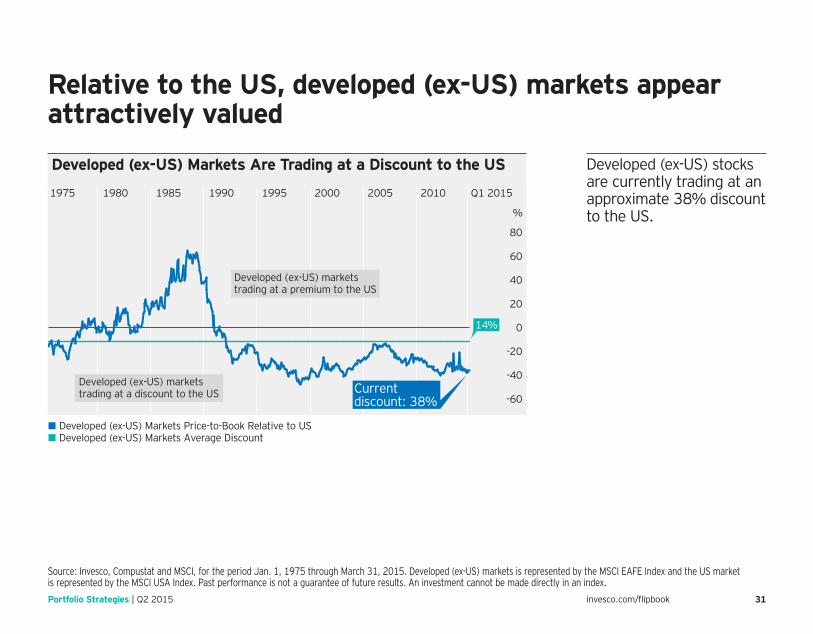
Relative to the US, developed (ex-US) markets appear attractively valued
Source: Invesco, Compustat and MSCI, for the period Jan. 1, 1975 through March 31, 2015. Developed (ex-US) markets is represented by the MSCI EAFE Index and the US market is represented by the MSCI USA Index. Past performance is not a guarantee of future results. An investment cannot be made directly in an index.
Developed (ex-US) stocks are currently trading at an approximate 38% discount to the US.
Developed (ex-US) Markets Are Trading at a Discount to the US
Currentdiscount: 38%
Developed (ex-US) markets trading at a premium to the US
Developed (ex-US) markets trading at a discount to the US
Q1 20151975 1980 1985 1990 1995 2000 2005 2010
%
-60
-40
-20
0
20
40
60
80
14%
• Developed (ex-US) Markets Price-to-Book Relative to US• Developed (ex-US) Markets Average Discount
Portfolio Strategies | Q2 2015 32invesco.com/flipbook
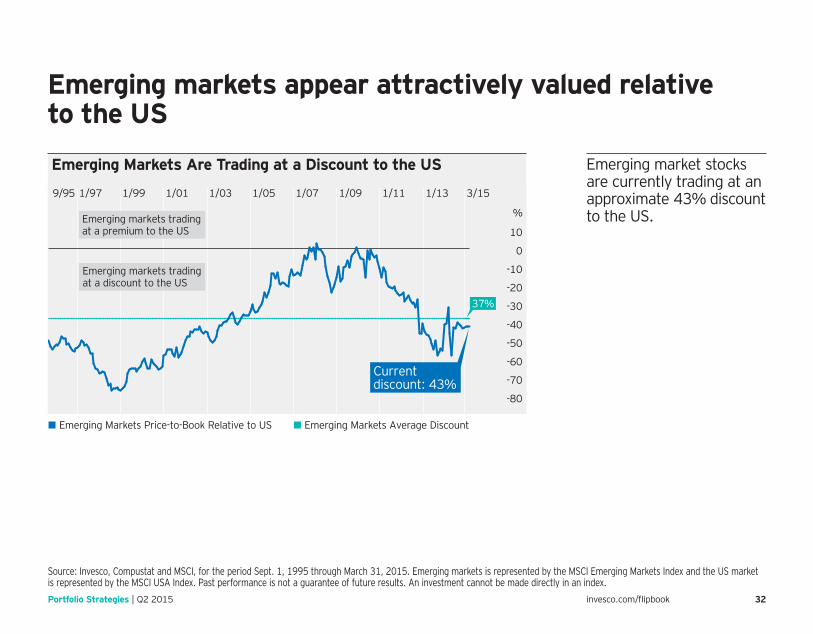
Emerging markets appear attractively valued relative to the US
Source: Invesco, Compustat and MSCI, for the period Sept. 1, 1995 through March 31, 2015. Emerging markets is represented by the MSCI Emerging Markets Index and the US market is represented by the MSCI USA Index. Past performance is not a guarantee of future results. An investment cannot be made directly in an index.
Emerging market stocks are currently trading at an approximate 43% discount to the US.
Emerging Markets Are Trading at a Discount to the US
Currentdiscount: 43%
Emerging markets tradingat a discount to the US
Emerging markets trading at a premium to the US
37%
%
-80
-70
-60
-50
-40
-30
-20
-10
0
10
3/159/95 1/97 1/99 1/01 1/03 1/05 1/07 1/09 1/11 1/13
• Emerging Markets Price-to-Book Relative to US • Emerging Markets Average Discount
Portfolio Strategies | Q2 2015 33invesco.com/flipbook
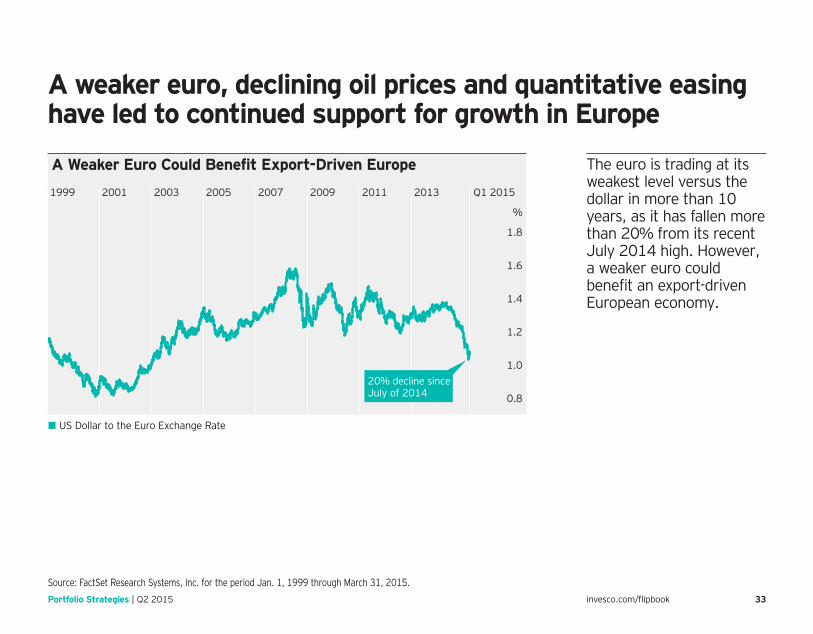
A weaker euro, declining oil prices and quantitative easing have led to continued support for growth in Europe
Source: FactSet Research Systems, Inc. for the period Jan. 1, 1999 through March 31, 2015.
The euro is trading at its weakest level versus the dollar in more than 10 years, as it has fallen more than 20% from its recent July 2014 high. However, a weaker euro could benefit an export-driven European economy.
A Weaker Euro Could Benefit Export-Driven Europe
20% decline sinceJuly of 2014
Q1 20151999 2001 2003 2005 2007 2009 2011 2013
0.8
%
1.8
1.0
1.2
1.4
1.6
• US Dollar to the Euro Exchange Rate
Portfolio Strategies | Q2 2015 34invesco.com/flipbook
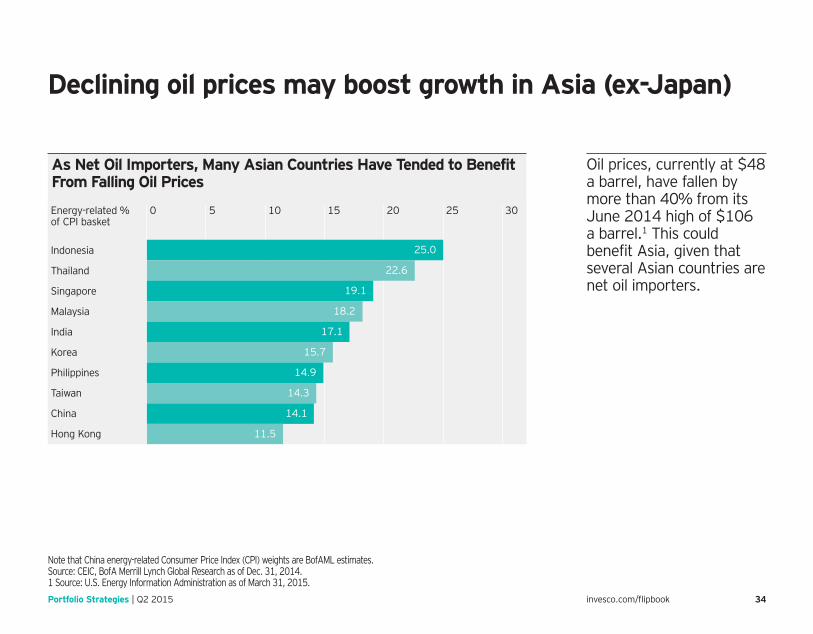
Declining oil prices may boost growth in Asia (ex-Japan)
Oil prices, currently at $48 a barrel, have fallen by more than 40% from its June 2014 high of $106 a barrel.1 This could benefit Asia, given that several Asian countries are net oil importers.
Note that China energy-related Consumer Price Index (CPI) weights are BofAML estimates.Source: CEIC, BofA Merrill Lynch Global Research as of Dec. 31, 2014.1 Source: U.S. Energy Information Administration as of March 31, 2015.
As Net Oil Importers, Many Asian Countries Have Tended to Benefit From Falling Oil Prices
300 5 10 15 20 25Energy-related % of CPI basket
Indonesia
Thailand
Singapore
Malaysia
India
Korea
Philippines
Taiwan
China
Hong Kong
25.0
22.6
19.1
18.2
17.1
15.7
14.9
14.3
14.1
11.5
Contact us
Before investing, investors should carefully read the prospectus and/or summary prospectus and carefully consider the investment objectives, risks, charges and expenses. For this and more complete information about the fund(s), investors should ask their advisors for a prospectus/summary prospectus or visit invesco.com/fundprospectus.
Note: Not all products, materials or services available at all firms. Advisors, please contact your home office.
The opinions expressed by Invesco professionals do not necessarily reflect those of Invesco Distributors, Inc. and are subject to change at any time based on market or other conditions. This is provided for educational and informational purposes only and is not an offer of investment advice or financial products. In addition, the results actual investors might have achieved may vary from those shown.
invesco.com/us Invesco Distributors, Inc. US5008
For more information, call your advisor or contact Invesco at 800 959 4246 from 7 a.m. to 6 p.m. Central time on weekdays. You can also visit us at invesco.com/us.

ACOPP-BRO-2-E 04/15
To access the latest online version of the Asset Class Opportunities brochure, please visit www.invesco.com/flipbook.